A Study of the Relationships between Depths of Soil Constraints and Remote Sensing Data from Different Stages of the Growing Season
Abstract
:1. Introduction
- If a topsoil constraint is impacting growth, we might expect its effects to show through a negative correlation between the soil constraint and the early-season EVI.
- We would not expect an impact of a subsoil constraint until later in the season (when roots have reached the constraint); therefore, subsoil constraints might show effects through negative correlations between the soil data and EVI from later in the growing season.
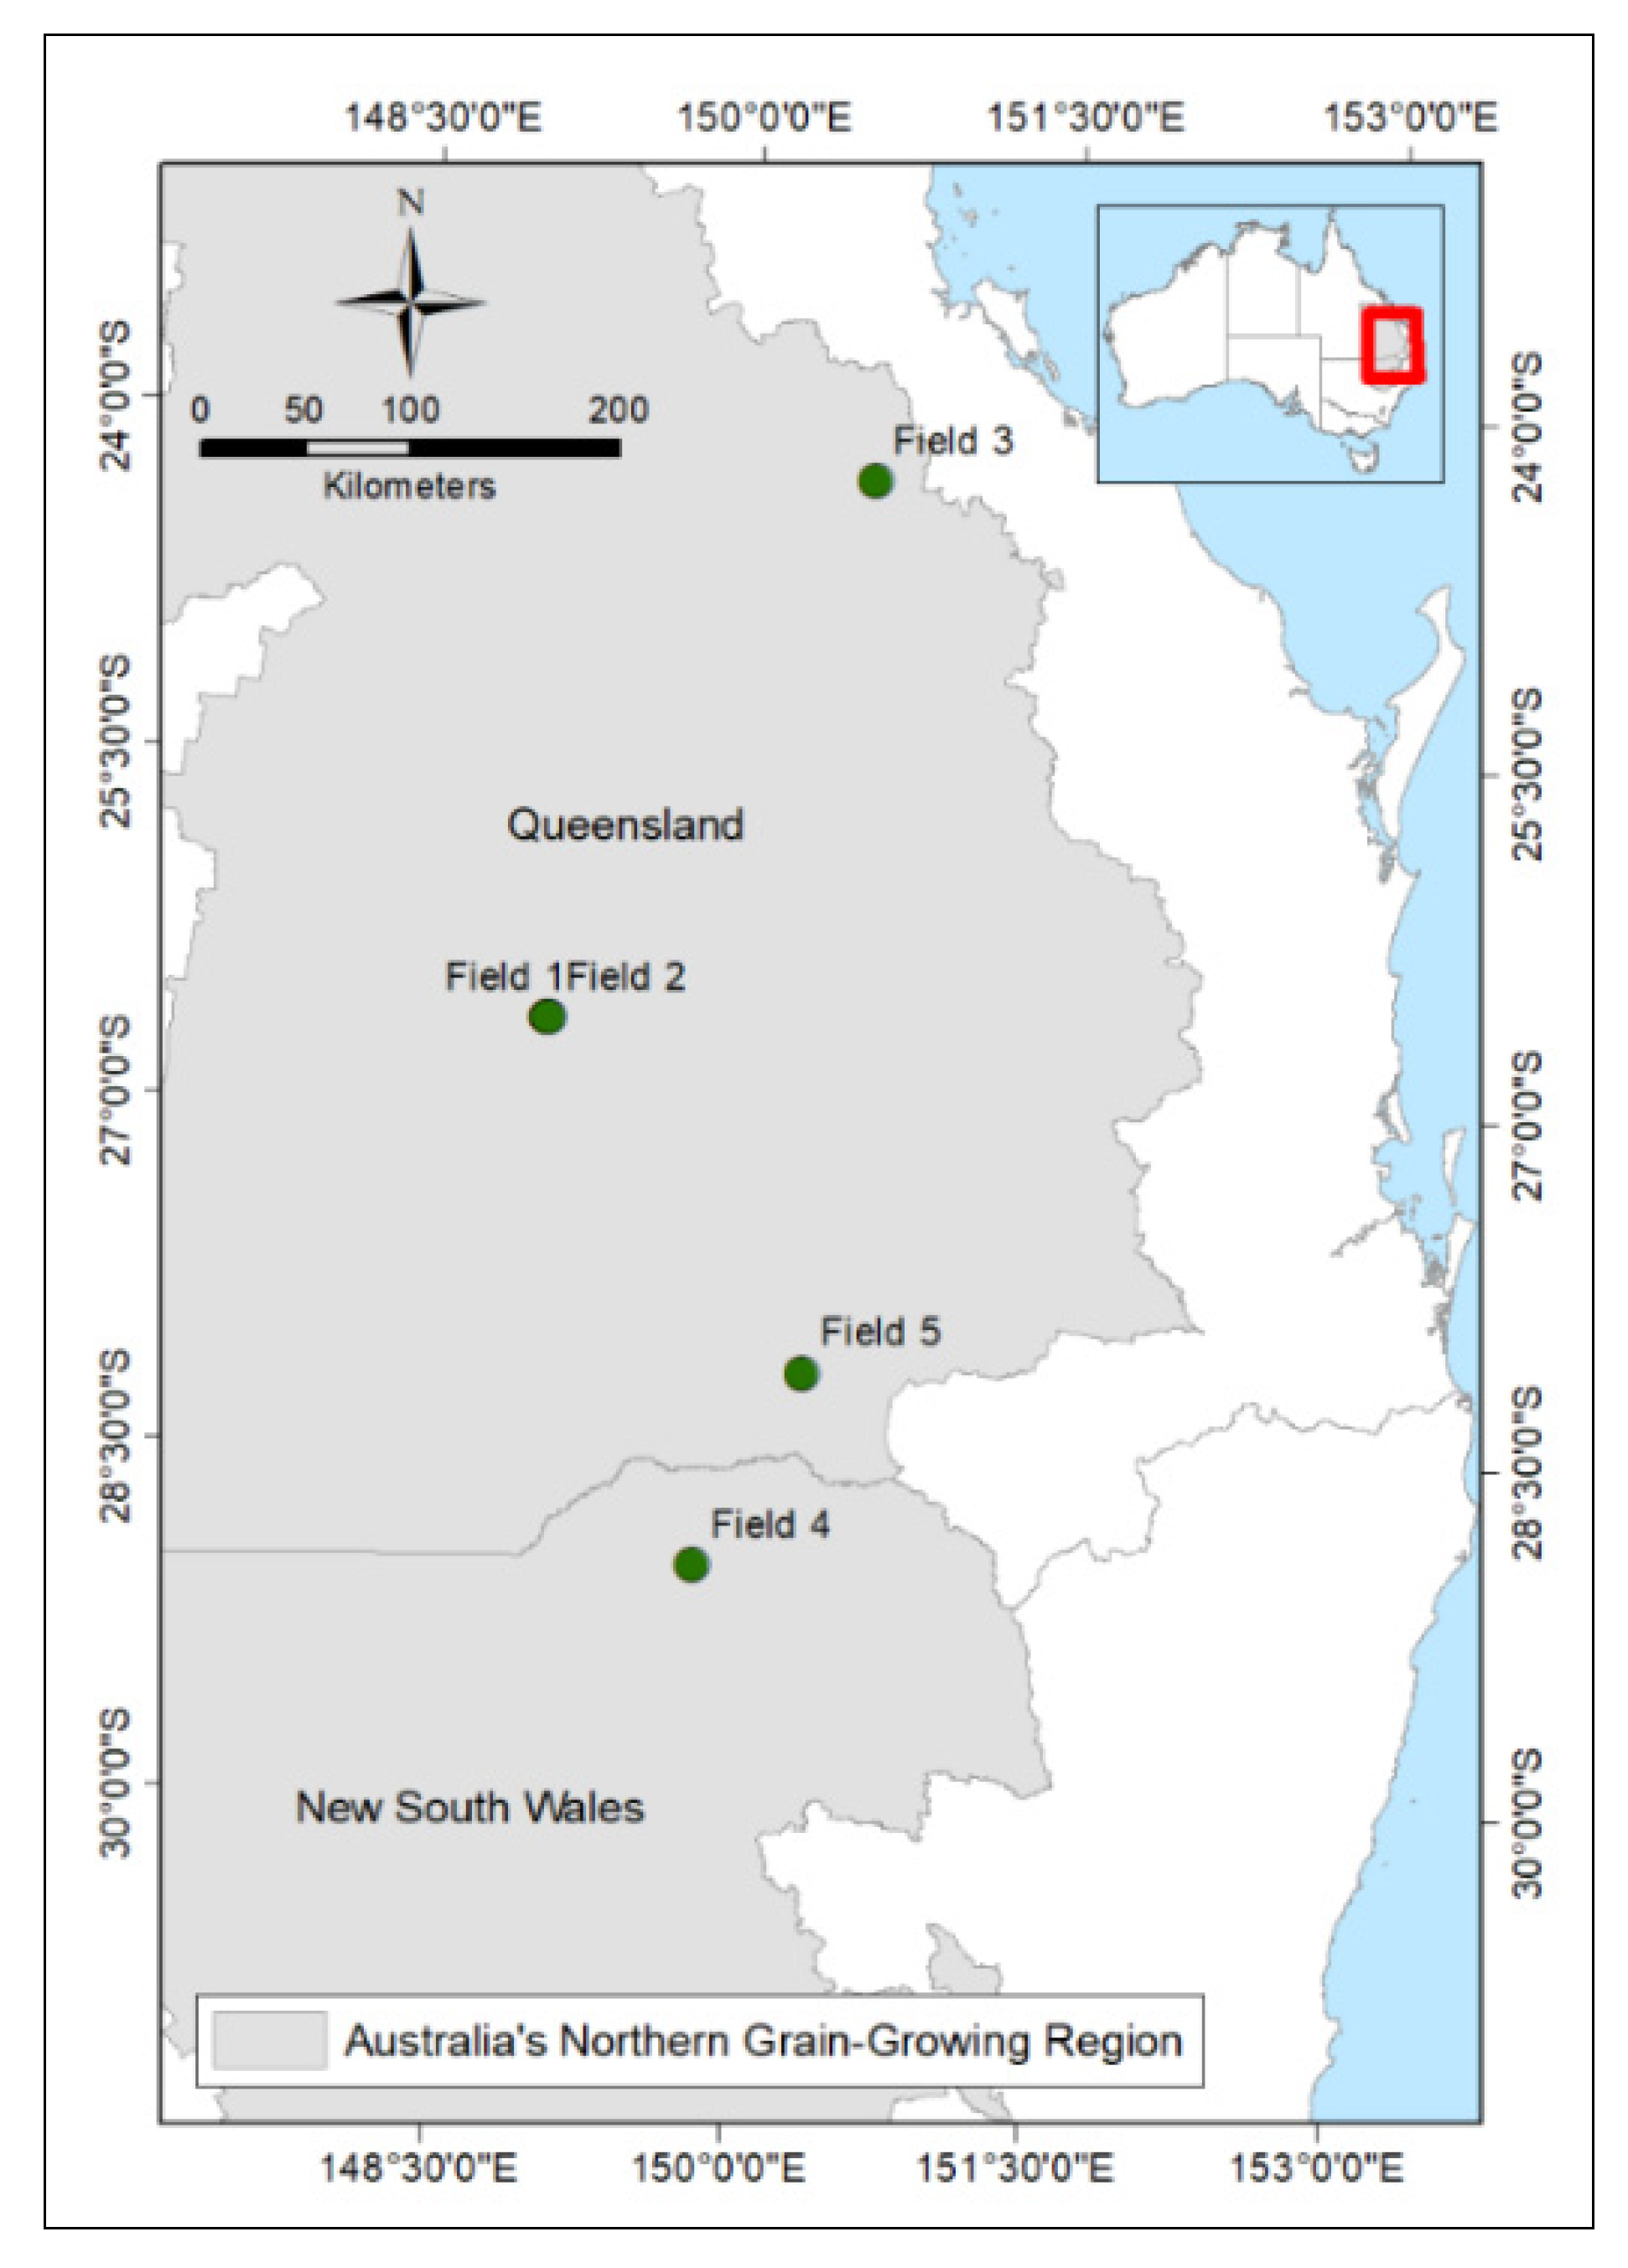
- We investigated whether data from the five fields provide any support for these hypotheses, and therefore whether the type of analysis applied here might be more broadly applicable for diagnosing the depth of soil constraints impacting crop growth.
2. Materials and Methods
2.1. Study Area
2.2. Datasets and Pre-Processing
2.2.1. Satellite Data
2.2.2. Soil Constraint Data and Severity Index
2.3. Initial Data Processing Methods
2.3.1. Dividing Crop Growth into Several Stages
2.3.2. Detecting Years to Be Included in the Ensuing Analysis
2.4. Statistical Analysis Methods
2.4.1. Soil Constraints Severity and Vegetation Index Correlation
2.4.2. Within-Field Variation in Soil Constraint Severity
2.4.3. Soil Constraints and Vegetation Index Correlation
3. Results
4. Discussion
4.1. Correlation between Soil Constraint Severity Index and EVI
4.2. Potential Approach Using Remote Sensing
4.3. Alternative Approaches
4.4. Limitation and Further Work
5. Conclusions
Author Contributions
Funding
Data Availability Statement
Acknowledgments
Conflicts of Interest
Appendix A. Using Remote Sensing Alone to Identify Topsoil and Subsoil Constraints
- Determine cropped years.
- For each cropped year.
- Calculate four average EVI maps representing the four stages.
- Convert the average EVI of each map into a relative growth index (RGI) [27,44] map. It is calculated by ranking the pixels in each average EVI map, representing a specific field-year-stage (to put all maps on a scale of 0–100). Thus, the RGI can indicate the parts of the field that were performing well or poorly.
- For each stage, use the RGI to:
- Categorize pixels as ‘consistently good growth’ (multi-year mean RGI > 50, p < 0.05); ‘consistently poor growth’ (mean RGI < 50, p < 0.05); or ‘inconsistent/moderate’ (p > 0.05)
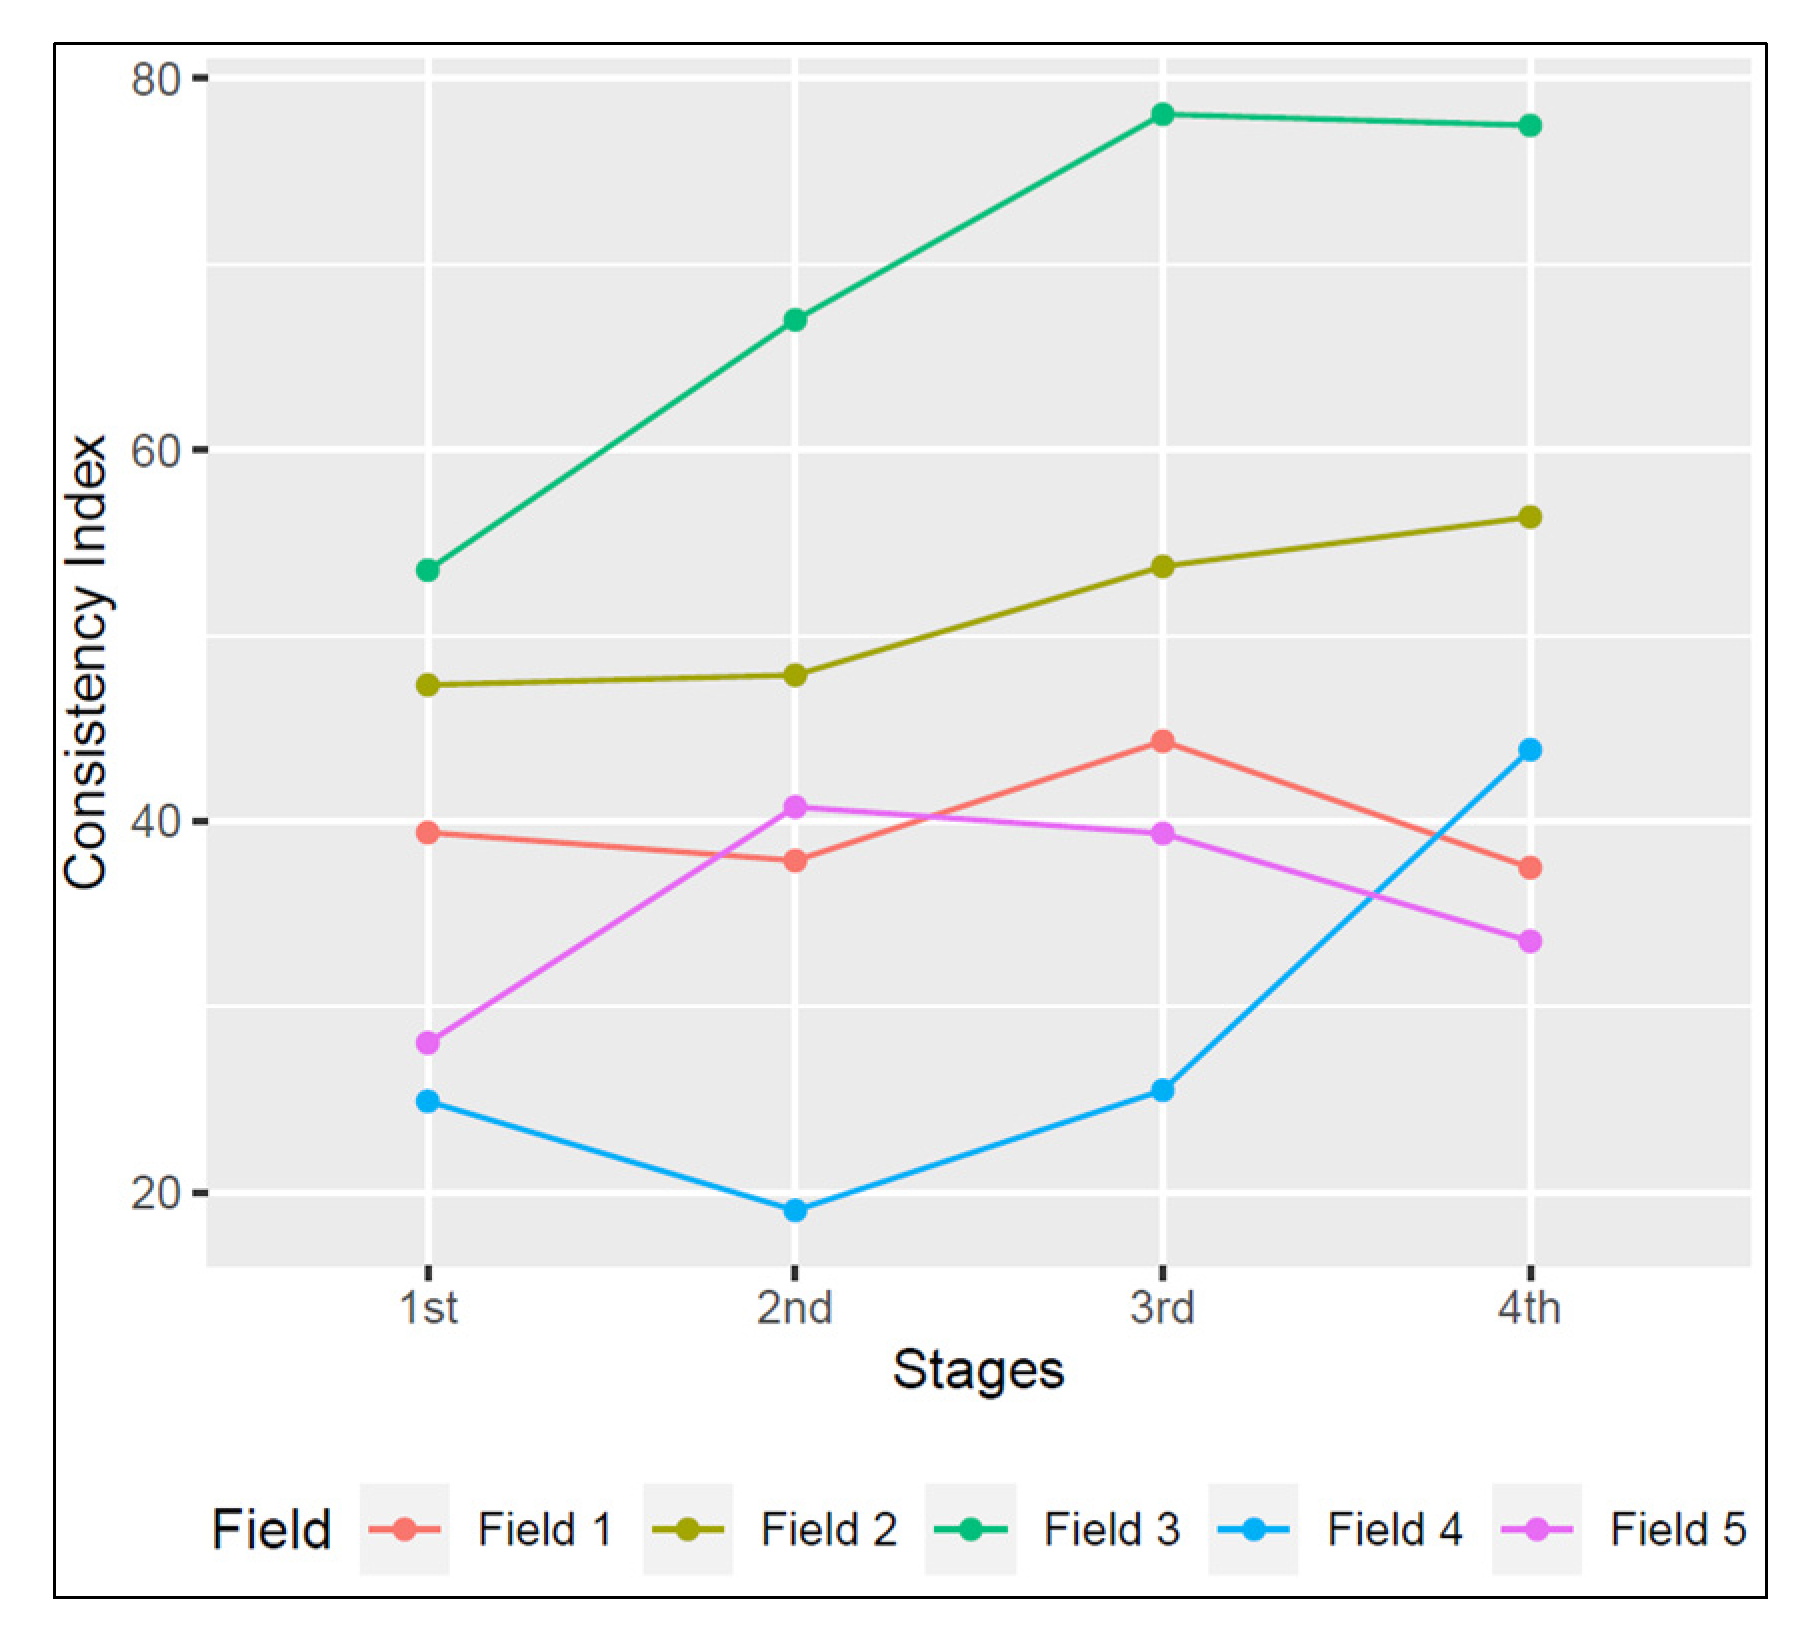
- Calculate the ‘consistency index’ as the percentage of pixels in the ‘consistently good growth’ or ‘consistently poor growth’ classes. A value of 0 indicates that the maps from each year display different patterns of spatial variation. In contrast, a value of 100 indicates that the maps from each year show identical patterns of spatial variation.
- Also, for each stage, calculate a map of the multi-year average EVI.
- If imagery from early in the season shows a consistent pattern (year after year), this might indicate that topsoil constraints, encountered early in the season when roots are shallow, might be causing variation.
- If imagery from early in the season is not consistent, but imagery from later in the season is, this might indicate that constraints at the depth of roots at that stage of the season (e.g., 60–90 cm for imagery from around 90 days after planting) are causing this increase in consistent patterns.
- If imagery shows a consistent pattern with increasing consistency through the season, this could indicate the presence of topsoil constraints, which have a lasting impact on growth (even after roots have extended below this depth), or it could indicate the presence of constraints through the profile.
- If imagery does not show any consistent patterns, this could indicate either no soil constraints are consistently impacting growth, or soil constraints are inconsistently impacting growth (e.g., limiting growth in wet years, beneficial for growth in dry years), or soil constraints are not spatially variable within the field.
Appendix A.1. Consistency Index
- Field 1 shows reasonable high consistency from the first stage in the season, with no strong increase later in the season; therefore, topsoil constraints might be important drivers of variation in growth here.
- Fields 2 and 3 show consistent variation from the first stage in the season, and also a strong increase in consistency throughout the season; therefore, there might be topsoil constraints with a lasting impact or constraints throughout the soil profile here.
- Fields 4 and 5 show increases in consistency at the 4th and 2nd stages, respectively, and therefore might be encountering soil constraints at soil depths 90–120 cm and 30–60 cm, respectively.

Appendix A.2. Topsoil Issues Indicated by Remote Sensing
Appendix A.3. Topsoil and Subsoil Issues Indicated by Remote Sensing
Appendix A.4. Soil Constraints in Specific Depths Indicated by Remote Sensing
Appendix A.5. Summary
| Feature Description of Remotely Sensed Consistency Index Plot | Interpreted Implication for Soil | Expected Relationships between Soil Data and EVI | Field Matching Feature Description, and Actual Relationships between Soil Data and EVI | Strongest Correlation between EVI and Soil Constraints for Field OR Conclusion from Inspection of Soil–EVI Correlations? |
|---|---|---|---|---|
| High consistency from the 1st stage onwards | Topsoil constraints | Spatial variation in soil constraint severity index of the topsoil. Negative correlations of 1st stage EVI with topsoil constraints severity index and with an individual constraint (ECse or ESP). | Field 1 No variation in soil constraint severity index of topsoil. No correlation between topsoil data (constraint severity index or individual constraints) and 1st stage EVI. | Field 1 30–50 cm soil data (ECse) and 2nd stage EVI. Partly agrees with expectations from inspection of consistency index plot. |
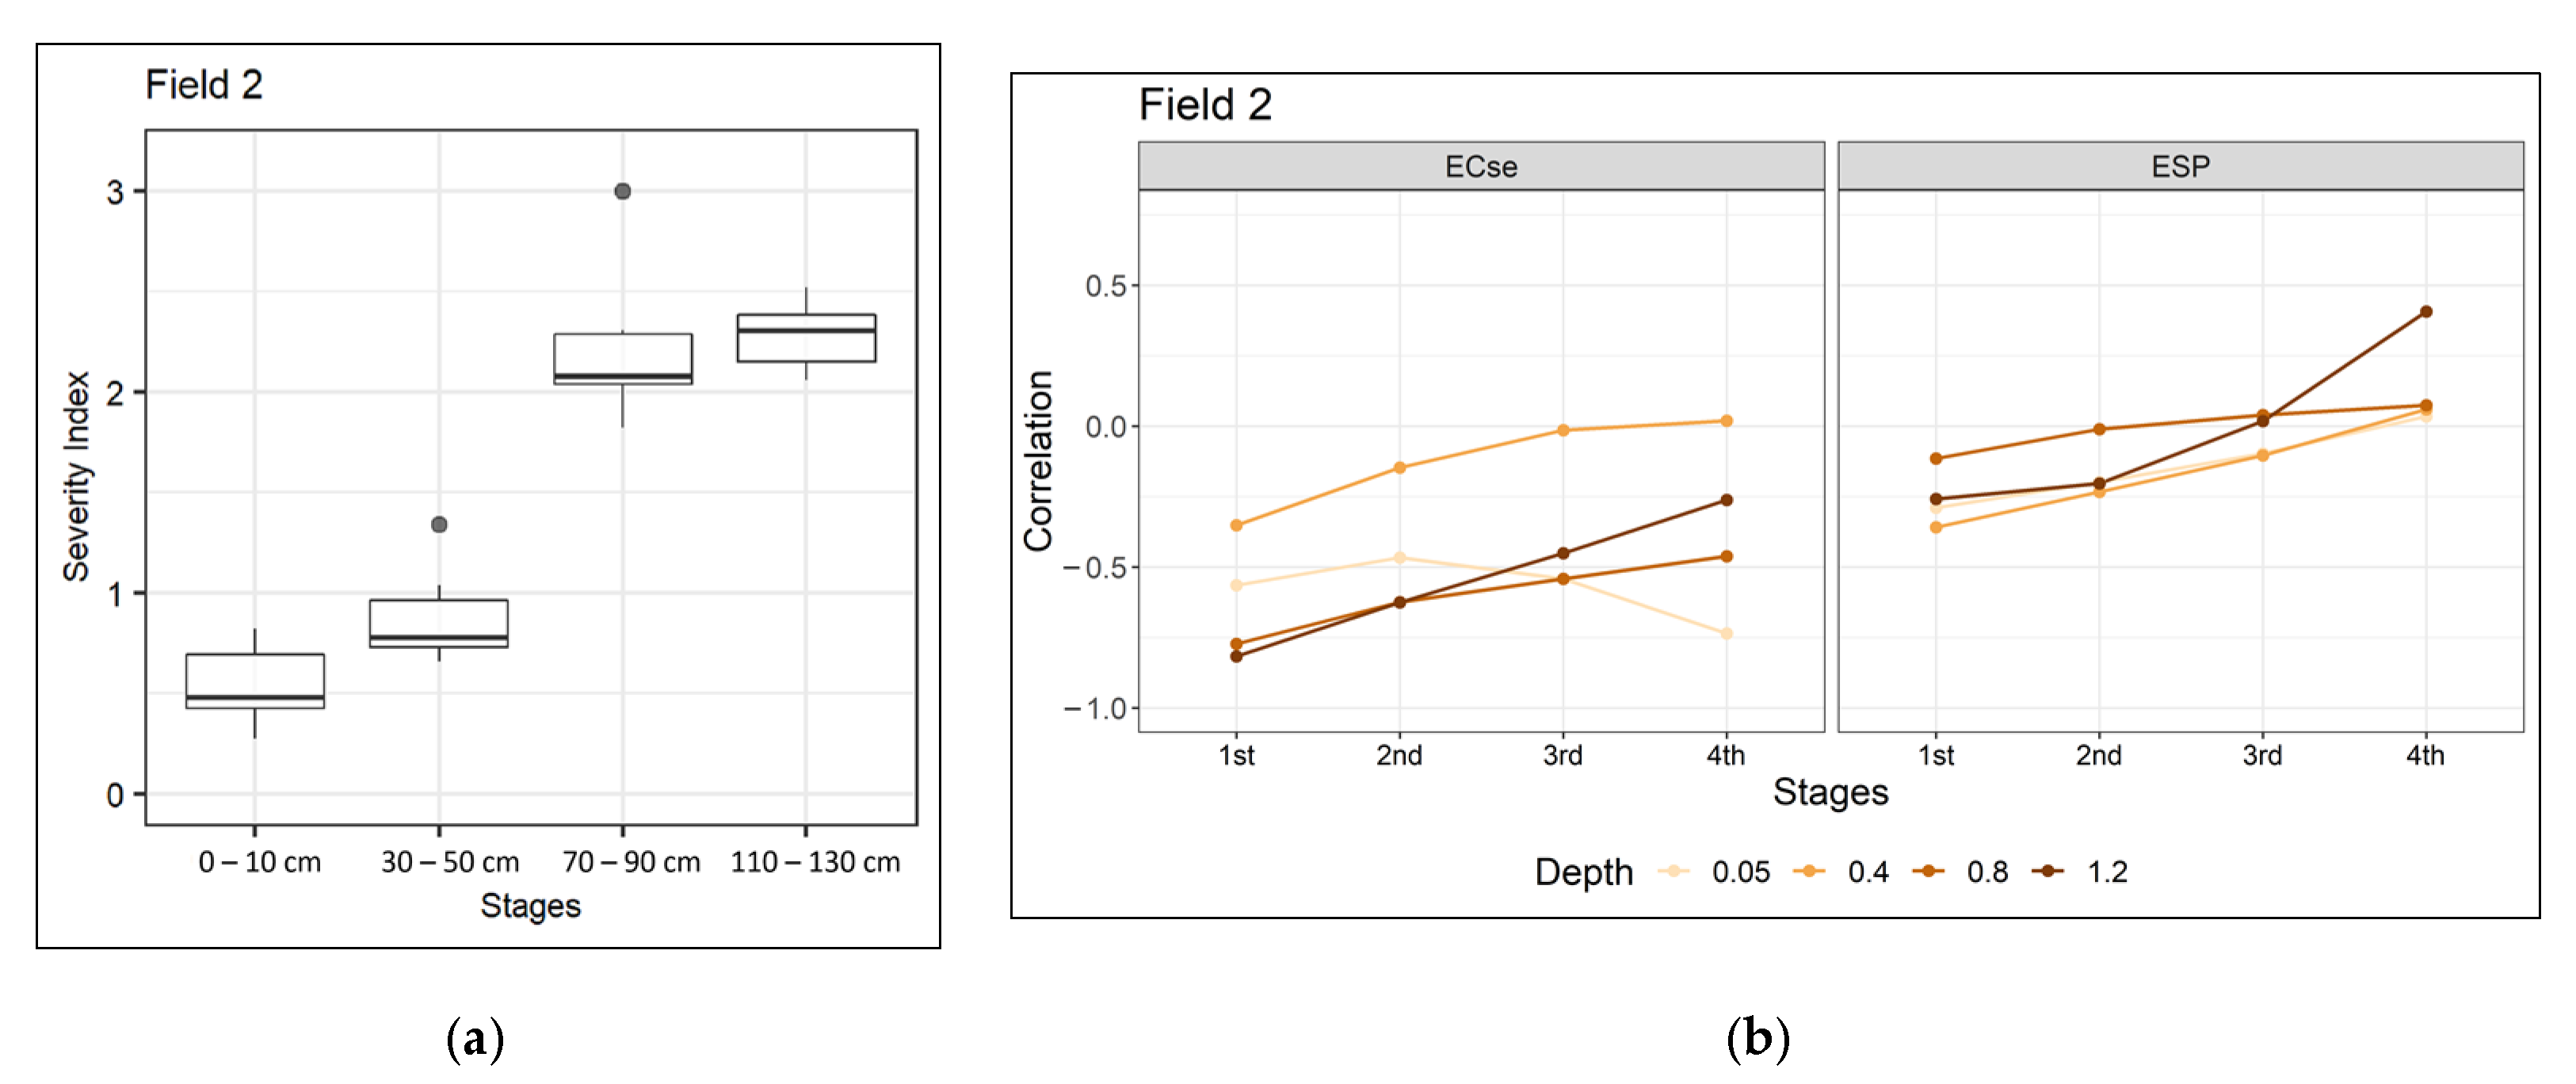
| High consistency in the 1st stage then continues to increase until the 4th stage | Topsoil and subsoil constraints | Spatial variation in soil constraint severity index at all stages. Negative correlations of EVI with the severity index and with an individual constraint (ECse or ESP) throughout the profile. | Field 2 Marginal variation in soil constraints severity, yet similar for all the stages. No correlation between each depth soil constraint severity index and the related stages of EVI. High negative correlation between topsoil ECse and 1st stage EVI. | Field 2 Strong negative correlation between topsoil ECse not only with the 1st stage but also other stages of EVI. Partly agrees with expectations from inspection of consistency index plot. |
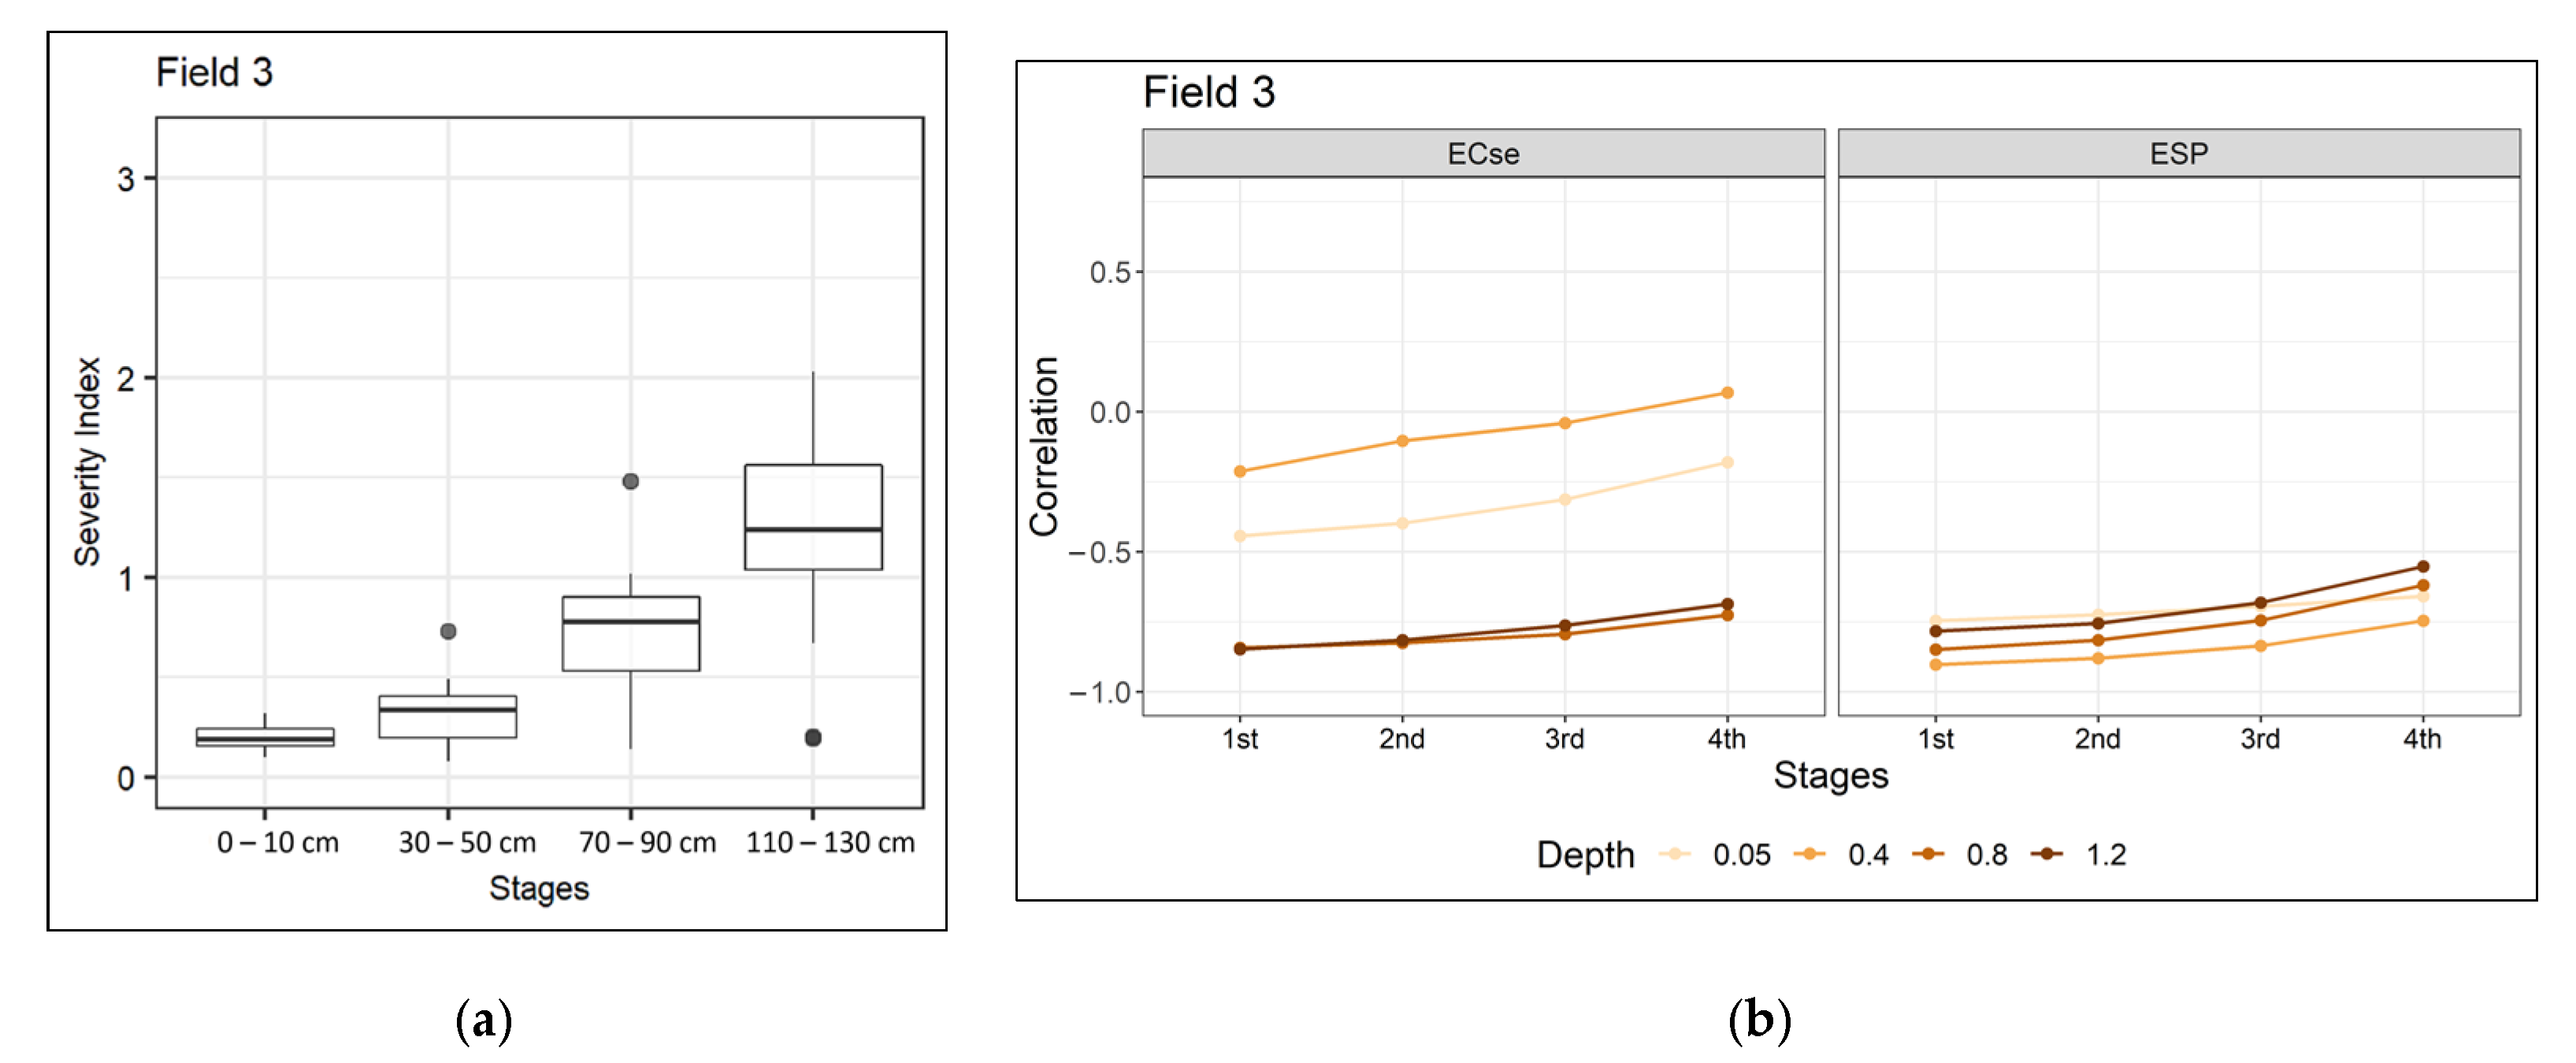
| Field 3 Increasing variation from 1st to 4th stage. Strong negative correlations between EVI and both soil constraints throughout the profile (ECse or ESP). | Field 3 Strong negative correlations between EVI and both soil constraints throughout the profile (ECse or ESP). Agrees with expectations from inspection of consistency index plot. | |||
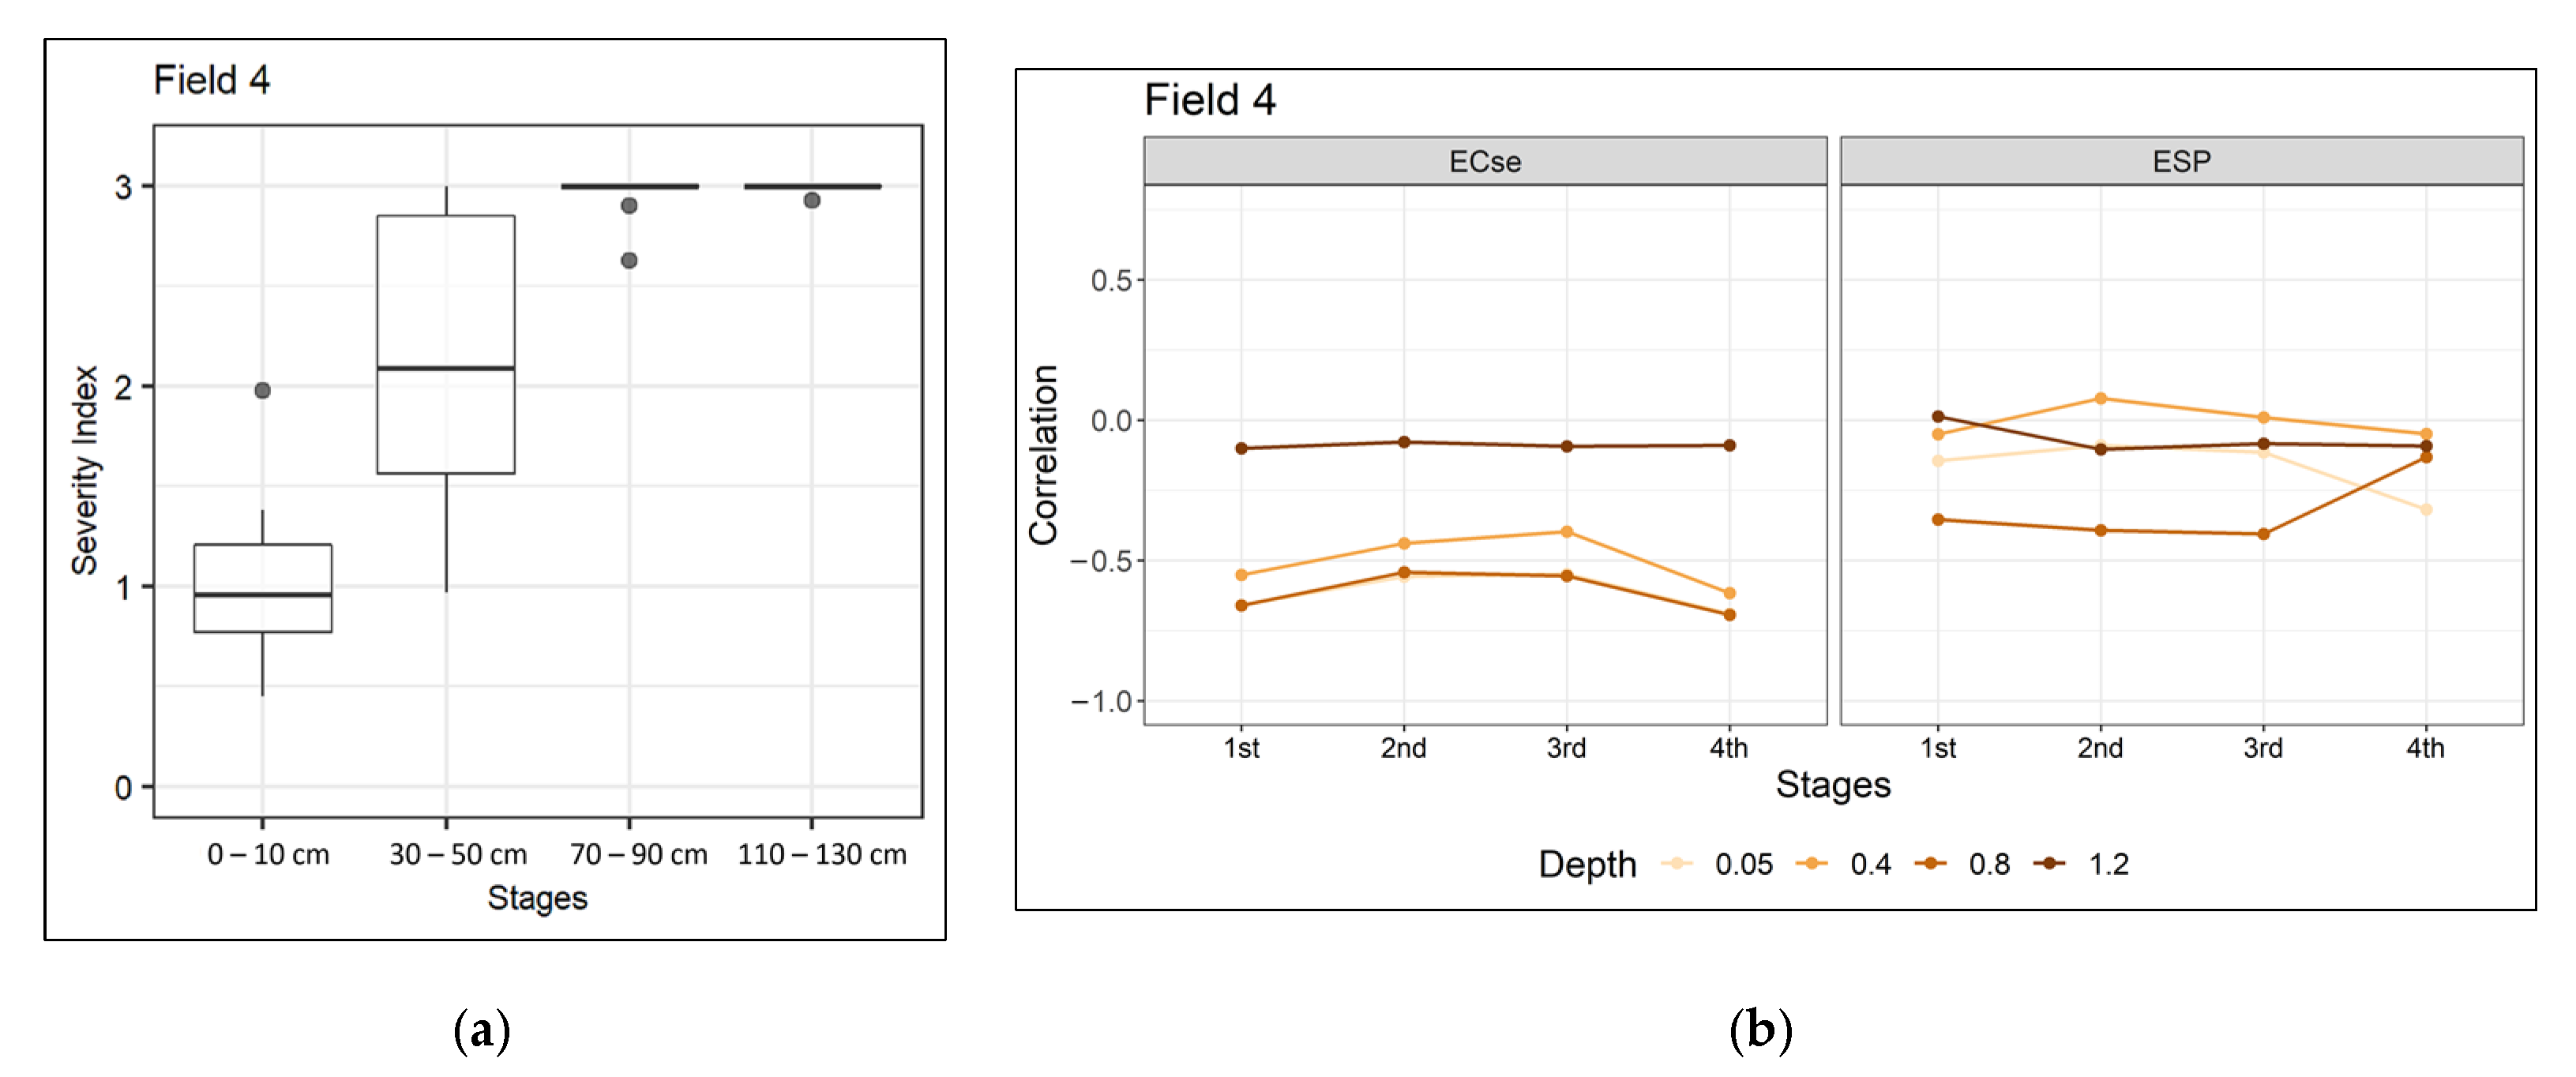
| A jump in consistency at a certain stage of the season | Constraints at a certain depth | Spatial variation in soil constraint severity index at a certain depth. Negative correlations of the certain stage EVI with the related depth severity index and with an individual constraint (ECse or ESP). | Field 4 (3rd to 4th stage) No variation in soil constraint severity index of the 4th stage. No correlation between 110 and 130 cm soil data (constraint severity index or individual constraints) and 1st stage EVI. | Field 4 70–90 cm soil data (ECse) and 4th stage EVI. Partly agrees with expectations from inspection of consistency index plot. |
| Field 5 (1st to 2nd stage) Soil constraint severity variation does exist in the 2nd stage. No correlation between 30 and 50 cm soil constraint severity index and 2nd stage EVI. Insignificant negative correlations between individual constraint (ECse or ESP) at depth 30–50 cm in the 2nd stage. | Field 5 The statistical evidence is not strong enough. Unclear result. |
References
- Bot, A.J.; Nachtergaele, F.O.; Young, A. Land Resource Potential and Constraints at Regional and Country Levels; Food and Agriculture Organization of the United Nations: Rome, Italy, 2000. [Google Scholar]
- SalCon. Salinity Management Handbook; Queensland Departement of Natural Resources and Mines: Indooroopilly, QLD, Australia, 1997. [Google Scholar]
- Orton, T.G.; Mallawaarachchi, T.; Pringle, M.J.; Menzies, N.W.; Dalal, R.C.; Kopittke, P.M.; Searle, R.; Hochman, Z.; Dang, Y.P. Quantifying the economic impact of soil constraints on Australian agriculture: A case-study of wheat. Land Degrad. Dev. 2018, 29, 3866–3875. [Google Scholar] [CrossRef]
- Page, K.L.; Dalal, R.C.; Wehr, J.B.; Dang, Y.P.; Kopittke, P.M.; Kirchhof, G.; Fujinuma, R.; Menzies, N.W. Management of the major chemical soil constraints affecting yields in the grain growing region of Queensland and New South Wales, Australia—A review. Soil Res. 2018, 56, 765. [Google Scholar] [CrossRef]
- Shaw, R.J. Soil Salinity-Electrical Conductivity and Chloride. In Soil Analysis: An Interpretation Manual; Peverill, K.I., Sparrow, L.A., Reuter, D.J., Eds.; CSIRO Publishing: Clayton, Australia, 1999. [Google Scholar]
- Dang, Y.P.; Dalal, R.C.; Routley, R.; Schwenke, G.D.; Daniells, I.G. Subsoil constraints to grain production in the cropping soils of the north-eastern region of Australia: An overview. Aust. J. Exp. Agric. 2006, 46, 19–35. [Google Scholar] [CrossRef] [Green Version]
- Dang, Y.P.; Dalal, R.C.; Buck, S.R.; Harms, B.; Kelly, R.; Hochman, Z.; Schwenke, G.D.; Biggs, A.J.W.; Ferguson, N.J.; Norrish, S. Diagnosis, extent, impacts, and management of subsoil constraints in the northern grains cropping region of Australia. Aust. J. Soil Res. 2010, 48, 105–119. [Google Scholar] [CrossRef]
- Sheldon, A.R.; Dalal, R.C.; Kirchhof, G.; Kopittke, P.M.; Menzies, N.W. The effect of salinity on plant-available water. Plant Soil 2017, 418, 477–491. [Google Scholar] [CrossRef]
- Weil, R.R.; Brady, N.C. The Nature and Properties of Soils, Global Edition, 15th ed.; Pearson Education Limited: London, UK, 2017. [Google Scholar]
- Tang, C.; Asseng, S.; Diatloff, E.; Rengel, Z. Modelling yield losses of aluminium-resistant and aluminium-sensitive wheat due to subsurface soil acidity: Effects of rainfall, liming and nitrogen application. Plant Soil. 2003, 254, 349–360. [Google Scholar] [CrossRef]
- Li, N.; Arshad, M.; Zhao, D.; Sefton, M.; Triantafilis, J. Determining optimal digital soil mapping components for exchangeable calcium and magnesium across a sugarcane field. Catena 2019, 181, 104054. [Google Scholar] [CrossRef]
- Triantafilis, J.; Acácio, F.; Santos, M. Hydrostratigraphic analysis of the Darling River valley (Australia) using electromagnetic induction data and a spatially constrained algorithm for quasi-three-dimensional electrical conductivity imaging. Hydrogeol. J. 2010, 19, 1053. [Google Scholar] [CrossRef]
- Zare, E.; Ahmed, M.F.; Malik, R.S.; Subasinghe, R.; Huang, J.; Triantafilis, J. Comparing traditional and digital soil mapping at a district scale using residual maximum likelihood analysis. Soil Res. 2018, 56, 535–547. [Google Scholar] [CrossRef]
- Dang, Y.P.; Dalal, R.C.; Mayer, D.G.; McDonald, M.; Routley, R.; Schwenke, G.D.; Buck, S.R.; Daniells, I.G.; Singh, D.K.; Manning, W.; et al. High subsoil chloride concentrations reduce soil water extraction and crop yield on Vertosols in north-eastern Australia. Aust. J. Agric. Res. 2008, 59, 321. [Google Scholar] [CrossRef]
- Shukla, M.K.; Lal, R.; Ebinger, M. Principal component analysis for predicting corn biomass and grain yields. Soil Sci. 2004, 169, 215–224. [Google Scholar] [CrossRef]
- Rengasamy, P.; Chittleborough, D.; Helyar, K. Root-zone constraints and plant-based solutions for dryland salinity. Plant Soil 2003, 257, 249–260. [Google Scholar] [CrossRef]
- Bai, T.; Zhang, N.; Mercatoris, B.; Chen, Y. Jujube yield prediction method combining Landsat 8 vegetation index and the phenological length. Comput. Electron. Agric. 2019, 162, 1011–1027. [Google Scholar] [CrossRef]
- Cai, Y.; Guan, K.; Lobell, D.; Potgieter, A.B.; Wang, S.; Peng, J.; Xu, T.; Asseng, S.; Zhang, Y.; You, L.; et al. Integrating satellite and climate data to predict wheat yield in Australia using machine learning approaches. Agric. For. Meteorol. 2019, 274, 144–459. [Google Scholar] [CrossRef]
- Dang, Y.P.; Moody, P.W. Quantifying the costs of soil constraints to Australian agriculture: A case study of wheat in north-eastern Australia. Soil Res. 2016, 54, 700–707. [Google Scholar] [CrossRef]
- Goodwin, A.W.; Lindsey, L.E.; Harrison, S.K.; Paul, P.A. Estimating wheat yield with normalized difference vegetation index and fractional green canopy cover. Crop. Forage Turfgrass Manag. 2018, 4, 1–6. [Google Scholar] [CrossRef] [Green Version]
- Kobayashi, N.; Tani, H.; Wang, X.; Sonobe, R. Crop classification using spectral indices derived from Sentinel-2A imagery. J. Inf. Telecommun. 2020, 4, 67–90. [Google Scholar] [CrossRef]
- Lai, Y.R.; Pringle, M.J.; Kopittke, P.M.; Menzies, N.W.; Orton, T.G.; Dang, Y.P. An empirical model for prediction of wheat yield, using time-integrated Landsat NDVI. Int. J. Appl. Earth Obs. Geoinf. 2018, 72, 99–108. [Google Scholar] [CrossRef]
- Rouse, J.W.; Hass, R.H.; Schell, J.A.; Deering, D.W. Monitoring vegetation systems in the great plains with ERTS. Third Earth Resour. Technol. Satell. Symp. 1973, 1, 309–317. [Google Scholar]
- Semeraro, T.; Mastroleo, G.; Pomes, A.; Luvisi, A.; Gissi, E.; Aretano, R. Modelling fuzzy combination of remote sensing vegetation index for durum wheat crop analysis. Comput. Electron. Agric. 2018, 156, 684–692. [Google Scholar] [CrossRef]
- Zhao, Y.; Potgieter, A.B.; Zhang, M.; Wu, B.; Hammer, G.L. Predicting wheat yield at the field scale by combining high-resolution Sentinel-2 satellite imagery and crop modelling. Remote Sens. 2020, 12, 1024. [Google Scholar] [CrossRef] [Green Version]
- Huete, A.; Ratana, P.; Didan, K.; Shimabukuro, Y.; Barbosa, H.; Ferreira, L.; Miura, T. Seasonal biophysical dynamics along an amazon eco-climatic gradient using modis vegetation indices. In Proceedings of the Anais XI SBSR, Belo Horizonte, Brazil, 5–10 April 2003. [Google Scholar]
- Ulfa, F.; Orton, T.G.; Dang, Y.P.; Menzies, N.W. Are Climate-Dependent Impacts of Soil Constraints on Crop Growth Evident in Remote-Sensing Data? Remote Sens. 2022, 14, 5401. [Google Scholar] [CrossRef]
- Ulfa, F.; Orton, T.G.; Dang, Y.P.; Menzies, N.W. A comparison of remote-sensing vegetation indices for assessing within-field variation of wheat yield. In Proceedings of the 20th Agronomy Conference, Toowoomba, QLD, Australia, 18–22 September 2022. [Google Scholar]
- Ulfa, F.; Orton, T.G.; Dang, Y.P.; Menzies, N.W. Developing and Testing Remote-Sensing Indices to Represent within-Field Variation of Wheat Yields: Assessment of the Variation Explained by Simple Models. Agronomy 2022, 12, 384. [Google Scholar] [CrossRef]
- Dang, Y.P.; Dalal, R.C.; Christopher, J.; Apan, A.A.; Pringle, M.J.; Bailey, K.; Biggs, A.J.W. Advanced Techniques for Managing Subsoil Constraints Project Results Book; Grains Research & Development Corporation: Canberra, Australia, 2010. [Google Scholar]
- Dang, Y.P.; Pringle, M.J.; Schmidt, M.; Dalal, R.C.; Apan, A. Identifying the spatial variability of soil constraints using multi-year remote sensing. Field Crops Res. 2011, 123, 248–258. [Google Scholar] [CrossRef]
- Dang, Y.P.; Dalal, R.C.; Pringle, M.J.; Biggs, A.J.W.; Darr, S.; Sauer, B.; Moss, J.; Payne, J.; Orange, D. Electromagnetic induction sensing of soil identifies constraints to the crop yields of north-eastern Australia. Soil Res. 2011, 49, 559–571. [Google Scholar] [CrossRef]
- Hochman, Z.; Probert, M.; Dalgliesh, N.P. Developing testable hypotheses on the impacts of sub-soil constraints on crops and croplands using the cropping systems simulator APSIM. In Proceedings of the 4th International Crop Science Congress, Brisbane, Australia, 26 September–1 October 2004. [Google Scholar]
- Page, K.L.; Dalal, R.C.; Menzies, N.W.; Strong, W.M. Nitrification in a Vertisol subsoil and its relationship to the accumulation of ammonium-nitrogen at depth. Aust. J. Soil Res. 2002, 40, 727–735. [Google Scholar] [CrossRef]
- Dang, Y.P.; Routley, R.; McDonald, M.; Dalal, R.C.; Alsemgeest, V.; Orange, D. Effects of chemical subsoil constraints on lower limit of plant available water for crops grown in southwest Queensland. In Proceedings of the 4th International Crop Science Congress, Brisbane, Australia, 26 September–1 October 2004. [Google Scholar]
- Thomas, G.A.; Gibson, G.; Nielsen, R.G.H.; Martin, W.D.; Radford, B.J. Effects of tillage, stubble, gypsum, and nitrogen fertiliser on cereal cropping on a red-brown earth in south-west Queensland. Aust. J. Exp. Agric. 1995, 35, 997–1008. [Google Scholar] [CrossRef]
- Flood, N.; Danaher, T.; Gill, T.; Gillingham, S. An operational scheme for deriving standardised surface reflectance from landsat TM/ETM+ and SPOT HRG imagery for eastern Australia. Remote Sens. 2013, 5, 83–109. [Google Scholar] [CrossRef] [Green Version]
- Zhu, Z.; Wang, S.; Woodcock, C.E. Improvement and expansion of the Fmask algorithm: Cloud, cloud shadow, and snow detection for Landsats 4-7, 8, and Sentinel 2 images. Remote Sens. Environ. 2015, 159, 269–277. [Google Scholar] [CrossRef]
- Huete, A.; Didan, K.; Miura, T.; Rodriguez, E.; Gao, X.; Ferreira, L. Overview of the radiometric and biophysical performance of the MODIS vegetation indices. Remote Sens. Environ. 2002, 83, 195–213. [Google Scholar] [CrossRef]
- Page, K.L.; Dang, Y.P.; Martinez, C.; Dalal, R.C.; Wehr, J.B.; Kopittke, P.M.; Orton, T.G.; Menzies, N.W. Review of crop-specific tolerance limits to acidity, salinity, and sodicity for seventeen cereal, pulse, and oilseed crops common to rainfed subtropical cropping systems. Land Degrad. Dev. 2021, 32, 2459–2480. [Google Scholar] [CrossRef]
- Chong, C.; Bible, B.B.; Ju, H.Y. Germination and emergence. In Handbook of Plant and Crop Physiology, 2nd ed.; NSW Department of Primary Industries: Albury, NSW, Australia, 2001; pp. 57–116. [Google Scholar]
- Weaver, J.E. Root habits of wheat. In Root Development of Field Crops; McGraw-Hill Book Company Inc.: New York, NY, USA, 1926. [Google Scholar]
- Pozza, L.E.; Filippi, P.; Whelan, B.; Wimalathunge, N.S.; Jones, E.J.; Bishop, T.F.A. Depth to sodicity constraint mapping of the Murray-Darling Basin, Australia. Geoderma 2022, 428, 116181. [Google Scholar] [CrossRef]
- Dang, Y.P.; Orton, T.G.; Mcclymont, D.; Menzies, N.W. ConstraintID: A free web-based tool for spatial diagnosis of soil constraints. In Proceedings of the 20th Agronomy Conference, Toowoomba, QLD, Australia, 18–22 September 2022. [Google Scholar]
- Orton, T.G.; Mcclymont, D.; Page, K.L.; Menzies, N.W.; Dang, Y.P. ConstraintID: An online software tool to assist grain growers in Australia identify areas affected by soil constraints. Comput. Electron. Agric. 2022, 202, 107422. [Google Scholar] [CrossRef]


| Soil Depth | Soil Constraints Data | Soil Constraints Severity Index | |||
|---|---|---|---|---|---|
| ECse (dS/m) | ESP (%) | ECse | ESP | Combined | |
| Field 1 | |||||
| 0.05 | 0.60 (0.42, 0.79) | 5.5 (2.9, 6.9) | 0.20 (0.14, 0.26) | 0.9 (0.5, 1.1) | 0.90 (0.48, 1.10) |
| 0.40 | 2.19 (1.08, 4.57) | 15.5 (11.8, 21.4) | 0.69 (0.36, 1.31) | 1.2 (0.8, 2.1) | 1.20 (0.79, 2.07) |
| 0.80 | 10.76 (6.31, 18.76) | 21.9 (18.7, 27.3) | 2.28 (1.66, 3.00) | 2.1 (1.7, 2.4) | 2.40 (1.92, 3.00) |
| 1.20 | 12.44 (9.20, 21.58) | 21.7 (16.5, 25.0) | 2.48 (2.15, 3.00) | 2.0 (1.3, 2.2) | 2.50 (2.15, 3.00) |
| Field 2 | |||||
| 0.05 | 0.59 (0.41, 1.03) | 3.5 (1.6, 5.0) | 0.17 (0.14, 0.23) | 0.5 (0.3, 0.8) | 0.50 (0.27, 0.82) |
| 0.40 | 1.97 (1.28, 3.18) | 13.1 (9.9, 17.3) | 0.63 (0.43, 1.04) | 0.9 (0.7, 1.3) | 0.90 (0.66, 1.34) |
| 0.80 | 8.13 (4.80, 18.01) | 22.4 (19.1, 27.4) | 1.90 (1.36, 3.00) | 2.1 (1.8, 2.4) | 2.20 (1.82, 3.00) |
| 1.20 | 9.28 (6.62, 12.16) | 23.7 (20.3, 28.5) | 2.16 (1.72, 2.52) | 2.2 (2.0, 2.4) | 2.30 (2.06, 2.52) |
| Field 3 | |||||
| 0.05 | 0.44 (0.31, 0.59) | 1.1 (0.4, 1.9) | 0.15 (0.10, 0.20) | 0.2 (0.1, 0.3) | 0.20 (0.10, 0.32) |
| 0.40 | 0.52 (0.24, 0.76) | 4.8 (0.6, 11.0) | 0.17 (0.08, 0.25) | 0.3 (0.0, 0.7) | 0.30 (0.08, 0.73) |
| 0.80 | 1.19 (0.43, 1.96) | 10.3 (0.4, 17.4) | 0.40 (0.14, 0.65) | 0.7 (0.0, 1.5) | 0.70 (0.14, 1.48) |
| 1.20 | 2.81 (0.58, 5.10) | 13.9 (0.2, 20.6) | 0.86 (0.19, 1.42) | 1.1 (0.0, 2.0) | 1.20 (0.19, 2.03) |
| Field 4 | |||||
| 0.05 | 2.71 (0.40, 7.92) | 5.8 (2.3, 11.2) | 0.80 (0.13, 1.98) | 0.9 (0.4, 1.6) | 1.00 (0.45, 1.98) |
| 0.40 | 10.43 (1.32, 21.78) | 16.1 (5.0, 27.9) | 2.03 (0.44, 3.00) | 1.3 (0.3, 2.4) | 2.10 (0.97, 3.00) |
| 0.80 | 20.50 (13.06, 26.38) | 22.1 (15.3, 28.4) | 2.95 (2.63, 3.00) | 2.0 (1.1, 2.4) | 3.00 (2.63, 3.00) |
| 1.20 | 20.05 (15.46, 23.56) | 25.2 (17.7, 32.0) | 2.99 (2.93, 3.00) | 2.2 (1.5, 2.6) | 3.00 (2.93, 3.00) |
| Field 5 | |||||
| 0.05 | 0.72 (0.34, 1.32) | 8.2 (3.0, 12.0) | 0.24 (0.11, 0.44) | 1.2 (0.5, 1.7) | 1.20 (0.50, 1.67) |
| 0.40 | 2.60 (0.93, 4.43) | 20.4 (15.0, 28.1) | 0.83 (0.31, 1.29) | 1.8 (1.0, 2.4) | 1.80 (1.00, 2.41) |
| 0.80 | 5.67 (3.77, 8.68) | 29.0 (20.1, 45.8) | 1.53 (1.15, 2.08) | 2.4 (2.0, 3.0) | 2.40 (2.00, 3.00) |
| 1.20 | 6.35 (4.78, 8.12) | 36.5 (25.1, 48.7) | 1.67 (1.36, 2.01) | 2.8 (2.3, 3.0) | 2.80 (2.26, 3.00) |
| No Constraint (0) | Potential (1) | Severe (2) | Extreme (3) | |
|---|---|---|---|---|
| ECse | 0 dS/m | 3 dS/m | 8 dS/m | 16 dS/m |
| Topsoil ESP | 0% | 6% | 15% | 30% |
| Subsoil ESP | 0% | 15% | 20% | 40% |
| Stages | Dates Relative to Peak | Dates Relative to Planting Date | Expected Root Depth | Representative Sampled Depth |
|---|---|---|---|---|
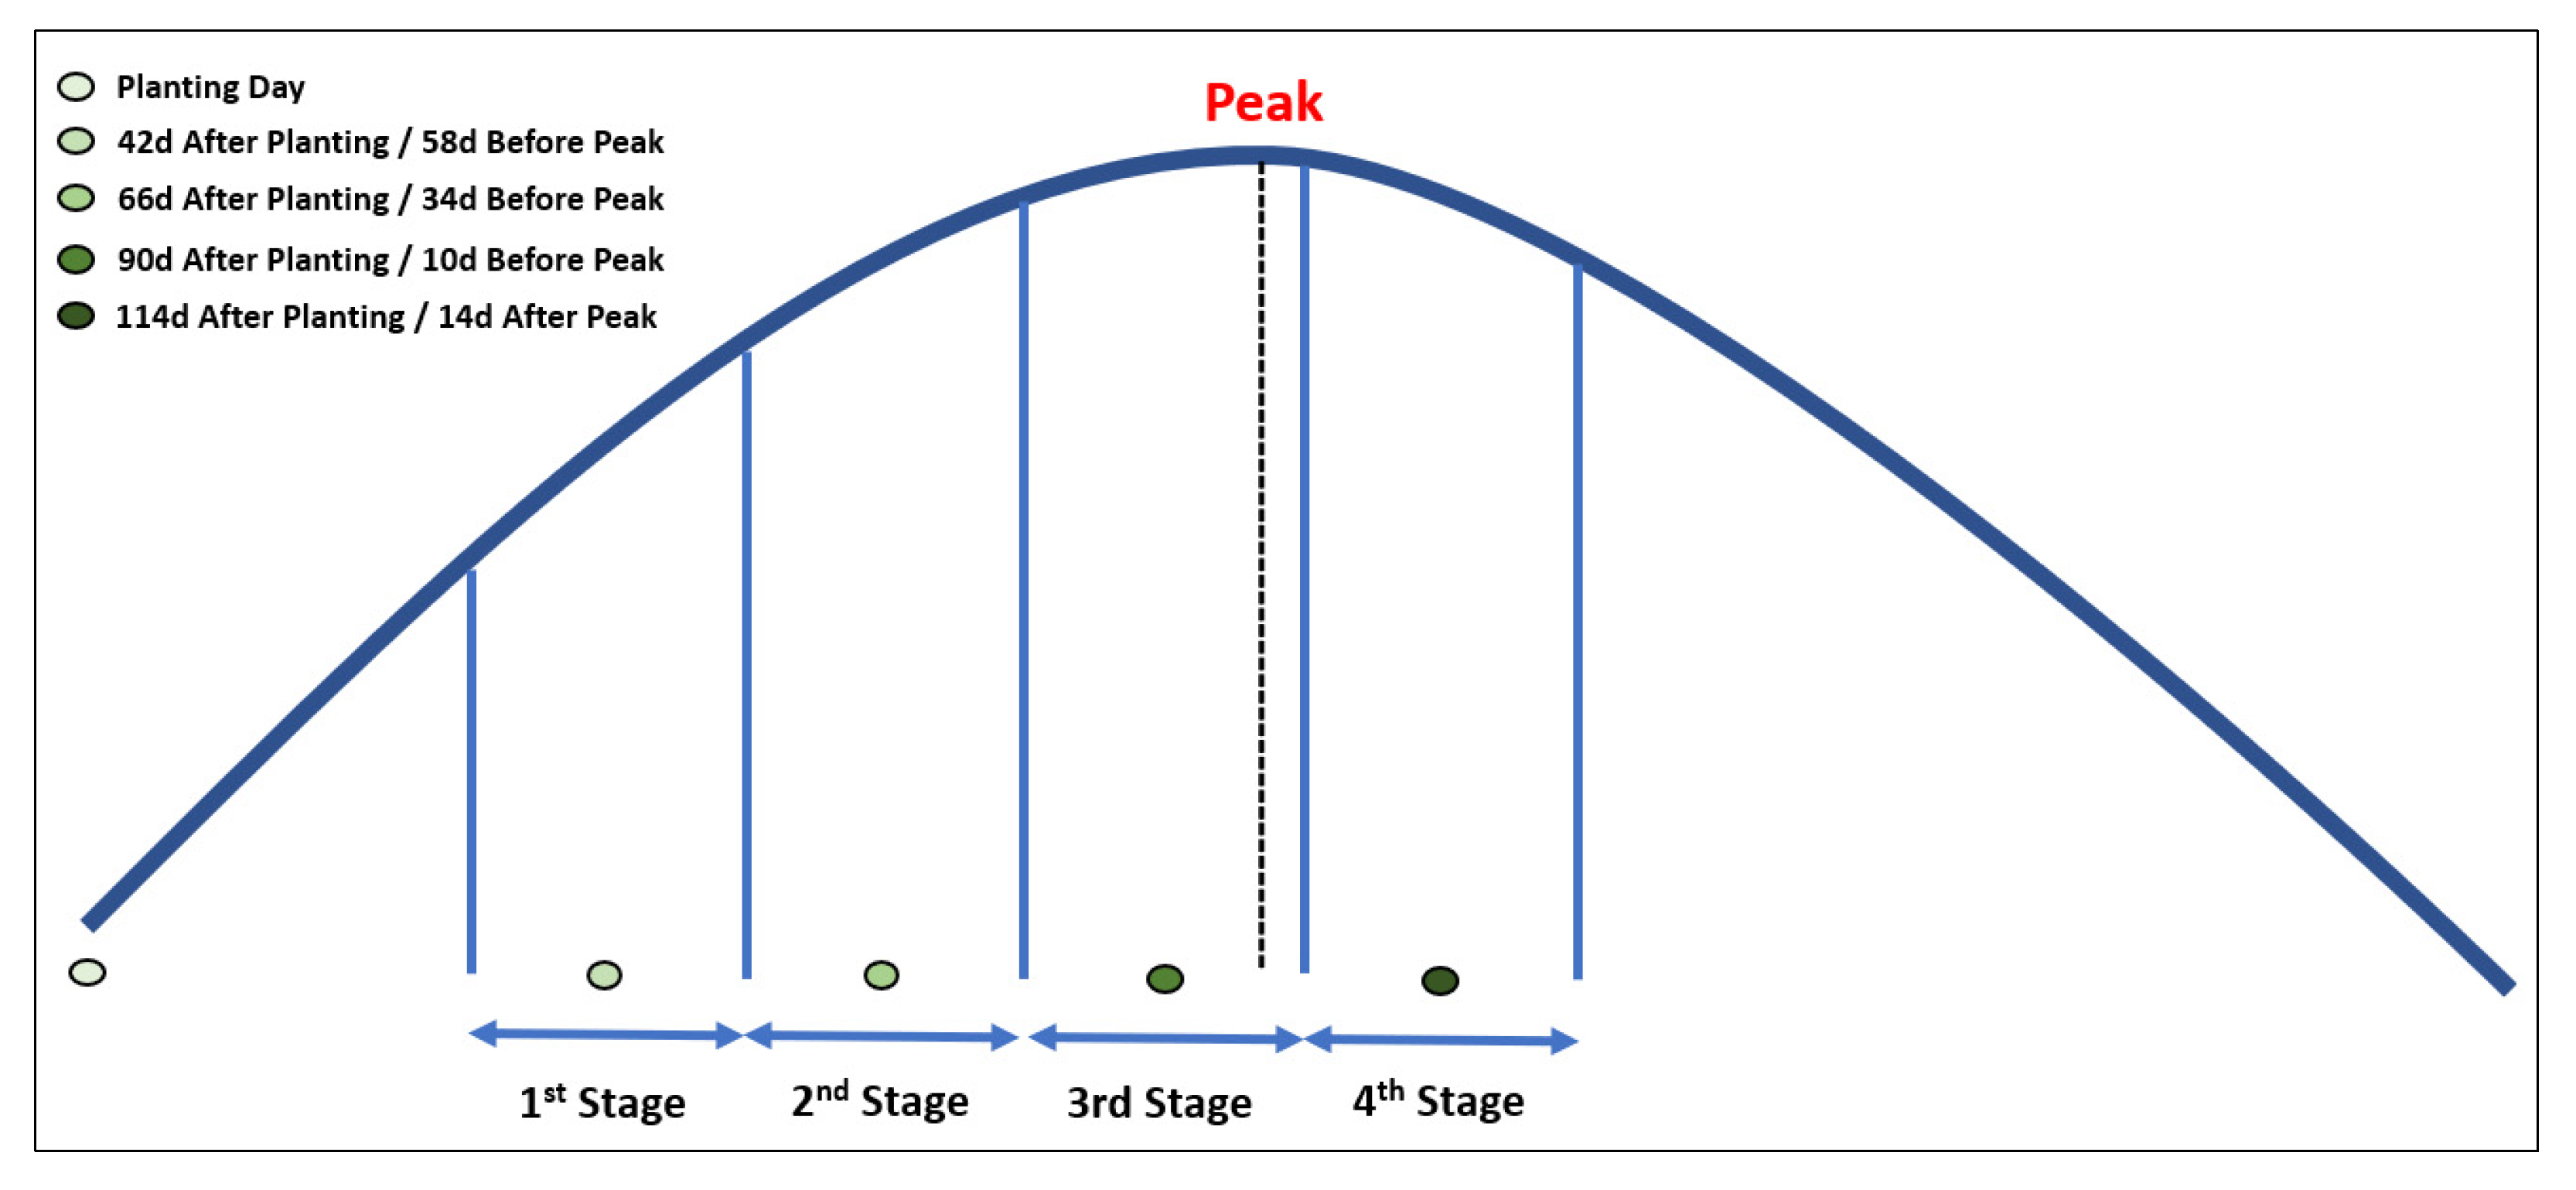
| 1st | 70–47 days before peak | 30–53 days after planting | 30 cm | 0–10 cm |
| 2nd | 46–23 days before peak | 54–77 days after planting | 60 cm | 30–50 cm |
| 3rd | 22 days before peak–2 days after peak | 78–102 days after planting | 90 cm | 70–90 cm |
| 4th | 3–26 days after peak | 103–126 days after planting | 120 cm | 110–130 cm |
| Sampled Soil Depth | Statistics | Field 1 | Field 2 | Field 3 | Field 4 | Field 5 |
|---|---|---|---|---|---|---|
| 0–10 cm | r | −0.10 | −0.52 | −0.74 | −0.13 | −0.43 |
| p-value | 0.81 | 0.23 | 0.01 | 0.71 | 0.21 | |
| 30–50 cm | r | −0.75 | −0.43 | −0.67 | −0.27 | 0.00 |
| p-value | 0.02 | 0.33 | 0.02 | 0.46 | 0.97 | |
| 70–90 cm | r | −0.25 | −0.31 | −0.70 | −0.32 | −0.43 |
| p-value | 0.51 | 0.50 | 0.01 | 0.38 | 0.22 | |
| 110–130 cm | r | 0.57 | 0.16 | −0.72 | 0.08 | 0.16 |
| p-value | 0.11 | 0.74 | 0.01 | 0.82 | 0.67 |
Disclaimer/Publisher’s Note: The statements, opinions and data contained in all publications are solely those of the individual author(s) and contributor(s) and not of MDPI and/or the editor(s). MDPI and/or the editor(s) disclaim responsibility for any injury to people or property resulting from any ideas, methods, instructions or products referred to in the content. |
© 2023 by the authors. Licensee MDPI, Basel, Switzerland. This article is an open access article distributed under the terms and conditions of the Creative Commons Attribution (CC BY) license (https://creativecommons.org/licenses/by/4.0/).
Share and Cite
Ulfa, F.; Orton, T.G.; Dang, Y.P.; Menzies, N.W. A Study of the Relationships between Depths of Soil Constraints and Remote Sensing Data from Different Stages of the Growing Season. Remote Sens. 2023, 15, 3527. https://doi.org/10.3390/rs15143527
Ulfa F, Orton TG, Dang YP, Menzies NW. A Study of the Relationships between Depths of Soil Constraints and Remote Sensing Data from Different Stages of the Growing Season. Remote Sensing. 2023; 15(14):3527. https://doi.org/10.3390/rs15143527
Chicago/Turabian StyleUlfa, Fathiyya, Thomas G. Orton, Yash P. Dang, and Neal W. Menzies. 2023. "A Study of the Relationships between Depths of Soil Constraints and Remote Sensing Data from Different Stages of the Growing Season" Remote Sensing 15, no. 14: 3527. https://doi.org/10.3390/rs15143527
APA StyleUlfa, F., Orton, T. G., Dang, Y. P., & Menzies, N. W. (2023). A Study of the Relationships between Depths of Soil Constraints and Remote Sensing Data from Different Stages of the Growing Season. Remote Sensing, 15(14), 3527. https://doi.org/10.3390/rs15143527


