Abstract
Location information is the core data in IoT applications, which is the essential foundation for scene interpretation and interconnection of everything, and thus high-precision positioning is becoming an immediate need. However, the non-line-of-sight (NLOS) effect of indoor complex environment on UWB signal occlusion has been a major factor limiting the improvement in ultra-wideband (UWB) positioning accuracy, and the optimization of NLOS error has not yet been studied in a targeted manner. To this end, this paper deeply analyzes indoor scenes, divides NLOS into two forms of spatial occlusion and human occlusion, and proposes a particle filtering algorithm based on LOS/NLOS mapping and NLOS error optimization. This algorithm is targeted to optimize the influence of two different forms of NLOS, using spatial a priori information to accurately judge the LOS/NLOS situation of the anchor, optimizing the NLOS anchor ranging using IMU to project the virtual position, judging whether the LOS anchor is affected by human occlusion, and correcting the affected LOS anchor using the established human occlusion error model. Through experimental verification, the algorithm can effectively suppress two different NLOS errors of spatial structure and human occlusion and can achieve continuous and reliable high-precision positioning and tracking in complex indoor environments.
1. Introduction
In the Internet of Things (IOT) era, location information attaches spatiotemporal attributes to everything and is an essential foundation for achieving scene interpretation and interconnection of everything. The global navigation satellite system (GNSS) can provide outdoor positioning information with meter-level accuracy, which basically meets the needs of outdoor location-based service (LBS) [1]. However, it is not practical to rely on GNSS to provide LBS indoors due to building occlusion [2]. With the large-scale development of indoor/underground space, people are increasingly active in the indoor environment. In the face of the unfamiliar and overly complex indoor space, the need for accurate indoor positioning becomes more urgent [3]. The global indoor positioning, localization, and navigation (PLAN) market is expected to reach $28.2 billion by 2024, growing at a compound annual growth rate (CAGR) of 38.2% [4]. Therefore, driven by commercial potential, indoor positioning has been widely studied [5,6,7,8,9,10,11].
Due to its nanosecond non-sinusoidal narrow pulse characteristics and strong anti-interference capability, UWB can achieve centimeter-level positioning accuracy in line-of-sight environments [12]. Therefore, the technology is favored by major cell phone manufacturers such as Apple, Samsung, NXP, Xiaomi, and OPPO as a promising industry solution. However, in real indoor positioning, due to the complex spatial structure and time-varying human occlusion environment, UWB, like other RF signals, is affected by NLOS, multipath effects, and other factors, resulting in serious ranging errors, and the accuracy of positioning with UWB is directly affected. Optimizing the localization performance with UWB in the NLOS environment has thus become the focus of the majority of scholars [10,13,14,15]. The solution strategies can be divided into two types, one of which is to make LOS/NLOS judgments on the current ranging signal and then correct the ranging value of NLOS through error models. After the determination of NLOS, various channel parameters of the signal are compared with prior information to make a classification. The common methods include mathematical statistics [16] and machine learning [17]. In the correction of NLOS errors, the error compensation model is generally trained by fitting error models to experimental test data [18] and deep learning [19]. Although this strategy can alleviate ranging errors to a certain extent, the establishment of error models is closely related to the environment of experiments, so it is difficult to be universally applied. Another is to design specific positioning algorithms in the positioning phase to weaken the influence of NLOS errors on the final positioning results. Common methods include various anti-difference filters [20,21,22] and the fusion of inertial guidance selected from classical combined navigation strategies [3,23,24], where anti-difference filters can compensate for short-time NLOS effects, but are not ideal for weakening the large-scale NLOS errors caused by spatial structure, and the classic fusion solutions mainly rely on IMU performance. By summarizing the existing schemes, we found that the experimental scenarios of most studies are relatively ideal and simple. Small-sized wooden boards, glass and metal boxes, and other objects are often used as obstacles in the NLOS occlusion, which cannot truly reflect the complexity of indoor space, and the tags are generally placed over the head of pedestrians in pedestrian localization, ignoring the influence of human body occlusion, in addition, the NLOS with different characteristics are not differentiated and analyzed in depth.
Therefore, in order to obtain high-precision pedestrian location information in a typical indoor complex environment with spatial occlusion and no redundant anchor, this paper analyzes the difference of the influence of different NLOS on UWB ranging from the real positioning scene and classifies NLOS into NLOS with a fixed impact area due to indoor spatial structure occlusion and NLOS of dynamic changes with pedestrian trajectory due to human occlusion. For the spatial structure NLOS, firstly, the LOS/NLOS information mapping of anchors is established based on the invariance of indoor spatial structure combined with the location of anchor deployment, and the prior information of spatial structure is fully utilized to accurately distinguish between LOS and NLOS anchors at any location in space, then a method is designed to optimize the NLOS ranging value by using the recursive location points of the low-cost IMU that comes with the device. For NLOS that varies by human occlusion, a pedestrian occlusion UWB ranging error correction model is established based on the relationship between the relative positions of the human body, base station, and tag and the ranging error, then a UWB high-precision pedestrian localization method dealing with NLOS errors is designed by using a particle filtering solution, the effectiveness of this method is verified by real test experiments.
The main contributions of this paper can be summarized as follows:
- (1)
- Analyze the difference of different NLOS effects on UWB ranging, classify NLOS into fixed spatial structure NLOS and human occlusion NLOS that changes with pedestrian movement for the first time.
- (2)
- Using the indoor spatial structure relationship, combined with the deployment location of base stations, the LOS/NLOS information mapping of anchors is quickly and conveniently established to accurately distinguish LOS/NLOS anchors and further optimize the range value of NLOS using the recursive position of IMU.
- (3)
- A UWB error correction model for human body occlusion is established to compensate for the error of NLOS for the dynamic human body occlusion.
- (4)
- A novel high-precision pedestrian positioning method is developed to handle UWB NLOS errors, and the system performance is verified.
The remainder of this article is organized as follows. We review the related work in Section 2. Section 3 describes the establishment of an information map of positioning LOS/NLOS anchors and the optimization method for spatially structured NLOS ranging; Section 4 describes the established UWB human occlusion error model; Section 5 presents the designed high-precision positioning method; Section 6 presents the experiments and experimental analysis; and finally, Section 7 concludes the paper.
2. Current Work
UWB positioning mainly relies on its unique RF characteristics, using the Time of Flight (TOF) of the signal to calculate the distance between the transceiver and the transmitter to estimate the location of the tag. The accuracy of ranging depends on the ability of the receiver whether it can correctly determine the TOF of the first diameter signal [25]. In the NLOS scene, the signal propagation path is more complex, as shown in Figure 1, Anc1 sends signals obscured by spatial obstacles, and the signal propagation will consist of multiple paths of transmission, reflection, and bypass. The literature [10] compared and discussed the direct, reflected, transmitted, and bypass propagation characteristics of three different UWB systems in a factory environment. The conditions of the generation of NLOS signal are closely related to the indoor structure, and several NLOS signals may be received by the tag at the same time due to the complex spatial structure, which makes the UWB range values jump severely. Thus, to optimize the ranging, using error modeling for NLOS caused by spatial structure in a complex environment will no longer be an effective solution.
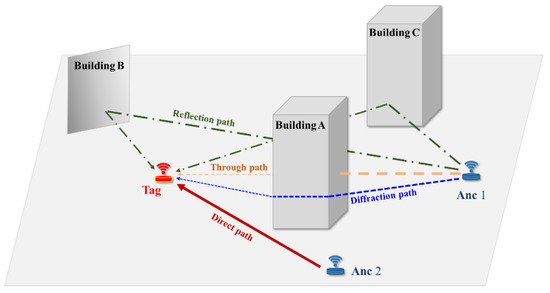
Figure 1.
LOS and NLOS propagation model of the signal.
Making use of the spatial geometric structure, semantics, feature points, and other information contained in the spatial model can effectively guide and correct the positioning effect [21,26], in addition to the map matching (MM) and map aiding (MA) algorithms, the use of spatial structure map to solve NLOS problems has also received increasing attention from scholars. Zhu researched an adaptive UWB positioning error map construction method, using the idea of fingerprint positioning to range UWB on spatial grid points, classifying the size of spatial grid points in a hierarchical manner according to the distribution of error values, and further establishing an error model of non-uniform positioning error grid to correct the positioning effect [27]. Wang used a map line segment matching algorithm for NLOS identification of UWB signals based on the spatial relationship between the anchor and the tag, observed the change in the range value, and adjusted the observed value by setting a threshold. The method uses the idea of an anti-difference algorithm to improve the localization effect, but the construction of spatial information is more cumbersome and not fully utilized [28]. Based on the literature [27], Liu proposed and implemented an indoor positioning system (IPS) based on a digital twin with UWB signals. Based on the constructed digital twin, the optimal anchor layout, adaptive error map construction, and positioning error mitigation are achieved [29]. Though the study does not consider the instability of NLOS errors, the strategy of using the new technology for building maps quickly is worth studying.
In the person location scenario, as the carrier holding the tag, the human body must block part of the ranging signal of anchors during the movement. Kiliç earlier studied the human shadow effect when people stand in different positions between TAG and ANC and found that the effect is similar to the infrastructure barrier [30]; subsequently, the issue of human occlusion error has also attracted the attention of some scholars. Taking two variables into consideration in the experiment, which are the angle of the human body relative to the tag-anchor connection and the distance between the tag and the anchor, Geng put the tag close to the human chest. Through the analysis of experimental data, the error was modeled by dividing the UWB propagation into body surface propagation and in vitro propagation [31]. On this basis, place the positioning tag at the wrist of the human body; by considering the three indicators of signal bandwidth, the signal-to-noise ratio, the angle formed by the human body, and the connection line between the tag and the anchor, experiments were carried out in LOS and NLOS scenarios, and it was found that the ranging errors in different scenarios are consistent with the Gaussian model, and the angle-related wrist error model is further established [32]. Otim explored the interaction between ultra-wideband and the human body by using the finite-difference time-domain (FDTD) technique and found that the ranging error showed a Gaussian distribution in the LOS environment and a Gamma distribution in the NLOS environment through statistical analysis of the data and an error function model is established with this feature [33]. Then, Otim focused on studying the effects of body wearable sensor positions, i.e., chest, arm, ankle, wrist, thigh, forehead, and hand, and evaluated the ranging error; through the analysis of tests, the best body sensor location is found to be the forehead, while the worst is the chest [34]. Furthermore, by placing the tag at the forehead and the chest, based on the ranging error model proposed in the literature [33], sub-meter level localization accuracy of the human wearable sensor can be achieved by using a particle filter (PF) that can help locate and track the human body [35]. The research results above are worthy of our consideration and further in-depth study.
To the best of our knowledge, the problem of accurate indoor pedestrian localization that takes into account the effects of two NLOS, namely spatial structure and human occlusion, has not been solved. By summarizing the current state of research in the literature, Our ideas are clarified to solve the problem. In this paper, Spatial prior information is used to accurately judge the LOS/NLOS anchor situation. The NLOS anchor ranging can be optimized by using IMU to derive the virtual position, the LOS anchor can be judged whether it is affected by human occlusion, the affected LOS anchor can be corrected by using the established human occlusion error model, and a high-precision localization method for UWB in complex NLOS environment can be designed by combining the particle filtering solution method. The comparative analysis of the experiments proves that the system is able to track pedestrians accurately with a more robust performance compared to the state-of-the-art approaches.
3. Spatial Structure NLOS Discrimination and Ranging Optimization Method
Using NLOS influence formed by large shopping malls, subway hubs, underground parking lots, and other such complex indoor building structure is the direct cause of the unsatisfactory indoor positioning accuracy. Though the spatial structure is complex, its useful value can be found when the anchors are laid out, and the fixed spatial structure can provide us with enough prior information to judge the LOS/NLOS area of anchors. Therefore, to solve the problem of spatial structure NLOS discrimination and ranging optimization, in this section, we first used a backpack-mounted LiDAR device to obtain spatial prior information and established a UWB anchor LOS/NLOS map to achieve precise determination of the LOS/NLOS condition from any location in space. The effectiveness of the LOS/NLOS anchor discrimination was verified through practical experiments. We then derived the positioning formula to demonstrate that ranging errors would significantly affect the positioning solution. Finally, we designed a method to optimize NLOS ranging values using the low-cost IMU provided by the device to correct NLOS ranging errors.
3.1. UWB LOS/NLOS Anchor Mapping Method
Nowadays, with the promotion and application of LiDAR equipment, the collection and construction of indoor space environments have become fast and accurate. As shown in Figure 2a, this paper chose the lidar backpack device that fuses two 16-line Velodyne lidar and a panoramic camera to collect information from room 314, covering an area of 744 square meters, which has typical spatial structure NLOS features like subways and underground parking, the acquisition process takes about 2 min, and the generated LIDAR point cloud can be shown in Figure 2c. A simple 2D plan of the experimental site can be quickly generated, and the spatial dimensions of the site can be obtained by using modeling software, as shown in Figure 2d, where the five gray rectangles are the columns in the site, and the side length of the square column is 0.8 m.
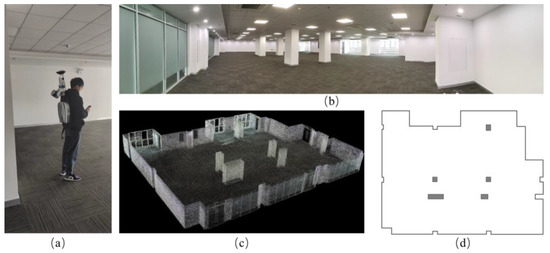
Figure 2.
Experimental environment information collection and mapping (a) backpack LiDAR collection process (b) experimental environment (c) point cloud data collected by LiDAR (d) experimental ground plan drawn using LiDAR-collected information.
After acquiring the spatial information of the site, the LOS and NLOS areas in the site can be quickly identified according to the location where the anchors are built. The criterion for identification is to see whether the line connecting any point in space with the anchor intersects with an obstacle (the column in this experimental site), then make a judgment. If there is an intersection, it means that the ranging process is blocked, and at this time, the location point where the tag is located is NLOS case relative to the anchor; otherwise, it is LOS case.
As shown in Figure 3, the red dot is the location where the anchor is located, and the black rectangle is the column in the site. P0, P1, P2, P3 are the corners of the column, and the coordinates of the corners of the column are brought in to calculate the two-dimensional equations of the four edges of the column (P0P1, P1P2, P2P3, P3P0). Taking the edge P0P1 as an example, the equation of the line for this edge is expressed as:
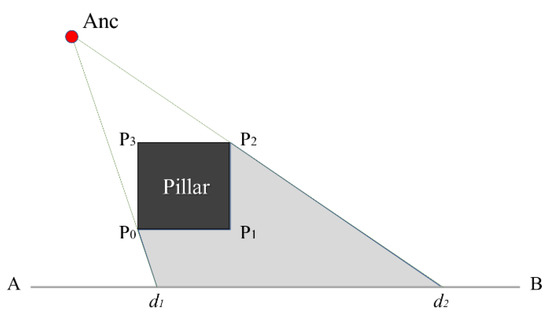
Figure 3.
Schematic diagram of LOS/NLOS area determination at the anchor.
Among them, is the two-dimensional coordinate of point P0, is the two-dimensional coordinate of point P1.
Among them, is the two-dimensional coordinate of the anchor, is the two-dimensional coordinate of any point in space.
Any point in space is an LOS state for the anchor and can be determined by calculating whether Equations (1) and (2) have an intersection. It is obvious to see in Figure 3 that the gray area enclosed by the is the NLOS area with respect to Anc.
3.2. Algorithms LOS/NLOS Discrimination Effect Validation
To verify the usability of the LOS/NLOS maps of the anchor, we test in a 225 square meter area containing two columns on the right side of 314 site. Experiments were conducted using the LinkTrack P device manufactured by NOOPLOOP. This device integrates UWB and IMU modules and achieves clock synchronization between UWB and IMU at the hardware level. The UWB module selected for this device utilizes the DW1000 chip, operating in the frequency range of 3744–4243 MHz, with a bandwidth of 499 MHz and a sampling frequency of 50 Hz. (This device was used for all experiments presented in this article.) A total of eight anchors from A0–A7 are set in the region, and the map is built with a sampling interval of 0.1 m, as shown in Figure 4a, where the red pentagram is the location of the anchor, the blue dot indicates the single anchor NLOS region, the cyan dot is the region of two anchors with simultaneous NLOS situation, the yellow is the region of three anchors with simultaneous NLOS situation, and the red dot is the region of four base stations with simultaneous NLOS situation. Through the effect demonstrated by Figure 4a, the LOS and NLOS situation of the corresponding anchor at any location can be quickly and accurately determined. To further verify the effect of determining the NLOS by building the map quickly, we conducted a field test on the region using UWB. The experiment was designed to walk around two columns, as shown in Figure 4b, with d0 as the starting point and d7 as the ending point. Taking the A0 anchor as an example, it can be seen that sections d3–d4 and d5–d6 are affected by NLOS. Figure 4c shows the ranging error of the A0 anchor in a three-dimensional form, where the X and Y axes indicate the spatial relative position and the Z axis indicates the value of the ranging error, and Figure 4d is the ranging error in the form of two dimensions, where the X axis indicates the path segment and the Y axis indicates the ranging error. As can be seen from the figure, when the AO anchor is in the LOS, the ranging error is stable within 0.2 m, which means that the ranging measurement is effective in the LOS case, while in the NLOS case, the ranging value has a serious deviation, with the maximum error reaching 4.49 m. This phenomenon also shows that the NLOS propagation signal is variable due to the influence of large indoor structures and complex environments, and the method of establishing an error compensation model by measurement is not an effective solution to improve the positioning effect in this environment.
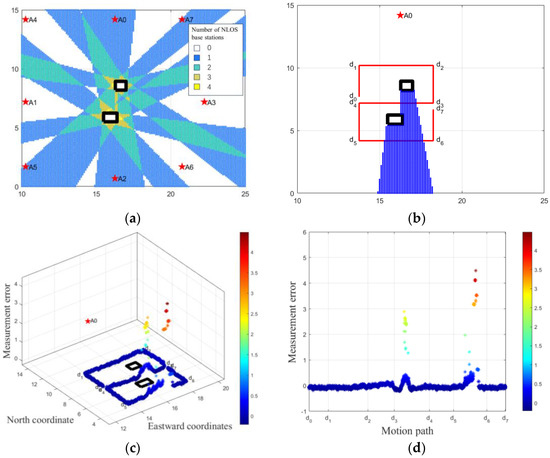
Figure 4.
Validation of anchor LOS/NLOS map effect (a) overall situation of anchor NLOS areas of the experimental area (b) NLOS area corresponding to Anc A0 (c) 3D map of Anc A0 experimental path and ranging error (d) 2D map of experimental path and ranging error.
Through the above analysis and comparison, the building method in the LOS/NLOS anchor designed in this paper can be used to quickly lock the NLOS area of the anchor, and the adoption interval can also be easily adjusted according to the demand. This work lays the foundation for the judgment and trade-off of the validity of the anchor measurement data in the subsequent positioning solution.
3.3. Relationship between Positioning Solution and Ranging Error
Take the 2D UWB positioning system as an example; by obtaining the distance between the corresponding tag and the anchor and then drawing three or more circles with the anchor as the center and the distance as the radius, the intersection of the circles is the location of the tag. Figure 5a shows the localization solution in the ideal case; the measured distance value is the real value, so the localization result is the intersection of three circles.
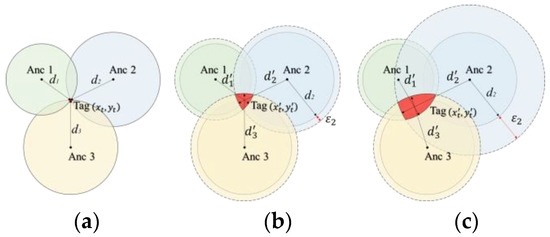
Figure 5.
Relationship between distance measurement and positioning (a) Ideal positioning results (b) LOS situation location results (c) NLOS situation location results.
However, in reality, the signal is affected by noise during propagation and measurement, so the actual measurement model between the anchor and the tag can be expressed as:
where is the actual measurement value of the ith anchor, is the real distance between the anchor and the tag, and is the ranging error.
Figure 5b shows the localization solution in the LOS case, and the localization result affected by the ranging error will be located in the red graphical region where the three circles intersect. In the LOS case, the ranging error conforms to the Gaussian distribution, and the error is generally small at the centimeter level [36], which has a small influence on the localization result. However, when NLOS ranging occurs, as shown in Figure 5c, assuming Anc 2 as the NLOS anchor, the error caused by NLOS is often more serious compared to the LOS error. As shown in the LOS/NLOS discrimination effect verification experiment, the error of NLOS by the influence of the column reaches 4.49 m, and it can be seen that the red graphic area where the three circles intersect is significantly larger.
Figure 5 shows that the accuracy of UWB positioning depends mainly on the ranging accuracy of the anchor and the tag. When there is a large NLOS error, the localization result will seriously deviate from the real value. Therefore, in the case of non-redundant anchors, the range value of the NLOS anchor must be optimized to ensure the accuracy of the localization solution.
3.4. Spatial NLOS Error Optimization Method
The low-cost IMU error accumulation is severe, and although the short-time recursive accuracy is not as good as the UWB LOS ranging, it still has a significant advantage over the NLOS ranging, which is tens to hundreds of times the error of the LOS ranging [36]. Therefore, this paper will optimize the NLOS ranging values using the IMU recurrence position.
As shown in Figure 6, the blue ball is the real position of the tag movement, and for the convenience of illustration, the position of blue ball No. 1 is represented by , the dark green ball indicates the solved position in the UWB LOS case, and corresponds to the position of dark green ball No. 1. As can be seen from the figure, when the tag moves to position No. 3 , the obstacle blocks the communication signal of the anchor on the right, so the anchor will generate an NLOS error and the UWB solution will be seriously deviated, and the tag result will deviate to the UWB NLOS solution position indicated by the red ball in the figure. It can be seen that has seriously affected the positioning accuracy of the tag, so we discard the solution point, optimize the range value of the NLOS anchor and then re-solve it. In this paper, we first use the anchor LOS/NLOS mapping to lock the position of the tag at the previous moment of entering the NLOS region, such as the dark green ball No. 2 in Figure 6, and use the UWB historical solution position combined with smoothing filtering to obtain the velocity value at this position, as shown in Equations (4) and (5), where is the smoothing window size, and is the sampling period.
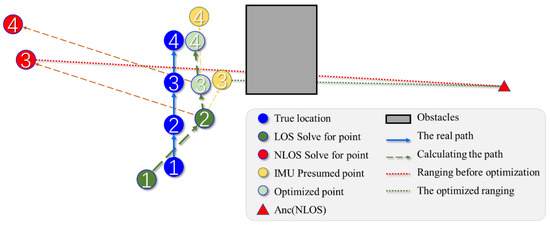
Figure 6.
Schematic diagram of NLOS range correction.
The position at the moment k + 3 is recursively obtained using the acceleration and heading angle collected by the UWB device’s own low-cost IMU in the current epoch, as indicated by the position in the yellow ball No. 3 in the figure, and calculated as shown in Equations (6) and (7).
The optimized NLOS anchor-ranging value is then obtained using combined with the location of the NLOS anchor as shown in Equation (8).
The optimized NLOS range value and the LOS anchor range value are substituted into the localization solution to obtain the UWB localization solution, as shown in Figure 6 for the light green position No. 3 . Similarly, at the moment , the recursive value of IMU is obtained on the basis of , and the NLOS anchor range value is optimized using , and then the UWB localization solution is performed to obtain the light green position No. 4 , and so on, until the influence of NLOS disappears.
4. Human Error Compensation Model
4.1. Analysis of Human Blocking Phenomenon
Pedestrians will place the positioning device (i.e., tag) on their chests for easy interaction during positioning. Due to the presence of the body, an NLOS region will be formed in the opposite direction of pedestrian travel, as shown in the blue sector in Figure 7, and the anchor in this region will also generate positive ranging bias due to the occlusion of the human body. To verify the effect of pedestrian bodies on UWB ranging, we erected anchors and tags on both sides of the pedestrian queue (dynamic), with tags about 0.5 m away from the queue and a straight-line distance of 7.25 m from the anchor and the scene is shown in Figure 8a. The change in the queue advance will have an impact on the UWB range. To facilitate the analysis of the correlation between occlusion and error, a camera is set up next to the anchor to capture the actual occlusion change of the pedestrian flow, and the ranging error is obtained by subtracting the straight-line distance between the tag and the anchor by 7.25 m. The UWB acquisition frequency is 50 Hz, and a total of 20 groups are acquired with an interval of 30 s. The ranging situation of one group is shown in Figure 8b, in which the horizontal coordinates are the epochs, the vertical coordinates are the ranging error values, and the images pointed by arrows in the figure are the corresponding actual occlusion of the epoch circled by the circles. From the figure, it can be found that the human body has an obvious effect on the ranging of UWB, such as between 800 and 1200 epochs, and the error values appear obvious ups and downs when the human flow passes quickly and the first 158 epochs and around 850, 960, and 1100 epochs, the tag and the anchor are just located in the queue gap and are in the LOS situation; therefore, the ranging error is around 0 value. When in the NLOS environment due to human occlusion, for example, a range error of 0.4 m was generated at 200 epochs, while at 883 and 1479 epochs, the range error values increased significantly to 0.7 and 1.1 m, respectively, due to the closer distance of the human body from the tag. It can be seen that the error of human occlusion cannot be ignored, so the distance measurement values affected by human occlusion must be optimized in order to obtain high-accuracy pedestrian positioning results.
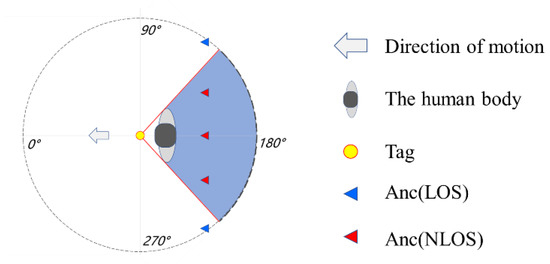
Figure 7.
Top view of human occlusion effect.
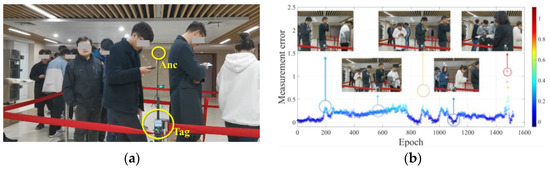
Figure 8.
Test on the influence of human flow on UWB ranging (a) experimental test scene (b) analysis of measurement error and corresponding human body occlusion situation.
4.2. Vector Art Human Occlusion Error Modeling
In the literature [37], based on previous studies [30,31,32,33,34,35], the relative heading angle (RHA) between TAG and ANC was considered by testing in three different experimental scenarios outdoors and indoors, and it was found that the ranging errors conformed to a Gaussian distribution at RHAs from to and to a gamma distribution from to . Based on the experimental data combined with Gaussian distribution under LOS and gamma distribution under NLOS, a UWB-ranging error model for human blocking is constructed. The expression for the probability distribution is shown in (9) [37], where is the ranging error, is the unit step function, is the angular threshold, is the degree of NLOS influence, and indicate the mean and standard deviation of the distribution, and a constant term c is included in the model to account for spurious ranging and situations where an error falls to the unsupported range of Gamma distribution. The relationship between and angle is shown in (10) [37].
In this paper, we will draw on the error model strategy devised in the literature [37], and the selection of model parameters will be obtained by measuring two different indoor scenarios, as shown on the left side of Figure 9. For the location of the tag, we consider the normal posture of pedestrians viewing cell phones, and the tag is located in front of the chest 25 cm, considering the shoulder width of adults to be about 50 cm; refer to Figure 7. The angle value at and is the critical angle value of LOS and NLOS. In the choice of relative angle with Anc, for the convenience of testing, this paper only measured the interval from to because of the symmetry relationship, the interval from to is no longer considered, and the error model angle is also made the same consideration, as shown in the right side of Figure 9 for the top view schematic of the test experiment, the legend is the same as Figure 7.
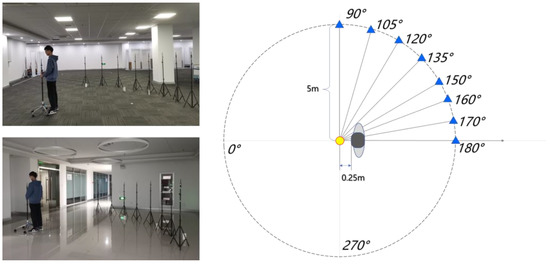
Figure 9.
Human occlusion indoor test scene and test schematic.
For both scenarios, UWB devices with a frequency of 50 Hz were used, and each set of data was acquired for 30 s, with a total of about 24,000 data acquired. The measurement error histogram is shown in Figure 10, where the error value is obtained by making a difference between the measured value and the straight-line distance, and it can be seen from the figure that the ranging errors at different angles conform to a normal distribution, which is not quite consistent with what is described in the literature [37], where the error data show a gamma distribution when the RHA is greater than . This paper explored this purpose when bringing the body closer to the tag (less than 0.1 m), the measurement data will jump, and the error value will show a gamma distribution. Considering the setting of tag and body distance in this paper, therefore, we will not consider the gamma distribution anymore with the actual collected data. In the relationship between the error and the angle through the graph labeled mean and variance can be seen when the angle is less than , UWB for LOS propagation, the error is basically 0; when the angle in the to interval for NLOS propagation, the error value rose significantly; when the angle for , reached a maximum of 0.33 m, this phenomenon also corresponds to our experiments designed by the tag, Anc, and the NLOS region formed by the spatial relationship between the human body. The error situation is basically the same for both scenes at the same angle, and only at and , there is a slight deviation of 0.04 m, which may be because of the deviation in the experimental anchor position placement.
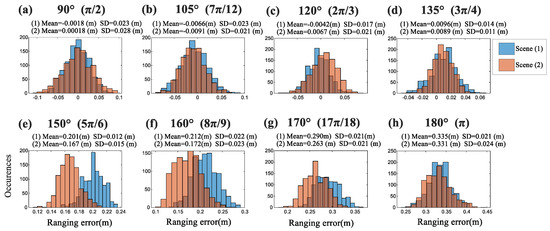
Figure 10.
Distribution of mismeasurement distance difference.
The mean and variance are shown in Figure 11a,b, and the distribution of the mean can be more intuitive to see the relationship between the error value and the angle. Regarding the data fitting, we chose the mean value of the NLOS environment data, as shown in Figure 11c, and compared it by choosing a linear function and a cubic function, the R2 after linear fitting is 0.928, and the RMSE is 0.067, and the R2 after cubic fitting is 0.983 and the RMSE is 0.032, and the comparison shows that the cubic fitting is more effective. Therefore, we differ from the literature [37] in choosing the cubic fitting formula to establish the error model. The expression of the mean value of the error is shown in (11), and Equation (12) is the probability density function of the error:
where is the ranging error, is the unit step function, is the NLOS judgment critical value taken as , is the radian angle representation of RHA, and according to the interval consideration of forming NLOS, the value range is taken as to . It can be observed in Figure 11b that the SD value of the ranging error is basically stable in the interval from to , and the SD value of the interval is averaged and set as 0.0184 m.
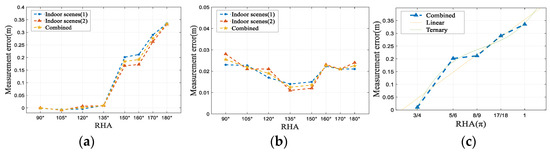
Figure 11.
(a) Error mean distribution (b) Error variance distribution (c) Error fitting function.
5. Positioning Algorithm
The overall design flow of the algorithm is shown in Figure 12. Based on , is predicted, and the LOS and NLOS of each UWB anchor are judged from the LOS/NLOS mapping and the deployment location of the anchor established in Section III-A. For the LOS anchors, we determine whether the LOS anchor is occluded by the human body according to the current predicted tag position and direction, and if it is occluded, then the range value of the LOS anchor is corrected using the human occlusion error model established in Section IV-B. Further, determine whether the LOS anchor is greater than or equal to three if it is satisfied, then exclude the NLOS anchor range value and only use the LOS anchor range value to obtain by particle filtering to solve the target current moment state. If there are fewer than three LOS anchors, the range values of NLOS anchors must be optimized, and the NLOS anchor range values are optimized using the method designed in Section III-D. Then, the optimized NLOS anchor range values are solved together with the LOS anchor range values using the adaptive extended Kalman filter method (AREKF) designed in the literature [38] for the target state to obtain , while the is corrected for IMU. An adaptive robust filtering algorithm (M–EO–AREKF) based on LOS/NLOS mapping and human occlusion error optimization is formed.
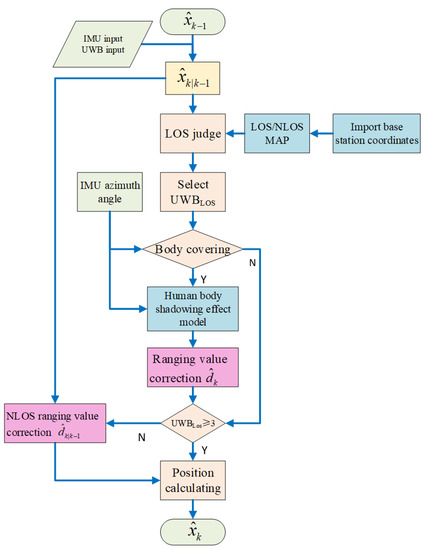
Figure 12.
Flowchart of the algorithm.
6. Experimental Verification and Analysis
6.1. Experimental Scheme
Combined with a complex inner environment, two experiments are designed without human interference and with human interference in this chapter to verify the effect of the algorithm proposed in this paper.
The site in Figure 2 is chosen for the experiment, and four UWB anchors are deployed on the right half of the site, and the locations are shown as A0–A3 in Figure 13a. The height of the tag in the experiment without human interference is adjusted to 1.9 m, which is higher than the human body, as shown in Figure 13b. In the experiment with human interference, the height of the tag is adjusted to 1.4 m, which is located in front of the human chest and kept 0.25 m away from the human body, as shown in Figure 13c. These two experiments follow the same path, which is shown in the red line in Figure 13a, around two pillars, starting at d0 and ending at d7, with a total path length of 25 m. The black square in the figure is a pillar, and it is the presence of the pillar that puts deployed anchors into a serious NLOS effect. The experimental site is highly representative of the typical environmental characteristics of office buildings and subway stations. Figure 14 shows the non-line-of-sight area of anchors from A0–A3. Blue represents the area with only one anchor NLOS, and yellow is the area with two anchors NLOS at the same time. As shown in the figure, the d2–d3 and d3–d4 sections and the area near the end point d7 will be affected by the dual anchor NLOS.
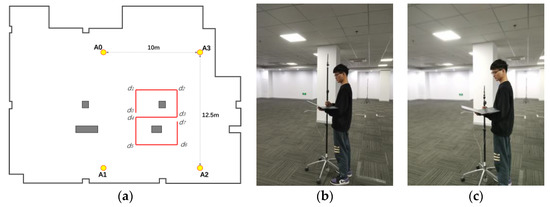
Figure 13.
Experimental design (a) deployment of experimental roadbed and anchors in the experimental environment (b) setting the height of experimental tags in non-human interference scenarios (c) setting the height of experimental tags in human interference scenarios.
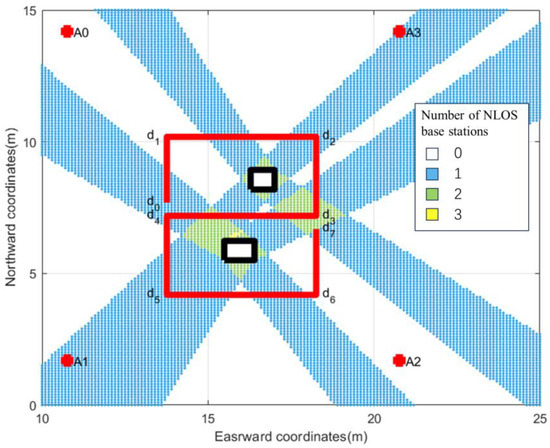
Figure 14.
LOS/NLOS situation of anchors in the experimental area.
6.2. Experimental Results and Analysis
According to the designed experimental site, the ranging values of four anchors are obtained by UWB mobile tags, the system errors are first corrected by using the ranging error correction model in the experiment, and then the results of different positioning algorithms are compared and analyzed. A sampling frequency of 50 Hz is chosen for the experiments. A total of 3407 epochs are acquired in experimental Scenario 1, and 3668 epochs are acquired in experimental Scenario 2. The basic information of the experimental data collection is shown in Table 1.

Table 1.
Basic Information of Experimental Data Collection.
Figure 15 shows the solved results of the tag movement trajectory in experimental Scenario 1, in which the solid red line is the real trajectory of the walk, the black box is the column in the experimental site, and the red dot is the location of the UWB anchor. The blue stars represent the trajectory under EKF, the black circle is the trajectory solved by the adaptive anti-difference filtering algorithm (ARKF) designed in the literature [39], the green star is the trajectory solved by the adaptive extended Kalman filter method (MAP–AREKF) based on the LOS/NLOS map which is proposed in this paper and used in selecting the anchors and the magenta triangle is the trajectory solved by the adaptive extended Kalman filter method (M–EO–AREKF) based on the LOS/NLOS map and NLOS error optimization.
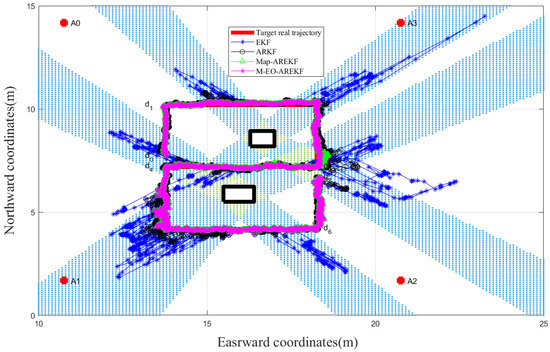
Figure 15.
Experimental solution results of Scenario 1.
It can be intuitively seen in the figure that the EKF works poorly, the ARKF is better than the EKF, the MAP–AREKF is basically close to the real trajectory, and the M–EO–AREKF works best, especially in the area of two anchors, it is closer to the real trajectory than the MAP–AREKF. This also visually proves the effectiveness of the algorithm designed in this paper.
The EKF calculates the trajectory directly using the ranging values of four anchors rather than optimizing the ranging values of the NLOS anchors. Due to NLOS, the solution results will show serious deviations. As can be seen in Figure 15, the EKF deviates severely in the region where NLOS appears, while the positioning result is solved better where all four anchors are LOS. To correct the ranging values that exceed the threshold, the matrix with robust factors is constructed by using single innovation values in the ARKF, which can optimize the ranging error of NLOS and improve the positioning accuracy within a certain range. As evidenced by the figure, the ARKF is better than the EKF, but the effect of optimization is not ideal in a wide range of NLOS, such as d4–d5 and d5–d6 path segments. Ranging values of all anchors are involved in the EKF and ARKF methods; the reason why ARKF is better than the EKF is the NLOS ranging values are optimized; however, optimization just weakens the ranging error rather than eliminating the error thoroughly, so due to the presence of NLOS, the positioning accuracy is degraded in the solution process.
The Map–AREKF method designed in this paper, firstly, uses the anchor LOS/NLOS map to exclude the ranging values of NLOS anchors and only takes LOS anchors into account; therefore, it can be seen from Figure 15 that in the area with only one anchor NLOS, better accuracy can be obtained by using the ranging values of the other three LOS anchors for the solution compared with EKF and ARKF. Figure 16 shows the LOS selection of each anchor based on an LOS/NLOS map, the horizontal axis of the figure means the trajectory of the experimental Scenario 1, and the vertical axis stands for the LOS of the anchors from A0–A3 at the corresponding path. Figure 17 shows the ranging error of the four anchors, the horizontal axis shows the trajectory of experimental Scenario 1, and the vertical axis shows the ranging error values of the epoch of the four anchors A0–A3 at the corresponding motion trajectory. Ranging values deviated seriously affected by NLOS of spatial structure, especially A1 anchor appears a ranging error of ten meters near the point d2. The Figure 16 and Figure 17 are combined in Figure 18 to compare and analyze each ranging error of four anchors A0–A3 with the LOS of selection cases. The horizontal axis of the figure shows the trajectory of experimental Scenario 1, the red star indicates the ranging error of this anchor, which corresponds to the scale of the left vertical axis, and the blue star indicates the LOS/NLOS selection of the algorithm for this anchor, which corresponds to the classification of the right vertical axis. It is obvious from the figure that the LOS/NLOS of anchors is selected well based on the anchor LOS/NLOS map, determining the ranging information of anchors as NLOS when the ranging deviation occurs. The solution of positioning accuracy is proved by eliminating the ranging errors of NLOS anchors.
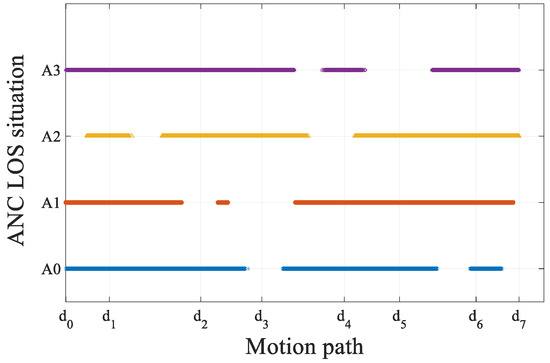
Figure 16.
LOS selection of each anchor under the trajectory of experimental Scenario 1.
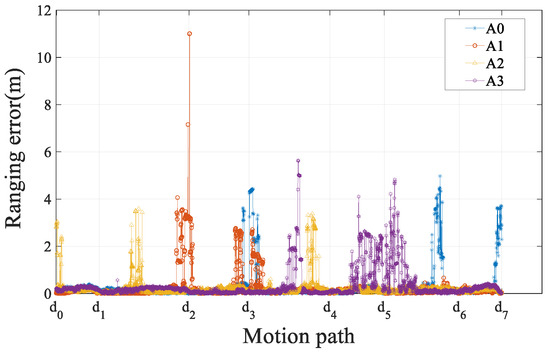
Figure 17.
The ranging error of each anchor in the experimental Scenario 1.
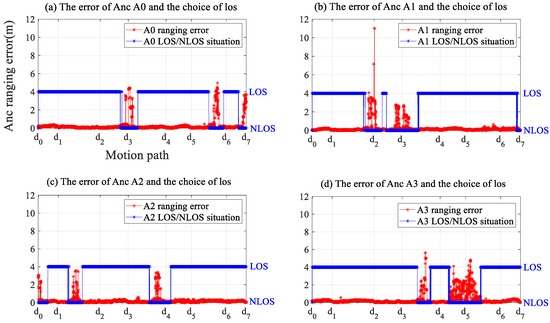
Figure 18.
Comparison of each anchor LOS selection and ranging error under the trajectory of experimental Scenario 1.
The M–EO–AREKF method designed in this paper is an optimization function for the ranging values of NLOS anchor added to the MAP–AREKF algorithm, and the algorithm flow is described in Section 5. From Figure 15, M–EO–AREKF solves the trajectory better than MAP–AREKF, which is closer to the real value. The trajectory absolute error between the trajectory solved by the four positioning algorithms and the real trajectory is shown in Figure 19, the error of the M–EO–AREKF algorithm designed in this paper is significantly less than that of EKF and ARKF, which shows the effectiveness of picking LOS anchor algorithm, and the M–EO–AREKF algorithm outperforms the MAP–AREKF without satisfying the three-anchor LOS solution conditions. It also indicates that the positioning performance improvement in the ARKF is limited since it is not good at eliminating ranging errors caused by the spatial structure. By combining Figure 17 and Figure 19, it can be seen that when the anchor experiences severe deviation due to NLOS influence, the positioning results of EKF and ARKE at the corresponding time are also the worst.
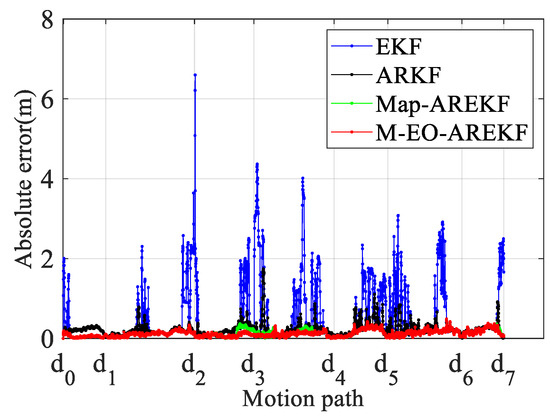
Figure 19.
Absolute trajectory error of the algorithm in the experimental Scenario 1.
The error probability statistics of the four positioning algorithms are shown in Figure 20. 82% of the positioning error of the EKF algorithm is within 1 m, and 90% is within 1.65 m; 90% of the positioning error of the ARKF algorithm is within 0.325 m; 90% of the positioning error of the MAP–AREKF algorithm designed in this paper is within 0.25 m. The M–EO–AREKF algorithm designed in this paper delivers 90% of the positioning error within 0.23 m, which is slightly better than MAP–AREKF due to the fact the scenario of simultaneous two anchor NLOS accounts for less of the entire experiment.
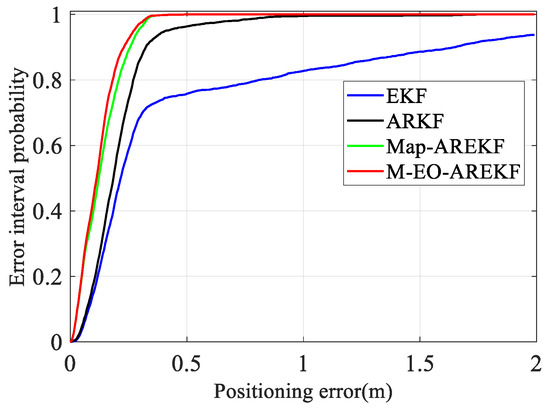
Figure 20.
Probability statistics of positioning error of the algorithm in experimental Scenario 1.
The tags were disturbed by the human body during the motion in Scenario 2. The ranging errors of the four anchors are shown in Figure 21, and, especially in the case of line-of-sight, the ranging errors are more serious than Scenario 1. Furthermore, the difference between NLOS errors generated by the spatial column occlusion in the two experiments is large, meaning NLOS is generated in the environment with certain randomness. Thus, eliminating NLOS errors with error models will not achieve satisfactory results. Figure 22 presents a comparative analysis of the ranging error, M–EO–AREKF algorithm-corrected ranging error of the four anchors from A0-A3, and LOS selection. The horizontal axis in the figure indicates the motion trajectory segment of the experimental Scenario 2, the green triangle indicates the ranging error value of this anchor, and the red star indicates the ranging error after algorithm optimization, corresponding to the scale of the left vertical axis, and the blue star indicates the LOS/NLOS selection of the algorithm for this anchor, responding to the classification of the right vertical axis. Taking the A0 anchor as an example, in the d1–d2, d2–d3, d4–d5, and d5–d6 segment paths, the anchor will be affected by human occlusion with the analysis of the experimental scenario. To address this problem, the algorithm designed in this paper can first accurately determine the road sections affected by human occlusion and then optimize the ranging error according to the relative angle. As observed in Figure 22a, the error of these paths before optimization is larger compared with that of Scenario 1, Figure 18a, while the error results after optimization are significantly better than before optimization, which also proves the effectiveness of the designed error compensation and algorithm. In addition, as shown in Figure 18 of Experimental Scenario 1, the positioning accuracy of the solution is ensured because the method based on the LOS/NLOS map of the anchor is also well selected for the LOS/NLOS of the anchor.
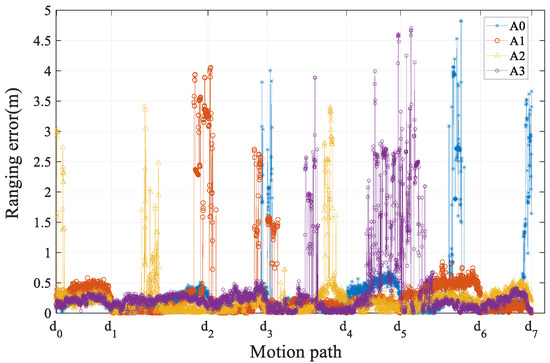
Figure 21.
The ranging error of each anchor in the experimental Scenario 2.
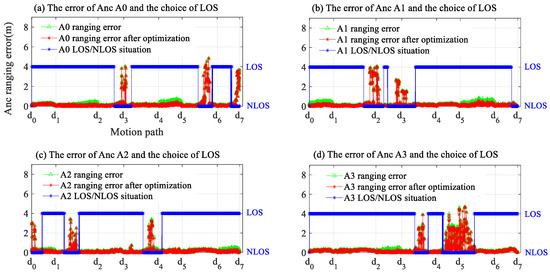
Figure 22.
Comparison of each anchor LOS selection and ranging error under the trajectory of experimental Scenario 2.
Figure 23 shows the solved results of the tag movement trajectory in Scenario 2, where the red solid line is the real trajectory of walking, the blue star is the trajectory solved by the EKF algorithm, the black circle is the trajectory solved by the ARKF algorithm, the green star is the trajectory solved by the MAP–AREKF algorithm, and the magenta triangle is the trajectory solved by the M–EO–AREKF algorithm designed in this paper. In this experimental scenario, the ranging value appears to have serious forward deviation due to the influence of two different characteristics of the spatial structure and the human body. The solved result in the EKF is worst for no optimization to ranging values. By comparison, the ARKF effect is better than the EKF because the ARKF can attenuate the effect of NLOS error by anti-difference, yet the optimization effect is general when facing such a large and long NLOS effect of spatial structure. Though the MAP–AREKF result is close to the real trajectory, the accuracy is not good as in the experimental Scenario 1 in that the MAP–AREKF algorithm does not take the ranging errors caused by human occlusion into account. In contrast, M–EO–AREKF works best since the algorithm optimizes the anchor ranging values via the anchor of the LOS/NLOS map and optimizes the NLOS errors when the solution conditions are not satisfied, correcting the ranging values affected by the spatial structure and human occlusion.
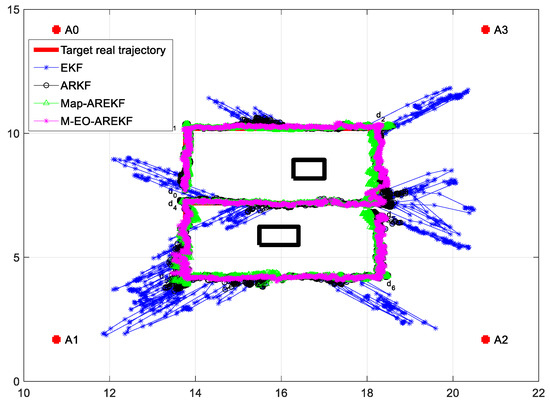
Figure 23.
Experimental solution results of Scenario 2.
The absolute errors of the trajectory of the four algorithms in Scenario 2 are displayed in Figure 24, and Figure 25 shows the probability statistics of the algorithm positioning errors. 90% of the positioning error of the EKF algorithm is less than 1.63 m; 90% of the positioning error of the ARKF algorithm is less than 0.47 m; 90% of the positioning error of the MAP–AREKF algorithm is within 0.45 m; 90% of the positioning error of the M–EO–AREKF algorithm designed in this paper is below 0.28 m.
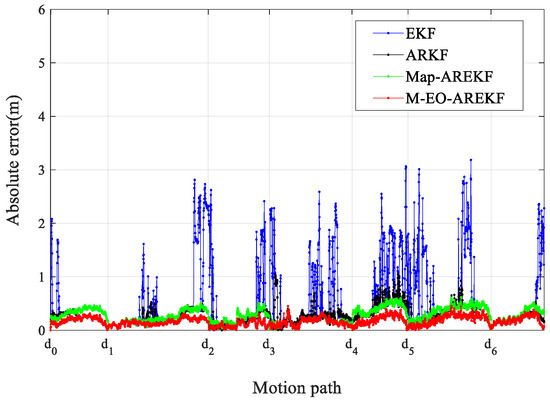
Figure 24.
Absolute trajectory error of the algorithm in Scenario 2.
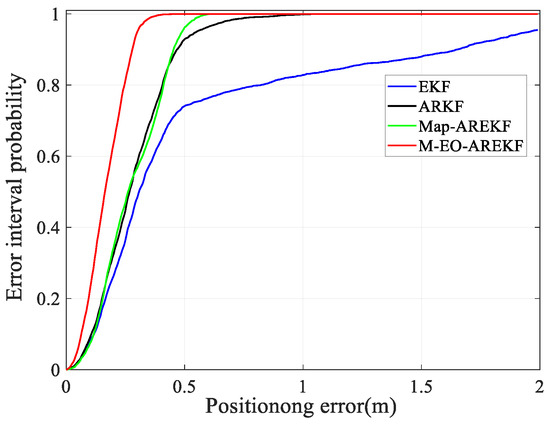
Figure 25.
Probability statistics of positioning error of the algorithm in Scenario 2.
The error statistics and histograms of the two experimental scenarios are shown in Table 2 and Figure 26, and combined with the graphs, in either scenario, the M–EO–AREKF algorithm designed in this paper is significantly superior to the EKF and ARKF algorithms. According to statistics, the positioning accuracy of the M–EO–AREKF algorithm is improved by 84% and 46% compared with EKF and ARKF algorithms, respectively, when just influenced by NLOS of spatial structure. In the complex indoor environment affected by two different NLOS of indoor spatial structure and human occlusion, the M–EO–AREKF algorithm achieves higher positioning accuracy than the EKF, ARKF, and Map–AREKF algorithms, with improvements of 76.8%, 40.6%, and 12.5%, respectively.
Table 2.
RMSE statistics for Scenario 1 and Scenario 2.
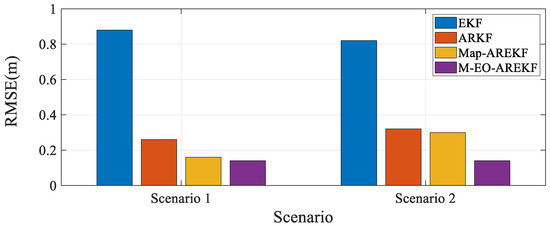
Figure 26.
RMSE histogram for Scenario 1 and Scenario 2.
Table 3 presents the computational time statistics of the algorithm for a single epoch. In terms of efficiency, Map–AREKF and M–EO–AREKF are not as effective as EKF and REKF. This is because Map–AREKF and M–EO–AREKF incorporate information map matching during their execution, particularly in the case of M–EO–AREKF, where the assessment and optimization of ranging values for NLOS base stations and LOS base stations obstructed by pedestrians are involved. These processes increase the computational time. The average time for a single computation using the M–EO–AREKF algorithm is 2.59 × 10⁻⁴, which is still significantly lower than the sampling time of 0.02 s for a single epoch in the experiment. While it may not achieve the real-time performance of EKF, it does not compromise the real-time positioning of pedestrians and other non-high-speed movements.
Table 3.
The average value of the single epoch calculation time of the four experimental algorithms (s).
Based on the analysis of the experimental results, the following conclusions can be drawn:
- The indoor spatial structure has a significant impact on the range, and if the NLOS error is not eliminated, serious positional deviations will occur when the ranging values with serious errors are brought into the algorithm for solving. The EKF algorithm directly uses the ranging values of the four UWB anchors for positioning without optimizing the NLOS ranging values. Due to the impact of NLOS, the positioning results have significant bias. This is also the reason why the EKF algorithm performs the worst in complex indoor scenarios.
- The ARKF algorithm can correct the short-term fluctuation of ranging errors to a certain extent and performs well in handling NLOS caused by random pedestrian occlusion. However, when facing large-scale NLOS caused by the indoor spatial structure and self-occlusion errors caused by the human body, the correction effect of the ARKF algorithm is moderate.
- Algorithms based on anchor LOS/NLOS map information can quickly and accurately identify the LOS/NLOS status of each anchor based on the indoor spatial structure. This method is a prerequisite for correcting the ranging values of NLOS anchors.
- The Map–AREKF algorithm uses a spatial NLOS error optimization method to effectively solve the NLOS error caused by indoor spatial structures. However, it cannot effectively correct ranging errors caused by pedestrian self-occlusion.
- In addition to the advantages of the Map–AREKF algorithm, the M–EO–AREKF algorithm proposed in this paper utilizes a human occlusion error correction model to effectively optimize the error caused by pedestrian self-occlusion. Experimental results demonstrate that this algorithm can achieve effective, reliable, and continuous high-precision pedestrian localization.
7. Conclusions
The development of indoor high-precision positioning has been limited by the ranging errors caused by the complex indoor environment, and pedestrian navigation positioning is also affected by the obstruction of the human body. Therefore, reasonably avoiding and eliminating the influence of environmental NLOS is an effective means to improve positioning accuracy. This paper firstly analyzes the NLOS error of UWB ranging in the real environment of indoor positioning, divides the NLOS into NLOS with fixed influence area due to indoor spatial structure occlusion and NLOS with dynamic change of pedestrian trajectory due to human occlusion, and proposes a targeted solution. For the spatial structure NLOS, this paper first establishes the LOS/NLOS information mapping of anchors based on the invariance of indoor spatial structure combined with the location of anchor placement, makes full use of the a priori information of spatial structure, and realizes the accurate differentiation between LOS and NLOS anchors at any location in space, and then design a method to optimize the NLOS range value by using the recursive location point of the low-cost IMU that comes with the device. For the NLOS that varies by human occlusion, we establish a pedestrian occlusion UWB ranging error correction model based on the relationship between the relative positions of the human body, anchor, tag, and ranging error. Based on this, we designed the M–EO–AREKF algorithm and verified through experiments that the algorithm can effectively suppress two different NLOS errors of spatial structure and human occlusion and realize the effective, reliable, and continuous high-precision positioning function in an indoor complex environment, and the positioning accuracy is improved by 76.8% and 40.6% compared with EKF and ARKF algorithms, respectively.
During the research and experiment process of this paper, we also found that the optimization deployment strategies and evaluation criteria for indoor UWB anchors in complex environments are not yet well-established. Therefore, in future work, we will conduct research on optimization deployment algorithms for anchors, combining position dilution of precision (PDOP) with UWB NLOS ranging error as a constraint, further improving the indoor UWB anchors optimization deployment plan, and achieving a more reliable indoor positioning system.
Author Contributions
Conceptualization, H.Z. and Q.W.; methodology, H.Z. and Z.L.; software, H.Z. and J.M.; validation, H.Z., Q.W., Z.L., J.M. and K.Z.; formal analysis, H.Z., J.M. and K.Z.; investigation, H.Z. and K.Z.; resources, H.Z. and Q.W.; data curation, H.Z.; writing—original draft preparation, H.Z., Q.W., Z.L., J.M. and K.Z.; writing—review and editing, H.Z.; visualization, H.Z.; supervision, Q.W.; project administration, Q.W.; funding acquisition, Q.W. All authors have read and agreed to the published version of the manuscript.
Funding
This research was funded by the National Natural Science Foundation of China (grant number 42074039).
Data Availability Statement
Not applicable.
Conflicts of Interest
The authors declare no conflict of interest.
References
- Guo, X.; Ansari, N.; Hu, F.; Shao, Y.; Elikplim, N.R.; Li, L. A survey on fusion-based indoor positioning. IEEE Commun. Surv. Tutor. 2019, 22, 566–594. [Google Scholar]
- Wang, D.; Lu, Y.; Zhang, L.; Jiang, G. Intelligent positioning for a commercial mobile platform in seamless indoor/outdoor scenes based on multi-sensor fusion. Sensors 2019, 19, 1696. [Google Scholar] [CrossRef]
- Feng, D.; Wang, C.; He, C.; Zhuang, Y.; Xia, X.-G. Kalman-filter-based integration of IMU and UWB for high-accuracy indoor positioning and navigation. IEEE Internet Things J. 2020, 7, 3133–3146. [Google Scholar] [CrossRef]
- Goldstein. Global Indoor Positioning and Indoor Navigation (IPIN) Market Outlook, 2024. 2019. Available online: https://www.goldsteinresearch.com/report/global-indoor-positioning-and-indoor-navigation-ipin-market-outlook-2024-global-opportunity-and-demand-analysis-market-forecast-2016-2024 (accessed on 28 April 2020).
- Chen, R.; Chen, L. Smartphone-based indoor positioning technologies. In Urban Informatics; Springer: Berlin/Heidelberg, Germany, 2021; pp. 467–490. [Google Scholar]
- Li, Z.; Wang, R.; Gao, J.; Wang, J. An approach to improve the positioning performance of GPS/INS/UWB integrated system with two-step filter. Remote Sens. 2017, 10, 19. [Google Scholar] [CrossRef]
- Liu, F.; Wang, J.; Zhang, J.; Han, H. An indoor localization method for pedestrians base on combined UWB/PDR/Floor map. Sensors 2019, 19, 2578. [Google Scholar] [CrossRef]
- Mur-Artal, R.; Tardós, J.D. Orb-slam2: An open-source slam system for monocular, stereo, and rgb-d cameras. IEEE Trans. Robot. 2017, 33, 1255–1262. [Google Scholar] [CrossRef]
- Tian, Q.; Kevin, I.; Wang, K.; Salcic, Z. A low-cost INS and UWB fusion pedestrian tracking system. IEEE Sens. J. 2019, 19, 3733–3740. [Google Scholar] [CrossRef]
- Ruiz, A.R.J.; Granja, F.S. Comparing ubisense, bespoon, and decawave uwb location systems: Indoor performance analysis. IEEE Trans. Instrum. Meas. 2017, 66, 2106–2117. [Google Scholar] [CrossRef]
- Chen, Y.-Y.; Huang, S.-P.; Wu, T.-W.; Tsai, W.-T.; Liou, C.-Y.; Mao, S.-G. UWB system for indoor positioning and tracking with arbitrary target orientation, optimal anchor location, and adaptive NLOS mitigation. IEEE Trans. Veh. Technol. 2020, 69, 9304–9314. [Google Scholar] [CrossRef]
- Djaja-Josko, V.; Kolakowski, M. A new map based method for NLOS mitigation in the UWB indoor localization system. In Proceedings of the 2017 25th Telecommunication Forum (TELFOR), Belgrade, Serbia, 21–22 November 2017; pp. 1–4. [Google Scholar]
- Ferreira, A.G.; Fernandes, D.; Catarino, A.P.; Monteiro, J.L. Performance analysis of ToA-based positioning algorithms for static and dynamic targets with low ranging measurements. Sensors 2017, 17, 1915. [Google Scholar] [CrossRef]
- García, E.; Poudereux, P.; Hernández, Á.; Ureña, J.; Gualda, D. Arobust uwb indoor positioning system for highly complex environments. In Proceedings of the 2015 IEEE International Conference on Industrial Technology (ICIT), Seville, Spain, 17–19 March 2015; pp. 3386–3391. [Google Scholar]
- Yang, X. NLOS mitigation for UWB localization based on sparse pseudo-input Gaussian process. IEEE Sens. J. 2018, 18, 4311–4316. [Google Scholar] [CrossRef]
- Haigh, S.; Kulon, J.; Partlow, A.; Rogers, P.; Gibson, C. A Robust Algorithm for Classification and Rejection of NLOS Signals in Narrowband Ultrasonic Localization Systems. IEEE Trans. Instrum. Meas. 2018, 68, 646–655. [Google Scholar]
- Kristensen, J.B.; Ginard, M.M.; Jensen, O.K.; Shen, M. Non-Line-of-Sight Identification for UWB Indoor Positioning Systems using Support Vector Machines. In Proceedings of the 2019 IEEE MTT-S International Wireless Symposium (IWS), Guangzhou, China, 19–22 May 2019; pp. 1–3. [Google Scholar]
- Alsindi, N.A.; Alavi, B.; Pahlavan, K. Measurement and Modeling of Ultrawideband TOA-Based Ranging in Indoor Multipath Environments. IEEE Trans. Veh. Technol. 2008, 58, 1046–1058. [Google Scholar] [CrossRef]
- Park, J.; Nam, S.; Choi, H.; Ko, Y.; Ko, Y.-B. Improving deep learning-based UWB LOS/NLOS identification with transfer learning: An empirical approach. Electronics 2020, 9, 1714. [Google Scholar] [CrossRef]
- Cao, B.; Wang, S.; Ge, S.; Ma, X.; Liu, W. A Novel Mobile Target Localization Approach for Complicate Underground Environment in Mixed LOS/NLOS Scenarios. IEEE Access 2020, 8, 96347–96362. [Google Scholar] [CrossRef]
- Li, X.; Wang, Y.; Khoshelham, K. A Robust and Adaptive Complementary Kalman Filter Based on Mahalanobis Distance for Ultra-Wideband/Inertial Measurement Unit Fusion Positioning. Sensors 2018, 18, 3435. [Google Scholar] [CrossRef]
- Meghani, S.K.; Asif, M.; Awin, F.; Tepe, K. Empirical based ranging error mitigation in IR-UWB: A fuzzy approach. IEEE Access 2019, 7, 33686–33697. [Google Scholar] [CrossRef]
- Fan, Q.; Sun, B.; Sun, Y.; Zhuang, X. Performance Enhancement of MEMS-Based INS/UWB Integration for Indoor Navigation Applications. IEEE Sens. J. 2017, 17, 3116–3130. [Google Scholar] [CrossRef]
- Liu, F.; Li, X.; Wang, J.; Zhang, J. An Adaptive UWB/MEMS-IMU Complementary Kalman Filter for Indoor Location in NLOS Environment. Remote Sens. 2019, 11, 2628. [Google Scholar] [CrossRef]
- Geiger, B. Ranging in the IEEE 802.15. 4a standard using energy detectors. In Proceedings of the IEEE EUROCON 2009, St. Petersburg, Russia, 18–23 May 2009; pp. 1956–1963. [Google Scholar]
- Yu, C.; Lan, H.; Liu, Z.; El-Sheimy, N.; Yu, F. Indoor map aiding/map matching smartphone navigation using auxiliary particle filter. In China Satellite Navigation Conference (CSNC) 2016 Proceedings: Volume I; Springer: Berlin/Heidelberg, Germany, 2016; pp. 321–331. [Google Scholar]
- Zhu, X.; Yi, J.; Cheng, J.; He, L. Adapted error map based mobile robot UWB indoor positioning. IEEE Trans. Instrum. Meas. 2020, 69, 6336–6350. [Google Scholar] [CrossRef]
- Wang, C.; Xu, A.; Kuang, J.; Sui, X.; Hao, Y.; Niu, X. A high-accuracy indoor localization system and applications based on tightly coupled UWB/INS/Floor map integration. IEEE Sens. J. 2021, 21, 18166–18177. [Google Scholar] [CrossRef]
- Lou, P.; Zhao, Q.; Zhang, X.; Li, D.; Hu, J. Indoor Positioning System with UWB Based on a Digital Twin. Sensors 2022, 22, 5936. [Google Scholar] [CrossRef]
- Kili, Y.; Ali, A.J.; Meijerink, A.; Bentum, M.J.; Scanlon, W.G. The effect of human-body shadowing on indoor UWB TOA-based ranging systems. In Proceedings of the 2012 9th Workshop on Positioning, Navigation and Communication, Dresden, Germany, 15–16 March 2012; pp. 126–130. [Google Scholar]
- Geng, Y.; Wan, Y.; He, J.; Pahlavan, K. An Empirical Channel Model for the Effect of Human Body on Ray Tracing. In Proceedings of the 2013 IEEE 24th Annual International Symposium on Personal, Indoor, and Mobile Radio Communications (PIMRC), London, UK, 8–11 September 2013; pp. 47–52. [Google Scholar]
- Geng, Y.; He, J.; Deng, H.; Pahlavan, K. Modeling the effect of human body on TOA ranging for indoor human tracking with wrist mounted sensor. In Proceedings of the 2013 16th International Symposium on Wireless Personal Multimedia Communications (WPMC), Atlantic City, NJ, USA, 24–27 June 2013; pp. 1–6. [Google Scholar]
- Otim, T.; Bahillo, A.; Díez, L.E.; Lopez-Iturri, P.; Falcone, F. FDTD and Empirical Exploration of Human Body and UWB Radiation Interaction on TOF Ranging. IEEE Antennas Wirel. Propag. Lett. 2019, 18, 1119–1123. [Google Scholar] [CrossRef]
- Otim, T.; Bahillo, A.; Díez, L.E.; Lopez-Iturri, P.; Falcone, F. Impact of Body Wearable Sensor Positions on UWB Ranging. IEEE Sens. J. 2019, 19, 11449–11457. [Google Scholar] [CrossRef]
- Otim, T.; Bahillo, A.; Díez, L.E.; Lopez-Iturri, P.; Falcone, F. Towards Sub-Meter Level UWB Indoor Localization Using Body Wearable Sensors. IEEE Access 2020, 8, 178886–178899. [Google Scholar]
- Yang, X.; Wang, J.; Song, D.; Feng, B.; Ye, H. A Novel NLOS Error Compensation Method Based IMU for UWB Indoor Positioning System. IEEE Sens. J. 2021, 21, 11203–11212. [Google Scholar]
- Tian, Q.; Kevin, I.; Wang, K.; Salcic, Z. Human body shadowing effect on UWB-based ranging system for pedestrian tracking. IEEE Trans. Instrum. Meas. 2018, 68, 4028–4037. [Google Scholar] [CrossRef]
- Zhang, H.; Wang, Q.; Yan, C.; Xu, J.; Zhang, B. Research on UWB Indoor Positioning Algorithm under the Influence of Human Occlusion and Spatial NLOS. Remote Sens. 2022, 14, 6338. [Google Scholar] [CrossRef]
- Han, H.; Wang, J.; Liu, F.; Zhang, J.; Yang, D.; Li, B. An Emergency Seamless Positioning Technique Based on ad hoc UWB Networking Using Robust EKF. Sensors 2019, 19, 3135. [Google Scholar] [CrossRef]


Disclaimer/Publisher’s Note: The statements, opinions and data contained in all publications are solely those of the individual author(s) and contributor(s) and not of MDPI and/or the editor(s). MDPI and/or the editor(s) disclaim responsibility for any injury to people or property resulting from any ideas, methods, instructions or products referred to in the content. |
© 2023 by the authors. Licensee MDPI, Basel, Switzerland. This article is an open access article distributed under the terms and conditions of the Creative Commons Attribution (CC BY) license (https://creativecommons.org/licenses/by/4.0/).