Article

Investigation of the Vertical Distribution Characteristics and Microphysical Properties of Summer Mineral Dust Masses over the Taklimakan Desert Using an Unmanned Aerial Vehicle

1
Key Laboratory for Semi-Arid Climate Change of the Ministry of Education, College of Atmospheric Sciences, Lanzhou University, Lanzhou 730000, China
2
Institute of Desert Meteorology, China Meteorological Administration, Urumqi 830002, China
*
Author to whom correspondence should be addressed.
Remote Sens. 2023, 15(14), 3556; https://doi.org/10.3390/rs15143556
Submission received: 29 May 2023 / Revised: 24 June 2023 / Accepted: 11 July 2023 / Published: 15 July 2023

Abstract

:
Investigating the vertical distribution of mineral dust masses and their microphysical properties is crucial for accurately assessing the climate effects of dust. However, there are limited studies related to relevant in situ observations over dust source areas. In this study, the near-surface vertical characteristics (within 500 m a.g.l) of dust mass concentrations in five size fractions (PMs: TSP, PM10, PM4, PM2.5, and PM1) were investigated using an unmanned aerial vehicle (UAV) in Tazhong (TZ) in the Taklimakan Desert (TD) in July 2021. To the best of our knowledge, the vertical profiles of particle number concentration (PNC), effective radius (Reff), and volume concentration (Cv) were obtained for the first time by UAV over the TD. Four scenarios of clear sky, floating dust, blowing sand, and dust storm were selected based on the classification criteria for PMs. The PMs, PNC, Reff, and Cv decreased with height for all scenarios. From clear-sky to dust-storm scenarios PMs, PNC, Reff, and Cv in the column gradually increased. Reff (Cv) increased from 1.15 μm (0.08 μm3/μm2) to 4.53 μm (0.74 μm3/μm2). The diurnal variations of PMs, PNC, and Reff (Cv) revealed a unimodal pattern, with the peak occurring between 13:00 and 16:00, due to the evolution of wind speed and the atmospheric boundary layer in TZ. Unexpectedly, among the three postprecipitation scenarios (P1, P2, and P3), the PNC of P2 was smaller than those of P1 and P3. The Reff (Cv) for P2 was similar to or greater than that for dust storms, which may be associated with moist dust particles on the ground surface being carried into the air by wind. These investigations add to our understanding of the mineral dust vertical characteristics over the source area, and provide a meaningful reference for colocated lidar inversion and dust simulations.

1. Introduction

Mineral dust is a major aerosol type in the Earth’s system and plays an important role in global climate, human health, and air quality. Dust particles regulate the radiation energy redistribution in the atmosphere by directly scattering and absorbing solar short- or terrestrial long-wave radiation [1,2]. However, the large temporal variability and characterization of the spatial distributions, aerosol mixtures, and absorptive properties make it difficult to evaluate aerosol direct radiative forcing [3]. Dust aerosols are one of the most common types of ice nuclei (IN) and can modify cloud macrophysical and microphysical properties in different ways [4]. As a result, cloud radiative properties and precipitation processes can be modulated by aerosol–cloud interactions [5]. Dust aerosols can also accelerate snow melting by altering the surface albedo of the snow and ice sheets [6,7,8]. From a public health perspective, mineral dust can transport pathogens and anthropogenic pollutants that trigger a variety of respiratory and cardiovascular diseases, as well as additional systemic pathologies [9,10].
Mineral dust’s vertical characteristics are essential to accurately evaluate its climate forcing and transboundary transportation to downstream areas [11,12,13]. Aerosol–radiation interactions mainly depend on dust particle size, aerosol vertical distribution, total optical depth, aerosol refractive index, temperature vertical profiles, and surface albedo. Among these parameters, dust vertical distribution is currently poorly characterized, resulting in large uncertainties when improving and validating models related to dust emission and transport, ultimately hindering effective evaluation of the impact of dust on climate processes [14,15]. In addition to its direct radiative effect, the indirect effect mainly depends on the particle number concentration (PNC) [16,17] and the relative vertical location of the cloud and aerosol layers [18,19]. In particular, a better characterization of the vertical distribution over dust source areas is required [15]. However, the existing models can effectively reproduce the onset and decline times of the dust process. The differences in the maximum near-surface dust concentrations, reflected by different models, are very extreme when they fail to accurately simulate the vertical distribution [20,21]. Desert areas are sparsely populated, making it difficult to obtain continuous vertical observations. This means that adequate constraints cannot be provided for the model simulations [22,23,24]. Thus, it is essential to better characterize the vertical distribution of dust aerosols in the atmosphere.
Usually, the dust vertical distribution is investigated using tethered balloons, meteorological towers, active remote sensing, and aircraft. Tethered balloons can carry a variety of instruments and are capable of reaching heights of 100–2000 m, with high resolution and lengthy duration [25]. However, it is more difficult to obtain continuous vertical profiles of atmospheric particles because of the low horizontal maneuverability of tethered balloons, the need for strong financial support, complex technical requirements, and balloon release frequency being limited by weather conditions [26,27]. Meteorological towers have long been used because of their high load capacity and stability; however, they are characterized by low vertical resolution, poor monitoring height, and low flexibility [27,28,29]. A space-based lidar (e.g., CALIOP) can capture the vertical structure of clouds and aerosols on a global scale. However, the spatiotemporal resolution is limited for a fixed location [30]. While ground-based lidar measurements range from hundreds of meters to tens of kilometers, providing information on particle distribution throughout the atmosphere, high spatiotemporal resolution, and high-precision extinction coefficient profiles, they are more restrictive when attempting to provide vertical resolution of aerosol microphysical properties [30,31,32]. Aircraft observations can overcome some of the shortcomings of the above methods by providing the microphysical, scattering, and absorption properties of aerosols in addition to the vertical distribution of these parameters. For example, [33] used aircraft and tethered balloons to investigate the vertical structure of the aerosol size distribution showing particles characterized by a large size within a dust plume during the Charmex campaign in 2013. However, aircraft require an airport to initiate frequent deployment of exhaust engines, which requires us to consider the limitations of the site [34,35,36,37,38]. Currently, the unique advantages attributed to unmanned aerial vehicles (UAVs), namely, having strong mobility and stability, and being exhaust-free, low-risk, and cost-effective, help detect lower tropospheric atmospheres and are considered one of the most suitable platforms for observing the vertical distribution of aerosols and measuring their physical and optical properties. UAV observations can be nicely coordinated with other observations, such as vertical data observed in the lower atmosphere, which can provide excellent constraints for the algorithm of lidar inversion of the microphysical properties of aerosols [39].
The Taklimakan Desert (TD), which is the largest dust source in the East Asian region, is located in the Tarim Basin of China and is surrounded by the Tianshan Mountains, Pamir Plateau, and Kunlun Mountains, which range over 5000 m above sea level. So far, there are only a few studies that have been conducted on the vertical distribution of dust over the TD. Ref [40] seeks to analyze the characteristics of the horizontal wind field and vertical velocity of a breaking dust weather in a desert hinterland and calculate the radar echo intensity and vertical distribution of a dust storm, blowing sand, and floating dust weather. Observational analysis of dust storm samples collected at seven vertical heights from an 80m high-throughput tower in the TD hinterland analyzed the vertical distribution of dust storm particle sizes and horizontal dust storm sediment fluxes near the surface [28]. Ref [41] explored the vertical distribution of dust with different particle size over the TD based on UAV observations, environmental particulate matter analyzer, and radiosonde. These previous studies provided us the preliminary insight on dust vertical distribution, but the information on the key microphysical parameters of the aerosol particles (e.g., effective radius (Reff) and volume concentration (Cv)) in the vertical distributions is still extremely scarce under harsh experimental conditions. Moreover, the dust particles can be transported from Tarim Basin to Tibet Plateau in summer [42], while the understanding on the correlation between the temporal–spatial evolution of the dust layer in the Tarim Basin and the dust transported to the Tibetan Plateau is still poor, and the exploration of this issue requires sufficient observation on mineral dust vertical distribution over this area.
In order to understand the vertical distribution of mineral dust in the Tarim Basin and its relationship with dust transported to the Tibetan Plateau, an intensive field campaign was carried out in Tazhong (TZ) in July 2021. This study is the first part of our work frame and mainly clarifies the vertical distribution of near-surface mineral dust mass and microphysical properties with UAV observation. The remainder of this study is organized as follows. Section 2 introduces the experimental station, instrument information, and retrieval methods; Section 3 and Section 4 present the results and discussion, respectively; and Section 5 concludes the study.

2. Materials and Methods

2.1. Field Campaign

As shown in Figure 1a, the TD, located in the Xinjiang Province, China, is a typical arid zone. TZ (39 00′N, 83 63′E, 1140 m) is located in the hinterland of the TD, where dust activity is frequent and intense, and flowing sand dunes account for more than 80%. The temperature varies greatly, with a maximum temperature of 44.2 °C and a minimum temperature of 18.6 °C during our observation period. Precipitation in TZ is extremely scarce, with an average annual precipitation of 26 mm in recent years, which is 37.3% lower than the average precipitation in surrounding regions [43]. Our intensive field experiment was conducted in TZ during July 2021. The experimental location was selected near a desert road at a distance of approximately 50 m, surrounded by several restaurants. Sand dunes (height of 30–150 m) surrounded the observation location from which the UAV was operated (Figure 1b). TZ is primarily crossed by winds traveling from the northeast, east, and north in July, with a 14.9% frequency of easterly winds and an average wind speed of 2.09 m/s near the surface (Figure 1c).

2.2. UAV

An eight-rotor UAV was manually operated on a concrete surface during the period of 9–31 July 2021. The maximum load of the UAV was approximately 7.3 kg, and the duration of the sustained flight time was 39.5 min (without a load). In our observations, the portable instruments equipped on the UAV included a microAeth (model: MA200), a personal ozone monitor (POM_ 2 B), a dust monitor spectrometer (model: Grimm11_D), and a temperature/humidity/pressure logger. To validate the data, all instruments were calibrated to a uniform time and sampled 10–15 min in advance to allow the instruments to warm up before each flight. Once the UAV reached 10 m in height, it was switched to a 1.2–1.5 m/s steady ascent and descent to achieve an optimized vertical resolution. As a result, a typical flight required approximately 13 min. A total of 200 flights were successfully conducted every 3 h at 10:00 (local morning), 13:00, 16:00 (noon), 19:00 (afternoon), and 22:00 (evening) (Beijing Time) to capture diurnal variations. To reduce the disturbance of dust from the surface due to the rotation of the paddles during takeoff and landing, data were only used after an ascent of 10 m above the ground in this study. Observations of the portable instrument at the fixed sites of Lanzhou University and TZ were conducted concurrently before the start of the experiment, and the observations of the portable instrument were in excellent agreement.

2.3. Dust Monitor Spectrometer

The dust monitoring spectrometer model Grimm11_D (Grimm Aerosol Technik (Ainring, Germany), hereinafter: 11D) was used to determine the particle number size distribution (PNSD), which subsequently displayed output related to nine dust mass fractions: total suspended particles (TSP), PM10, PM4, PM2.5, PM1, PMCoarse, inhalable, thoracic, respirable, as well as the PNC distribution in 31 channels ranging from 0.253 to 35.15 μm. The instrument works on the principle of scattered light measurement pertaining to individual particles and utilizes a polytetrafluoroethylene (PTFE: a plastic made of fluorine and carbon, also known as Teflon) filter for gravimetric validation of the calculated dust mass. The time resolution of 11D sampling time resolution can be varied between 6 or more (31 channels) and 1 s (only 16 channels). A time resolution of six seconds was selected for this experiment. The volume flow rate was set to 1.2 L/min.
In this study, the dust mass fractions were calculated based on the PNSD measured using 11D. The data from each observation were smoothed to remove outliers. The PNC summed the particle concentrations of the 31 channels for each observation. The 15 μm radius is the Reff for the largest particle size considered in the inversion of AERONET optical data into a particle volume size distribution [44,45]. Furthermore, the microphysics parameters (particle volume size distribution ( d V ( r ) / d l n r ), particle Reff, and Cv) were calculated using Equations (1)–(3) based on PNSD ( d N ( r ) / d l n r ) . Reff is the quotient of the sum of the cubic and quadratic radii of all particles, and represents the average distribution of the aerosol radius in the atmosphere, and Cv denotes the total volume of aerosol particles per unit volume. All observation data were refined to remove outliers, and the observed spectral distributions were compared with the results obtained from AERONET [46] to show that the data processing and its calculation process were reasonable. The maximum and minimum values of the 11D particle size are represented by rmax and rmin, respectively.
In this study, the sensor used was for dry aerosols, and the instantaneous relative humidity observed at the time of the precipitation event was greater than 60%, which can affect the mass concentration; thus, the observed mass concentration in three different size fractions postprecipitation were corrected using Equation (4) [13,47]. PMs represent the particle mass concentrations of five size fractions (TSP, PM10, PM4, PM2.5, and PM1). PM10, PM4, PM2.5, and PM1 refer to particle diameters less than or equal to 10, 4, 2.5, and 1 μm, respectively. TSP is a general term for solid and liquid particulate matter floating in the air with a particle size range of about 0.1–100 μm.
R e f f = r m i n r m a x r 3 d N r dln r dln r r m i n r m a x r 2 d N r dln r dln r
d V r dln r = V r d N r dln r = 4 3 π r 3 d N r dln r
C v = r m i n r m a x d N r dln r dln r
P M s = P M s 1 + 0.25 R H 2 1 R H

2.4. Radiosonde

The radiosonde system used to provide vertical information of atmospheric temperature, relative humidity, pressure, and horizontal wind speed/direction in this experiment was composed of GPS sounding and a ground antenna receiving system (Beijing Changfeng Microelectronics Technology Co., Ltd., Beijing, China). The data vertical resolution was 10 m and the average speed of the balloon was 300 m/min. Sounding observations were made every 6 h during 9–31 July (01:15, 07:15, 13:15, and 19:15 Beijing Time). In addition, intensive observations were carried out at 04:15 and 22:15 from 6 to 15 July and at 10:15 and 16:15 from 12 to 21 July. We analyzed the meteorological elements during three different precipitation processes and dust storms using sound data from 0 to 500 m altitude.

2.5. Meteorology Elements

A portable micro-automatic weather instrument (NK5500 Kestrel, Chicago, US) was deployed to collect near-surface temperature, relative humidity, pressure, and wind vector on a bare leaky sand dune, at a distance of 50 m from the UAV observation location and 1.2 m above the ground. This experiment was performed using a new factory-calibrated NK5500 instrument with a time resolution of 10 min. Compared to the same type of product, the NK5500 has the characteristics of high precision, high performance, and portability.

3. Results

3.1. Measurement Overview

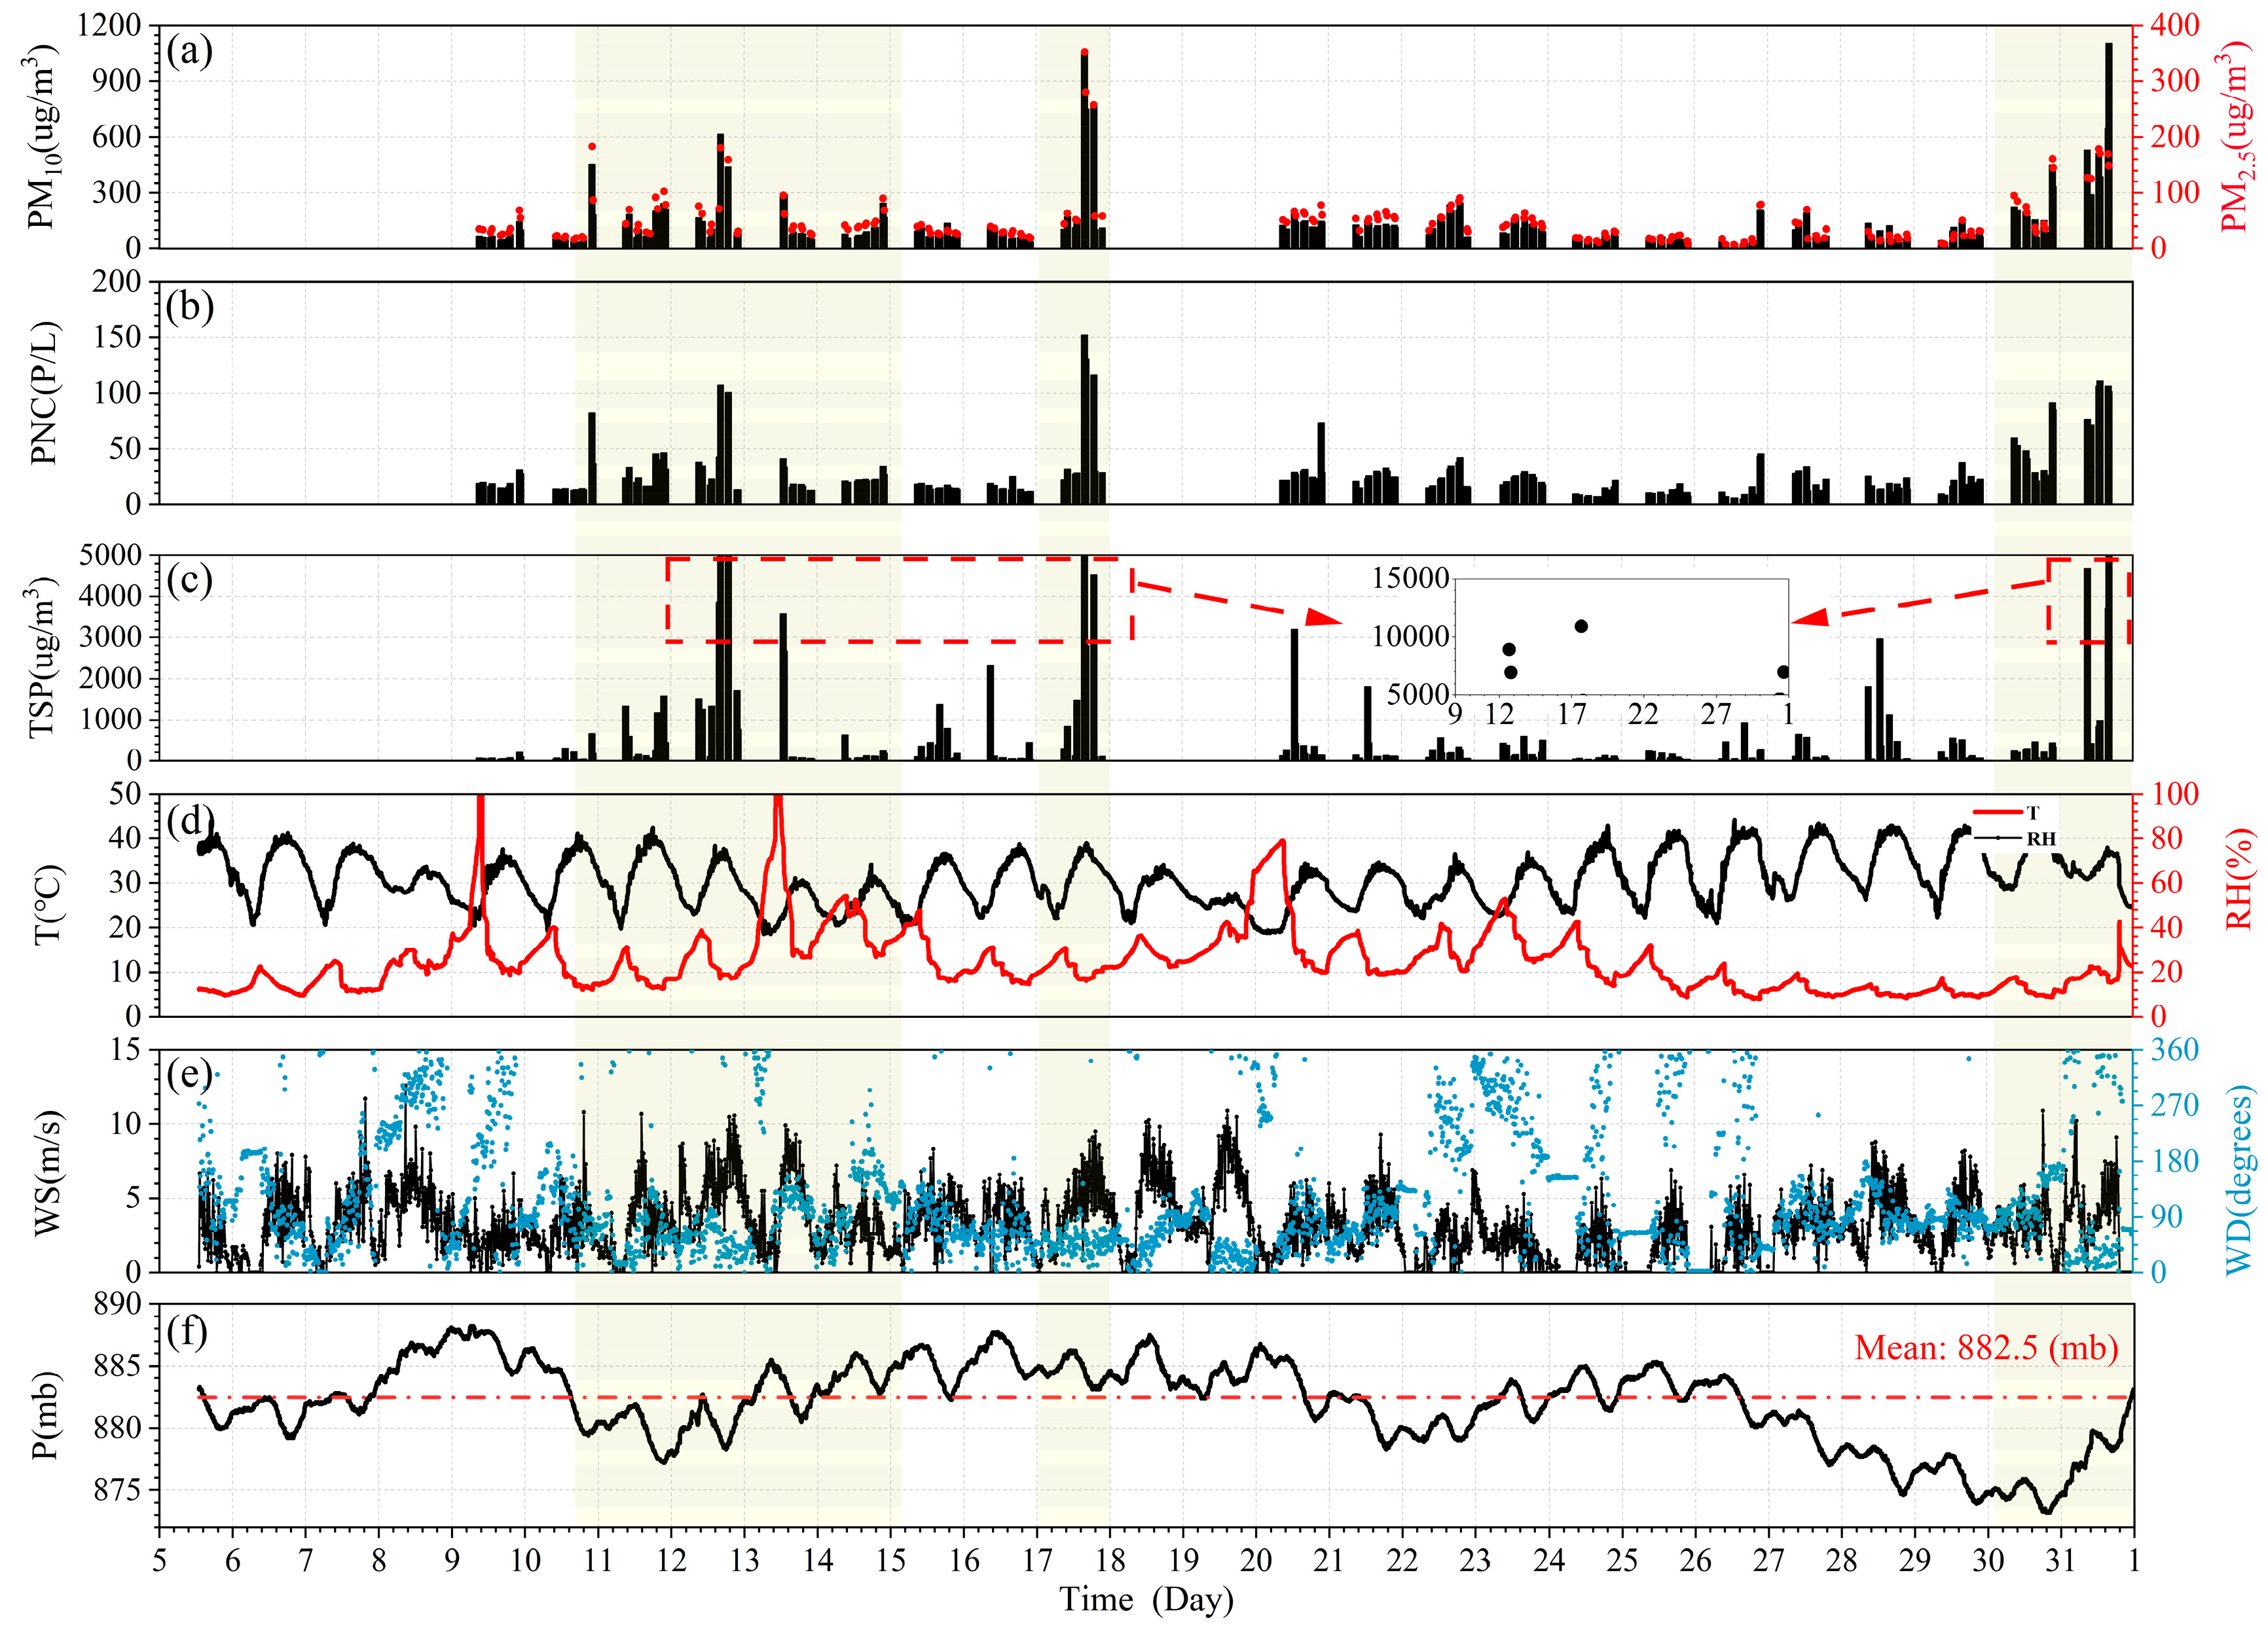
As shown in Figure 2d–f, during the observation period, the mean values of temperature and pressure in TZ were 30.77 °C and 882.5 hPa, respectively, and were mainly influenced by the northeast and east traveling winds with an average wind speed (WS) of 3.13 m/s. The PMs mass concentration and PNC within 10–30 m above ground level were averaged to represent particle variation over the entire observation period (Figure 2a–c). On 12, 17, and 31 July (19:00–22:00), the values of PM10, PM2.5, PNC, and TSP increased rapidly, and the maximum values of PM10 and TSP exceeded 500 μg/m3 and 6000 μg/m3, respectively, considering that a dust-storm event occurred during these three days. The overall trend of PM mass concentration and PNC increased in the days before the occurrence of dust storms on 12 and 31 July, when the pressure was lower than the average pressure and daily maximum temperature gradually decreased. The constant high temperatures and high ground WS, as well as the ample dust sources in the surrounding environment, contributed to the high dust concentrations in TZ. The largest dust storm during the experiment occurred on the night of 17 July, in which TSP, PNC, PM10, and PM2.5 were all higher than those on 12 and 31 July. Near-ground TSP, PM10, and PM2.5 were 6000–12000, ~1100, and 380 μg/m3, respectively. Before the dust storm, the PM mass concentration and PNC values were low, and there was no significant trend in the barometric pressure or daily maximum temperature; however, the WS was at a high level throughout the day. As shown in the observation records (yellow shading), there were continuous dusty weather occurrences from 19:00 to 10:00 on 10, 17, and 30–31 July, with a significant reduction in visibility in the afternoon and evening. The dust storms on 12 and 31 July were mainly influenced by larger weather systems that lasted longer, whereas 17 July was influenced more by near-surface winds and experienced a slightly shorter duration of dust storms driven by small-scale weather systems.
As shown in Figure 2d, the maximum relatie humidity (RH) on nonprecipitation days during the observation period was 52.7%. We determined that an RH greater than this value represents the occurrence of precipitation. Three precipitation events occurred during the study period. Precipitation occurs mostly at night and early in the morning. The first precipitation event (P1) lasted for 4 h from 6:30 on 9 July, when the ground temperature was high and evaporation was faster. The second precipitation event (P2) occurred on 13 July, lasting for 8.5 h, during which high-intensity precipitation lasted for 1.5 h (RH = 100%) and had a significant wetting effect on the dust layer (observation records indicated that P2 had the largest precipitation volume). The third precipitation event (P3) had the longest duration, from 23:00 on 19 July to 10:30 on 20 July; however, the intensity of precipitation was the lowest of the three events, during which RH failed to exceed 80%.
Typically, PM10 concentrations are used to classify different pollution levels. The PM10 evaluation criteria in the ambient air quality standards have been implemented in China since 1 January 2016. The yellow sand intensity forecasting criteria were developed by the Ministry of Environment and the Meteorological Agency of Korea in April 2002, which delineate the criteria for dusty weather levels [48,49]. In general, the trend of the mass concentration was more obvious in the range of 10–100 m, and the influence of sand dunes at the observation points was effectively avoided. The PM10 maximum value, within 10–100 m in our observations, was selected to distinguish dusty weather. As shown in Table 1, the four scenarios can be divided into clear sky, floating dust, blowing dust, and dust storm. According to the criteria, 149 flights observed clear skies, 33 flights observed floating dust, 4 flights observed blowing dust, 8 flights observed dust storms, and 6 flights occurred during postprecipitation, of which approximately 75% were in clear-sky conditions.

3.2. Vertical Characteristics under Clear and Dust Scenarios

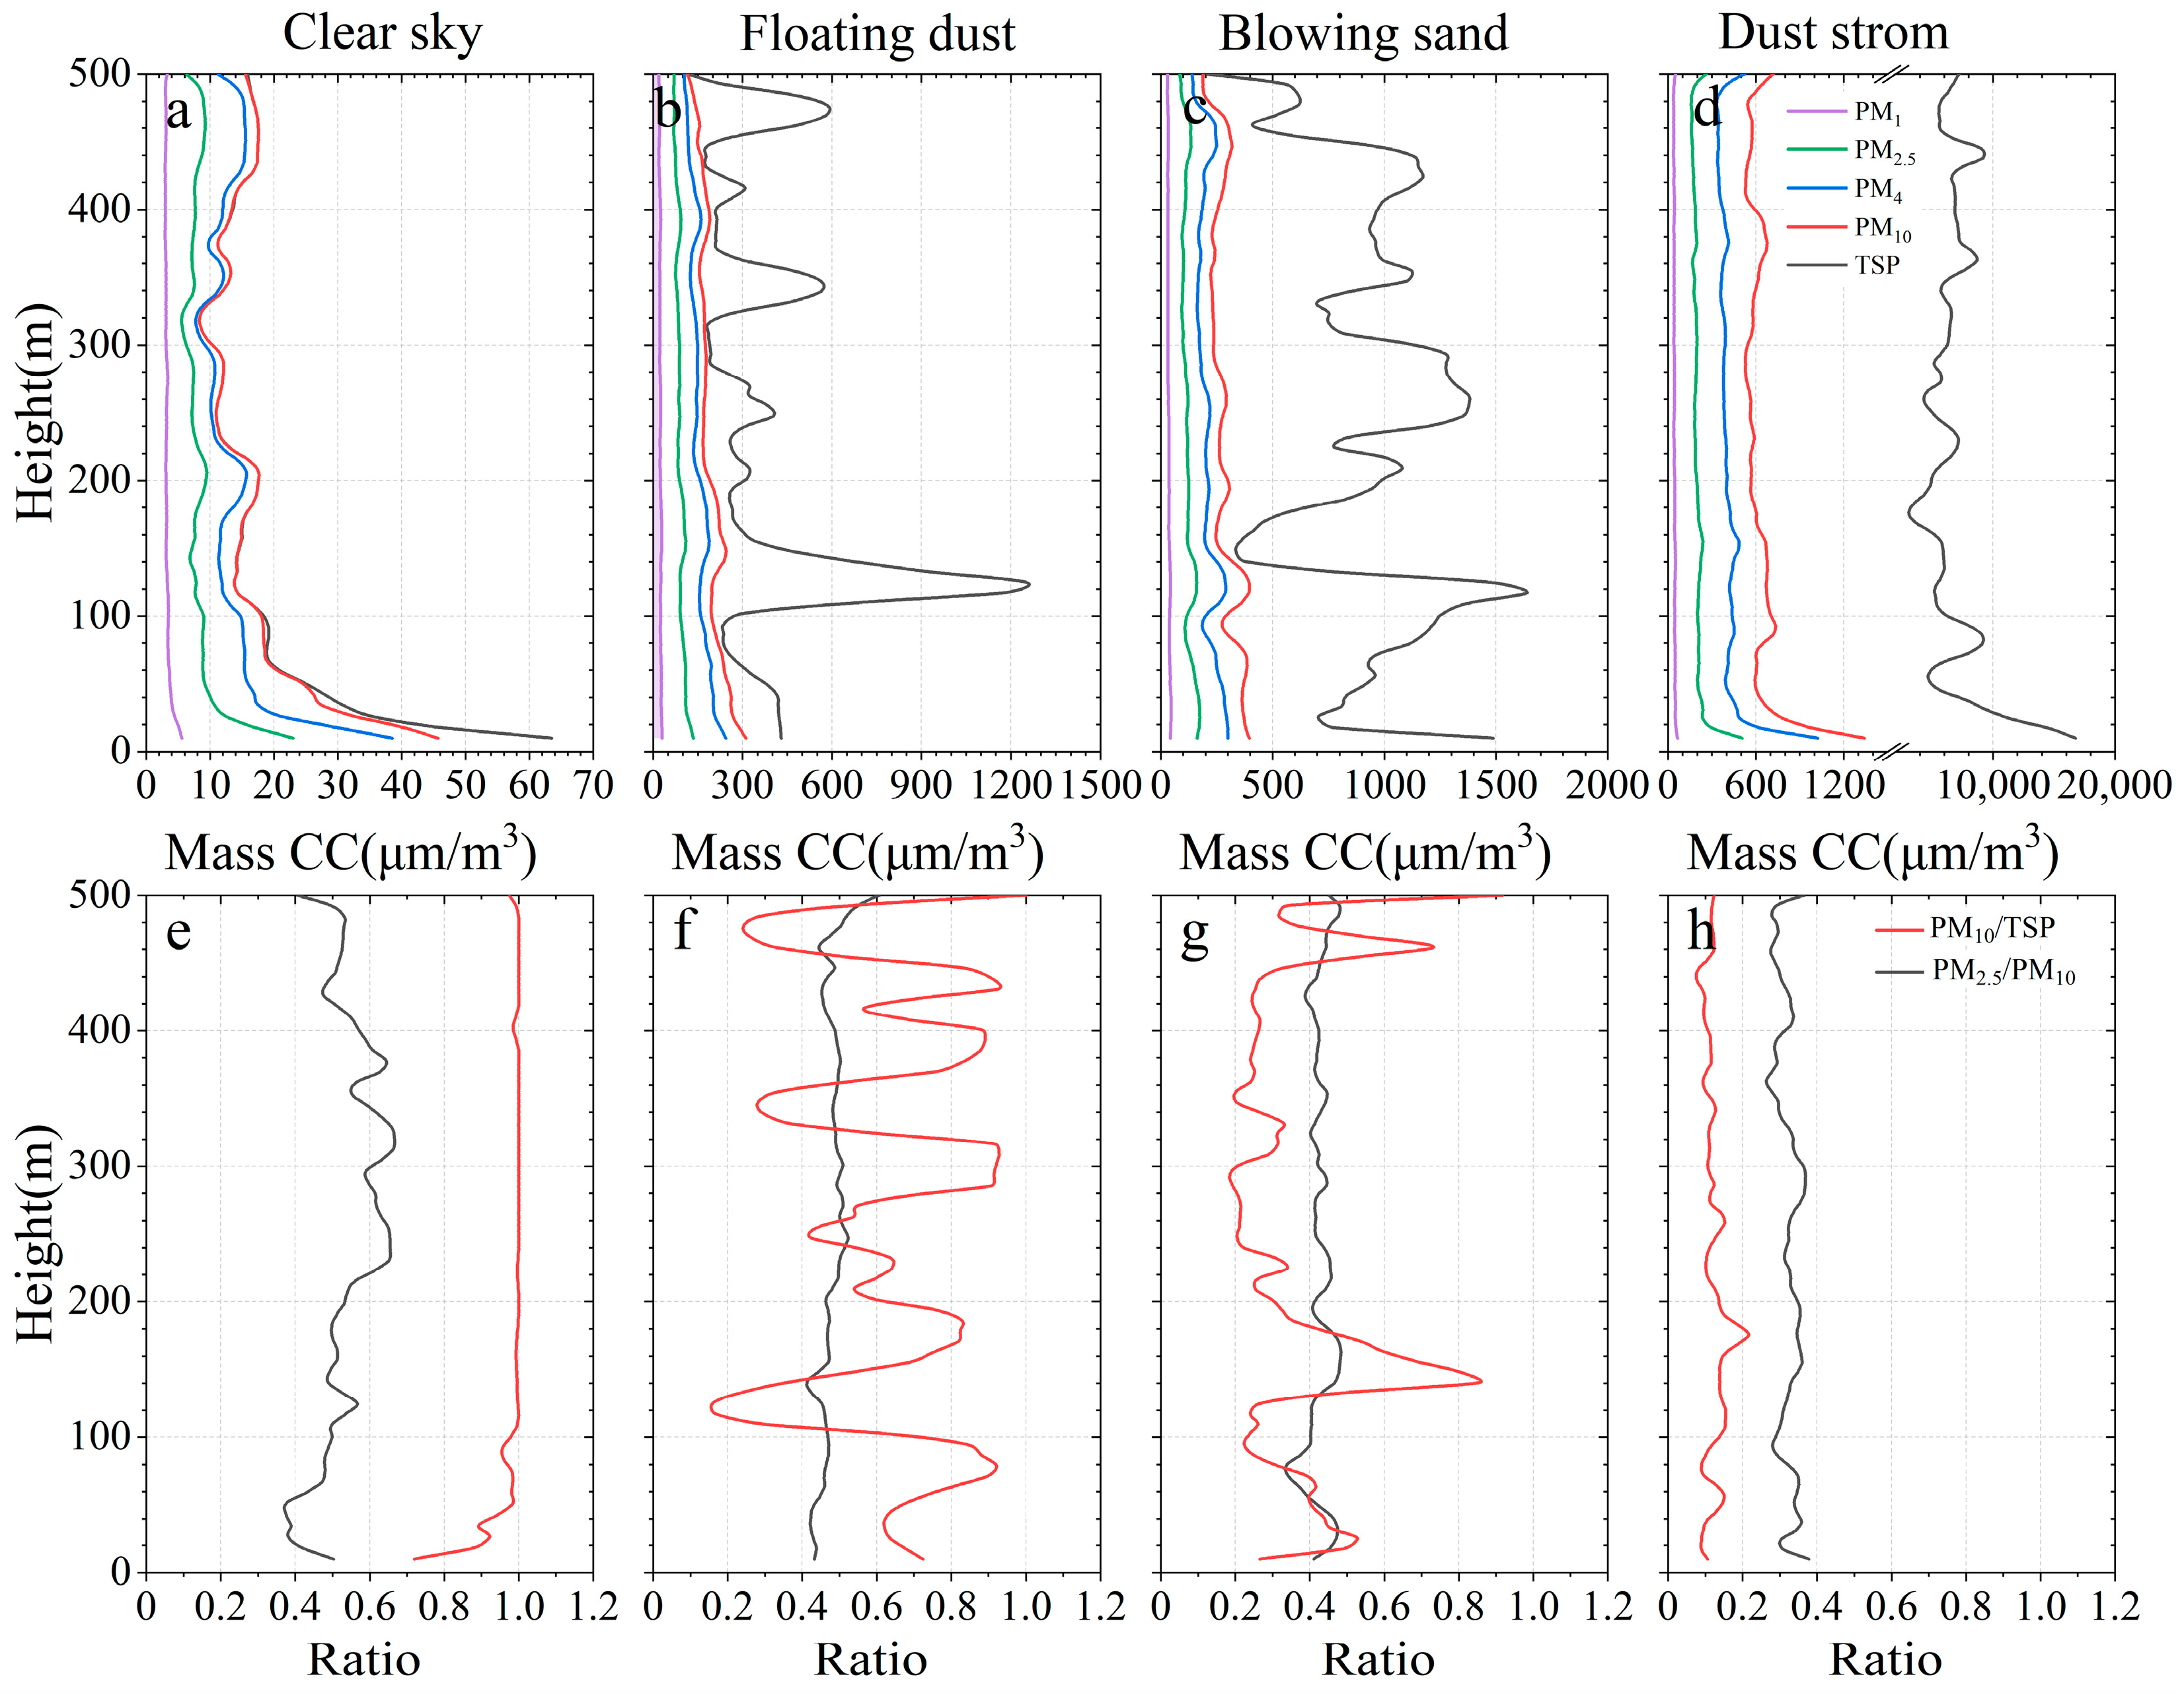
According to the criteria given in Table 1, four flights were selected to present the vertical characteristics of mass concentration changes under different situations. As shown in Figure 3, the PM mass concentrations in the different size fractions increased significantly from clear sky, floating dust, and blowing dust to dust storms. For example, the mean TSP during a dust storm is 5348.8 µg/m3, which is approximately 6 and 15 times higher than that of blowing dust (938.1 µg/m3) and floating dust (361.1 µg/m3) scenarios, respectively, and 318 times higher than that of the clear sky (16.8 µg/m3). The mass concentration ratio decreased for the four scenarios when small particle size fractions were considered. For instance, the average value of PM1 during a dust storm was 44.4 µg/m3, which is 1.2, 1.8, and 13.4 times higher than those during blowing sand, floating dust, and clear sky, respectively. This indicates that the contribution of large particles to the mass concentration had a significant effect on this ratio under different scenarios. During clear-sky periods, the mass concentrations in different size fractions revealed a decreasing trend, with heights below approximately 80 m near the ground, remaining essentially constant above that height. In particular, the profiles for dust storms had a greater decreasing trend than those for clear sky at altitudes below approximately 40 m. As pointed out by [50], the mass concentration distribution varied slightly above 32 m using an 80 m meteorological tower over TZ. The observations reported in the current study are consistent with these results.
As mentioned previously, the four scenarios can be considered as almost instantaneous vertical distributions of dust particles. Compared to the clear-sky and dust-storm scenarios, the TSP profiles for the floating-dust and blowing-dust scenarios exhibited more pronounced swellings in Figure 3b,c. Considering the high spatial resolution sampling characteristics of 11D, we attribute these pronounced swellings to the sudden increase in large dust particles with radii greater than 10 µm on the fine scale of tens to hundreds of meters in the dust layer. This finding is consistent with the results obtained by [35] during the Charmex campaign in 2013. As shown in Figure 3e–h, the clear-sky and dust-storm scenarios provide a reference range for the PM10/TSP ratio. During the dust storm, the ratio remained almost constant at approximately 0.12 with height, which means that the percentage of particles larger than 10 µm was close to 90%. Under clear-sky conditions, the ratio increased with height below approximately 100 m and then remained almost constant at 1. This indicates that there were almost no particles larger than 10 µm above approximately 100 m. In particular, the maximum and minimum ratios under the floating-dust scenario were comparable to those under the clear-sky and dust-storm scenarios. In contrast, the PM2.5/PM10 ratios for the four scenarios were concentrated in the range of 0.3–0.6. The ratios for the three dust scenarios did not show a significant trend with height, with corresponding mean values of 0.48, 0.43, and 0.33, respectively, showing a trend of increasing and then decreasing with height under a clear sky, with peak values occurring at approximately 220–320 m. This again confirms the influence of particles above 10 µm on the mass concentration as described above.
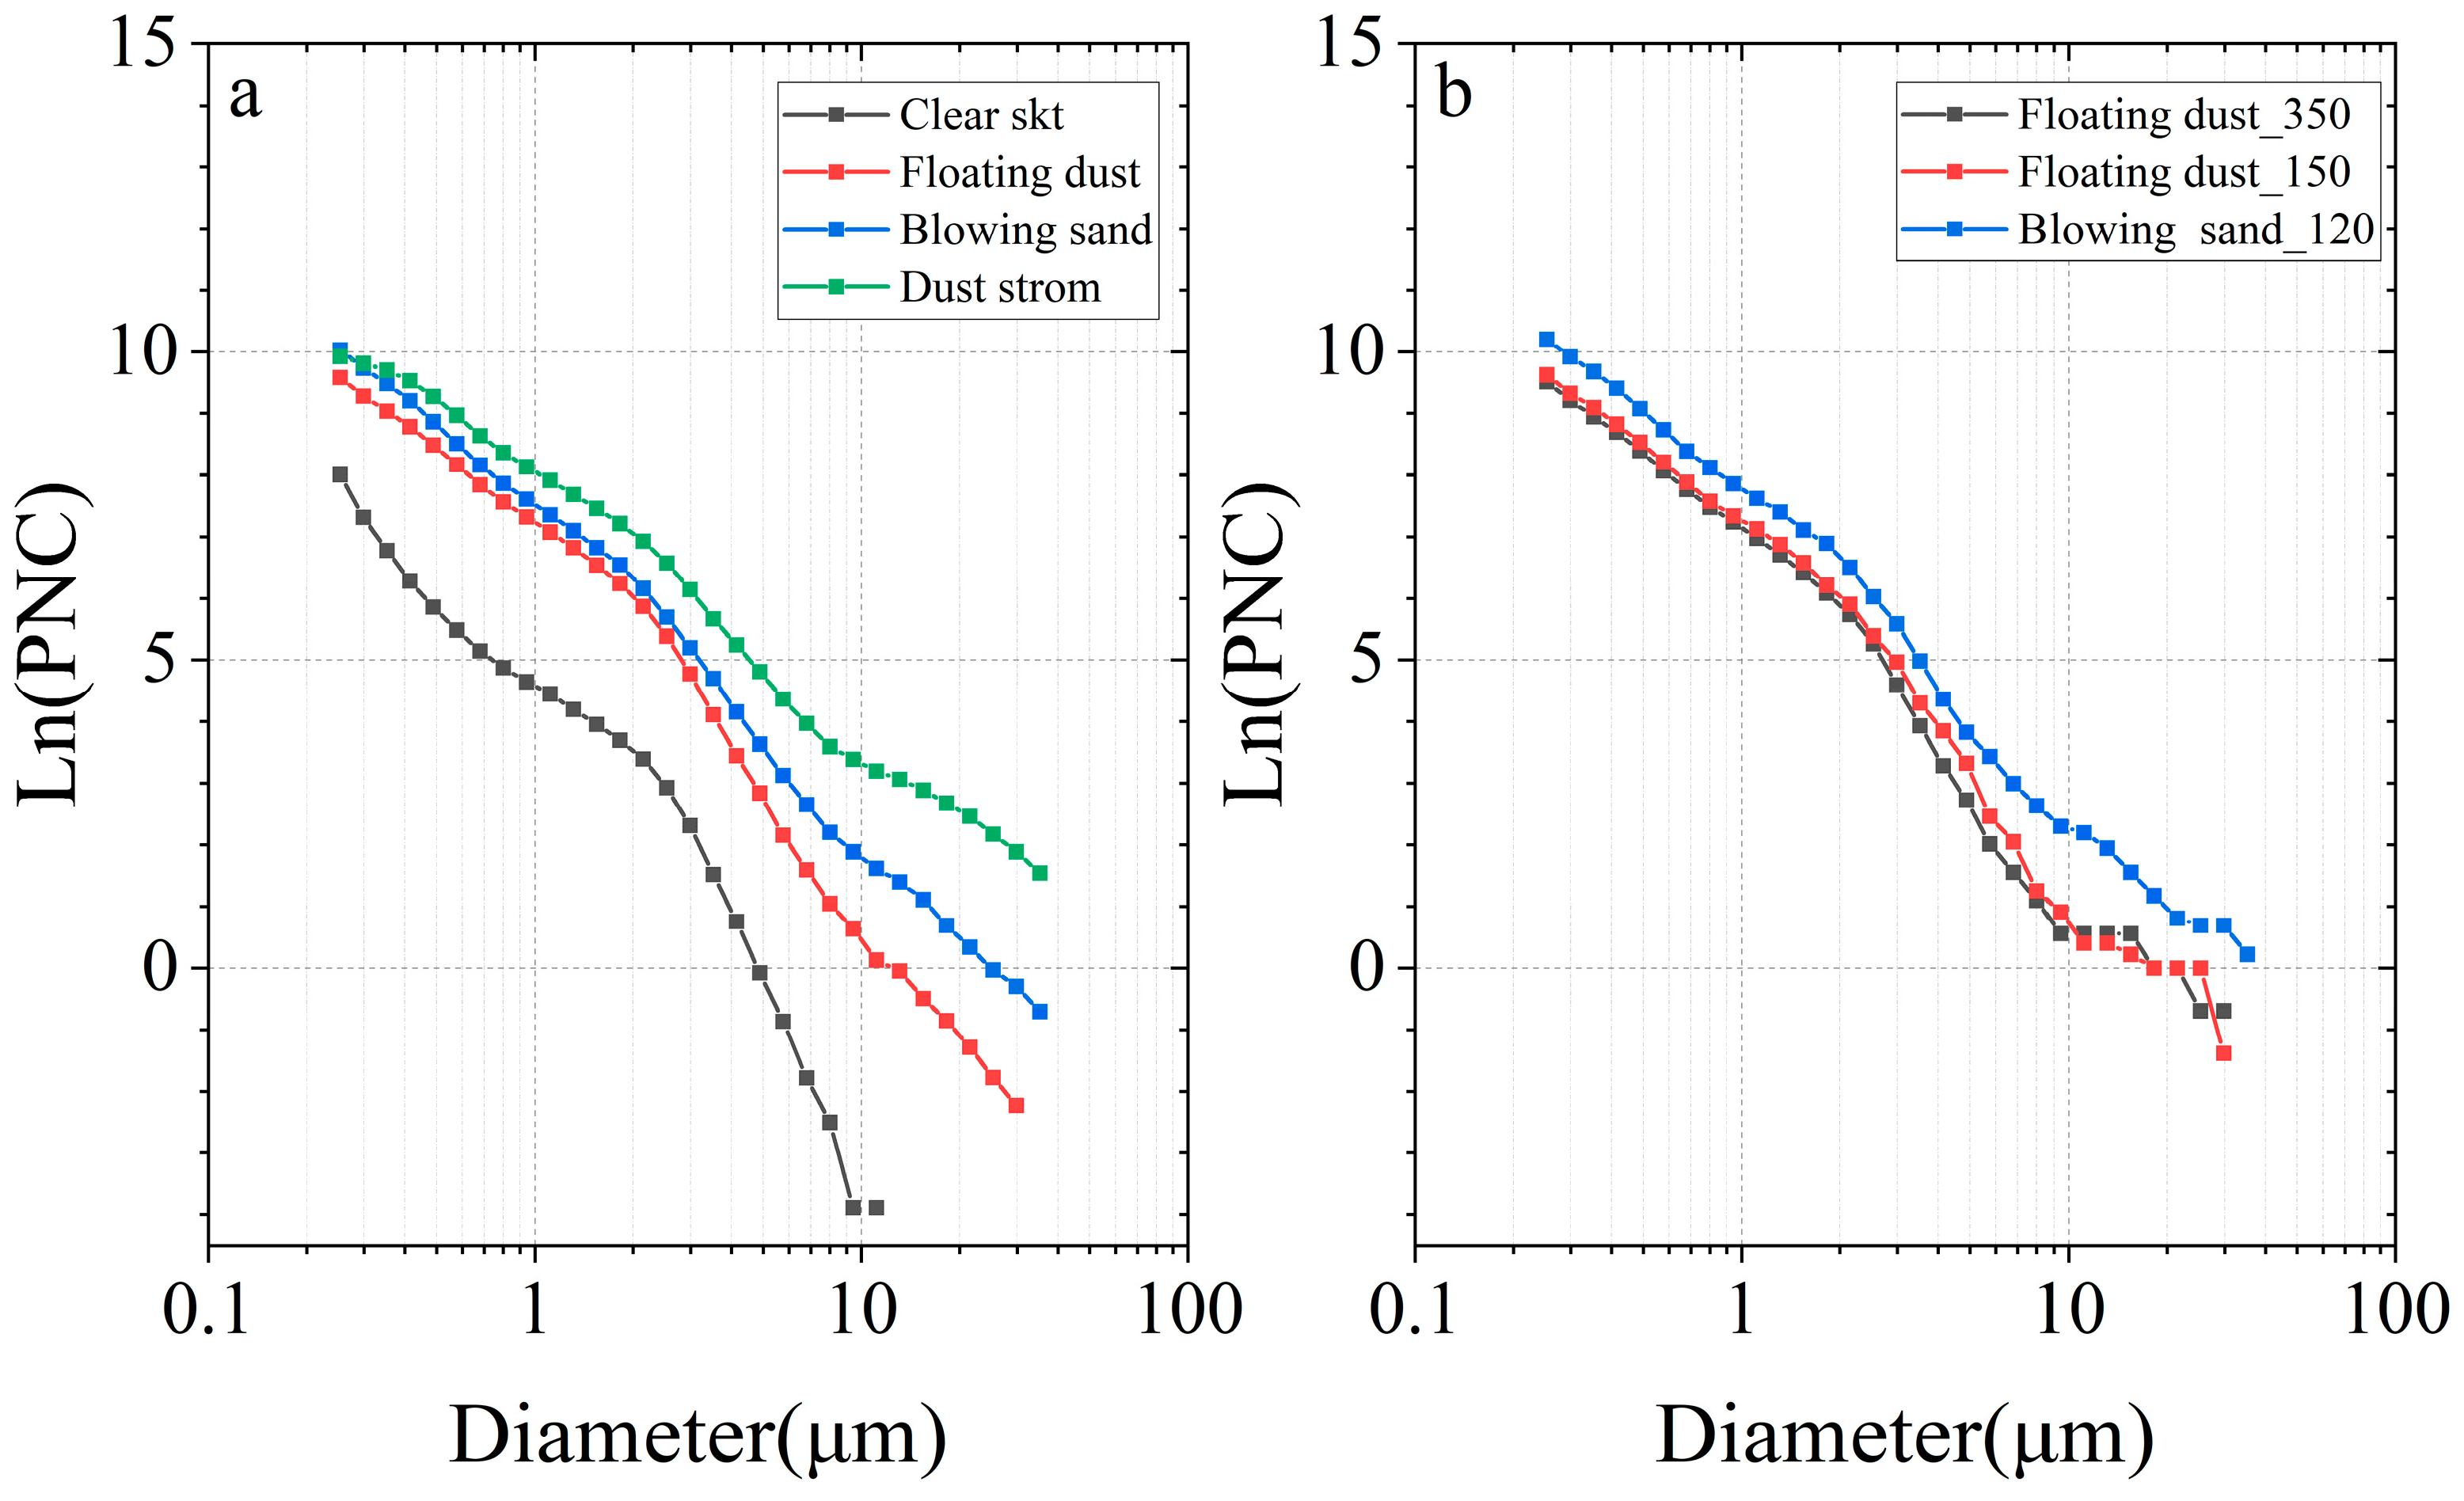
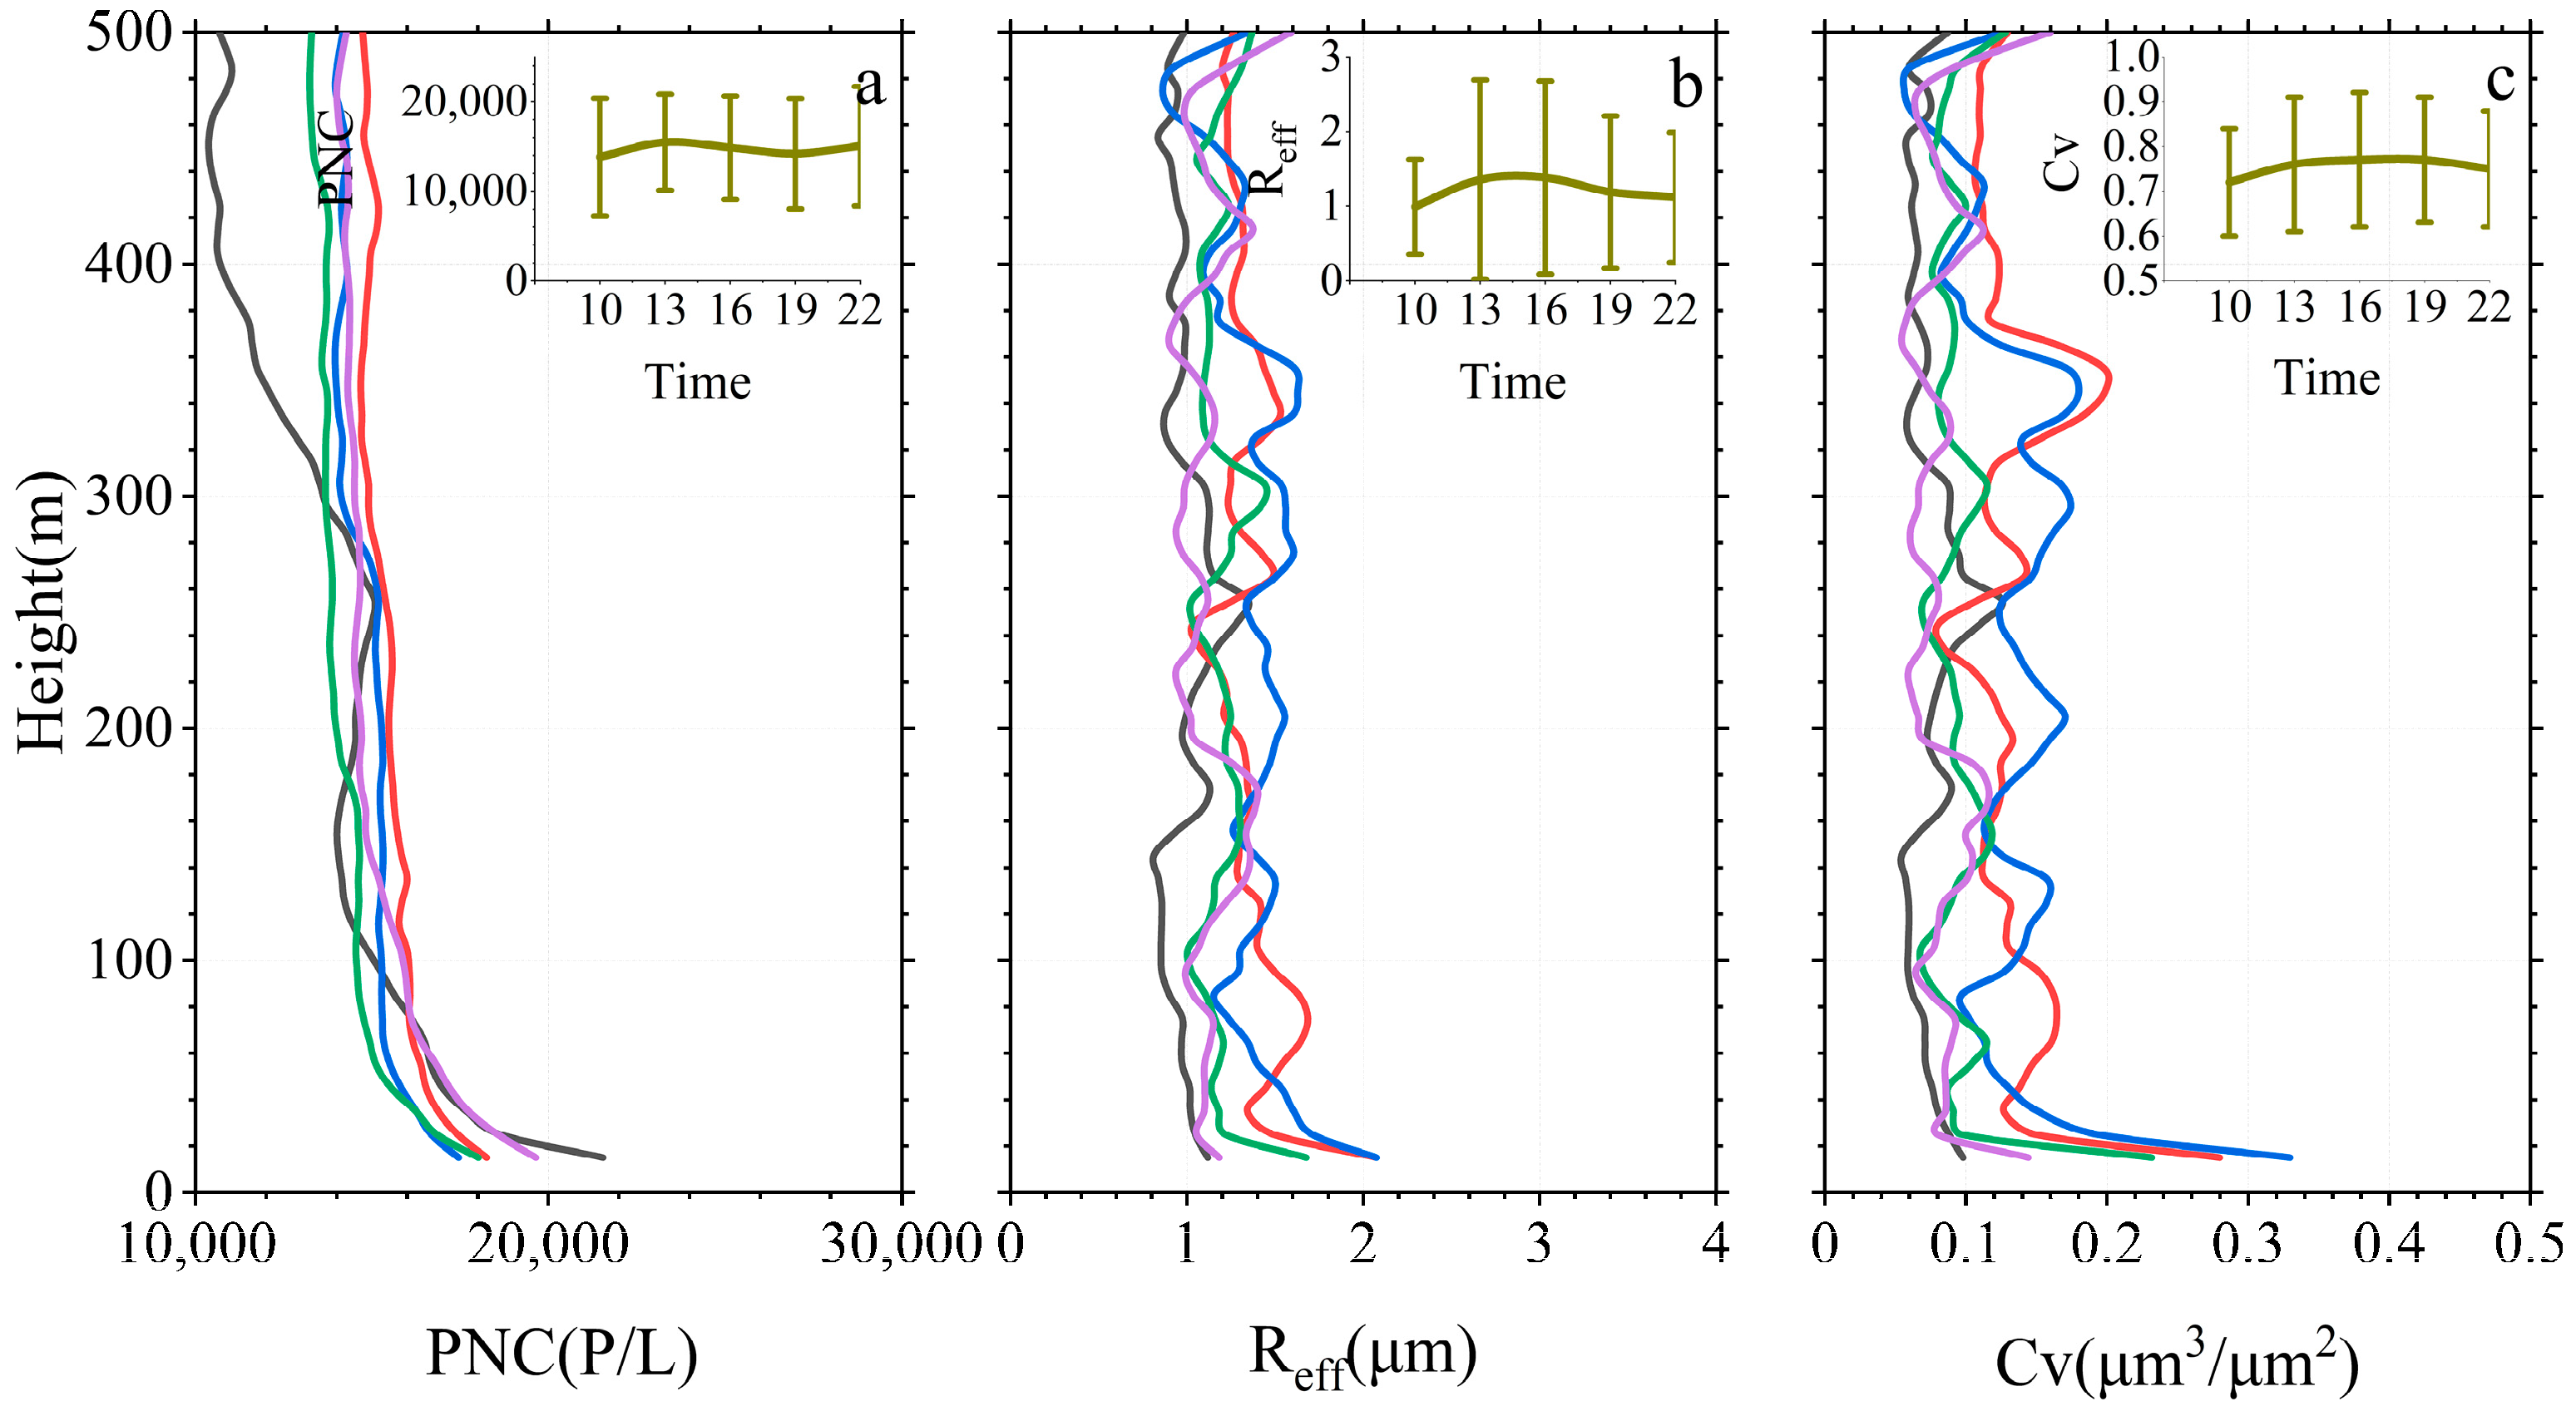
PNC, Reff, and Cv showed consistent changes with respect to mass concentration in the four scenarios (Figure 4a–c). The mean PNCs for the clear-sky, floating-dust, blowing-sand, and dust-storm scenarios were 7246, 58,765, 88,452, and 111,780 P/L, respectively. Compared with the PNC in a clear sky, the dust scenario increases the PNC by 8–16 times. In particular, the vertical decreasing rate of PNC under the dust-storm scenario was 2294 P/L per m (height below approximately 40 m), which was approximately 14 times that of the clear-sky scenario decreasing rate (161.35 P/L per m). In desert areas, aerodynamic factors significantly influence the vertical distribution of dust aerosols in the lower troposphere, particularly during the dust processes. Combined with the WS in Figure 2e, this may be because the hourly average WS exceeded 10 m/s at 19:00 on 17 July and the sand particles swept by strong winds rapidly changed the PNC below 45 m. The PNSD of the four scenarios shown in Figure 5a,b show that regardless of the scenario, the PNC of fine particles is invariably dominant (e.g., the PNC with a radius smaller than 1 μm accounts for 80%), whereas the PNC of large particles in the dust-storm scenario is only approximately 5–25 P/L. Therefore, it is clear that the PNC in Figure 4a exhibits virtually the same vertical characteristics as PM1 in Figure 3a–d. Reff and Cv exhibit almost synchronous trends in the vertical profile. The profile-averaged Reff (Cv) increased from 0.70 µm (0.03 µm3/µm2) in the clear-sky scenario to 4.55 µm (0.73 µm3/µm2) in the dust-storm scenario. Some studies have pointed out that the average Reff was less than 5 μm during clear-sky, floating-dust (1.17 μm), and blowing-sand scenarios (2.12 μm). In contrast, Reff was greater than 5 μm at 300–500 m during dust storms [41].
Combined with the PNSD in Figure 5a,b, it is clear that although the number of large particles is small, their effect on Reff and Cv is significant. This can be understood in two ways: (1) For the two fine-dust layers at approximately 130 m and 350 m in the floating-dust scenario in Figure 3b, the TSP peak is in good agreement with the Reff peak at the same altitude. Under the floating-dust scenario, it can be found that only the TSP profile in these two fine-sand layers shows a clear peak at the same height, excluding other mass fractions, which means that the increase in particles larger than 10 µm is more obvious in the two fine-dust layers. (2) Excluding TSP, the mass concentration distributions in other size fractions under all dust scenarios were relatively similar (Figure 3b–d); however, the Reff and Cv distributions under the floating-dust scenario were closer to those under the clear-sky scenario (Figure 4b,c). In particular, the Reff and Cv values in the floating-dust scenario were very close to those in the clear-sky scenario, except for two peaks, where Reff and Cv were higher than those in the clear-sky scenario. This variation was mainly due to the presence of particles with radii larger than 10 µm in the dust-storm scenario.

3.3. Diurnal Evolution

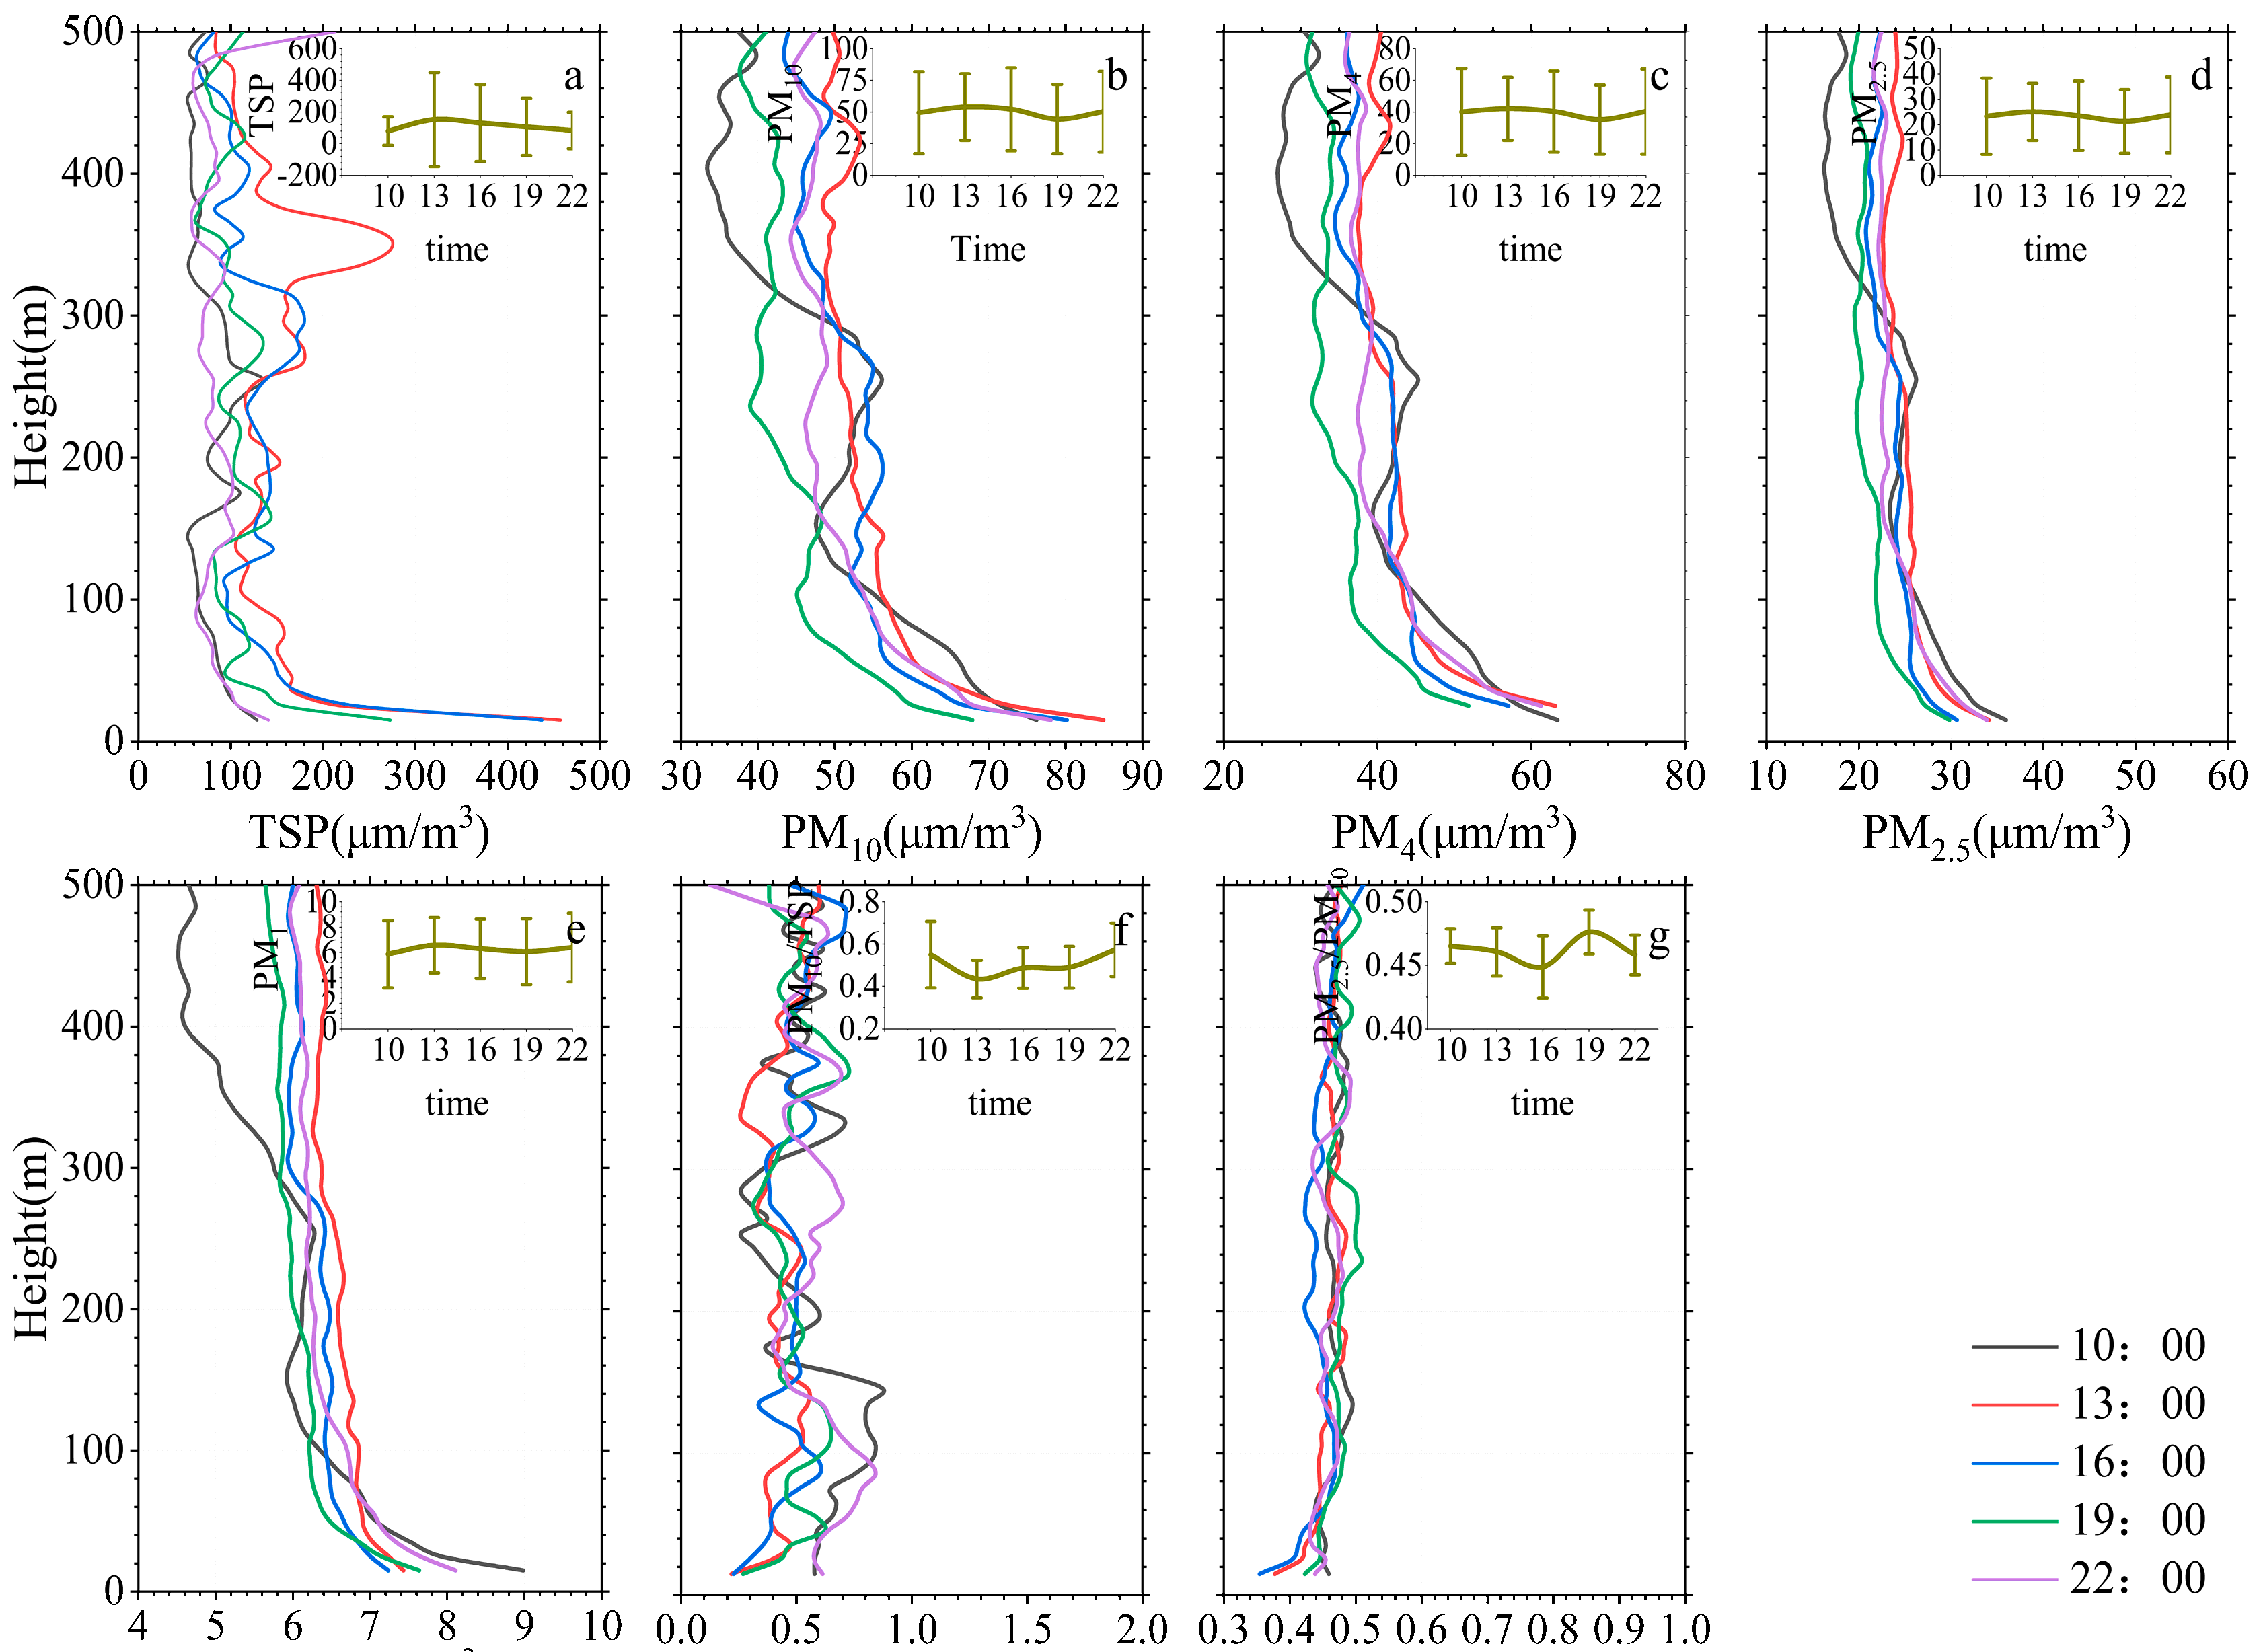
Only the 149 clear-sky flights were considered to represent the diurnal evolution of the background mass and microphysical properties over TZ in July. As shown in Figure 6a–e, the average profiles of the mass concentrations in different size fractions at five time points (10:00, 13:00, 16:00, 19:00, and 22:00) showed a decreasing trend with height, especially below 100 m. The reason for this pattern is that wind-driven sand dust was transported from nearby natural sand dunes. For example, the rate of decrease in the TSP below 100 m reached 3.8 μg/m3 per m at 13:00. PMs in July 2021 in TZ showed a single-peak distribution, with the peak occurring at approximately 13:00. Combined with WS, the distributions of WS and PMs showed the same daily variation characteristics. The average WS near the ground reached a maximum of 4.4 m/s at approximately 13:00 on that day (Figure 2); however, the WS persisted at this level throughout the afternoon. The high WS near the surface of the sand source was more likely to roll up dust particles into the atmosphere and add to the increase in PMs. It has been shown that the daily variation in aerosol mass concentration is positively correlated with RH and pressure and negatively correlated with temperature [26,40], although these effects are not as significant as those of WS in this study. A possible reason is associated with the particle emission mechanism being closely related to WS over dust source areas, unlike the emissions in urban areas. The maximum atmosphere boundary layer height (ABLH) in TZ occurred at approximately 16:00 h in the day [51,52]. This strong thermal mixing within the atmosphere boundary layer (ABL) uplifted the near-surface particles to higher altitudes, resulting in a decrease in the mass concentration and PNC near the surface. As shown in Figure 6f,g, the average PM10/TSP ratio at 13:00 was smallest at 0.43 and increased gradually thereafter. The average PM2.5/PM10 ratio was 0.46, which decreased until 16:00 and then gradually increased. This also confirms that WS is a key factor in the formation of coarse airborne dust particles.
As shown in Figure 7a, PNC also showed a decreasing trend with increasing height, particularly at 10:00. This is because in the experimental region, this stage occurs when the convective boundary layer starts to develop; here, the PBLH is usually less than 500 m. Furthermore, Reff and Cv varied almost constantly with height. The Reff remained approximately in the range of 1–2 μm, while the Cv remained mainly between 0.06 and 1.08 μm3/μm2. Among them, Reff and Cv at 13:00 and 16:00 were considered to be at a maximum level at different heights. The diurnal variation of PNC, Reff, and Cv were similar to those of mass concentration showing a single-peaked distribution, with the peaks occurring at 13:00–16:00, when their values were 15,467 P/L, 1.4 μm, and 0.13 μm3/μm2, respectively.

4. Discussion

4.1. Comparison with Previous Studies

According to the differentiation criteria in Table 1, the mean values of the mineral dust microphysical properties under different scenarios are listed in Table 2. The mean PNC, Reff, and Cv in TZ were 21,290 P/L, 1.47 μm, and 0.16 μm3/μm2, respectively, during the experimental period. The microphysical properties gradually increased from clear sky, floating dust, and blowing dust to dust storm. Some relevant studies were reviewed for comparison with previous observations. As listed in Table 3, only a few studies have addressed these parameters based on UAV, and large differences exist between the values obtained from observations of different land types [34,37,52,53]. The particle size range of the instrument carried by Weinzierl during UAV observations in the Sahara Desert was similar to that in this study. Reff was similar to the observations during the blowing sand scenario, whereas the PNCs were comparable to those under the dust-storm scenario [54]. In urban areas, PNC data were mostly obtained from mobile monitoring campaigns, e.g., 229,720 P/L, 0.87 μm, and 0.01 μm3/μm2 for PNC, Reff, and Cv, respectively, monitored in Lanzhou, northwest China, in January 2020 (unpublished results). The PNC in the desert area was approximately 1/10th of that in the urban area, whereas Reff and Cv were larger than the values observed by urban UAV and mobile monitoring. In addition, Reff was similar to observations in desert and forest land; however, the PNC varied greatly [37,52,53].

4.2. Vertical Characteristics of Postprecipitation Scenarios

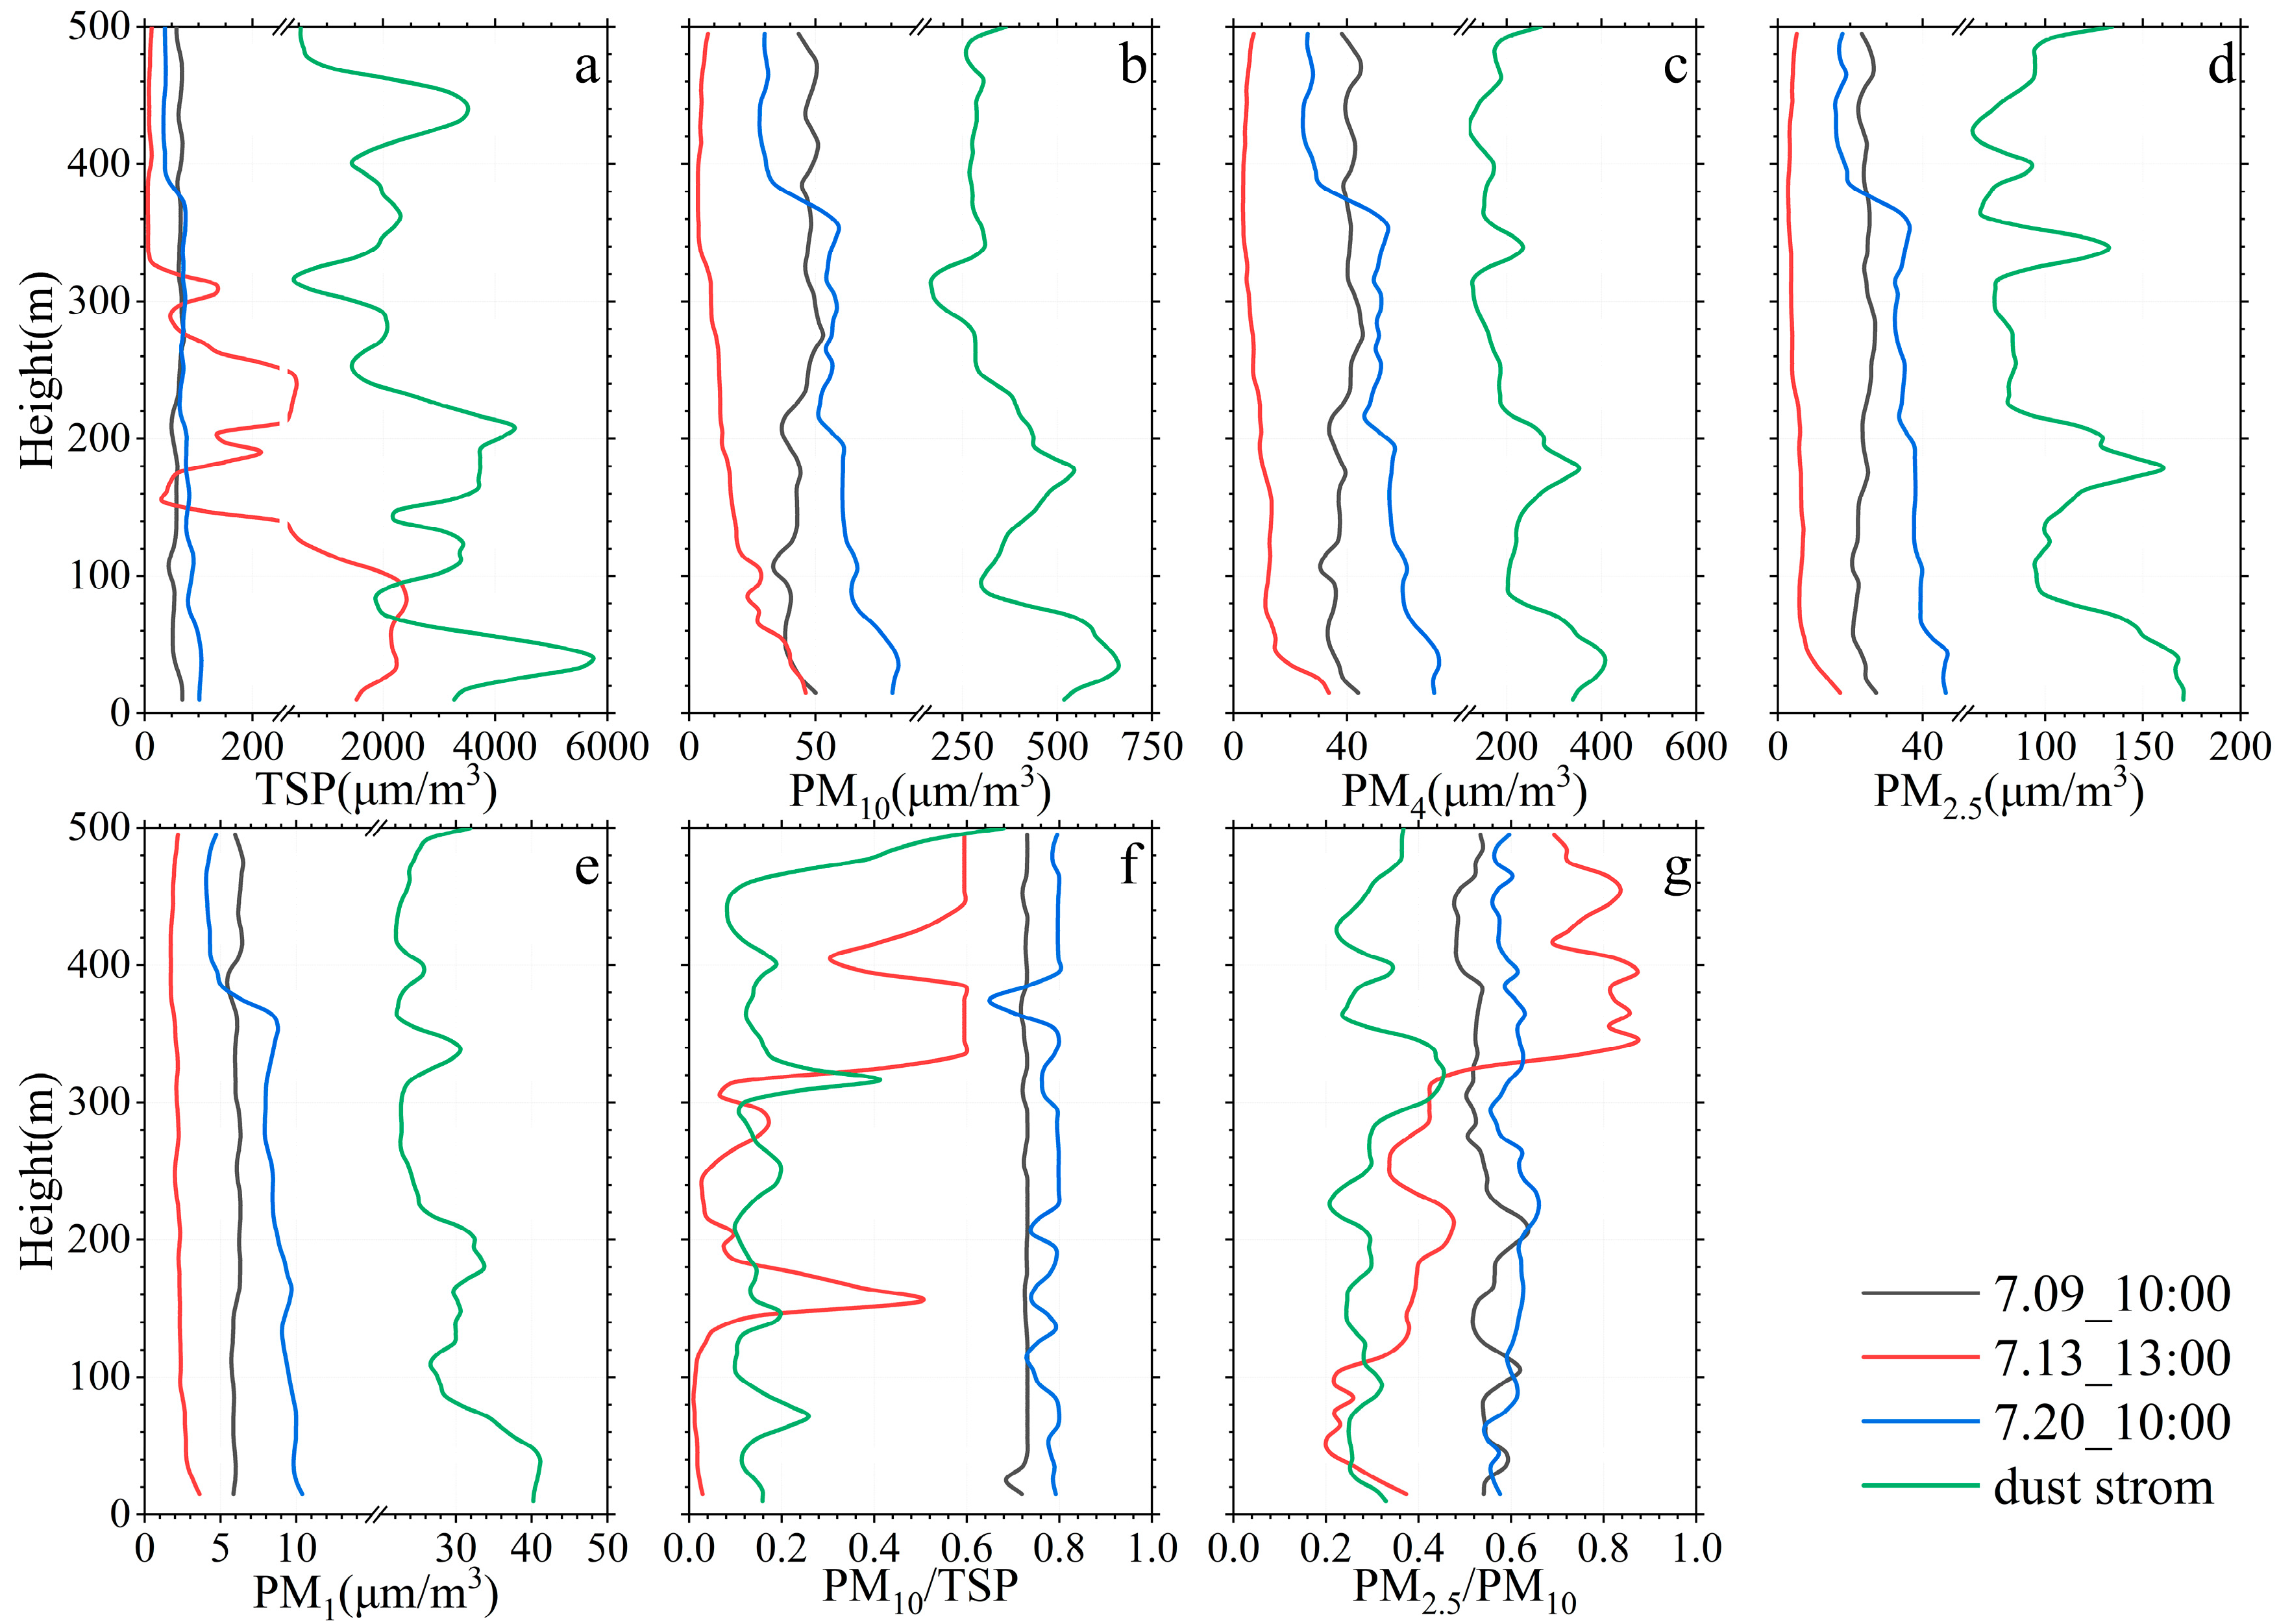
During the campaign period, fortuitous precipitation conditions were captured as rain extremely rarely in the desert hinterland. In the three postprecipitation scenes shown in Figure 8 (P1, P2, and P3), the mean mass concentrations in different size fractions, other than the TSP for P1 and P3, were similarly located between P2 and the dust-storm scenario. The associated mean PM10 values were approximately three times higher than those of P2. In contrast, the mean TSP for P2 was seven to nine times greater than those for P1 and P3. For P2, the PM10/TSP ratios were lower than those of P1 and P3. The TSP decreased with height and revealed two peaks at 80 m and 240 m below 320 m, and its peak value was approximately 5–22 times those of P1 and P3. In Figure 8f, most of the PM10/TSP ratios below 320 m were less than those of the dust-storm scenario, and the values above 320 m lay between those of the dust-storm scenario and P1. Therefore, it can be observed that there are a large number of dust particles with sizes greater than 10 µm below 320 m in P2. Overall, PM2.5/PM10 decreased with increasing height.
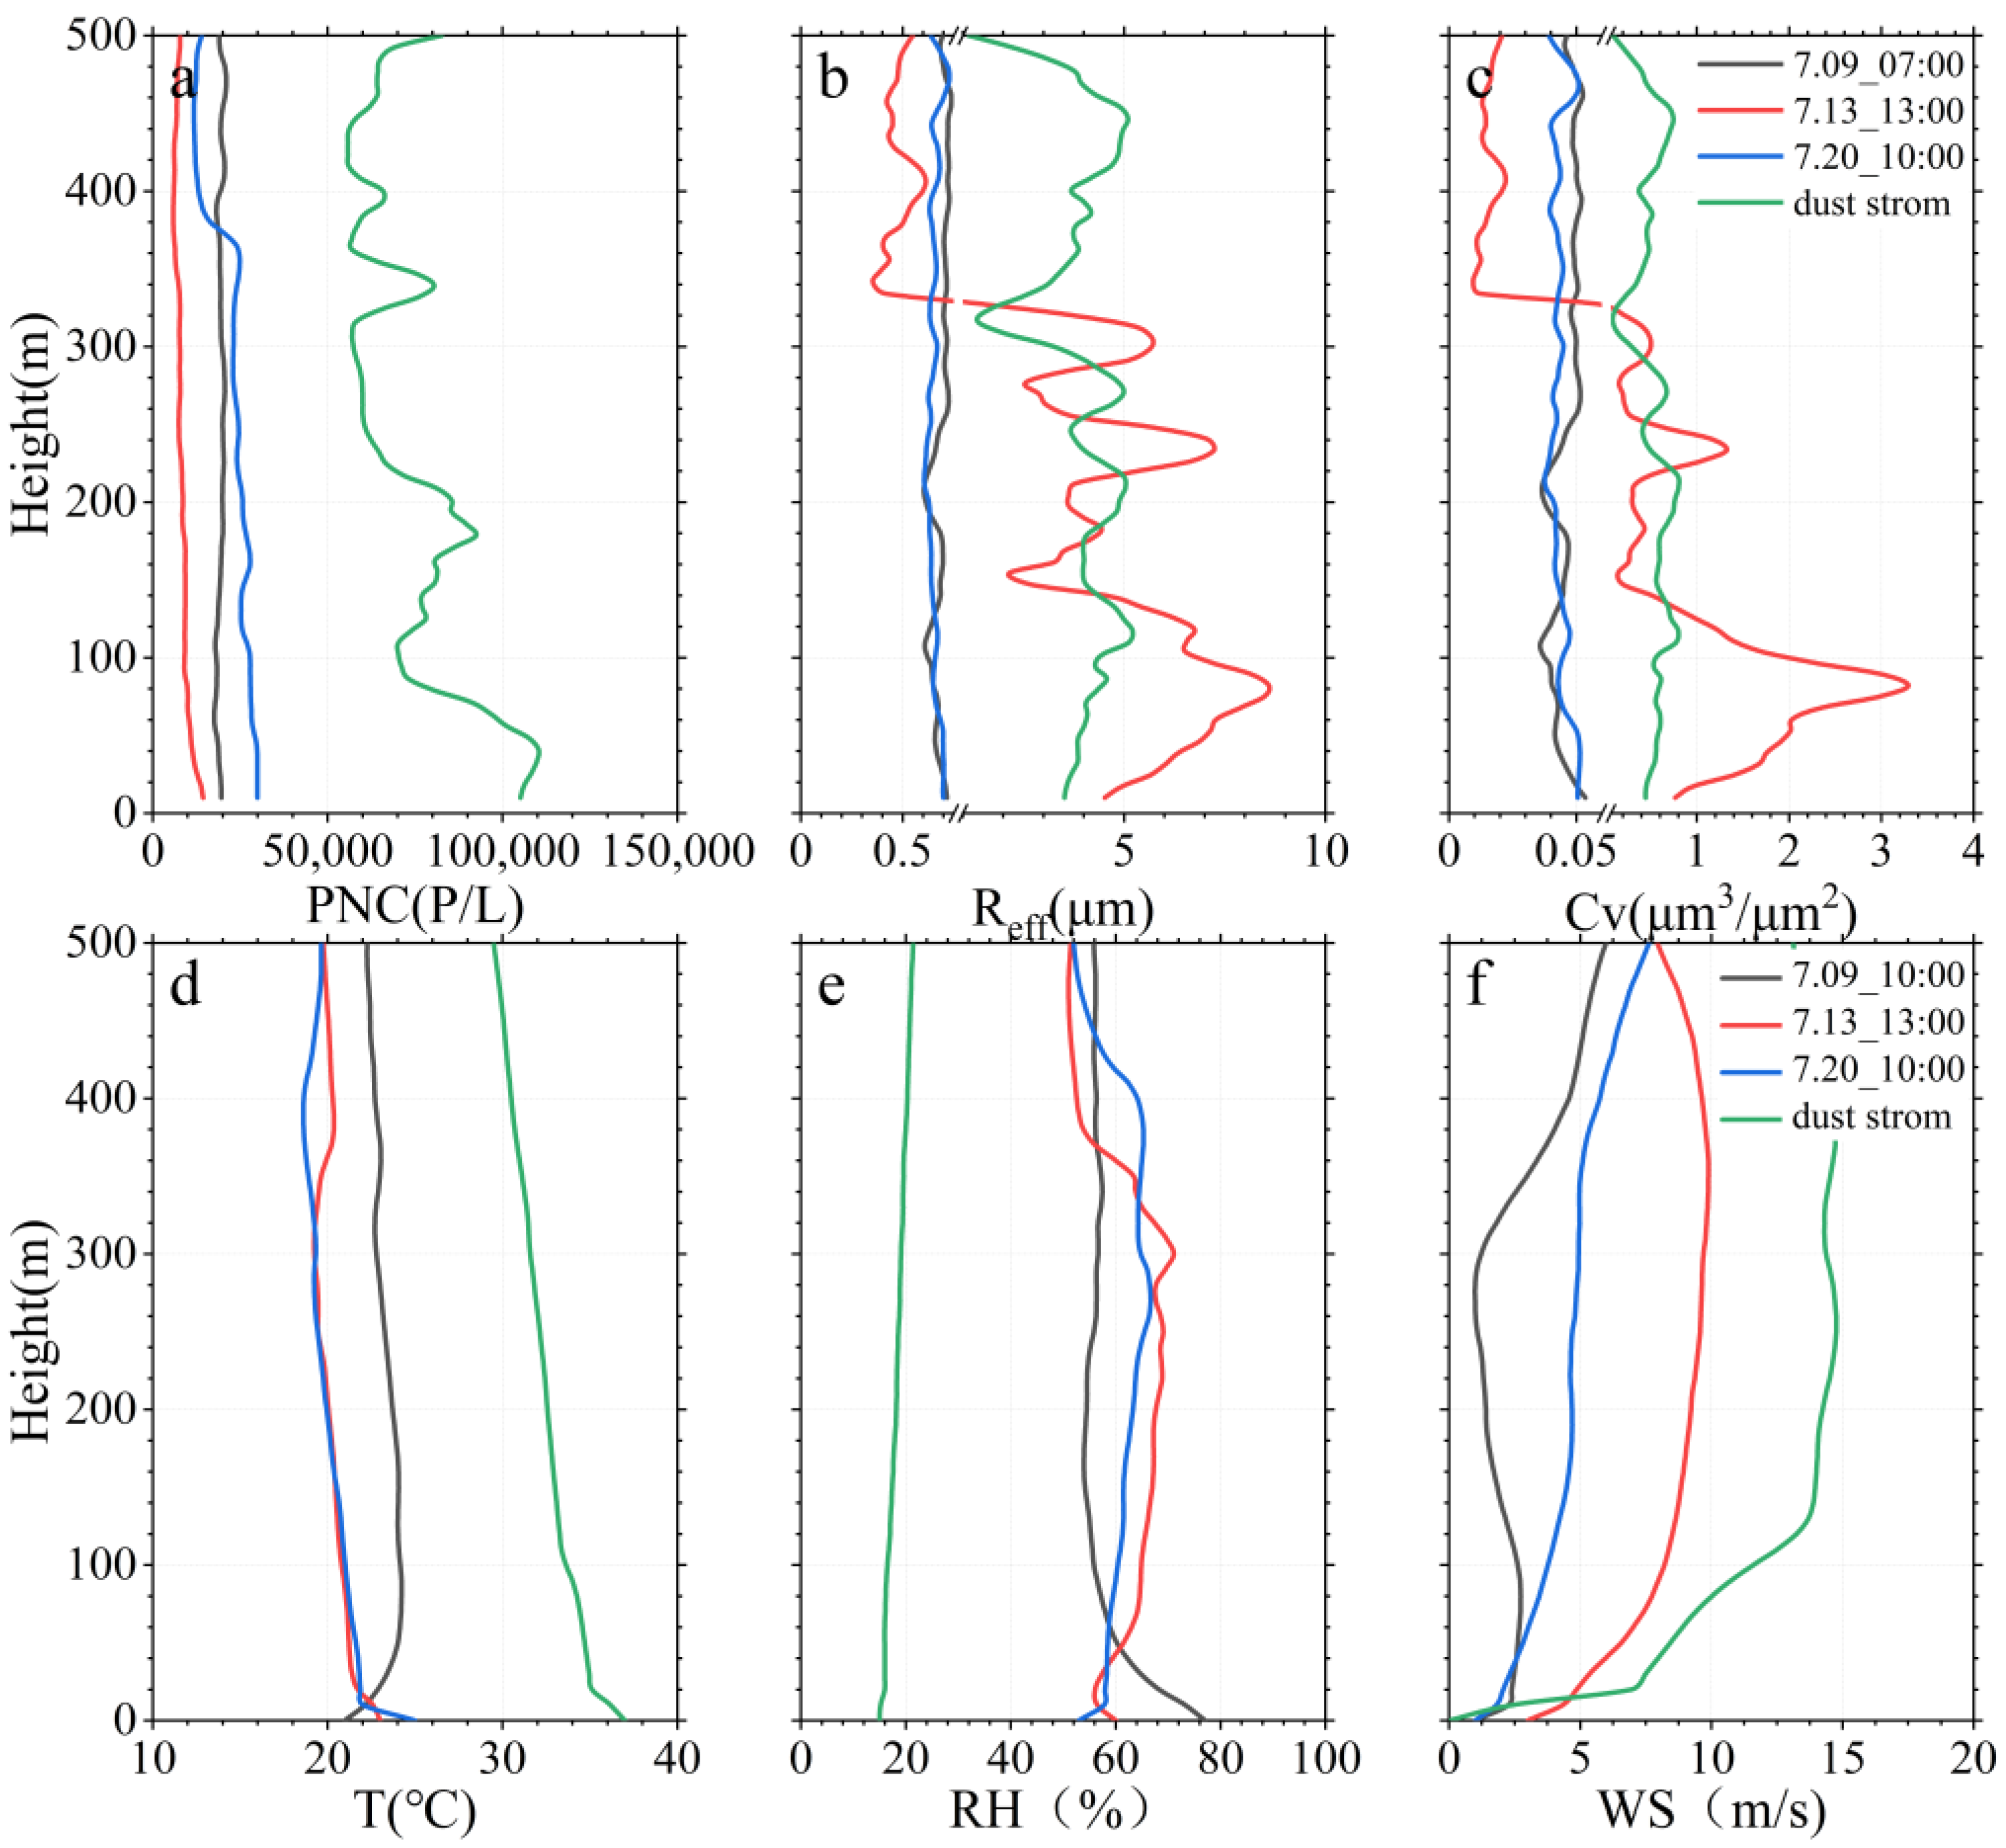
As shown in Figure 9, due to the scavenging effect of rain on airborne particles, it can be seen that the profile-averaged PNC for P1–P3 accounts for 69–89% of the dust-storm scenario (73329 P/L), with the lowest PNC in P2. The profile-averaged Reff and Cv of P2 were 3.6 μm and 0.64 µm3/µm2, respectively, which were significantly 5 and 14 times higher than those of P1 and P3, respectively, and the P2 values were comparable to those of the dust-storm scenario (3.9 μm and 0.52 µm3/µm2). The PNSD in Figure 10a shows that particles with a radius larger than 10 μm were observed in P2, similar to the dust-storm scenario. A possible reason for this is that the WS corresponding to P2 was much greater than those of P1 and P2, and even higher than that during the dust-storm scenario near the ground surface. This high WS accelerates the evaporation of water from the wet-sand layer, and the moist dust particles are able to break free of the sticky wet-sand layer and are then carried into the air from the surrounding sand dunes. In addition, a high-RH environment after precipitation is more favorable for water vapor to wrap around dust particles, thus adsorbing smaller dust particles onto the ground surface [55].

4.3. The Importance of UAV Observations for Lidar Inversion

Although the microphysical properties of aerosols can be inverted well using lidar, the impact of RH on the aerosol mass and microphysical properties is non-negligible, as shown in Figure 9 and Figure 10. Dionisi reported that lidar-inversed Cv and in situ observations agreed well when the RH was less than 60%, while the lidar-inversed Cv was 3–3.5 times higher than that in situ when the RH was greater than 90% [56]. Ziemba showed that the extinction coefficient was underestimated by 32%, indicating that the water in the particles had a significant effect on lidar inversion [13]. Therefore, it is necessary to introduce in situ observations with UAV as independent constraints for lidar data inversion to improve the performance of lidar inversion algorithms under multiple scenarios.

5. Conclusions

In this study, the vertical characteristics and diurnal evolution of near-surface dust mass concentrations of different PMs, PNC, Reff, and Cv were determined using a UAV observation platform during field campaigns in July 2021 in the TZ region of the TD hinterland. To the best of our knowledge, this is the first report on the vertical profiles of PNC, Reff, and Cv using a UAV over the TD.
From clear-sky, floating-dust, and blowing-sand to dust-storm scenarios, PMs, PNC, Reff, and Cv gradually increased, and the values of PNC in the four scenarios were 14650, 58,765, 88,452, and 111,779 P/L, respectively. Compared with that under clear-sky scenarios, PNC increased by four to eight times under dust scenarios, while Reff and Cv increased from 1.15 μm and 0.08 μm3/μm2 under the floating-dust scenario to 4.53 μm and 0.74 μm3/μm2 under the dust-storm scenario, respectively. The diurnal variations in PMs, PNC, Reff, and Cv showed a unimodal distribution, with the peak occurring at approximately 13:00–16:00. Wind speed was the key factor causing peaks in mass concentrations and microphysical parameters in the desert hinterland, which in turn decreased near the surface as the convective boundary layer developed. PMs and PNC below the boundary layer height were approximately 1.5 times higher than those above, whereas the TSP/PM10 ratio, PM10/PM2.5 ratio, Reff, and Cv remained almost unchanged.
Only a few studies have covered PNC, Reff, and Cv based on UAVs, and there are large differences among the observations of different land types. The Reff in the Sahara Desert was similar to that observed in the TD during the blowing-sand scenario, whereas the PNCs was comparable to those under the dust-storm scenario. The PNC in the desert area was approximately 1/10th that in the urban area, whereas Reff and Cv were larger than those in the urban region. For the P2 postprecipitation scenario, the PNC, Reff, and Cv were 8363 P/L, 3.57 μm, and 0.64 μm3/μm2, respectively. The PNC of P2 was smaller than that under the clear-sky scenario, whereas Reff and Cv were similar to or greater than those for the dust-storm scenario. This increase in particle radius postprecipitation was associated with high WS and an increase in RH.
Here, we neglected the effect of the propeller-disturbance airflow on the sampled air characteristics during the rotorcraft flight because of the lack of other similar sampling instruments for auxiliary correction. In future studies, this effect will be further evaluated and applied to lidar inversion.

Author Contributions

Conceptualization, X.Z.; methodology, X.Z. and T.Z.; software, X.Z. and T.Z.; validation, X.Z. and T.Z.; formal analysis, T.Z.; resources, T.Z.; data curation, X.Z., T.Z., S.F. and B.H.; writing—original draft preparation, X.Z. and T.Z.; visualization, T.Z.; funding acquisition, Q.H. All authors have read and agreed to the published version of the manuscript.

Funding

This research was funded by the Second Tibetan Plateau Scientific Expedition and Research Program (STEP) (2019QZKK0602), the National Science Foundation of China (41975019, 42030612), Gansu Provincial Science and Technology Program (23JRRA1032), and Gansu Provincial Science and Technology Innovative Talent Program: High-level Talent and Innovative Team Special Project (No.22JR9KA001).

Data Availability Statement

The data presented in this study are available on request from the author.

Acknowledgments

We acknowledge the colleagues (Fan Yang, Jiantao Zhang) at the Institute of Desert Meteorology, Urumqi, for their selfless support and suggestions for our field campaign. We also acknowledge all anonymous reviewers for their insightful and valuable comments.

Conflicts of Interest

The authors declare no conflict of interest.

References

  1. Palacios-Pena, L.; Baro, R.; Guerrero-Rascado, J.L.; Alados-Arboledas, L.; Brunner, D.; Jimenez-Guerrero, P. Evaluating the representation of aerosol optical properties using an online coupled model over the Iberian Peninsula. Atmos. Chem. Phys. 2017, 17, 277–296. [Google Scholar] [CrossRef] [Green Version]
  2. Kala, N.K.; Anand, N.S.; Manoj, M.R.; Pathak, H.S.; Moorthy, K.K.; Satheesh, S.K. Zonal variations in the vertical distribution of atmospheric aerosols over the Indian region and the consequent radiative effects. Atmos. Chem. Phys. 2022, 22, 6067–6085. [Google Scholar] [CrossRef]
  3. Toledano, C.; Wiegner, M.; Gross, S.; Freudenthaler, V.; Gasteiger, J.; Mueller, D.; Mueller, T.; Schladitz, A.; Weinzierl, B.; Torres, B.; et al. Optical properties of aerosol mixtures derived from sun-sky radiometry during SAMUM-2. Tellus Ser. B-Chem. Phys. Meteorol. 2011, 63, 635–648. [Google Scholar] [CrossRef] [Green Version]
  4. Huang, J.; Li, Y.; Fu, C.; Chen, F.; Fu, Q.; Dai, A.; Shinoda, M.; Ma, Z.; Guo, W.; Li, Z.; et al. Dryland climate change: Recent progress and challenges. Rev. Geophys. 2017, 55, 719–778. [Google Scholar] [CrossRef]
  5. Zhang, S.; Huang, Z.; Li, M.; Shen, X.; Wang, Y.; Dong, Q.; Bi, J.; Zhang, J.; Li, W.; Li, Z.; et al. Vertical Structure of Dust Aerosols Observed by a Ground-Based Raman Lidar with Polarization Capabilities in the Center of the Taklimakan Desert. Remote Sens. 2022, 14, 2461. [Google Scholar] [CrossRef]
  6. Chen, S.; Zhang, R.; Mao, R.; Zhang, Y.; Chen, Y.; Ji, Z.; Gong, Y.; Guan, Y. Sources characteristics and climate impact of light-absorbing aerosols over the Tibetan Plateau. Earth-Sci. Rev. 2022, 232, 104111. [Google Scholar] [CrossRef]
  7. Kang, S.; Cong, Z.; Wang, X.; Zhang, Q.; Ji, Z.; Zhang, Y.; Xu, B. The transboundary transport of air pollutants and their environmental impacts on Tibetan Plateau. Chin. Sci. Bull.-Chin. 2019, 64, 2876–2884. [Google Scholar]
  8. Gogoi, M.M.; Babu, S.S.; Pandey, S.K.; Nair, V.S.; Vaishya, A.; Girach, I.A.; Koushik, N. Scavenging ratio of black carbon in the Arctic and the Antarctic. Polar Sci. 2018, 16, 10–22. [Google Scholar] [CrossRef]
  9. Onishi, K. Health Impact Assessment of Asian Dust/Cross-border Air Pollutant and Necessary Preventive Measure. Nihon Eiseigaku Zasshi Jpn. J. Hyg. 2017, 72, 43–48. [Google Scholar] [CrossRef]
  10. Jin, L.; Zhou, T.; Fang, S.; Zhou, X.; Han, B.; Bai, Y. The short-term effects of air pollutants on pneumonia hospital admissions in Lanzhou, China, 2014–2019: Evidence of ecological time-series study. Air Qual. Atmos. Health 2022, 15, 2199–2213. [Google Scholar] [CrossRef]
  11. Liu, D.; Wang, Y.; Wang, Z.; Zhou, J. The Three-Dimensional Structure of Transatlantic African Dust Transport: A New Perspective from CALIPSO LIDAR Measurements. Adv. Meteorol. 2012, 2012, 850704. [Google Scholar] [CrossRef] [Green Version]
  12. Xie, H.; Wang, Z.; Luo, T.; Yang, K.; Zhang, D.; Zhou, T.; Yang, X.; Liu, X.; Fu, Q. Seasonal Variation of Dust Aerosol Vertical Distribution in Arctic Based on Polarized Micropulse Lidar Measurement. Remote Sens. 2022, 14, 5581. [Google Scholar] [CrossRef]
  13. Ziemba, L.D.; Thornhill, K.L.; Ferrare, R.; Barrick, J.; Beyersdorf, A.J.; Chen, G.; Crumeyrolle, S.N.; Hair, J.; Hostetler, C.; Hudgins, C.; et al. Airborne observations of aerosol extinction by in situ and remote-sensing techniques: Evaluation of particle hygroscopicity. Geophys. Res. Lett. 2013, 40, 417–422. [Google Scholar] [CrossRef]
  14. Zhou, S.; Wu, L.; Guo, J.; Chen, W.; Wang, X.; Zhao, J.; Cheng, Y.; Huang, Z.; Zhang, J.; Sun, Y.; et al. Measurement report: Vertical distribution of atmospheric particulate matter within the urban boundary layer in southern China—size-segregated chemical composition and secondary formation through cloud processing and heterogeneous reactions. Atmos. Chem. Phys. 2020, 20, 6435–6453. [Google Scholar] [CrossRef]
  15. Vandenbussche, S.; Kochenova, S.; Vandaele, A.C.; Kumps, N.; De Maziere, M. Retrieval of desert dust aerosol vertical profiles from IASI measurements in the TIR atmospheric window. Atmos. Meas. Tech. 2013, 6, 2577–2591. [Google Scholar] [CrossRef] [Green Version]
  16. Bangert, M.; Nenes, A.; Vogel, B.; Vogel, H.; Barahona, D.; Karydis, V.A.; Kumar, P.; Kottmeier, C.; Blahak, U. Saharan dust event impacts on cloud formation and radiation over Western Europe. Atmos. Chem. Phys. 2012, 12, 4045–4063. [Google Scholar] [CrossRef] [Green Version]
  17. Rosenfeld, D. Atmosphere. Aerosols, clouds, and climate. Science 2006, 312, 1323–1324. [Google Scholar] [CrossRef]
  18. Creamean, J.M.; Primm, K.M.; Tolbert, M.A.; Hall, E.G.; Wendell, J.; Jordan, A.; Sheridan, P.J.; Smith, J.; Schnell, R.C. HOVERCAT: A novel aerial system for evaluation of aerosol-cloud interactions. Atmos. Meas. Tech. 2018, 11, 3969–3985. [Google Scholar] [CrossRef] [Green Version]
  19. Miller, R.L.; Tegen, I. Radiative forcing of a tropical direct circulation by soil dust aerosols. J. Atmos. Sci. 1999, 56, 2403–2433. [Google Scholar] [CrossRef]
  20. Torres, B.; Dubovik, O.; Toledano, C.; Berjon, A.; Cachorro, V.E.; Lapyonok, T.; Litvinov, P.; Goloub, P. Sensitivity of aerosol retrieval to geometrical configuration of ground-based sun/sky radiometer observations. Atmos. Chem. Phys. 2014, 14, 847–875. [Google Scholar] [CrossRef]
  21. Nowottnick, E.; Colarco, P.; Ferrare, R.; Chen, G.; Ismail, S.; Anderson, B.; Browell, E. Online simulations of mineral dust aerosol distributions: Comparisons to NAMMA observations and sensitivity to dust emission parameterization. J. Geophys. Res. Atmos. 2010, 115, D03202. [Google Scholar] [CrossRef] [Green Version]
  22. Shi, Y.; Liu, X.; Wu, M.; Zhao, X.; Ke, Z.; Brown, H. Relative importance of high-latitude local and long-range-transported dust for Arctic ice-nucleating particles and impacts on Arctic mixed-phase clouds. Atmos. Chem. Phys. 2022, 22, 2909–2935. [Google Scholar] [CrossRef]
  23. Perez, C.; Nickovic, S.; Baldasano, J.M.; Sicard, M.; Rocadenbosch, F.; Cachorro, V.E. A long Saharan dust event over the western Mediterranean: Lidar, Sun photometer observations, and regional dust modeling. J. Geophys. Res. Atmos. 2006, 111, D15214. [Google Scholar] [CrossRef]
  24. Tegen, I.; Lacis, A.A. Modeling of particle size distribution and its influence on the radiative properties of mineral dust aerosol. J. Geophys. Res. Atmos. 1996, 101, 19237–19244. [Google Scholar] [CrossRef] [Green Version]
  25. Ran, L.; Deng, Z.; Wu, Y.; Li, J.; Bai, Z.; Lu, Y.; Zhuoga, D.; Bian, J. Measurement report: Vertical profiling of particle size distributions over Lhasa, Tibet—tethered balloon-based in situ measurements and source apportionment. Atmos. Chem. Phys. 2022, 22, 6217–6229. [Google Scholar] [CrossRef]
  26. Zhao, M.; Wang, T.; Li, S.; Li, M.; Xie, M.; Zhuang, B. Lidar- and UAV-Based Vertical Observation of Spring Ozone and Particulate Matter in Nanjing, China. Remote Sens. 2022, 14, 3051. [Google Scholar]
  27. Song, R.-f.; Wang, D.-S.; Li, X.-B.; Li, B.; Peng, Z.-R.; He, H.-d. Characterizing vertical distribution patterns of PM2.5 in low troposphere of Shanghai city, China: Implications from the perspective of unmanned aerial vehicle observations. Atmos. Environ. 2021, 265, 118724. [Google Scholar] [CrossRef]
  28. Huo, W.; Song, M.; Wu, Y.; Zhi, X.; Yang, F.; Ma, M.; Zhou, C.; Yang, X.; Mamtimin, A.; He, Q. Relationships between Near-Surface Horizontal Dust Fluxes and Dust Depositions at the Centre and Edge of the Taklamakan Desert. Land 2022, 11, 959. [Google Scholar] [CrossRef]
  29. Liu, L.; Xu, L.; Zhang, J.; Yuan, Q.; Ding, X.; Hu, W.; Fu, P.; Zhang, D. Overview of primary biological aerosol particles from a Chinese boreal forest: Insight into morphology, size, and mixing state at microscopic scale. Sci. Total Environ. 2020, 719, 137520. [Google Scholar] [CrossRef] [PubMed]
  30. Zhou, T.; Xie, H.; Bi, J.; Huang, Z.; Huang, J.; Shi, J.; Zhang, B.; Zhang, W. Lidar Measurements of Dust Aerosols during Three Field Campaigns in 2010, 2011 and 2012 over Northwestern China. Atmosphere 2018, 9, 173. [Google Scholar] [CrossRef] [Green Version]
  31. Wu, C.; Liu, B.; Wu, D.; Yang, H.; Mao, X.; Tan, J.; Liang, Y.; Sun, J.Y.; Xia, R.; Sun, J.; et al. Vertical profiling of black carbon and ozone using a multicopter unmanned aerial vehicle (UAV) in urban Shenzhen of South China. Sci. Total Environ. 2021, 801, 149689. [Google Scholar] [CrossRef]
  32. Xie, H.; Zhou, T.; Fu, Q.; Huang, J.; Huang, Z.; Bi, J.; Shi, J.; Zhang, B.; Ge, J. Automated detection of cloud and aerosol features with SACOL micro-pulse lidar in northwest China. Opt. Express 2017, 25, 30732–30753. [Google Scholar] [CrossRef]
  33. Mallet, M.; Dulac, F.; Formenti, P.; Nabat, P.; Sciare, J.; Roberts, G.; Pelon, J.; Ancellet, G.; Tanré, D.; Parol, F.; et al. Overview of the Chemistry-Aerosol Mediterranean Experiment/Aerosol Direct Radiative Forcing on the Mediterranean Climate (ChArMEx/ADRIMED) summer 2013 campaign. Atmos. Chem. Phys. 2016, 16, 455–504. [Google Scholar] [CrossRef] [Green Version]
  34. Weinzierl, B.; Petzold, A.; Esselborn, M.; Wirth, M.; Rasp, K.; Kandler, K.; Schuetz, L.; Koepke, P.; Fiebig, M. Airborne measurements of dust layer properties, particle size distribution and mixing state of Saharan dust during SAMUM 2006. Tellus Ser. B-Chem. Phys. Meteorol. 2009, 61, 96–117. [Google Scholar] [CrossRef] [Green Version]
  35. Tesche, M.; Ansmann, A.; Mueller, D.; Althausen, D.; Mattis, I.; Heese, B.; Freudenthaler, V.; Wiegner, M.; Esselborn, M.; Pisani, G.; et al. Vertical profiling of Saharan dust with Raman lidars and airborne HSRL in southern Morocco during SAMUM. Tellus Ser. B-Chem. Phys. Meteorol. 2009, 61, 144–164. [Google Scholar] [CrossRef] [Green Version]
  36. Kezoudi, M.; Keleshis, C.; Antoniou, P.; Biskos, G.; Bronz, M.; Constantinides, C.; Desservettaz, M.; Gao, R.-S.; Girdwood, J.; Harnetiaux, J.; et al. The Unmanned Systems Research Laboratory (USRL): A New Facility for UAV-Based Atmospheric Observations. Atmosphere 2021, 12, 1042. [Google Scholar] [CrossRef]
  37. Kezoudi, M.; Tesche, M.; Smith, H.; Tsekeri, A.; Baars, H.; Dollner, M.; Estelles, V.; Buehl, J.; Weinzierl, B.; Ulanowski, Z.; et al. Measurement report: Balloon-borne in situ profiling of Saharan dust over Cyprus with the UCASS optical particle counter. Atmos. Chem. Phys. 2021, 21, 6781–6797. [Google Scholar] [CrossRef]
  38. Knippertz, P.; Ansmann, A.; Althausen, D.; Mueller, D.; Tesche, M.; Bierwirth, E.; Dinter, T.; Mueller, T.; Von Hoyningen-Huene, W.; Schepanski, K.; et al. Dust mobilization and transport in the northern Sahara during SAMUM 2006—A meteorological overview. Tellus Ser. B-Chem. Phys. Meteorol. 2009, 61, 12–31. [Google Scholar] [CrossRef] [Green Version]
  39. Zhao, M.; Fang, Z.; Yang, H.; Cheng, L.; Chen, J.; Xie, C. UAVC: A New Method for Correcting Lidar Overlap Factors Based on Unmanned Aerial Vehicle Vertical Detection. Appl. Sci. 2022, 12, 184. [Google Scholar] [CrossRef]
  40. Wang, M.; Wei, W.; Ruan, Z.; He, Q.; Ge, R. Application of wind-profiling radar data to the analysis of dust weather in the Taklimakan Desert. Environ. Monit. Assess. 2013, 185, 4819–4834. [Google Scholar] [CrossRef]
  41. Zhou, C.; Liu, Y.; He, Q.; Zhong, X.; Zhu, Q.; Yang, F.; Huo, W.; Mamtimin, A.; Yang, X.; Wang, Y.; et al. Dust Characteristics Observed by Unmanned Aerial Vehicle over the Taklimakan Desert. Remote Sens. 2022, 14, 990. [Google Scholar] [CrossRef]
  42. Huang, J.P.; Minnis, P.; Yi, Y.H.; Tang, Q.; Wang, X.; Hu, Y.X.; Liu, Z.Y.; Ayers, K.; Trepte, C.; Winker, D. Summer dust aerosols detected from CALIPSO over the Tibetan Plateau. Geophys. Res. Lett. 2007, 34, L18805. [Google Scholar] [CrossRef] [Green Version]
  43. Jia, X. Observation of Ground Temperature at Shallow Layer of Different Dune Types in the Tazhong Area. Arid. Zone Res. 2011, 28, 163–167. [Google Scholar] [CrossRef]
  44. Velasco-Merino, C.; Mateos, D.; Toledano, C.; Prospero, J.M.; Molinie, J.; Euphrasie-Clotilde, L.; Gonzalez, R.; Cachorro, V.E.; Calle, A.; de Frutos, A.M. Impact of long-range transport over the Atlantic Ocean on Saharan dust optical and microphysical properties based on AERONET data. Atmos. Chem. Phys. 2018, 18, 9411–9424. [Google Scholar] [CrossRef] [Green Version]
  45. Mueller, D.; Lee, K.H.; Gasteiger, J.; Tesche, M.; Weinzierl, B.; Kandler, K.; Mueller, T.; Toledano, C.; Otto, S.; Althausen, D.; et al. Comparison of optical and microphysical properties of pure Saharan mineral dust observed with AERONET Sun photometer, Raman lidar, and in situ instruments during SAMUM 2006. J. Geophys. Res. Atmos. 2012, 117, D07211. [Google Scholar] [CrossRef] [Green Version]
  46. Aerosol Robotic Network (AERONET). Publications—Aerosol Robotic Network (AERONET). Available online: https://www.nasa.gov/ (accessed on 23 September 2022).
  47. Tong, X.; Ho, J.M.W.; Li, Z.; Lui, K.H.; Kwok, T.C.Y.; Tsoi, K.K.F.; Ho, K.F. Prediction model for air particulate matter levels in the households of elderly individuals in Hong Kong. Sci. Total Environ. 2020, 717, 135323. [Google Scholar] [CrossRef]
  48. Tan, C.; Chen, Q.; Qi, D.; Xu, L.; Wang, J. A Case Analysis of Dust Weather and Prediction of PM10 Concentration Based on Machine Learning at the Tibetan Plateau. Atmosphere 2022, 13, 897. [Google Scholar] [CrossRef]
  49. Song, Y. Research on the characteristics of dusty weather and floating dust observation standards in Dalian. J. Desert Res. 2010, 30, 1229–1233. [Google Scholar]
  50. Huo, W.; He, Q.; Yang, F.; Yang, X.; Yang, Q.; Zhang, F.; Mamtimin, A.; Liu, X.; Wang, M.; Zhao, Y.; et al. Observed particle sizes and fluxes of Aeolian sediment in the near surface layer during sand-dust storms in the Taklamakan Desert. Theor. Appl. Climatol. 2017, 130, 735–746. [Google Scholar] [CrossRef]
  51. Han, B.; Zhou, T.; Zhou, X.; Fang, S.; Huang, J.; He, Q.; Huang, Z.; Wang, M. A New Algorithm of Atmospheric Boundary Layer Height Determined from Polarization Lidar. Remote Sens. 2022, 14, 5436. [Google Scholar] [CrossRef]
  52. She, L.; Xue, Y.; Guang, J.; Che, Y.; Fan, C.; Li, Y.; Xie, Y. Towards a comprehensive view of dust events from multiple satellite and ground measurements: Exemplified by the May 2017 East Asian dust storm. Nat. Hazards Earth Syst. Sci. 2018, 18, 3187–3201. [Google Scholar] [CrossRef] [Green Version]
  53. Crumeyrolle, S.; Schwarzenboeck, A.; Roger, J.C.; Sellegri, K.; Burkhart, J.F.; Stohl, A.; Gomes, L.; Quennehen, B.; Roberts, G.; Weigel, R.; et al. Overview of aerosol properties associated with air masses sampled by the ATR-42 during the EUCAARI campaign (2008). Atmos. Chem. Phys. 2013, 13, 4877–4893. [Google Scholar] [CrossRef] [Green Version]
  54. Weinzierl, B.; Sauer, D.; Esselborn, M.; Petzold, A.; Veira, A.; Rose, M.; Mund, S.; Wirth, M.; Ansmann, A.; Tesche, M.; et al. Microphysical and optical properties of dust and tropical biomass burning aerosol layers in the Cape Verde region-an overview of the airborne in situ and lidar measurements during SAMUM-2. Tellus Ser. B-Chem. Phys. Meteorol. 2011, 63, 589–618. [Google Scholar] [CrossRef] [Green Version]
  55. Tang, I.N.; Munkelwitz, H.R. Composition and temperature dependence of the deliquescence properties of hygroscopic aerosols. Atmos. Environ. Part A Gen. Top. 1993, 27, 467–473. [Google Scholar] [CrossRef]
  56. Dionisi, D.; Barnaba, F.; Diemoz, H.; Di Liberto, L.; Gobbi, G.P. A multiwavelength numerical model in support of quantitative retrievals of aerosol properties from automated lidar ceilometers and test applications for AOT and PM10 estimation. Atmos. Meas. Tech. 2018, 11, 6013–6042. [Google Scholar] [CrossRef] [Green Version]
Figure 1. The location of Tazhong (TZ), its surrounding area, and a working photo (a) for the unmanned aerial vehicle (UAV) system (b) and surface wind direction and wind speed distribution (c) during the observation period in July 2021.
Remotesensing 15 03556 g001
Figure 2. Time series of (ac) near-surface particulate mass (PM10, PM2.5), particle number concentration (PNC), and total suspended particles (TSP) obtained from the UAV observation system, and (df) temperature, relative humidity (RH), wind direction (WD), wind speed (WS), and pressure in July 2021 in TZ. (The yellow shaded area indicates dusty weather during the observation period. The red and blue dots represent PM2.5 and WD, respectively).
Remotesensing 15 03556 g002
Figure 3. The vertical distribution of PMs (ad) and the ratios of PM10/TSP and PM2.5/PM10 (eh) under clear and dust scenarios in the height range of 10–500 m above ground level during the experiment.
Remotesensing 15 03556 g003
Figure 4. The vertical distribution of PNC, particle effective radius (Reff) and particle volume concentration (Cv) under the four scenarios in the height range of 10–500 m above ground level during the experiment. In detail, floating dust at 13:00 on 31 July (red line), blowing dust at 16:00 on 31 July (blue), sand storms at 19:00 on 17 July (green), and clear sky at 13:00 on 26 July (black).
Remotesensing 15 03556 g004
Figure 5. The particle number size distribution (PNSD) for (a) the averaged distribution with a height of 10–500 m under four scenarios, where the corresponding times are the same as those in Figure 3; and (b) three fine-dust layers: 150 m (red) and 350 m (black) under floating dust, blowing sand at 120 m (blue).
Remotesensing 15 03556 g005
Figure 6. The averaged vertical profiles of PMs, PM10/TSP, and PM2.5/PM10 at 10:00, 13:00, 16:00, 19:00, and 22:00 in the altitude range of 10–500 m above ground level during the experiment. The subfigure (ag) in the upper right corner shows the average values of PMs, PM10/TSP, and PM2.5/PM10 in the 10–500 m range at different observation times.
Remotesensing 15 03556 g006
Figure 7. The same as Figure 6, but for (a) PNC, (b) Reff, and (c) Cv.
Remotesensing 15 03556 g007
Figure 8. The vertical distribution of PMs (ae) and the ratios of PM10/TSP and PM2.5/PM10 (f,g) under the three postprecipitation (P1, P2, and P3) and dust storm scenarios in the height range of 10–500 m above ground level during the experiment. P1 at 10:00 on the July 9th (black line), P2 at 13:00 on the July 13th (red line), P3 at 10:00 the July 20th (blue line), and dust storm at 19:00 on the 31th (green line).
Remotesensing 15 03556 g008
Figure 9. The same as Figure 8, but for (a) PNC, (b) Reff, (c) Cv, (d) T, (e) RH, and (f) WS.
Remotesensing 15 03556 g009
Figure 10. The same as Figure 6, but for postprecipitation scenarios, the averaged distribution is for (a) a range of 10–500 m, (b) below the atmosphere boundary layer, and (c) above the boundary layer, excluding a dust-storm scene.
Remotesensing 15 03556 g010
Table 1. The criteria for identifying four scenarios using PM10.
Clear SkyFloating DustBlowing SandDust Storm
PM10 (μg/m3)0–150150–350350–500>500
Table 2. The mean and standard deviations of PNC, Reff, and Cv under different scenarios.
ParameterFlightsPNC
P/L
Reff
µm
Cv
µm3/µm2
ALL20021,290 ± 30461.47 ± 1.480.16 ± 0.34
Clear sky14914,712 ± 18771.22 ± 1.120.11 ± 0.17
Floating dust3331,034 ± 43911.81 ± 1.860.28 ± 0.60
Blowing sand464,447 ± 15,4002.43 ± 2.130.35 ± 0.47
Dust storm883,297 ± 12,8813.86 ± 1.440.54 ± 0.30
Postprecipitation616,867 ± 28851.86± 2.450.33 ± 0.70
Table 3. The list of aerosol microphysical properties by UAV.
Land TypeSize Range
µm
PNC
P/L
Reff
µm
Cv
µm3/µm2
She et al. (2018) [52]Urban------1–1.8---
Crumeyrolle et al. (2013) [53]Urban ---------0.005–0.47
unpublished resultsUrban 229,7200.870.01
Kezoudi et al. (2021) [37]Forest0.5–50.01000–30,0002.4---
Weinzierl et al. (2011) [54]Desert 0.1–3083,3002.47---
Disclaimer/Publisher’s Note: The statements, opinions and data contained in all publications are solely those of the individual author(s) and contributor(s) and not of MDPI and/or the editor(s). MDPI and/or the editor(s) disclaim responsibility for any injury to people or property resulting from any ideas, methods, instructions or products referred to in the content.