Abstract
The regional and global scale of aerosols in the atmosphere can be quantified using the aerosol optical depth (AOD) retrieved from satellite observations. To obtain reliable satellite AODs, conducting consistent validations and refining retrieval algorithms are crucial. AODs and Ångström exponents (AEs) measured with the aerosol robotic network (AERONET) are considered as the ground truth for satellite validations. AERONET AEs are used to collocate the wavelength of the AERONET AODs to those of the satellite AODs when there is a discordancy in their wavelengths. However, numerous validation studies have proposed different strategies by applying the AERONET AODs and AEs, and spatiotemporal collocation criteria. This study examined the impact of the wavelength and spatial collocation radius variations by comparing AODs at 550 nm derived from the geostationary ocean color imager (GOCI) with those obtained from the AERONET for the year 2016. The estimated AERONET AODs at 550 nm varied from 5.18% to 11.73% depending on the selection of AOD and AE, and the spatial collocation radii from 0 to 40 km, respectively. The longer the collocation radius and the higher the AODs, the greater the variability observed in the validation results. Overall, the selection of the spatial collocation radius had a stronger impact on the variability in the validation results obtained compared to the selection of the wavelength. The variability was also found in seasonal analysis. Therefore, it is recommended to carefully select the data wavelength and spatial collocation radius, consider seasonal effects, and provide this information when validating satellite AODs using AERONET.
1. Introduction
Aerosols, both natural and anthropogenic in origin, are solid and liquid particles suspended in the air. They significantly impact human health [1] and are a major source of uncertainty in estimates of the total radiative forcing, thus affecting the Earth’s radiant energy balance through direct and indirect cooling effects [2]. Therefore, accurate aerosol observations are essential to understand their impacts on climate and human health. In addition, aerosol concentration data is necessary for retrieving reliable, satellite-based trace gas data products and improving satellite retrieval algorithms for air quality-related trace gases [3].
Aerosols are quantified in terms of their aerosol optical depth (AOD), which refers to the integrated extinction by aerosols in the atmospheric column from the surface to the top of the atmosphere. Since the first satellite launch in the 1950s, studies have retrieved AODs using satellite data to overcome limitations in the spatial distribution of ground-based observation data [4]. AODs were retrieved at the near-ultraviolet to visible wavelengths from payloads onboard polar-orbiting satellites, such as the Ozone Monitoring Instrument (OMI) and the Moderate Resolution Imaging Spectroradiometer (MODIS), or visible channels from geostationary satellites, like the Geostationary Ocean Color Imager (GOCI) and the Advanced Meteorological Imager [5,6,7]. Recently, with the launch of the geostationary environment monitoring spectrometer (GEMS), AODs can be obtained using ultraviolet wavelengths with a high spatiotemporal resolution [8].
Retrieved AODs from various sensors depend on their retrieval algorithms. Each product can have a significant systematic bias that contributes to inconsistencies in the AOD products. Additionally, using radiance data at different wavelengths can lead to discrepancies in retrieving the AODs even at the same reference wavelength (e.g., 550 nm). Therefore, to ensure reliable and comparable validation results, unifying the verification of the AODs retrieved from a specific satellite is necessary. AODs derived from satellite observations are usually validated using the aerosol robotic network (AERONET), which provides the ground truth of spectral AODs [9,10]. To validate satellite AOD products, conducting the spectral collocation of AERONET AODs at a particular targeted wavelength, typically at 550 nm, using either interpolation or extrapolation is necessary as AERONET stations measure AODs at various wavelengths, such as 440, 500, and 675 nm, which may not match the desired wavelength of the satellite AOD products. Therefore, the resulting AERONET AODs at the desired target wavelength can vary depending on the selection of the AODs and AE at different wavelengths.
Previous studies have utilized AERONET AODs at various wavelengths and interpolated them to the desired target wavelength to obtain their reference data (Table 1). For example, Remer et al. [11] used AERONET AODs at 440 and 870 nm to verify MODIS AODs at 470 and 550 nm, respectively. Sayer et al. [12] utilized AERONET AODs at 440 and 500 nm and Ångström exponents (AEs) obtained from the AODs at 440 and 870 nm (hereafter, referred to as AE440-870) to verify the MODIS AODs at 550 nm retrieved using the Deep Blue and Dark Target algorithms. Furthermore, Shi et al. [13] verified the MODIS AODs at 550 nm using AERONET AODs at 500 and 670 nm, and Shi et al. [14] applied AODs at 400 and 679 nm together, and 500 nm alone, respectively. Sayer et al. [15,16] used AERONET data at 440 and 500 nm and AE440-870 to verify the SeaWiFS AODs over the land and sea. Park et al. [17] validated the MODIS AODs at 550 nm with the AERONET AODs at 550 nm obtained through interpolating AERONET data at other wavelengths using an AE. AERONET data were also used to validate chemical transport models. For instance, Cesnulyte et al. [18] utilized AERONET data at 500 nm and AE400-870 to interpolate and validate the European Centre for Medium-Range Weather Forecasts reanalysis of AODs at 550 nm. Lee et al. [19] calculated AERONET AODs at 550 nm using logarithmic interpolation from AERONET AODs at 500 and 675 nm, respectively. In the absence of a 675 nm AOD value, they extrapolated from 440 and 500 nm to validate the model-simulated AODs.
In order to validate the satellite AODs with AERONET data, spatiotemporal collocation is also necessary due to the different observation times and locations of each station. Several studies used different collocation radii to verify the satellite AODs using AERONET (i.e, averaging satellite pixels within specific distance from AERONET location). Ichoku et al. [20] proposed a spatiotemporal collocation method for verifying MODIS AODs with AERONET; satellite data were averaged within a 50 km × 50 km space centered on the AERONET site, and AERONET data were averaged within a time window of ±30 min from the MODIS overpass time. This strategy was also applied by Ichoku et al. [21,22], Levy et al. [23], and Petrenko et al. [24]. Furthermore, Shi et al. [13] averaged the AERONET AODs included in each MODIS pixel within the MODIS overpass time and used a one-to-one collocation approach within a 0.1° spatial radius and a ±30 min time window [14]. Sayer et al. [12,25] verified the MODIS Collection 6 AODs with the AERONET AODs after averaging within a radius of 25 km, centering on the 30 min time window and AERONET observation site. Similarly, they verified SeaWiFS aerosol outputs within a 25 km spatial radius and a 30 min time window [15,16]. Kahn et al. [26,27] used a time window of 2 h and averaged over a calculation area of one central and eight surrounding data for the multi-angle imaging spectroradiometer (MISR). Moreover, Ahn et al. [3] used a 40 km spatial radius and a time average within ±10 min for OMI, while Huang et al. [28] used a 27.5 km spatial radius and a temporal collocation time of ±30 min for the Suomi-NPP Visible Infrared Imaging Radiometer Suite (VIIRS). In the case of the GOCI AODs, a spatial average of a 25 km radius centered on the AERONET observation stations and a ± 30 min time window were used [29]. Variogram analysis can also be used to estimate the uncertainty of spatiotemporal collocation between the satellite and AERONET AODs [30].

Table 1.
Summary of the spectral and spatiotemporal criteria for validations of the aerosol optical depth (AOD) products retrieved from the satellite using AERONET.
Table 1.
Summary of the spectral and spatiotemporal criteria for validations of the aerosol optical depth (AOD) products retrieved from the satellite using AERONET.
| Authors | Year | Satellite/Model Dataset Name | Spectral Selections of Aeronet | Spatiotemporal Criteria for Validation |
|---|---|---|---|---|
| Ahn et al. [3] | 2014 | OMI OMAERUV AODs at 388 nm | AOD380 and AOD440 | 40 km spatial radius with a ±10 min time window |
| Cesnulyte et al. [18] | 2014 | ECMWF reanalysis AODs at 550 nm | AOD550 and AE400-870 | 80 km spatial radius with a ±30 min time window |
| Choi et al. [29] | 2019 | GOCI YAER AODs 550 nm | Interpolate AERONET data to the satellite | 25 km spatial radius with a ±30 min time window |
| Huang et al. [28] | 2016 | Suomi-NPP VIIRS AOT at 11 wavelengths and evaluated at 550 nm | AERONET AODs at 10 wavelengths from 340 nm to 870 nm plus 1640 nm | 27.5 km spatial radius with a ±30 min time window |
| Ichoku et al. [20] | 2002 | MODIS AODs at 660 nm | AOD670 | 50 km × 50 km space with a ±30 min time window |
| Ichoku et al. [21] | 2003 | MODIS AODs at 470 and 660 nm | AOD440 and AOD670 | |
| Ichoku et al. [22] | 2005 | MODIS AODs at 470, 550, and 660 nm | AOD440, AOD670, and AOD870 | |
| Kahn et al. [26] | 2005 | MISR AODs | All AERONET AODs | One central and eight surrounding 17.6 km retrieval regions with a 2 h time window |
| Kahn et al. [27] | 2010 | |||
| Lee et al. [19] | 2013 | MODIS, MISR AODs 550 nm, GOCART model AODs 550 nm | AOD500 and AOD675, or AOD440 and AOD500 in the absence of AOD675, or AOD440 and AOD675 in the absence of AOD500 | 2.8° × 2.8° grid |
| Park et al. [17] | 2020 | MODIS AODs at 550 nm | AOD500 | Collocation time and range were tested in this paper |
| Petrenko et al. [24] | 2012 | MODIS Collection 5 AODs | Interpolate AERONET data to the satellite wavelength | 27.5 km spatial radius with ±30 min time window |
| Remer et al. [11] | 2005 | MODIS AODs at 470 and 550 nm | AOD440 and AOD870 | 1° × 1° space |
| Sayer et al. [12] | 2014 | MODIS AODs at 550 nm Deep Blue and Dark Target | AOD440, AOD500, and AE440-870 | 25 km spatial radius with a 30 min time window |
| Sayer et al. [15] | 2012 | SeaWiFS AODs | AOD440, AOD500, and AE440-890 | 25 km spatial radius with a ±30 min time window |
| Sayer et al. [16] | ||||
| Shi et al. [13] | 2011 | MODIS AODs at 550 nm | AOD500 and AOD670 | One-to-one collocation approach within a 0.1° spatial radius with a ±30 min time window |
| Shi et al. [14] | 2011 | MODIS AODs at 550 nm and MISR AODs at 557.5 nm | AOD 440 and AOD 670, or AOD500 |
Although several studies have utilized different combinations of collocation radii and AERONET data wavelengths to validate the satellite AODs, the variability of AERONET AODs based on the spatial and spectral collocations has not been analyzed for satellite data validation. In this study, we examined variations in the validation results of GOCI AODs at 550 nm using AERONET based on various spatial and spectral collocations. We aimed to propose a validation strategy for GOCI AODs. To analyze the effects of the spatial collocation on the validation results, we selected different collocation radii between a GOCI pixel and an AERONET station. Additionally, we compared AERONET AODs at 550 nm derived from various combinations of wavelengths of AODs and AE, with GOCI AODs retrieved at 550 nm to investigate the effect of spectral collocations.
This paper consists of the following sections. Section 2 describes the GOCI data, the AERONET data, and the collocation methods. Section 3 presents the verification results of the GOCI AODs depending on the wavelength combination and the collocation radius of AERONET. Finally, Section 4 summarizes the findings and conclusions of this study.
2. Materials and Methods
2.1. Materials
In this study, GOCI AODs at 550 nm were validated using AERONET AODs at 550 nm derived from various wavelengths of AERONET AODs and AE by adjusting the collocation radii between the GOCI pixels and AERONET stations in 2016 (Figure 1a and Table 2). We selected this year as several additional AERONET stations were installed over East Asia in 2016 to conduct the Korea–United States Air Quality Study (KORUS-AQ), which was a research campaign that aimed to further the understandings of air quality across urban, rural, and coastal areas over the areas [31].
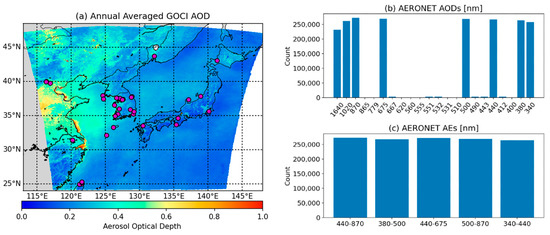
Figure 1.
(a) Annually averaged geostationary ocean color imager (GOCI) aerosol optical depth (AOD) in 2016 and locations of the aerosol robotic network (AERONET) stations (purple circles). The number of data points of (b) the AOD and (c) the Ångström Exponent (AE) in the year of 2016 over the GOCI observation area.
Table 2.
Detailed information of the AERONET stations used in this study.
2.1.1. AERONET
AERONET is a global network of ground-based aerosol measurements using sun–sky radiometers. For over 20 years, it has provided aerosol optical properties, such as AOD, AE, and single-scattering albedo [32]. In particular, AERONET Level 2.0 AODs are quality-assured data with an uncertainty range of 0.01–0.02 [10]. They are commonly used as ground truth values to verify the AODs obtained from the satellite observations and chemical transport model simulations [33,34]. AERONET Version 3.0 data are generally more reliable compared to previous versions of the algorithms (1.0 or 2.0) due to improvements in cloud screening and quality assurance processes [9,35,36]. Therefore, this study utilized the AERONET Version 3.0 Level 2.0 data to validate the satellite AODs.
2.1.2. GOCI
The GOCI is an ocean color sensor launched in the Korean Communication, Ocean, and Meteorological Satellite (COMS) into a geostationary orbit in June 2010. It has six visible and two near-infrared channels for monitoring the optical properties of marine and atmospheric environments over East Asia. GOCI was in operation for over a decade, ending its mission in March 2021. Several studies have been conducted to develop reliable algorithms for producing AODs using GOCI data [37,38]. This study utilized GOCI AODs at 550 nm that were retrieved hourly from 00:00 to 07:30 Coordinated Universal Time (UTC) via version 2 of the Yonsei aerosol retrieval (YAER) algorithm with a spatial resolution of 6 × 6 km2 [37]. In the YAER algorithm, GOCI AODs are retrieved by comparing the measured top-of-atmosphere spectral radiance and the calculated radiance with the assumed aerosol models and estimated surface reflectance, similar to other satellite aerosol products, including MODIS [23]. The retrieved GOCI AOD has an uncertainty range of ±(18% + 0.03) over the ocean, which was estimated from the long-term validation using AERONET over East Asia [38].
2.2. Methods
GOCI AODs at 550 nm were validated with AERONET AODs at 550 nm derived by applying the following spatial and spectral collocations.
2.2.1. Spectral Collocation
AERONET provides aerosol optical properties, such as AODs and AEs, at various wavelengths. While the number of AERONET AOD data (depending on wavelength) varies depending on the observation site, AERONET mainly provides AODs at the eight wavelength bands (340, 380, 440, 500, 675, 870, 1020, and 1640 nm, respectively), as shown in Figure 1b, and AE data obtained from AODs at different wavelength pairs, including 440 and 870 nm (AE440-870), 380 and 500 nm (AE380-500), 440 and 675 nm (AE440-675), 500 and 870 nm (AE550-870), and 340 and 449 nm (AE340-449), respectively, as depicted in Figure 1c.
The AE indicates a spectral dependence of aerosol extinction and is calculated from AODs at different wavelengths using Equation (1). The AE is inversely related to the aerosol particle size [39] and is commonly used to interpolate or extrapolate AODs for a desired wavelength [40]. Equation (2) allows AOD calculations to be made for a desired wavelength band (in this case, 550 nm) when AOD λ and AE α are available [15,25,41].
AE does not vary linearly depending on the wavelength, and a second-order polynomial equation is more reliable [42]. However, to obtain AERONET AODs at a different wavelength, previous studies have commonly used the linear regression of the logarithm of the power equation [11,12,13,15,16]. Kahn et al. [27] verified the MISR aerosol output by interpolating the relationship of the AODs according to the wavelength with a second-order polynomial fit, as Lee et al. [34] suggested. Similarly, AERONET AODs at 10 wavelengths were used to validate AODs derived from VIIRS observation at 11 channels via the second-order polynomial fitting [28].
To investigate for the effect of spectral dependency in the validation results of the satellite data, this study applied 16 combinations of the most frequently obtained AODs at 4 wavelengths (440, 500, 675, and 870 nm) with AE440-675 and AE440-870 to calculate AERONET AODs at 550 nm, as shown in Figure 2.
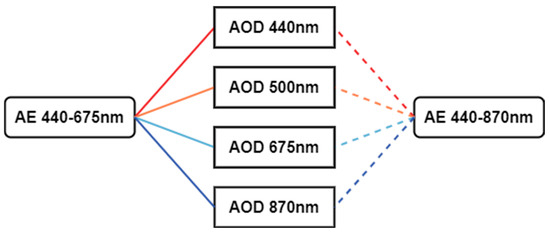
Figure 2.
Schematic diagram of the AOD and AE pairs of AERONET that were used to calculate the AOD at 550 nm for validating the GOCI AOD at 550 nm. Solid and dashed lines are pairs using AE440-675 and AE440-870, respectively.
2.2.2. Spatial Collocation
Different collocation radii have been used to compare the spatiotemporal collocations of the satellite and AERONET data. Ichoku [20] proposed a method for verifying the MODIS AODs with a grid resolution of 10 × 10 km2 using AERONET. MODIS provides global coverage once or twice a day, while AERONET performs continuous time-to-time observations at one site. To minimize the impact of cloud contamination, satellite data were averaged within a 50 km × 50 km space centered at the AERONET observation site, and AERONET data were averaged within a time window of ± 30 min from the MODIS overpass time. Representative spatiotemporal scale analysis was conducted for AODs together with the relevant gas observations that were obtained from the ground-based remote sensing platforms [17]. Several studies have applied this strategy to verify MODIS AODs using AERONET [21,22,23,24].
Meanwhile, Shi et al. [13] averaged the AERONET data within the MODIS overpass time to compare the Collection 5 MODIS AODs with AERONET. For spatial collocations, they averaged AERONET AODs included in each MODIS pixel instead of averaging the data by applying a certain radius between the MODIS pixels and the AERONET stations. Shi et al. [14] used one-to-one collocated MODIS/MISR (Level 2) and AERONET AODs within ±30 min in time and 0.1° in space for the 2000–2007 period. In addition, Sayer et al. [12,25] verified the MODIS Collection 6 AODs with AERONET AODs after averaging within a radius of 25 km, centered at the AERONET observation site within 30 min.
For the SeaWiFS aerosol outputs, the average within a 25 km radius within 30 min was applied for their verification [15,16]. The MISR data were averaged over the calculation area of one central and eight surrounding data within 17.6 km, and a time window of 2 h was applied for temporal collocation [26,27]. To verify the OMI aerosol products, pixels within a 40 km radius were averaged, and time averages within ±10 min were used [3]. For verifying the VIIRS aerosol products, Huang et al. [28] averaged by applying a spatial collocation radius of 27.5 km and a temporal collocation time of ±30 min. In the case of GOCI AODs [29], which were applied in this study, verification was conducted by applying a spatial average of a radius of 25 km centered on the AERONET observation stations and a ±30 min time window using the method proposed by Sayer et al. [25].
In this study, verification was performed using a collocation radius ranging from 0 to 40 km by 5 km intervals, where 0 km means the pixel area including the AERONET station (hereafter referred to as 0 km between the AERONET station and the GOCI pixel). As in previous studies, the AERONET AODs within ±30 min of the GOCI data were averaged for the temporal collocation to validate the GOCI AODs.
3. Results
3.1. Annual Analysis
Figure 3 shows the spatial and spectral dependencies in the validation results of the GOCI AODs at 550 nm using the AERONET AODs at 550 nm in 2016. The spatial collocation of the satellite data was performed by averaging them over pixels within the radius from 0 to 40 km with a spatial interval of 5 km from the AERONET station. A search radius of 0 km indicates the use of one pixel of the satellite data where the AERONET station is located.
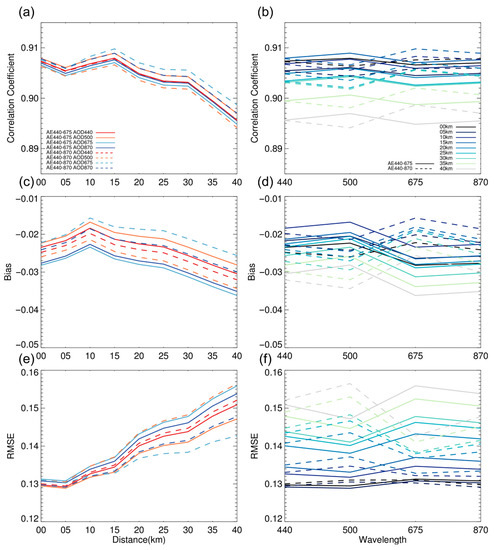
Figure 3.
Statistical results for retrieving AERONET AODs at 550 nm using AE440-675 and AE440-870 depending on various collocation radii (a,c,e) and wavelengths (b,d,f) using the original AERONET AODs to validate the GOCI AODs at 550 nm in 2016.
Based on the verification results, we found an overall tendency where the correlation coefficient (R) decreased, while the bias and root mean square error (RMSE) tended to increase as the collocation radius was widened. This can be attributed to the frequent inclusions of satellite data with uncertainties potentially caused by cloud contamination or bright surfaces during the retrieval process, and different aerosol mass properties from those observed by AERONET when a wider collocation radius was chosen. However, upon closer examination of Figure 3a within the collocation radius range of 5 to 15 km, representing a relatively short distance between AERONET and the satellite, the opposite trend was shown with an increased R as the collocation radius increased. This indicates that the short collocation radius can mitigate the effects of variability of aerosol properties in validations by yielding a strong correlation between the GOCI AODs at/near the AERONET pixel and AERONET data within the collocation radii near the satellite’s spatial resolution (6 by 6 km2). The overall average R was 0.904, and the highest R of 0.908 was observed at a collocation radius of 15 km, followed by 0.907 at 0 km, respectively. The overall average bias was −0.025; the bias tended to increase negatively as the collocation radius increased, and the collocation radius of 10 km had the minimum absolute bias. The overall average RMSE was 0.139, which slightly decreased to 0.130 at 5 km, and then increased with the collocation radius. This analysis revealed a high correlation between the GOCI and AERONET AODs at the collocation radii of 10 and 15 km, with relatively small differences observed. Examining the results of the wavelength combination by radius, the statistical difference between the values of the wavelength combination increased as the radius increased, as prominently reflected in the RMSE. This finding suggests that the wavelength combination of AERONET used for interpolation has a greater impact on the validation results when the collocation radius is increased.
Figure 3b presents the validation results of the calculated AODs at 550 nm using AERONET AODs at different wavelengths (hereafter referred to as AOD440, AOD500, AOD675, and AOD870, respectively) and applying either AE440-675 or AE440-870. At a collocation radius of 15 km, the R of the AOD675/AE440-870 pair was higher at 0.910, followed by AOD500/AE440-675 at 0.909; the lowest R was for the AOD500/AE440-870 and AOD675/AE440-675 pairs. However, as the overall difference observed was in the order of 10−3; it slightly varied comparing to the difference caused by spatial collocation. This implies that validating the satellite AODs using AERONET AODs is more dependent on the collocation radius than the wavelength.
3.2. Seasonal Analysis
We evaluated the seasonal variations in the validation results of GOCI AODs at 550 nm using AERONET AODs at 550 nm, derived by applying various collocation radii and spectral combinations. As shown in Figure 4, R decreased while the bias and RMSE increased as the collocation radius widened. The R was highest in the fall period (September–October–November), followed by summer (June–July–August), spring (March–April–May), and winter (December–January–February), respectively, while the bias was lowest in fall, and the RMSE was lowest in winter. Notably, R increased as the collocation radius increased in winter, and decreased with the collocation radius during other seasons. Additionally, the negative bias increased with the collocation radius during the different seasons except for fall, which showed a decreasing positive bias with the collocation radius. As the collocation radius increased, the RMSE also increased significantly in the summer and fall compared with the other seasons, and the deviation caused by selecting AE440-675 or AE440-870 also increased as a result.
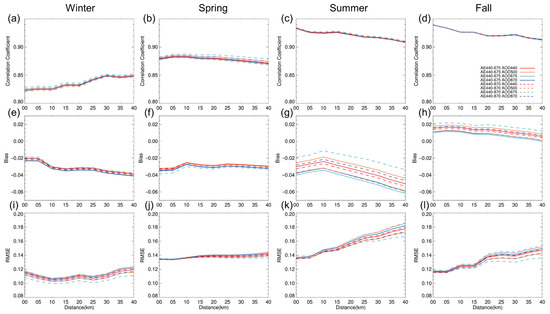
Figure 4.
Seasonal analysis of the validation results of GOCI AODs at 550 nm using AERONET AODs at 550 nm based on the collocation radii in (a,e,i) winter (December–January–February), (b,f,j) spring (March–April–May), (c,g,k) summer (June–July–August), and (d,h,l) fall (September–October–November) in the year of 2016.
The seasonal analysis showed that the differences in the statistical values obtained based on the wavelength combinations (Figure 5) were not as large as those based on the collocation radii. However, deviations in the bias and RMSE caused by spectral dependence were quite prominent in the summer and fall compared with those in the spring and winter. Combinations of AOD500/AE440-870 or AOD675/AE440-675 had the smallest bias and RMSE in the summer and fall.
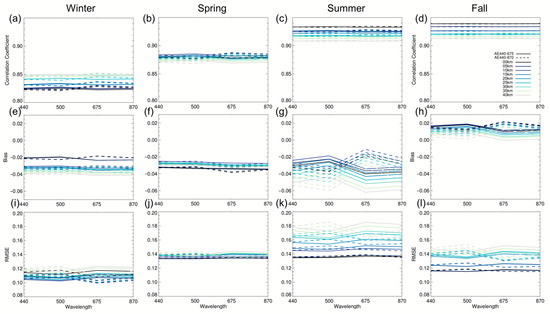
Figure 5.
Seasonal analysis of the validation results of GOCI AODs at 550 nm using AERONET AODs at 550 nm based on the AOD wavelengths of AERONET in (a,e,i) winter (December–January–February), (b,f,j) spring (March–April–May), (c,g,k) summer (June–July–August), and (d,h,l) fall (September–October–November) in the year of 2016.
Figure 6 displays the scatter plots of the annual and seasonal statistical values, yielding overall tendencies in that the R decreases and the RMSE increases as the collocation radius increases. The annual analysis did not reveal any seasonal tendencies as it yielded similar R and RMSE values based on the collocation radii (Figure 6a). As shown in Figure 6b, the seasonal scatter plots consist of four distinct clusters marked with magenta dashed lines. The variance of the eight wavelength combinations varied by season compared to the annual average. Although summer showed the highest R-value distribution (understandably due to the wider retrieved AOD range), it also displayed a horizontally wide RMSE value range, suggesting that in summer, the bias of the statistical value increases for each wavelength combination and collocation radius. The distribution of statistical values in fall was similar to that observed in summer, but with slightly higher R and lower RMSE values. In winter, the lowest R value and RMSE were found, and there were notable variations in R across the different collocation radii. The widespread distributions of these statistical values depending on the collocation radius emphasize the importance of carefully selecting the AERONET wavelength combination for the satellite validations and analysis, particularly in studies focusing on high concentrations of aerosols, which can originate from both transport and domestic sources over the Korean Peninsula during the winter season. Among the four seasons, spring exhibited the least pronounced differences in the statistical values with respect to the collocation radii. Therefore, these statistics can differ by season, wavelength combination, and collocation radius, and hence, care should be taken when directly comparing the verification results of the satellite data with AERONET.
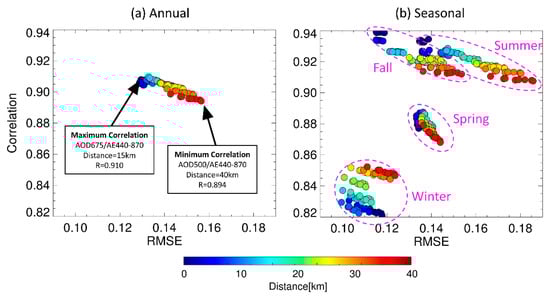
Figure 6.
Scatter plots of the correlation coefficient (R) and root mean square error (RMSE) between the GOCI and AERONET AODs at 550 nm, colored by collocation radii for (a) annual and (b) seasonal results in the year of 2016.
3.3. Analysis of High AOD Cases
During the summer season, high humidity can lead to an increase in the AOD values due to the accelerated growth of hygroscopic aerosols [24]. As addressed in Section 3.2, the statistical bias during summer was found to be greater compared to the other seasons. Furthermore, high concentrations of aerosols over the Korean Peninsula can be attributed to both long-range transported pollution or yellow dust from abroad [29] and domestically-originated pollution from various anthropogenic sources, including industrial activities and transportation. Considering the significance of a high AOD, this section aims to investigate the impacts of high AODs on the variations in the wavelength combinations and collocation radii.
The same analysis was conducted by dividing the high AODs Into two cases—AODs ≥0.5 and ≥1.0, respectively. As AODs increased, R decreased, bias increased positively, and RMSE increased. Notably, this tendency of change observed in these statistical values was more prominent in high AODs with an increasing collocation radii. Although the RMSE ranged from 0.13 to 0.16 for all AODs, its range expanded from 0.18 to 0.29 at AODs ≥ 0.5, and from 0.21 to a maximum of 0.42 at AODs ≥ 1.0, respectively (Figure 7). In the overall AOD, the distribution of R ranged from 0.89 to 0.91, but these values continued to decrease and spread further from 0.81 to 0.89 in AODs ≥ 0.5, and from 0.70 to 0.87 in AODs ≥ 1.0, respectively.
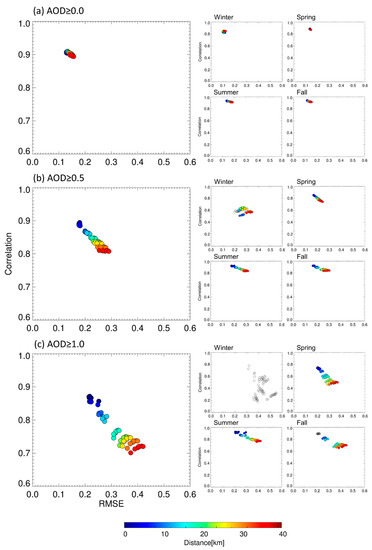
Figure 7.
Scatter plots of R against the RMSE between the GOCI and AERONET AODs at 550 nm, colored by the collocation radius for annual (left) and seasonal (right) results for (a) AOD ≥ 0, (b) AOD ≥ 0.5, and (c) AOD ≥ 1.0, respectively.
The analysis of seasonal differences was conducted using the same approach. First, the number of collocations collected for each season was examined. Figure 8 shows the number of AERONET and GOCI collocations depending on the collocation radii of up to 40 km, representing the seasonal count number of collocations for all AODs, AODs ≥ 0.5, and AODs ≥ 1.0. In all seasons, the number of collected collocations increased as the collocation radii increased. Notably, the higher the AOD, the higher the number of collocations observed in the summer than in the spring, suggesting that high-concentration aerosols were most frequently observed in the summer of 2016 when the KORUS-AQ campaign was conducted. Eck et al. [36] showed that the highest AOD days were observed on the cloudy and foggy days associating with the high humidity in the Yellow Sea during the campaign period. Furthermore, during the winter, a minimum of seven and a maximum of fifty-five collocations were observed for the total collocation radius when the AOD ≥ 1.0 (Figure 8c). However, as the sample size was not statistically significant, statistical values calculated with samples <100 were denoted with unfilled dots in Figure 8. Based on the distribution of these seasonal statistics by the concentration and season, R decreased, and the RMSE increased in all seasons when the AOD ≥ 1.0, with the range of R and RMSE expanding more widely than when the AOD ≥ 0.5. In spring, the variance increased for each wavelength combination as the collocation distance increased compared to the other seasons. In contrast, for the summer and fall, the difference in the RMSE was more significant than for the difference in each wavelength combination depending on the collocation radii.
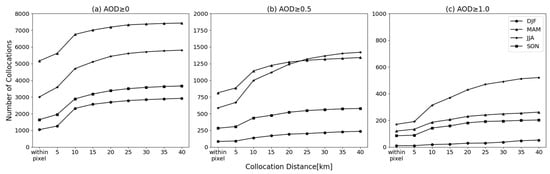
Figure 8.
The number of collocated points used for calculating the statistics displayed in Figure 7 for (a) AOD ≥ 0, (b) AOD ≥ 0.5, and (c) AOD ≥ 1.0, respectively.
Therefore, for the verification of high AODs, close attention should be paid to the selection of collocation radii and the combination of AERONET wavelengths used to derive AERONET AODs at 550 nm, as the statistical analysis results vary depending on these factors.
3.4. Statistical Matrices
In this study, AODs at 550 nm were calculated by either interpolating or extrapolating eight wavelength combinations of AERONET, and the AOD values of GOCI and AERONET were compared for a total of nine different spatial radii from within-pixel (0 km) to the radius of 40 km based on the GOCI AOD pixels. In this section, seventy-two results for the eight wavelength combinations and nine collocation radii were presented as statistical matrices. Unlike Section 3.2, which focused on the collocation radius, the distribution of statistical values, such as R, RMSE, and bias was analyzed with a focus on the wavelength combination.
First, we compared the average AOD values for each pair of GOCI and AERONET used in the comparison and for each collocation radius. Figure 9c shows the difference rate between the average GOCI AOD (Figure 9a) and the collocated AERONET AOD (Figure 9b). This was obtained by calculating the percentile of AERONET AOD compared to the GOCI AOD for each wavelength combination and collocation radius. Fluctuations were observed depending on the wavelength and collocation radius, ranging from a minimum of 5.18% to a maximum of 11.73%, respectively. Overall, the difference in the GOCI value increased as the collocation radius increased. The smallest difference was observed in AOD675/AE440-870 at a collocation radius of 10 km, while the largest difference was noted in AOD675/AE440-675 at a collocation radius of 40 km, respectively. At high concentrations, the difference fluctuated from −2.28% to 15.56% for AODs ≥ 0.5, and from −6.64% to 19.51% for AODs≥ 1.0, respectively.
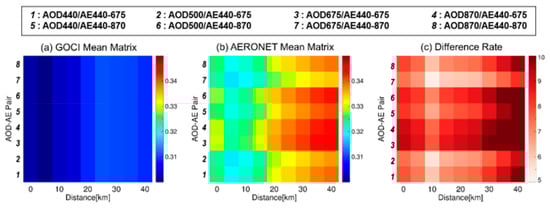
Figure 9.
Color matrices of the averaged and collocated AODs depending on the collocation radii and wavelength pairs for (a) GOCI, (b) AERONET, and (c) the difference rate between them for all AOD values.
Based on the pattern distribution of the averaged AODs in Figure 9, GOCI exhibited varying values of collocated data for each wavelength, even at the same collocation radii. However, the results were generally similar, with only slight variations observed in the averaged values. The AODs tended to increase slightly with the increasing collocation radius, except for at 0 km (within-pixel). Similarly, AERONET AOD values tended to increase as the collocation radius increased, except for the 0 km radius. Among the different wavelength combinations, the AOD500/AE440-675 and AOD675/AE440-870 combinations showed less variation and differences with the changing collocation radius compared to that of the other combinations. Furthermore, the difference rates between the two values showed a similar distribution to the AERONET AODs.
Figure 10 shows the distribution of R, bias, and RMSE for all AODs. As mentioned in Section 3.1, a relatively high R, a low bias, and a low RMSE were obtained from the AOD500/AE440-675 and AOD675/AE440-870 combinations. Furthermore, variations concerning the collocation radii were found to be less than those found in other wavelength combinations, indicating that in verifying the GOCI using the AERONET AODs, the above two combinations tended to be less affected by the collocation radii than the wavelength variation. The analysis of the distribution of these statistics by concentration is also shown in Figure 10. Consistent with the findings in Section 3.3, the change in statistics was more pronounced in the wavelength and collocation radii with increasing AODs. The two wavelength combinations AOD500/AE440-675 and AOD675/AE440-870 showed lower R values compared to the other wavelength combinations in Figure 10d,e, and displayed a greater difference at AODs ≥ 1.0 than AODs ≥ 0.5. In contrast, the bias of the two wavelengths was positively higher than that of the other wavelength combinations, and the RMSE was lower. These results were more evident at high AODs.
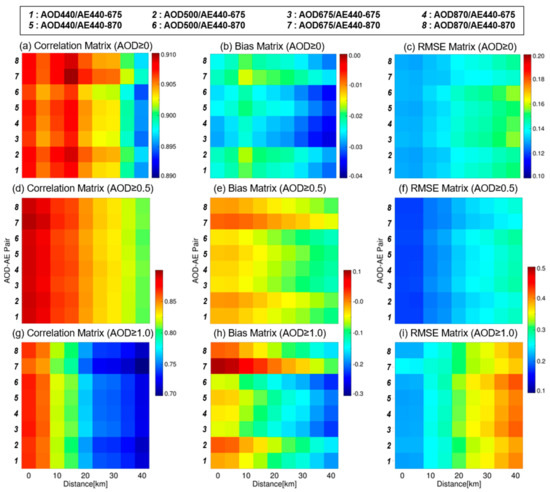
Figure 10.
Statistical matrices of the correlation coefficient (R) (a,d,g), bias (b,e,h), and root mean square error (RMSE) (c,f,i) for AOD interpolation, arranged depending on the collocation radii, spectral combinations, and the range of AOD values.
4. Summary and Conclusions
This study compared and analyzed the validation results of GOCI AODs at 550 nm using AERONET AODs at the same wavelength to investigate the spectral and spatial dependencies of AERONET AODs for the year 2016. The AERONET AODs at 550 nm were interpolated using these AERONET AODs at various wavelengths and AEs. For the spectral dependency, eight combinations were applied using four AERONET AOD wavelengths (440, 500, 675, and 870 nm, respectively) and two AEs (AE440-675 and AE440-870). To investigate spatial dependency, the validation results of the GOCI AODs using AERONET AODs were obtained at nine collocation radii ranging from the AERONET site entering the satellite grid (0 km) to 40 km at 5 km intervals. Therefore, in this study, seventy-two combinations (eight wavelength combinations multiplied by nine collocation radii) of AERONET AODs at 550 nm were used to validate the GOCI AODs at 550 nm. The validation results were statistically analyzed using R, RMSE, and bias under both annual and seasonal time scales and for all AOD values and high AOD cases.
Here are the key findings from our study:
- Spectral dependency: the linear interpolation of AODs at 550 nm using AOD500/AE440-675 and AOD675/AE440-870 yielded the highest R, lowest RMSE, and most near-zero biases. These two wavelength combinations showed less statistical changes compared with other wavelength combinations, even when the collocation radius was increased. They also demonstrated a consistent performance at high AODs. Therefore, the results were relatively comparable when AODs at 550 nm were interpolated with the above combinations;
- Spatial dependency: the collocation radius between 10 to 15 km showed the highest R and the lowest RMSE based on the GOCI pixel center with a resolution of 6 km × 6 km. Further increasing the collocation radius led to a decrease in R and an increase in the RMSE. The bias was primarily negative but showed relatively positive values during the summer season when AOD concentrations were high. Furthermore, the negative bias increased as the collocation radius increased;
- The impact of the collocation radius on the variability in the statistical values obtained was greater than that of the difference observed with the wavelength combinations. Previous studies have suggested that the uncertainty in interpolating the AODs into a target wavelength using AODs at different wavelength bands was negligible [12]. However, our study found that the variance in these statistical values for each wavelength combination increased as the collocation radius increased. This suggests that the choice of wavelength combination can have a greater impact on the verification results when using data with a wider collocation radius. This tendency was more pronounced when analyzing high AODs or during the summer season, as well as with a larger collocation radii. Therefore, specifying the wavelength combination and spatiotemporal collocation used in the interpolation of the AERONET AODs has been recommended to improve the consistency in various satellite validation studies.
The variability in the satellite AOD validation results obtained due to the spectral and spatial dependencies of the AERONET data highlights the importance of carefully selecting the wavelength and collocation radius when interpolating the AERONET AODs into a target wavelength. Additionally, the “best” selection of wavelengths and collocation radii can vary for different satellites based on their characteristics, including their spatial resolution and target wavelengths for observations.
Our results can be used as a preliminary guideline for validating satellites with similar spectral and spatiotemporal specification, but further investigations should be conducted for other satellites with different characteristics, given the complexity of measurements, in addition to the complicated aerosol chemistry and microphysics. In this sense, we plan to expand our analysis by investigating the spectral and spatial dependencies of validation for GEMS AODs at ultraviolet wavelengths using AERONET data and comparing their outcomes with those acquired from GOCI. This will help to further enhance aerosol algorithms and improve our ability to interpret geostationary satellite observations.
Author Contributions
Conceptualization, M.K. and K.L.; methodology, M.K. and K.L.; software, M.K.; validation, M.K.; investigation, M.K., K.L. and M.C.; formal analysis, M.K. and K.L.; GOCI AOD data production, M.C.; writing—original draft preparation, M.K. and K.L.; visualization, M.K.; review and editing, M.K., K.L. and M.C.; supervision, K.L.; project administration, K.L. All authors have read and agreed to the published version of the manuscript.
Funding
This work was supported by a grant from the National Institute of Environment Research (NIER) and funded by the Ministry of Environment (MOE) of the Republic of Korea (NIER-2023-01-01-023).
Data Availability Statement
GOCI data were provided by the Korea Institute of Ocean Science Technology (KIOST) with an algorithm developed by the Atmospheric Radiation Laboratory at Yonsei University. The AERONET AODs were provided by the National Aeronautics and Space Administration (NASA) at https://aeronet.gsfc.nasa.gov, accessed on 26 May 2023.
Acknowledgments
The authors sincerely appreciate the hard work of all researchers who have been involved in the satellite and AERONET observations. We would like to express our special thanks to Prof. Jhoon Kim of Yonsei University for his contribution in developing the GOCI AOD algorithm and for his valuable advice and comments on our work and paper.
Conflicts of Interest
The authors declare no conflict of interest.
References
- Pope, C.A., III; Burnett, R.T.; Thun, M.J.; Calle, E.E.; Krewski, D.; Ito, K.; Thurston, G.D. Lung Cancer, Cardiopulmonary Mortality, and Long-Term Exposure to Fine Particulate Air Pollution. JAMA 2002, 287, 1132–1141. [Google Scholar] [CrossRef] [PubMed]
- Parry, M.; Canziani, O.; Palutikof, J.; Van der Linden, P.; Hanson, C. Climate Change 2007-Impacts, Adaptation and Vulnerability: Working Group II Contribution to the Fourth Assessment Report of the IPCC; Cambridge University Press: Cambridge, UK, 2007; ISBN 9780521880107. [Google Scholar]
- Ahn, C.; Torres, O.; Jethva, H. Assessment of OMI near-UV aerosol optical depth over land. J. Geophys. Res. Atmos. 2014, 119, 2457–2473. [Google Scholar] [CrossRef]
- King, M.D.; Kaufman, Y.J.; Tanré, D.; Nakajima, T. Remote Sensing of Tropospheric Aerosols from Space: Past, Present, and Future. Bull. Am. Meteorol. Soc. 1999, 80, 2229–2260. [Google Scholar] [CrossRef]
- Levelt, P.F.; Joiner, J.; Tamminen, J.; Veefkind, J.P.; Bhartia, P.K.; Zweers, D.C.S.; Duncan, B.N.; Streets, D.G.; Eskes, H.; Van Der, A.R.; et al. The Ozone Monitoring Instrument: Overview of 14 years in space. Atmos. Chem. Phys. 2018, 18, 5699–5745. [Google Scholar] [CrossRef]
- Levy, R.C.; Mattoo, S.; Munchak, L.A.; Remer, L.A.; Sayer, A.M.; Patadia, F.; Hsu, N.C. The Collection 6 MODIS aerosol products over land and ocean. Atmos. Meas. Tech. 2013, 6, 2989–3034. [Google Scholar] [CrossRef]
- Lee, J.; Kim, J.; Song, C.H.; Ryu, J.-H.; Ahn, Y.-H.; Song, C.K. Algorithm for retrieval of aerosol optical properties over the ocean from the Geostationary Ocean Color Imager. Remote Sens. Environ. 2010, 114, 1077–1088. [Google Scholar] [CrossRef]
- Kim, J.; Jeong, U.; Ahn, M.-H.; Kim, J.H.; Park, R.J.; Lee, H.; Song, C.H.; Choi, Y.-S.; Lee, K.-H.; Yoo, J.-M.; et al. New Era of Air Quality Monitoring from Space: Geostationary Environment Monitoring Spectrometer (GEMS). Bull. Am. Meteorol. Soc. 2020, 101, E1–E22. [Google Scholar] [CrossRef]
- Holben, B.N.; Eck, T.F.; Slutsker, I.; Tanré, D.; Buis, J.P.; Setzer, A.; Vermote, E.; Reagan, J.A.; Kaufman, Y.J.; Nakajima, T.; et al. AERONET—A federated instrument network and data archive for aerosol characterization. Remote Sens. Environ. 1998, 66, 1–16. [Google Scholar] [CrossRef]
- Eck, T.F.; Holben, B.N.; Reid, J.S.; Dubovik, O.; Smirnov, A.; O’Neill, N.T.; Slutsker, I.; Kinne, S. Wavelength dependence of the optical depth of biomass burning, urban, and desert dust aerosols. J. Geophys. Res. Atmos. 1999, 104, 31333–31349. [Google Scholar] [CrossRef]
- Remer, L.A.; Kaufman, Y.J.; Tanré, D.; Mattoo, S.; Chu, D.A.; Martins, J.V.; Li, R.R.; Ichoku, C.; Levy, R.C.; Kleidman, R.G.; et al. The MODIS aerosol algorithm, products, and validation. J. Atmos. Sci. 2005, 62, 947–973. [Google Scholar] [CrossRef]
- Sayer, A.M.; Munchak, L.A.; Hsu, N.C.; Levy, R.C.; Bettenhausen, C.; Jeong, M.-J. MODIS Collection 6 aerosol products: Comparison between Aqua’s e-Deep Blue, Dark Target, and “merged” data sets, and usage recommendations. J. Geophys. Res. Atmos. 2014, 119, 13965–13989. [Google Scholar] [CrossRef]
- Shi, Y.; Zhang, J.; Reid, J.S.; Holben, B.; Hyer, E.J.; Curtis, C. An analysis of the collection 5 MODIS over-ocean aerosol optical depth product for its implication in aerosol assimilation. Atmos. Chem. Phys. 2011, 11, 557–565. [Google Scholar] [CrossRef]
- Shi, Y.; Zhang, J.; Reid, J.S.; Hyer, E.J.; Eck, T.F.; Holben, B.N.; Kahn, R.A. A critical examination of spatial biases between MODIS and MISR aerosol products–application for potential AERONET deployment. Atmos. Meas. Tech. 2011, 4, 2823–2836. [Google Scholar] [CrossRef]
- Sayer, A.M.; Smirnov, A.; Hsu, N.C.; Munchak, L.A.; Holben, B.N. Estimating marine aerosol particle volume and number from Maritime Aerosol Network data. Atmos. Chem. Phys. 2012, 12, 8889–8909. [Google Scholar] [CrossRef]
- Sayer, A.M.; Hsu, N.C.; Bettenhausen, C.; Jeong, M.-J.; Holben, B.N.; Zhang, J. Global and regional evaluation of over-land spectral aerosol optical depth retrievals from SeaWiFS. Atmos. Meas. Tech. 2012, 5, 1761–1778. [Google Scholar] [CrossRef]
- Park, S.S.; Kim, S.-W.; Song, C.-K.; Park, J.-U.; Bae, K.-H. Spatio-temporal variability of aerosol optical depth, total ozone and NO2 over East Asia: Strategy for the validation to the GEMS Scientific Products. Remote Sens. 2020, 12, 2256. [Google Scholar] [CrossRef]
- Cesnulyte, V.; Lindfors, A.V.; Pitkänen, M.R.A.; Lehtinen, K.E.J.; Morcrette, J.-J.; Arola, A. Comparing ECMWF AOD with AERONET observations at visible and UV wavelengths. Atmos. Chem. Phys. 2014, 14, 593–608. [Google Scholar] [CrossRef]
- Lee, K.; Chung, C.E. Observationally-constrained estimates of global fine-mode AOD. Atmos. Chem. Phys. 2013, 13, 2907–2921. [Google Scholar] [CrossRef]
- Ichoku, C.; Chu, D.A.; Mattoo, S.; Kaufman, Y.J.; Remer, L.A.; Tanré, D.; Slutsker, I.; Holben, B.N. A spatio-temporal approach for global validation and analysis of MODIS aerosol products. Geophys. Res. Lett. 2002, 29, 8006. [Google Scholar] [CrossRef]
- Ichoku, C.; Remer, L.A.; Kaufman, Y.J.; Levy, R.; Chu, D.A.; Tanré, D.; Holben, B.N. MODIS observation of aerosols and estimation of aerosol radiative forcing over southern Africa during SAFARI 2000: MODIS observation of aerosols during Safari 2000. J. Geophys. Res. Atmos. 2003, 108, D13. [Google Scholar] [CrossRef]
- Ichoku, C.; Remer, L.A.; Eck, T.F. Quantitative evaluation and intercomparison of morning and afternoon Moderate Resolution Imaging Spectroradiometer (MODIS) aerosol measurements from Terra and Aqua. J. Geophys. Res. Atmos. 2005, 110, D10. [Google Scholar] [CrossRef]
- Levy, R.C.; Remer, L.A.; Kleidman, R.G.; Mattoo, S.; Ichoku, C.; Kahn, R.; Eck, T.F. Global evaluation of the Collection 5 MODIS dark-target aerosol products over land. Atmos. Chem. Phys. 2010, 10, 10399–10420. [Google Scholar] [CrossRef]
- Petrenko, M.; Ichoku, C.; Leptoukh, G. Multi-sensor Aerosol Products Sampling System (MAPSS). Atmos. Meas. Tech. 2012, 5, 913–926. [Google Scholar] [CrossRef]
- Sayer, A.M.; Hsu, N.C.; Bettenhausen, C.; Jeong, M.J. Validation and uncertainty estimates for MODIS Collection 6 “Deep Blue” aerosol data: Deep blue collection 6 validation. J. Geophys. Res. Atmos. 2013, 118, 7864–7872. [Google Scholar] [CrossRef]
- Kahn, R.A.; Gaitley, B.J.; Martonchik, J.V.; Diner, D.J.; Crean, K.A.; Holben, B. Multiangle Imaging Spectroradiometer (MISR) global aerosol optical depth validation based on 2 years of coincident Aerosol Robotic Network (AERONET) observations. J. Geophys. Res. Atmos. 2005, 110, D10. [Google Scholar] [CrossRef]
- Kahn, R.A.; Gaitley, B.J.; Garay, M.J.; Diner, D.J.; Eck, T.F.; Smirnov, A.; Holben, B.N. Multiangle Imaging SpectroRadiometer global aerosol product assessment by comparison with the Aerosol Robotic Network. J. Geophys. Res. Atmos. 2010, 115, D23209. [Google Scholar] [CrossRef]
- Huang, J.; Kondragunta, S.; Laszlo, I.; Liu, H.; Remer, L.A.; Zhang, H.; Superczynski, S.; Ciren, P.; Holben, B.N.; Petrenko, M. Validation and expected error estimation of Suomi-NPP VIIRS aerosol optical thickness and Ångström exponent with AERONET: Validation of VIIRS Aerosol Products. J. Geophys. Res. Atmos. 2016, 121, 7139–7160. [Google Scholar] [CrossRef]
- Choi, M.; Lim, H.; Kim, J.; Lee, S.; Eck, T.F.; Holben, B.N.; Garay, M.J.; Hyer, E.J.; Saide, P.E.; Liu, H. Validation, comparison, and integration of GOCI, AHI, MODIS, MISR, and VIIRS aerosol optical depth over East Asia during the 2016 KORUS-AQ campaign. Atmos. Meas. Tech. 2019, 12, 4619–4641. [Google Scholar] [CrossRef]
- Sayer, A.M. How Long Is Too Long? Variogram Analysis of AERONET Data to Aid Aerosol Validation and Intercomparison Studies. Earth Space Sci. 2020, 7, e2020EA001290. [Google Scholar] [CrossRef]
- Crawford, J.H.; Ahn, J.-Y.; Al-Saadi, J.; Chang, L.; Emmons, L.K.; Kim, J.; Lee, G.; Park, J.-H.; Park, R.J.; Woo, J.H.; et al. The Korea–United States Air Quality (KORUS-AQ) field study. Elem. Sci. Anth. 2021, 9, 00163. [Google Scholar] [CrossRef]
- Giles, D.M.; Sinyuk, A.; Sorokin, M.G.; Schafer, J.S.; Smirnov, A.; Slutsker, I.; Eck, T.F.; Holben, B.N.; Lewis, J.R.; Campbell, J.R.; et al. Advancements in the Aerosol Robotic Network (AERONET) Version 3 database–Automated near-real-time quality control algorithm with improved cloud screening for Sun photometer aerosol optical depth (AOD) measurements. Atmos. Meas. Tech. 2019, 12, 169–209. [Google Scholar] [CrossRef]
- Holben, B.N.; Kim, J.; Sano, I.; Mukai, S.; Eck, T.F.; Giles, D.M.; Schafer, J.S.; Sinyuk, A.; Slutsker, I.; Smirnov, A.; et al. An overview of mesoscale aerosol processes, comparisons, and validation studies from DRAGON networks. Atmos. Chem. Phys. 2018, 18, 655–671. [Google Scholar] [CrossRef]
- Lee, K.; Yu, J.; Lee, S.; Park, M.; Hong, H.; Park, S.Y.; Choi, M.; Kim, J.; Kim, Y.; Woo, J.-H.; et al. Development of Korean Air Quality Prediction System version 1 (KAQPS v1) with focuses on practical issues. Geosci. Model Dev. 2020, 13, 1055–1073. [Google Scholar] [CrossRef]
- Sinyuk, A.; Holben, B.N.; Eck, T.F.; Giles, D.M.; Slutsker, I.; Korkin, S.; Schafer, J.S.; Smirnov, A.; Sorokin, M.; Lyapustin, A. The AERONET Version 3 aerosol retrieval algorithm, associated uncertainties and comparisons to Version 2. Atmos. Meas. Tech. 2020, 13, 3375–3411. [Google Scholar] [CrossRef]
- Eck, T.F.; Holben, B.; Kim, J.; Beyersdorf, A.; Choi, M.; Lee, S.; Koo, J.-H.; Giles, D.; Schafer, J.; Sinyuk, A.; et al. Influence of cloud, fog, and high relative humidity during pollution transport events in South Korea: Aerosol properties and PM2.5 variability. Atmos. Environ. 2020, 232, 117530. [Google Scholar] [CrossRef]
- Choi, M.; Kim, J.; Lee, J.; Kim, M.; Park, Y.-J.; Jeong, U.; Kim, W.; Hong, H.; Holben, B.; Eck, T.F.; et al. GOCI Yonsei Aerosol Retrieval (YAER) algorithm and validation during the DRAGON-NE Asia 2012 campaign. Atmos. Meas. Tech. 2016, 9, 1377–1398. [Google Scholar] [CrossRef]
- Choi, M.; Kim, J.; Lee, J.; Kim, M.; Park, Y.-J.; Holben, B.; Eck, T.F.; Li, Z.; Song, C.H. GOCI Yonsei aerosol retrieval version 2 products: An improved algorithm and error analysis with uncertainty estimation from 5-year validation over East Asia. Atmos. Meas. Tech. 2018, 11, 385–408. [Google Scholar] [CrossRef]
- Ångström, A. On the Atmospheric Transmission of Sun Radiation and on Dust in the Air. Geogr. Ann. 1929, 11, 156–166. [Google Scholar] [CrossRef]
- Koo, J.-H.; Kim, J.; Lee, J.; Eck, T.F.; Lee, Y.G.; Park, S.S.; Kim, M.; Jung, U.; Yoon, J.; Mok, J.; et al. Wavelength dependence of Ångström exponent and single scattering albedo observed by skyradiometer in Seoul, Korea. Atmos. Res. 2016, 181, 12–19. [Google Scholar] [CrossRef]
- Schuster, G.L.; Dubovik, O.; Holben, B.N. Angstrom exponent and bimodal aerosol size distributions. J. Geophys. Res. 2006, 111, D07207. [Google Scholar] [CrossRef]
- O’Neill, N.T.; Eck, T.F.; Smirnov, A.; Holben, B.N.; Thulasiraman, S. Spectral discrimination of coarse and fine mode optical depth. J. Geophys. Res. Atmos. 2003, 108, 4559. [Google Scholar] [CrossRef]


Disclaimer/Publisher’s Note: The statements, opinions and data contained in all publications are solely those of the individual author(s) and contributor(s) and not of MDPI and/or the editor(s). MDPI and/or the editor(s) disclaim responsibility for any injury to people or property resulting from any ideas, methods, instructions or products referred to in the content. |
© 2023 by the authors. Licensee MDPI, Basel, Switzerland. This article is an open access article distributed under the terms and conditions of the Creative Commons Attribution (CC BY) license (https://creativecommons.org/licenses/by/4.0/).