Article

FedDAD: Solving the Islanding Problem of SAR Image Aircraft Detection Data

School of Electrical and Information Engineering, Changsha University of Science and Technology, Changsha 410205, China
*
Author to whom correspondence should be addressed.
These authors contributed equally to this work.
Remote Sens. 2023, 15(14), 3620; https://doi.org/10.3390/rs15143620
Submission received: 2 July 2023 / Revised: 15 July 2023 / Accepted: 18 July 2023 / Published: 20 July 2023
(This article belongs to the Special Issue SAR Images Processing and Analysis)

Abstract

:
In aircraft feature detection, the difficulty of acquiring Synthetic Aperture Radar (SAR) images leads to the scarcity of some types of aircraft samples, and the high privacy makes the personal sample set have the characteristics of data silos. Existing data enhancement methods can alleviate the problem of data scarcity through feature reuse, but they are still powerless for data that are not involved in local training. To solve this problem, a new federated learning framework was proposed to solve the problem of data scarcity and data silos through multi-client joint training and model aggregation. The commonly used federal average algorithm is not effective for aircraft detection with unbalanced samples, so a federal distribution average deviation (FedDAD) algorithm, which is more suitable for aircraft detection in SAR images, was designed. Based on label distribution and client model quality, the contribution ratio of each client parameter is adaptively adjusted to optimize the global model. Client models trained through federated cooperation have an advantage in detecting aircraft with unknown scenarios or attitudes while remaining sensitive to local datasets. Based on the YOLOv5s algorithm, the feasibility of federated learning was verified on SAR image aircraft detection datasets and the portability of the FedDAD algorithm on public datasets. In tests based on the YOLOv5s algorithm, FedDAD outperformed FedAvg’s mAP0.5–0.95 on the total test set of two SAR image aircraft detection and far outperformed the local centralized training model.

Graphical Abstract

1. Introduction

Synthetic Aperture Radar (SAR) is an active microwave imaging sensor, which can penetrate clouds, rain, snow, and smoke, and has all-day and all-weather imaging observation capability, which has been widely used in both military and civilian fields [1,2,3,4,5,6,7]. Aircraft detection is an important application of SAR. In the civil field, aircraft detection is helpful to the effective management of the airport. In the military field, it is of great value to obtain information such as the number and type of aircraft [8], which has become a hot spot in the research of SAR image target detection and recognition [9,10,11,12,13].
Due to the irregular distribution of land clutter, there are a large number of background highlight scattering points during the detection and recognition of aircraft targets in SAR images. Coupled with the complex imaging mechanism and the variability of scattering conditions, the aircraft target imaging shows a diversity of features, causing aircraft detection and recognition to face the problems of morphological dispersion, feature variability, and the influence of complex background [11]. Diao et al. [14] used a CFAR detector to locate potential aircraft locations and eventually used the RCNN [15] algorithm for detection and identification. He et al. [16] designed a component-based multilayer parallel network structure to pinpoint the location of aircraft in images. An et al. [17] used a feature pyramid structure to optimize the performance of the model for small targets. Zhao et al. [18] designed a fully convolutional attention network that can improve detection accuracy by extracting different levels of contextual information. Chen et al. [19] innovatively proposed a geospatial converter framework to implement a three-step target detection neural network. Based on this work, Wang et al. [20] combined an attention mechanism with weighted feature fusion and airport masks to achieve high-accuracy aircraft detection. Luo et al. [21] proposed a scalable artificial intelligence (XAI) framework for explaining the black-box behavior of aircraft detection models.
However, the above research advancements are contingent upon a comprehensive and well-balanced sample library. Due to the complex SAR imaging mechanism, the discrete and small size of the target in the image, and the interference of speckle noise, it is very difficult to obtain a significant quantity of balanced training data in practical applications. Data enhancement techniques can alleviate this problem, but they cannot eliminate it. Ma et al. [22] expanded the dataset utilizing flipping, rotating, and random clipping to create suitable training conditions for the model. Song et al. [23] used translation and flip to enrich the features of the aircraft dataset, hoping that the model could cope with different detection angles. Gao et al. [24] proposed a method based on weighted distance and feature fusion to cope with the small-sample learning of SAR images. Ji et al. [25] still used a simple data enhancement approach to augment the dataset to solve the problem of insufficient manually labeled aircraft data. Although feature reuse can enrich the dataset, it does not guarantee the robustness of the model.
Limited by the special imaging mechanism of SAR image, it is impossible to shoot all the samples of the required types of aircraft completely, which leads to the scarcity of some types of samples and the problem of sample imbalance. In addition, available public datasets of SAR image aircraft detection are scarce, leading to the formation of data silos. This situation, in which only a certain group has simple access to a particular dataset while others have difficulty gaining access to it, is referred to as data silos [26], and federated learning is often used to solve such problems. In this study, data from clients other than a single client are defined as unknown data because they were not involved in the training of the local model. The same type of aircraft may appear in different scenes, and the samples obtained by a single client may only cover a small part of the scenes, resulting in poor performance of the model trained by the corresponding dataset in the real scene. When the number of samples from different types of aircraft cannot be collected completely, sample imbalance will occur. Feature reuse is a common solution to solve this problem, but distributed training of federated learning is more reliable. In contrast to centralized training methods, federated learning, which is a distributed training method, enables individual users in different spatial locations to collaborate with other users to learn machine learning models and to keep all personal data that may contain sensitive personal information on the device. With the help of federated learning, individual users can benefit from obtaining trained machine-learning models without sending their privacy-sensitive personal data to a central server [27]. Joint learning protects user privacy mainly by exchanging encrypted processing parameters, while attackers cannot access the source data. All this ensures that federated learning does not compromise user privacy at the data level and does not violate GDPR [28] and other acts [29,30]. In federated learning, in contrast to distributed machine learning, each worker node is the sole owner of its own data and training participant of the model.
This paper addresses the enhancement of the aggregation algorithm, which is orthogonal to the study of the data transfer encryption algorithm. Federal average aggregation (FedAvg) [31], an algorithm that classifies aggregation proportions based on the number of client images, is a classic algorithm that is still used by most federated learning projects. On this basis, researchers have improved it for different application scenarios [32,33,34]. Sarma et al. [32] applied federated learning to the training of deep learning models for clinical data in the medical domain to address the challenge of medical data non-aggregation. Sheller et al. [33] used federated learning to achieve multi-institutional collaboration without sharing patient data training. Mohri et al. [34] designed an agnostic federation learning framework for learning in large-scale applications in an attempt to find potential spatial fairness. However, FedAvg is more suitable for these image classification tasks, and its performance in SAR image aircraft detection tasks with unbalanced samples is not as good as our designed FedDAD algorithm. FedDAD adaptively adjusts the contribution ratio of each client in the aggregation process through the distribution of model quality and sample labels in the training process, thus making the global model more trustworthy.
Federated learning was initially adopted to solve the data scarcity and data silos phenomena in SAR image aircraft detection tasks. However, due to the problem of sample imbalance in different categories of aircraft labels in the datasets, the classical FedAvg can no longer meet our needs. To address this problem, an improved FedDAD algorithm for SAR image aircraft detection is proposed. After the experiment of self-made datasets and public datasets, our method has a certain universality and can be extended to other target detection tasks. The contributions of this paper can be summarized as follows:
  • Federated learning is adopted for SAR image aircraft detection scenarios to solve the problem of sample scarcity and derived data silos in SAR images. The successful application of federated learning has increased the possibility of the diverse use of SAR image aircraft detection datasets, making it possible to obtain better models based on data privacy.
  • A federated aggregation algorithm based on model training quality and label distribution is proposed to solve the problem of sample imbalance in SAR image aircraft detection tasks, and this algorithm is more suitable for target detection tasks than FedAvg. FedDAD realizes the adaptive balance of detection quality and label distribution among model classes and can automatically adjust the proportion of model parameters provided by each client in each communication wheel during federated training to make the weight coefficient more reasonable.
  • Based on YOLOv5s, experiments were conducted on two self-made datasets and one open dataset to test the feasibility of the federated learning framework and FedDAD algorithm, both of which were successful. Moreover, the success of the open datasets represents that FedDAD is not only suitable for SAR image aircraft detection but also has good scalability.

2. Materials and Methods

In this study, federal cooperation was compared with centralized training to demonstrate the feasibility of federated learning in SAR image aircraft detection tasks. Compared to other algorithms, YOLOv5s was shown to achieve a balance of accuracy and speed when performing the SAR image aircraft detection tasks [21]. Therefore, YOLOv5s was adopted as the test algorithm and compared with the two most recent algorithms of the YOLO family on the self-constructed dataset. If our method is successful on the simple YOLOv5s, our method can be applied to other studies.

2.1. Deep Learning Object Detection Algorithm

The algorithm in this paper is a federated learning framework that applies the YOLOv5 6.0 algorithm [35] without model improvement. As shown in Figure 1, the YOLOv5s network architecture used in this paper consists of roughly three parts: the backbone, the neck, and the head. The backbone is an optimized CSPDarknet that extracts and generates five-scale features and then inputs the C3, C4, and C5 feature maps output from the latter three stages to the neck. The neck is an optimized PANet [36], which has two branches for top-down and bottom-up multi-scale feature fusion. The detection head part is the same coupled detection head as YOLOv3 [37], which detects large-, medium-, and small-scale objects based on nine predefined anchor frames. The loss functions of the algorithm include BCE as the target loss and classification loss and CIoU as bounding box prediction regression loss [38].

2.2. Federated Learning

Federated learning is used to solve the small samples and data silos problems. The most important characteristic is that cooperative clients can save data locally and train ideal models by sharing model information, but the model information may also leak some private information [39]. The common methods to protect the privacy of coalition are model aggregation [40], homomorphic encryption [41], and differential privacy [42], and this paper only optimizes for model aggregation and does not involve other privacy protection methods. Model aggregation trains the global model by aggregating the model parameters of cooperating clients, thus avoiding the leakage of the raw data during the training process. Federated average aggregation (FedAvg) [31] is the most common model aggregation method in federated learning, which averages locally uploaded randomly descending gradient data and then distributes the updated global model locally. There have been many improved experiments based on FedAvg [43,44], but the Federated Distribution Average Deviation algorithm (FedDAD) proposed in this paper is orthogonal to these methods, and thus FedAvg is used as the baseline for comparison. As shown in Figure 2, each local client uses the YOLOv5s algorithm and the local datasets to train the SAR image aircraft detection model and interacts with the central server periodically. The central server updates the global model using the aggregation algorithms and sends the updated global model to each client for a new round of training. During the federated learning process, each client can start training the model in parallel at different times, but each communication round must wait for all clients to complete training before starting to aggregate and update the model. Many researchers [45,46,47] have optimized based on the communication process, but all clients are assumed to be communicated normally in this paper.
Although model averaging in federated averaging [31] loses some of the model performance, it eliminates SGD, does not have to synchronize data frequently, and allows for some of the missing updates. Model averaging is more generalized than gradient averaging. The federated averaging algorithm in this paper refers to model averaging rather than gradient averaging. Suppose there is a fixed set of K clients, each with a fixed and private local dataset. At least one and at most K clients are selected for training in each round, and the central server initializes the model parameters and sends down the clients for initial updates. Each selected client (a total of four clients were set up in this experiment, and all participated in training and aggregation update) trained the new model w t + 1 k with its dataset on the local device according to the epicycle (round t) model w t issued by the server, and the model w t + 1 k uploaded back to the server. The server collects the models uploaded by each client and aggregates them according to the number of samples of each party in a weighted average way to obtain the next round of models w t + 1 :
w t + 1 k = 1 K n k n w t + 1 k
The amount of client computation is determined by the number of iterations of the local server before the central server performs model aggregation. The total computation volume is determined by three factors: the proportion of clients involved in the computation per communication round (C = 1), the number of iterations that clients put into the local dataset per communication round (30 iterations in this paper), and the batch-size used for client updates (the batch-size is 16 in this paper).

2.3. Distribution Average Deviation Algorithm

The Federated Distribution Average Deviation (FedDAD) algorithm is based on the FedAvg algorithm, which combines the client label distribution and the local model performance to optimize the parameter scaling during the model aggregation process. The FedAvg algorithm is a weighted average algorithm based on the distribution of the number of client samples, which performs well in image classification tasks in which each sample is a single label but is not fully adapted to single-sample, multi-label target detection tasks. Based on this, a distributional mean bias algorithm that performs well in the SAR image aircraft detection task is designed. Instead of weighting the models based on the number of samples assigned to the clients, the proportion of parameters involved in the aggregation process for each client model is determined based on the distribution coefficients and the mean squared deviation coefficients. The distribution coefficient is the sum of the number of labels of different categories for each client. The mean-variance coefficient is determined by the performance of the model at the time each client uploads to the central server.
Assuming that there are K clients participating in this federation training, and the number of labels in client k is defined as N k , and in the corresponding number of labels of category i is N k i . For the same category, the more training samples the model obtained, the more desirable the detection effect of the category will be. α k i is defined as the proportion of the number of labels of the same category of the client subclass.
α k i = N k i / n = 1 K N n i
Each client only needs to upload the number of labels in each category during the first communication with the central server (without uploading any samples) to determine the distribution coefficients for the subsequent aggregation process. Assuming that there is a total of j categories in this joint training and ensuring the reasonableness of the model aggregation parameter proportions, the distribution coefficients μ k are defined as follows:
μ k = 1 j · n = 1 j α k n
Since the samples are not shared between each client and the number of labels in each category is irregularly distributed, defining the contribution ratio using only the distribution coefficients may not be ideal in the target detection task. The quality of the local dataset directly determines the performance of the local model. Based on the local model, the potential relationship between the detection accuracy of each category was explored. Inspired by Gaussian distribution, the mean deviation coefficient γ k is defined. And it is expected to balance the distribution coefficients through the correlation between the local dataset and the local model performance μ k so that the contribution ratio can be more reasonable.
Assume that the detection accuracy of each client is P k , the detection accuracy of its corresponding class i is P k i , the detection accuracy of all classes on a single image is P k m . Since each client model is trained only concerning its dataset, the mean coefficient of variance is defined by the test results of the local model on the local test set γ k . The distribution of category labels in the dataset varies, and the user model performs differently in detecting different categories. We expect the models to have higher category detection accuracy and smaller fluctuations in detection accuracy between categories. By analogy to the physical meaning of standard deviation, the fluctuation factor β k was defined to reflect the stability of the model between different detection accuracies. The smaller the fluctuation coefficient, the more stable the performance of the model in detecting different classes, and the fluctuation coefficient β k is defined as follows:
β k = i = 1 j ( P k i P k m ) 2 / j
It is well known that the higher the overall detection accuracy of the model and the smaller the fluctuation of the detection accuracy between categories, the better the performance of the model. The average detection accuracy of the model on a single image P k m with the fluctuation coefficient β k is constructed to define a negative correlation between the mean difference base R k :
R k = P k m 1 2 · β k
In the case of limited data, higher P k m and lower β k client-side models are pursued, which corresponds to a high mean-variance base. Conversely, the mean difference base will be higher due to a lower P k m or higher β k . The local training results of a class are affected by the difficulty of object detection and the number of labels, so a cross-sectional normalization of the mean square deviation base for each client is needed to define the mean difference coefficient γ k :
γ k = 1 K · ( R k / n = 1 K R n )
The interconnection between the distribution coefficient and the mean-variance coefficient is adopted to effectively prevent the emergence of spurious local optima. According to the actual situation, the model with a larger distribution coefficient and mean square deviation coefficient is closer to the ideal model. Therefore, there should be a positive correlation between the two, the distribution mean deviation coefficient factor θ k is defined according to this effect:
θ k = 1 2 · ( μ k + γ k )
The above process constitutes Algorithm 1, and the corresponding pseudo-code is shown as follow.
Pseudo-code 1. Distribution average deviation algorithm.
Algorithm 1 Federated Averaging algorithm
Input: The number of K clients is k ;
1: B , E , η indicate the local minibatch size, epochs, and learning rate respectively;
2: The total number of detected categories is j ;
3: P k i represents the corresponding precision of class i of client k ;
4: P k m represents the detection accuracy of client k on a single image.
Output: Central server executes:
5: Initialize w 0 ;
6: μ k   (Client’s sample and labels distribution)
7: for Communication cycle t = 1, 2, …, n do
8:  m   max ( C   · K ,   1 )     //C is the proportional
9:   S t   (Select four clients A, B, C and D)
10:   for Each client k   S t simultaneously do
11:    W t + 1 k   Client update( k , W t )
12:  end for
13:  Coefficient of fluctuation β k   ( P k i , P k m , j )
14:  Base of mean difference R k   ( P k m , β k )
15:  Coefficient of mean difference γ k   ( R k , K )
16:  DAD factor θ k = 1 2 · ( μ k + γ k )
17:   W t + 1     k = 1 K θ k W t + 1 k
18: end for
19:
Output: Client update( k , w ):     run on client k
20: β   (Divide D k into batches of size B )
21: // D k is the index set of data points on client k
22: for Each local epochs i ( 1   ~   E )  do
23:    for batch b     β  do
24:      w   w η     l ( w ; b )
25:     // is the computed gradient and l ( w ; b ) is the loss function
26:    end for
27:    Return w to the central server
28: end for
Finally, at each communication aggregation stage, the number of parameters contributed by each client model is determined based on the distribution average deviation factor.
As can be seen from Table 1, the distribution average deviation factor is adaptively adjusted according to the degree of the training of the local model, which is more conducive to improving the performance of the global model than pure average aggregation. FedDAD’s scaling logic is one of the reasons for its success. It prevents low-quality models from contributing too many parameters. See Pseudo-Code 1 for the specific steps.

3. Results

An empirical study of FedDAD was conducted on two aircraft detection datasets and the MSAR-1.0 dataset and compared to the popular FedAvg. Other aggregation optimization methods are either orthogonal to our method or not suitable for the federated customer cooperation training set by us, so the performance of FedAvg and FedDAD is compared based on the YOLOv5s algorithm. Based on centralized training, comparative experiments are conducted in this paper on YOLOv7 [48] and YOLOv8s [49] for multi-class aircraft detection datasets, which Luo et al. [21] failed to investigate.

3.1. Experimental Setup

FedDAD, FedAvg, and baseline testing schemes are implemented in PyTorch. The empirical study was deployed in a simulated federated learning environment, where one node in the distributed learning is considered a central server, and the other nodes are considered local clients. The nodes are deployed on NVIDIA RTX 2080Ti servers with software environments Python3.8, NVIdia-SMI 470.103.01, Driver version 470.103.01, CUDA11.4, etc. The model algorithm is YOLOv5s and the official yolov5s.pt weight file provided by YOLOv5 6.0 is used as the pre-trained model in the experiments. The optimizer for model training is SGD, with a momentum factor size of 0.937, an initial learning rate of 0.01, and a weight decay of 0.0005. learning rate warm-up is performed in the first three iterations to maintain the desired gradient. Both YOLOv7 and YOLOv8s for centralized training used the Yolov7.pt and Yolov8s.pt weight files officially provided by the publisher as pre-training models, and other settings were consistent with YOLOv5.
The centralized training of YOLOv5s is used as the baseline, with a total of 300 iterations to take the final model that evaluates best on the validation set. For federal training, every 30 iterations is a round of communication, and in each communication round, the central server aggregates the models sent up from the clients, and finally, the global model is sent down to each client for updating. Two test sets are built, the local test set for each client and the total test set (aggregated for all clients), as shown in Table 2 and Table 3. All models in the training process are tested on these two test sets, and the results are displayed graphically.
The distribution average deviation factor (accurate to six decimal places) generated by FedDAD in the experiment is listed in Table 1. Due to the width of the table, only a portion of the communication round data is listed here. The data quality and model training quality directly affect the size of this factor. It is worth noting that the distribution average deviation factor will be adjusted adaptively according to a new round of model quality before each polymerization to expect to obtain a better weight ratio.

3.2. Evaluation Index

To better evaluate the performance of each algorithm for aircraft target detection on SAR images, some commonly used evaluation metrics for the target detection task [12,50] are adopted: precision (Precision), recall (Recall), and mean average precision (mAP0.5, mAP0.5–0.95) to measure the detection performance of the algorithms. Since no model adjustments are made to the YOLOv5s algorithm, the model parameters (Params), floating point operations per second (FLOPs), and frames per second (FPS) were fixed at 7.2M, 15.8G, and 55.33.
IoU is the threshold for dividing positive and negative samples in the experimental evaluation. Precision (P) and recall (R) are defined in Equations (8) and (9), respectively, where TP, FP, TN, and FN denote true positive, false positive, true negative, and false negative cases, respectively. P and R are defined as follows:
P = T P T P + F P
R = T P T P + F N
The mean average precision (mAP) is the area of the region between the PR curve and the coordinate axes, which combines the effects of precision and recall to reflect the quality of the model. mAP0.5 refers to calculating the AP of all pictures in each category when the IoU is set to 0.5, and then all categories are averaged. mAP0.5–0.95 indicates the average mAP over different IoU thresholds (from 0.5 to 0.95, step 0.05) on the average mAP. The larger the AP value, the better the performance of the model. The AP and mAP are defined as follows, where j is the number of categories.
A P = 0 1 p ( r ) d r
m A P = 1 j · i = 1 j A P i
In the process of federated learning, the common target detection index may not be able to directly reflect the gap between distributed training and centralized training. To more directly reflect the advantages of the federated learning model on a larger test dataset, a new evaluation index, compensation score (CS), was defined. The accuracy difference between federated training and centralized training on different test sets was quantified to reflect the advantages and disadvantages of FedDAD and FedAvg. The larger the C S , the more the federated learning method compensates for the model on a larger test set, which is want to be seen. It is defined as follows:
C S = P K a l l P K l o c P K a l l
P K a l l = P K _ F e d a l l P K _ c e n a l l
P K l o c = P K _ c e n l o c P K _ F e d l o c
where P represents the average detection accuracy of the model, a l l represents the total test set, l o c represents the local test set, K represents the local client, K _ F e d represents the federated learning training method, K _ c e n represents the centralized learning training method, and C S unit is a percentage.

3.3. Datasets Introduction and Setup

Datasets one (#1): Based on two 1M-resolution SAR airfield images taken by the GF-3 satellite system. The conventional incidence angle of the system is 20°–50°; it is C-band and adopts single-polarized slider bunching (SL) imaging mode. The dataset polarization mode is HH. The dataset was originally in tiff format, with a total of seven categories. To facilitate model training, slices were sliced and data enhanced into 6640 512 × 512 pixel 24-bit deep JPG images. The ratio of training and test sets is 4:1, where the training set contains 5312 images and the test set contains 1328 images. This paper uses the unrevised version of this dataset and the latest revised version (SAR-AIRcraft-1.0) obtained: https://radars.ac.cn/web/data/getData?dataType=SARDataset (accessed on 1 January 2020).
Datasets two (#2): Eleven 1M-resolution SAR airfield images taken by the GF-3 satellite system. The technical indicators of the dataset are the same as dataset #1, the original picture format is tiff, and there is only one category. To facilitate model training, 4296 images were sliced into 24-bit deep JPG images of 512 × 512 pixels. The training and test sets were allocated in a 4:1 ratio, with the training set containing 3416 images and the test set containing 880 images.
MSAR-1.0 [51]: A large-scale multi-class SAR target detection dataset based on the Hisea-1 satellite and GF-3 satellite system, containing 28,449 detection slices and four target categories. Dataset polarization modes include HH, HV, VH, and VV. The slice size is 256 × 256 pixels, some bridge slices are 2048 × 2048 pixels, and the format is a three-channel grayscale image, 24-bit deep JPG. To facilitate model training, we sliced all 293 images with the size of 2048 × 2048 pixels into images with the size of 256 × 256 pixels, and the total number of images in the final dataset was 30,180, all of which were 256 × 256 pixels. The ratio of training and test sets was 4:1, with the training set containing 25,416 images and the test set containing 4764 images.
In this paper, the experiments related to federated learning are divided into four clients, each of which is guaranteed to have the same sample size. Since the satellite system is an imaging system, the number of labels carried by each sample in the dataset cannot be guaranteed. Therefore, the distribution of the three datasets is fine-tuned when dividing the local datasets to ensure that there is some sample imbalance among the clients. The configuration of the self-built dataset and the open MSAR-1.0 datasets after they are divided into four local datasets is shown in Table 2 and Table 3. Sample examples for each dataset are shown in Figure 3.

3.4. Experiment and Analysis

3.4.1. Multi-Class Aircraft Detection

All clients use YOLOv5s as the training model and are trained and tested on two SAR image aircraft detection datasets. As stated in [52], the number of iterations per communication round should not be too high, so one communication was performed every 30 iterations. The distribution coefficients for the FedDAD process are calculated in Table 2: A ( μ A = 0.250803 ), B ( μ B = 0.262863 ), C ( μ C = 0.231434 ), D ( μ D = 0.254899 ). As shown in Figure 4, each time the central server sends down the global model to be updated, the local client needs roughly 30 iterations to help the model converge to the ideal situation. It is important to note that while federated learning can help the client-side model perceive unknown data more strongly; this may degrade performance. As shown in Figure 4, local centralized training has a better model convergence performance, while both FedAvg and FedDAD fluctuate during the convergence process.
It is worth noting that the fluctuations that occur during the convergence process do not affect the final performance of the model too much. As shown in Table 4, Table 5 and Table 6, the test results of the model on the local dataset after each communication round iteration are compared. The P(Precision), R(Recall), and mAP0.5 (area under the PR curve at IoU = 0.5) were illustrated when the model was tested, hoping to analyze the advantages and disadvantages of centralized and distributed training through more subtle data fluctuations. Combining the data in Figure 4 and Table 6, the centralized training process turned out to be more stable and gradually converged to the ideal state as the number of iterations increased. Distributed training leads to the sporadic performance of the model, and insufficient communication and iterations may lead to the less-than-optimal performance of the model. For example, the performance of the federally trained model is prone to large fluctuations until the eighth communication round (240 iterations) but gradually smooths out and outperforms centralized training afterward. When IoU = 0.5, the FedDAD-trained model can achieve higher levels on the local test set, which is shown in Precision, Recall, and mAP0.5 after model convergence.
To further explore the differences between FedDAD (ours), FedAvg, and centralized training, the mAP0.5–0.95 metric was computed, which provides a more three-dimensional assessment of the models. As shown in Figure 5, the mAP0.5–0.95 values of the locally trained model and the aggregated global model on the local test set and the total test set are shown. In the figure, locally represents the centrally trained local model, which is the baseline; Pre-FedAvg and Pre-FedDAD represent the local model trained with federal average assistance during training; Post-FedAvg and Post-FedDAD represent the global model that was trained using the federated aggregation after the training process.
Our proposed FedDAD is more suitable for SAR image aircraft detection, and its aggregated global model has a more stable and better final performance. It adaptively adjusts the parameter contribution of each client model according to the number of labels between different aircraft classes and the specific performance of the local model before aggregation, thus fitting a more idealized space. The four tables on the left of Figure 5 represent the performance of the client-side model and the global model on the local test set when corresponding to the communication rounds (number of iterations). Surprisingly, the local model with the corresponding number of iterations using federated cooperative training clients performs close to or even slightly better than the centralized training results on the local test set. This is because federated aggregation may lead to a weakened connection between the global model and the corresponding client’s local dataset, which is then compensated with an enhanced connection to the unknown dataset. It is noteworthy that the final results of the federated training are better than the centralized training for three of the four clients, and only the centralized training results are slightly better for Client A. This phenomenon may be related to the random distribution of the sample labels in Table 3 and suggests that the performance of the aggregated global model is acceptable after a certain number of iterations of the local model. The performance of the global model is not satisfactory at the beginning due to uneven data distribution and insufficient training. When the number of iterations reaches 120 (the fourth aggregated model), the aggregated model performs close to or even better than the centrally trained results on all local test sets. We would like to see this happen because the aggregated model will perform differently on different clients, where fluctuations in model quality may occur. For example, FedAvg’s global model will produce non-idealized degradation between the fifth and seventh communication, and its final performance on Client A and B test sets will suffer.
By comparing Figure 5 and Figure 6, it is found that the federally cooperatively trained model has better generalization ability, which ensures the ideal recognition rate of the local dataset and also has stronger unknown data detection ability than the centrally trained model, which is exactly what the aircraft detection model needs when facing different scenarios. The four tables on the right in Figure 5 represent the performance of the client-side model on the total test set for the corresponding number of iterations. Consider (a) and (b) in Figure 5, which represent the simulation results of client A. The final performance of the model trained by the federated learning institute in Figure 5a is slightly lower than that of the centralized training, and the randomness of the FedAvg global model (the aggregated model) is higher than that of the FedDAD. As can be seen in Figure 5b, the model trained by federated learning is more capable of detecting unknown data than the models trained locally and centrally, which is a result that is more easily obtained under certain requirements. As just analyzed, model aggregation may cause the global model to lose some performance in detecting specific datasets but compensate in terms of linkage to unknown datasets. Analyzing the test data for different periods for the four clients, FedDAD demonstrates better performance than FedAvg in the middle of federal training, which helps the model to obtain more stable convergence and higher detection accuracy (for the whole test set).
Figure 6 shows the performance of the aggregated model compared to the centrally trained model on the total test set for the corresponding number of iterations. Before the third communication (90 iterations), the global model performs poorly due to the uneven distribution of category labels. In the middle of the federated collaboration, the global model begins to gradually outperform the centralized training model. Again, FedAvg’s model quality fluctuated more during this time, while FedDAD was more stable. In the later stages of federated cooperation, sufficient joint training allows the global model to exhibit more robust detection performance. The detection accuracy of FedDAD (mAP0.5–0.95) is 2% higher than FedAvg, and 4–9% higher than the centralized training of the local client. It cannot be ignored that comparing Figure 5 and Figure 6 shows that the quality of the global model after aggregation may be lower than the local model for the corresponding number of iterations, but it does provide a more reasonable initial model for the local iteration of a new communication round. The above experimental results fully illustrate that our proposed FedDAD can not only be applied to multiclass aircraft detection from SAR images but is also more adapted to this task than FedAvg.
Some of the results of the YOLOv5s global model trained by FedDAD (the tenth communication round) are shown in Figure 7. The top half of Figure 7 shows the aircraft labeled by SAR image experts, and the bottom half is the detection results of the model. The model trained by federation cooperation still has a high sensitivity to most of the labels in dataset #1 and does not degrade performance too much due to aggregation operations in the process. On the contrary, the federated cooperatively trained model not only can identify the original dataset but also has a stronger detection effect on unknown data than the centralized locally trained model. Admittedly, basic target detection algorithms such as YOLOv5s are still subject to strong contextual factors, and the trained models are still suffering from false positives and misclassifications.
As shown in Table 7, the effect of YOLOv7 and YOLOv8s was tested on dataset #1, where YOLOv7 performed similarly to YOLOv5s, but YOLOv7 had a larger number of model parameters and longer training and detection time. YOLOv8s has a higher detection accuracy, and the amount of parameter computation is within the acceptable range. The results of the comparison experiments suggest that YOLOv8s may be more suitable for SAR image aircraft detection than YOLOv5s, but this is something we need to explore in the future and is not the focus of this paper. The results of the comparison experiments are for reference only, we declare, as we did not further analyze the specific performance metrics of these three YOLO series models. In other words, our method can be implemented on top of the YOLOv5s algorithm and, therefore, can be applied in other studies as well. It is worth affirming that the success of FedDAD on basic target detection models (YOLOv5s) shows that it has a promising application prospect on other better models.

3.4.2. Single-Class Aircraft Detection

Unlike dataset #1, dataset #2 has only one category of labels (‘Aircraft’). FedDAD is desired not only suitable for multi-category aircraft detection but also to perform well in single-category aircraft detection. The same training strategy as in dataset #1 was used to demonstrate the feasibility of our method through comparative experiments. The distribution coefficients are calculated from Table 2: A ( μ A = 0.354859 ), B ( μ B = 0.348686 ), C( μ C = 0.092434 ), D( μ D = 0.204021 ). Since there is only one category, the fluctuation coefficient β k = 0 , the mean difference base R k is completely determined by the single image detection accuracy P k m is determined.
The left side of Figure 8 shows the test results of the model on the local test set for each stage of centralized and federated cooperative training. Unlike the performance on dataset #1, the aggregated global model loses more performance on the local test set of dataset #2, both FedAvg and FedDAD. This is similar too, but more pronounced than the case on dataset 1. It is worth acknowledging that the global model can perform similarly to the centrally trained model on the local test set after a new iteration for each client. Neither FedDAD nor FedAvg’s global model shows large performance fluctuations on this dataset, but the former has a higher detection accuracy (for the client dataset) than the latter, which lays a good foundation for the later client iterations. This provides a good foundation for later client-side iterations.
The right side of Figure 8 shows the test results of the local model before centralized training and federal training without aggregation on the total test set. The success of the federated cooperation shows that the method does help the local model to improve its ability to detect unknown data and that FedDAD has a stronger ability to sense unknown data. Compared with dataset #1, the global model of federated learning after model aggregation in dataset #2 loses more local performance. Taking Figure 8a,b as an example, after the tenth communication round (300epochs) iteration, the local model before aggregation is closer to the result of centralized training than the global model after aggregation, and their ability to detect unknown data is also better than that of the model trained locally and centrally. So, using the global model as our final result would defeat the original purpose of federation training. Although the aggregated global model also possesses stronger performance in detecting unknown data than the centrally trained model, as shown in Figure 9, there is some randomness in the performance of the global model compared to the final local model. We choose the local model before the tenth aggregation (300 epochs) of each client as the final result, which can guarantee the privacy of the clients to a certain extent and also obtain an ideal model.
The experimental results for dataset #2, although affected by the quality of labels and single category, further illustrate that the global model is not suitable as the final model. For example, in Figure 8c, the global model obtained by aggregating the local models after iteration degrades the performance on the local dataset by about 30%. The detection accuracy (mAP0.5–0.95) of the final local model trained by FedDAD is 1–3% higher than that of the local model trained by FedAvg and 17–20% higher than the performance of the centrally trained model.

3.4.3. MSAR-1.0

Different from Dataset #1 and Dataset #2, MSAR-1.0 is a large-scale multi-class SAR image dataset containing four class labels and complex background information. The same training strategy as Dataset 1 was used to demonstrate the portability of our method (FedDAD) through comparative experiments. The distribution coefficients are calculated from Table 3: A( μ A = 0.313737 ), B( μ B = 0.233523 ), C( μ C = 0.250449 ), D( μ D = 0.202291 ).
The test results of centralized training and partial federated training are shown in Figure 10, mainly using customer A as an example. As shown in Figure 10a, we define the sum of the training sets of all customers in Table 3 as the total training set and the sum of the test sets as the total test set and perform centralized training. The loss function of the total dataset converges around 300 epochs, so for the MSAR-1.0 dataset, we still use the setting mode of one communication wheel every 30 iterations to ensure the reliability of the convergent data. As shown in Figure 10b, we present the results of centralized training for four clients on the local dataset and the results of federated training for client A. The quality of the models trained by the local YOLOv5s algorithm varies greatly due to the large difference in the number of sample labels for each client. Among them, Clients A and D have higher detection accuracy, while Clients B and C have lower detection accuracy. However, this only represents the model on the local dataset, and the robustness of the model may not be good due to unbalanced samples. In the federated collaboration, the final accuracy of client A’s model before and after aggregation is slightly lower than that of its centralized training. A line chart in Figure 10b is presented to reflect this result. The effect of aggregation operation on model performance is acceptable because it achieves greater performance compensation on unknown datasets. As shown in Figure 10c, Customer A’s federally trained model performs much better on the total test set than the locally centralized training model, which is known as performance compensation. It is worth noting that FedDAD compensates more performance than FedAvg in the same environment, which is well illustrated by the high and low CS.
Based on the data from all previous experiments, the compensation score (CS) corresponding to each client was calculated. As shown in Table 8, since different local datasets train different models, it is necessary to compare the compensation scores of FedAvg and FedDAD strategies, all other things being equal. The model aggregation process of federated learning may cause the model to lose some performance on the local test set but compensate for the model’s ability to detect a larger dataset. C S is used to quantify the degree of compensation. As can be seen from Table 8, the C S of FedDAD is higher than that of FedAvg, no matter whether it is a multi-class SAR image aircraft detection dataset, single-class SAR image aircraft detection dataset, or MSAR-1.0 dataset. This suggests that FedDAD can help the final model to obtain a stronger detection capability for unknown data under the same environment.

4. Discussion

The success of federated learning on two SAR image aircraft detection datasets demonstrates the feasibility of our proposed scheme. First, the final local models participating in federated training have more reliable performance on a larger dataset than the local model trained by the clients individually, indicating that the federation cooperation of multiple and small sample clients can indeed train a more robust SAR image aircraft detection model. This ameliorates the problem of the SAR image data siloing in some application scenarios can be improved to some extent. Second, the two federated aggregation algorithms (FedDAD and FedAvg) used in the two experiments we simulated affect the local detection results of the client aggregation models. This slight negative effect is compensated for on a larger dataset and with better performance compensation using FedDAD aggregation than using FedAvg. In the multi-class aircraft detection dataset setup, we make the label distribution worse for some classes. In this case, the Fedavg-trained model will show performance fluctuations, while the FedDAD-trained model is more stable. The final federated models of the two methods have the same test results on the client’s local dataset. Based on the above analysis, our proposed FedDAD outperforms FedAvg in dealing with uneven distribution of sample quality across different clients that may occur in SAR image aircraft detection. Third, object detection is different from image classification. A single sample of a task dataset may contain multiple labels, so weight balancing based on the number of samples is undesirable. The success of FedDAD on a single-class aircraft detection dataset demonstrates that our approach achieves the stated goals even in the presence of uneven label distribution and fewer detection classes, which is commendable. Finally, each client in the federated collaboration selects the 300th iteration of the model as the final model and does not participate in model aggregation. In our experiments, model aggregation affects the performance of models on local test sets to some extent. Not performing final model aggregation not only further protects each client’s data privacy but also minimizes the negative impact of aggregation.
The MSAR-1.0 dataset was used to test the portability of FedDAD, and the experiment results were successful. Although the accuracy of the YOLOv5s algorithm on MSAR-1.0 is not satisfactory, it does not affect our evaluation results. The preliminary success of the experimental results demonstrates that federated learning is suitable for training SAR image aircraft detection models under certain conditions, and FedDAD can be extended to other multi-class SAR image target detection tasks, such as ship, tank, and bridge detection. There are still some urgent problems to be solved in our research. For example, whether our algorithm still maintains good performance when the number of clients increases; and what kind of quality fluctuation occurs in the aggregated global model when the clients are out of synchronization during the training process. The application of federated learning in the field of SAR images is worth exploring, and we will also focus on solving the problems that still exist in our future work.

5. Conclusions

Our proposed FedDAD has achieved success on two SAR image airplane detection datasets and the MSAR-1.0 dataset, which solves the problems of sparse SAR image data and data silos to some extent, and lays a solid foundation for federated training of SAR image airplane detection. The two homemade datasets used in the experiments are from the GF-3 system, and the original image format is tif, which is cut into 512 × 512 pixels suitable for YOLOv5s training. For the MSAR-1.0 dataset, we sliced the samples with the size of 2048 × 2048 into 256 × 256 pixels to ensure that all samples were of the same size. To facilitate training on a local device, we used 24-bit depth JPG format as the annotation format for the three datasets. Four clients and a central server were set up to simulate the federated cooperative framework and randomly divide the three datasets among the four clients. The number of sample labels was fine-tuned to be uneven across clients to better match what might occur. On the total test set of dataset #1, the FedDAD-trained models are 4–9% higher than the models trained in each client set with mAP0.5–0.95 and about 2% higher than FedAvg. On the total test set of dataset #2, the compensation for federated learning performance is even more pronounced, with FedDAD-trained models being 13–23% higher than the mAP0.5–0.95 of the models trained in each client and about 3% higher than FedAvg. On the MSAR-1.0 dataset, FedDAD-trained models had 3–6% higher mAP0.5 per client than centrally trained models and 0.5–2% higher than FedAvg. FedDAD has a higher CS value than FedAvg on all three datasets, indicating that FedDAD can compensate for more performance losses. Based on the experimental results, we choose the last iteration of the FedDAD model on each client as the final model, which ensures user privacy and model stability.

Author Contributions

Conceptualization, Z.J. and H.Z.; methodology, Z.J. and H.Z.; software, H.Z.; validation, H.Z. and R.W.; formal analysis, H.Z.; investigation, W.Z.; resources, Z.J.; data curation, H.Z.; writing—original draft preparation, H.Z.; writing—review and editing, W.Z.; visualization, R.W.; supervision, Z.J.; project administration, Z.J.; funding acquisition, Z.J. All authors have read and agreed to the published version of the manuscript. Z.J. and H.Z. contributed to the work equally and should be regarded as co-first authors.

Funding

This research was supported by the National Natural Science Foundation of China (Grant No. 52207074), partly funded by the Research Foundation of Education Bureau of Hunan Province, China (Grant No.19B016), and the Postgraduate Scientific Research Innovation Project of Hunan Province, China (Grant No. CX20210796, CX20220919).

Data Availability Statement

The data that support the findings of this study are openly available at https://radars.ac.cn/web/data/getData?dataType=MSAR, accessed on 1 January 2020.

Acknowledgments

We sincerely thank the anonymous reviewers for their critical comments and suggestions for improving the manuscript.

Conflicts of Interest

The authors declare no conflict of interest.

References

  1. Moreira, A.; Prats-Iraola, P.; Younis, M.; Krieger, G.; Hajnsek, I.; Papathanassiou, K.P. A tutorial on synthetic aperture radar. IEEE Geosci. Remote Sens. Mag. 2013, 1, 6–43. [Google Scholar] [CrossRef] [Green Version]
  2. Chen, L.; Weng, T.; Xing, J.; Li, Z.; Yuan, Z.; Pan, Z.; Tan, S.; Luo, R. Employing deep learning for automatic river bridge detection from SAR images based on adaptively effective feature fusion. Int. J. Appl. Earth Obs. Geoinf. 2021, 102, 102425. [Google Scholar] [CrossRef]
  3. Zeng, K.; Wang, Y. A deep convolutional neural network for oil spill detection from spaceborne SAR images. Remote Sens. 2020, 12, 1015. [Google Scholar] [CrossRef] [Green Version]
  4. Luti, T.; De Fioravante, P.; Marinosci, I.; Strollo, A.; Riitano, N.; Falanga, V.; Mariani, L.; Congedo, L.; Munafò, M. Land consumption monitoring with SAR data and multispectral indices. Remote Sens. 2021, 13, 1586. [Google Scholar] [CrossRef]
  5. Shu, Y.; Li, W.; Yang, M.; Cheng, P.; Han, S. Patch-based change detection method for SAR images with label updating strategy. Remote Sens. 2021, 13, 1236. [Google Scholar] [CrossRef]
  6. Yang, K.; Yuan, Z.; Xing, X.; Chen, L. Deep Learning-Based Mask-Cut Method for InSAR Phase-Unwraping. IEEE J. Miniaturization Air Space Syst. 2023, 4, 221–230. [Google Scholar] [CrossRef]
  7. Molan, Y.E.; Lu, Z. Modeling InSAR phase and SAR intensity changes induced by soil moisture. IEEE Trans. Geosci. Remote Sens. 2020, 58, 4967–4975. [Google Scholar] [CrossRef]
  8. Chen, S.; Wang, H.; Xu, F.; Jin, Y.Q. Target classification using the deep convolutional networks for SAR images. IEEE Trans. Geosci. Remote Sens. 2016, 54, 4806–4817. [Google Scholar] [CrossRef]
  9. Zhao, Y.; Zhao, L.; Liu, Z.; Hu, D.; Kuang, G.; Liu, L. Attentional feature refinement and alignment network for aircraft detection in SAR imagery. arXiv 2022, arXiv:2201.07124. [Google Scholar] [CrossRef]
  10. Guo, Q.; Wang, H.; Xu, F. Scattering enhanced attention pyramid network for aircraft detection in SAR images. IEEE Trans. Geosci. Remote Sens. 2020, 59, 7570–7587. [Google Scholar] [CrossRef]
  11. Luo, R.; Chen, L.; Xing, J.; Yuan, Z.; Tan, S.; Cai, X.; Wang, J. A fast aircraft detection method for SAR images based on efficient bidirectional path aggregated attention network. Remote Sens. 2021, 13, 2940. [Google Scholar] [CrossRef]
  12. Kang, Y.; Wang, Z.; Fu, J.; Sun, X.; Fu, K. SFR-Net: Scattering feature relation network for aircraft detection in complex SAR images. IEEE Trans. Geosci. Remote Sens. 2021, 60, 1–17. [Google Scholar] [CrossRef]
  13. Zhang, P.; Xu, H.; Tian, T.; Gao, P.; Tian, J. Sfre-net: Scattering feature relation enhancement network for aircraft detection in sar images. Remote Sens. 2022, 14, 2076. [Google Scholar] [CrossRef]
  14. Diao, W.; Dou, F.; Fu, K.; Sun, X. Aircraft detection in SAR images using saliency based location regression network. In Proceedings of the IGARSS 2018-2018 IEEE International Geoscience and Remote Sensing Symposium, Valencia, Spain, 22–27 July 2018; pp. 2334–2337. [Google Scholar]
  15. Girshick, R.; Donahue, J.; Darrell, T.; Malik, J. Rich feature hierarchies for accurate object detection and semantic segmentation. In Proceedings of the IEEE Conference on Computer Vision and Pattern Recognition, Columbus, OH, USA, 23–28 June 2014; pp. 580–587. [Google Scholar]
  16. He, C.; Tu, M.; Xiong, D.; Tu, F.; Liao, M. A component-based multi-layer parallel network for airplane detection in SAR imagery. Remote Sens. 2018, 10, 1016. [Google Scholar] [CrossRef] [Green Version]
  17. An, Q.; Pan, Z.; Liu, L.; You, H. DRBox-v2: An improved detector with rotatable boxes for target detection in SAR images. IEEE Trans. Geosci. Remote Sens. 2019, 57, 8333–8349. [Google Scholar] [CrossRef]
  18. Zhao, Y.; Zhao, L.; Li, C.; Kuang, G. Pyramid attention dilated network for aircraft detection in SAR images. IEEE Geosci. Remote Sens. Lett. 2020, 18, 662–666. [Google Scholar] [CrossRef]
  19. Chen, L.; Luo, R.; Xing, J.; Li, Z.; Yuan, Z.; Cai, X. Geospatial transformer is what you need for aircraft detection in SAR Imagery. IEEE Trans. Geosci. Remote Sens. 2022, 60, 1–15. [Google Scholar] [CrossRef]
  20. Wang, J.; Xiao, H.; Chen, L.; Xing, J.; Pan, Z.; Luo, R.; Cai, X. Integrating weighted feature fusion and the spatial attention module with convolutional neural networks for automatic aircraft detection from SAR images. Remote Sens. 2021, 13, 910. [Google Scholar] [CrossRef]
  21. Luo, R.; Xing, J.; Chen, L.; Pan, Z.; Cai, X.; Li, Z.; Wang, J.; Ford, A. Glassboxing deep learning to enhance aircraft detection from sar imagery. Remote Sens. 2021, 13, 3650. [Google Scholar] [CrossRef]
  22. Ma, Y.; Zhou, D.; He, Y.; Zhao, L.; Cheng, P.; Li, H.; Chen, K. Aircraft-LBDet: Multi-Task Aircraft Detection with Landmark and Bounding Box Detection. Remote Sens. 2023, 15, 2485. [Google Scholar] [CrossRef]
  23. Song, F.; Ma, R.; Lei, T.; Peng, Z. RAIH-Det: An End-to-End Rotated Aircraft and Aircraft Head Detector Based on ConvNeXt and Cyclical Focal Loss in Optical Remote Sensing Images. Remote Sens. 2023, 15, 2364. [Google Scholar] [CrossRef]
  24. Gao, F.; Xu, J.; Lang, R.; Wang, J.; Hussain, A.; Zhou, H. A Few-Shot Learning Method for SAR Images Based on Weighted Distance and Feature Fusion. Remote Sens. 2022, 14, 4583. [Google Scholar] [CrossRef]
  25. Ge, J.; Wang, C.; Zhang, B.; Xu, C.; Wen, X. Azimuth-Sensitive Object Detection of High-Resolution SAR Images in Complex Scenes by Using a Spatial Orientation Attention Enhancement Network. Remote Sens. 2022, 14, 2198. [Google Scholar] [CrossRef]
  26. Li, Q.; Wen, Z.; Wu, Z.; Hu, S.; Wang, N.; Li, Y.; Liu, X.; He, B. A survey on federated learning systems: Vision, hype and reality for data privacy and protection. IEEE Trans. Knowl. Data Eng. 2021, 35, 3347–3366. [Google Scholar] [CrossRef]
  27. Gong, M.; Xie, Y.; Pan, K.; Feng, K.; Qin, A.K. A survey on differentially private machine learning. IEEE Comput. Intell. Mag. 2020, 15, 49–64. [Google Scholar] [CrossRef]
  28. Albrecht, J.P. How the GDPR will change the world. Eur. Data Prot. Law Rev. 2016, 2, 287. [Google Scholar] [CrossRef]
  29. Parasol, M. The impact of China’s 2016 Cyber Security Law on foreign technology firms, and on China’s big data and Smart City dreams. Comput. Law Secur. Rev. 2018, 34, 67–98. [Google Scholar] [CrossRef]
  30. Gray, W.; Zheng, H.R. General Principles of Civil Law of the People’s Republic of China. Am. J. Comp. Law 1986, 34, 715–743. [Google Scholar] [CrossRef]
  31. McMahan, B.; Moore, E.; Ramage, D.; Hampson, S.; y Arcas, B.A. Communication-efficient learning of deep networks from decentralized data. In Artificial Intelligence and Statistics; PMLR: Amsterdam, The Netherlands, 2017; pp. 1273–1282. [Google Scholar]
  32. Sarma, K.V.; Harmon, S.; Sanford, T.; Roth, H.R.; Xu, Z.; Tetreault, J.; Xu, D.; Flores, M.G.; Raman, A.G.; Kulkarni, R.; et al. Federated learning improves site performance in multicenter deep learning without data sharing. J. Am. Med. Inform. Assoc. 2021, 28, 1259–1264. [Google Scholar] [CrossRef]
  33. Sheller, M.J.; Edwards, B.; Reina, G.A.; Martin, J.; Pati, S.; Kotrotsou, A.; Milchenko, M.; Xu, W.; Marcus, D.; Colen, R.R.; et al. Federated learning in medicine: Facilitating multi-institutional collaborations without sharing patient data. Sci. Rep. 2020, 10, 12598. [Google Scholar] [CrossRef]
  34. Mohri, M.; Sivek, G.; Suresh, A.T. Agnostic federated learning. In International Conference on Machine Learning; PMLR: Long Beach, CA, USA, 2019; pp. 4615–4625. [Google Scholar]
  35. Jocher, G.; Stoken, A.; Chaurasia, A.; Borovec, J.; Kwon, Y.; Michael, K.; Changyu, L.; Fang, J.; Skalski, P.; Hogan, A.; et al. 0-YOLOv5n ‘Nano’ Models, Roboflow Integration, TensorFlow Export, OpenCV DNN Support, Ultralytics/yolov5: V6; Zenodo: Cern, Switzerland, 2021. [Google Scholar]
  36. Liu, S.; Qi, L.; Qin, H.; Shi, J.; Jia, J. Path aggregation network for instance segmentation. In Proceedings of the 2018 IEEE/CVF Conference on Computer Vision and Pattern Recognition, Salt Lake City, UT, USA, 18–23 June 2018; pp. 8759–8768. [Google Scholar]
  37. Redmon, J.; Farhadi, A. Yolov3: An incremental improvement. arXiv 2018, arXiv:1804.02767. [Google Scholar]
  38. Zheng, Z.; Wang, P.; Liu, W.; Li, J.; Ye, R.; Ren, D. Distance-IoU loss: Faster and better learning for bounding box regression. In Proceedings of the AAAI Conference on Artificial Intelligence, New York, NY, USA, 7–12 February 2020; Volume 34, pp. 12993–13000. [Google Scholar]
  39. Bhowmick, A.; Duchi, J.; Freudiger, J.; Kapoor, G.; Rogers, R. Protection against reconstruction and its applications in private federated learning. arXiv 2018, arXiv:1812.00984. [Google Scholar]
  40. Chen, Y.R.; Rezapour, A.; Tzeng, W.G. Privacy-preserving ridge regression on distributed data. Inf. Sci. 2018, 451, 34–49. [Google Scholar] [CrossRef]
  41. Aono, Y.; Hayashi, T.; Wang, L.; Moriai, S. Privacy-preserving deep learning via additively homomorphic encryption. IEEE Trans. Inf. Forensics Secur. 2017, 13, 1333–1345. [Google Scholar]
  42. McMahan, H.B.; Ramage, D.; Talwar, K.; Zhang, L. Learning differentially private recurrent language models. arXiv 2017, arXiv:1710.06963. [Google Scholar]
  43. Yang, K.; Jiang, T.; Shi, Y.; Ding, Z. Federated learning via over-the-air computation. IEEE Trans. Wirel. Commun. 2020, 19, 2022–2035. [Google Scholar] [CrossRef] [Green Version]
  44. Liang, P.P.; Liu, T.; Ziyin, L.; Allen, N.B.; Auerbach, R.P.; Brent, D.; Salakhutdinov, R.; Morency, L.P. Think locally, act globally: Federated learning with local and global representations. arXiv 2020, arXiv:2001.01523. [Google Scholar]
  45. Smith, V.; Chiang, C.K.; Sanjabi, M.; Talwalkar, A.S. Federated multi-task learning. Adv. Neural Inf. Process. Syst. 2017, 30. [Google Scholar]
  46. Konečný, J.; McMahan, H.B.; Ramage, D.; Richtárik, P. Federated optimization: Distributed machine learning for on-device intelligence. arXiv 2016, arXiv:1610.02527. [Google Scholar]
  47. Caldas, S.; Konečny, J.; McMahan, H.B.; Talwalkar, A. Expanding the reach of federated learning by reducing client resource requirements. arXiv 2018, arXiv:1812.07210. [Google Scholar]
  48. Wang, C.Y.; Bochkovskiy, A.; Liao, H.Y.M. YOLOv7: Trainable bag-of-freebies sets new state-of-the-art for real-time object detectors. In Proceedings of the IEEE/CVF Conference on Computer Vision and Pattern Recognition, Vancouver, BC, Canada, 18–22 June 2023; pp. 7464–7475. [Google Scholar]
  49. Glenn, J. Ultralytics yolov8. 2023. Available online: https://github.com/ultralytics/ultralytics (accessed on 1 July 2023).
  50. Everingham, M.; Eslami, S.A.; Van Gool, L.; Williams, C.K.; Winn, J.; Zisserman, A. The pascal visual object classes challenge: A retrospective. Int. J. Comput. Vis. 2015, 111, 98–136. [Google Scholar] [CrossRef]
  51. Chen, J.; Huang, Z.; Xia, R.; Wu, B.; Sheng, L.; Sun, L.; Yao, B. Large-scale multi-class SAR image target detection dataset-1.0[OL]. J. Radars 2022. Available online: https://radars.ac.cn/web/data/getData?dataType=MSAR (accessed on 1 January 2023).
  52. Wang, H.; Yurochkin, M.; Sun, Y.; Papailiopoulos, D.; Khazaeni, Y. Federated learning with matched averaging. arXiv 2020, arXiv:2002.06440. [Google Scholar]
Figure 1. YOLOv5s 6.0 algorithm framework.
Remotesensing 15 03620 g001
Figure 2. 
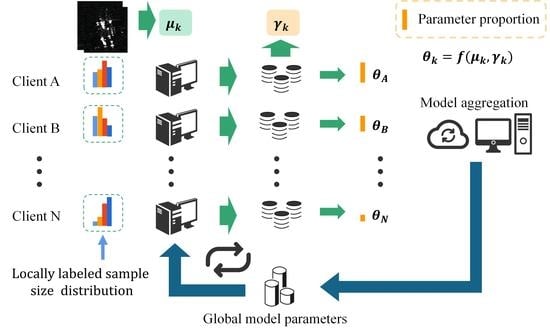
Federated learning framework.
Remotesensing 15 03620 g002
Figure 3. Label samples for all datasets.
Remotesensing 15 03620 g003
Figure 4. Loss functions of clients A, B, C, and D on the multiclass aircraft detection dataset using three training strategies: centralized, federally averaged, and federally distributed mean difference.
Remotesensing 15 03620 g004
Figure 5. Test results of clients A, B, C, and D on a multiclass aircraft detection dataset using three training strategies: centralized, federated average, and federated distributed mean difference, with evaluation metrics of mAP0.5–0.95, all data taken from corresponding communication rounds (number of iterations). The Pre prefix represents the unaggregated local model, and the Post prefix represents the aggregated global model. The four left panels (a,c,e,g) show the test results of each model on the local test set, and the four right panels (b,d,f,h) show the test results of each model on the total test set.
Remotesensing 15 03620 g005
Figure 6. Test results of four clients, A, B, C, and D, on a multi-category aircraft detection dataset using three training strategies, centralized, federated average, and federated distributed mean difference, with evaluation metrics of mAP0.5–0.95. Data are from the centralized training model and the aggregated post model on the total test set.
Remotesensing 15 03620 g006
Figure 7. Performance of the global model (300 epochs) aggregated by FedDAD on the test image of dataset #1. The top is the label sample, and the bottom is the detection effect.
Remotesensing 15 03620 g007
Figure 8. Test results of clients A, B, C, and D on a single-category aircraft detection dataset using three training strategies: centralized, federated average, and federated distributed mean difference, with evaluation metrics of mAP0.5–0.95, all data taken from corresponding communication rounds (number of iterations). The Pre prefix represents the unaggregated local model, and the Post prefix represents the aggregated global model. The four left panels (a,c,e,g) show the test results of each model on the local test set, and the four right panels (b,d,f,h) show the test results of each model on the total test set.
Remotesensing 15 03620 g008
Figure 9. Test results of four clients, A, B, C, and D, on a single-category aircraft detection dataset using three training strategies, centralized, federated average, and federated distributed mean difference, with evaluation metrics of mAP0.5–0.95. Data are from the centralized training model and the post-aggregation model on the total test set.
Remotesensing 15 03620 g009
Figure 10. Experimental results of the MSAR-1.0 dataset. (a): loss of the total training set, Client A centralized training, and federated cooperative training model; (b): Results of centralized training for all clients and test results of Client A’s federated cooperative training model on a local test set, evaluated as mAP0.5(%); (c): Test results of Client A’s centralized training and federated cooperative training model on the total test set, evaluated as mAP0.5(%).
Remotesensing 15 03620 g010
Table 1. Distribution average deviation factors for datasets 1 and 2 at each communication round (30 iterations for one communication round).
DatasetsClient\Epochs3090150210270300
Datasets oneA0.2503600.2438290.2438620.2450970.2455030.245669
B0.2637720.2745250.2705210.2693380.2694290.268085
C0.2346260.2328450.2356850.2353640.2347020.237778
D0.2512420.2475490.2499310.2502000.2503660.248468
Datasets twoA0.2941220.2964080.2972040.2974520.2968860.296913
B0.3017000.3016860.3011790.3015160.3012830.301459
C0.1735740.1722630.1722060.1715680.1721870.171807
D0.2306040.2296420.2294110.2294640.2296440.229821
MSAR-1.0A0.3264560.3041210.3089710.3166630.3189550.316743
B0.2262020.227430.2356250.2469150.2385610.239982
C0.233880.2164030.2161330.2171980.2213010.219898
D0.2134620.2520460.2392710.2192230.2211830.223377
Table 2. Distribution of Dataset 1 and Dataset 2 after dividing into four client datasets A, B, C, and D.
Datasets NameClientTrainTestBoeing 787A220Boeing 737–800OtherA320/321ARJ21A330Aircraft
Datasets oneA1328332535813450159052227860/
B1328332582837418164742840732/
C1328332472871409152539427469/
D1328332516774470144057231988/
Datasets twoA854220///////4484
B854220///////4406
C854220///////1168
D854220///////2578
Table 3. Distribution of MSAR-1.0 after dividing into four client datasets A, B, C, and D.
Datasets NameClientTrainTestShipOil TankBridgeAircraft
MSAR-1.0A63541588949810,9715422243
B6354158810,65176603231471
C6354158811,25336839491379
D6354158811,3478757991275
Table 4. The precision of clients A, B, C, and D using three training strategies, centralized, federated average, and federated distributed mean difference, on the multiclass aircraft detection dataset corresponding to communication rounds (number of iterations).
PClientEpochs306090120150180210240270300
ALocal93.191.592.892.892.191.589.891.891.391.0
FedAvg93.192.992.592.092.392.993.292.591.493.6
FedDAD93.194.293.692.092.890.892.191.894.294.1
BLocal95.096.296.196.897.797.496.997.297.397.7
FedAvg95.095.997.298.197.897.897.697.998.397.9
FedDAD95.095.697.897.898.097.997.998.098.198.4
CLocal91.093.895.894.496.696.895.395.795.995.3
FedAvg91.095.395.092.996.796.196.294.296.396.2
FedDAD91.096.196.493.896.296.895.596.496.696.7
DLocal79.191.693.890.992.392.791.392.192.091.7
FedAvg79.191.793.392.293.894.193.893.994.094.6
FedDAD79.191.592.694.293.294.294.194.394.594.7
Table 5. Recall clients A, B, C, and D using three training strategies, centralized, federated average, and federated distributed mean difference, on the multiclass aircraft detection dataset corresponding to communication rounds (number of iterations).
RClientEpochs306090120150180210240270300
ALocal76.589.793.192.794.295.595.694.994.494.3
FedAvg76.592.694.395.193.995.393.993.895.595.2
FedDAD76.591.893.895.594.695.694.994.894.995.1
BLocal78.692.195.393.695.695.695.395.895.995.8
FedAvg78.695.296.597.298.198.498.398.698.898.7
FedDAD78.695.996.296.497.298.398.298.398.998.8
CLocal85.488.790.892.890.992.193.393.193.092.8
FedAvg85.491.993.498.596.396.997.698.898.297.3
FedDAD85.491.093.996.095.896.197.398.398.798.6
DLocal83.986.789.991.490.690.991.491.590.291.6
FedAvg83.988.294.195.296.596.696.797.397.696.8
FedDAD83.989.994.594.996.696.997.997.697.397.5
Table 6. mAP0.5 of clients A, B, C, and D using three training strategies, centralized, federated average, and federated distributed mean difference, on the multiclass aircraft detection dataset corresponding to communication rounds (number of iterations).
mAP0.5ClientEpochs306090120150180210240270300
ALocal89.192.994.194.094.394.994.994.794.994.9
FedAvg89.194.695.495.895.996.195.495.995.395.4
FedDAD89.194.296.295.595.596.095.895.796.795.8
BLocal83.795.197.697.297.897.397.797.897.797.8
FedAvg83.797.898.399.199.199.399.299.299.399.3
FedDAD83.797.598.798.898.999.299.299.399.499.4
CLocal88.493.393.493.893.894.093.893.993.894.0
FedAvg88.496.697.498.798.798.798.498.698.498.6
FedDAD88.496.698.897.698.398.698.498.598.798.7
DLocal87.591.394.193.394.594.093.894.294.094.1
FedAvg87.593.595.996.596.997.497.597.597.797.7
FedDAD87.593.595.596.997.197.497.797.697.697.9
Table 7. Test results of YOLOv5s, YOLOv7, and YOLOv8s with 300 rounds of centralized training on dataset #1.
ModelSize (Pixels)EpochsmAP0.5–0.95Params (M)FLOPs (B)
YOLOv5s51230089.857.215.8
YOLOv751230089.6437.23105.2
YOLOv8s51230092.5711.1328.5
Table 8. Compensation score (CS) for all customers using FedAvg and FedDAD in federated cooperation.
DatasetsMethodClient AClient BClient CClient D
Datasets #1FedAvg4.6910.6314.2713.11
FedDAD(ours)5.9612.6514.6715.00
Datasets #2FedAvg24.8717.7635.0733.20
FedDAD(ours)30.6523.4538.8839.42
MSAR-1.0FedAvg3.045.117.493.44
FedDAD(ours)3.796.088.203.61
Disclaimer/Publisher’s Note: The statements, opinions and data contained in all publications are solely those of the individual author(s) and contributor(s) and not of MDPI and/or the editor(s). MDPI and/or the editor(s) disclaim responsibility for any injury to people or property resulting from any ideas, methods, instructions or products referred to in the content.

