Article

Assessment of Spatiotemporal Patterns and the Effect of the Relationship between Meteorological Drought and Vegetation Dynamics in the Yangtze River Basin Based on Remotely Sensed Data

1
The Academy of Digital China, Fuzhou University, Fuzhou 350002, China
2
Key Laboratory of Ecosystem Network Observation and Modeling, Institute of Geographic Sciences and Nature Resources Research, Chinese Academy of Sciences, Beijing 100101, China
3
School of Resource Engineering, Longyan University, Longyan 364012, China
4
State Key Laboratory of Multimodal Artificial Intelligence Systems, Institute of Automation, Chinese Academy of Sciences, Beijing 100190, China
*
Author to whom correspondence should be addressed.
These authors contributed equally to this work.
Remote Sens. 2023, 15(14), 3641; https://doi.org/10.3390/rs15143641
Submission received: 17 May 2023 / Revised: 15 July 2023 / Accepted: 17 July 2023 / Published: 21 July 2023

Abstract

:
Global climate change and human activities have increased the frequency and severity of droughts. This has become a critical factor affecting vegetation growth and diversity, resulting in detrimental effects on agricultural production, ecosystem stability, and socioeconomic development. Therefore, assessing the response of vegetation dynamics to drought can offer valuable insights into the physiological mechanisms of terrestrial ecosystems. Here, we applied long-term datasets (2001–2020) of solar-induced chlorophyll fluorescence (SIF) and normalized difference vegetation index (NDVI) to unveil vegetation dynamics and their relationship to meteorological drought (SPEI) across different vegetation types in the Yangtze River Basin (YRB). Linear correlation analysis was conducted to determine the maximum association of SPEI with SIF and NDVI; we then compared their responses to meteorological drought. The improved partial wavelet coherence (PWC) method was utilized to quantitatively assess the influences of large-scale climate patterns and solar activity on the relationship between vegetation and meteorological drought. The results show that: (1) Droughts were frequent in the YRB from 2001 to 2020, and the summer’s dry and wet conditions exerted a notable influence on the annual climate. (2) SPEI exhibits a more significant correlation with SIF than with NDVI. (3) NDVI has a longer response time (3–6 months) to meteorological drought than SIF (1–4 months). Both SIF and NDVI respond faster in cropland and grassland but slower in evergreen broadleaf and mixed forests. (4) There exists a significant positive correlation between vegetation and meteorological drought during the 4–16 months period. The teleconnection factors of Pacific Decadal Oscillation (PDO), El Niño Southern Oscillation (ENSO), and sunspots are crucial drivers that affect the interaction between meteorological drought and vegetation, with sunspots having the most significant impact. Generally, our study indicates that drought is an essential environmental stressor that disrupts vegetation growth over the YRB. Additionally, SIF demonstrates great potential in monitoring vegetation response to drought. These findings will be meaningful for drought prevention and ecosystem conservation planning in the YRB.

Graphical Abstract

1. Introduction

In the context of global warming, the frequency and intensity of droughts have significantly increased [1,2,3]. Generally, droughts occur based on a decreasing rate of regional precipitation or an increasing rate of evaporation caused by rising temperatures [4,5,6], which have crucial negative impacts on agricultural production, water resources, ecosystems, and socioeconomic development [7,8,9]. Terrestrial vegetation, as a major component of terrestrial ecosystems and a natural link between soil, atmosphere, and water, is highly vulnerable to drought events that can reduce species productivity and diversity [10,11]. Moreover, changes in atmospheric carbon dioxide are closely related to alterations in carbon uptake in terrestrial ecosystems, and regions affected by long-term drought can have an impact on the carbon cycle within their ecosystems [10]. Therefore, it is crucial to monitor meteorological drought and vegetation dynamics from regional to global scales in a timely and accurate manner to support agricultural production, ecological management, and restoration, as well as human adaptation to climate change [12].
Recently, a variety of drought indices have been proposed for assessing drought situations [13], including the Palmer Drought Index (PDSI) [14], Standardized Precipitation Index (SPI) [15], and Standardized Precipitation Evapotranspiration Index (SPEI) [16]. Among them, SPEI is particularly suitable for evaluating drought under climate change, as it considers both precipitation and evapotranspiration [17,18]. In contrast to PDSI and SPI, SPEI not only involves multiple time scales but also a comprehensive set of drought-related natural factors [16,19]. Consequently, it is regarded as a better drought index than the others. The impact of drought events on vegetation can be monitored and assessed using remote sensing satellite data across large spatial scales [20,21]. Traditional vegetation indices, such as the normalized difference vegetation index (NDVI) and enhanced vegetation index (EVI), have been widely employed to evaluate vegetation dynamics in response to drought [22,23]. However, previous studies utilizing NDVI and EVI data have indicated a time lag between vegetation dynamics and meteorological factors such as precipitation and air temperature [24,25]. This may be because NDVI and EVI primarily capture changes in vegetation greenness rather than direct plant photosynthesis [6]. Nowadays, solar-induced chlorophyll fluorescence (SIF) has emerged as an innovative and effective variable for monitoring plant photosynthesis [12,26,27]. Satellite-based SIF presents a new method for tracking vegetation dynamics from space, enabling the monitoring and prediction of global vegetation growth status [20,28]. Numerous studies have confirmed the direct association between chlorophyll fluorescence and vegetation photosynthesis, allowing for the rapid reflection of dynamic vegetation changes under drought stress, such as water or heat stress [28,29,30,31]. Therefore, we applied SIF data to investigate the relationship between vegetation and meteorological drought, comparing it with NDVI in our study.
Additionally, a growing body of research suggests that large-scale climate patterns and solar activity, such as the Pacific Decadal Oscillation (PDO), El Niño Southern Oscillation (ENSO), and sunspots, play crucial roles in impacting drought and vegetation growth on global and regional scales [24,31,32]. This is attributed to the significant impact of PDO and ENSO on climate elements such as temperature and precipitation, thereby influencing both regional and global climate conditions [31,33,34,35]. Moreover, sunspot activity is closely related to solar radiant intensity and global climate change, indirectly affecting vegetation growth [36]. Currently, there is an increasing interest in exploring teleconnection factors and their remote relationship to drought and vegetation. Many studies have utilized wavelet coherence (WTC) and cross-wavelet coherence methods to investigate the influence of large-scale climate patterns and solar activity on drought or vegetation [3,37,38,39]. However, these expositions are unsatisfactory because they barely mention the effects of teleconnection factors on the interaction of drought and vegetation. The partial wavelet coherence (PWC) method can effectively isolate a specific influence factor and establish the relationship between two variables. Recent improvements to PWC have equipped it with the capability to handle multiple excluded variables, providing a notable advantage over previous methods [40].
In recent years, several drought events have occurred in the YRB. For example, in the spring of 2011, the middle and lower reaches of the YRB encountered an unprecedented drought event, the most severe in 50 years since records began in 1961. As a consequence, millions of hectares have been devastated, posing significant implications for agriculture [41]. Furthermore, multiple studies have emphasized that future droughts in the YRB are projected to increase in frequency, severity, and duration, as indicated by the CMIP5 output [42,43]. However, there is a lack of studies examining the impact of drought on watershed ecosystems, and the response mechanisms of terrestrial ecosystems to drought in the YRB are intricate [12]. Therefore, the precise and prompt monitoring of changes in vegetation dynamics under drought stress and the response of vegetation to drought will provide new insights into the effects of climate change on terrestrial ecosystem functions.
Thus, this study aims to capture the spatiotemporal evolution of meteorological drought and dynamic changes in vegetation across the YRB from 2001 to 2020. Moreover, it seeks to quantify vegetation responses to meteorological drought using multiscale data from SPEI, NDVI, and SIF. The study examines the effect of meteorological drought on SIF and NDVI while also comparing their distinct responses to meteorological drought. Additionally, for this study, the improved PWC method was utilized to assess the effects of teleconnection factors on the relationship between meteorological drought and vegetation.

2. Materials and Methods

2.1. Study Area

The Yangtze River Basin (YRB) encompasses 90°–122°E and 24°–35°N, covering the Yangtze River and its tributaries (Figure 1a). It covers approximately 20% of China’s land area (1.8 million km2), more than 36% of the country’s water resources, and is home to nearly 33% of its population. Additionally, the YRB contributes approximately 40% of the China’s total GDP, making it one of the most significant and vital regions in China [44]. The YRB, located in a typical East Asian monsoon region, is highly sensitive and vulnerable to climate change because of its unique geographical location, distinct temperature gradients from sea to land, and seasonal changes in atmospheric circulation [45]. In recent decades, the YRB has experienced growing vulnerability to severe and extreme climate change, which poses a threat to the region’s food production, vegetation growth, river runoff hydrological conditions, and water resource supply [44]. Figure 1b shows the land cover of the YRB region, classified based on the International Geosphere-Biosphere Program (IGBP). The vegetation ecosystem in the YRB is mainly composed of Evergreen Needleleaf Forest (ENF), Evergreen Broadleaf Forest (EBF), Deciduous Broadleaf Forest (DBF), Mixed Forest (MF), Woody Savannas (WSA), Savanna (SA), Grassland (GRA), Cropland (CRO), and Dryland (DL).

2.2. Datasets

In this study, we utilized various datasets to investigate the remote relationship among large-scale climate patterns, solar activity, meteorological drought, and vegetation in the YRB. The solar-induced chlorophyll fluorescence data were obtained from the global monthly GOSIF dataset (https://globalecology.unh.edu/data/GOSIF.html, accessed on 17 July 2022) [26]. The GOSIF product, based on OCO-2 SIF datasets, offers improved spatial resolution, continuous worldwide coverage, and a longer observation period [31]. Spanning from 2001 to 2020, the SIF data possess a temporal resolution of 1 month and a spatial resolution of 0.05°.
The NDVI data and land cover data used in this study were acquired from the Model Resolution Imaging Spectrometer (MODIS) [3]. The MODIS NDVI datasets (MOD13C2) offer a temporal resolution of 1 month and a spatial resolution of 0.05° [11]. The MODIS land cover type datasets (MCD12C1) with a spatial resolution of 0.05° were reclassified according to the IGBP classification to explore different vegetation types and their responses to meteorological drought.
The SPEI data, ranging from one to twelve months, was obtained from the global monthly SPEI gridded dataset (https://digital.csic.es/handle/10261/268088, accessed on 22 August 2022) [11], which covers a period from 2001 to 2020 and has a spatial resolution of 0.5°. The first month of SPEI at different time scales represents the current month, while for a time scale of n months, it extends from the current month to n − 1 months in time. The classification of SPEI drought levels, based on meteorological drought grade standards, is presented in Table 1 [46]. This dataset is widely utilized and has been demonstrated to be an efficient indicator for discerning different types of drought events [11,47]. To support collaborative research involving multi-source remote sensing data, the SPEI data were downscaled to a spatial resolution of 0.05° using bilinear interpolation.
In addition, this study utilized the data of PDO, ENSO, and sunspots from 2001 to 2020 to investigate the remote relationships of teleconnection factors with meteorological drought and vegetation. Monthly PDO and ENSO data were obtained from the National Oceanic and Atmospheric Administration (https://psl.noaa.gov/data/climateindices/list/, accessed on 17 October 2022). Sunspot data were provided by the International Council for Science World Data System (https://www.sidc.be/silso/home, accessed on 17 October 2022).

2.3. Methods

The flowchart that demonstrates the main concepts of this study, including data sources, preprocessing, methods, and results, is presented in Figure 2. Firstly, the multi-scale drought index (SPEI) was employed to explore the spatiotemporal characteristics of meteorological drought through Sen slope estimation and the Mann–Kendall nonparametric test. Then, the Spearman correlation method was applied to evaluate the correlations of SIF and NDVI with SPEI while also examining their differential responses to meteorological drought. Finally, the role of PDO, ENSO, and sunspots in the relationship between meteorological drought and vegetation was assessed using PWC and WTC methods.

2.3.1. Calculation of Standardized Anomaly

By calculating the anomalies of SIF and NDVI to analyze their effectiveness and variability in monitoring regional vegetation drought stress, the anomalies of SIF and NDVI were calculated as [48]:
S A i , j = V a r ( i , j ) V a r ( i , j ) ¯ S T D ( V a r ( i , j ) ¯ )
where S A i , j denotes the anomaly; V a r ( i , j ) denotes the value of SIF (NDVI) for a certain period; V a r ( i , j ) ¯ denotes the monthly averages of SIF (NDVI) from 2001 to 2020; S T D ( V a r ( i , j ) ¯ ) is the standard deviation.

2.3.2. Trend Analysis Method

Sen slope estimation and the Mann–Kendall (M–K) nonparametric test were applied to evaluate the trends and spatial heterogeneity of the SPEI over the time series [49]. The M–K test is a nonparametric test based on the Sen slope estimator, which has been widely employed for detecting trends in meteorological and hydrological time series [50].

2.3.3. Correlation Analysis

Spearman correlation analysis was employed to determine the correlation coefficients between multi-scale SPEI (SPEI1-12) and vegetation indices (SIF and NDVI) to investigate the relationship between meteorological drought and vegetation [9,45,51]. Compared to Pearson correlation, this method is less sensitive to outliers. Additionally, it does not depend on the distribution of variables and applies to various types of data, making it suitable for a wider range of applications [20,52,53]. We calculated the correlation coefficients and tested their significance (p < 0.05) using the following equation:
R s = 1 ( 6 i = 1 n d i 2 ) n ( n 2 1 )
where d i is the positional difference (the position where the values are arranged in ascending order) between the SPEI index and vegetation index (NDVI and SIF) for each grid cell; n represents the number of grid cells. The correlation coefficient ( R s ) ranges from −1 to 1, with a value closer to 1 indicating a stronger positive correlation, a value closer to −1 indicating a stronger negative correlation, and a value closer to 0 suggesting a weaker correlation. In this study, the response time of vegetation to meteorological drought was defined as the time scale at which the maximum absolute value of the correlation coefficient was observed, ranging from 1 to 12 on a monthly time scale.

2.3.4. Wavelet Coherence

Wavelet coherence (WTC) reveals the correlation between two time series by extracting time–frequency events [31]. For any two time series x and y, WTC can be defined as follows [54]:
R n 2 ( a , τ ) = | S ( a 1 W n x y ( a , τ ) ) | 2 S ( |   a 1 W n x ( a , τ ) | 2 ) ( |   a 1 W n y ( a , τ ) | 2 )
where S is the smoothing operator, W n x ( a , τ ) and W n y ( a , τ ) are the wavelet transforms of time series x and y at scale a and location τ , and W n x y ( a , τ ) is the cross-wavelet spectrum of x and y [32]. The value ( R n 2 ( a , τ ) ) is taken in the range of [0–1], and the better the correlation between the two sequences, the closer the value is to 1.

2.3.5. Partial Wavelet Coherence

WTC may not accurately reflect the coherence relationship between two variables in the presence of intervening effects from other factors. To tackle this issue, partial wavelet coherency (PWC) has been proposed. However, PWC is limited to excluding a single variable [40]. The improved PWC analysis enables the examination of wavelet coherence in the time–frequency domain after removing the effect of other factors [3]. For a more detailed description and calculation process of the improved PWC, please refer to the study conducted by Hu and Si [40]. Here are the expressions for the three variables, along with the new PWC formulas:
ρ y x , z 2 = | γ y , x a , τ γ y , z a , τ γ x , z a , τ ¯ | 2 ( 1 R ( y , z ) 2 ( a , τ ) ) ( 1 R ( x , z ) 2 ( a , τ ) )
where ρ y x , z 2 represents the PWC of x and y without the influence of z; γ y , x a , τ , γ y , z a , τ , and γ x , z a , τ denote the complex wavelet coherence between x and y at scale a and location τ ; R ( y , z ) 2 ( a , τ ) and R ( x , z ) 2 ( a , τ ) are the bivariate wavelet coherence of the two variables [40]. Using Monte Carlo methods, the statistical significance values for both the WTC and PWC studies are estimated.

3. Results

3.1. Temporal Variation and Spatial Patterns of Meteorological Drought

3.1.1. Temporal Dynamics of Multi-Scale SPEI

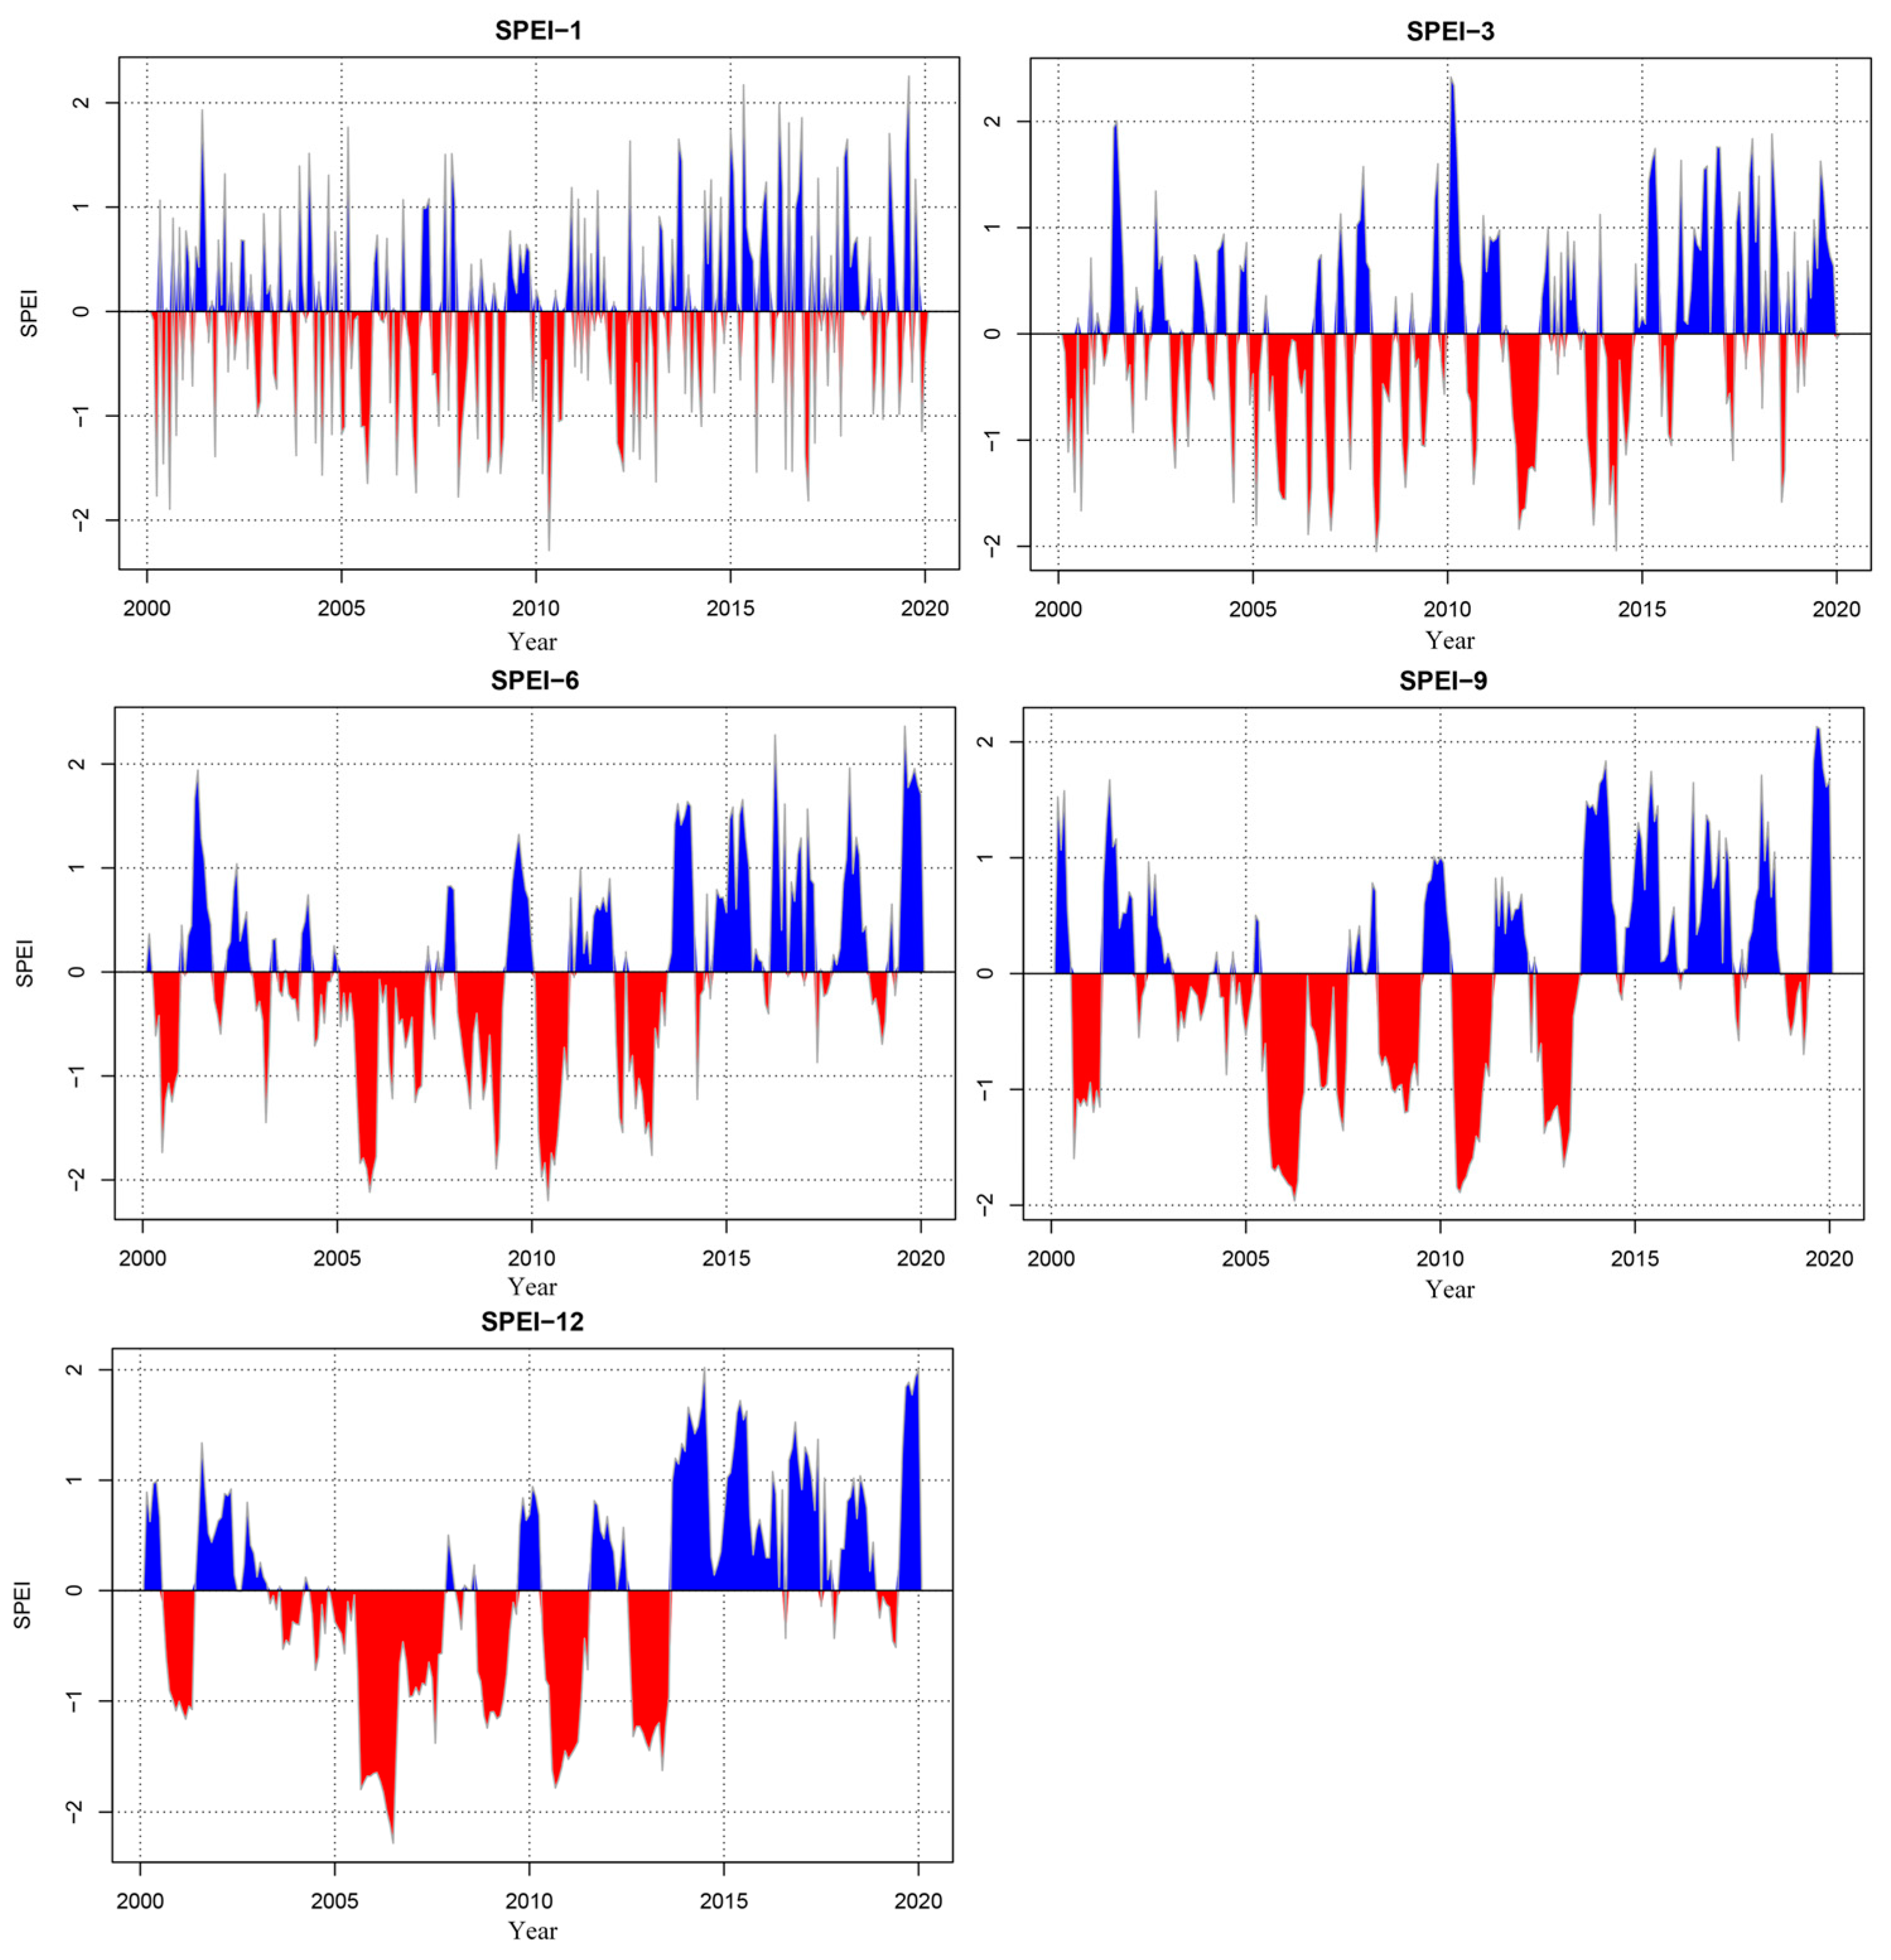
The 20-year variations of monthly SPEI values at different time scales (SPEI-1, SPEI-3, SPEI-6, SPEI-9, and SPEI-12) were calculated by averaging the SPEI values of all pixels in the YRB (Figure 3). The monthly values of SPEI-1 exhibited both positive and negative fluctuations during the study period without showing a clear pattern. However, as the time scale of SPEI increased, a predominantly negative trend emerged from 2001 to 2015, with the monthly scale at 53.89%, the seasonal scale at 61.11%, the June scale at 65.56%, the September scale at 60.0%, and the annual scale at 63.89%. Consequently, longer time scales were found to be more effective in capturing periodic changes in meteorological drought occurrence compared to shorter time scales. Additionally, the frequency of negative months exceeded that of positive months during 2001–2015, indicating that the YRB experienced more frequent and sustained dry conditions.

3.1.2. Spatial Characteristics of Multi-Scale SPEI

Generally, dry and wet conditions are closely related to drought, and gaining insights into the long-term variations of dry and wet conditions in the YRB can greatly enhance drought monitoring efforts. Therefore, in this study, we conducted an analysis of the trend distribution of the SPEI for annual, spring, summer, and autumn to investigate the spatial characteristics of dry and wet conditions across the YRB (Figure 4a–d). Moreover, we assessed the proportion of pixels exhibiting different trend changes on an annual and seasonal basis (Figure 4e), aiming to provide a comprehensive understanding of drought dynamics in the region.
The results revealed that fewer significant drying areas were observed, as the majority of observed trends failed the 95% significance test. Specifically, the annual SPEI trend showed that significant wet areas were predominantly distributed in the northwest, south, and northeast of the YRB (Figure 4a). Conversely, dry areas make up 19.54% of the entire study area (0.40% for significantly dry), with the majority located in the western grassland areas of the YRB and the northeastern cropland areas. During the spring SPEI trend (Figure 4b), significant wetting areas were primarily concentrated in the delta and southeastern portions, while dry areas were mainly dispersed in the southwest and west of the YRB. These dry regions accounted for 17.90% of the study area, with approximately 1% classified as significantly dry. In contrast, the summer SPEI trend revealed a lack of significant wet areas, with 63.91% of the areas displaying a dry trend, including 4% exhibiting a significant dry trend (Figure 4c). The areas experiencing summer drought were primarily concentrated in the west, southwest, and north regions of the YRB, encompassing extensive cropland and grassland, which significantly impacted agricultural and forestry production. There were almost no significant dry areas in the fall SPEI trend (Figure 4d), and the predominantly dry areas (7.66%) were mainly concentrated in the southwest of the YRB. The significantly wet areas were mostly located in the central, southern, and northwestern parts. Overall, the distribution of the summer’s SPEI trend exhibited the most notable variations in wet and dry conditions compared to other seasons. This finding indicates that the wet and dry conditions during the summer had significant impacts on the annual climate of the YRB.

3.2. Relationship between Vegetation Dynamics and Meteorological Drought

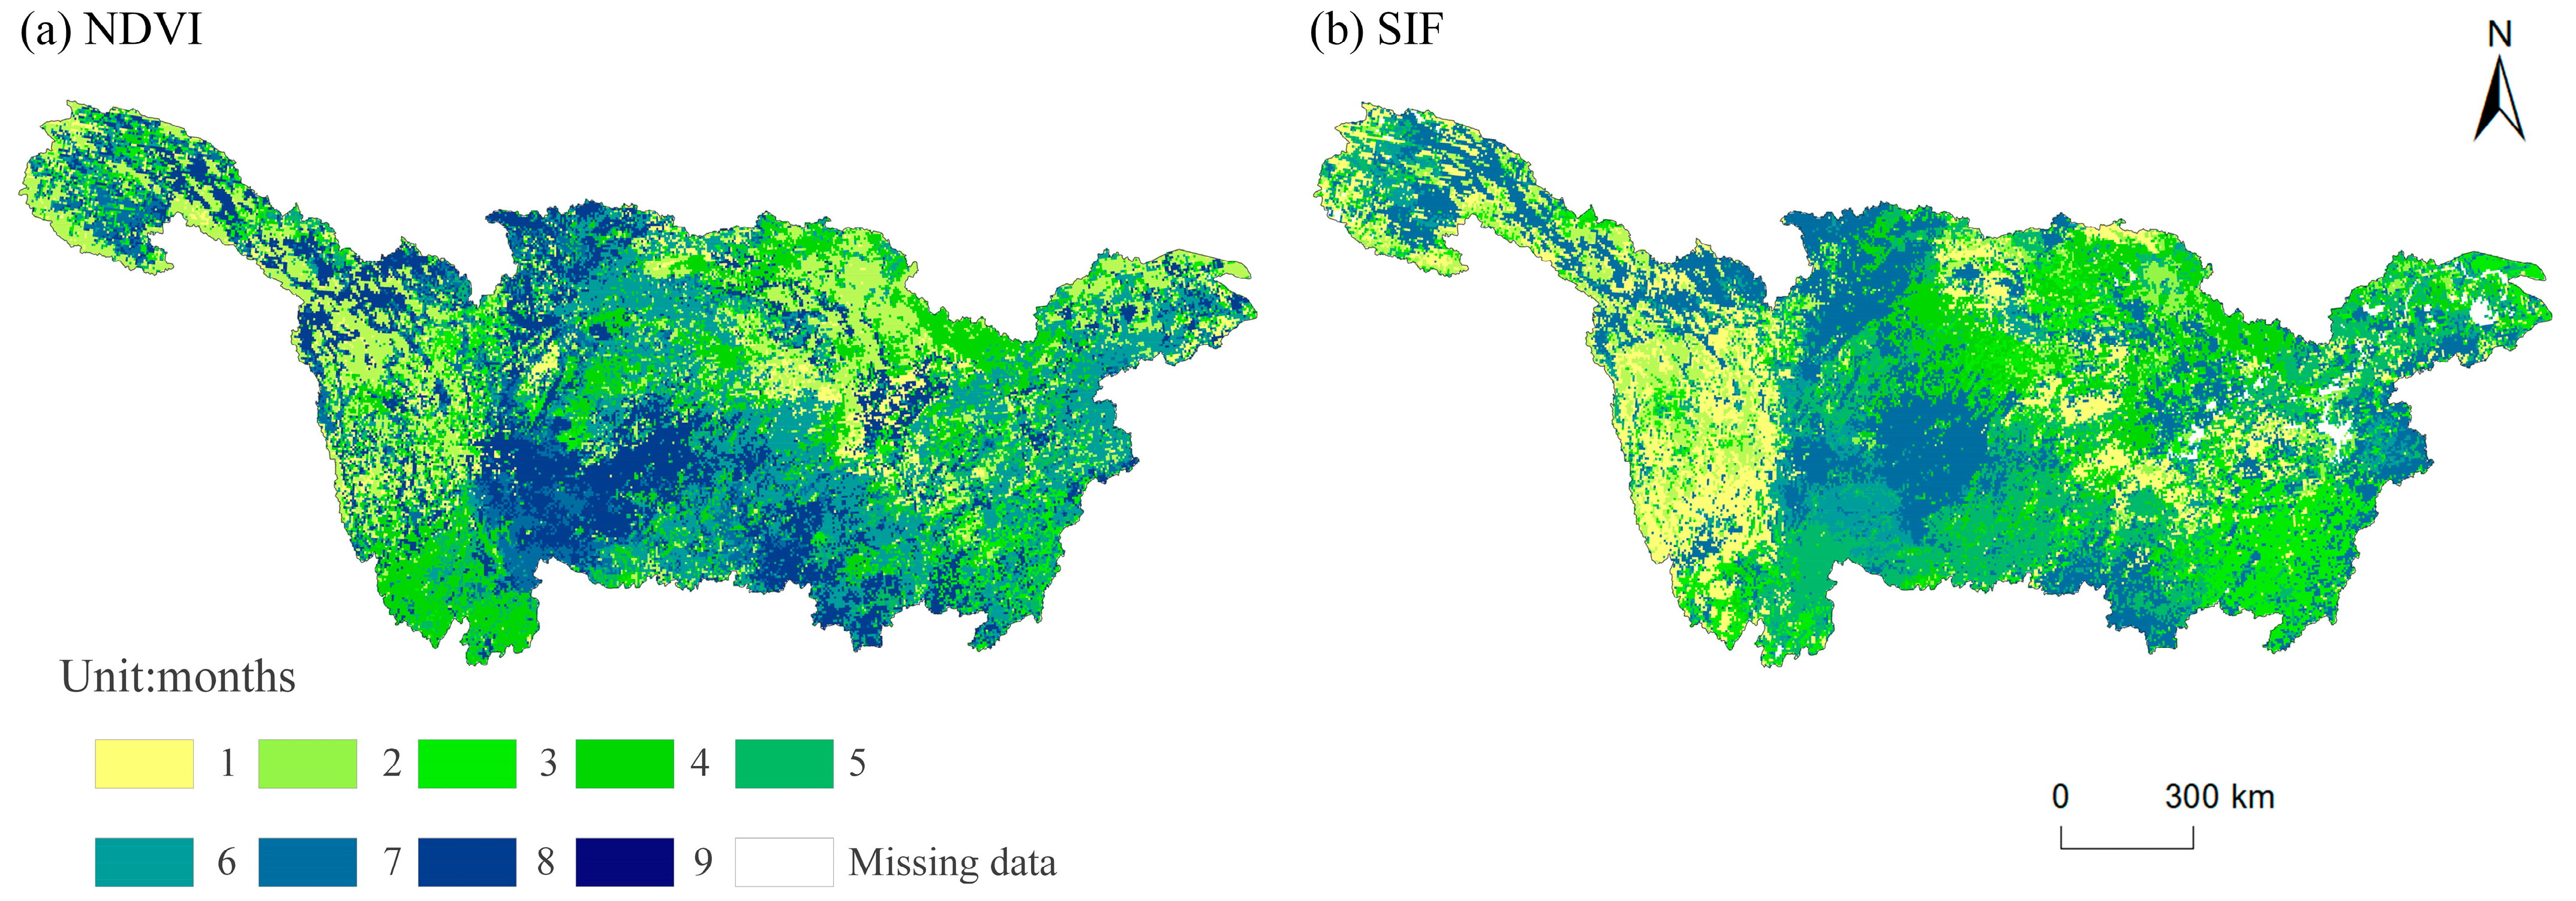
To explore the relationship between vegetation dynamics and meteorological drought, this study focused on determining the maximum correlation coefficients (MSCC) of NDVI and SIF with SPEI on the monthly time scale (SPEI1-12) and identified the response times. There was a tight association between meteorological drought and NDVI in the YRB (Figure 5). The MSCC ranged from −0.58 to 0.66, and the positive correlation coefficients were mostly statistically significant (p < 0.05). In contrast, SIF exhibited a stronger correlation with meteorological drought in the YRB, with MSCC ranging from −0.67 to 0.69. Furthermore, a significant association between SPEI and SIF was observed, with most positive correlation coefficients being statistically significant (p < 0.05). In general, NDVI and SIF exhibited similar spatial distribution patterns in terms of vegetation response to meteorological drought. However, SIF demonstrated a faster response to meteorological drought than NDVI in the YRB (Figure 6). Specifically, the response time of NDVI (VRTN) varied from 1 to 9 months, with most regions (62.74%) showing response times between 3 and 6 months, with 6 months being the most prevalent. In contrast, the response time of SIF (VRTS) was shorter, with a range of 1 to 7 months. The majority of areas (66.39%) indicated response times between 1 and 4 months, with March (18.33%), April (17.58%), and January (16.21%) accounting for a larger proportion.
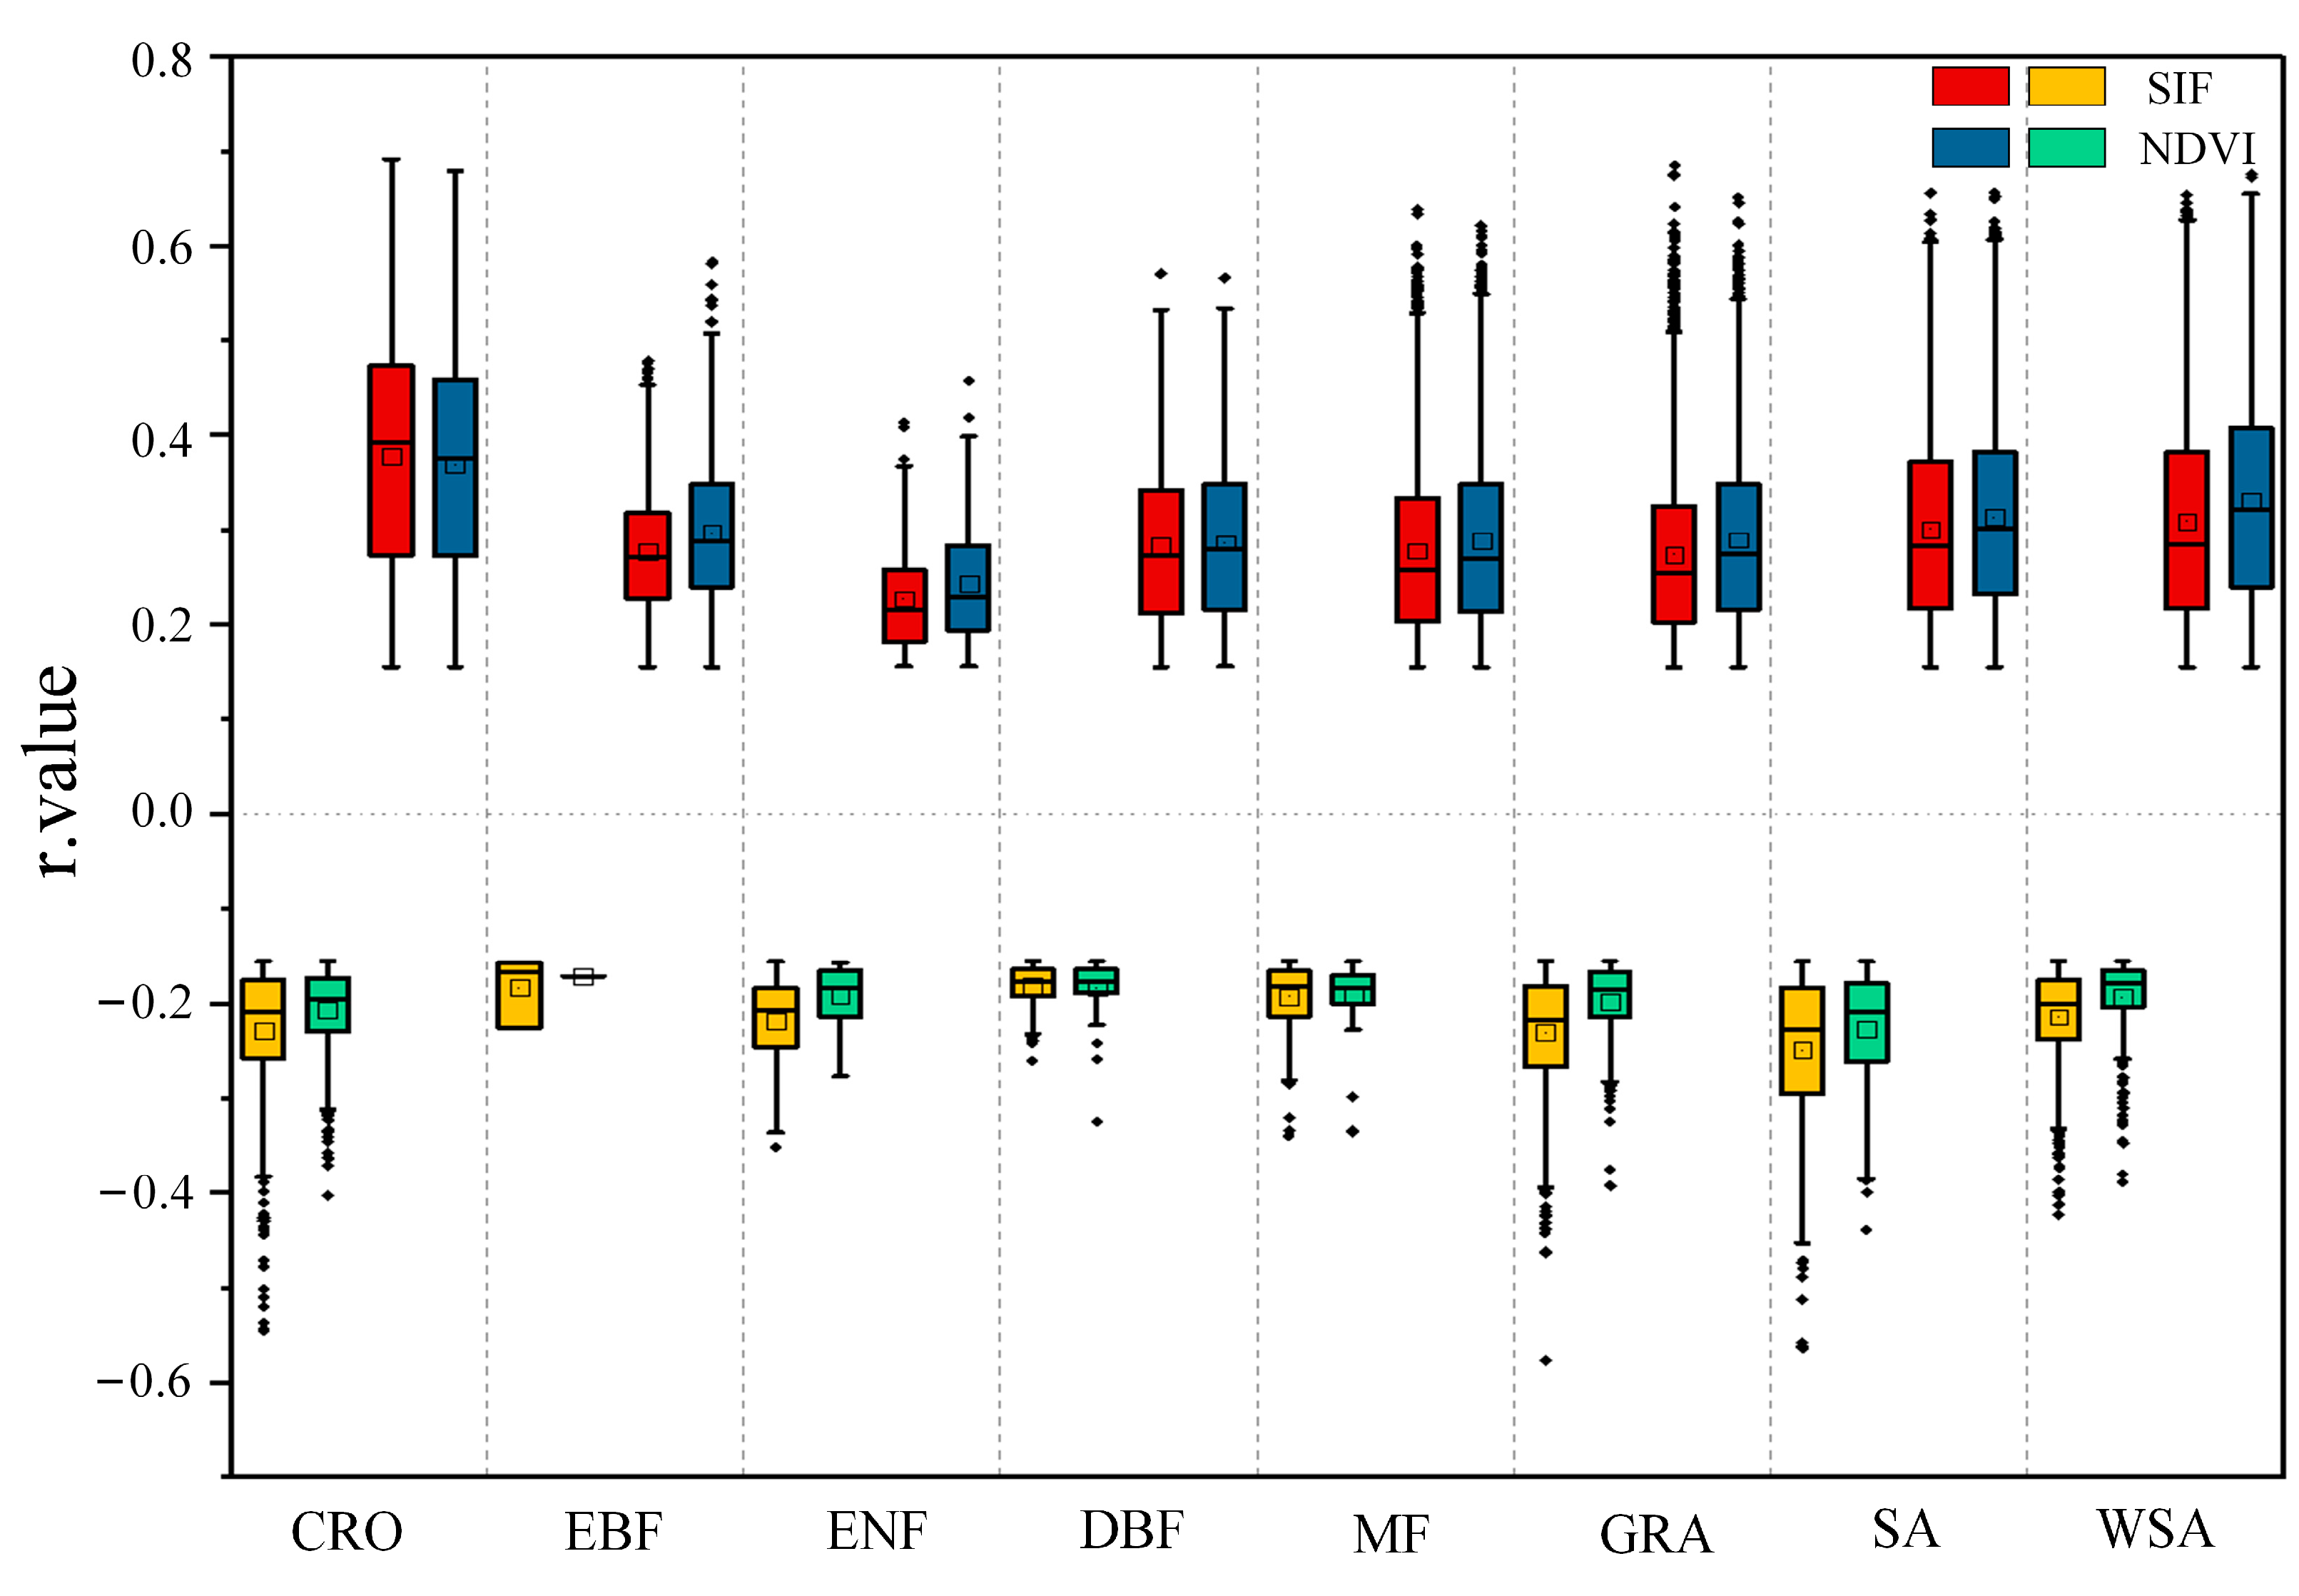
The MSCC and response times of various vegetation types to meteorological drought indicate the varying drought resistance of different ecosystems. The MSCCs based on SIF and NDVI were calculated for different vegetation types in the YRB, and the correlation coefficient r values were statistically significant (p < 0.05). Both SIF and NDVI exhibited similar levels of correlation (Figure 7), with stronger positive correlations compared to negative correlations. Among the vegetation types, DL showed the strongest positive correlation coefficient, with SIF values ranging from about 1.7 to 4.8 and NDVI values ranging from approximately 1.7 to 4.5, followed by CRO, WSA, and SA. Except for DL and CRO, the positive correlation values of SIF were generally lower compared to NDVI for other vegetation types. On the other hand, when considering negative correlation, the correlation coefficients for NDVI were weaker than those for SIF. The SA exhibited the highest correlation coefficients for both SIF and NDVI, ranging from −0.2 to −0.3 and −0.19 to −0.27, respectively. In contrast, the EBF showed the weakest negative correlation coefficients for NDVI, with essentially no negative correlation observed. Similarly, the DBF forest had the weakest negative correlation for SIF, with a correlation coefficient of approximately −0.18 to −0.2. Overall, drought had a significant impact on various grasslands and cultivated lands, while its impact on broad-leaved forests and MF was comparatively lower. Table 2 provides a summary of the response times for each vegetation type. The VRTN values showed a gradual decline from the forest (5.894 months) to grassland (5.357 months) and cropland (5.184 months). Similarly, the VRTS values followed the same order as the VRTN but were smaller in magnitude. Herbaceous plants exhibited the shortest response time (4.696 months), followed by woody plants (4.339 months) and croplands (4.132 months). Generally, herbaceous plants displayed shorter response times to meteorological drought compared to woody plants. In short, SIF demonstrated a significant response and a quicker reaction to drought during the study period than NDVI.

3.3. Effects of Teleconnection Factors

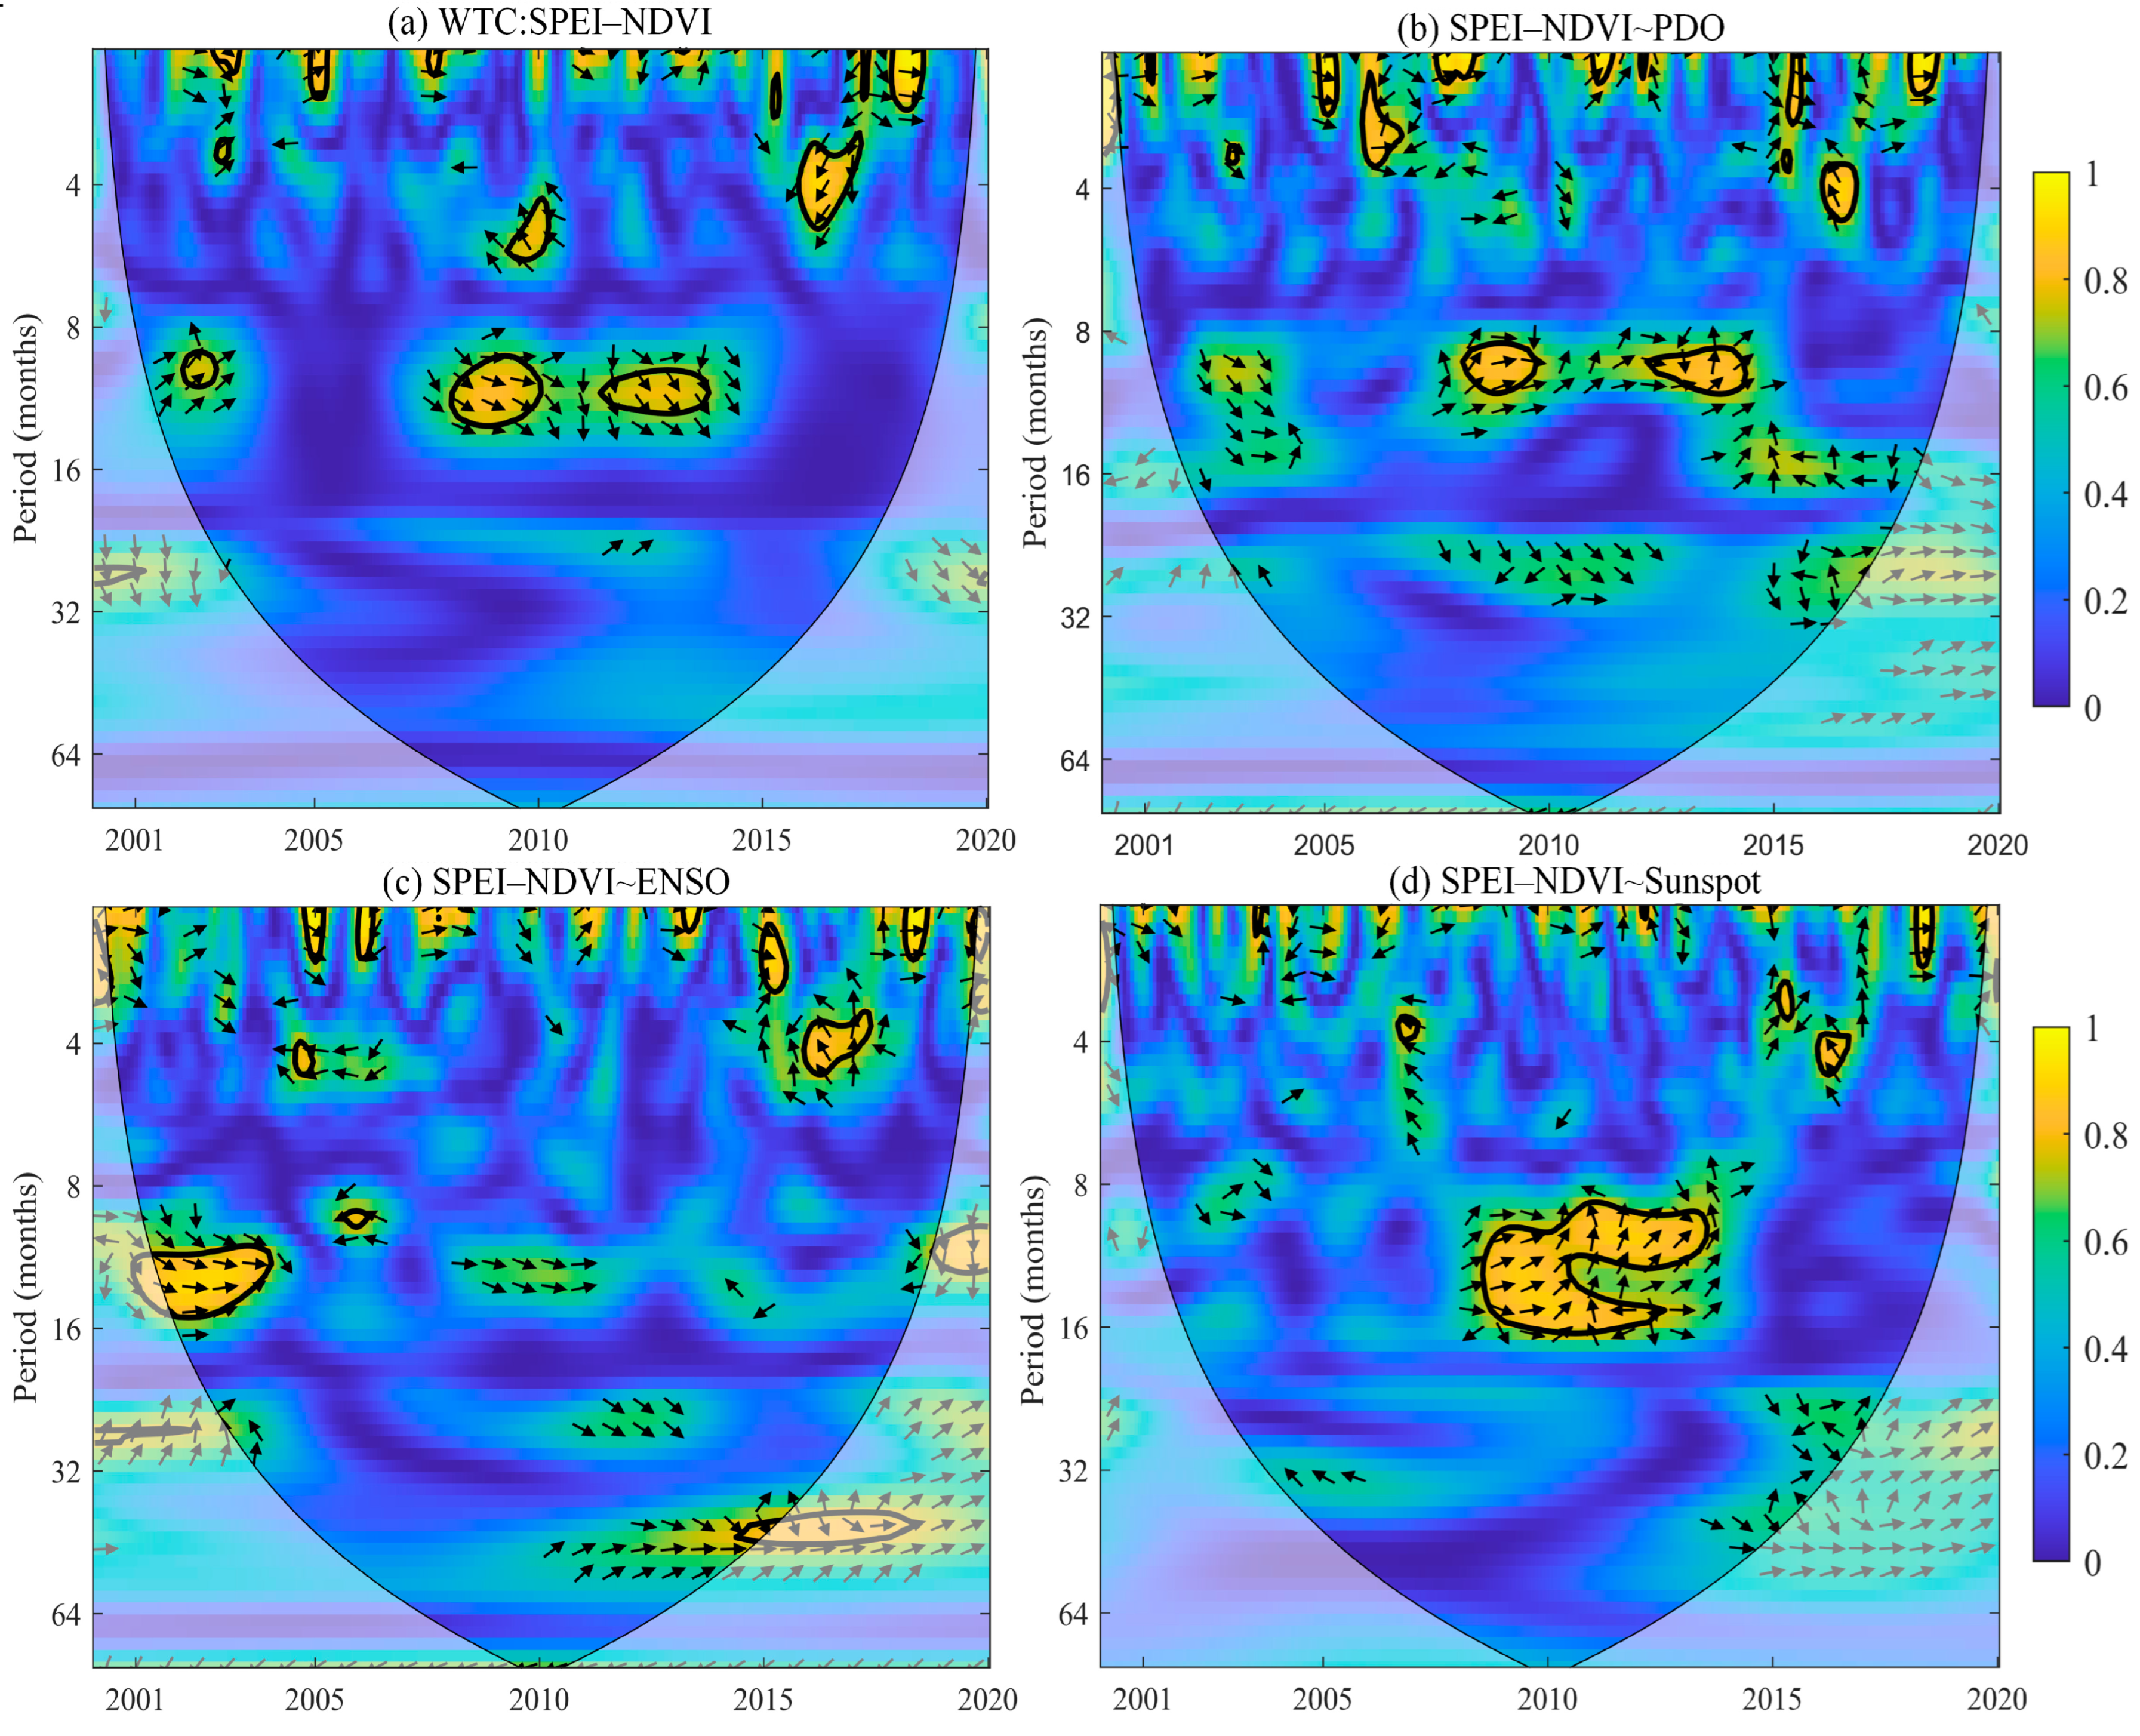
Revealing the correlation between teleconnection factors and the relationship between vegetation and drought is crucial to exploring the mechanisms of drought and dynamic changes in vegetation under drought stress in the YRB. This study utilized WTC and PWC methods to differentiate the influence of PDO, ENSO, and sunspots on the vegetation–drought relationship. Given the information provided in the previous chapter, representative examples were chosen with 6 months of VRTN and 4 months of VRTS. By altering the percentage of the significant coherent area (PASC) at different scales, we conducted a quantitative analysis of the impact of teleconnection factors on the relationship between meteorological drought and vegetation. Figure 8 and Figure 9 presented the WTC of SPEI–NDVI and SPEI–SIF, respectively, along with the PWC results obtained after removing the influences of PDO, ENSO, and sunspots. Based on the cycle scale, the correlation diagrams were separated into three sections: small-scale (<8 months), medium-scale (8–32 months), and large-scale (>32 months). Table 3 provides information on the total change in the PASC and the change observed after considering each teleconnection factor.
During the study period, a significant positive correlation between SPEI and NDVI was observed, displaying periodic patterns. There existed a markedly positive correlation at the medium scale during 2008–2010 and 2011–2014, with a periodicity of 9–14 months. When the effects of PDO and ENSO on the relationship between SPEI and NDVI were eliminated, there was an increase of 5.60% and 3.57% in PASC at small scales, respectively. However, at medium scales, a decrease of 1.07% and 0.87%, respectively, was observed. At large scales, the removal of PDO resulted in a decrease of 0.24% in PASC, while ENSO led to an increase of 2.18%. Likewise, after excluding the function of sunspots from the relationship of SPEI–NDVI, PASC rose by 5.95% at the small scale but declined by 1.03% and 0.24% at the medium and large scales, respectively. PASC was not observed at large scales for both PDO and sunspots, resulting in a 0.24% decrease. When all three factors were eliminated, the total PASC increased by 4.90%, 4.30%, and 4.68% for PDO, ENSO, and sunspots, respectively. In summary, sunspots exerted a significant impact on the SPEI–NDVI association at small and medium scales, followed by PDO and ENSO. Moreover, ENSO could be an important factor influencing the relationship between SPEI and NDVI at a large scale.
Compared to NDVI, SIF displayed a significantly positive correlation and periodic patterns with SPEI at small scales, in contrast to a negative correlation observed at large scales. Specifically, from 2008 to 2014, the mesoscale exhibited a significant positive correlation with a cycle of 10–14 months and a significant negative correlation with a cycle of 24–32 months. When the influence of PDO was eliminated from the SPEI–SIF association, there was a reduction of 0.12%, 0.73%, and 0.67% in PASC at the small, medium, and large scales, respectively, resulting in a total decrease of 1.52%. Excluding the impact of ENSO from the connection between SPEI and SIF led to a decline of 0.83% and 2.67% in PASC at the small and medium scales, respectively, but an increase of 0.18% at large scales. Consequently, there was an overall decrease of 3.32% in PASC. Furthermore, after removing the influence of sunspots from the SPEI–SIF linkage, PASC decreased by 2.02% at the small scale but grew by 0.77% and 3.80% at the medium and large scales, respectively, resulting in an overall fall of 2.54%. Generally, sunspots exerted a more pronounced impact on the association of SPEI–SIF than PDO and ENSO, particularly at small and large scales. At the medium scale, ENSO played a major role in the mesoscale relationship between SPEI and SIF. In conclusion, these findings highlight the more significant influence of sunspots on the interaction between meteorological drought and vegetation, surpassing the impact of PDO and ENSO.

4. Discussion

4.1. Analysis of Drought Sensitivity to SIF and NDVI

The relationship between SPEI and vegetation indices (SIF and NDVI) not only provides insights into the impact of drought on vegetation but also highlights the divergent capabilities of SIF and NDVI in monitoring drought conditions [31]. The analysis of Figure 5 and Figure 8 revealed a stronger correlation between SPEI and SIF compared to NDVI, and VRTS was shorter than VRTN. These results indicated that SIF was more responsive to short-term water stress but less sensitive to long-term water stress than NDVI [31]. Unlike NDVI, which serves as an indirect indicator of vegetation’s physiological structure, SIF directly represents plant photosynthesis [28]. Previous studies have shown that the fluorescence yield of C3 plant leaves decreases under water stress, and drought has a more sensitive effect on fluorescence than on vegetation canopy greenness [30]. Thus, SIF exhibits a faster response to drought, which is crucial for the early monitoring and management of vegetation during drought conditions.
In addition, it is important to note that vegetative ecosystems respond differently to drought, which is influenced by factors such as community structure, biodiversity, and water use methods [11] (Table 2). Generally, herbaceous plants tend to respond more quickly to drought compared to woody plants. This may be because, during meteorological droughts, vegetation may not experience water stress to the same extent as in agricultural or hydrological droughts. Moreover, woody plants possess the ability to tap into greater soil water reserves through their roots and stem, thereby enhancing their drought tolerance [12]. This enables them to sustain growth by extracting water from soil at the onset of drought events, as changes in soil moisture lag behind the drought [31,33].

4.2. Influence Mechanism of Teleconnection Factors

Large-scale climate patterns alter atmospheric circulation through the movement of rainfall and water vapor transport, thereby influencing regional hydrological factors, climates, and ecosystems. For example, ENSO leads to a redistribution of heat and water vapor, altering surface air currents and small-scale ocean circulation [34,35]. As a result, it exerts a considerable impact on regional temperature and precipitation patterns. In contrast, PDO refers to periodic fluctuations in the surface sea temperature of the North Pacific Ocean, which influence regional precipitation distribution and temperature variation, ultimately impacting vegetation growth [31,55]. The YRB, with its complex topography and monsoon climate, is highly susceptible to the effects of PDO and ENSO [36]. Many studies have discovered the notable periodicity between PDO, ENSO, and precipitation in the YRB, typically occurring in cycles of about 4–8 years [36]. Therefore, PDO and ENSO can impact the annual and seasonal variability of vegetation growth by altering regional climate conditions, thereby influencing the relationship between meteorological drought and vegetation. This may explain why PDO and ENSO have similar impacts on the vegetation–drought relationship.
Sunspots, as a fundamental and prominent phenomenon of solar activity, have a significant impact on solar radiation intensity [56]. This, in turn, directly affects photosynthesis and plays a crucial role in the development of vegetation ecosystems [57]. Due to the close relationship between solar radiation and climate factors, variations in solar radiation intensity have the potential to exert a profound influence on the regional hydrological cycle, ultimately affecting vegetation growth [24]. In addition, significant correlations have been observed between solar activity and large-scale climate patterns, particularly within the 0.25–11a periodicity range [58]. Solar activity transmits climate factors through large-scale climatic phenomena, which subsequently affect regional climate and vegetation growth. For example, sunspots transfer energy from sunspot motion to regional climate by influencing ENSO climate patterns or through mechanisms such as the “Western Pacific Subtropical–East Asian Circulation–Water Vapor Movement” [59]. Consequently, solar activity has an indirect effect on vegetation growth. This may also illustrate why sunspots impact the relationship between vegetation and drought more than ENSO and PDO.

4.3. Uncertainty

In this study, to facilitate collaborative research on multi-source remote sensing data, the SPEI dataset was resampled to a spatial resolution of 0.05° before integrating it into the study, which may have introduced errors. The Spearman correlation was used to establish the correlation between GOSIF, NDVI, and SPEI, serving as an indicator of the relationship between vegetation and meteorological drought. It is important to note that this linear correlation analysis does not imply causation; rather, it provides a statistical basis for the relationship between meteorological drought and vegetation [11]. Furthermore, it is crucial to recognize that the present study only focused on the impacts of drought on vegetation alone. However, there is a lack of consideration for other natural elements and human activities, such as changes in land use types, expansion of urbanization, development of irrigated agriculture, pests, and diseases [11,60]. Therefore, to understand the patterns of drought impacts on vegetation more precisely, future studies should consider the effects of various factors on vegetation growth.

5. Conclusions

In this paper, we explored the multi-year temporal and spatial changes of meteorological drought and its effects on vegetation dynamics. We compared the vegetation response to meteorological drought using NDVI and SIF derived from high-resolution GOSIF products, MODIS NDVI products, as well as multi-scale SPEI products. During the period 2001–2015, the YRB experienced predominantly drought-prone conditions. However, a shift occurred after 2015, characterized by alternating dry and wet conditions. It is worth noting that the summer wet and dry conditions had a more significant impact on the annual climate over the YRB than other seasons. The relationship between SPEI and SIF was stronger than that of SPEI and NDVI. Furthermore, VRTS was shorter than VRTN, and the response times of herbaceous plants to meteorological drought were shorter compared to woody plants. Consequently, SIF offers advantages in monitoring vegetation dynamics under drought stress and assessing vegetation responses to meteorological drought in the YRB. Additionally, there were significant positive correlations between meteorological drought and vegetation at both small and medium scales during the study period, with a period of about 8–14 months. PDO, ENSO, and sunspots are important factors that affect the relationship between meteorological drought and vegetation, with sunspots exerting the most significant influence. This provides a new perspective for the study of teleconnection factors that impact the interaction between climate change and vegetation dynamics.

Author Contributions

X.D., Y.Z., J.L., D.Z., J.W. (Jiapei Wu) and J.W. (Jiaojiao Wang) were involved in the intellectual elements of this paper. Y.Z., J.L., D.Z. and X.D. designed the research. X.D. conducted the research and wrote the manuscript. J.W. (Jiapei Wu) and J.W. (Jiaojiao Wang) helped with the data arrangement and analysis. All authors have read and agreed to the published version of the manuscript.

Funding

This research was funded by National Key Research and Development Program (Grant No. 2021xjkk0303) and National Natural Science Foundation of China (Grant No. 72074209).

Data Availability Statement

All data are available upon request.

Acknowledgments

We are grateful to the National Aeronautics and Space Administration (NASA) for providing their MOD13C2 and MCD12C1 products. We also gratefully acknowledge the GOSIF products from the Global Ecology Group. We express our gratitude to the anonymous reviewers for their valuable feedback and constructive suggestions.

Conflicts of Interest

The authors declare no conflict of interest.

References

  1. AghaKouchak, A.; Chiang, F.; Huning, L.S.; Love, C.A.; Mallakpour, I.; Mazdiyasni, O.; Moftakhari, H.; Papalexiou, S.M.; Ragno, E.; Sadegh, M. Climate Extremes and Compound Hazards in a Warming World. Annu. Rev. Earth Planet. Sci. 2020, 48, 519–548. [Google Scholar] [CrossRef] [Green Version]
  2. Zhu, X.; Zhang, S.; Liu, T.; Liu, Y. Impacts of Heat and Drought on Gross Primary Productivity in China. Remote Sens. 2021, 13, 378. [Google Scholar] [CrossRef]
  3. Zhou, Z.; Ding, Y.; Fu, Q.; Wang, C.; Wang, Y.; Cai, H.; Liu, S.; Shi, H. Comprehensive evaluation of vegetation responses to meteorological drought from both linear and nonlinear perspectives. Front. Earth Sci. 2022, 10, 953805. [Google Scholar] [CrossRef]
  4. Hao, Z.; Singh, V.P.; Xia, Y. Seasonal Drought Prediction: Advances, Challenges, and Future Prospects. Rev. Geophys. 2018, 56, 108–141. [Google Scholar] [CrossRef] [Green Version]
  5. Mishra, A.K.; Singh, V.P. A review of drought concepts. J. Hydrol. 2010, 391, 202–216. [Google Scholar] [CrossRef]
  6. Ding, Y.; He, X.; Zhou, Z.; Hu, J.; Cai, H.; Wang, X.; Li, L.; Xu, J.; Shi, H. Response of vegetation to drought and yield monitoring based on NDVI and SIF. Catena 2022, 219, 106328. [Google Scholar] [CrossRef]
  7. Trenberth, K.E.; Dai, A.; van der Schrier, G.; Jones, P.D.; Barichivich, J.; Briffa, K.R.; Sheffield, J. Global warming and changes in drought. Nat. Clim. Chang. 2014, 4, 17–22. [Google Scholar] [CrossRef]
  8. Lai, C.; Zhong, R.; Wang, Z.; Wu, X.; Chen, X.; Wang, P.; Lian, Y. Monitoring hydrological drought using long-term satellite-based precipitation data. Sci. Total Environ. 2019, 649, 1198–1208. [Google Scholar] [CrossRef]
  9. Lesk, C.; Rowhani, P.; Ramankutty, N. Influence of extreme weather disasters on global crop production. Nature 2016, 529, 84–87. [Google Scholar] [CrossRef] [Green Version]
  10. Piao, S.; Zhang, X.; Chen, A.; Liu, Q.; Lian, X.; Wang, X.; Peng, S.; Wu, X. The impacts of climate extremes on the terrestrial carbon cycle: A review. Sci. China Earth Sci. 2019, 62, 1551–1563. [Google Scholar] [CrossRef]
  11. Geng, G.; Yang, R.; Liu, L. Downscaled solar-induced chlorophyll fluorescence has great potential for monitoring the response of vegetation to drought in the Yellow River Basin, China: Insights from an extreme event. Ecol. Indic. 2022, 138, 108801. [Google Scholar] [CrossRef]
  12. Xu, H.-J.; Wang, X.-P.; Zhao, C.-Y.; Yang, X.-M. Assessing the response of vegetation photosynthesis to meteorological drought across northern China. Land Degrad. Dev. 2020, 32, 20–34. [Google Scholar] [CrossRef]
  13. Zhao, Z.; Wang, K. Capability of Existing Drought Indices in Reflecting Agricultural Drought in China. J. Geophys. Res. Biogeosci. 2021, 126, e2020JG006064. [Google Scholar] [CrossRef]
  14. Guttman, N.B. Comparing the Palmer Drought Index and the Standardized Precipitation Index. J. Am. Water Resour. Assoc. 1998, 34, 113–121. [Google Scholar] [CrossRef]
  15. Wu, H.; Hayes, M.J.; Weiss, A.; Hu, Q. An evaluation of the Standardized Precipitation Index, the China-Z Index and the statistical Z-Score. Int. J. Climatol. 2001, 21, 745–758. [Google Scholar] [CrossRef]
  16. Vicente-Serrano, S.; Beguería, S.; López-Moreno, J.I. A Multiscalar Drought Index Sensitive to Global Warming: The Standardized Precipitation Evapotranspiration Index. J. Clim. 2010, 23, 1696–1718. [Google Scholar] [CrossRef] [Green Version]
  17. Zhang, Q.; Kong, D.; Singh, V.P.; Shi, P. Response of vegetation to different time-scales drought across China: Spatiotemporal patterns, causes and implications. Global Planet. Chang. 2017, 152, 1–11. [Google Scholar] [CrossRef] [Green Version]
  18. Zeng, P.; Sun, F.; Liu, Y.; Wang, Y.; Li, G.; Che, Y. Mapping future droughts under global warming across China: A combined multi-timescale meteorological drought index and SOM-Kmeans approach. Weather Clim. Extremes 2021, 31, 100304. [Google Scholar] [CrossRef]
  19. Xu, H.-J.; Wang, X.-P.; Zhao, C.-Y.; Shan, S.-Y.; Guo, J. Seasonal and aridity influences on the relationships between drought indices and hydrological variables over China. Weather Clim. Extremes 2021, 34, 100393. [Google Scholar] [CrossRef]
  20. Jiao, W.; Tian, C.; Chang, Q.; Novick, K.A.; Wang, L. A new multi-sensor integrated index for drought monitoring. Agric. For. Meteorol. 2019, 268, 74–85. [Google Scholar] [CrossRef] [Green Version]
  21. Zhou, L.; Zhang, J.; Wu, J.; Zhao, L.; Liu, M.; Lü, A.; Wu, Z. Comparison of remotely sensed and meteorological data-derived drought indices in mid-eastern China. Int. J. Remote Sens. 2012, 33, 1755–1779. [Google Scholar] [CrossRef]
  22. Shammi, S.A.; Meng, Q. Use time series NDVI and EVI to develop dynamic crop growth metrics for yield modeling. Ecol. Indic. 2021, 121, 107124. [Google Scholar] [CrossRef]
  23. Wang, X.; Qiu, B.; Li, W.; Zhang, Q. Impacts of drought and heatwave on the terrestrial ecosystem in China as revealed by satellite solar-induced chlorophyll fluorescence. Sci. Total Environ. 2019, 693, 133627. [Google Scholar] [CrossRef] [PubMed]
  24. Zhao, J.; Huang, S.; Huang, Q.; Wang, H.; Leng, G.; Fang, W. Time-lagged response of vegetation dynamics to climatic and teleconnection factors. Catena 2020, 189, 104474. [Google Scholar] [CrossRef]
  25. Zhang, X.; Zhang, B. The responses of natural vegetation dynamics to drought during the growing season across China. J. Hydrol. 2019, 574, 706–714. [Google Scholar] [CrossRef]
  26. Li, X.; Xiao, J. A Global, 0.05-Degree Product of Solar-Induced Chlorophyll Fluorescence Derived from OCO-2, MODIS, and Reanalysis Data. Remote Sens. 2019, 11, 517. [Google Scholar] [CrossRef] [Green Version]
  27. Song, L.; Guanter, L.; Guan, K.; You, L.; Huete, A.; Ju, W.; Zhang, Y. Satellite sun-induced chlorophyll fluorescence detects early response of winter wheat to heat stress in the Indian Indo-Gangetic Plains. Global Chang. Biol. 2018, 24, 4023–4037. [Google Scholar] [CrossRef] [Green Version]
  28. Sinha, S.K.; Padalia, H.; Patel, N.R.; Chauhan, P. Estimation of Seasonal Sun-Induced Fluorescence Dynamics of Indian Tropical Deciduous Forests using SCOPE and Sentinel-2 MSI. Int. J. Appl. Earth Obs. Geoinf. 2020, 91, 102155. [Google Scholar] [CrossRef]
  29. Mohammed, G.H.; Colombo, R.; Middleton, E.M.; Rascher, U.; van der Tol, C.; Nedbal, L.; Goulas, Y.; Perez-Priego, O.; Damm, A.; Meroni, M.; et al. Remote sensing of solar-induced chlorophyll fluorescence (SIF) in vegetation: 50 years of progress. Remote Sens. Environ. 2019, 231, 111177. [Google Scholar] [CrossRef]
  30. Baker, N.R. Chlorophyll fluorescence: A probe of photosynthesis in vivo. Annu. Rev. Plant Biol. 2008, 59, 89–113. [Google Scholar] [CrossRef] [Green Version]
  31. Zhou, Z.; Liu, S.; Ding, Y.; Fu, Q.; Wang, Y.; Cai, H.; Shi, H. Assessing the responses of vegetation to meteorological drought and its influencing factors with partial wavelet coherence analysis. J. Environ. Manag. 2022, 311, 114879. [Google Scholar] [CrossRef] [PubMed]
  32. Liu, Z.; Zhang, X.; Fang, R. Multi-scale linkages of winter drought variability to ENSO and the Arctic Oscillation: A case study in Shaanxi, North China. Atmos. Res. 2018, 200, 117–125. [Google Scholar] [CrossRef]
  33. Liu, Q.; Zhang, J.; Zhang, H.; Yao, F.; Bai, Y.; Zhang, S.; Meng, X.; Liu, Q. Evaluating the performance of eight drought indices for capturing soil moisture dynamics in various vegetation regions over China. Sci. Total Environ. 2021, 789, 147803. [Google Scholar] [CrossRef] [PubMed]
  34. Yeh, S.-W.; Kug, J.-S.; Dewitte, B.; Kwon, M.-H.; Kirtman, B.P.; Jin, F.-F. El Niño in a changing climate. Nature 2009, 461, 511–514. [Google Scholar] [CrossRef]
  35. Qi, Z.; Cui, C.; Jiang, Y.; Chen, Y.; Ju, J.; Guo, N. Changes in the spatial and temporal characteristics of China’s arid region in the background of ENSO. Sci. Rep. 2022, 12, 17826. [Google Scholar] [CrossRef]
  36. Yang, P.; Zhang, S.; Xia, J.; Zhan, C.; Cai, W.; Wang, W.; Luo, X.; Chen, N.; Li, J. Analysis of drought and flood alternation and its driving factors in the Yangtze River Basin under climate change. Atmos. Res. 2022, 270, 106087. [Google Scholar] [CrossRef]
  37. Zou, L.; Xia, J.; Zhang, Y. Spatio-temporal evolution of extreme precipitation in the middle and lower reaches of the Yangtze River. Resour. Environ. Yangtze Basin 2021, 30, 1264–1274. [Google Scholar] [CrossRef]
  38. Fang, G.; Li, X.; Xu, M.; Wen, X.; Huang, X. Spatiotemporal Variability of Drought and Its Multi-Scale Linkages with Climate Indices in the Huaihe River Basin, Central China and East China. Atmosphere 2021, 12, 1446. [Google Scholar] [CrossRef]
  39. Cui, L.; Wang, L.; Singh, R.P.; Lai, Z.; Jiang, L.; Yao, R. Association analysis between spatiotemporal variation of vegetation greenness and precipitation/temperature in the Yangtze River Basin (China). Environ. Sci. Pollut. Res. Int. 2018, 25, 21867–21878. [Google Scholar] [CrossRef]
  40. Hu, W.; Si, B. Technical Note: Improved partial wavelet coherency for understanding scale-specific and localized bivariate relationships in geosciences. Hydrol. Earth Syst. Sci. 2021, 25, 321–331. [Google Scholar] [CrossRef]
  41. Lu, E.; Liu, S.; Luo, Y.; Zhao, W.; Li, H.; Chen, H.; Zeng, Y.; Liu, P.; Wang, X.; Higgins, R.W.; et al. The atmospheric anomalies associated with the drought over the Yangtze River basin during spring 2011. J. Geophys. Res. Atmos. 2014, 119, 5881–5894. [Google Scholar] [CrossRef]
  42. Wang, L.; Chen, W. A CMIP5 multimodel projection of future temperature, precipitation, and climatological drought in China. Int. J. Climatol. 2014, 34, 2059–2078. [Google Scholar] [CrossRef]
  43. Sun, F.; Mejia, A.; Zeng, P.; Che, Y. Projecting meteorological, hydrological and agricultural droughts for the Yangtze River basin. Sci. Total Environ. 2019, 696, 134076. [Google Scholar] [CrossRef]
  44. Chen, X.; Wang, L.; Niu, Z.; Zhang, M.; Li, C.; Li, J. The effects of projected climate change and extreme climate on maize and rice in the Yangtze River Basin, China. Agric. For. Meteorol. 2020, 282–283, 107867. [Google Scholar] [CrossRef]
  45. Zhang, Y.; Song, C.; Zhang, K.; Cheng, X.; Zhang, Q. Spatial–temporal variability of terrestrial vegetation productivity in the Yangtze River Basin during 2000–2009. J. Plant Ecol. 2013, 7, 10–23. [Google Scholar] [CrossRef] [Green Version]
  46. Wu, Z.; Yu, L.; Du, Z.; Zhang, H.; Fan, X.; Lei, T. Recent changes in the drought of China from 1960 to 2014. Int. J. Climatol. 2020, 40, 3281–3296. [Google Scholar] [CrossRef]
  47. Vicente-Serrano, S.M.; Gouveia, C.; Camarero, J.J.; Beguería, S.; Trigo, R.; López-Moreno, J.I.; Azorín-Molina, C.; Pasho, E.; Lorenzo-Lacruz, J.; Revuelto, J. Response of vegetation to drought time-scales across global land biomes. Proc. Natl. Acad. Sci. USA 2013, 110, 52–57. [Google Scholar] [CrossRef]
  48. Shi, X.; Chen, F.; Shi, M.; Ding, H.; Li, Y. Construction and application of Optimized Comprehensive Drought Index based on lag time: A case study in the middle reaches of Yellow River Basin, China. Sci. Total Environ. 2023, 857, 159692. [Google Scholar] [CrossRef]
  49. Wang, Q.; Ju, Q.; Wang, Y.; Fu, X.; Zhao, W.; Du, Y.; Jiang, P.; Hao, Z. Regional Patterns of Vegetation Dynamics and Their Sensitivity to Climate Variability in the Yangtze River Basin. Remote Sens. 2022, 14, 5623. [Google Scholar] [CrossRef]
  50. Guan, Y.; Zhang, X.; Zheng, F.; Wang, B. Trends and variability of daily temperature extremes during 1960–2012 in the Yangtze River Basin, China. Global Planet. Chang. 2015, 124, 79–94. [Google Scholar] [CrossRef] [Green Version]
  51. Ding, Y.; Wang, F.; Mu, Q.; Sun, Y.; Cai, H.; Zhou, Z.; Xu, J.; Shi, H. Estimating land use/land cover change impacts on vegetation response to drought under ‘Grain for Green’ in the Loess Plateau. Land Degrad. Dev. 2021, 32, 5083–5098. [Google Scholar] [CrossRef]
  52. Yildirim, G.; Rahman, A.; Singh, V.P. Meteorological and hydrological drought hazard, frequency and propagation analysis: A case study in southeast Australia. J. Hydrol. Reg. Stud. 2022, 44, 101229. [Google Scholar] [CrossRef]
  53. Luo, Y.; Liang, W.; Yan, J.; Zhang, W.; Gou, F.; Wang, C.; Liang, X. Vegetation Growth Response and Trends after Water Deficit Exposure in the Loess Plateau, China. Remote Sens. 2023, 15, 2593. [Google Scholar] [CrossRef]
  54. Shi, W.; Huang, S.; Liu, D.; Huang, Q.; Leng, G.; Wang, H.; Fang, W.; Han, Z. Dry and wet combination dynamics and their possible driving forces in a changing environment. J. Hydrol. 2020, 589, 125211. [Google Scholar] [CrossRef]
  55. Mantua, N.J.; Hare, S.R. The Pacific decadal oscillation. J. Oceanogr. 2002, 58, 35–44. [Google Scholar] [CrossRef]
  56. Balasubramaniam, K.; Henry, T. Sunspot numbers from ISOON: A ten-year data analysis. Sol. Phys. 2016, 291, 3123–3138. [Google Scholar] [CrossRef] [Green Version]
  57. Zhang, Y.; Zhu, Z.; Liu, Z.; Zeng, Z.; Ciais, P.; Huang, M.; Liu, Y.; Piao, S. Seasonal and interannual changes in vegetation activity of tropical forests in Southeast Asia. Agric. For. Meteorol. 2016, 224, 1–10. [Google Scholar] [CrossRef]
  58. Linyao, D.; Pingcang, Z.; Jigen, L.; Xiaoxia, T.; Hao, X. Combined influence of solar activity and ENSO on hydrological processes in Yoshino River basin, Japan. Adv. Water Sci. 2017, 28, 671–680. [Google Scholar] [CrossRef]
  59. Zhang, J.; Zhao, K.; Wang, Y.; Kong, X.; Shao, X.; Liang, Y.; Cui, Y.; Cheng, H.; Edwards, R.L.; Shao, Q. Modulation of centennial-scale hydroclimate variations in the middle Yangtze River Valley by the East Asian-Pacific pattern and ENSO over the past two millennia. Earth Planet. Sci. Lett. 2021, 576, 117220. [Google Scholar] [CrossRef]
  60. Ma, H.; Cui, T.; Cao, L. Monitoring of Drought Stress in Chinese Forests Based on Satellite Solar-Induced Chlorophyll Fluorescence and Multi-Source Remote Sensing Indices. Remote Sens. 2023, 15, 879. [Google Scholar] [CrossRef]
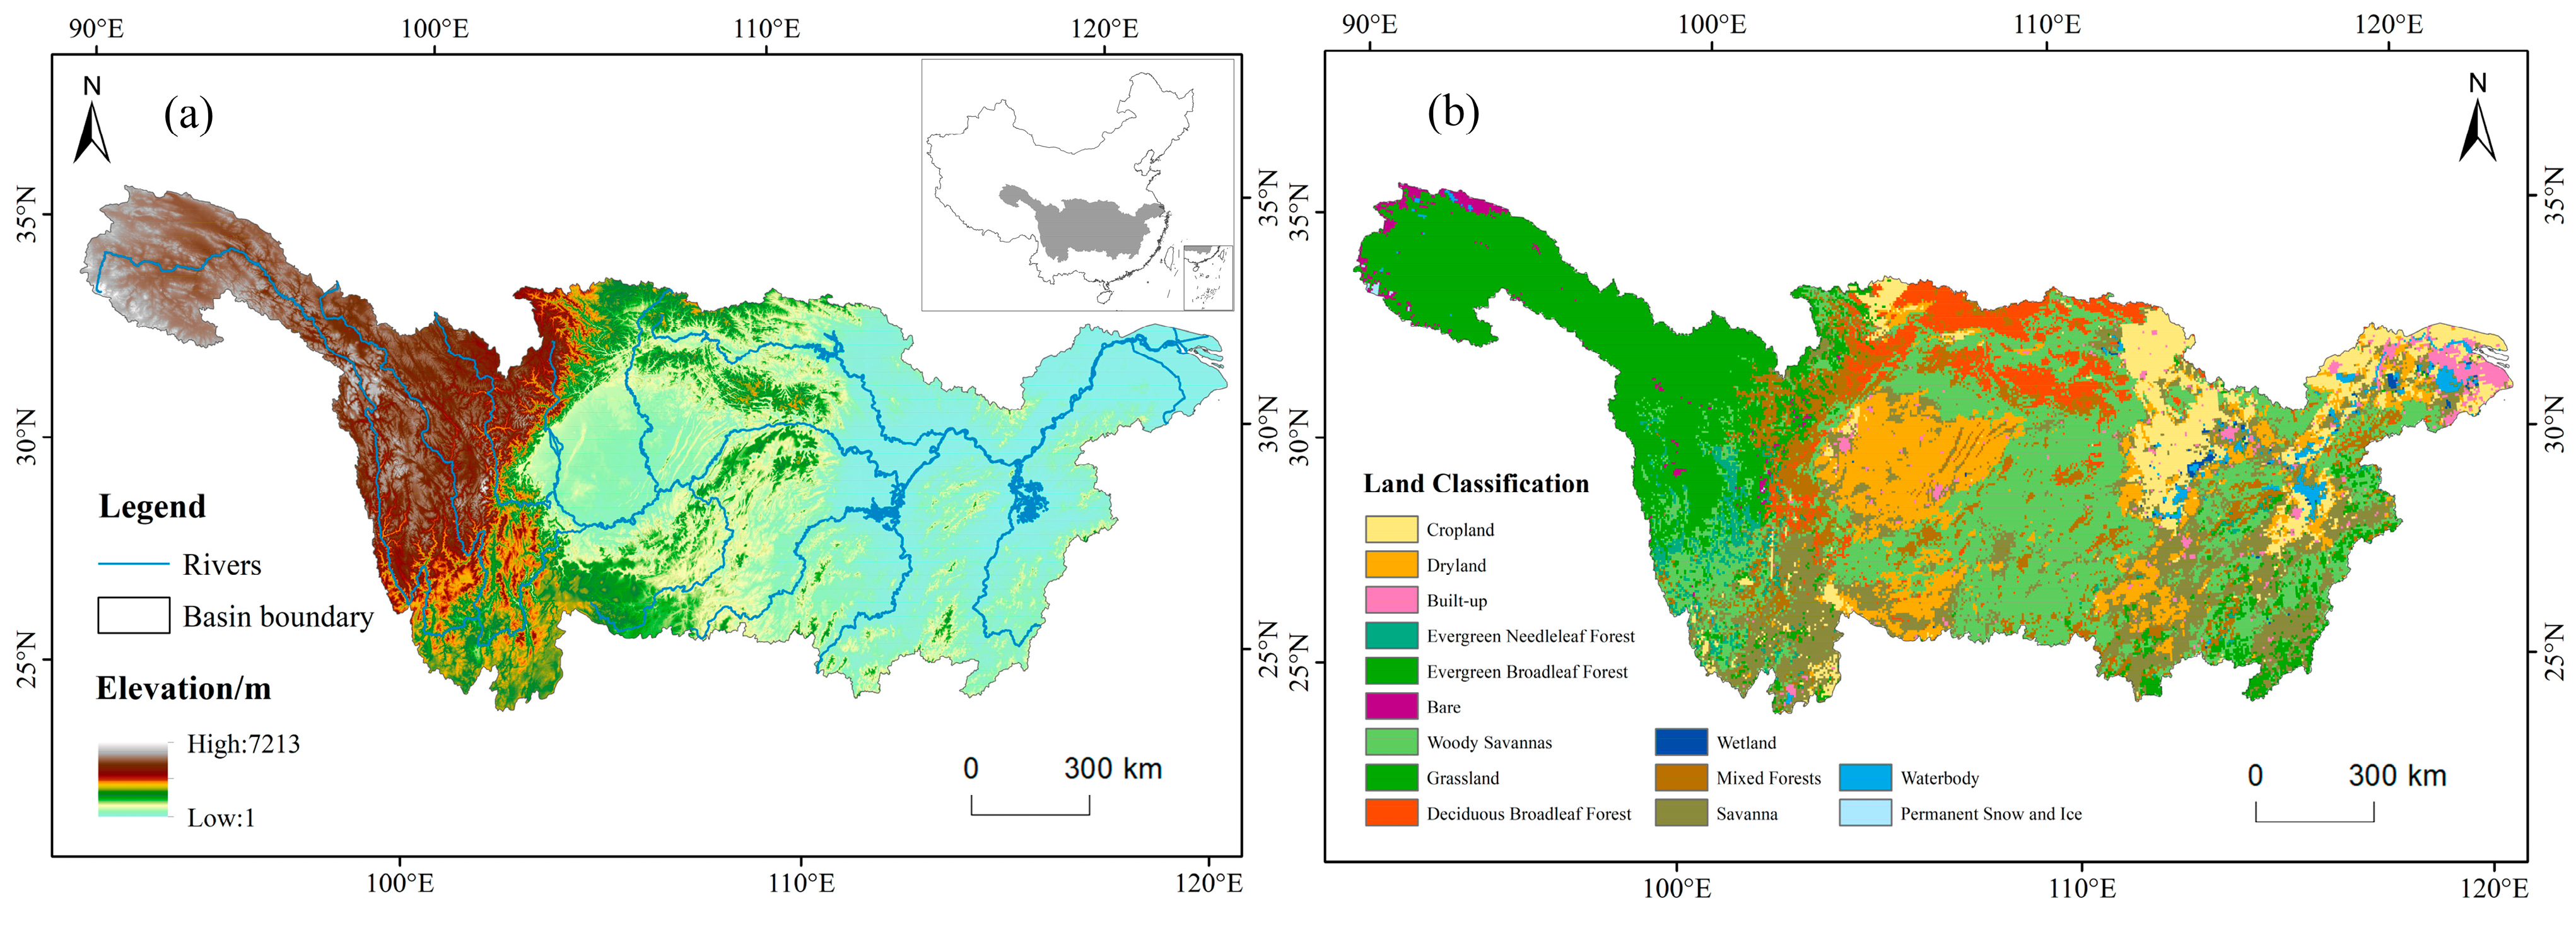
Figure 1. Map of elevation (a) and land cover types (b) in the YRB.
Remotesensing 15 03641 g001
Figure 2. The flowchart of this study.
Remotesensing 15 03641 g002
Figure 3. Temporal dynamics of SPEI in the YRB for the period 2001–2020. The blue represents the wetting; the red represents the drying.
Remotesensing 15 03641 g003
Figure 4. Spatial characteristics of annual (a), spring (b), summer (c), and autumn (d) SPEI trends and pixel proportions of different trends (e). * represents p < 0.05 according to an M–K test.
Remotesensing 15 03641 g004
Figure 5. Spatial distributions of MSCC for NDVI (a) and SIF (b) with SPEI.
Remotesensing 15 03641 g005
Figure 6. Response time distributions of (a) NDVI and (b) SIF to meteorological drought in the YRB.
Remotesensing 15 03641 g006
Figure 7. The MSCC of different vegetation types in the YRB. The square boxes represent the mean values; boxes delineate quartiles; short black lines represent the median; black dots represent anomalous values. Please refer to the study area section (Section 2.1) for the meaning of the abbreviations of each vegetation type.
Remotesensing 15 03641 g007
Figure 8. SPEI–NDVI of (a) WTC and PWC after removing the influences of (b) PDO, (c) ENSO, and (d) sunspot. The larger value represents a strong correlation. The thick black contour lines have passed the 95% confidence level. The thin black lines denote cones of influence, and arrows indicate the phase relationship between NDVI and PDO (ENSO or sunspot), with arrows pointing to the right indicating that the two signals are in phase and arrows pointing to the left representing an inverted signal.
Remotesensing 15 03641 g008
Figure 9. SPEI–SIF of (a) WTC and PWC after removing the influences of (b) PDO, (c) ENSO, and (d) sunspot. The larger value represents a strong correlation. The thick black contour lines have passed the 95% confidence level. The thin black lines denote cones of influence, and arrows indicate the phase relationship between NDVI and PDO (ENSO or sunspot), with arrows pointing to the right indicating that the two signals are in phase and arrows pointing to the left representing an inverted signal.
Remotesensing 15 03641 g009
Table 1. The classification of SPEI drought grades.
SPEI ValueDrought Severity
−0.5 < SPEINormal
−1.0 < SPEI ≤ −0.5Mild drought
−1.5 < SPEI ≤ −1.0Moderate drought
−2.0 < SPEI ≤ −1.5Severe drought
SPEI ≤ −2.0Extreme drought
Table 2. The VRTN and VRTS (months) for different vegetation types in the YRB.
Vegetation TypesVRTN (Months)VRTS (Months)
Forest EcosystemENF5.4225.8944.2064.696
EBF6.1054.893
DBF5.8424.748
MF6.2054.935
Grassland EcosystemWSA5.6035.3574.3634.339
SA5.4324.675
GRA5.0373.978
Farmland EcosystemCRO4.9645.1843.7634.132
DL5.4034.501
Table 3. Changes in PASC at different time scales.
PASCPDOENSOSunspots
SPEI-NDVISmall5.60%3.57%5.95%
Medium−1.07%−0.87%−1.03%
Large−0.24%2.18%−0.24%
Total4.30%4.90%4.68%
SPEI-SIFSmall−0.12%−0.83%−2.02%
Medium−0.73%−2.67%0.77%
Large−0.67%0.18%3.80%
Total−1.52%−3.32%2.54%
Disclaimer/Publisher’s Note: The statements, opinions and data contained in all publications are solely those of the individual author(s) and contributor(s) and not of MDPI and/or the editor(s). MDPI and/or the editor(s) disclaim responsibility for any injury to people or property resulting from any ideas, methods, instructions or products referred to in the content.