Article

MASA-SegNet: A Semantic Segmentation Network for PolSAR Images

1
College of Resources, Sichuan Agricultural University, Chengdu 611130, China
2
College of Information Engineering, Sichuan Agricultural University, Ya’an 625000, China
3
Key Laboratory of Investigation and Monitoring, Protection and Utilization for Cultivated Land Resources, Ministry of Natural Resources, Chengdu 611130, China
*
Author to whom correspondence should be addressed.
These authors contributed equally to this work.
Remote Sens. 2023, 15(14), 3662; https://doi.org/10.3390/rs15143662
Submission received: 1 June 2023 / Revised: 15 July 2023 / Accepted: 18 July 2023 / Published: 22 July 2023

Abstract

:
Semantic segmentation of Polarimetric SAR (PolSAR) images is an important research topic in remote sensing. Many deep neural network-based semantic segmentation methods have been applied to PolSAR image segmentation tasks. However, a lack of effective means to deal with the similarity of object features and speckle noise in PolSAR images exists. Thisstudy aims to improve the discriminative capability of neural networks for various intensities of backscattering coefficients while reducing the effects of noise in PolSAR semantic segmentation tasks. Firstly, we propose pre-processing methods for PolSAR image data, which consist of the fusion of multi-source data and false color mapping. Then, we propose a Multi-axis Sequence Attention Segmentation Network (MASA-SegNet) for semantic segmentation of PolSAR data, which is an encoder–decoder framework. Specifically, within the encoder, a feature extractor is designed and implemented by stacking Multi-axis Sequence Attention blocks to efficiently extract PolSAR features at multiple scales while mitigating inter-class similarities and intra-class differences from speckle noise. Moreover, the process of serialized residual connection design enables the propagation of spatial information throughout the network, thereby improving the overall spatial awareness of MASA-SegNet. Within the decoder, it is used to accomplish the semantic segmentation task. The superiority of this algorithm for semantic segmentation will be explored through feature visualization. The experiments show that our proposed spatial sequence attention mechanism can effectively extract features and reduce noise interference and is thus able to obtain the best results on two large-scale public datasets (the AIR-POlSAR-Seg and FUSAR-Map datasets).

Graphical Abstract

1. Introduction

Polarimetric Synthetic Aperture Radar (PolSAR) imaging is a satellite remote sensing microwave imaging technology which has a wide range of applications in disaster monitoring, wetland monitoring, ocean monitoring, land cover classification, and other fields. Therefore, the semantic segmentation of PolSAR images has important research value. Compared to visible light remote sensing, PolSAR has higher penetration capabilities that enable it to penetrate through cloud cover, and it is not affected by diurnal variations and severe weather conditions [1]. However, PolSAR captures polarization echoes from the ground, providing each pixel with rich waveform information, but it cannot be directly converted into color values. Furthermore, signals frequently encounter non-linear interference during transmission, resulting in the presence of speckle noise [2].
In previous works, the segmentation methods for Synthetic Aperture Radar (SAR) images can be broadly categorized into three groups: mathematical statistics, machine learning, and deep learning. In mathematical model-based methods, early studies directly applied traditional image segmentation algorithms to land classification tasks for SAR images such as the level set method [3]. At the same time, there has been increased attention from researchers to investigate the imaging principles of SAR imagery. They have been attempting to interpret SAR images by quantitatively analyzing the variation in the backscattering coefficient and frequency amplitude of specific frequency bands. In Ref. [4], the researchers discovered that incorporating the analysis of both backscatter intensity and coherence yields superior classification accuracy compared to relying solely on backscatter intensity. In Ref. [5], different polarization combinations were used for improving the performance of SAR image evaluation.
Although machine learning models like support vector machine (SVM), random forest (RF), level set-based multi-texture models, and Markov random fields [6,7,8,9] can segment land types in PolSAR images, they suffer from limited accuracy and generalization capabilities due to their dependence on complex manual computations.
With the application of deep neural networks in image processing, they show impressive capabilities for PolSAR images at the same time [10,11,12,13,14]. Convolutional neural networks (CNNs) are the most commonly used model structures in deep learning for visual processing; they extract image features through convolutions to handle downstream tasks [15,16]. However, for semantic segmentation of PolSAR images, this feedforward network initializes weights randomly, which makes it impossible to distinguish noise, the background, or effective physical areas during the process of feature extraction at the pixel level, thus affecting the semantic accuracy of features [17]. In order to direct the attention of the network towards valuable regions, a transformer architecture based on a self-attention mechanism [18] in natural language processing is introduced into visual tasks, such as ViT [19] and Swin-Transformer [20]. The transformer can establish long-range dependencies, provide global relationships for features, and offer location and channel information in the target space [21], paying closer attention to specific targets rather than noise information during the feature extraction process. The transformer has demonstrated its superiority for various PolSAR applications [22,23,24,25,26].
However, in the semantic segmentation of PolSAR images, due to the inevitable speckle noise, the classification of features at the pixel level relies more on contextual relationships between local neighboring pixels. At the same time, segmentation accuracy is also affected by spatial position information. Traditional transformer architectures are weak in this regard. As an alternative to the transformer, MLPs with gating (gMLPs) [27] become a possibility to solve this problem. It has been proved that gMLPs are excellent in processing low-level vision tasks [28]. This is beneficial for dealing with speckle noise in PolSAR images. The present study concentrates on addressing three main challenges. The first is how to reduce the impact of noise on the high-dimensional feature information extraction of polarimetric SAR images. The second is how to discern subtle differences in distinguishing among ground features that share similar scattering characteristics. The last is how to supply sufficient and accurate spatial location information for classification purposes.
This study makes three contributions to address the aforementioned challenges:
-
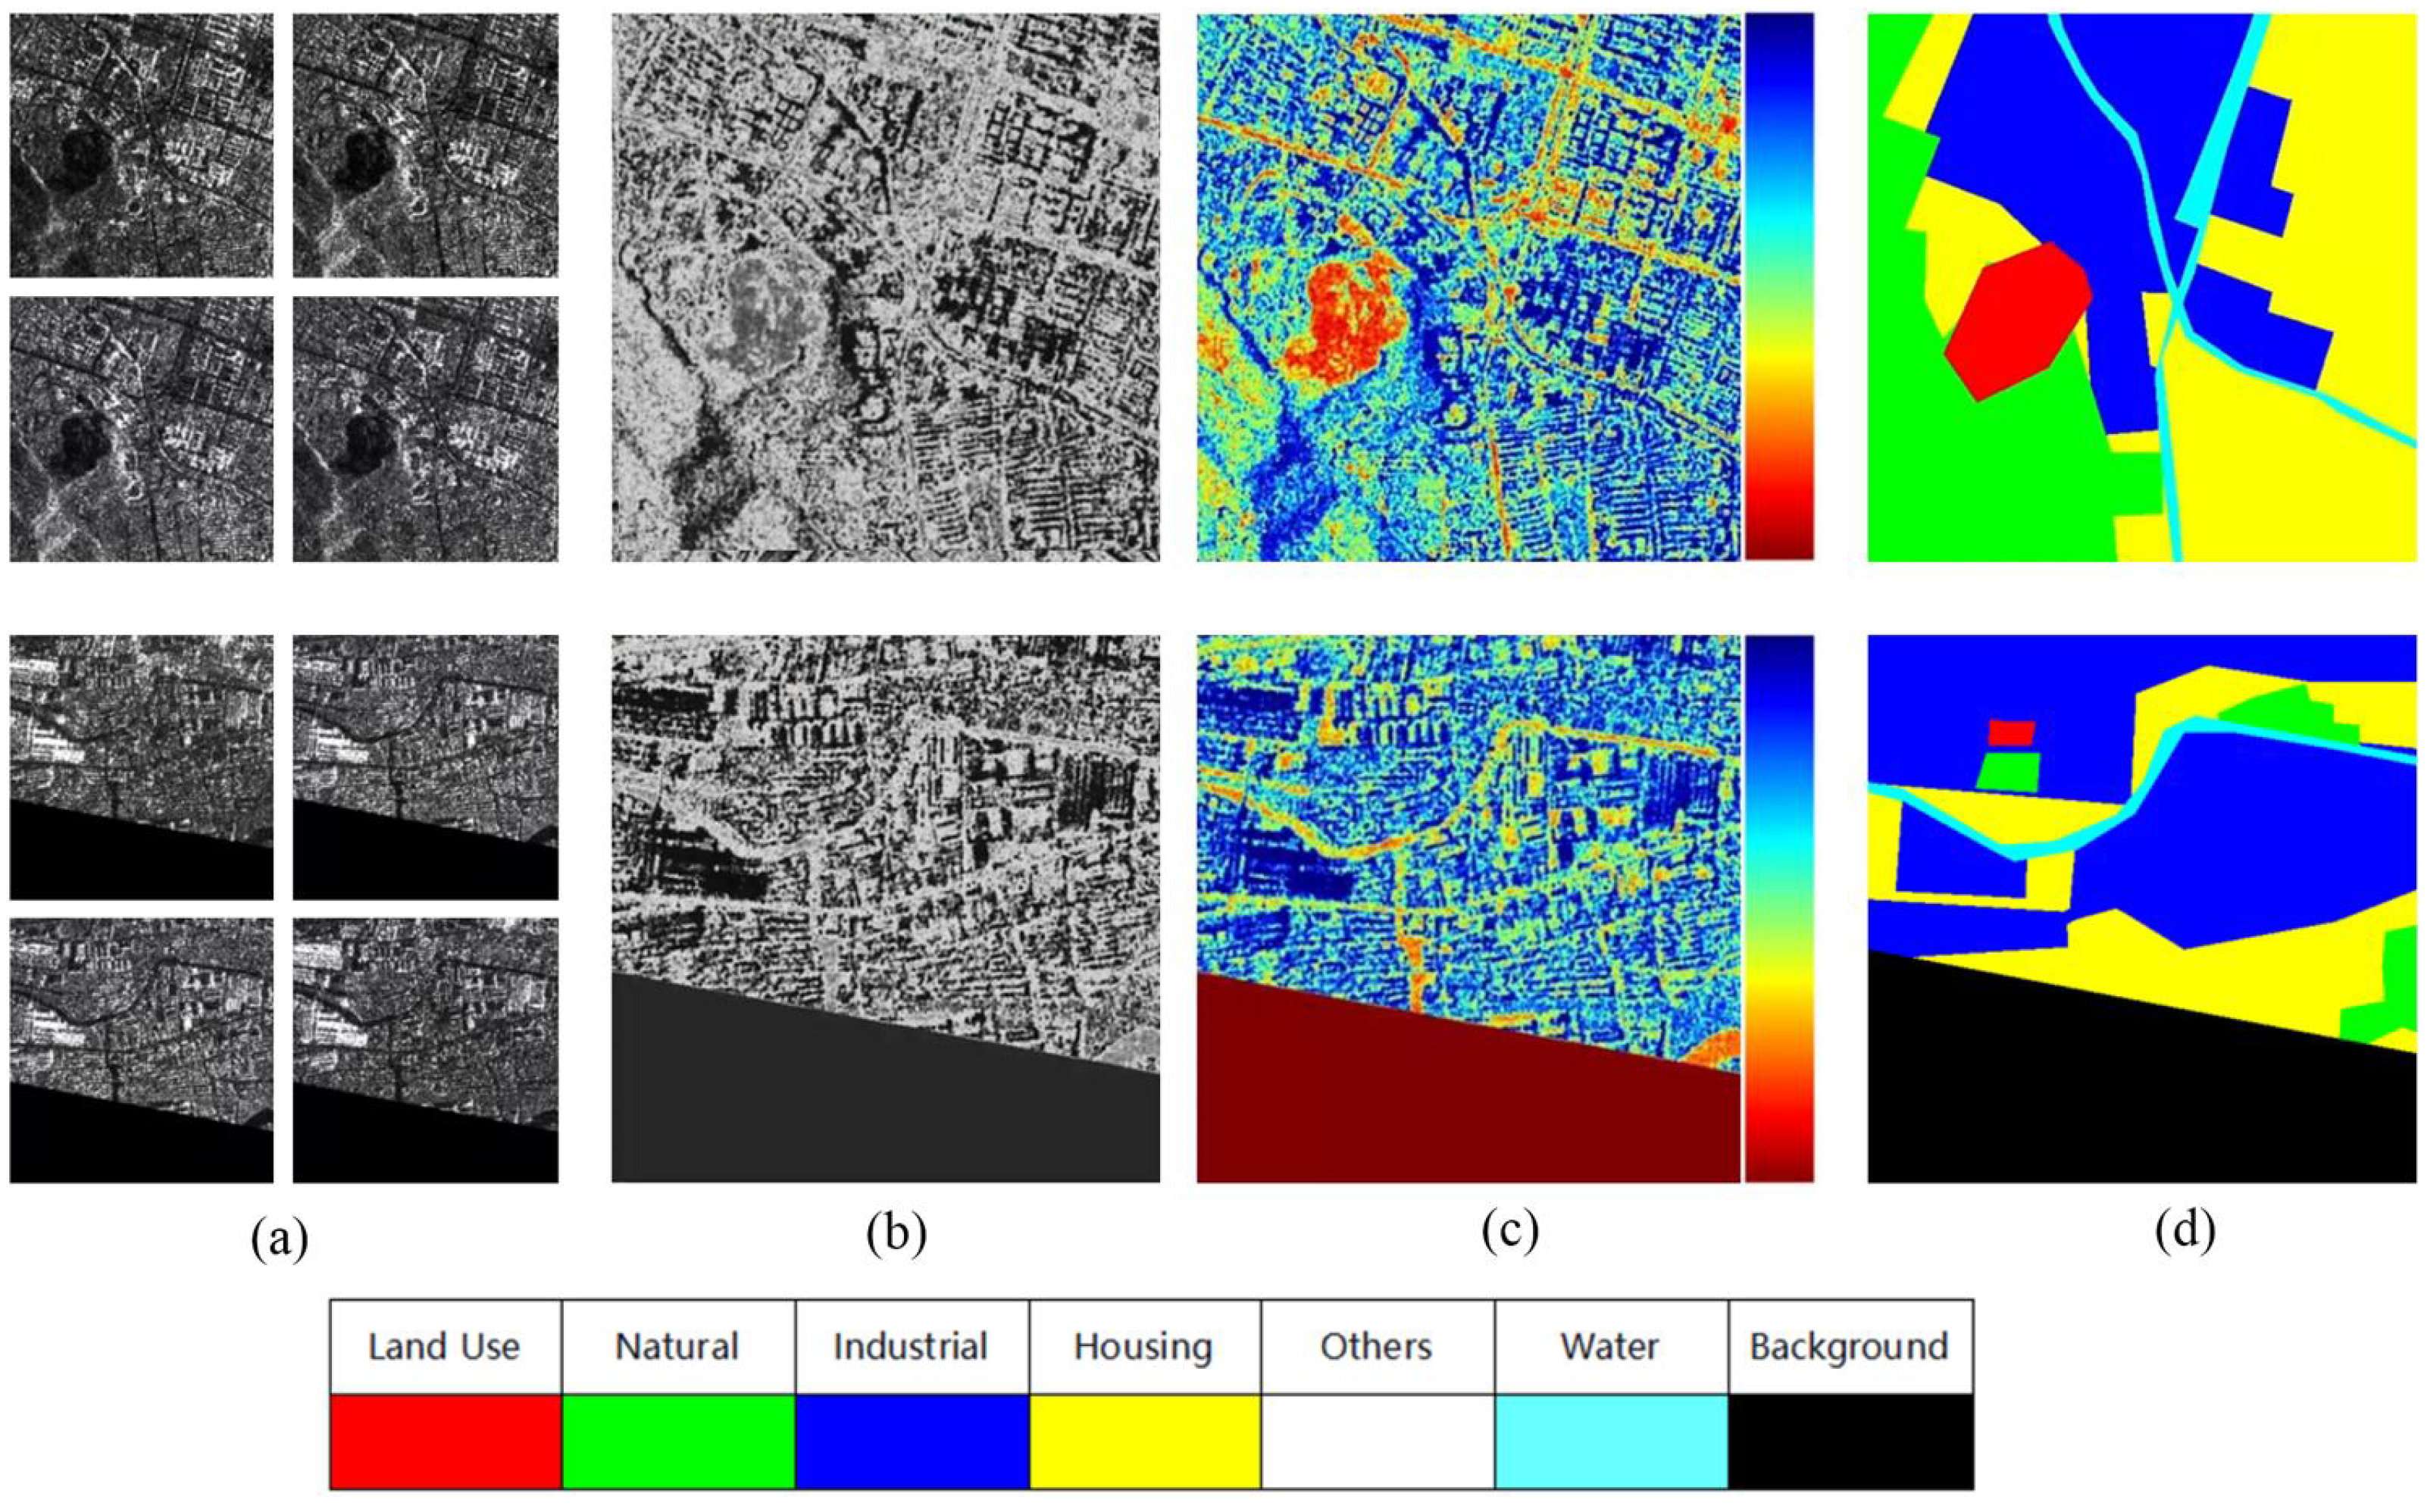
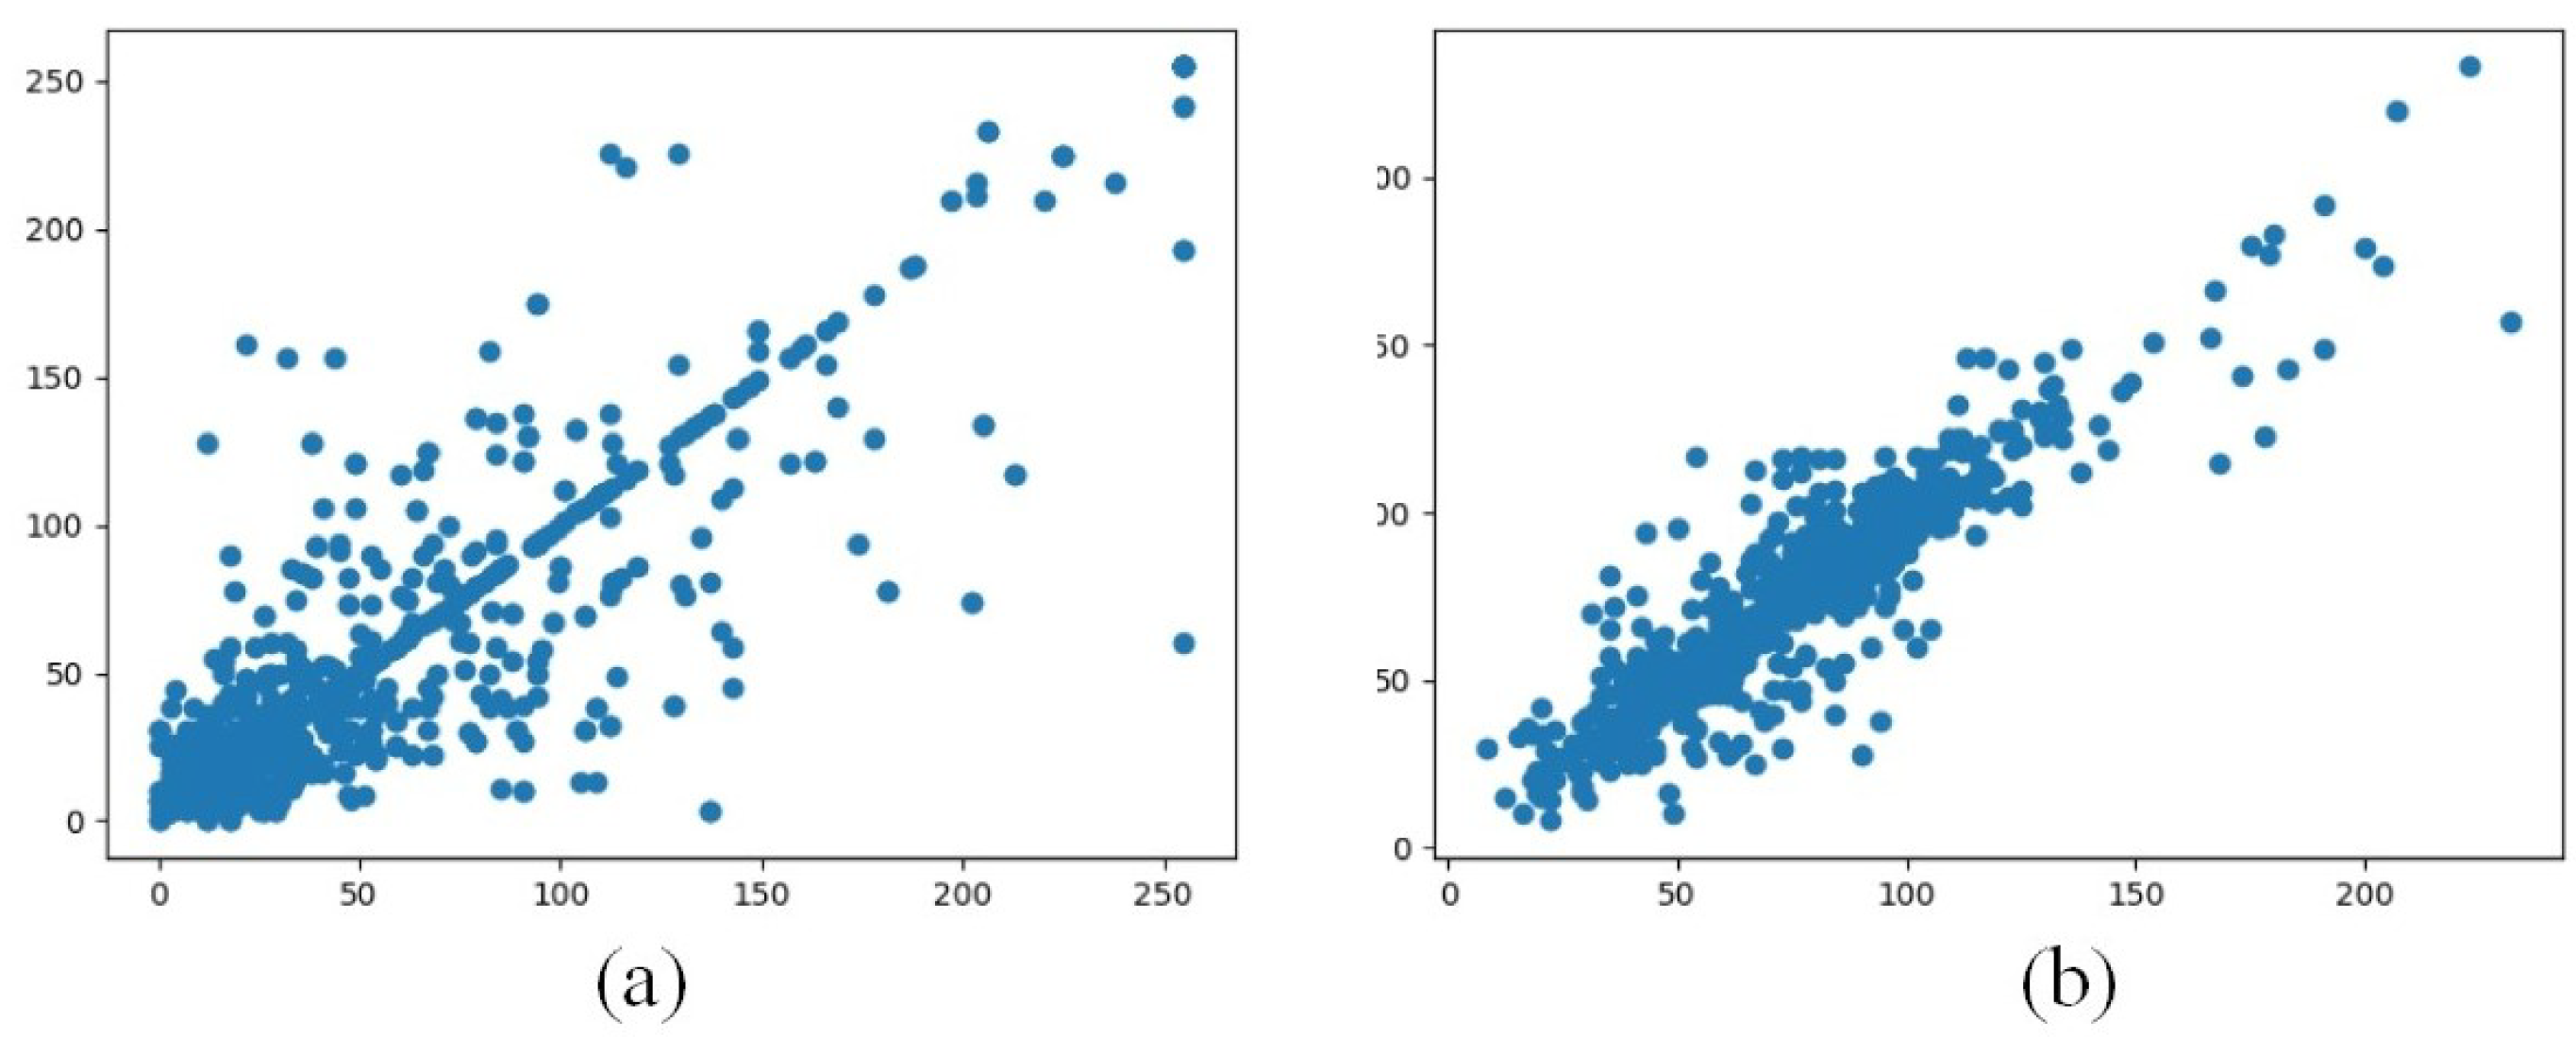
We propose two methods for pseudo-color synthesis of PolSAR images; these are used as pre-processing methods for single-polarization and multi-polarization SAR images. The aim is to reduce the interference of noise and increase the readability of images as much as possible prior to executing segmentation tasks.
-
We design a feature extractor for PolSAR images. The feature map is serialized along two axes to calculate both global and local attention, thereby extracting important spatial feature information and reducing noise interference.
-
We propose MASA-SegNet, which is a novel multi-axis sequence attention semantic segmentation network that deploys an encoder–decoder structure to achieve effective semantic segmentation. The encoder of MASA-SegNet consists of multi-level feature extraction, and the decoder is constructed with convolution and linear interpolation upsampling. This network architecture demonstrates excellent performance with PolSAR datasets.
The effectiveness is demonstrated through experiments on the quad-polarized AIR-PolSAR-Seg dataset [29] and the single-polarization FUSAR-MAP dataset [30]. For the AIR-PolSAR-Seg dataset, the mean Intersection over Union (mIoU) increased to 54.25%, with an average improvement of 1.67–10.02%. On the other hand, the Frequency Weighted Intersection over Union (FWIoU) increased to 75.94% for the FUSAR-MAP dataset, with an average improvement of 9.35–21.18%. Our method showed superior performance in reducing noise, enhancing features, and preserving feature spatial positioning by comparing different methods for generating PolSAR false color images and conducting quantitative visualization analysis.

2. Materials and Methods

2.1. Datasets

2.1.1. Single-Polarization SAR Data

The FUSAR-MAP [30] dataset consists of 610 optical and single-polarization SAR images of 1024 × 1024 pixels. The SAR images are provided by the GF-3 satellite, which operates in C-band ultra-fine strip (UFS) mode, with a nominal resolution of 3 m, and the polarization mode is HH. Four types of land cover are considered, and others are regarded as background.
To enhance the characteristic information of PolSAR images, we synthesized pseudo-RGB images by fusing optical and PolSAR images pixel-by-pixel. We applied Refined Lee Filtering (RLF) [31] to the single-polarization SAR images p s in the dataset and mapped to the R and B channels of the pseudo-RGB images. It is critical to enhance the scattering features that are more sensitive in the C-band, such as vegetation and dense buildings. Therefore, we extracted the green channel of the optical image I G mapped to the green channel of the pseudo-RGB. The whole process can be formulated as
R G B = u n i t 8 R L F p s I G R L F p s [ 0 , 255 ] ,
where the function R L F ( . ) represents Refined Lee Filtering.
Through the above operations, we fused the optical image with the single-polarization SAR image, and the result is shown in Figure 1c. The pseudo-RGB image displays a different color gamut for the volume scattering of vegetation and dense buildings, as well as the surface scattering of water and roads, thus providing richer prior knowledge for the neural network.

2.1.2. Multi-Polarization SAR data

The AIR-PolSAR-Seg dataset [29] is a multi-polarization dataset that provides SAR images in four polarization modes: HH, HV, VH, VV. The entire dataset consists of 500 images, each with a size of 512 × 512 pixels. The data are sourced from the GF-3 satellite, which operates in C-band quad-polarization strip map (QPSI) mode, with a spatial resolution of 8 m. There are 6 types of land cover considered, and others are regarded as background. Figure 2a shows a partial slice of the AIR-PolSAR-Seg dataset.
Our proposed method aims to combine the four polarization images in order to retain all the scattering attributes of the land cover with minimal interference. It combined the HV and VH PolSAR images into the first image channel, mapped HH polarized images as the second channel, and mapped VV polarized images as the third channel. It can be formulated as
C 1 C 2 C 3 = u n i t 8 255 R L F p H V + R L F p V H 2 255 R L F p H H 255 R L F p V V [ 0 , 255 ] ,
where, p H V , p V H , p H H , and p V V denote the polarization images of HV, VH, HH, and VV.
To achieve a visible fusion image shown in Figure 2b, the three image channels were processed into a grayscale image using
G r e y = 0.299 × C 2 + 0.587 × C 1 + 0.114 × C 3 .
Finally, we choose false color mapping to obtain pseudo-RGB images [32], as shown in Figure 2c; the fusion pseudo-RGB images not only retain the different polarization SAR attributes, but also emphasize the feature differences among the same type of objects through color information.

2.2. Methodology

The objective of our work is to achieve pixel-level semantic segmentation for PolSAR images. Given a PolSAR image P s R W , H , R G B , based on our semantic segmentation network, we assign corresponding semantic categories to each pixel of P s , which can be formulated as
T = MASA-SegNet ( P s )
where the function MASA-SegNet(·) represents the process of pixel-level semantic segmentation; T is the result of semantic segmentation. Shown in Figure 3 is the overall framework of our method. In this section, we first give an overall overview of our framework, then introduce each part that makes up the network framework, and finally describe the network in detail.

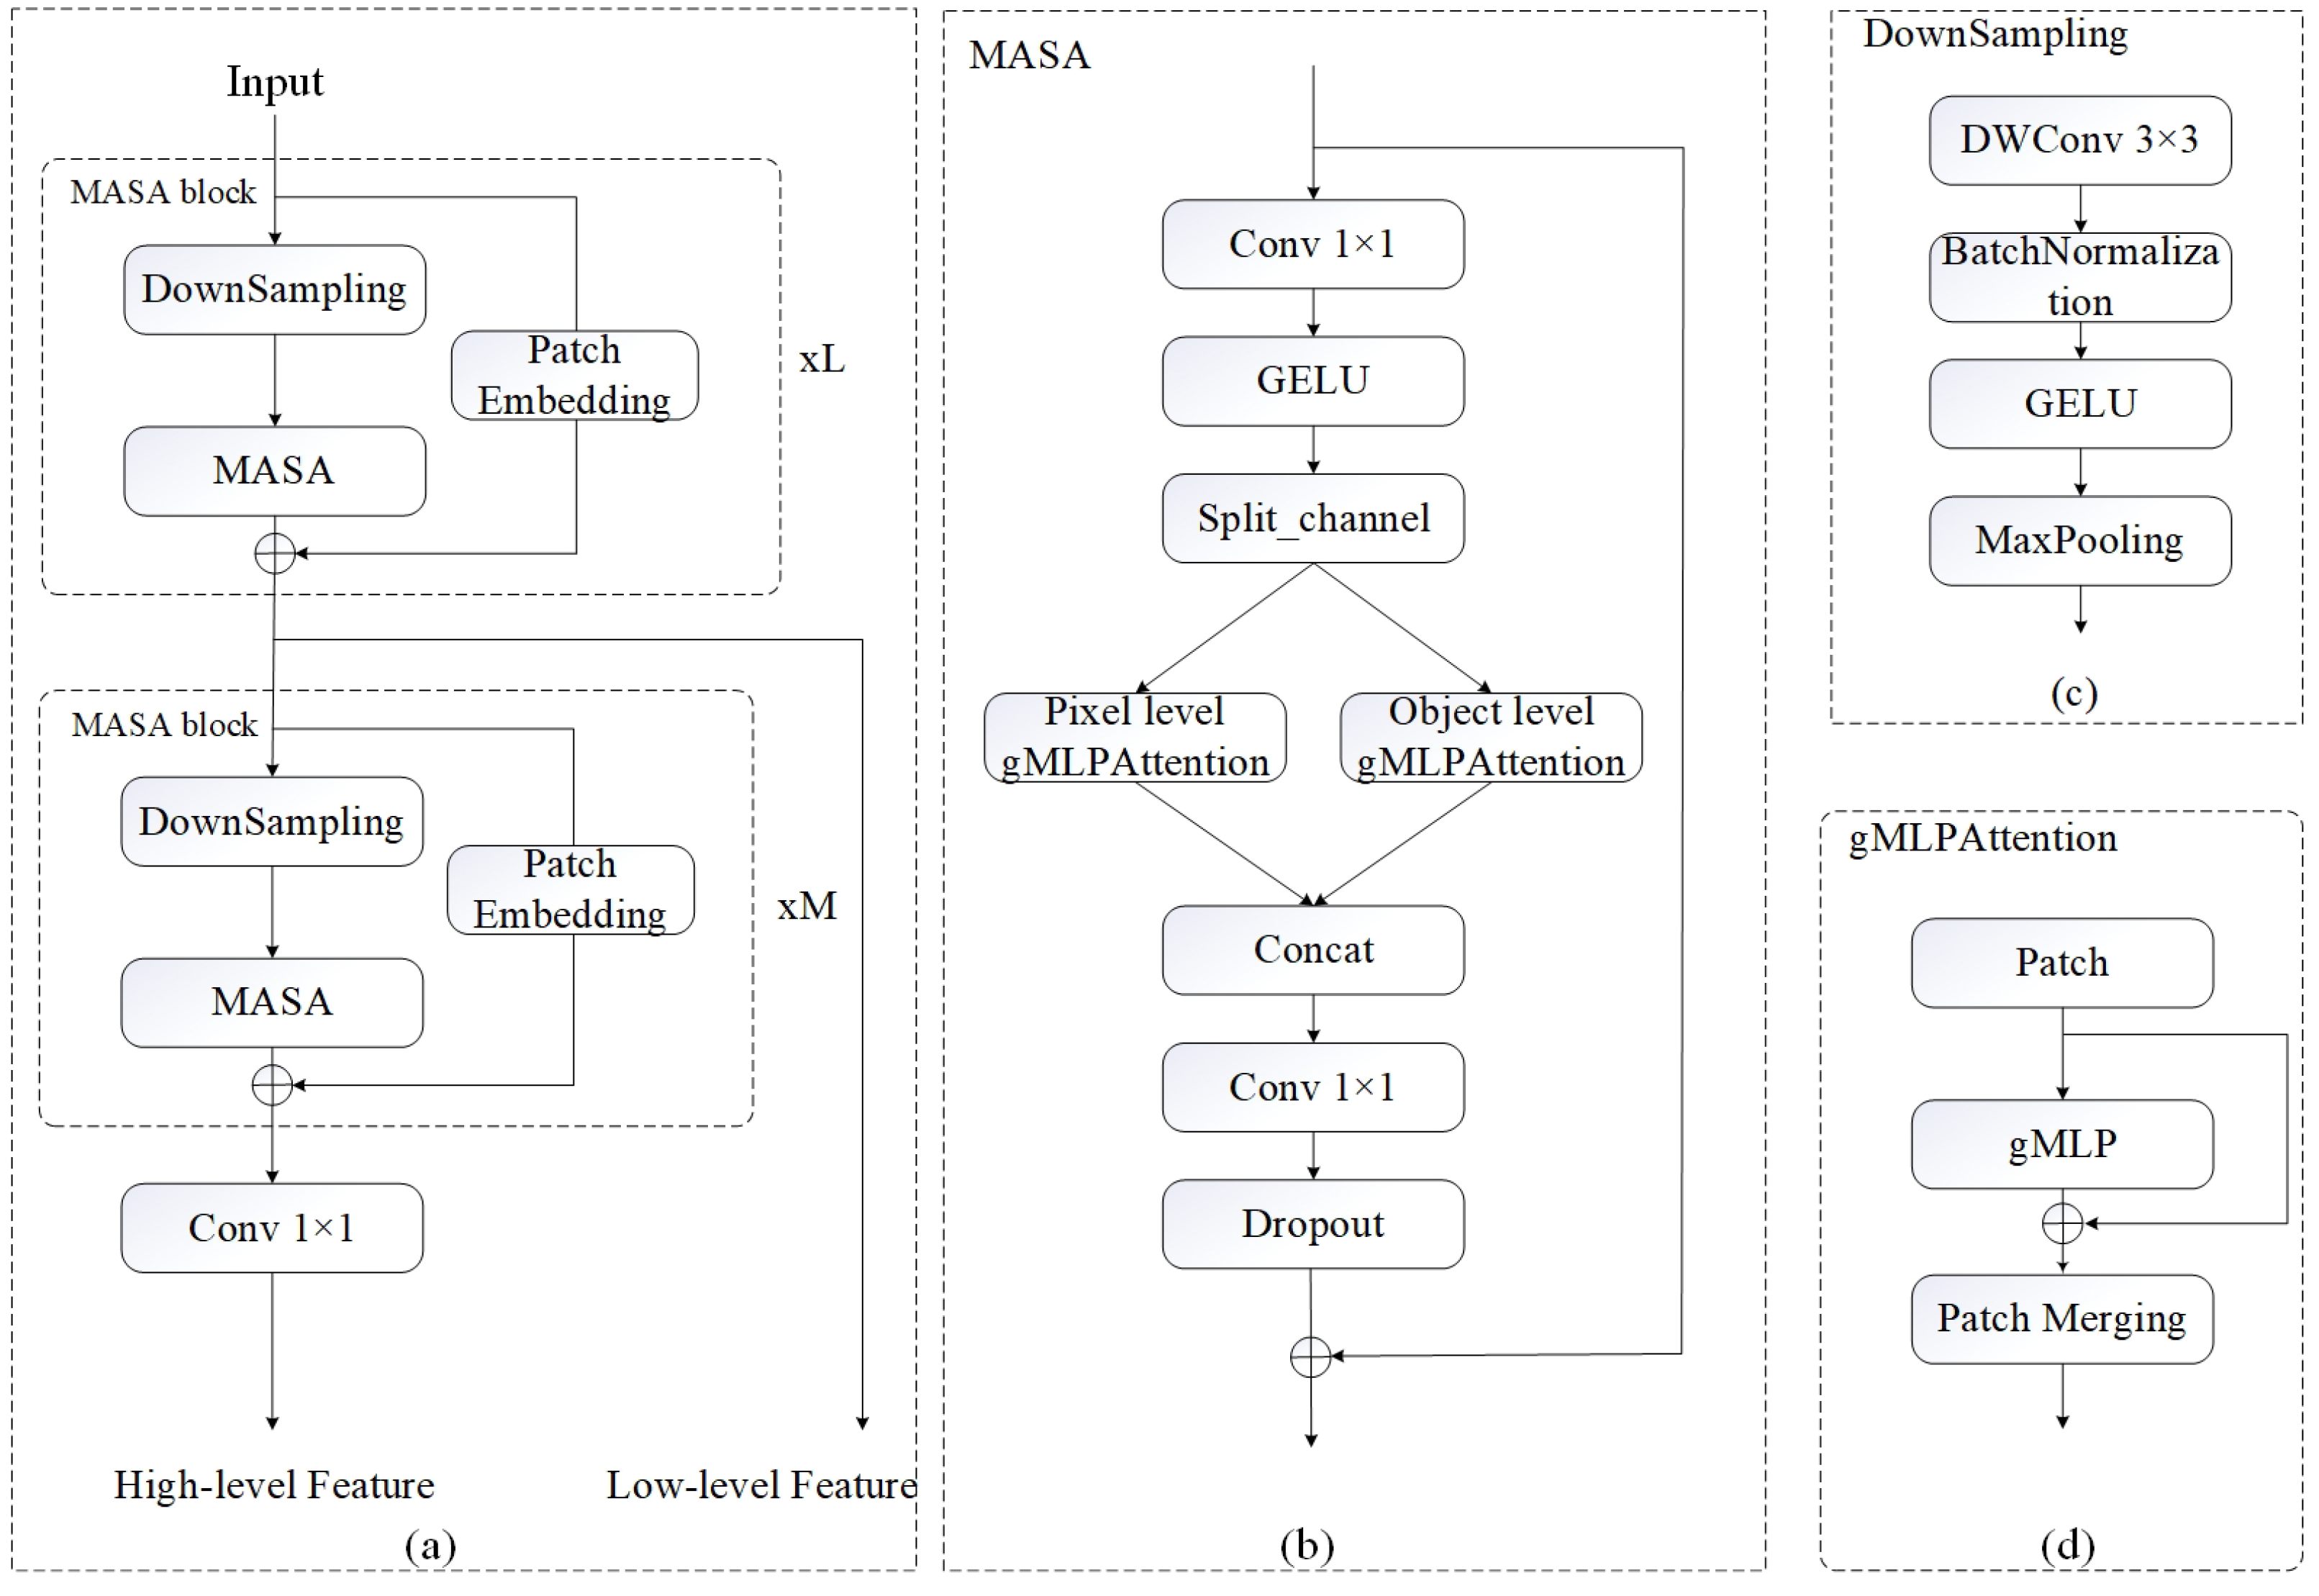
2.2.1. Framework of MASA-SegNet

In this paper, we propose an encoder–decoder framework for semantic segmentation of PolSAR images named Multi-axis Sequence Attention Segmentation Network (MASA-SegNet), which is illustrated in Figure 3. The encoder is composed of stacked blocks of the feature extractor, as shown in Figure 4a. We adopt a simple decoder structure, which receives low-level and high-level features from the encoder to accomplish pixel-level semantic segmentation.

2.2.2. PolSAR Image Feature Extraction

Our feature extractor is stacked with Multi-axis Sequence Attention (MASA) blocks. The PolSAR images are input into the feature extractor, and the low-level features and high-level features are extracted through MASA blocks, as shown in Figure 4a. These features are input to the decoder for the semantic segmentation task of PolSAR images.
The MASA block consists of three parts, the Multi-axis Sequence Attention (MASA), Downsampling, and Residual Connection, as shown in Figure 4b,c.
(1) DownSampling: Downsampling consists of depthwise separable convolution (DWConv) [33], Batch Normalization, Gaussian Error Linear Unit (GELU) activation function [34], and Maxpooling. The pseudo-RGB image x from PolSAR images shaped as(H, W, 3) is used as downsampling part inputs. We use depthwise separable convolution [33] to extract deep features, then normalize, activate (GLUE [34]), and perform Maxpooling to obtain feature f with a shape of ( h , w , c ) , which can be formulated as
f ( h , w , c ) = Maxpooling ( G N D ( x ) )
where GND is expressed as GELU, Batch Normalization, and depthwise separable convolution, h and w are the feature map height and width, and c is the number of channels. The DWConv with 3 × 3 convolution not only extracts features such as texture and color from the image, but also implicitly encodes spatial position information, retaining relative position information for each pixel, which is crucial for semantic work.
(2) Multi-axis Sequence Attention Block: Convolutional filters often lack attention ability and cannot effectively suppress the impact of noise on feature extraction, thus weakening the decoding performance of the model. To address this issue, the concept of multi-axis sequence attention (MASA) is introduced into PolSAR feature extraction tasks. Using MASA to perform pixel-level attention and region-level attention on features, we used a convolution with a kernel size of 1 × 1 to further deepen the features to ( h , w , 2 c ) , and then split the features into two axes along the channel dimension, with each axis having an input feature size of ( h , w , c ) .
Firstly, we serialize the features on both axes:
  • Pixel-level sequence attention: In the pixel-level attention axis, the feature with a size of ( h , w , c ) is serialized into a sequence of tensors with a shape of ( h b × w b , b × b , c ) , and the pixel of each block is ( b × b ) , as shown in Figure 5a.
  • Region-level sequence attention: In the region-level attention axis, the entire feature map is divided into ( q × q ) sequence windows with a shape of ( q × q , h q × w q , c ) , and the size of each window is ( h q × w q ) , as shown in Figure 5b.
During the serialization process, the values of b and q remain fixed and represent a predetermined token window size. Next, we deploy the gMLP [27] architecture across multiple axes to compute the internal attention Figure 4d of each token.
On the pixel-level axis, the spatial attention between local pixels is calculated. Meanwhile, on the region-level axis, the global region spatial attention is calculated. And then, the output features of the two axes are reshaped to ( h , w , c ) , as shown in Figure 5. The information from the upper and lower axes is merged and concatenated in the channel dimension to obtain the shape ( h , w , 2 c ) . Finally, we restore the features to their original size ( h , w , c ) by convolution with a kernel size of 1 × 1 . The implementation process of multi-axis sequence attention is shown in Figure 4b.
(3) Serialized Residual Connection: To prevent network degradation and share shallow information, we introduce a residual structure [35] in the MASA block. In order to map to channel dimensions for matching the attention sequnce, we introduce residual structure with serialization [19] to convert the features to sequence and transfer features to deeper layers without the degradation problem. In the process of serialization, we use 1 × 1 convolution to maintain the absolute spatial position, which allows us to better understand the global distribution of land features and objects. This simple design allows our backbone network to be both stackable and scalable, while also being able to stably preserve spatial location information.

2.3. Network Details

2.3.1. Encoder

The encoding part of our network is a feature extractor composed of four layers of MASA blocks. As shown in Figure 3a, the preprocessed pseudocolor image, with a size of ( H , W , 3 ) , is fed into the network. We stack two layers of MASA blocks sequentially to produce low-level features of ( h 4 , w 4 , 2 c ) in size, and c is set to 64. Each MASA block performs 2 × downsampling. The next two layers of MASA blocks are stacked to obtain high-level features, with a size of ( h 16 , w 16 , 8 c ). Our encoder pipeline is constructed in this way. It is worth noting that the number of MASA blocks used to extract high-level and low-level features can be variable.

2.3.2. Decoder

Inspired by DeeplabV3+ [36], we adopt its simple and efficient decoding method, as shown in Figure 3b. To facilitate the connection of low-level and high-level features, we use 1 × 1 convolution to reduce the dimensionality of low-level features from 2c to 48, i.e., ( h 4 , w 4 , c ). We upsample the high-level features by a factor of 4 to match the size of the low-level feature, i.e., ( h 4 , w 4 , 8 c ). Then, we concatenate the high-level features and low-level features along the channel dimension, i.e., ( h 4 , w 4 , 8 c + c ). Finally, a ( h 4 , w 4 , 4 c ) feature is obtained through a 3 × 3 convolution, and after 4 times upsampling and a 1 × 1 convolution, the classification of each pixel is achieved, which is ( H , W , c l a s s ) .

3. Experiments and Results

Datasets: In order to validate the effectiveness of our proposed method, we conducted experiments using two datasets, namely the AIR-PolSAR-Seg [29] multi-polarization SAR image dataset and the FUSAR-MAP [30] single-polarization SAR image dataset. We preprocessed the two datasets using the method described in Section 2.1 to obtain the synthesized pseudo-RGB SAR images, and then we divided them into training, validation, and testing sets in a ratio of 7:2:1.
Implementation Details: We built our deep learning model using the PyTorch framework and trained it on an NVIDIA GeForce RTX 3090 GPU with 24 GB of memory, running on the Ubuntu operating system. SGD is selected as the optimizer with an initial learning rate of 7 × 10⁻³ and a minimum limit of 7 × 10⁻⁵, implementing a cosine annealing strategy to decrease the learning rate while setting the batchsize to 8 and epoch number to 500. The loss function is CrossEntropy loss.
Evaluation Metrics: In order to evaluate the performance of the network, we use some commonly accepted performance evaluation criteria to evaluate our network. In our work, we use Intersection over Union (IoU) to evaluate the single-category segmentation effect and use mean Intersection over Union (mIoU), frequency-weighted Intersection over Union (FWIoU), and overall accuracy (OA) to evaluate the overall segmentation effect. IoU, MIoU, and FWIoU are all measures used to quantify the similarity between two sets, while OA and MPA are used to measure the accuracy of pixel classification.
The calculation formula for Intersection over Union (IoU) and mean Intersection over Union (mIoU) is
I o U = P i i j = 0 k P i j + j = 0 k P j i P i i
M I o U = 1 T + 1 i = 0 T P i i j = 0 k P i j + j = 0 k P j i P i i
where T is the total number of categories T ( 1 , 2 k ) , assuming P i j is the amount of pixels predicted as class j by class i, and P i i is the amount of pixels correctly predicted as class i.
The calculation formula for FWIou (Frequency Weighted Intersection over Union) is
FWIoU = 1 i = 1 T j = 1 T P i j i = 1 T j = 1 T P i j P i i j = 1 T P i j + P j i P i i .
The calculation formula for OA (Overall Accuracy) is
OA = i = 1 k P i i i = 1 k T i ,
where T i is the total number of pixels labeled as class i.

3.1. Experiments on FUSAR-MAP Dataset

This section shows the result of our proposed semantic segmentation method on the FUSAR-MAP [30] dataset. Comparing with other state-of-the-art single-polarization SAR image semantic segmentation algorithms, U-Net [37], SegNet [38], VGG-SegNet [38], DeepLabV3+ [36], and Fusar-Map network [30], our method demonstrates superiority in small target segmentation and small sample learning when compared to the other networks.
Table 1 shows the results of the FUSAR-MAP [30] dataset; three indicators, namely IoU, mIoU, FWIoU, and OA, are selected to evaluate the performance of our network. Our overall evaluation metrics OA and FWIoU are 79.67% and 75.94%, respectively, which shows excellent performance compared to other networks. OA is improved by 3.83–14.83% and FWIoU improved by 9.35–21.18%. In addition, the IoU values for categories such as water, road, and vegetation are 88.68%, 25.56%, and 61.27%, respectively, all of which are higher than the results of other networks.
The segmentation results shown in Figure 6 confirm our experimental data. There exist numerous small road branches in the FUSAR-MAP [30] dataset, which pose a challenge to improving segmentation accuracy. As shown in Figure 6c, our method demonstrates its superiority in the extraction of Collector Road and Residential Road. In the predicted results of Figure 6d–f, only large Arterial Road is segmented, while most small roads are identified as background, confirming that MASA-SegNet has a larger receptive field.
Furthermore, the network we proposed can improve the perception of detail features and suppress the coherent noise generated during the backward scattering process. Especially in urban areas where vegetation and buildings are heavily overlapped, such as the Residential area shown in Figure 6, the prediction results of other networks exhibit significant misclassification of vegetation and buildings. In contrast, our network effectively distinguishes the background, vegetation, and buildings. As shown in Figure 6a,b, there exists pixel-value interference (speckle noise) between closely connected vegetation and buildings; even after the fusion of SAR and optical images, the speckle noise still exists. However, our segmentation results can effectively recognize buildings and vegetation, suppress noise, and reduce misclassification.
We believe that the superiority of the network is attributable to its multi-axis and multi-scale design structure, as well as the spatial and adjacent semantic correlation information provided by the sequence attention.

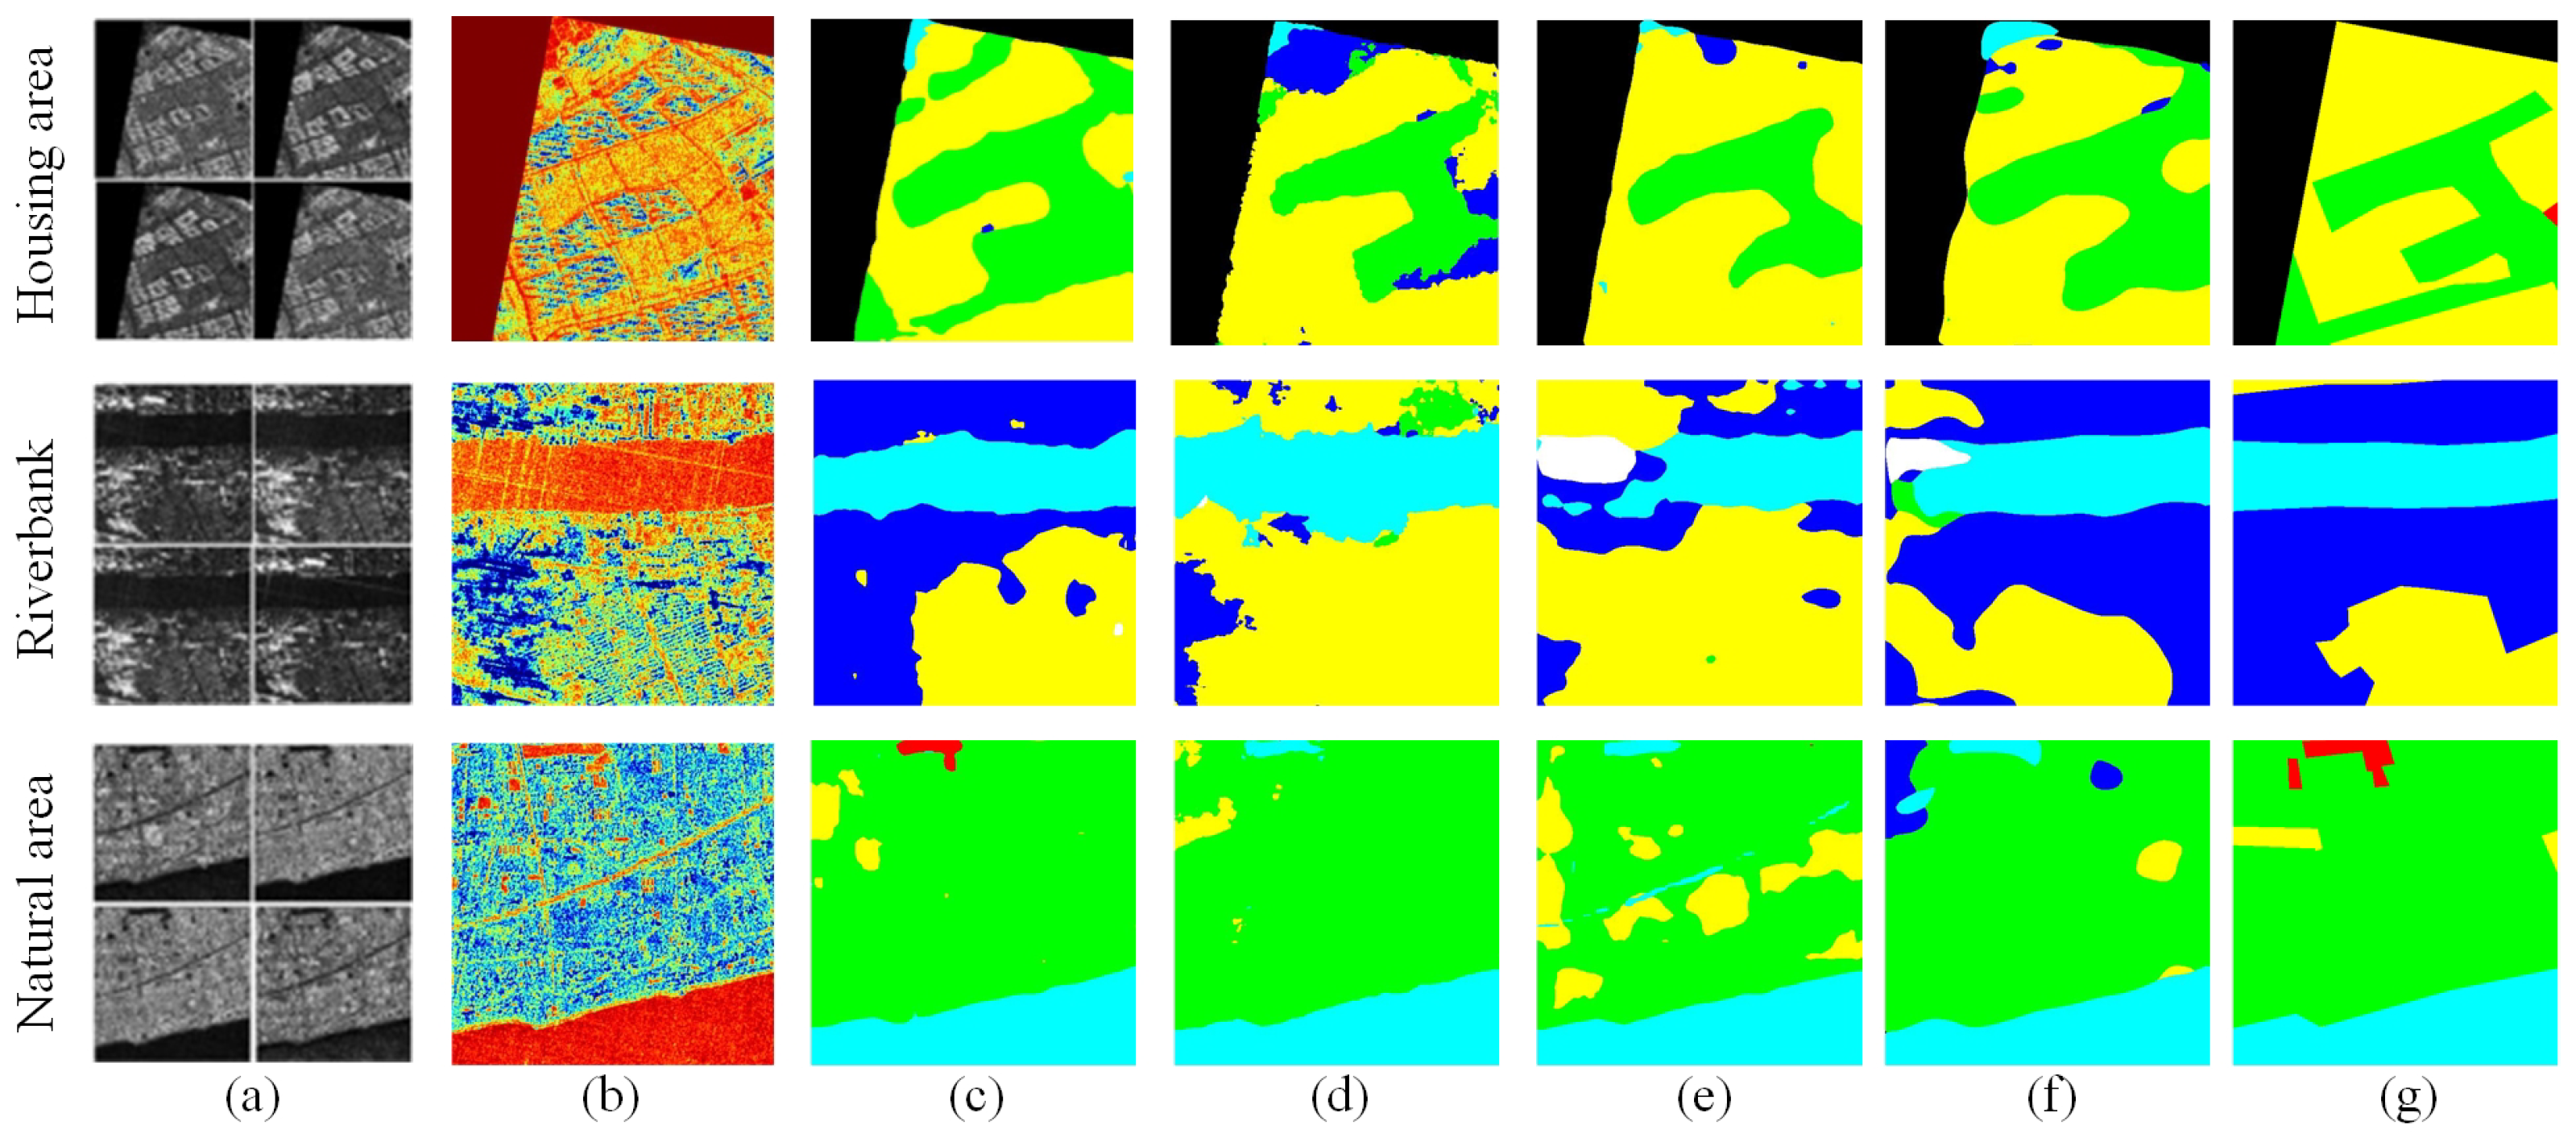
3.2. Experiments on AIR-PolSAR-Seg Dataset

This section presents the experimental results obtained by applying our method to the AIR-PolSAR-Seg dataset [29]. We compared FCN [39], ANN [40],U-Net [37], Deeplabv3+ [36], DANet [41], PSPNet [42], EncNet [43], NonLocal [44], FUSAR-Map [30] with our work.
Table 2 presents the results of our experiments, where IoU is the evaluation metric for various types of land cover, and mIoU, OA, and FWIoU serve as overall evaluation metrics. In comparison to other networks, our method has exhibited improvement in small target segmentation. The IoU value of the Land Use category in our study reached 7.91%, which is an increase of 5.44–7.36%. With regard to overall evaluation metrics, the mIoU rose by 1.67–10.02%, and the OA improved by 0.14–1.93%. Despite the fact that our performance in the water and housing categories is not the best, we gain a remarkable edge in OA and mIoU, arguably resulting from the way our network amplifies the receptive field when extracting features and implicitly encodes relative and absolute spatial information to guide pixel-level classification.
The results from different networks are presented in Figure 7. In the Natural area scene, by comparing the ground truth in Figure 7g with our test results in Figure 7c, we observe that the land use, as a small target, is effectively recognized. As shown in Figure 7d–f this small target is not identified or even misdetected. This makes us believe that the advantage of our network with multi-scale receptive fields remains effective in the multi-polarized data. It is worth noting that the spatial distribution of the overall terrain classification conforms to the terrain layout of the labels as shown in the comparison of Figure 7c–g. In the riverbank scene, particularly the difference in results between Figure 7c,f demonstrates the spatial awareness ability of our network.
The result indicates that our method can improve the network’s sensitivity to different backscatter types, guiding the edge segmentation and maximally retaining the position information in abstract features.

3.3. Ablation Study

Ablation experiments are designed to validate the superiority of the attention mechanism in SAR image processing within our network. Using MASA-SegNet as the baseline, we design a Full Convolution Network (FCN) architecture as a control group, denoted as MASA-SegNet without MASA (None-MASA). None-MASA retains all downsampling modules and residual connections from MASA-SegNet while excluding the MASA, aiming to validate our proposition that the attention mechanism establishes connections between pixels and focuses attention on valuable data, thus preserving high-frequency features, enhancing spatial awareness of the network, and perceiving subtle changes such as details, edges, and textures in the image.
We conducted experiments on the AIR-PolSAR-Seg dataset and provided the experimental results. Table 3 provides a numerical comparison of performance indicators; mIoU, FWIoU, and OA all verify the role of the MASA in improving spatial perception and classification accuracy.
The visualization of the effect of attention on the prediction results is shown in Figure 8. The red boxes in Figure 8b,c highlight the differences in network segmentation results, demonstrating the capabilities in small object and detail segmentation as well as noise suppression. It is evident that our network is able to predict results more smoothly and effectively suppress noise. In the first row of images in Figure 8b, there are no pixel misclassifications in the segmentation of the river. In contrast, in the first row of the prediction results in Figure 8c, such misclassifications are present due to noise. The second row of results in Figure 8b,c confirms our superiority in small object segmentation.

4. Discussion

4.1. Analysis of Data Preprocessing Effects

Traditional noise metrics such as Peak Signal-to-Noise Ratio (PSNR) and Structural Similarity Index (SSIM) require comparison with clear, noise-free data. However, the dataset lacks real noise-free images, which poses a challenge for evaluating denoising performance. The noise in SAR images appears as randomly scattered pixels due to its imaging mechanism. These pixels exhibit a random and discrete distribution within the image. Based on the noise characteristics of SAR images, we can assess image quality by comparing scatter plots before and after preprocessing. Scatter plots effectively display the distribution of pixel values in an image, with each point representing a pixel value, and the degree of scatter in the points of the scatter plot reflects the level of image chaos. We analyze the distribution of pixel point values qualitatively using scatter plots. Figure 9a contains a large number of randomly scattered points, representing random speckle noise, and in Figure 9b, the presence of outliers decreases, and pixel points are constrained within a certain range, demonstrating the effectiveness of our preprocessing method in denoising tasks.

4.2. Effect of Feature Extractor on PolSAR

Considerations regarding the imaging characteristics of PolSAR necessitate addressing the precise identification of similar scattering types and the suppression of coherent noise. The feature extractor in our proposed MASA-SegNet offers the advantages of multi-axis neighborhood attention and serialized spatial positional information. It combines the characteristics of convolution-pooling downsampling structure and multi-axis neighborhood attention, which enables the network to extract features while expanding the receptive field and enhance spatial awareness. Neighborhood attention from gMLP structure allows it to establish pixel-level relations, which helps counteract incoherent noise interference. This will provide important reference for the multi-level feature selection strategy.
In the design of our proposed MASA-SegNet, we require a clear, denoised image as the input for low-level features while simultaneously preserving edge and texture features to enhance the extraction of local detail information. From Figure 10a–c, it is evident that the output of the second block exhibits significant improvements in smoothing and edge enhancement compared to the first block. From the third block onward, the image features gradually become more abstract, hence the selection of the output of the second block as low-level features. We consider that the expansion of network depth is caused by the built-in convolutional operations in our attention module, which performs adaptive weighted dot product summation within the module. This helps to reduce noise interference on the same resolution unit, addressing cases of boundary fuzziness and misclassification. As the network deepens, the feature images gradually become more abstract, as shown in Figure 10d,e, and eventually output high-level features and merge them with low-level features in the decoder, in order to retain a significant amount of semantic information to coordinate the completion of the segmentation task.
Figure 10 shows the visualization results of the intermediate features from different layers, which proves our theory. Sporadically distributed speckled pixels may cause serious between-class similarity and within-class dissimilarity. Our network attends more closely to ground objects by incorporating multi-scale spatial awareness and multi-axis sequence attention mechanisms, thereby reducing the influence of noise on ground object classification. The features shown in Figure 10k,l proves that our network effectively suppresses coherent noise.
Figure 10f–j display the 3D quantification of features, manifesting the spatial propagation and detail enhancement during the feature extraction process. Although feature representation continuously abstracts with network depth, the maximum difference always concentrates within a fixed coordinate range. Correspondingly, this is visualized as the boundary line between the object and the background when projected onto Figure 10k–o.

4.3. Advantages of Framework

Our multi-axis attention network, designed specifically for polarimetric synthetic aperture radar (PolSAR) images, addresses segmentation challenges by exploiting spatial sequences and offers two advantages:
(1) Spatial position information. Our network promotes strong spatial perception through the downsampling and serialization of residual design. Within the downsampling module, feature extraction employs 3 × 3 convolution. At the same time, the serialization module utilizes adaptive padding and stride in a purely linear projection process employing 1 × 1 convolution for feature extraction, while retaining sequential spatial position information of different neighborhoods. The 1 × 1 convolution mainly serves two functions in serialization. One is to increase the dimension of the input of the previous layer and change the scale of the input to match the output of this layer for residual connection. The other is to implicitly encode the spatial position information of the previous layer and pass it to the next layer. Zero padding and borders in convolution are an anchor from which spatial information is derived and eventually propagated over the whole image [45]. In our network design, the spatial position information mainly comes from the input image and intermediate features. We believe that spatial information has excellent guiding significance for the accuracy improvement of semantic segmentation of land objects. The spatial connections between pixels provide global information for scene structures and background edges, reducing errors in semantic segmentation, such as misclassification of land objects, misalignment of segmentation objects, and confusion between backgrounds and recognition objects. At the same time, spatial position information helps to alleviate the spatial confusion caused by the partitioning and recombination in the gMLP (gated Multi-Layer Perceptron) structure.
(2) Image denoising. The imaging mechanism of PolSAR images determines that the input raw data have a large amount of speckle noise. Therefore, the feature extractor needs to have the performance of suppressing noise. A multi-axis sequence attention mechanism based on gMLP with linear projection completed by convolution is introduced to solve this challenge. The downsampled feature tensor subspace, which is used to generate attention weights, captures the dependency between neighboring and distant regions and focuses the network on more valuable areas to suppress noise effects.

5. Conclusions

This study introduces a new Multi-axial Sequence Attention Segmentation Network for Semantic segmentation of PolSAR image, namely, MASA-SegNet. The network employs an encoder–decoder structure in conjunction with convolution and gMLP to perform multi-scale spatial sequence attention semantic segmentation. It has demonstrated remarkable potential in both PolSAR image denoising and land use classification. However, the multi-axis sequence attention mechanism in MASA-SegNet lacks exploration for adaptive slice sizes. Fixed-size slicing windows may affect the network’s focus on ground targets and overall spatial perception, reducing its competitiveness in downstream tasks with limited objects of interest, such as object detection. In the future, we will explore adaptive dual-axis spatial sequence attention mechanisms and apply this structure to a wider range of remote sensing tasks.

Author Contributions

Conceptualization, J.S.; methodology, J.S. and S.Y.; software, S.Y.; validation, X.G.; formal analysis, X.G. and D.O.; investigation, J.S. and S.Y.; resources, X.G., D.O. and Z.T.; writing—original draft preparation, S.Y. and J.S.; writing—review and editing, D.O., Z.T. and J.W.; visualization, J.W. and M.W.; supervision, X.G. and M.W.; project administration, D.O. anf Z.T.; funding acquisition, X.G. All authors have read and agreed to the published version of the manuscript.

Funding

The authors are grateful for the funding provided by the Ministry of Science and Technology of China, National Key Research and Development Plan (No. 2022YFD1901400).

Data Availability Statement

Code and data can be obtained at https://github.com/sj6440/MASA-SegNet (accessed on 7 January 2023.).

Acknowledgments

The authors thank the anonymous reviewers for the helpful comments that improved this manuscript.

Conflicts of Interest

The authors declare no conflict of interest.

Sample Availability

The sample that support the findings of this study are available on request from the corresponding author.

Abbreviations

The following abbreviations are used in this manuscript:
SARSynthetic Aperture Radar
PolSARPolarimetric Synthetic Aperture Radar
MASA-SegNetMulti-axis Sequence Attention Segmentation Network
MASAMulti-axis Sequence Attention
SVMSupport Vector Machine
CNNsConvolutional Neural Networks
ViTVision Transformer
gMLPMultilayer Perceptron with gate
IoUIntersection over Union
mIoUMean Intersection over Union
FWIoUFrequency Weighted Intersection over Union
RLFRefined Lee Filter
OAOverall Accuracy
QPSIQuad-Polarization Strip Map
DW-ConvDepthwise Separable Convolution
GLUEGaussian Error Linear Units
SGDStochastic Gradient Descent

References

  1. Moreira, A.; Prats-Iraola, P.; Younis, M.; Krieger, G.; Hajnsek, I.; Papathanassiou, K.P. A tutorial on synthetic aperture radar. IEEE Geosci. Remote Sens. Mag. 2013, 1, 6–43. [Google Scholar] [CrossRef] [Green Version]
  2. Lee, J.-S.; Jurkevich, L.; Dewaele, P.; Wambacq, P.; Oosterlinck, A. Speckle filtering of synthetic aperture radar images: A review. Remote Sens. Rev. 1994, 8, 313–340. [Google Scholar] [CrossRef]
  3. Ayed, I.B.; Mitiche, A.; Belhadj, Z. Multiregion level-set partitioning of synthetic aperture radar images. IEEE Trans. Pattern Anal. Mach. Intell. 2005, 27, 793–800. [Google Scholar] [CrossRef] [PubMed]
  4. Parihar, N.; Das, A.; Rathore, V.S.; Nathawat, M.S.; Mohan, S. Analysis of l-band sar backscatter and coherence for delineation of land-use/land-cover. Int. J. Remote Sens. 2014, 35, 6781–6798. [Google Scholar] [CrossRef]
  5. Haldar, D.; Das, A.; Mohan, S.; Pal, O.; Hooda, R.S.; Chakraborty, B. Assessment of l-band sar data at different polarization combinations for crop and other landuse classification. Prog. Electromagn. Res. B 2012, 36, 303–321. [Google Scholar] [CrossRef] [Green Version]
  6. Liu, H.; Li, S. Decision fusion of sparse representation and support vector machine for sar image target recognition. Neurocomputing 2013, 113, 97–104. [Google Scholar] [CrossRef]
  7. Beijma, S.V.; Comber, A.; Lamb, A. Random forest classification of salt marsh vegetation habitats using quad-polarimetric airborne sar, elevation and optical rs data. Remote Sens. Environ. 2014, 149, 118–129. [Google Scholar] [CrossRef]
  8. Luo, S.; Tong, L.; Chen, Y. A multi-region segmentation method for sar images based on the multi-texture model with level sets. IEEE Trans. Image Process. 2018, 27, 2560–2574. [Google Scholar] [CrossRef]
  9. Bi, H.; Xu, L.; Cao, X.; Xue, Y.; Xu, Z. Polarimetric sar image semantic segmentation with 3d discrete wavelet transform and markov random field. IEEE Trans. Image Process. 2020, 29, 6601–6614. [Google Scholar] [CrossRef]
  10. Bianchi, F.M.; Espeseth, M.M.; Borch, N. Large-scale detection and categorization of oil spills from sar images with deep learning. Remote Sens. 2020, 12, 2260. [Google Scholar] [CrossRef]
  11. Jaturapitpornchai, R.; Matsuoka, M.; Kanemoto, N.; Kuzuoka, S.; Ito, R.; Nakamura, R. Newly built construction detection in sar images using deep learning. Remote Sens. 2019, 11, 1444. [Google Scholar] [CrossRef] [Green Version]
  12. Li, J.; Xu, C.; Su, H.; Gao, L.; Wang, T. Deep learning for sar ship detection: Past, present and future. Remote Sens. 2022, 14, 2712. [Google Scholar] [CrossRef]
  13. Cao, H.; Zhang, H.; Wang, C.; Zhang, B. Operational flood detection using sentinel-1 sar data over large areas. Water 2019, 11, 786. [Google Scholar] [CrossRef] [Green Version]
  14. Mohammadimanesh, F.; Salehi, B.; Mahdianpari, M.; Gill, E.; Molinier, M. A new fully convolutional neural network for semantic segmentation of polarimetric sar imagery in complex land cover ecosystem. ISPRS J. Photogramm. Remote Sens. 2019, 151, 223–236. [Google Scholar] [CrossRef]
  15. Orfanidis, G.; Ioannidis, K.; Avgerinakis, K.; Vrochidis, S.; Kompatsiaris, I. A deep neural network for oil spill semantic segmentation in sar images. In Proceedings of the 2018 25th IEEE International Conference on Image Processing (ICIP), Athens, Greece, 7–10 October 2018; pp. 3773–3777. [Google Scholar]
  16. Chen, L.-C.; Papandreou, G.; Kokkinos, I.; Murphy, K.; Yuille, A.L. Deeplab: Semantic image segmentation with deep convolutional nets, atrous convolution, and fully connected crfs. IEEE Trans. Pattern Anal. Mach. Intell. 2017, 40, 834–848. [Google Scholar] [CrossRef] [Green Version]
  17. Zou, B.; Xu, X.; Zhang, L. Object-based classification of polsar images based on spatial and semantic features. IEEE J. Sel. Top. Appl. Earth Obs. Remote. Sens. 2020, 13, 609–619. [Google Scholar] [CrossRef]
  18. Vaswani, A.; Shazeer, N.; Parmar, N.; Uszkoreit, J.; Jones, L.; Gomez, A.N.; Kaiser, L.; Polosukhin, I. Attention is all you need. Adv. Neural Inf. Process. Syst. 2017, 30. [Google Scholar] [CrossRef]
  19. Dosovitskiy, A.; Beyer, L.; Kolesnikov, A.; Weissenborn, D.; Zhai, X.; Unterthiner, T.; Dehghani, M.; Minderer, M.; Heigold, G.; Gelly, S.; et al. An image is worth 16 × 16 words: Transformers for image recognition at scale. arXiv 2020, arXiv:2010.11929. [Google Scholar]
  20. Liu, Z.; Lin, Y.; Cao, Y.; Hu, H.; Wei, Y.; Zhang, Z.; Lin, S.; Guo, B. Swin transformer: Hierarchical vision transformer using shifted windows. In Proceedings of the IEEE/CVF International Conference on Computer Vision, Virtual Event, 12 October 2021; pp. 10012–10022. [Google Scholar]
  21. Sun, J.; Zhang, J.; Gao, X.; Wang, M.; Ou, D.; Wu, X.; Zhang, D. Fusing spatial attention with spectral-channel attention mechanism for hyperspectral image classification via encoder–decoder networks. Remote Sens. 2022, 14, 1968. [Google Scholar] [CrossRef]
  22. Dong, H.; Zhang, L.; Zou, B. Exploring vision transformers for polarimetric sar image classification. IEEE Trans. Geosci. Remote Sens. 2021, 60, 5219715. [Google Scholar] [CrossRef]
  23. Jamali, A.; Roy, S.K.; Bhattacharya, A.; Ghamisi, P. Local window attention transformer for polarimetric sar image classification. IEEE Geosci. Remote Sens. Lett. 2023, 20, 4004205. [Google Scholar] [CrossRef]
  24. Liu, X.; Wu, Y.; Liang, W.; Cao, Y.; Li, M. High resolution sar image classification using global-local network structure based on vision transformer and cnn. IEEE Geosci. Remote Sens. Lett. 2022, 19, 4505405. [Google Scholar] [CrossRef]
  25. Xia, R.; Chen, J.; Huang, Z.; Wan, H.; Wu, B.; Sun, L.; Yao, B.; Xiang, H.; Xing, M. Crtranssar: A visual transformer based on contextual joint representation learning for sar ship detection. Remote Sens. 2022, 14, 1488. [Google Scholar] [CrossRef]
  26. Zhao, S.; Luo, Y.; Zhang, T.; Guo, W.; Zhang, Z. A domain specific knowledge extraction transformer method for multisource satellite-borne sar images ship detection. ISPRS J. Photogramm. Remote Sens. 2023, 198, 16–29. [Google Scholar] [CrossRef]
  27. Liu, H.; Dai, Z.; So, D.; Le, Q.V. Pay attention to mlps. Adv. Neural Inf. Process. Syst. 2021, 34, 9204–9215. [Google Scholar]
  28. Tu, Z.; Talebi, H.; Zhang, H.; Yang, F.; Milanfar, P.; Bovik, A.; Li, Y. Maxim: Multi-axis mlp for image processing. In Proceedings of the IEEE/CVF Conference on Computer Vision and Pattern Recognition, Istanbul, Turkey, 28–29 January 2022; pp. 5769–5780. [Google Scholar]
  29. Wang, Z.; Zeng, X.; Yan, Z.; Kang, J.; Sun, X. Air-polsar-seg: A large-scale data set for terrain segmentation in complex-scene polsar images. IEEE J. Sel. Top. Appl. Earth Obs. Remote Sens. 2022, 15, 3830–3841. [Google Scholar] [CrossRef]
  30. Shi, X.; Fu, S.; Chen, J.; Wang, F.; Xu, F. Object-level semantic segmentation on the high-resolution gaofen-3 fusar-map dataset. IEEE J. Sel. Top. Appl. Earth Obs. Remote Sens. 2021, 14, 3107–3119. [Google Scholar] [CrossRef]
  31. Yommy, A.S.; Liu, R.; Wu, S. Sar image despeckling using refined lee filter. In Proceedings of the 2015 7th International Conference on Intelligent Human-Machine Systems and Cybernetics, Hangzhou, China, 26–27 August 2015; Volume 2, pp. 260–265. [Google Scholar]
  32. Toet, A.; Walraven, J. New false color mapping for image fusion. Opt. Eng. 1996, 35, 650–658. [Google Scholar] [CrossRef]
  33. Chollet, F. Xception: Deep learning with depthwise separable convolutions. In Proceedings of the IEEE Conference on Computer Vision and Pattern Recognition, Honolulu, HI, USA, 21–26 July 2017; pp. 1251–1258. [Google Scholar]
  34. Wang, A.; Singh, A.; Michael, J.; Hill, F.; Levy, O.; Bowman, S.R. Glue: A multi-task benchmark and analysis platform for natural language understanding. arXiv 2018, arXiv:1804.07461. [Google Scholar]
  35. He, K.; Zhang, X.; Ren, S.; Sun, J. Deep residual learning for image recognition. In Proceedings of the IEEE Conference on Computer Vision and Pattern Recognition, Las Vegas, NV, USA, 26 June–1 July 2016; pp. 770–778. [Google Scholar]
  36. Chen, L.; Zhu, Y.; Papandreou, G.; Schroff, F.; Adam, H. Encoder-decoder with atrous separable convolution for semantic image segmentation. In Computer Vision–ECCV 2018: 15th European Conference, Munich, Germany, 8–14 September 2018, Proceedings, Part VII 15; Springer: Berlin/Heidelberg, Germany, 2018; pp. 833–851. [Google Scholar]
  37. Ronneberger, O.; Fischer, P.; Brox, T. U-net: Convolutional networks for biomedical image segmentation. In Medical Image Computing and Computer-Assisted Intervention–MICCAI 2015: 18th International Conference, Munich, Germany, 5–9 October 2015, Proceedings, Part III 18; Springer: Berlin/Heidelberg, Germany, 2015; pp. 234–241. [Google Scholar]
  38. Badrinarayanan, V.; Kendall, A.; Cipolla, R. Segnet: A deep convolutional encoder-decoder architecture for image segmentation. IEEE Trans. Pattern Anal. Mach. Intell. 2017, 39, 2481–2495. [Google Scholar] [CrossRef]
  39. Long, J.; Shelhamer, E.; Darrell, T. Fully convolutional networks for semantic segmentation. In Proceedings of the IEEE Conference on Computer Vision and Pattern Recognition, Boston, MA, USA, 7–12 June 2015; pp. 3431–3440. [Google Scholar]
  40. Zhu, Z.; Xu, M.; Bai, S.; Huang, T.; Bai, X. Asymmetric non-local neural networks for semantic segmentation. In Proceedings of the IEEE/CVF International Conference on Computer Vision, Seoul, Korea, 27 October–2 November 2019; pp. 593–602. [Google Scholar]
  41. Fu, J.; Liu, J.; Tian, H.; Li, Y.; Bao, Y.; Fang, Z.; Lu, H. Dual attention network for scene segmentation. In Proceedings of the IEEE/CVF Conference on Computer Vision and Pattern Recognition, Long Beach, CA, USA, 16–20 June 2019; pp. 3146–3154. [Google Scholar]
  42. Zhao, H.; Zhang, Y.; Liu, S.; Shi, J.; Loy, C.C.; Lin, D.; Jia, J. Psanet: Point-wise spatial attention network for scene parsing. In Proceedings of the European Conference on Computer Vision (ECCV), Munich, Germany, 8–14 September 2018; pp. 267–283. [Google Scholar]
  43. Zhang, H.; Dana, K.; Shi, J.; Zhang, Z.; Wang, X.; Tyagi, T.; Agrawal, A. Context encoding for semantic segmentation. In Proceedings of the IEEE Conference on Computer Vision and Pattern Recognition, Salt Lake City, UT, USA, 18–22 June 2018; pp. 7151–7160. [Google Scholar]
  44. Wang, X.; Girshick, R.; Gupta, A.; He, K. Non-local neural networks. In Proceedings of the IEEE Conference on Computer Vision and Pattern Recognition, Salt Lake City, UT, USA, 18–22 June 2018; pp. 7794–7803. [Google Scholar]
  45. Islam, M.A.; Jia, S.; Bruce, N.D.B. How much position information do convolutional neural networks encode? arXiv 2020, arXiv:2001.08248. [Google Scholar]
Figure 1. The FUSAR-MAP dataset. (a) The single-polarization SAR image. (b) A grayscale image of the optical image’s green channel. (c) The result of image fusion. (d) The label of SAR images.
Remotesensing 15 03662 g001
Figure 2. The AIR-PolSAR-Seg dataset. (a) The Multi-polarization SAR image. (b) The grayscale image fused by four polarization SAR images. (c) The composite image after color space conversion. (d) The labels of SAR images.
Remotesensing 15 03662 g002
Figure 3. The proposed framework, MASA-SegNet. (a) The encoder part of MASA-SegNet used for feature extraction. (b) The decoder part of MASA-SegNet used for pixel-level semantic classification. The parameter c represents the number of channels of features, and the value of parameter c in MASA-SegNet can be manually adjusted.
Remotesensing 15 03662 g003
Figure 4. The details of feature extractor. (a) The structure of feature extractor. (b) The Multi-axis Sequence Attention. (c) The downsampling model. (d) The attention model.
Remotesensing 15 03662 g004
Figure 5. Multi-axis sequence attention (MASA). (a) The pixel-level sequence attention. (b) The region-level sequence attention.
Remotesensing 15 03662 g005
Figure 6. Visualization of experimental results on the FUSAR-MAP dataset. (a) Raw single-polarization SAR image; (b) single-polarization SAR fusion optical image; (c) MASA-SegNet; (d) DeeplabV3+; (e) U-Net; (f) FUSAR-Map; (g) ground truth.
Remotesensing 15 03662 g006
Figure 7. Visualization of experimental results on the AIR-PolSAR-Seg dataset. (a) Raw Multi-polarization SAR image; (b) preprocessed PolSAR data; (c) MASA-SegNet; (d) DeeplabV3+; (e) U-Net; (f) FUSAR-Map. (g) ground truth.
Remotesensing 15 03662 g007
Figure 8. Prediction result images of ablation experiment on AIR-PolSAR-Seg dataset. (a) Preprocessed PolSAR data; (b) the result of MASA-SegNet; (c) the result of None-MASA; (d) ground truth.
Remotesensing 15 03662 g008
Figure 9. Speckle distribution map. (a) Pixel value distribution chart of the original image; (b) pixel value distribution chart of the preprocessed image.
Remotesensing 15 03662 g009
Figure 10. Feature visualization of MaSSA-Net. (ae) Visualization of the output features of individual layers of MaSSA-Net. (fj) 3D surface plot of the features. (ko) 2D heat map of 3D surface graph.
Remotesensing 15 03662 g010
Table 1. Results on FUSAR-MAP dataset.
MethodsTerrain Category/IOU(%)mIoUFWIoUOA
WaterRoadBuildingVegetation
and Others
U-Net [37]81.9313.0222.0656.7043.4357.3466.92
SegNet [38]79.406.4411.7956.4638.5254.7664.78
VGG-SegNet [38]82.227.8528.5557.4944.0359.2168.26
DeepLabv3+ [36]85.8713.7232.6058.3047.6262.2372.02
FUSAR-Map [30]88.2825.2635.1560.5552.3166.5975.80
MASA-SegNet88.6825.5627.2861.2750.7075.9479.67
Table 2. Results on AIR-PolSAR-Seg dataset.
MethodsTerrain Category/IOU (%)mIoUFWIoUOA
Industrial
Area
Natural
Area
Land UseWaterHousingOther
FCN [39]37.7871.581.2472.7667.6939.0548.3553.2176.28
ANN [40]41.2372.920.9775.9568.4056.0152.5861.5477.46
U-Net [37]42.1773.830.9675.5267.1953.2852.1262.1277.29
DeepLabv3+ [36]40.6270.670.5572.9369.9634.5348.2156.2476.81
DANet [41]39.5672.001.0074.9567.7956.2851.9358.7376.91
PSPNet [42]40.7069.461.3369.4668.7532.6847.1456.9576.21
EncNet [43]32.9571.591.8975.6667.1637.2447.7557.6875.67
NonLocal [44]35.5171.122.4770.6068.3916.3144.2353.4376.05
FUSAR-Map [30]38.5274.091.9468.1762.8847.6355.4560.6174.42
MASA-SegNet45.0074.797.9174.3666.8756.5854.2565.5477.60
Table 3. Result of ablation experiment on AIR-PolSAR-Seg dataset.
MethodmIoUFWIoUOA
None-MASA47.95560.2273.78
MASA-SegNet54.2565.5477.6
Disclaimer/Publisher’s Note: The statements, opinions and data contained in all publications are solely those of the individual author(s) and contributor(s) and not of MDPI and/or the editor(s). MDPI and/or the editor(s) disclaim responsibility for any injury to people or property resulting from any ideas, methods, instructions or products referred to in the content.

