Article

Vegetation Dynamics and Its Response to Extreme Climate on the Inner Mongolian Plateau during 1982–2020

1
College of Geographical Science, Inner Mongolia Normal University, Hohhot 010022, China
2
Inner Mongolia Key Laboratory of Disaster and Ecological Security on the Mongolian Plateau, Inner Mongolia Normal University, Hohhot 010022, China
3
Provincial Key Laboratory of Mongolian Plateau’s Climate System, Inner Mongolia Normal University, Hohhot 010022, China
4
Inner Mongolia Key Laboratory of Remote Sensing and Geographic Information Systems, Inner Mongolia Normal University, Hohhot 010022, China
5
Ecology and Environment College, Hainan University, Haikou 570208, China
*
Author to whom correspondence should be addressed.
Remote Sens. 2023, 15(15), 3891; https://doi.org/10.3390/rs15153891
Submission received: 15 July 2023 / Revised: 4 August 2023 / Accepted: 4 August 2023 / Published: 6 August 2023

Abstract

:
The impact of extreme climate change on terrestrial ecosystems continues to intensify. This study was conducted to understand extreme climate–vegetation interactions under exacerbated frequency, severity, and duration of extreme climatic events. The Inner Mongolian Plateau (IMP) was selected due to its sensitive natural location, which is particularly vulnerable to climate change. Based on the Normalized Difference Vegetation Index (NDVI) and daily meteorological station data from 1982 to 2020, changes in the patterns of vegetation and extreme climate in the three ecological zones (forest, steppe, and desert steppe) of the IMP were identified. Furthermore, the effects of extreme climate on vegetation were quantified using correlation analysis and a geographical detector. The results showed that the annual NDVI of 95.1%, 50.6%, and 19.5% of the area increased significantly in the forest, steppe, and desert steppe, respectively. The Tx90p (warm days) and Tn90p (warm nights) increased significantly at the rate of 0.21 and 0.235 day·yr−1, respectively, while the Tx10p (cold days) and Tn10p (cold nights) showed a significantly decreasing trend at the rate of −0.105 and −0.117 day·yr−1. An extreme warming phenomenon was observed in all extreme temperature indices on the IMP. The results of both the correlation analysis and factor detector indicated that extreme temperature intensity and frequency greatly affected forest vegetation. In contrast, extreme precipitation intensity and frequency were relatively more important to the vegetation of the desert steppe. The lag in NDVI response to extreme temperature intensity was not less than three months in the IMP; however, extreme precipitation intensity exhibited a two-month time lag in the NDVI. This study can improve our understanding of extreme climate–vegetation interactions, provide theoretical support for disaster mitigation, and aid in understanding the ecological environment of the IMP.

1. Introduction

Climate change is the greatest potential health threat to the world in the 21st century [1]. Globally, temperature is increasing rapidly, which will lead to extreme climatic events such as heatwaves, droughts, and floods [2]. Compared to mean-state climate change, extreme climatic events can seriously impact society and human life due to their destructive and unpredictable nature [3,4,5]. According to the State of Climate Services (2020), there have been 11,072 extreme climatic events worldwide over the past 50 years, which have directly and indirectly killed 2.06 million people and caused 3.6 trillion dollars in economic losses [6]. In addition to human life and society, extreme climatic events affect ecosystems by altering soil moisture, physiological characteristics, nutrient status, community structure, productivity, and carbon cycling [7,8]. Therefore, it is crucial to detect variations in extreme climatic characteristics and identify their influence on ecosystems.
Vegetation and plant communities play key roles in terrestrial ecosystems [9]. Vegetation links the atmosphere, soil, and biosphere together, and vegetative processes such as respiration, photosynthesis, and evapotranspiration prominently influence material transfer and energy exchange in an ecosystem [10,11]. Based on previous experience, vegetation must adapt to the climatic conditions of its current environment to achieve optimum growth [12,13]. However, this adaptation strategy is difficult to clarify in the event of extreme climatic events. Therefore, it is imperative to understand the variation in vegetation dynamics and its response to extreme climatic events considering the increased frequency, severity, and duration of such events. Numerous satellite-based vegetation indices can assess vegetation growth [14,15], among which the NDVI accurately assesses surface vegetation owing to its ability to reduce sensor calibration, bi-directional effects, and the effects of atmosphere and terrain [16,17]. Therefore, this study utilized the NDVI to characterize the spatiotemporal variation of vegetation and its response to climate extremes.
The Expert Team on Climate Change Detection and Indices (EICCDI) have identified and evaluated 27 extreme climate indices that describe climate in different dimensions, such as duration, intensity, and frequency [18]. Numerous studies have analyzed the link between vegetation and extreme climatic indices [19,20,21,22]. However, most of these analyses focused only on a single spatiotemporal scale and failed to precisely reveal the response mechanism of vegetation to such events. Firstly, the impact of extreme climate on vegetation has both advantages and disadvantages. Heavy and prolonged rainfall restricts vegetation growth in humid regions but increases vegetation vitality in arid regions [23]. Secondly, vegetation exhibits different temporal scale responses to extreme climatic conditions. Due to the uneven characteristics of vegetation in each growth phase, its response to extreme climatic conditions varies seasonally [24]. In addition, memories of previous climatic conditions can drive changes in vegetation dynamics [25]. Therefore, the effect of time lags should not be ignored when investigating climate–vegetation interactions. Thirdly, the degree of vegetation response to extreme climate shows considerable spatial heterogeneity, particularly among the different vegetation types [26]. However, qualitative analyses alone cannot explicitly reveal these climate–vegetation interaction characteristics. Thus, improved statistical modeling for spatial analysis is needed [27,28]. Geographical detectors are the new statistical method that detects spatial stratified heterogeneity and uncovers the underlying factors [29]. In contrast to the traditional linear method, it is more robust in operation and facilitates quantitative measurement of the influence of extreme climate indices on vegetation NDVI changes. In general, this study aimed to quantitatively investigate the impact of extreme climate on vegetation on multiple scales through various methods.
The Inner Mongolian Plateau (IMP), China, located in Eastern Asia, is an important part of the Mongolian Plateau. Due to its unique geographical location, the IMP has emerged as a crucial ecological barrier in northern China [30]. Moreover, the region is endowed with abundant vegetation resources, making it a vital livestock production hub in China. However, the IMP comprises arid and semi-arid inland zones, which makes it one of the most vulnerable areas to climate change. Extreme climatic events have directly affected husbandry and agricultural productivity, which have seriously threatened the economy and ecology of the IMP [31]. The IMP covers a large longitudinal range, characterized by different water and heat conditions and substratum factors, and hosts a wide variety of vegetation types that are distributed from east to west, including broadleaf forest, coniferous forest, forest steppe, typical steppe, desert steppe, and sand vegetation (Figure 1b). Thus, the IMP comprises spatially heterogeneous vegetation. Interactions between the extreme climate and vegetation of the IMP have previously been studied [32]. However, concerning global warming, existing data and research need to be updated; this could be achieved by monitoring responses of vegetation dynamics to extreme climatic events at multiple scales and perspectives via various methods. This will facilitate robust identification and characterization of the effect of climate change on vegetation growth in the IMP.
In this study, different climatic conditions and vegetation types of the IMP were evaluated to improve the current understanding of the above-mentioned factors by dividing the region into three ecological zones. Vegetation dynamics were assumed to be strongly influenced by extreme climate. The study focused on the following: (1) examining the vegetation dynamics of the IMP that occurred over the past 39 years based on the NDVI; (2) investigating the variation characteristics of extreme climate on the IMP; (3) determining the impact of extreme climatic events on vegetation in different ecological zones of the IMP; and (4) exploring whether a time lag effect exists between the vegetation response and events. The results of the study can elucidate the interactions between extreme climate events and vegetation, provide theoretical support for disaster mitigation, and document the effects of extreme climate events on the ecological zones of the IMP.

2. Materials and Methods
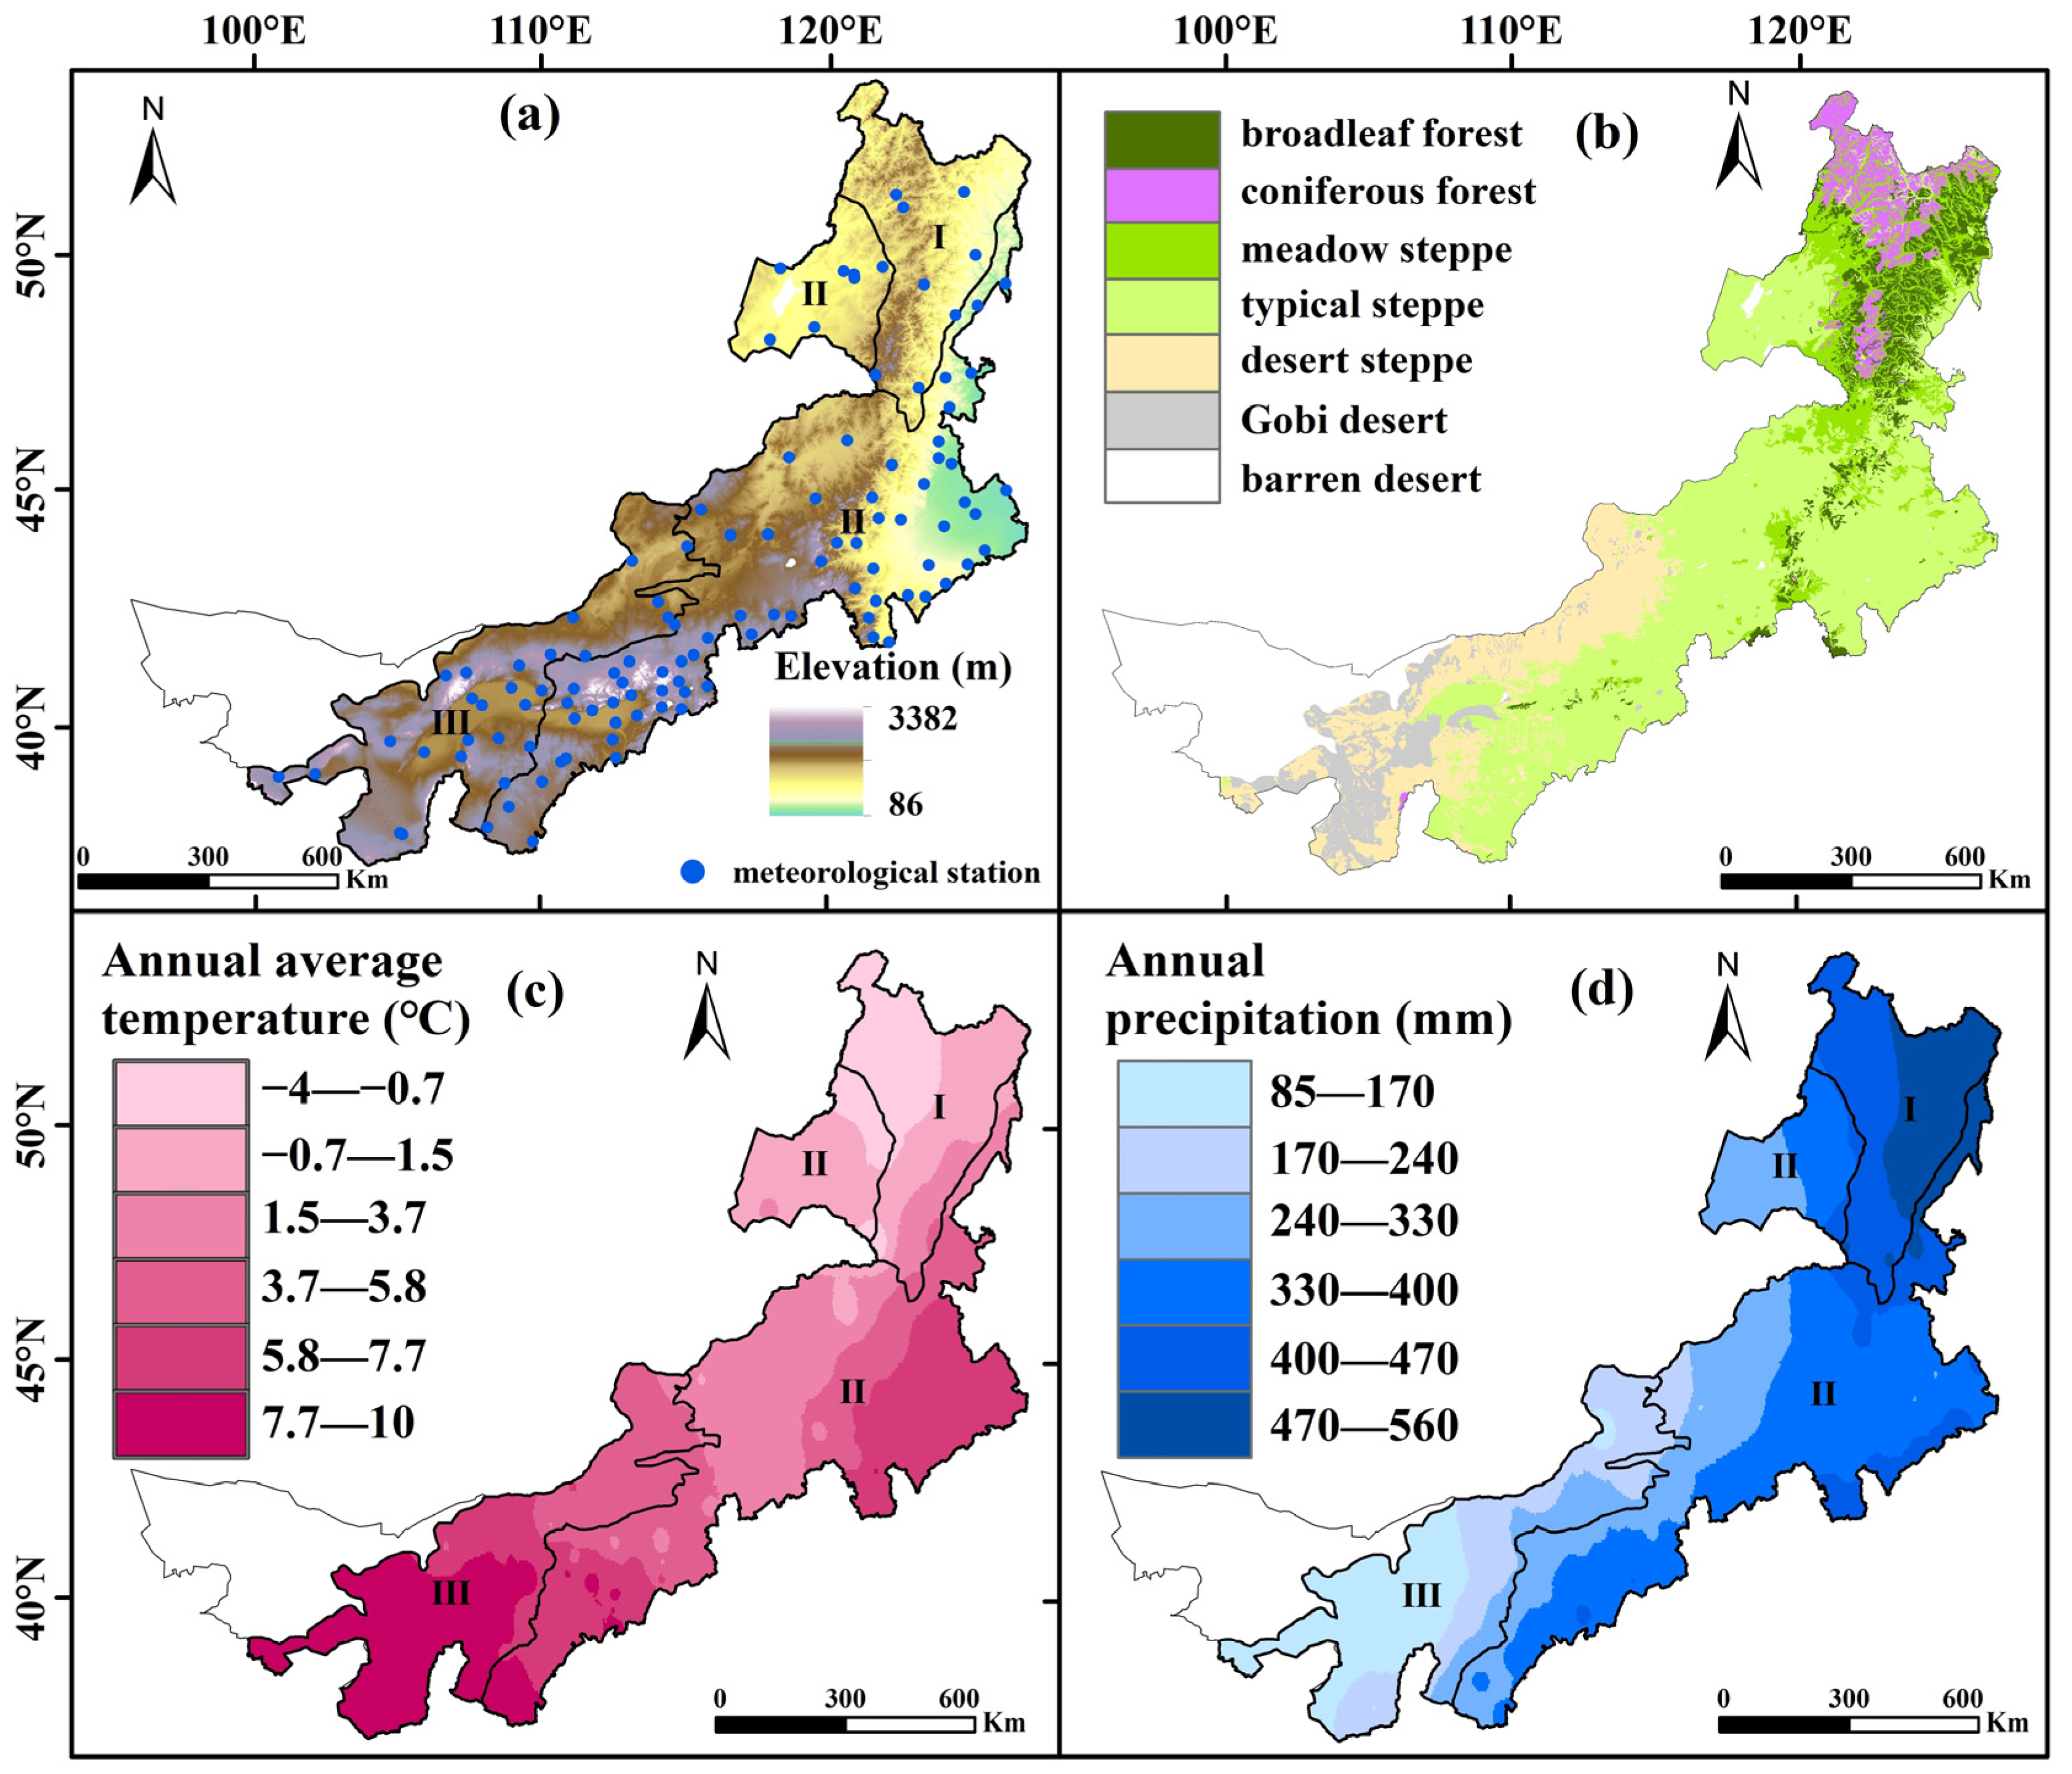
2.1. Study Area

The IMP is located in northern China between 97°12′–126°04′E and 37°24′–53°23′N; it comprises arid to semi-arid regions covering an area of approximately 1,183,000 km2. The area has a complex topography, with a variety of landforms; the terrain gradually slopes from west to east, at an altitude of approximately 86–3382 m. The IMP is located in a delicate natural setting in the middle- and high-latitude inland regions of the Northern Hemisphere, which is particularly vulnerable to climate change. The average annual temperature ranges from −4 to 10 °C (Figure 1c), and the amount of precipitation continually decreases from the northeast to southwest region (Figure 1d). Summers are hot and transient, whereas winters are cold and lengthy, with frequent sandstorms occurring in spring and large differences in diurnal temperatures in autumn [32]. The IMP was divided into three ecological zones (Figure 1a) from east to west based on climatic conditions and vegetation types: forest (I), steppe (II), and desert steppe (III).

2.2. Data Sources

2.2.1. Meteorological Data

Extreme climate indices were analyzed using daily maximum and minimum temperature, and precipitation data from 113 meteorological stations across the IMP (Figure 1) obtained from the Inner Mongolia Meteorological Bureau for 1982–2020. The locations of the meteorological stations are shown in Figure 1.

2.2.2. NDVI Data

Vegetation data based on the Climate Data Record NDVI dataset of the National Oceanic and Atmospheric Administration from 1982 to 2020 were obtained from the National Earth System Science Data Center (http://www.geodata.cn, accessed on 22 September 2021). The dataset had a temporal resolution of 1 day and a spatial resolution of 5 km. A maximum-value composite (MVC) method recalculates each NDVI value to obtain the highest value from a pixel scale, which minimizes the influence of clouds and the atmosphere [33]. Therefore, the annual and seasonal NDVI dataset from 1982 to 2020 was synthesized using MVC to monitor vegetation dynamics. Desert regions are barren, with a constant vegetation index of zero, suggesting limited variation; therefore, the desert regions of the western IMP were eliminated to better constrain vegetation dynamics.

2.3. Methods

2.3.1. Extreme Climate Indices

The EICCDI identified and evaluated 27 extreme climate indices (http://etccdi.pacificclimate.org/, accessed on 10 September 2021). Nine extreme temperature indices and six extreme precipitation indices (Table S1) were calculated for 1982–2020 using RclimDex Software Version 1.0. The selected indices described climate for different dimensions, such as duration, intensity, and frequency. Indices such as TNn, TXn, TNx, TXx, Tx90p, Tn90p, Tx10p, Tn10p, Rx1day, and Rx5day were described on an annual scale, as well as on a seasonal and monthly scale. Indices such as the GSL, R10, R20, CDD, and CWD were defined on an annual scale. Thus, the selected indices could bolster research on multiple timescales and perspectives. For mapping and analysis, the inverse distance weighting method was used for interpolation to obtain the spatial patterns of extreme climate indices.

2.3.2. Sen’s Slope and Mann–Kendall Test

The Theil–Sen slope calculation is a reliable method that is insensitive to errors and outliers and commonly used to analyze the trend of a factor over a long period [34]. Sen’s slope was calculated using the following formula:
β = m e d i a n C n C m t n t m , 1982 m < n 2020
where β indicates the trend of an extreme climate index or NDVI, Cm and Cn represent the dataset in years of m and n, and tm and tn are the time series. When β > 0, there is an increasing trend in the extreme climate index or NDVI, and vice versa.
The Mann–Kendall method is a non-parametric statistical test that determines the significance of the sequence trend; it does not require sequence distribution and is unaffected by outliers. When the standardized test statistic was |Z| > 1.96, the trend passed the 95% confidence level.

2.3.3. Correlation Analysis

Pearson correlation analysis was used to evaluate the connection between NDVI values and extreme climate indices.
Cross-correlation analysis was selected to evaluate the time lag effect of extreme climate on the NDVI, as it could identify the lead/lags between the time series of the two variables.

2.3.4. Geographical Detectors

Geographical detectors are a new statistical method proposed by Wang et al. [29] that can detect spatial stratified heterogeneity and uncover the underlying factors responsible for it. This method has a distinct advantage over other approaches as it does not rely on linear hypotheses, and instead offers a definite physical meaning. Geographical detectors include factor, risk, ecological, and interaction detectors, which have already been applied in many fields of natural and social sciences [35,36,37,38]. In this study, the factor detector and interaction detector were used to measure the influence of an individual and the interaction of two extreme climate indices on vegetation NDVI changes using the explanatory power (Q value). The Q value ranges from 0 to 1, and a higher Q value indicates greater explanatory power. Factor detectors can detect the explanation for a dependent extreme climate index on NDVI changes. Interaction detectors can examine whether the impact of interactive indices on NDVI changes is enhanced, weakened, or mutually independent of each other. First, the Q values of the two indices for the NDVI were calculated (Q(X1) and Q(X2)). Then, the Q value of the interaction was calculated (Q(X1 ∩ X2)) and compared with Q(X1) and Q(X2). If the Q(X1 ∩ X2) is greater than Max Q(X1), Q(X2) or Q(X1) + Q(X2) means that their impact is enhanced (double factor enhancement: Q(X1 ∩ X2) > Max Q(X1), Q(X2); Nonlinear enhancement: Q(X1 ∩ X2) > Q(X1) + Q(X2)).The calculation was based on the “GD” package.

3. Results

3.1. Spatiotemporal Variability of Vegetation Dynamics

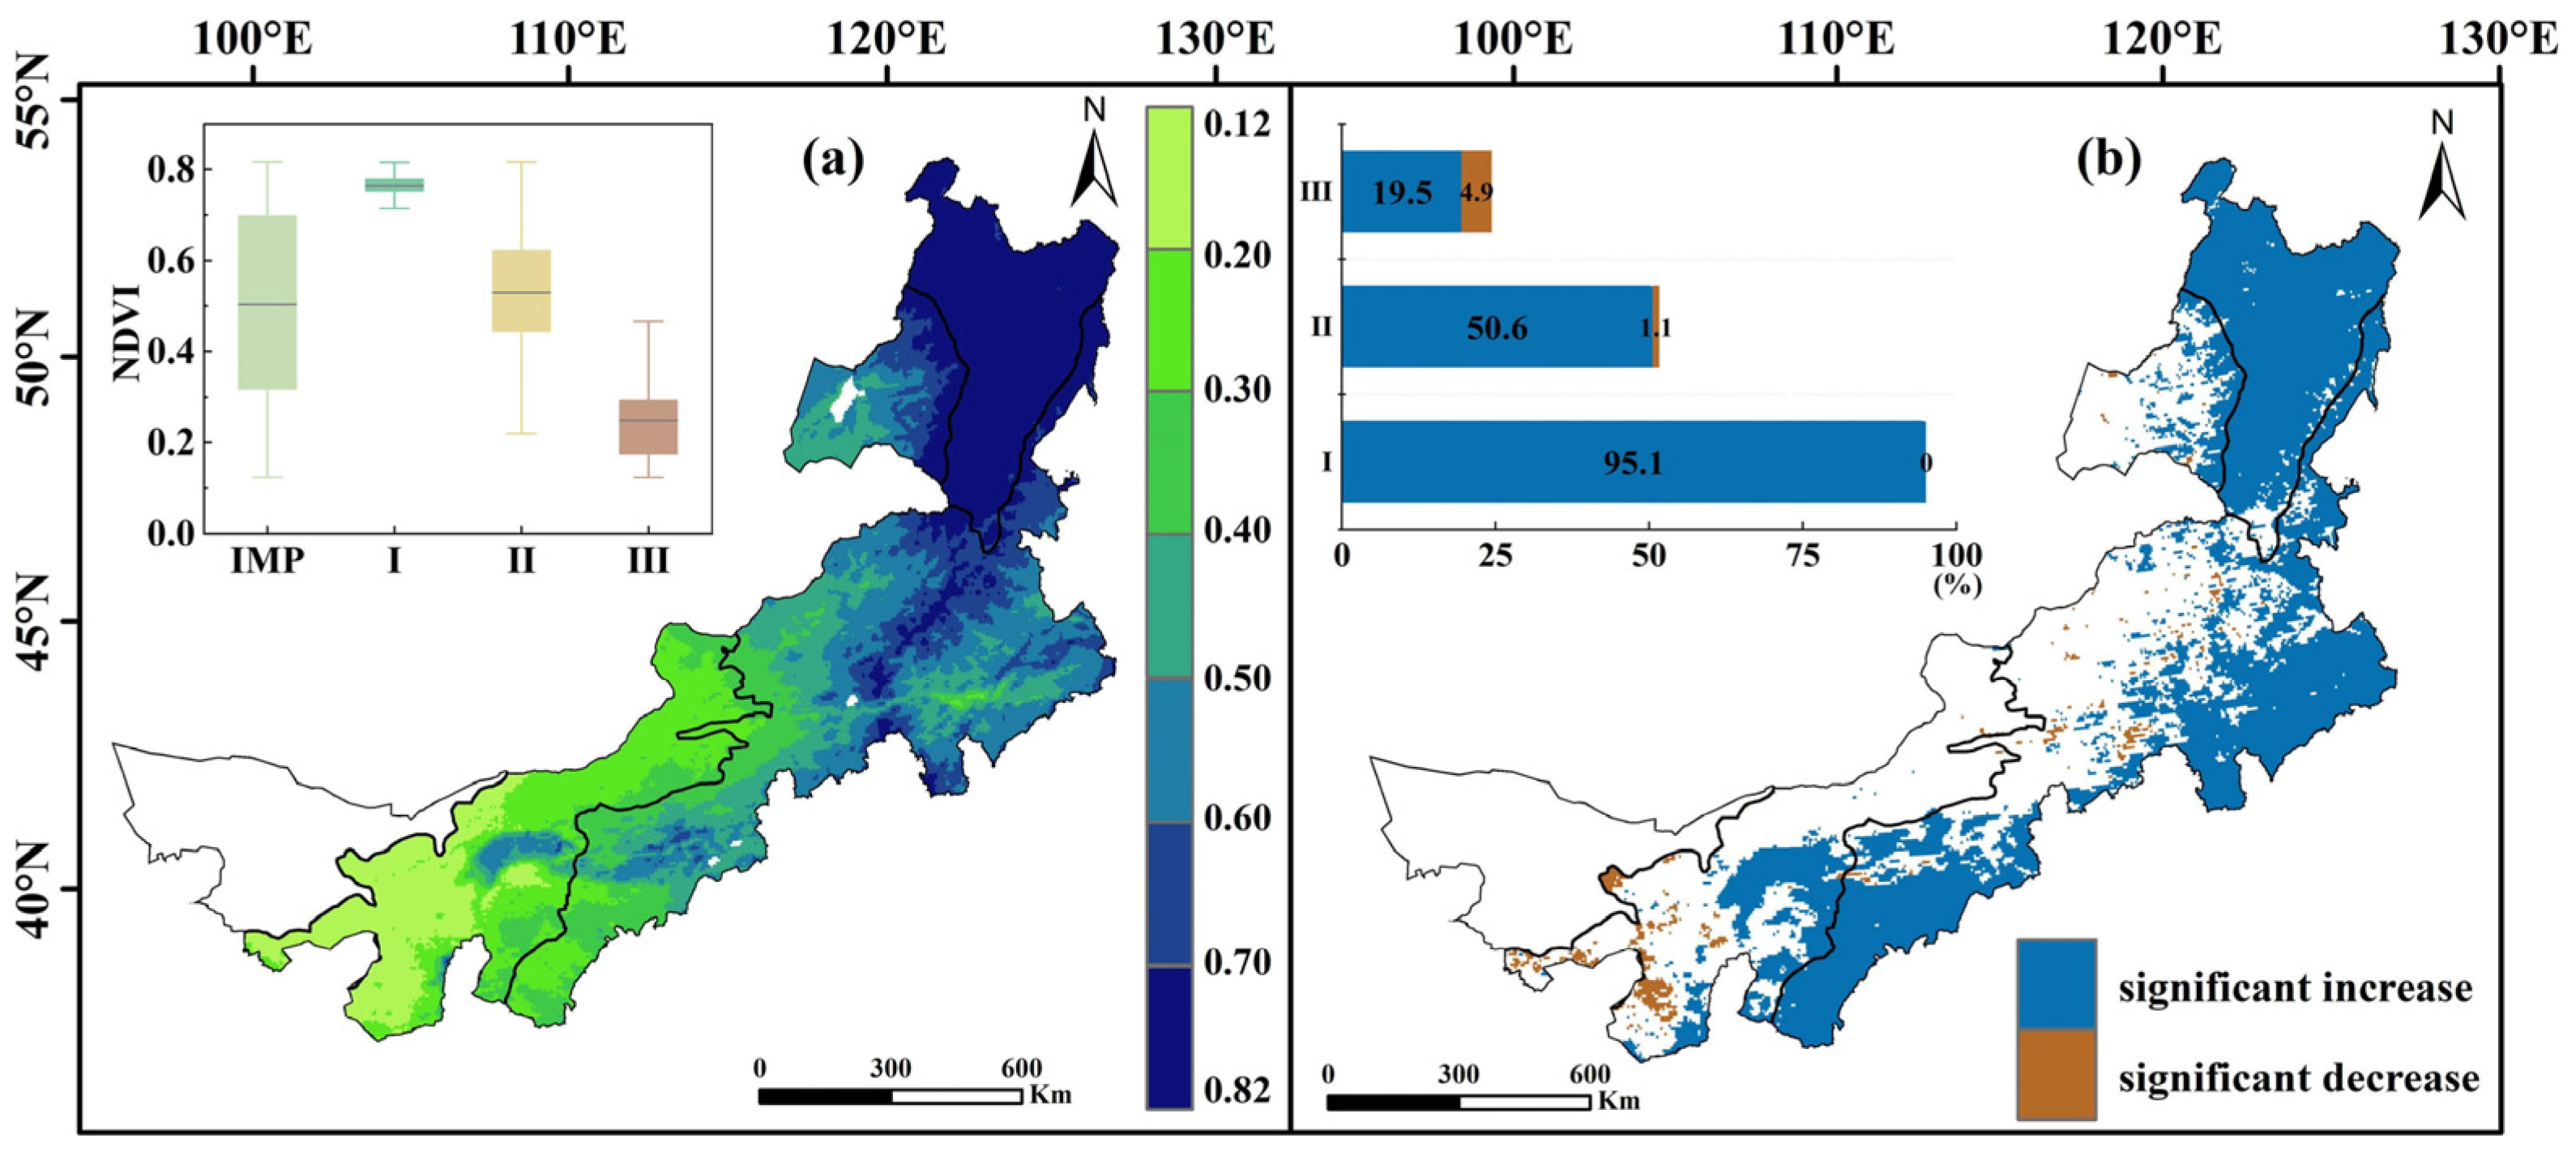
3.1.1. Annual Trends of NDVI

The average NDVI was 0.506 from 1982 to 2020, showing an increasing trend at a rate of 4 × 10⁻⁴ yr−1. Among the different ecological zones, the annual mean NDVI values for forest, steppe, and desert steppe were 0.745, 0.523, and 0.454, respectively. The annual NDVI for forests increased significantly (α = 0.05) at a rate of 15 × 10−4 yr−1, and that for steppe and desert steppe increased at the rate of 8 × 10⁻⁴ yr−1 and 5 × 10⁻⁴ yr−1, respectively (Figure S1).
The annual NDVI was spatially heterogeneous and gradually decreased from the northeast to southwest from 1982 to 2020 (Figure 2a). Based on the zonal differentiation patterns, spatial differences were caused by different climatic, humidity, and temperature conditions. In terms of spatial variation trends (Figure 2b), the results showed that the annual NDVI of 44.7% of the total area of the IMP increased significantly(α = 0.05). However, only 1.9% of the area decreased significantly (α = 0.05). In the forest, 95.1% of the area showed a significantly increasing trend (α = 0.05). For the steppe, the annual NDVI of 50.6% of the area increased significantly (α = 0.05) and was mainly distributed in the north, whereas it decreased significantly (α = 0.05) for only 1.1% of the area. In the desert steppe, 4.9% of the area showed a significant decreasing trend of annual NDVI (α = 0.05) and was mainly distributed in the west.

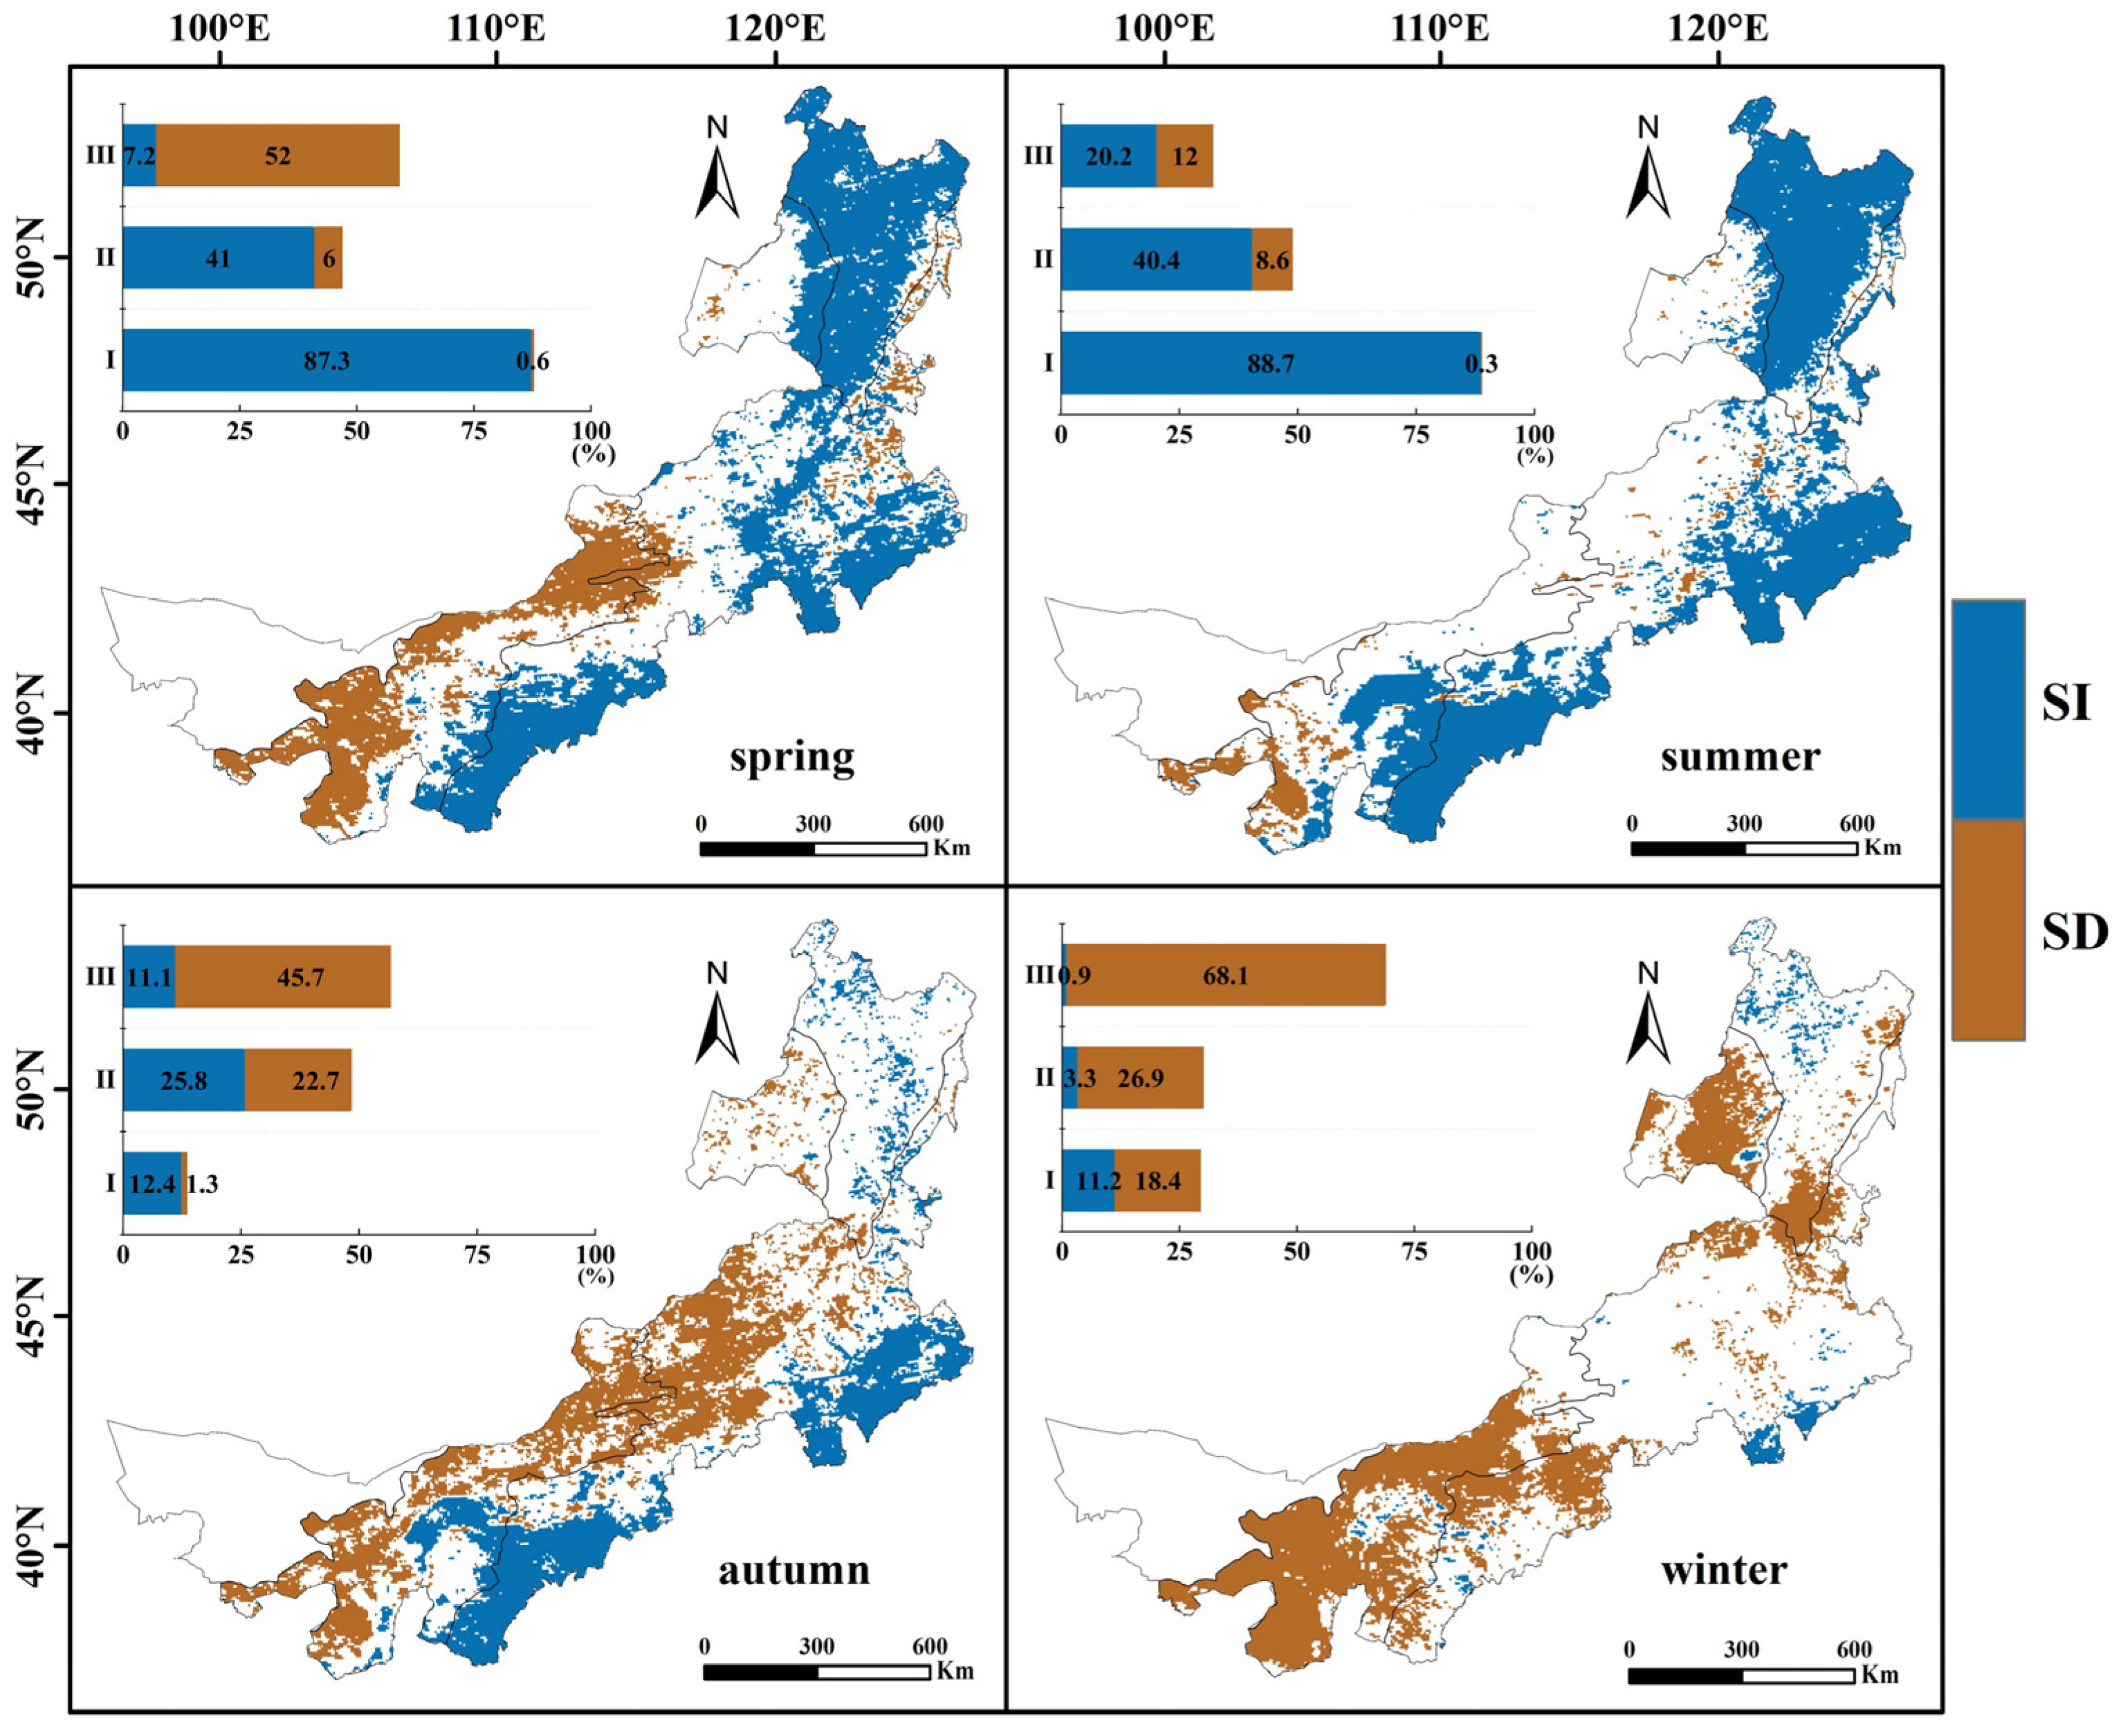
3.1.2. Seasonal Trends of NDVI

Table 1 lists the rates of the temporal variation trend of the seasonal NDVI in the different ecological zones. Throughout the IMP, the NDVI increased significantly (α = 0.05) in spring, summer, and autumn at the rate of 17 × 10−4 yr−1, 9 × 10⁻⁴ yr−1, and 8 × 10⁻⁴ yr−1, respectively. The forest generally showed the same trends as the entire IMP. The NDVI of the steppe increased significantly (α = 0.05) in spring, summer, autumn, and winter at the rate of 16 × 10−4 yr−1, 11 × 10−4 yr−1, 11 × 10−4 yr−1, and 15 × 10−4 yr−1, respectively. The NDVI of the desert steppe increased significantly (α = 0.05) in summer and decreased in autumn and winter, with no significance. Overall, the NDVI in spring, summer, and autumn showed an increasing trend in forest and steppe during 1982–2020, while the NDVI of the desert steppe increased only in summer.
The variation characteristics of seasonal NDVI during the past four decades were determined by analyzing the spatial variation trends (Figure 3). In spring, 87.3%, 41%, and 7.2% of the areas in the forest, steppe, and desert steppe exhibited significant (α = 0.05) increasing trends, respectively, while 0.6%, 6%, and 52% of the areas showed significant (α = 0.05) decreases in the NDVI, respectively. In summer, the mean NDVI values of the entire IMP, forest, steppe, and desert steppe were 0.44, 0.73, 0.46, and 0.2, respectively (Figure S2). The summer NDVI in the forest, steppe, and desert steppe showed significant (α = 0.05) increasing trends, accounting for 88.7%, 40.4%, and 20.2%, respectively, but significant (α = 0.05) decreasing trends, accounting for 0.3%, 8.6%, and 12%, respectively. Both the distribution characteristics and variation trends of the summer NDVI were similar to those of the annual NDVI because summer was the main growth season for vegetation, thus determining the variation in the IMP throughout the year. In autumn, the NDVI of 12.4%, 25.8%, and 11.1% of the area increased significantly (α = 0.05) in the forest, steppe, and desert steppe, respectively, while that of 1.3%, 22.7%, and 45.7% of the area decreased significantly (α = 0.05), respectively. The NDVI was lowest in winter because the temperate continental climate resulted in sparse vegetation cover.

3.2. Variation Characteristics of Extreme Temperature

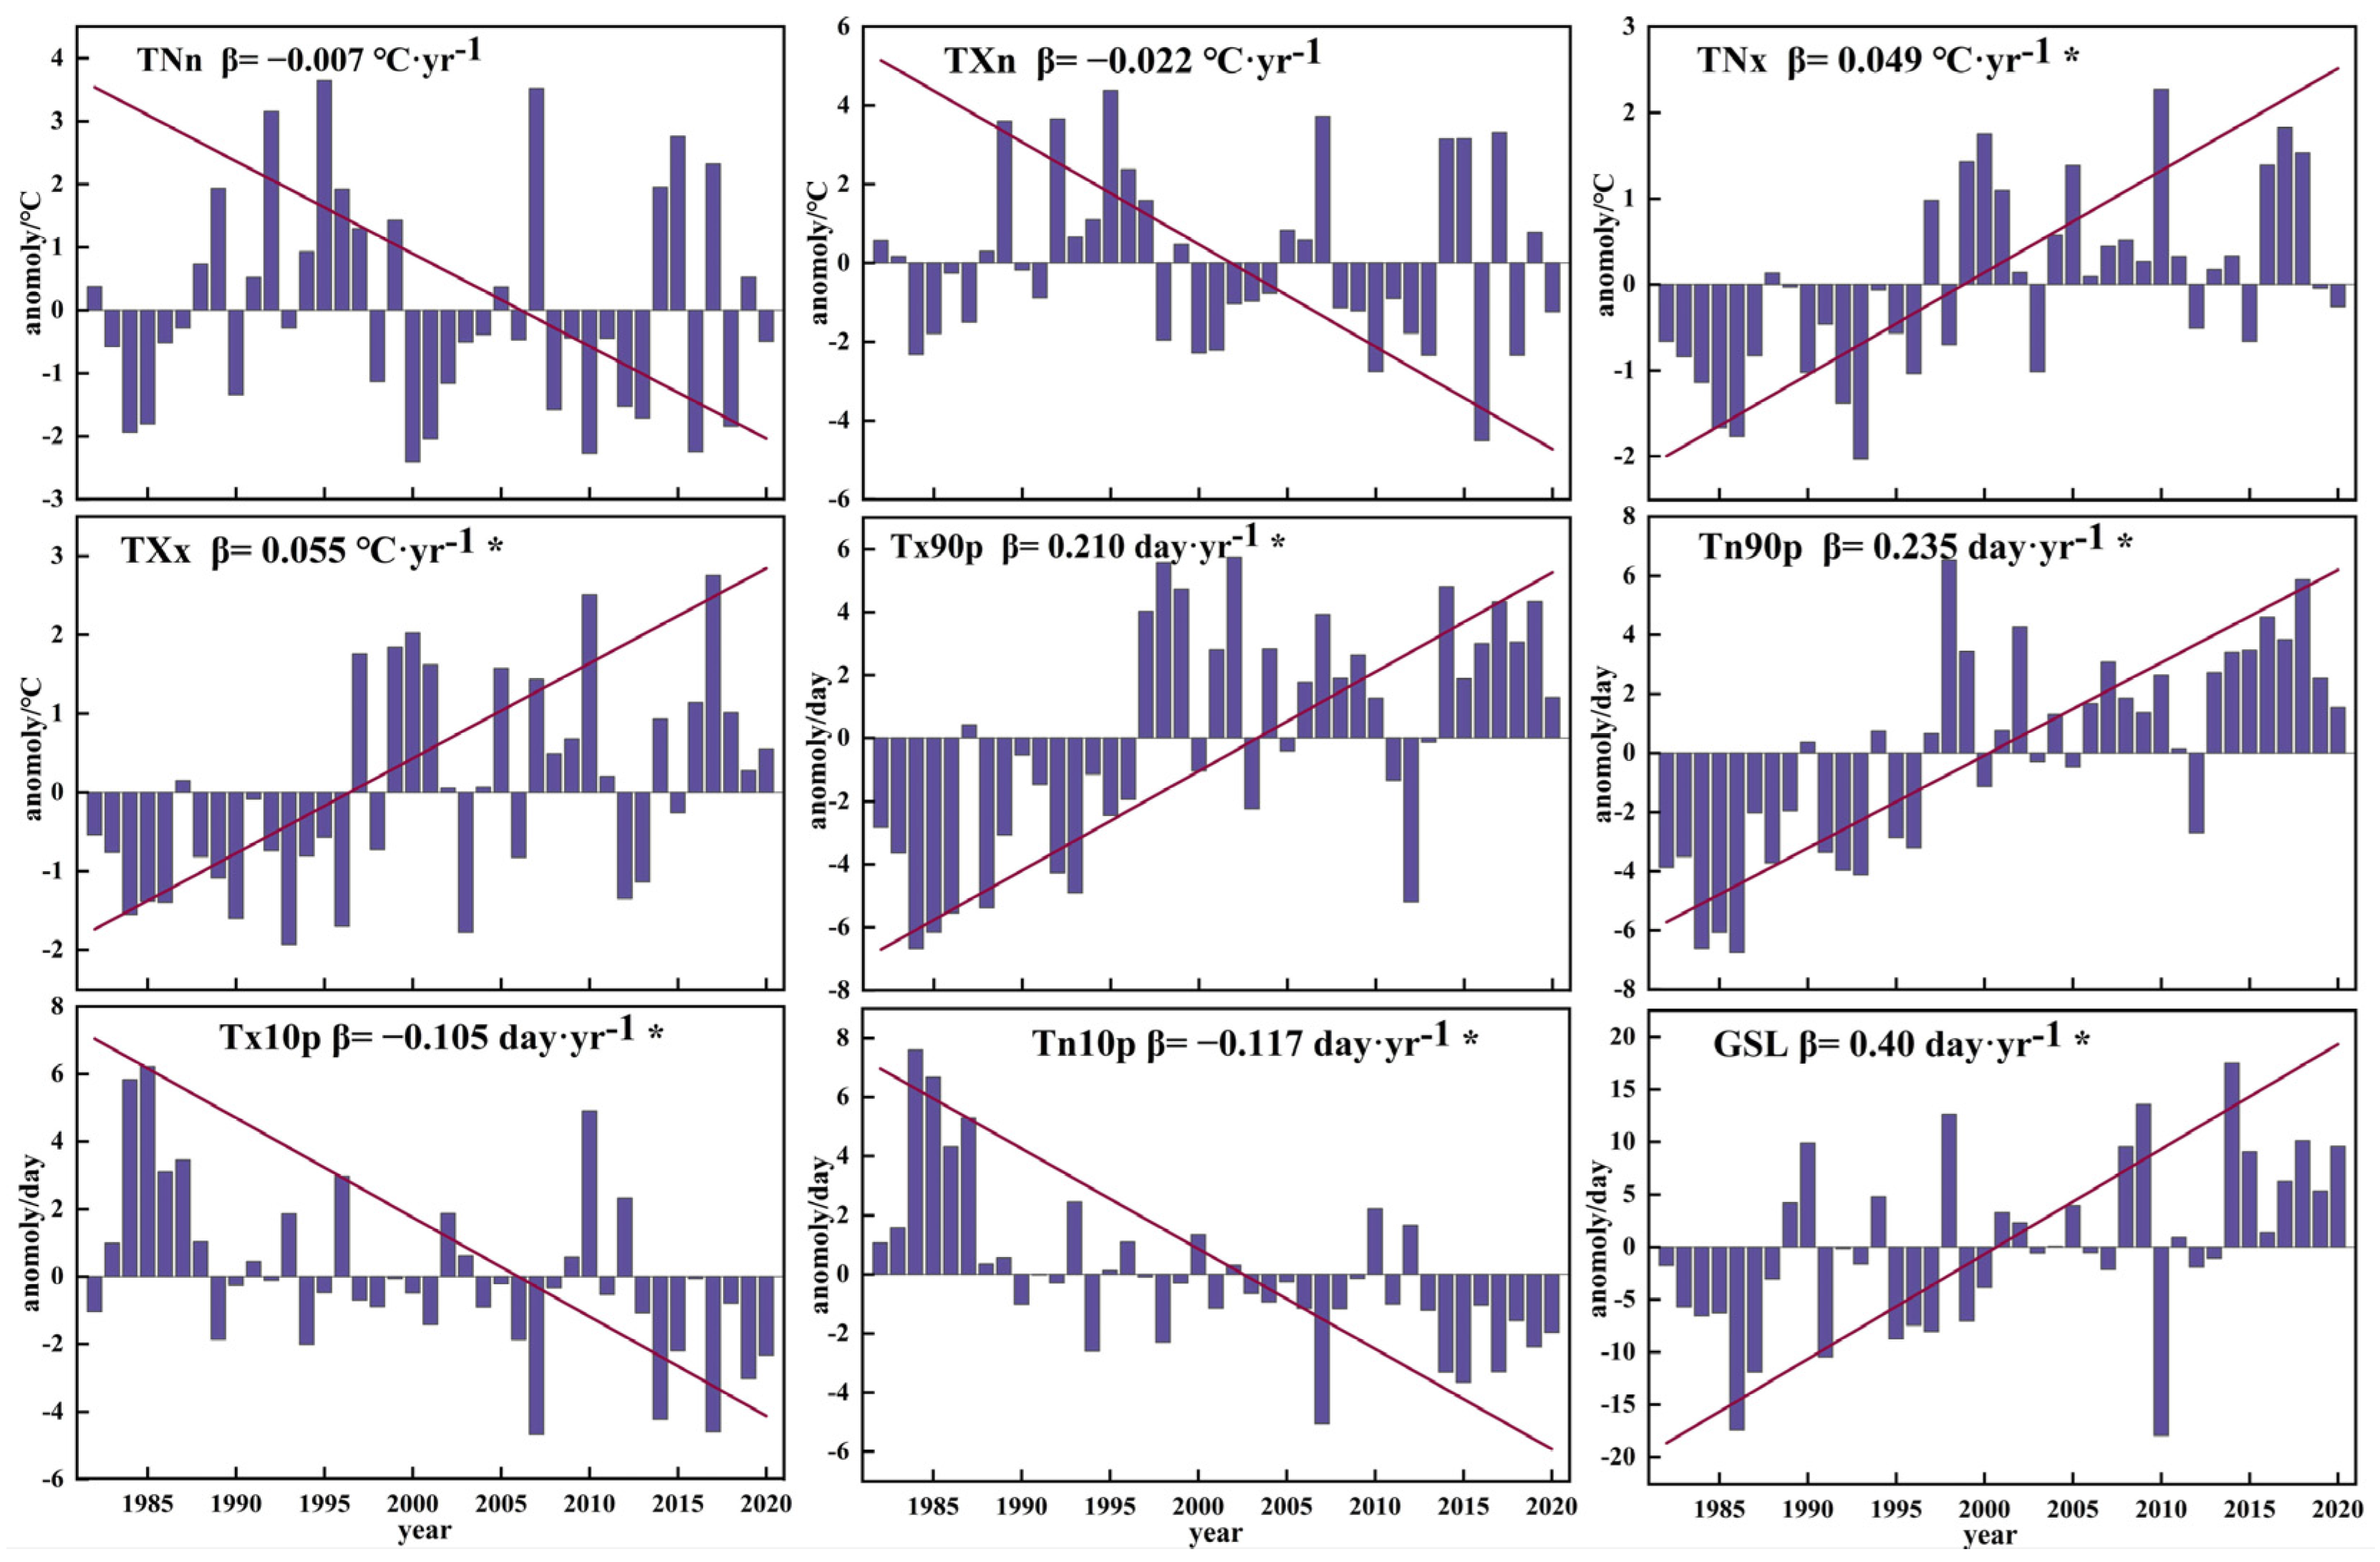
3.2.1. Temporal Variation of Extreme Temperature

The anomalies and time-varying extreme temperature indices of the IMP are shown in Figure 4. In the extreme temperature intensity indices, the low temperature, TNn, and TXn decreased at the rate of −0.007 and −0.022 °C·yr−1, while the high temperature TNx and TXx increased significantly (α = 0.05) at the rate of 0.049 and 0.055 °C·yr−1. However, the increasing rate of the latter (high temperature) was faster than the decreasing rate of the former. The extreme temperature frequency indices Tx90p and Tn90p increased significantly (α = 0.05) at the rate of 0.21 and 0.235 day·yr−1, respectively, while the Tx10p and Tn10p showed a significantly (α = 0.05) decreasing trend at the rate of −0.105 and −0.117 day·yr−1. The duration index, GSL, increased significantly (α = 0.05) at a rate of 0.4 day·yr−1.
The rate of variations in the extreme temperature index of each ecological zone was further analyzed (Table S2). The results showed that both TNn and TXn increased in the forest but decreased in the steppe and desert steppe (without significance). The TNx of forest, steppe, and desert steppe increased significantly (α = 0.05) at the rate of 0.051, 0.048, and 0.054 °C·yr−1, respectively. The variation characteristics of TXx were the same as those of TNx, at the rate of 0.083, 0.058, and 0.04 °C·yr−1, in the respective zones. Both Tx90p and Tn90p increased significantly (α = 0.05) in the three ecological zones. The increasing rate in the desert steppe was faster than in the other zones (0.27 and 0.302 day·yr−1), while the Tx10p and Tn10p decreased in the three ecological zones. GSL increased significantly (α = 0.05) at the rate of 0.41, 0.34, and 0.53 day·yr−1 in the forest, steppe, and desert steppe, respectively. The increasing rate of the GSL in the desert steppe was much faster than that in the other zones. The overall results indicated that extremely high temperatures showed an increasing trend in terms of intensity, frequency, and duration in the IMP during 1982–2020.

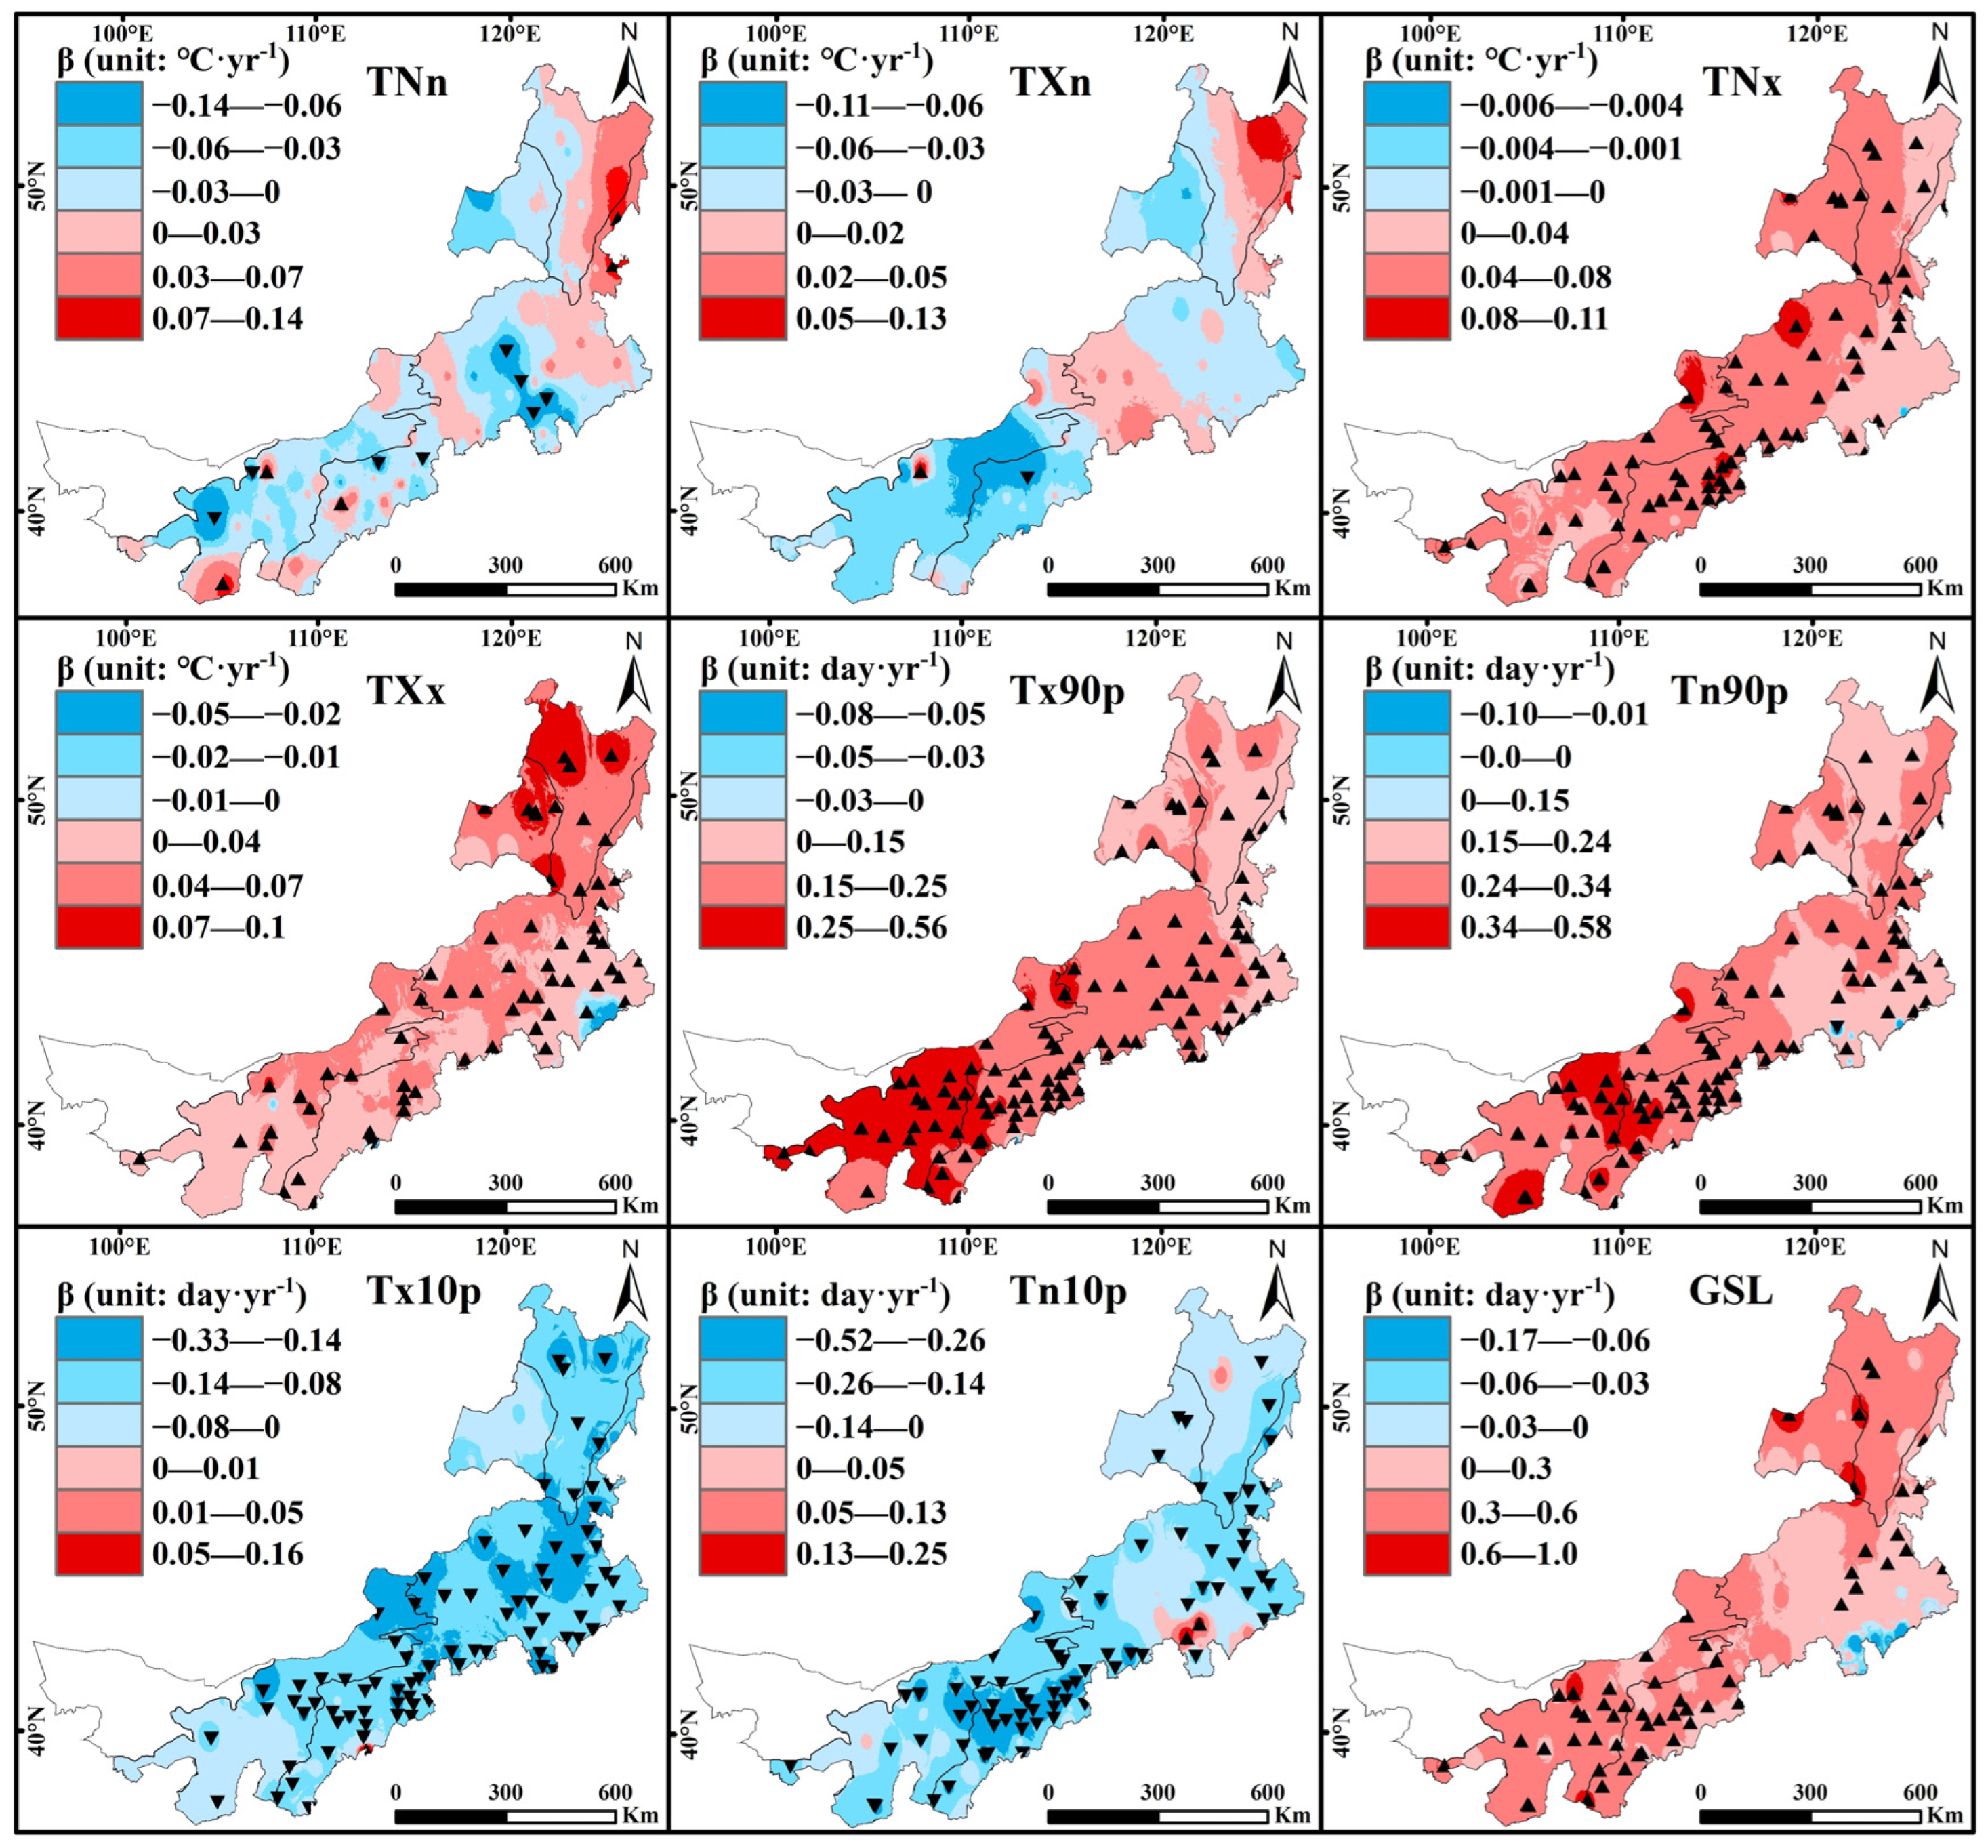
3.2.2. Spatial Variations of Extreme Temperature

Figure 5 shows the spatial variation patterns and station-wise trends of the extreme temperature indices. The significance tests of the station trends were all at a 95% confidence level (α = 0.05). TNn showed a decreasing trend at 62.4% of the total area, and eight stations, mainly in the steppe and desert steppe zones, exceeded the significance level. An increasing trend of TNn was detected in 37.6% of the area, and five stations showed a significantly increasing trend. The trend of TXn was not obvious because only two stations passed the significance test. TNx showed an increasing trend at all stations, with 66.4% passing the significance test. TXx increased by 98%, with 63 stations passing the significance level. This indicated that the intensity of the high temperature increasing trend was more evident than that of the low temperature decreasing trend during 1982–2020 in the IMP. Tx90p and Tn90p showed an increasing trend in 99% of the area, with 107 and 97 stations passing the significance test, respectively. In contrast, Tx10p and Tn10p showed decreasing trends in 99% and 96% of the areas, with 79 and 74 stations, respectively, passing the significance test. Overall, an increasing trend was observed in the extreme temperature frequency in the IMP over the past 39 years. GSL showed an increase in 97.5% of the area, with 55 stations having a significant increase; the stations were distributed throughout the IMP, except for the central steppe.

3.3. Variation Characteristics of Extreme Precipitation

3.3.1. Temporal Variation of Extreme Precipitation

Figure 6 depicts the anomalies and time-varying characteristics of the extreme precipitation indices. The intensity index Rx1day increased at a rate of 0.028 mm·yr−1, whereas Rx5day decreased at a rate of −0.039 mm·yr−1. Increasing intensity of daily precipitation and decreasing intensity of continuous precipitation were observed in the IMP. The highest values of Rx1day and Rx5day occurred in 1998 at 55.73 mm and 82.24 mm, respectively. The frequency indices R10 decreased (−0.002 d·yr−1), while R20 increased (0.003 d·yr−1). The highest values of R10 and R20 were recorded in 1998. This could be due to the heavy rainfall in most parts of China caused by climatic anomalies experienced in that year [39,40]. The extreme precipitation duration indices CDD and CWD showed a significant (α = 0.05) decreasing trend at the rates of −0.243 and −0.008 d·yr−1, respectively, indicating that the continuous duration of dryness or wetness decreased in the IMP during 1982–2020.
In different ecological zones (Table S2), Rx1day increased in the forest and desert steppe zones at the rate of 0.046 and 0.07 mm·yr−1, while it decreased in the steppe zone at the rate of −0.005 mm·yr−1. The variation traits of Rx5day were the same as those of Rx1day in each ecological zone. R10 and R20 both increased slowly in the desert steppe zone and decreased in the steppe zone, thus indicating a decrease in the intensity and frequency of extreme precipitation in the steppe, and their increase in the desert steppe over the past 39 years. CDD decreased in the forest, steppe, and desert steppe zones at the rate of −0.023, −0.321, and −0.177 d·yr−1, respectively. CWD decreased in the forest and desert steppe zones at the rate of −0.014 and −0.002 d·yr−1, respectively, while it decreased significantly (α = 0.05) in the steppe zone at a rate of −0.011 d·yr−1.

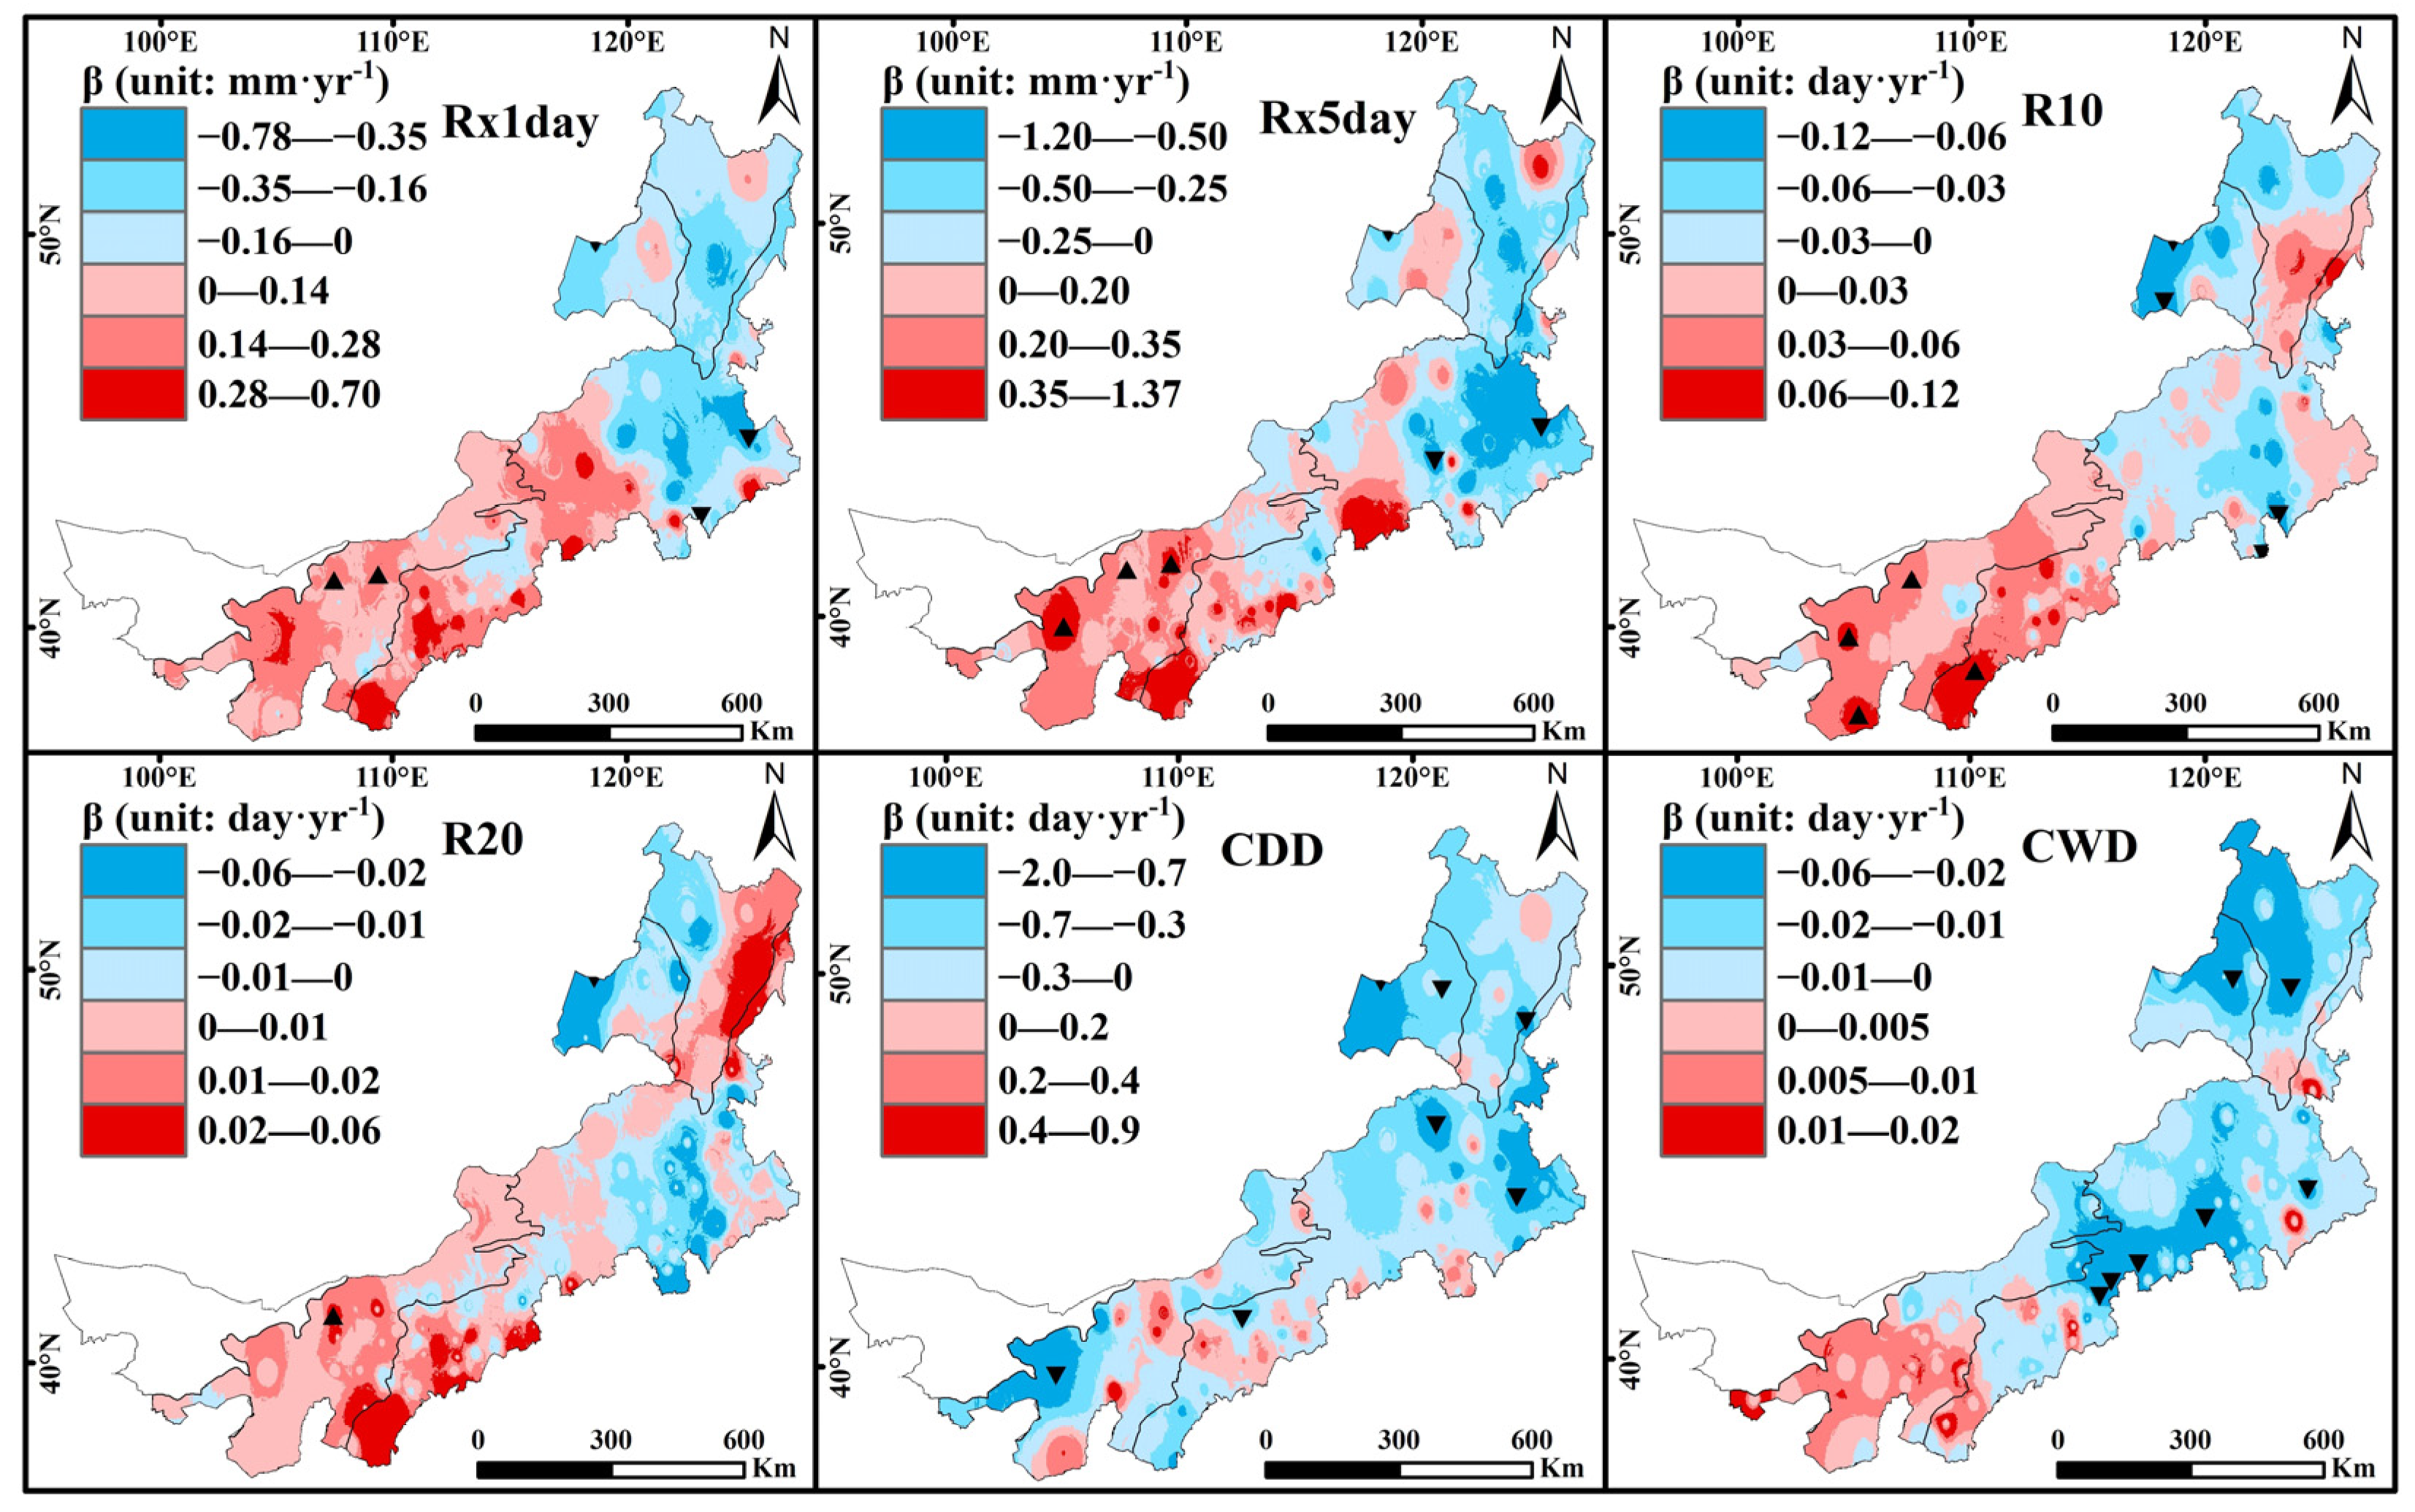
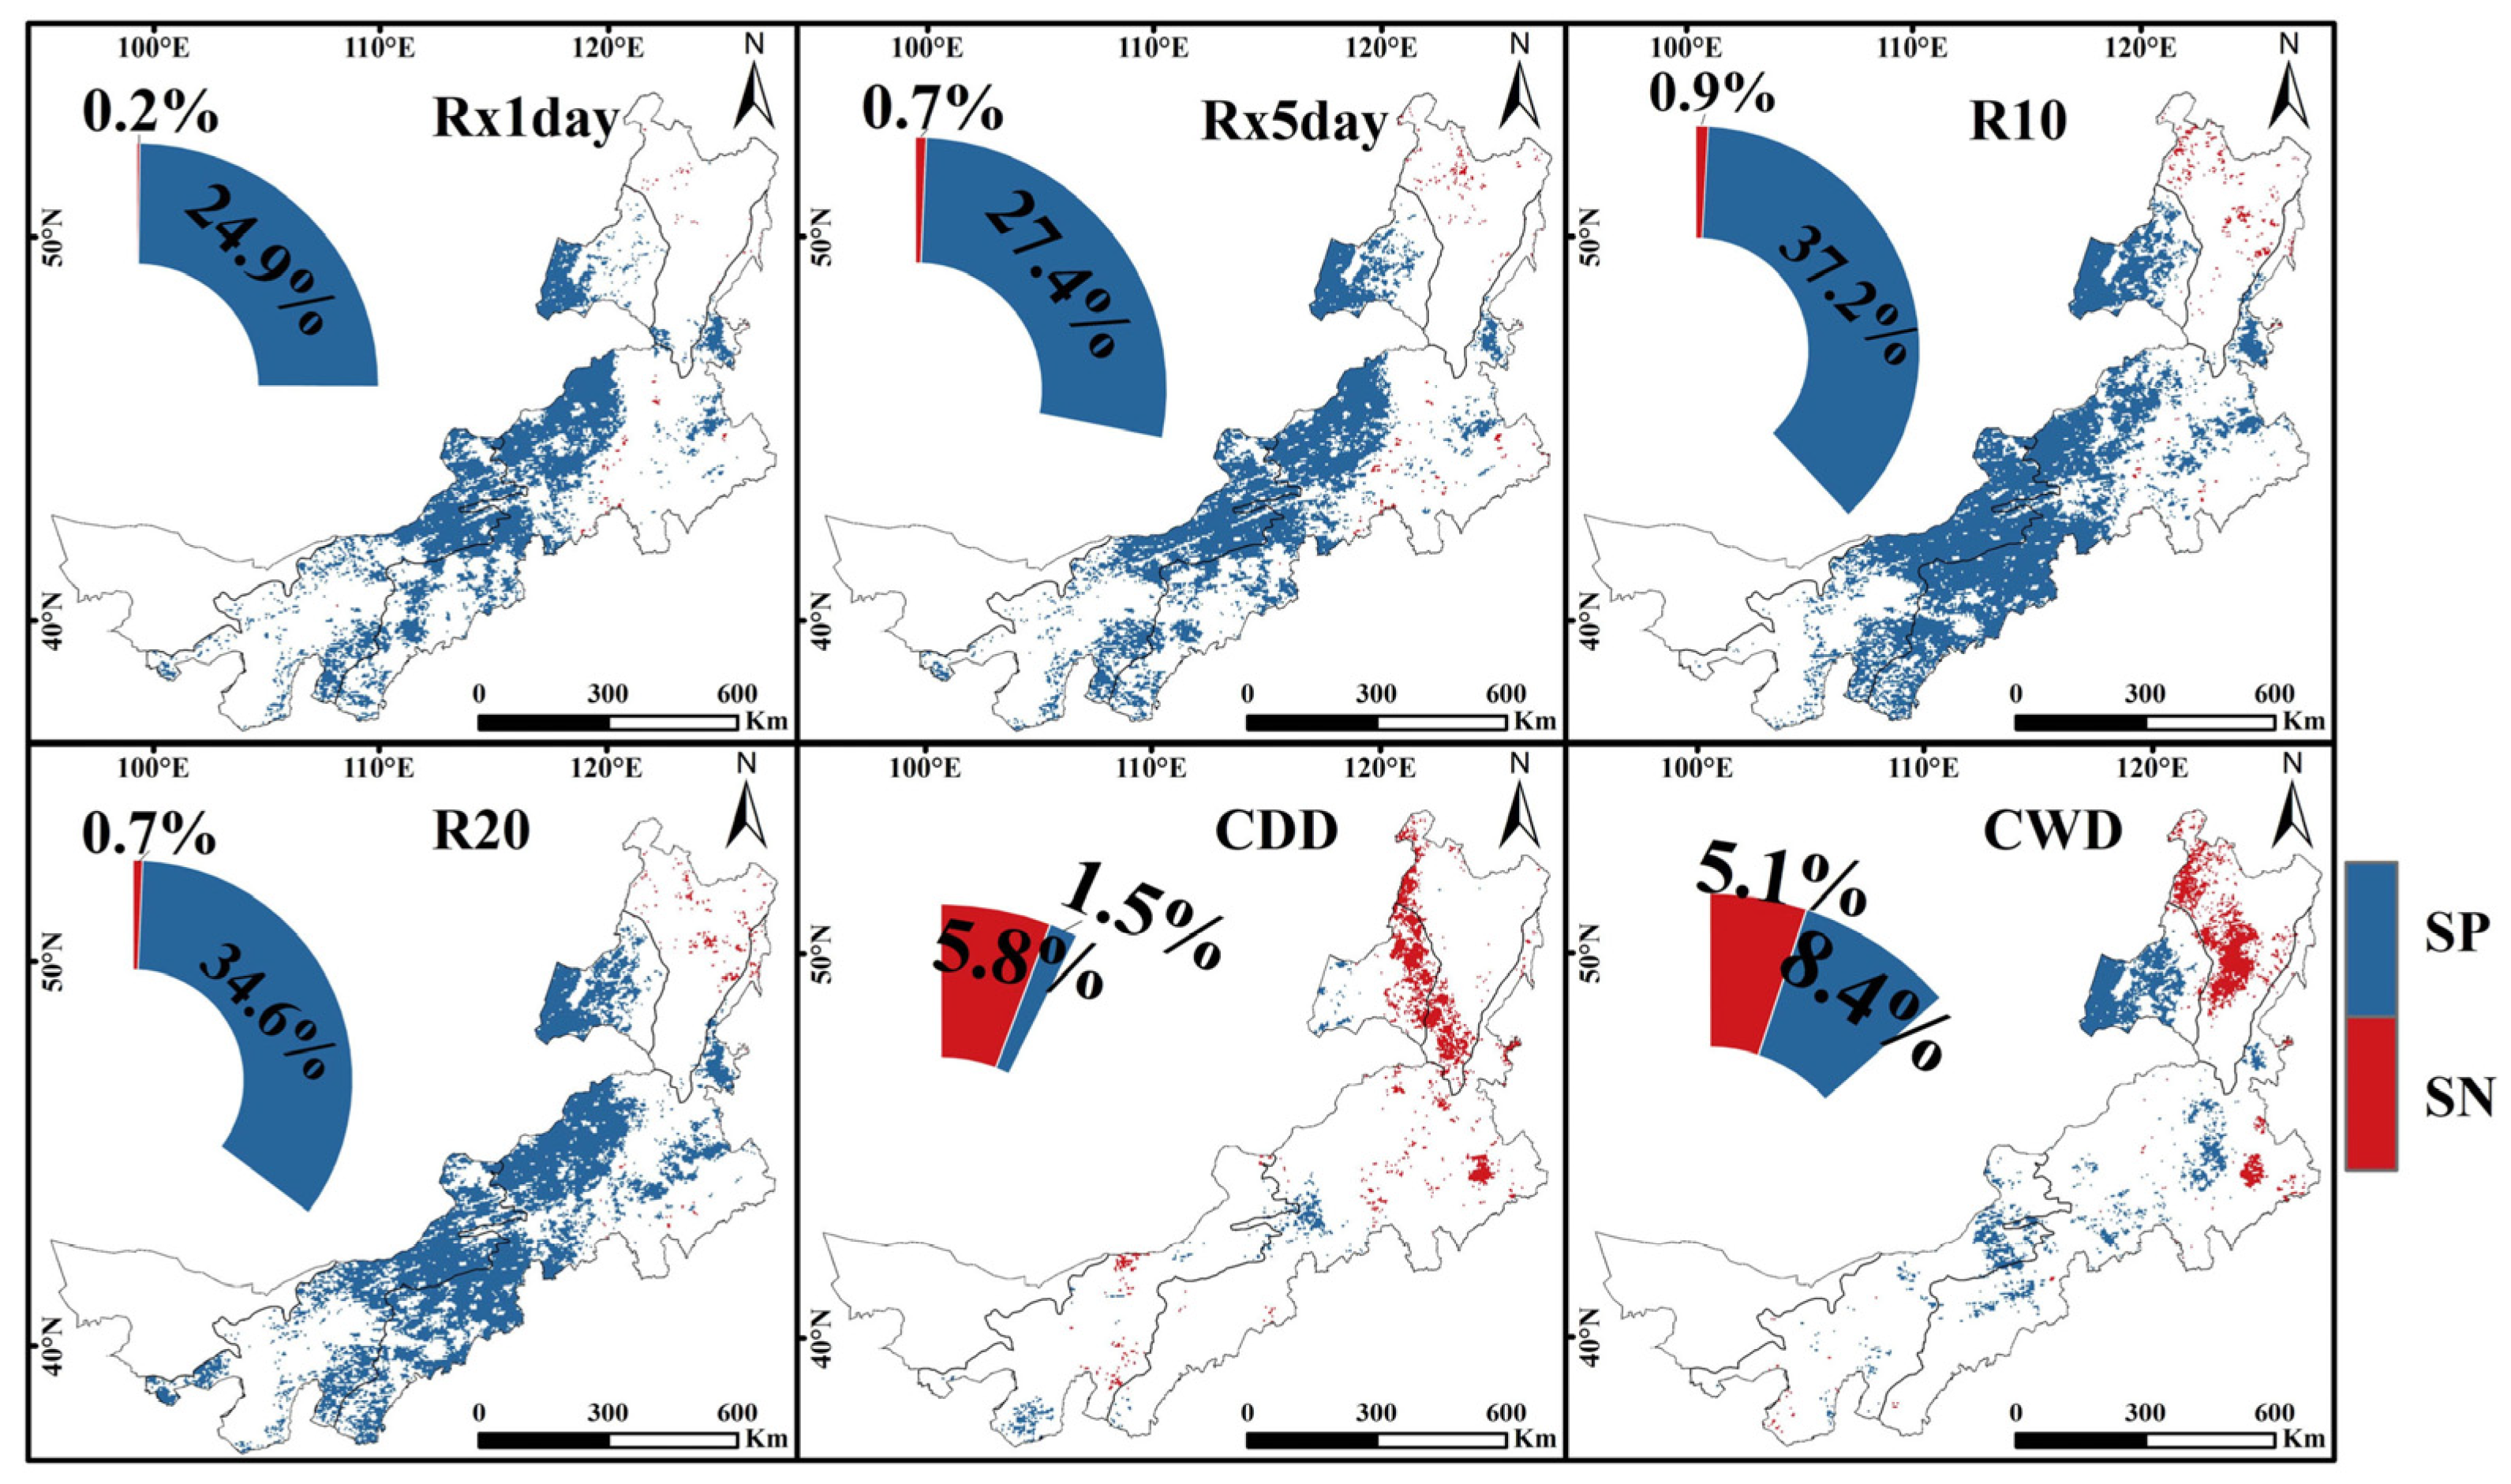
3.3.2. Spatial Variations of Extreme Precipitation

Figure 7 shows the spatial variation patterns and station-wise trends of the extreme precipitation indices. The significance tests of the station trends were all at a 95% confidence level (α = 0.05). Rx1day showed an increasing trend in 50.3% of the total area, whereas decreasing trends were observed in 49.7% of the area. Rx5day showed an increase in 44.6% of the area, whereas a decrease was observed in 55.4% of the area. Both Rx1day and Rx5day increased mainly in the western steppe and desert steppe zones and decreased in the forest and eastern steppe zones. R10 showed an increasing (decreasing) trend in 55.6% (44.4%) of the area, with four stations passing the significance test. R20 exhibited an increasing (decreasing) trend, accounting for 60.3% (39.7%) of the total area, with only one station exceeding the significance level. The increase in R10 and R20 mainly occurred in the desert steppe, western steppe, and eastern forest, whereas the decrease mainly occurred in the central steppe and northern forest. CDD showed a decreasing trend in 85.9% of the total area, with significant decreases observed in seven stations, and showed an increasing trend in 14.1% of the total area, with no significance. CWD increased in 21.4% of the area, with no significance, while it decreased in 78.6% of the area. Seven stations passed the significance test and were mainly distributed in the steppe. As previously noted, the continuous duration of dryness or wetness decreased in IMP during 1982–2020.

3.4. Correlation between NDVI and Climate Extremes

3.4.1. Correlation between Annual NDVI and Climate Extremes

Figure 8 shows the correlation between the annual NDVI and extreme temperature indices. A significance level of α = 0.05 was used as the threshold to determine significance. NDVI and TNn were generally not highly correlated, with no significant correlation in 90% of the study area. TNx, TXx, Tx90p, Tn90p, and NDVI were positively and significantly correlated in the forest zone. The steppe and desert steppe zones showed a significant negative correlation between NDVI and TXn, TNx, TXx, and Tx90p. The Tx10p, Tn10p, and NDVI showed a significant negative correlation in the eastern region of the IMP. The areas with a significant positive correlation between NDVI and GSL were mainly located in the steppe zone, and those with a negative correlation were statistically insignificant.
The correlation between annual NDVI and extreme precipitation indices (Figure 9) showed that NDVI and Rx1day, Rx5day, R10, and R20 were positively and significantly correlated in the steppe and desert steppe areas. Rx1day, Rx5day, R10, and R20 had no significant negative effect on the NDVI in the forest zone. CDD had a significant negative effect on the NDVI in the eastern part of the steppe. CWD had a positive effect on NDVI in the steppe, but a negative effect in the forest.
To further identify the influences of extreme climate change on the IMP vegetation, the correlation between NDVI and mean-state climate changes was analyzed (Figure S5). For average temperature (Tem), the correlation pattern between NDVI and Tem was similar to its correlation with the extremely high temperature indices (TNx, TXx, Tx90p, and Tn90p). However, the negative effect of extreme temperature was more significant than that of Tem in the steppe. Thus, the sensitivity of the steppe NDVI to extreme temperature was higher than the average temperature. In the forest, the positive effect of extreme temperature was also higher than Tem. This finding indicated that the effect of extreme temperature was higher than the average temperature in both forest and steppe. For average precipitation (Pre), the correlation pattern between NDVI and Pre was similar to its correlation with the extreme precipitation intensity and frequency indices. However, the positive effect of Pre was more significant than extreme precipitation in the steppe and desert steppe, indicating that vegetation grew well when precipitation was normal on an annual scale.

3.4.2. Correlation between Seasonal NDVI and Climate Extremes

The correlation between the seasonal NDVI and extreme climate indices indicated subtle spatiotemporal differences (Figure S6). For the forest zone, in spring and summer, NDVI was positively and significantly (α = 0.05) correlated with TNn, TXn, TNx, TXx, Tx90p, and Tn90p, and negatively and significantly (α = 0.05) correlated with Tx10p and Tn10p. However, the NDVI did not significantly correlate with extreme precipitation indices in forests. This finding further indicated that the forest was more sensitive to extreme temperature intensity and frequency. In the steppe zone, the correlation between NDVI and extreme climate indices was similar to that in the forest zone, but NDVI was prone to rely on Rx1day in summer. In the desert steppe zone, NDVI did not have a significant relationship with extreme temperatures, whereas it was more sensitive to Rx1day and Rx5day in summer, with a correlation of 0.543 and 0.511, respectively. This indicated that the desert steppe was more sensitive to extreme precipitation intensity in summer. Moreover, NDVI did not correlate well with the extreme climate indices in autumn and winter for the entire IMP.
For average climate change (Table S3), NDVI was positively and significantly (α = 0.05) correlated with Tem in spring and summer in both forest and steppe, but did not significantly correlate with Pre. This further suggested that the forest and steppe were more sensitive to temperature. In contrast, in the desert steppe, NDVI was prone to rely on Pre in summer, but this correlation coefficient was smaller than that of the extreme precipitation intensity indices (Rx1day and Rx5day). This indicated that the desert steppe was more sensitive to intensive extreme precipitation in summer.

3.5. Influence of Extreme Climate Indices on NDVI Changes

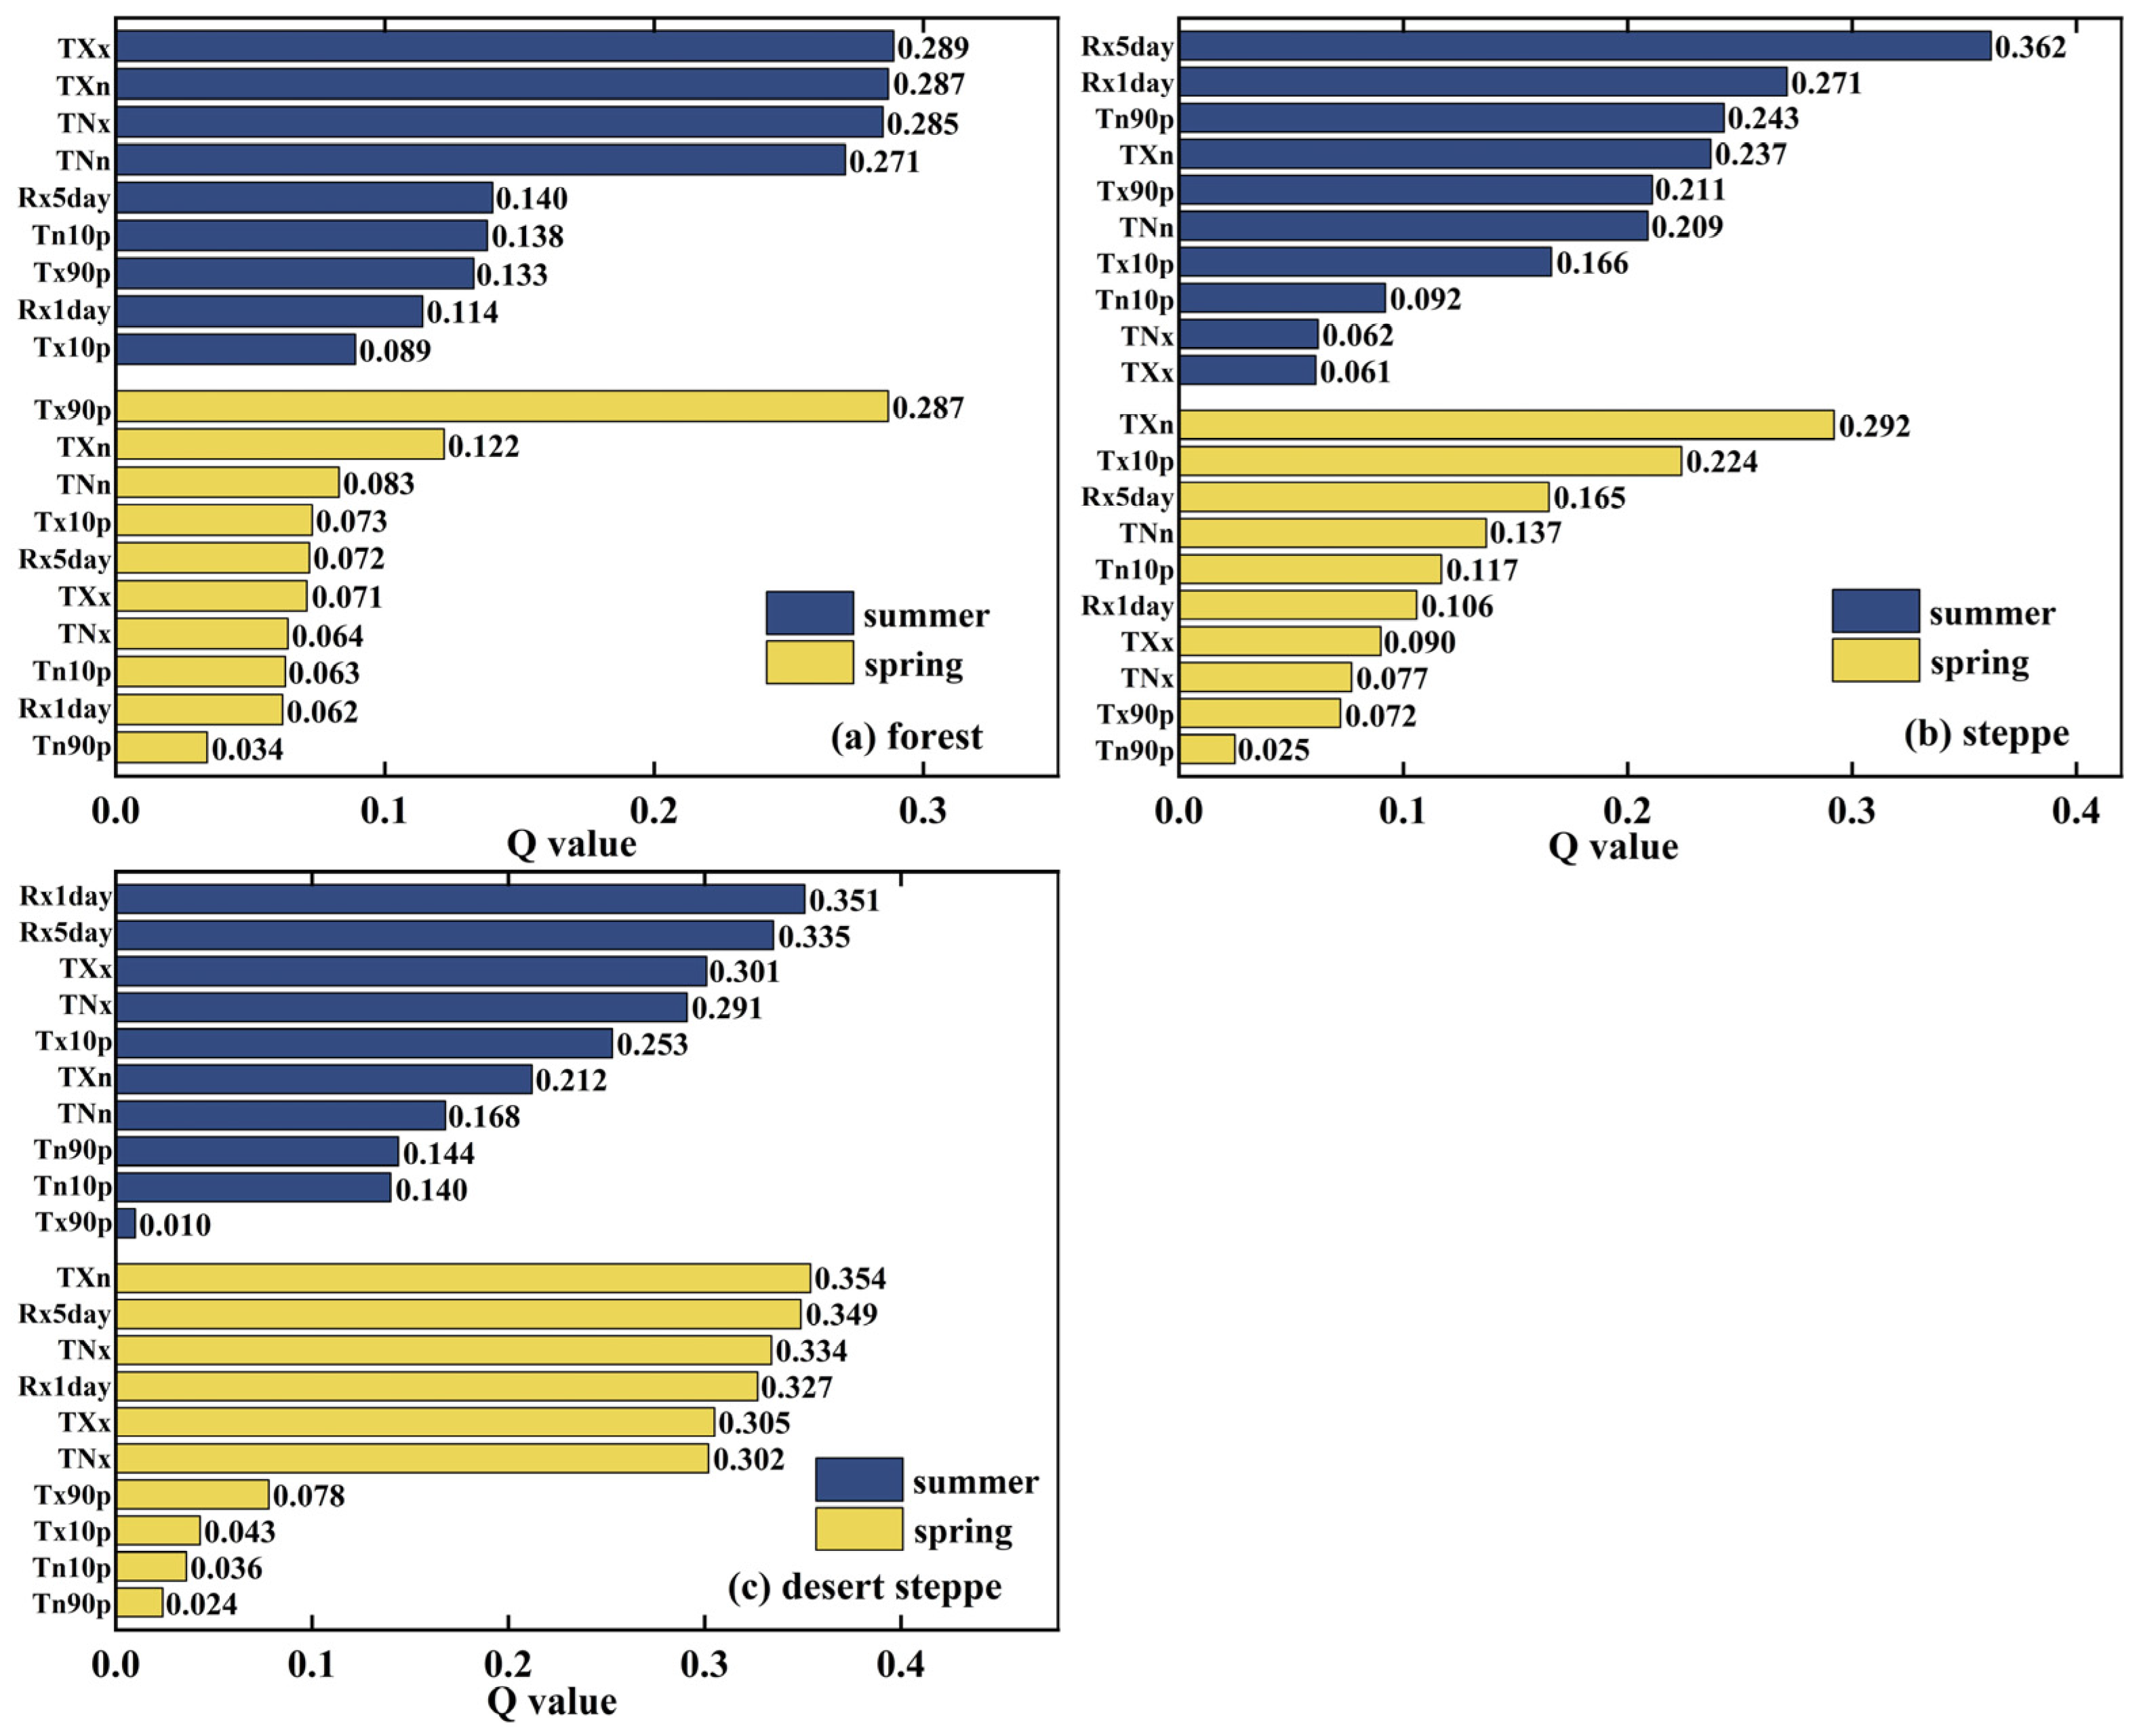
3.5.1. Influence of Individual Extreme Climate Indices

The influence of extreme climate indices on NDVI changes was explored using a factor detector. In the forest zone (Figure 10), GSL, TNn, Tn90p, TXn, TNx, and TXx exhibited the greatest impact on annual NDVI changes, with Q values of 0.313, 0.290, 0.267, 0.259, 0.241, and 0.237, respectively (Figure 10a). This indicated that the intensity, frequency, and duration of extreme temperature were all relatively more important to NDVI changes in the forest. In the steppe areas, the influence of extreme climate indices on NDVI changes in descending order was CWD (0.652), Tx10p (0.405), GSL (0.317), R10 (0.309), R20 (0.302), and Rx5day (0.301) (Figure 10b). Although Tx10p and GSL had a greater Q value, the other indices were all extreme precipitation indices, with a Q value higher than 0.3 for all. Notably, the influence of consecutive wetness, extreme precipitation intensity, and frequency was higher on steppe vegetation growth on an annual scale. For the desert steppe zone, Rx1day, R20, Rx5day, and R10 exhibited the highest effects on NDVI changes, with Q values of 0.395, 0.385, 0.374, and 0.341, respectively (Figure 10c). This finding indicated that desert steppe vegetation was more sensitive to the annual frequency and intensity of extreme precipitation.
The influence of extreme climate indices on NDVI changes was further analyzed on a seasonal scale in each IMP ecological zone (Figure 11). Our aforementioned findings demonstrated that the correlation between NDVI and extreme climate indices was not strong in autumn and winter; therefore, they were not discussed in this section. In the forest, Tn90p had the highest effect on vegetation changes in spring, with a Q value of 0.287. In summer, all extreme temperature intensity indices exhibited the greatest influence on NDVI changes (Figure 11a). In the steppe zone, TXn, and Tx10p had the greatest influence on NDVI changes in spring, where Rx5day and Rx1day affected NDVI more in summer. Other indices affecting this region in summer included some extreme temperature indices, such as Tn90p, Tx90p, TXn, and TNn, with Q values all greater than 0.2 (Figure 11b). This indicates that the forest and steppe vegetation were more sensitive to extreme temperature intensity and frequency in spring and summer. Furthermore, the NDVI of the latter was also prone to be influenced by intensive extreme precipitation in summer. In contrast, vegetation in the desert steppe was more sensitive to extreme precipitation intensity (Rx5day and Rx1day) in summer (Figure 11c). In spring, despite the most important influencing factor being TXn, Rx5day and Rx1day also had a higher impact on NDVI (with a Q value of 0.349 and 0.327, respectively) in the desert steppe. These findings further support the observation that the desert steppe vegetation is more sensitive to extreme rainfall.

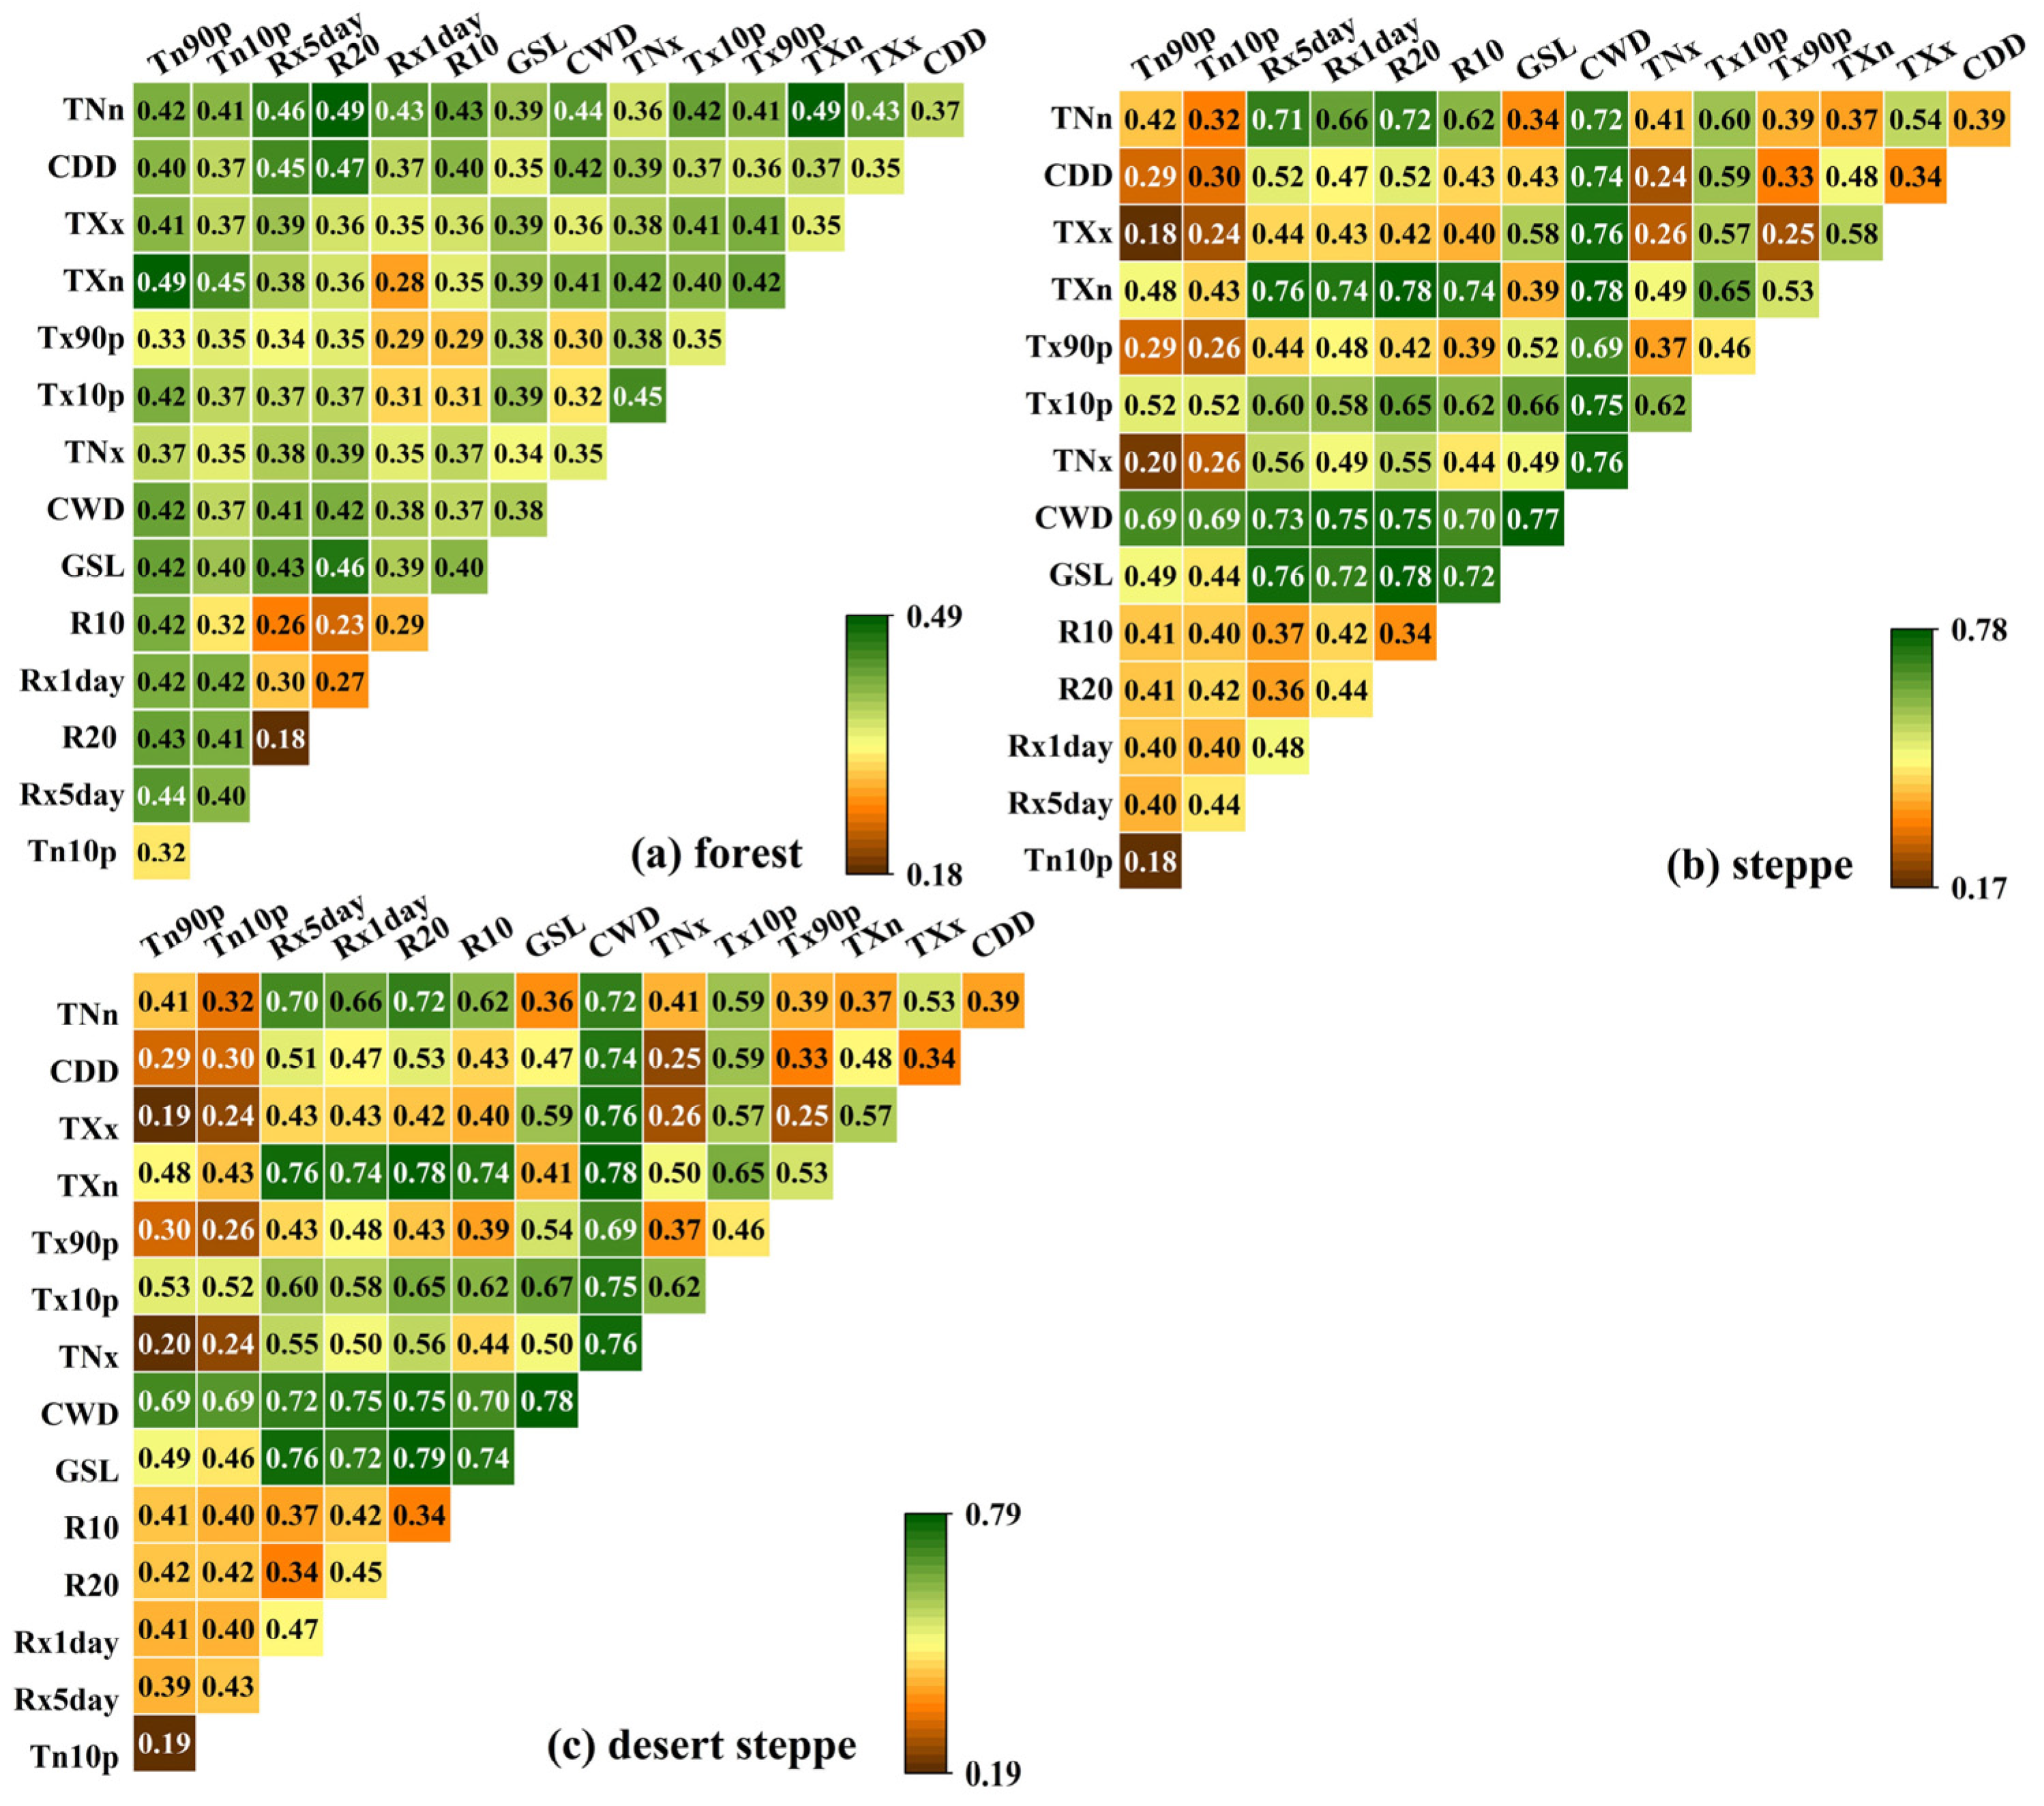
3.5.2. Influence of Interaction between Extreme Climate Indices

The interaction detector shows that all interactive influences of the extreme climate indices on NDVI changes were double factor enhancement and nonlinear enhancement, were greater than any of their individual indices. However, the effect of extreme climates’ interaction on NDVI varied in different ecological zones (Figure 12). In the forest zones, the interaction between extreme climate indices on annual NDVI changes, with Q values ranging from 0.18 to 0.49, and the highest value was between TNn and TXn (Figure 12a). In the steppe areas, the explanatory power of the interactive extreme climate impacts on annual NDVI changes ranged from 0.18 to 0.78 (Figure 12b). Among these interactions, the combination of CWD and other extreme climate indices on annual NDVI had a dominant influence, with all Q values greater than 0.7. In addition, the extreme precipitation indices Rx1day, Rx5day, R10, and R20 interacted greater with some extreme temperature indices, such as TNn, TXn, and GSL. The characteristics of the interactive influences of extreme climate indices on the annual NDVI of the desert steppe areas were similar to those of the steppe areas (Figure 12c). In addition, the explanatory power of the interactive extreme climate impacts on annual NDVI is higher in the steppe and desert steppe than in the forest.
Figure S7 shows that the collaborative influences between any two extreme climate indices varied in different seasons. In the forest, the collaborative contribution of Tx90p and any extreme climate indices on NDVI were the largest in spring, with all Q values greater than 0.4. In summer, TNn, TXn, TNx, and TXx had a greater interaction with any extreme climate indices. This further indicated that vegetation in the forest was dominated mainly by extreme temperature intensity and frequency during spring and summer. In the steppe and desert steppe zones, the combination of Rx1day and Rx5day and other extreme climate indices had a greater influence on NDVI in both spring and summer. At the same time, the interaction of the other indices was slighter.
To sum up, whether on an annual scale or seasonal scale, the vegetation in the forest is more sensitive to the collaborative effects of extreme temperature than other factors. In contrast, the vegetation in the steppe and desert steppe is more sensitive to the interactive influence of extreme precipitation than other factors.

3.6. Time Lags of NDVI Response to Climate Extremes

Vegetation changes could be driven by memories of earlier climate circumstances; thus, a cross-correlation analysis was conducted to evaluate the time lag effect of extreme climate on NDVI. Vegetation responses to climate change often have a shorter than a quarter (of the year) time lag [41]; thus, the time lag effect of extreme climate indices on NDVI in months 0–3 was considered (Figure 13). The results showed that a significant lag effect of extreme climate indices on the NDVI was observed in the IMP. The lag effect of the NDVI response to extreme temperature intensity (TNn, TXn, TNx, and TXx) was at least three months for the entire IMP and its ecological zones. The NDVI did not correlate well with Tx90p, Tn90p, Tx10p, and Tn10p in the current month, and no significant lag effect of these extreme temperature frequency indices was observed. The responses of NDVI to extreme precipitation intensity (Rx1day and Rx5day) exhibited a two-month time lag for the entire IMP and its ecological zones. Generally, the time lag effects in the IMP were longer for extreme temperatures than for extreme precipitation.

4. Discussion

4.1. Vegetation Dynamics

During 1982–2020, an annual and seasonal increasing trend was observed in the NDVI of the IMP. Even though the trends in the variation of different ecological zones were spatially heterogeneous, all vegetation zones in the IMP showed a greening trend. Concerning the variation in annual vegetation, the NDVI of the entire IMP increased slowly between 1982 and 2020, and the greening rate was lower than that in all of China (6 × 10⁻⁴ yr−1) [10]. However, the greening rates of the forest (15 × 10−4 yr−1) and steppe (8 × 10⁻⁴ yr−1) zones were higher than those in China. Among the different seasons, the regional mean NDVI in spring, summer, and autumn showed an increasing trend in the IMP, forest, and steppe, with faster greening rates in spring during 1982–2020. Snow and ice cover, or the death of vegetation, led to the smallest NDVI in winter. Such uneven vegetation variations during different growing periods in different regions may lead to an insignificant annual trend.

4.2. Extreme Climate Changes

The Earth is undergoing drastic environmental changes due to a warming climate. This study showed a warming trend in which the intensity, frequency, and duration of extremely high temperatures increased in the IMP during 1982–2020. Reports have suggested that 70% of the global landmass show a significant trend of decreasing cold nights and increasing warm nights [42]. This current study observed a similar result, in that the number of warm days (Tx90p) and warm nights (Tn90p) both increased by higher rates of 0.21 and 0.235 day·yr−1, respectively, while the number of cold days (Tx10p) and cold nights (Tn10p) both decreased by −0.105 and −0.117 day·yr−1, respectively. In terms of diurnal variation, the rates were greater at night than during the day; therefore, the increase in nighttime temperatures could have further accelerated the warming. In recent decades, global warming has lengthened the growing seasons in the Northern Hemisphere [43], which supports the results of this study, in which the GSL of the IMP increased at a relatively high rate (0.4 day·yr−1).
Spatial distribution of the intensity, frequency indices, and CWD for extreme precipitation generally had northeast to southwest gradients in the IMP (Figure S3). CWD has been reportedly increasing in northwest China and decreasing in northeast China [44,45]. A similar trend was discovered, in which the intensity and frequency of extreme precipitation increased in the desert steppe zone. Notably, extreme precipitation in the steppe area decreased, likely because of its relatively poor moisture conditions.

4.3. Vegetation Response to Extreme Climate

The results of both the correlation analysis and geographical detector demonstrated that the extreme climate–vegetation interactions varied regionally. In the forest areas, a rise in TNx, TXx, Tx90p, and Tn90p promoted vegetation growth, and the positive effect of extreme temperature was higher than the average temperature. These areas were relatively moist, and extreme heating eliminated superfluous water via evapotranspiration, which in turn mitigated the impact of flooding from heavy precipitation [46]. Additionally, nighttime warming could alleviate the threat of low temperatures and freezing [47]. In the steppe and desert steppe areas, extremely high temperatures were negatively correlated with NDVI on an annual scale, and the negative effect of extreme temperature was more significant than average temperature. This suggested that the occurrence of extreme temperature was more likely to decrease NDVI in the steppe and desert steppe regions. However, NDVI was positively correlated with extreme temperature in spring, and the positive effect was higher than average temperature. This may be because the rising temperature fosters vegetation before the optimal temperature for photosynthesis is reached [48]. When the temperature exceeds the optimal requirements for growth, the high temperature enhances the respiration of vegetation and accelerates nutrient absorption, which, in turn, limits production [49]. Moreover, high temperatures in spring can accelerate snow melting and advance the start of the growing season [50].
Forests of the IMP are water-rich; excessive precipitation and continuous wetness may lead to anaerobic respiration in the forest vegetation roots due to flooding, affecting their nutrient uptake efficiency and normal development [51]. In contrast, NDVI was positively and significantly correlated with Rx1day, Rx5day, R10, and R20 in both the steppe and desert steppe areas. Water resources are scarce in these areas, and vegetation is mainly perennial and xerophytic grasses; therefore, a rise in the intensity and frequency of extreme precipitation has mitigated drought to some extent due to the relative scarcity of water resources, thus promoting vegetation growth [52,53]. Despite increased extreme precipitation in the desert steppe zone, the NDVI of the desert steppe and steppe areas declined significantly in autumn, suggesting that autumn is a harvest season for nomads, which leads to an overloaded mowing and grazing capacity [54].
The interactive effect of extreme climate is more serious in the steppe and desert steppe than in the forest region. This suggests that steppe and desert steppe are more vulnerable to extreme compound events [55]. A declining trend in extreme precipitation in the steppe was observed, and this area experienced a continuous rise in extreme heat. This could lead to an annual potential evapotranspiration much higher than the annual precipitation. Decreasing extreme precipitation and cumulative effects of dryness in the steppe can be detrimental to ecosystem functioning and services [56], as these are the major animal husbandry areas densely populated by nomads. Therefore, greater emphasis should be placed on the restoration of semi-arid ecosystems under extreme climatic conditions.
The NDVI did not correlate well with the extreme climate indices for the IMP in autumn and winter. In the middle and high latitudes of the Northern Hemisphere, the plants will start to be in dormancy in early October [43]. Therefore, the vegetation may have dropped in autumn and winter due to their phenological and physiological characteristics rather than to climate change.

4.4. Lagged Response of NDVI to Extreme Climate

It takes time for vegetation dynamics to adapt to climate change [41]. This study reported that the time lag effect of vegetation on extreme temperature intensity indices (TNn, TXn, TNx, and TXx) was three months, and the lagged effect of extreme precipitation intensity indices (Rx1day and Rx5day) was two months. This was also supported by evidence from a case study conducted in northern China [52]. Possible reasons for the delayed influence of extreme climate indices are discussed below. Precipitation in winter leads to snow cover in forest and steppe areas, which is vital for regional water resources [57]. The high temperature in spring provides the necessary conditions for vegetation growth, in addition to providing the opportunity to melt snow and glaciers, and meltwater increases soil moisture, further increasing vegetation growth. Moreover, considerable rainfall supplements soil water through macropores, allowing vegetation to absorb nutrients and water from the soil [58]. These processes have a lag effect. We observed that the correlation between NDVI and Tx90p, Tn90p, Tx10p, and Tn10p was weak in the current months and without any time lag. This could be because its response to extreme temperature frequency indices (Tx90p, Tn90p, Tx10p, and Tn10p) was insensitive on a monthly scale in arid and semi-arid areas [21].

4.5. Limitation and Prospects

Although the results of this study are considered reliable, the methodology used has some limitations. First, the time series datasets from nature, such as NDVI or climate variables, are usually nonlinear and nonstationary, and often composed of several components influenced by noise, annual variations, inter-annual fluctuations, long-term trends, or even abrupt changes caused by disturbing events. The NDVI and extreme climate indices were directly used in this study without further processing; thus, some uncertainties may exist.
Second, we considered only the effect of extreme climate events on NDVI in this study and simply discussed the correlation between mean-state climate variables and NDVI. Thus, identifying the divergences between mean-state climate factors and extreme climate events and their effects on vegetation should be further explored. In addition to climate change, anthropogenic disturbances are another factor that affects vegetation growth [59,60]. Currently, anthropogenic emissions of carbon dioxide are the main cause of climate change, which can affect the ecosystem [61]. Certain types of anthropogenic activity, such as animal husbandry and the initiation of desertification, can limit vegetation growth. In contrast, restoration programs and environmental conservation can maintain and safeguard the ecological environment and promote vegetation greening [62,63]. Therefore, the mechanisms of extreme climate and anthropogenic influences on vegetation should be further investigated.

5. Conclusions

NDVI and daily meteorological station data from 1982 to 2020 were used to identify the pattern changes in vegetation dynamics and extreme climates. These were then combined with correlation analysis and geographical detectors to evaluate vegetation dynamics responses to extreme climate change in three ecological zones of the IMP using multiple scales (annual, seasonal, and spatial), perspectives (intensity, frequency, and duration), and methods. The main conclusions of this study are as follows:
  • Between 1982 and 2020, the annual NDVI of the forest, steppe, and desert steppe zones showed a significant (α = 0.05) increasing trend, accounting for 95.1%, 50.6%, and 19.5% of the areas, respectively.
  • An extreme warming trend was evident from all the extreme temperature indices on the IMP. For example, GSL increased significantly (α = 0.05) in the forest, steppe, and desert steppe zones at the rate of 0.41, 0.34, and 0.51 day·yr−1, respectively. The intensity and frequency of extreme precipitation increased in the desert steppe zone, whereas the intensity, frequency, and CWD of extreme precipitation decreased in the steppe zone over the past 39 years. It can be noted that the steppe zone will be warmer and drier.
  • Response of vegetation dynamics to the extreme climate indices showed a distinct spatial heterogeneity: the intensity and frequency (TNn, TXn, TNx, TXx, Tx90p, and Tn90p) of extremely high temperature was beneficial to vegetation growth in the forest areas but restricted growth in the desert steppe zone. The intensity and frequency (Rx1day, Rx5day, R10, and R20) of extreme precipitation were relatively more important to the vegetation of the steppe and desert steppe zone. However, the steppe zone is prone to experiencing more dryness and extreme heat; thus, greater emphasis should be placed on the restoration of semi-arid ecosystems under extreme climatic conditions.
  • The lag effects of NDVI response to extreme temperature intensity were not less than three months in the forest, steppe, and desert steppe zones, although extreme precipitation intensity exhibited a two-month time lag to NDVI in the three ecological zones.

Supplementary Materials

The following supporting information can be downloaded at: https://www.mdpi.com/article/10.3390/rs15153891/s1, Figure S1. Changes in annual NDVI in the IMP during 1982–2020. Notes: “*” indicates statistical significance at the 95% confidence level. Figure S2. Spatial distribution of the seasonal Normalized Difference Vegetation Index (NDVI) on the Inner Mongolian Plateau (IMP) during 1982–2020 (a: spring; b: summer; c: autumn; d: winter). Notes: I, II and III represent forest, steppe and desert steppe, respectively. The gray line within the boxes shows the mean value of NDVI. Figure S3. Spatial distribution of extreme temperature indices on the Inner Mongolian Plateau (IMP) during 1982–2020. Figure S4. Spatial distribution of extreme precipitation indices on the Inner Mongolian Plateau (IMP) during 1982–2020. Figure S5. Correlation between annual Normalized Difference Vegetation Index (NDVI) and average climate. Notes: SP and SN means significant positive and significant negative, respectively. Figure S6. Correlation between seasonal Normalized Difference Vegetation Index (NDVI) and extreme climate indices in each ecological zone of the Inner Mongolian Plateau (IMP). (a) forest; (b) steppe; (c) desert steppe. Notes: “*” indicates the correlation passed the 95% significance level. Figure S7. Interactive influence of different extreme climate indices on NDVI changes on a seasonal scale in each ecological zone of the IMP. Table S1. Definitions of extreme climate indices. Table S2. Trend rates (unit: yr−1) of extreme climate indices in each ecological zone. Table S3. Correlation between seasonal Normalized Difference Vegetation Index (NDVI) and average climate in each ecological zone.

Author Contributions

R.S.: conceptualization, methodology, writing—original draft; E.G.: conceptualization, supervision; Y.W.: writing—review and editing; S.Y.: writing—review and editing; Y.B. (Yulong Bao): software; Z.S.: investigation; N.M.: investigation; Y.B. (Yuhai Bao): validation. All authors have read and agreed to the published version of the manuscript.

Funding

The project was supported by the National Natural Science Foundation of China (42261019, 32160320); the Fundamental Research Funds for the Inner Mongolia Normal University (CXJJS22130, 2022JBBJ016, 2022JBQN092) and Graduate Students’ Research & Innovation Fund of Inner Mongolia Normal University (CXJJS22130); the Natural Science Foundation of the Inner Mongolia Autonomous Region of China (2019MS04010); Young Talents of Science and Technology in the Universities of Inner Mongolia Autonomous Region (NJYT22028); and the Science and Technology Planning Project in Inner Mongolia (2022YFSH0070, 2021ZD004503). The authors would like to thank the editors and anonymous reviewers for their crucial comments, which improved the quality of this paper.

Conflicts of Interest

The authors declare no conflict of interest.

References

  1. Costello, A.; Abbas, M.; Allen, A.; Ball, S.; Bell, S.; Bellamy, R.; Friel, S.; Groce, N.; Johnson, A.; Kett, M.; et al. Managing the health effects of climate change. Lancet 2009, 373, 1693–1733. [Google Scholar] [CrossRef]
  2. IPCC. Climate Change 2022: Impacts, Adaptation and Vulnerability; GIEC: Geneva, Switzerland, 2022. [Google Scholar]
  3. Forzieri, G.; Cescatti, A.; e Silva, F.B.; Feyen, L. Increasing risk over time of weather-related hazards to the European population: A data-driven prognostic study. Lancet Planet. Health 2017, 1, e200–e208. [Google Scholar] [CrossRef] [PubMed]
  4. Liu, D.; Wang, T.; Yang, T.; Yan, Z.; Liu, Y.; Zhao, Y.; Piao, S. Deciphering impacts of climate extremes on Tibetan grasslands in the last fifteen years. Sci. Bull. 2019, 64, 446–454. [Google Scholar] [CrossRef] [PubMed]
  5. Schuldt, B.; Buras, A.; Arend, M.; Vitasse, Y.; Beierkuhnlein, C.; Damm, A.; Gharun, M.; Grams, T.E.E.; Hauck, M.; Hajek, P.; et al. A first assessment of the impact of the extreme 2018 summer drought on Central European forests. Basic Appl. Ecol. 2020, 45, 86–103. [Google Scholar] [CrossRef]
  6. World Meteorological Organization. 2020 State of Climate Services: Risk Information and Early Warning Systems. Available online: https://library.wmo.int/index.php?lvl=notice_display&id=21777#.X4a4V-bis2y (accessed on 19 February 2023).
  7. Papatheodorou, E.M.; Papapostolou, A.; Monokrousos, N.; Jones, D.W.; Scullion, J.; Stamou, G.P. Crust cover and prior soil moisture status affect the response of soil microbial community and function to extreme rain events in an arid area. Eur. J. Soil Biol. 2020, 101, 103243. [Google Scholar] [CrossRef]
  8. Elahi, E.; Khalid, Z.; Tauni, M.Z.; Zhang, H.; Lirong, X. Extreme weather events risk to crop-production and the adaptation of innovative management strategies to mitigate the risk: A retrospective survey of rural Punjab, Pakistan. Technovation 2022, 117, 102255. [Google Scholar] [CrossRef]
  9. Zhang, W.; Wang, L.; Xiang, F.; Qin, W.; Jiang, W. Vegetation dynamics and the relations with climate change at multiple time scales in the Yangtze River and Yellow River Basin, China. Ecol. Indic. 2020, 110, 105892. [Google Scholar] [CrossRef]
  10. Xu, G.; Zhang, H.; Chen, B.; Zhang, H.; Innes, J.L.; Wang, G.; Yan, J.; Zheng, Y.; Zhu, Z.; Myneni, R.B. Changes in Vegetation Growth Dynamics and Relations with Climate over China’s Landmass from 1982 to 2011. Remote Sens. 2014, 6, 3263–3283. [Google Scholar] [CrossRef] [Green Version]
  11. Zhao, L.; Dai, A.; Dong, B. Changes in global vegetation activity and its driving factors during 1982–2013. Agric. For. Meteorol. 2018, 249, 198–209. [Google Scholar] [CrossRef]
  12. Piao, S.; Mohammat, A.; Fang, J.; Cai, Q.; Feng, J. NDVI-based increase in growth of temperate grasslands and its responses to climate changes in China. Glob. Environ. Chang. 2006, 16, 340–348. [Google Scholar] [CrossRef]
  13. Gu, Z.; Duan, X.; Shi, Y.; Li, Y.; Pan, X. Spatiotemporal variation in vegetation coverage and its response to climatic factors in the Red River Basin, China. Ecol. Indic. 2018, 93, 54–64. [Google Scholar] [CrossRef]
  14. Merrick, T.; Pau, S.; Detto, M.; Broadbent, E.N.; Bohlman, S.A.; Still, C.J.; Almeyda Zambrano, A.M. Unveiling spatial and temporal heterogeneity of a tropical forest canopy using high-resolution NIRv, FCVI, and NIRvrad from UAS observations. Biogeosciences 2021, 18, 6077–6091. [Google Scholar] [CrossRef]
  15. Zhang, C.; Ren, H.; Qin, Q.; Ersoy, O.K. A new narrow band vegetation index for characterizing the degree of vegetation stress due to copper: The copper stress vegetation index (CSVI). Remote Sens. Lett. 2017, 8, 576–585. [Google Scholar] [CrossRef]
  16. Zeng, Y.; Hao, D.; Huete, A.; Dechant, B.; Berry, J.; Chen, J.M.; Joiner, J.; Frankenberg, C.; Bond-Lamberty, B.; Ryu, Y.; et al. Optical vegetation indices for monitoring terrestrial ecosystems globally. Nat. Rev. Earth Environ. 2022, 3, 477–493. [Google Scholar] [CrossRef]
  17. Fang, W.; Huang, S.; Huang, Q.; Huang, G.; Wang, H.; Leng, G.; Wang, L.; Guo, Y. Probabilistic assessment of remote sensing-based terrestrial vegetation vulnerability to drought stress of the Loess Plateau in China. Remote Sens. Environ. 2019, 232, 111290. [Google Scholar] [CrossRef]
  18. Zhang, X.; Alexander, L.; Hegerl, G.C.; Jones, P.; Tank, A.K.; Peterson, T.C.; Trewin, B.; Zwiers, F.W. Indices for monitoring changes in extremes based on daily temperature and precipitation data. WIREs Clim. Chang. 2011, 2, 851–870. [Google Scholar] [CrossRef]
  19. Subash, N.; Singh, S.S.; Priya, N. Extreme rainfall indices and its impact on rice productivity—A case study over sub-humid climatic environment. Agric. Water Manag. 2011, 98, 1373–1387. [Google Scholar] [CrossRef]
  20. Piao, S.; Zhang, X.; Chen, A.; Liu, Q.; Lian, X.; Wang, X.; Peng, S.; Wu, X. The impacts of climate extremes on the terrestrial carbon cycle: A review. Sci. China Earth Sci. 2019, 62, 1551–1563. [Google Scholar] [CrossRef]
  21. Luo, M.; Sa, C.; Meng, F.; Duan, Y.; Liu, T.; Bao, Y. Assessing extreme climatic changes on a monthly scale and their implications for vegetation in Central Asia. J. Clean. Prod. 2020, 271, 122396. [Google Scholar] [CrossRef]
  22. John, R.; Chen, J.; Ou-Yang, Z.-T.; Xiao, J.; Becker, R.; Samanta, A.; Ganguly, S.; Yuan, W.; Batkhishig, O. Vegetation response to extreme climate events on the Mongolian Plateau from 2000 to 2010. Environ. Res. Lett. 2013, 8, 035033. [Google Scholar] [CrossRef]
  23. Li, S.; Wei, F.; Wang, Z.; Shen, J.; Liang, Z.; Wang, H.; Li, S. Spatial Heterogeneity and Complexity of the Impact of Extreme Climate on Vegetation in China. Sustainability 2021, 13, 5748. [Google Scholar] [CrossRef]
  24. Wang, L.; Hu, F.; Miao, Y.; Zhang, C.; Zhang, L.; Luo, M. Changes in Vegetation Dynamics and Relations with Extreme Climate on Multiple Time Scales in Guangxi, China. Remote Sens. 2022, 14, 2013. [Google Scholar] [CrossRef]
  25. Kong, D.; Miao, C.; Wu, J.; Zheng, H.; Wu, S. Time lag of vegetation growth on the Loess Plateau in response to climate factors: Estimation, distribution, and influence. Sci. Total Environ. 2020, 744, 140726. [Google Scholar] [CrossRef]
  26. Yan, W.; He, Y.; Cai, Y.; Qu, X.; Cui, X. Relationship between extreme climate indices and spatiotemporal changes of vegetation on Yunnan Plateau from 1982 to 2019. Glob. Ecol. Conserv. 2021, 31, e01813. [Google Scholar] [CrossRef]
  27. He, L.; Guo, J.; Yang, W.; Jiang, Q.; Chen, L.; Tang, K. Multifaceted responses of vegetation to average and extreme climate change over global drylands. Sci. Total Environ. 2023, 858, 159942. [Google Scholar] [CrossRef]
  28. Zhao, W.; Hu, Z.; Guo, Q.; Wu, G.; Chen, R.; Li, S. Contributions of Climatic Factors to Interannual Variability of the Vegetation Index in Northern China Grasslands. J. Clim. 2020, 33, 175–183. [Google Scholar] [CrossRef]
  29. Wang, J.; Xu, C. Geodetector: Principle and prospective. Acta Geogr. Sin. 2017, 72, 116–134. [Google Scholar]
  30. Dan, S.; Li, H.; Ping, L.; De, X. Effects of Climate Change on Vegetation in Desert Steppe Inner Mongolia. Nat. Resour. 2013, 4, 319–322. [Google Scholar] [CrossRef] [Green Version]
  31. Liu, X.; Zhu, Z.; Yu, M.; Liu, X. Drought-induced productivity and economic losses in grasslands from Inner Mongolia vary across vegetation types. Reg. Environ. Chang. 2021, 21, 59. [Google Scholar] [CrossRef]
  32. Li, C.; Wang, J.; Hu, R.; Yin, S.; Bao, Y.; Ayal, D.Y. Relationship between vegetation change and extreme climate indices on the Inner Mongolia Plateau, China, from 1982 to 2013. Ecol. Indic. 2018, 89, 101–109. [Google Scholar] [CrossRef]
  33. Julien, Y.; Sobrino, J.A. Comparison of cloud-reconstruction methods for time series of composite NDVI data. Remote Sens. Environ. 2010, 114, 618–625. [Google Scholar] [CrossRef]
  34. Sen, P.K. Estimates of the Regression Coefficient Based on Kendall’s Tau. J. Am. Stat. Assoc. 1968, 63, 1379–1389. [Google Scholar] [CrossRef]
  35. Yang, T.; Sun, F.; Liu, W.; Wang, H.; Wang, T.; Liu, C. Using Geo-detector to attribute spatio-temporal variation of pan evaporation across China in 1961–2001. Int. J. Climatol. 2019, 39, 2833–2840. [Google Scholar] [CrossRef]
  36. Ran, Q.; Hao, Y.; Xia, A.; Liu, W.; Hu, R.; Cui, X.; Xue, K.; Song, X.; Xu, C.; Ding, B.; et al. Quantitative Assessment of the Impact of Physical and Anthropogenic Factors on Vegetation Spatial-Temporal Variation in Northern Tibet. Remote Sens. 2019, 11, 1183. [Google Scholar] [CrossRef] [Green Version]
  37. He, Y.; Wang, W.; Chen, Y.; Yan, H. Assessing spatio-temporal patterns and driving force of ecosystem service value in the main urban area of Guangzhou. Sci. Rep. 2021, 11, 3027. [Google Scholar] [CrossRef]
  38. Chen, Y.; Zhou, Y.; Nixia, C.; Zhang, H.; Wang, C.; Gesang, D.; Wang, X. Spatiotemporal variations of surface ozone and its influencing factors across Tibet: A Geodetector-based study. Sci. Total Environ. 2022, 813, 152651. [Google Scholar] [CrossRef]
  39. Hsu, S.-C.; Lin, F.-J. Elemental characteristics of surface suspended particulates off the Changjiang estuary during the 1998 flood. J. Mar. Syst. 2010, 81, 323–334. [Google Scholar] [CrossRef]
  40. Zong, Y.; Chen, X. The 1998 Flood on the Yangtze, China. Nat. Hazards 2000, 22, 165–184. [Google Scholar] [CrossRef]
  41. Wu, D.; Zhao, X.; Liang, S.; Zhou, T.; Huang, K.; Tang, B.; Zhao, W. Time-lag effects of global vegetation responses to climate change. Glob. Chang. Biol. 2015, 21, 3520–3531. [Google Scholar] [CrossRef]
  42. Alexander, L.V.; Zhang, X.; Peterson, T.C.; Caesar, J.; Gleason, B.; Klein Tank, A.M.G.; Haylock, M.; Collins, D.; Trewin, B.; Rahimzadeh, F.; et al. Global observed changes in daily climate extremes of temperature and precipitation. J. Geophys. Res. Atmos. 2006, 111, 1042–1063. [Google Scholar] [CrossRef] [Green Version]
  43. Piao, S.; Fang, J.; Zhou, L.; Ciais, P.; Zhu, B. Variations in satellite-derived phenology in China’s temperate vegetation. Glob. Chang. Biol. 2006, 12, 672–685. [Google Scholar] [CrossRef]
  44. Shi, J.; Cui, L.; Wen, K.; Tian, Z.; Wei, P.; Zhang, B. Trends in the consecutive days of temperature and precipitation extremes in China during 1961–2015. Environ. Res. 2018, 161, 381–391. [Google Scholar] [CrossRef]
  45. Deng, H.; Chen, Y.; Shi, X.; Li, W.; Wang, H.; Zhang, S.; Fang, G. Dynamics of temperature and precipitation extremes and their spatial variation in the arid region of northwest China. Atmos. Res. 2014, 138, 346–355. [Google Scholar] [CrossRef]
  46. Gao, J.; Jiao, K.; Wu, S. Investigating the spatially heterogeneous relationships between climate factors and NDVI in China during 1982 to 2013. J. Geogr. Sci. 2019, 29, 1597–1609. [Google Scholar] [CrossRef] [Green Version]
  47. Xu, X.; Jiang, H.; Guan, M.; Wang, L.; Huang, Y.; Jiang, Y.; Wang, A. Vegetation responses to extreme climatic indices in coastal China from 1986 to 2015. Sci. Total Environ. 2020, 744, 140784. [Google Scholar] [CrossRef]
  48. Michaletz, S.T.; Cheng, D.; Kerkhoff, A.J.; Enquist, B.J. Convergence of terrestrial plant production across global climate gradients. Nature 2014, 512, 39–43. [Google Scholar] [CrossRef]
  49. Siddik, M.A.; Zhang, J.; Chen, J.; Qian, H.; Jiang, Y.; Raheem, A.k.; Deng, A.; Song, Z.; Zheng, C.; Zhang, W. Responses of indica rice yield and quality to extreme high and low temperatures during the reproductive period. Eur. J. Agron. 2019, 106, 30–38. [Google Scholar] [CrossRef]
  50. Shen, M.; Piao, S.; Dorji, T.; Liu, Q.; Cong, N.; Chen, X.; An, S.; Wang, S.; Wang, T.; Zhang, G. Plant phenological responses to climate change on the Tibetan Plateau: Research status and challenges. Natl. Sci. Rev. 2015, 2, 454–467. [Google Scholar] [CrossRef] [Green Version]
  51. Kramer, K.; Vreugdenhil, S.J.; van der Werf, D.C. Effects of flooding on the recruitment, damage and mortality of riparian tree species: A field and simulation study on the Rhine floodplain. For. Ecol. Manag. 2008, 255, 3893–3903. [Google Scholar] [CrossRef]
  52. Jiang, H.; Xu, X. Impact of extreme climates on vegetation from multiple scales and perspectives in the Agro-pastural Transitional Zone of Northern China in the past three decades. J. Clean. Prod. 2022, 372, 133459. [Google Scholar] [CrossRef]
  53. Jiapaer, G.; Liang, S.; Yi, Q.; Liu, J. Vegetation dynamics and responses to recent climate change in Xinjiang using leaf area index as an indicator. Ecol. Indic. 2015, 58, 64–76. [Google Scholar] [CrossRef]
  54. Hoffmann, C.; Giese, M.; Dickhoefer, U.; Wan, H.; Bai, Y.; Steffens, M.; Liu, C.; Butterbach-Bahl, K.; Han, X. Effects of grazing and climate variability on grassland ecosystem functions in Inner Mongolia: Synthesis of a 6-year grazing experiment. J. Arid. Environ. 2016, 135, 50–63. [Google Scholar] [CrossRef]
  55. Kang, Y.; Guo, E.; Wang, Y.; Bao, Y.; Bao, Y.; Mandula, N.; Runa, A.; Gu, X.; Jin, L. Characterisation of compound dry and hot events in Inner Mongolia and their relationship with large-scale circulation patterns. J. Hydrol. 2022, 612, 128296. [Google Scholar] [CrossRef]
  56. Zhang, Z.; Ju, W.; Zhou, Y.; Li, X. Revisiting the cumulative effects of drought on global gross primary productivity based on new long-term series data (1982–2018). Glob. Chang. Biol. 2022, 28, 3620–3635. [Google Scholar] [CrossRef]
  57. Sivakumar, B. Global climate change and its impacts on water resources planning and management: Assessment and challenges. Stoch. Environ. Res. Risk Assess. 2011, 25, 583–600. [Google Scholar] [CrossRef]
  58. Richards, J.H.; Caldwell, M.M. Hydraulic lift: Substantial nocturnal water transport between soil layers by Artemisia tridentata roots. Oecologia 1987, 73, 486–489. [Google Scholar] [CrossRef] [PubMed]
  59. Hua, W.; Chen, H.; Zhou, L.; Xie, Z.; Qin, M.; Li, X.; Ma, H.; Huang, Q.; Sun, S. Observational Quantification of Climatic and Human Influences on Vegetation Greening in China. Remote Sens. 2017, 9, 425. [Google Scholar] [CrossRef] [Green Version]
  60. Wen, Z.; Wu, S.; Chen, J.; Lü, M. NDVI indicated long-term interannual changes in vegetation activities and their responses to climatic and anthropogenic factors in the Three Gorges Reservoir Region, China. Sci. Total Environ. 2017, 574, 947–959. [Google Scholar] [CrossRef]
  61. Burrell, A.L.; Evans, J.P.; De Kauwe, M.G. Anthropogenic climate change has driven over 5 million km2 of drylands towards desertification. Nat. Commun. 2020, 11, 3853. [Google Scholar] [CrossRef]
  62. Peng, S.-S.; Piao, S.; Zeng, Z.; Ciais, P.; Zhou, L.; Li, L.Z.X.; Myneni, R.B.; Yin, Y.; Zeng, H. Afforestation in China cools local land surface temperature. Proc. Natl. Acad. Sci. USA 2014, 111, 2915–2919. [Google Scholar] [CrossRef]
  63. Lü, Y.; Zhang, L.; Feng, X.; Zeng, Y.; Fu, B.; Yao, X.; Li, J.; Wu, B. Recent ecological transitions in China: Greening, browning and influential factors. Sci. Rep. 2015, 5, 8732. [Google Scholar] [CrossRef] [PubMed] [Green Version]
Figure 1. Maps showing the overview (a), vegetation types (b), annual average temperature (c), and precipitation (d) of the IMP.
Remotesensing 15 03891 g001
Figure 2. Spatial distribution (a) and variation trend (b) of the annual NDVI of the IMP between 1982 and 2020. Notes: I–III represent forest, steppe, and desert steppe, respectively. The gray line within the boxes shows the mean value of NDVI.
Remotesensing 15 03891 g002
Figure 3. Spatial variation trend of seasonal NDVI of the IMP during 1982–2020. Notes: I–III represent forest, steppe, and desert steppe, respectively.
Remotesensing 15 03891 g003
Figure 4. Anomalies and changes in the annual extreme temperature indices in the IMP during 1982–2020. Notes: “*” indicates statistical significance at the 95% confidence level.
Remotesensing 15 03891 g004
Figure 5. Spatial variation of temperature indices in the IMP during 1982–2020. Notes: Equilateral triangle means significant increase, and inverted triangle means significant decrease.
Remotesensing 15 03891 g005
Figure 6. Anomalies and changes in the annual extreme precipitation indices in the IMP during 1982–2020. Notes: “*” indicates statistical significance at the 95% confidence level.
Remotesensing 15 03891 g006
Figure 7. Spatial variation in precipitation indices over the IMP during 1982–2020. Notes: Equilateral triangle means significant increase, and inverted triangle means significant decrease.
Remotesensing 15 03891 g007
Figure 8. Spatial distribution of correlation between annual NDVI and extreme temperature indices. Notes: SP and SN indicate significant positive and significant negative, respectively.
Remotesensing 15 03891 g008
Figure 9. Spatial distribution of correlation between annual NDVI and extreme precipitation indices. Notes: SP and SN indicate significant positive and significant negative, respectively.
Remotesensing 15 03891 g009
Figure 10. Influence of different extreme climate indices on NDVI changes on an annual scale in each ecological zone of the IMP.
Remotesensing 15 03891 g010
Figure 11. Influence of different extreme climate indices on NDVI changes on a seasonal (spring and summer) scale in each ecological zone of the IMP.
Remotesensing 15 03891 g011
Figure 12. Interactive influence of different extreme climate indices on NDVI changes on an annual scale in each ecological zone of the IMP.
Remotesensing 15 03891 g012
Figure 13. Time-lagged response of the NDVI to extreme climate indices. Notes: “0” denotes no time lag; 1–3 denotes a 1–3-month time lag. “*” indicates the correlation passed the 95% confidence level.
Remotesensing 15 03891 g013
Table 1. Temporal trend rates (unit: yr−1) for the seasonal NDVI during 1982–2020.
SeasonsIMPForestSteppeDesert Steppe
spring0.0017 *0.0017 *0.0016 *0.0008
summer0.0009 *0.0012 *0.0011 *0.0021 *
autumn0.0008 *0.0014 *0.0011 *−0.0009
winter−0.000200.0015 *−0.0008
Notes: “*” indicate statistical significance at the 95% confidence level.
Disclaimer/Publisher’s Note: The statements, opinions and data contained in all publications are solely those of the individual author(s) and contributor(s) and not of MDPI and/or the editor(s). MDPI and/or the editor(s) disclaim responsibility for any injury to people or property resulting from any ideas, methods, instructions or products referred to in the content.

