
Risk Zoning of Permafrost Thaw Settlement in the Qinghai–Tibet Engineering Corridor

1
College of Geology Engineering and Geomatics, Chang’an University, Xi’an 710054, China
2
State Key Laboratory of Road Engineering Safety and Health in Cold and High-Altitude Regions, CCCC First Highway Consultants Co., Ltd., Xi’an 710065, China
*
Author to whom correspondence should be addressed.
Remote Sens. 2023, 15(15), 3913; https://doi.org/10.3390/rs15153913
Submission received: 26 May 2023
/
Revised: 29 July 2023
/
Accepted: 5 August 2023
/
Published: 7 August 2023
(This article belongs to the Special Issue Remote Sensing and Land Surface Process Models for Permafrost Studies II)
Abstract
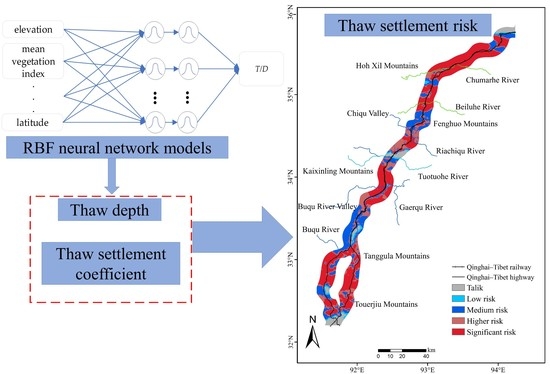
:The Qinghai–Tibet Plateau is the highest and largest permafrost area in the middle and low latitudes of China. In this region, permafrost thaw settlement is the main form of expressway subgrade disaster. Therefore, the quantitative analysis and regionalization study of permafrost thaw settlement deformation are of great significance for expressway construction and maintenance in the Qinghai–Tibet region. This paper establishes a thaw settlement prediction model using the thaw settlement coefficient and thaw depth. The thaw depth was predicted by the mean annual ground temperatures and active-layer thicknesses using the Radial Basis Function (RBF) neural network model, and the thaw settlement coefficient was determined according to the type of ice content. Further, the distribution characteristics of thaw settlement risk of the permafrost subgrade in the study region were mapped and analyzed. The results showed that the thaw settlement risk was able to be divided into four risk levels, namely significant risk, high risk, medium risk and low risk levels, with the areas of these four risk levels covering 3868.67 km2, 1594.21 km2, 2456.10 km2 and 558.78 km2, respectively, of the total study region. The significant risk level had the highest proportion among all the risk levels and was mainly distributed across the Chumar River Basin, Beiluhe River Basin and Gaerqu River Basin regions. Moreover, ice content was found to be the main factor affecting thaw settlement, with thaw settlement found to increase as the ice content increased.
1. Introduction
Permafrost in the Qinghai–Tibet region covers an area of 1.06 million square kilometers [1], accounting for 70% of China’s total permafrost area. It is the highest and largest permafrost area in the country’s middle and low latitudes. With the construction of the national “the Belt and Road” in recent years, it has become urgent to build expressways in China’s permafrost areas. The construction quality of subgrade is closely related to its stability [2,3,4,5]. Thaw settlement disasters are caused by the temperature rising and the melting of underlying permafrost layers, which can lead to the instability or even destruction of permafrost subgrade [6,7,8]. Therefore, the quantitative analysis and regionalization study of permafrost thaw settlement deformation are of great significance for subgrade construction in the Qinghai–Tibet region.
Considering the impact of global warming on the environment in permafrost regions, intensive research has been carried out on thawing and subgrade disasters in permafrost regions [9,10,11,12]. Dashjamts et al. [13] conducted laboratory tests on the thaw process of permafrost and found that the thaw deformation of permafrost was related to the clay content of the sample, the initial pressure applied and the intensity of heating. Ma et al. [14], based on ground temperatures and subgrade deformations observed in the Qinghai–Tibet Plateau since 2002, evaluated the effects of various thaw settlement remedial measures. Their results showed that crushed rock revetment decreased the thaw settlement of the subgrade. Similarly, based on the measured data of surface temperature deformation under the subgrade in the permafrost area of Qinghai–Tibet Railway from 2006 to 2013, Sun et al. [15] found that the ice content is an important factor affecting the subgrade settlement, and the greater the ice content, the greater the settlement. Yu et al. [16] studied the characteristics of surface frost heave in winter and thaw settlement in spring, finding that the ground settlement caused by permafrost thaw settlement accounted for 20% of the total ground settlement in the study region. Wang et al. [17] investigated permafrost degradation impacts along the Ingraham Trail by focusing on the vertical thaw settlement of the trail’s pavement structure and proposed an insulating material to mitigate thaw settlement in permafrost areas. Hjort et al. [18] found that ice-rich permafrost warming and thawing had considerable threats to high-altitude subgrade and infrastructure and explored some methods available to mitigate their negative effects. Through on-site monitoring and field investigation, Niu et al. [19] analyzed the thermal stability and the secondary freeze–thaw disasters caused by the permafrost subgrade in the Qinghai–Tibet railway region, finding that thaw settlement seriously harmed the stability of the subgrade.
The above articles, which mainly analyzed permafrost thaw settlement disasters through field observation and theoretical analysis, had deficiencies in their quantitative calculation and zoning distributions of thaw settlement. In their research on risk prediction and zoning of thaw settlement disasters, Ruan et al. [20] established a modified thaw settlement index model to study the risk of future thaw settlement disasters under climate change in the Qinghai–Tibet engineering corridor and analyzed the zoning of future thaw settlement risks. Hong et al. [21] established the permafrost settlement hazard index (PSHI) by analyzing the ecological characteristics of climate warming and thaw settlement in permafrost regions, finding that a discontinuous permafrost region was more prone to thaw settlement than other regions, and they further used a climate model to estimate the risk of thaw settlement in 2050. In addition, some scholars have established numerical models. For example, Zaretskii [22] proposed that the thaw settlement deformation of permafrost conforms to the classical Terzaghi consolidation theory by analyzing their experimental data, and they obtained a method to roughly calculate the total amount of thaw settlement deformation by using the permafrost ice thicknesses. Tang et al. [23] used the frost heave ratio to establish a numerical calculation model of frost heave and thaw settlement and analyzed thaw settlement in a permafrost region after 1, 10, 30 and 50 years. Liu et al. [24] established a numerical model of runway structures in permafrost regions in order to study the evolution of thaw settlement, finding that the thaw settlement in the study region was mainly concentrated in the subgrade, and that it gradually expanded to the natural surface over time. Ni et al. [25] analyzed the reliability of three thaw settlement indicators based on a geological hazard index and employed comprehensive optimization indicators to predict thaw settlement disasters in the permafrost region of the Qinghai–Tibet Plateau. Sun et al. [26] analyzed the station data from the Qinghai–Tibet engineering corridor from 1966 to 2018 and established a permafrost thaw settlement model by using a transient mobile network, concluding that there was a high risk of thaw settlement in the ice-rich permafrost region with a zero-temperature gradient.
In general, the research on permafrost thaw settlement has mainly focused on employing field measurement analysis and thaw settlement coefficient models, but these approaches still have many shortcomings, including the following: it is difficult to calculate thaw settlement from a theoretical perspective using field-measured data; when determining the thaw settlement coefficient, many factors need to be considered and a large number of experiments need to be conducted; and the existing models find it difficult to combine thaw settlement with risk and to describe thaw settlement’s distribution characteristics. In this context, this paper proposes a model for predicting thaw settlement that combines thaw depth with the thaw settlement coefficient. Using 277 groups of borehole monitoring points along the Qinghai–Tibet engineering corridor, this study established RBF neural network models of the mean annual ground temperature and active-layer thickness in order to predict the thaw depth. Further, the thaw settlement in the study region was determined according to the type of ice content. Finally, using the above prediction model, a distribution map of the permafrost thaw settlement in the Qinghai–Tibet engineering corridor was obtained, and the risk characteristics of thaw settlement disasters were analyzed. This study therefore serves as a valuable reference for linear engineering construction and disaster prevention in permafrost areas.
2. Materials and Methods
2.1. Data Source
In this paper, the north–south boundary of the permafrost in the Qinghai–Tibet engineering corridor (Xidatan–Amdo) was taken as the research area, as shown in Figure 1. Taking the Qinghai–Tibet highway and Qinghai–Tibet railway as the reference lines, the study area extended 10 km on both sides, having a total length of about 540 km. The geographical coordinates are located between 32°and 36° north in latitude and 91°–95° east in longitude. Further, we collected a series of remote sensing data to establish a prediction model of thaw settlement, as shown in Table 1. The Kriging interpolation method was used to unify the data resolution to 90 × 90 m [27,28]. We used the mean NDVI values to analyze the vegetation change trends; the threshold value of NDVI was between −1 and 1, which can reasonably reflect the spatial distribution characteristics of surface vegetation and non-vegetation. The SRTM DEM dataset was downloaded from the Consortium for Spatial Information of CGIAR (http://srtm.csi.cgiar.org/ (accessed on 21 September 2022)), and the MODIS datasets (MOD11A2, MOD13Q1) were downloaded from the Land Processes Distributed Active Archive Center of NASA (https://lpdaac.usgs.gov/ (accessed on 5 October 2022)).
In addition to remote sensing data, a series of monitoring data was used to establish a thaw settlement prediction model. Equivalent latitude represents the impact of solar radiation on the Earth’s surface and is also important for judging slope direction. It can be calculated using slope, aspect and latitude:
where is the equivalent latitude; l is the slope; h is the slope aspect; and φ is the latitude.
Figure 2 shows the on-site drilling detection diagram. The measured mean annual ground temperature and active-layer thickness were obtained from the borehole monitoring points along the Qinghai–Tibet engineering corridor (the monitoring points are shown in Figure 1), totaling 277 groups. The monitoring points were evenly distributed across the study area and basically reflected the characteristics of the mean annual ground temperature and active-layer thickness in the study region, thus, having great representativeness.
The ice content data were obtained from on-site drilling of the permafrost layer within 8 m of depth below the upper limit, and then we comprehensively obtained the ice content distribution map based on geomorphic units, stratigraphic conditions and vegetation conditions. Figure 3 shows the distribution map of permafrost ice content in the study region.
2.2. Prediction Model of Permafrost Thaw Settlement
Due to the impact of climate warming and human activities, permafrost thaw depths have continued to increase across the globe in recent times, further aggravating the occurrence of thaw settlement disasters. In this paper, the thaw settlement was obtained using the thaw depth and thaw settlement coefficient, and its calculation formula is as follows:
where I is the thaw settlement (m); ∆h is the thaw depth (m); and A is the thaw settlement coefficient.
The specific calculation process of thaw settlement is shown in Figure 4.
2.2.1. Determination of the Thaw Settlement Coefficient (A)
The thaw settlement coefficient was determined according to the type of ice content. According to the characteristics of permafrost ice content in the Qinghai–Tibet engineering corridor, the permafrost was divided into five types: ice-poor, icy soil, ice-rich, ice-saturated and ice layer with soil inclusions [29]. The regional thaw settlement coefficient values of different permafrost ice contents in the study region were classified and determined, as shown in Table 2.
2.2.2. Prediction Model of Permafrost Thaw Depth (∆h)
Under the influence of human engineering activities, changes in surface conditions and vegetation lead to the melting of underground soils near the permafrost upper limit. Different mean annual ground temperatures and active-layer thicknesses responded differently to the influence of human engineering activities. Our preliminary research analyzed the variation rule of permafrost thaw depth under different mean annual ground temperatures and active-layer thicknesses. We developed a fitting model to estimate the permafrost thaw depth of 26 m wide subgrade by using the mean annual ground temperature and active-layer thickness [30]:
where T is the mean annual ground temperature (°C); D is the active-layer thickness (m). The R2 of the fitting formula was found to be 0.979, meaning it can accurately predict the thaw depth of permafrost in the Qinghai–Tibet engineering corridor.
The mean annual ground temperature, which refers to the ground temperature at the depth where the annual ground temperature difference of the permafrost is zero [31,32,33,34], is an important indicator, as it reflects the influence of regional characteristics of the permafrost. To date, machine learning algorithms have been widely used in the prediction of the mean annual ground temperature of permafrost and have achieved good results [35,36,37,38,39]. Based on this, this paper adopted an RBF neural network to establish a mean annual ground temperature prediction model.
The basic structure of RBF neural networks is a three-layer neural network [40] involving an input layer, a hidden layer and an output layer. The input layer consists of input nodes, which connect the network with the external environment and transmit the input signal to the hidden layer. The hidden layer is used to realize nonlinear transformation from the input layer signal to the hidden layer signal. The output layer is used to output the final result. K-fold cross-validation is an effective method for obtaining an optimal model using a small amount of sample data. The principle of this method is to divide the original data into K groups and then form a verification set for each data group, and the rest of the K-1 data groups are used as training sets to obtain K models, and finally to select the optimal model.
The activation function of RBF neural networks is the Gaussian kernel function:
where ci is the central vector; σ is the width parameter of the function; and xp is the input unit.
The loss function formula for the least squares method is:
where yj is the output unit; p is the number of input samples; and dj is the expected output value.
In this paper, through a large number of combinations and data factor attempts, as well as constant optimization, the five data types of elevation, surface temperature, average vegetation index, latitude and equivalent latitude were finally selected as the prediction factors for establishing the RBF neural network model, and, namely, for the input layer nodes. Further, in the model, the mean annual ground temperature was the output layer, the hidden layer was set to 2 layers, the first layer was set to have 13 nodes and the second layer was set to have 10 nodes. The model is shown in Figure 5a.
The active layer is the soil layer close to the surface that freezes in winter and melts in summer. It is the most important area of water and heat exchange in frozen ground. Due to global warming, the permafrost region is shrinking and the active-layer thickness is increasing in many areas [41,42,43]. Our research team established an RBF neural network prediction model of active-layer thickness based on the mean vegetation index, equivalent latitude, latitude, elevation, surface temperature and ice content [44], as shown in Figure 5b.
Three statistical variables, namely R-squared (R2), the mean absolute error (MAE) and the root mean square error (RMSE), were used as evaluation indexes to analyze the error of the RBF neural network model. The expressions of R2, MAE and RMSE are shown in Equations (6)–(8), respectively:
where is the predicted value; is the measured value; and is the average value.
2.3. Risk Classification of Thaw Settlement
For the subgrade in the permafrost area of the Qinghai–Tibet highway, according to “The Evaluation Standard for Permafrost Thaw Settlement Disease” [45], the sections with thaw settlement I < 0.1 m were considered to have low thaw settlement risk, sections with thaw settlement I between 0.1 m and 0.25 m were considered to have medium risk, and sections with thaw settlement I > 0.25 m were considered to have high thaw settlement disaster risk. According to “The Code for Highway Subgrade Design” [46], roads with thaw settlement I > 0.5 m generally need treatment design. Therefore, in this study, sections with high thaw settlement risk above 0.25 m were divided further, with those with thaw settlement I between 0.25 m and 0.5 m identified as having high risk and those with thaw settlement I > 0.5 m categorized as having significant thaw settlement disaster risk, as shown in Table 3.
3. Results
3.1. Distribution of Thaw Depth
To avoid the influence of thaw zones on the prediction results of the model, this paper only studied the permafrost region in the Qinghai–Tibet engineering corridor. Further, the results of the established RBF neural network prediction models of the mean annual ground temperature and active-layer thickness, as shown in Figure 5, were imported into ArcGIS software, and the zoning maps of the mean annual ground temperature and active-layer thickness in the study area were obtained through grid processing and interpolation analysis, as shown in Figure 6.
According to the mean annual ground temperature data, the permafrost region was divided into four types: when T ≥ −0.5 °C, it was high-temperature, extremely unstable permafrost; when −1 °C ≤ T < −0.5 °C, it was high-temperature, unstable permafrost; when −2 °C ≤ T < −1 °C, it was low-temperature, basically stable permafrost; and when T < −2 °C, it was low-temperature, stable permafrost [47]. It can be seen from Figure 6a that the high-temperature, extremely unstable permafrost (−0.5 °C~0 °C) in the study area was mainly distributed in the Chumar River Basin, Wuli Basin and Tongtianhe River Basin regions. The high-temperature, unstable permafrost (−1 °C~−0.5 °C) was mainly distributed in the Kaixinling Mountain, Riachiqu River Basin and Chumar River Basin regions, and slightly in the Touerjiu Mountain region. The low-temperature, basically stable permafrost (−2 °C~−1 °C) was mainly distributed in the Kunlun Mountain, Beiluhe River Basin and Tanggula Mountain regions. Furthermore, the low-temperature, stable permafrost (<−2 °C) was mainly distributed in the Hoh Xil Mountain and Beiluhe River Basin regions. Overall, the high-temperature, unstable permafrost was found to be the main type of permafrost in the study area.
It can be seen from Figure 6b that the active-layer thicknesses in the study area mainly ranged between 2 and 4 m; these were mainly distributed from the Chumar Plain to the Beiluhe Basin and from the south of the Tanggula Mountains to the Touerjiu Mountains. Thicknesses of more than 4 m were mainly distributed from the Buqu River to the Touerjiu Mountains and were also generally distributed in the southern region. Thicknesses of 0~2 m were less distributed and scattered in the study area, mainly found in the Chumar River Plain and Hoh Xil Mountain regions.
According to the prediction results of the mean annual ground temperatures and active-layer thicknesses, Equation (3) was used to calculate the thaw depth in the Qinghai–Tibet engineering corridor. Further, a zoning map of the permafrost thaw depth distribution in the study area was obtained, as shown in Figure 7.
As can be seen from Figure 7, the thaw depth of the permafrost in the Qinghai–Tibet engineering corridor was mainly 3–9 m. The permafrost with a thaw depth of 3–6 m was mainly distributed in the northern end of the corridor and the Chumar River Basin, and a small amount was also distributed in the Tanggula Mountain and Beiluhe River Basin regions. The permafrost with a thaw depth of 6–9 m was mainly distributed in the Beiluhe River Basin, Riachiqu River Basin and Buqu River Basin regions. The permafrost with a thaw depth of more than 9 m was mainly distributed in the Gaerqu River Basin region, and slightly in the Riachiqu River Basin and Touerjiu Mountain regions. In general, the permafrost thaw depth was large in the study area, with permafrost with a high thaw depth being widely distributed.
3.2. Risk Characteristics of Thaw Settlement
On the basis of the classification criteria of the thaw settlement risk (as shown in Table 3) and the calculation results for thaw settlement in the Qinghai–Tibet engineering corridor, a thaw settlement risk zoning map of the study area was obtained (as shown in Figure 8).
According to this map, the area and proportion relationships of the areas corresponding to each risk level were extracted, as shown in Figure 9. The distribution range of the thaw settlement of the permafrost in the study area was found to be 0.02–4.89 m. Further, in the study region, the thaw settlement risk was mainly at the significant level: a total area of 3868.67 km2 fell into this category, accounting for 33.44% of the total study area. This was mainly distributed across the Chumar River Basin, Beiluhe River Basin, Gaerqu River Basin and Tanggula Mountain regions. Those regions with a high risk level covered a total area of 1594.21 km2, accounting for 13.78% of the total study region, and were mainly distributed across the Hoh Xil Mountain, Wuli Basin and Buqu River Valley regions. Those areas with a medium risk level amounted to a total area of 2456.10 km2, accounting for 21.23% of the total study region. This was mainly distributed across the Chiqu Valley and Buqu Valley regions, and slightly across the Tanggula Mountain region. Those areas with a low risk level covered a total area of 558.78 km2, accounting for only 4.83% of the total study region. This was mainly distributed across the Tuotuohe River Basin, Wenquan Fault Basin and Touerjiu Mountain regions. In general, the low-risk permafrost areas in the study region were very rare, with significant-risk areas being the main type of risk area. Therefore, the permafrost in the study region was generally found to have great thaw settlement risk.
The proportions of thaw settlement risk in each region are shown in Figure 10. It can be seen that the whole area of the Chumar River Plain was found to be a significant-risk area, meaning thaw settlement disasters are likely to occur. Further, the significant risk level was the highest risk level found for the Beiluhe Basin, Fenghuo Mountain, Wuli Basin, Kaixinling Mountain, Tongtianhe River Basin, Tanggula Mountain and Touerjiu Mountain regions. Among these, the proportions of significant risk in the Tongtianhe River Basin, Beiluhe Basin, Tanggula Mountain and Wuli Basin regions were 84.03%, 72.5%, 69.1% and 51.51%, respectively. In addition, the Tuotuohe Basin was found to be mainly a high-risk region, accounting for 53.28% of the region’s total area. The Chiqu Valley, Wenquan Fault Basin, Kunlun Mountain and Buqu River Valley regions were found to mainly have a medium risk level. The Hoh Xil Mountain region had the largest proportion of low-risk areas.
3.3. Influence Analysis of Ice Content
Ice content is the main factor that determines the thaw settlement coefficient, with the coefficient increasing as ice content increases. Therefore, ice content has a significant impact on thaw settlement. To explore their relationship, a probability distribution of the ice content and thaw settlement in different regions of the study area was analyzed through statistics, as shown in Figure 11.
It can be seen from Figure 11 that the average values of thaw settlement corresponding to the four types of ice content were 0.75 m, 0.78 m, 0.81 m and 0.82 m, respectively. Further, it can be seen that the probability curve shifts to the right as the ice content increases, which indicates that the thaw settlement in the study area increased as the ice content increased. Combined with the thaw settlement zoning distribution, it can be seen that the ice content was the main factor affecting the regional thaw settlement in the study region, especially in those areas with ice content characterized by an ice layer with soil inclusions; in these areas, thaw settlement was almost always found to be a significant risk.
4. Discussion
4.1. Error Analysis of RBF Neural Network Models
Through analysis of the model prediction results for the mean annual ground temperatures and active-layer thicknesses (as shown in Figure 5), comparisons of the predictive values and actual values were obtained, as shown in Figure 12.
The predictive values of the mean annual ground temperatures and active-layer thicknesses are basically within the ±15% error line, and the prediction error of the model was small. Equations (6)–(8) were used to evaluate the prediction results of the RBF neural network models, and the results are shown in Table 4.
It can be seen from Table 4 that for the RBF neural network prediction models of the mean annual ground temperatures and the active-layer thicknesses, the R2 values were 0.81 and 0.84, the MAE values were 0.27 and 0.11, and the RMSE values were 0.37 and 0.33, respectively. The models were found to have a good fitting effect and to be able to accurately predict the mean annual ground temperatures and active-layer thicknesses of permafrost in the Qinghai–Tibet engineering corridor.
In addition, the remote sensing data we used were 90 × 90 m, and the difference in resolution will have had an impact on the distribution of mean annual ground temperatures and active-layer thicknesses. If higher resolution data can be obtained for analysis in the future, the distribution of mean annual ground temperatures and active-layer thicknesses in the Qinghai–Tibet engineering corridor will be more accurate. The Qinghai–Tibet Plateau has a high altitude and complex landforms, but the terrain is relatively flat, so the error caused by the resolution is acceptable and will not cause significant differences in research results.
4.2. Analysis of Influencing Factors of Thaw Settlement
Next, the influencing characteristics of the 14 sections in the study area were analyzed, and the relationships between the ice content, elevation, equivalent latitude, surface temperature, vegetation index, latitude and thaw settlement were studied. Then the correlation coefficients between each factor and the thaw settlement were obtained, as shown in Table 5.
Table 5 shows the influence of each factor in the different regions. It is worth noting that the ice content showed a negative correlation only in the Wenquan Faulted Basin region. This may be because both the terrain and the ice content types in this region are complex, with it having a large distribution of the ice-poor and icy soil types; the ice-rich and ice-saturated types are also distributed across the region. Although the elevation, equivalent latitude, surface temperature, vegetation index and latitude were not the main influencing parameters with regards to the thaw settlement, certain influence relationships were still observed. The relationships of these parameters with the thaw settlement in their main areas of influence (elevation in the Chumar River Plain region, surface temperature in the Fenghuo Mountain region, vegetation index in the Hoh Xil Mountain region and latitude in the Tongtianhe Basin region) were analyzed separately, and the results are shown in Figure 13.
It can be seen from Figure 13 that although the influence of these parameters on the thaw settlement was not particularly strong, change trends (red arrows marked in Figure 13) can still be observed. In the Chumar River Plain region, elevation was the main factor affecting the thaw settlement, with the thaw settlement showing a downward trend with the increase in the elevation. This is because the terrain in this area is high but flat and mainly characterized by gullies and eolian dunes. The surface temperature in the Fenghuo Mountain region ranged from −3.1 to 1.3 °C, making it a mainly low-temperature permafrost area. There was a trend of surface temperature increases and permafrost degradation in this region, and as the surface temperature increased, the thaw settlement was found to also increase. The vegetation index was the main factor affecting the thaw settlement in the Hoh Xil Mountain region. The alpine grassland, alpine meadow and alpine marginal sparse vegetation types were the main types distributed in this area; it was also found to have a very small alpine desert area. Other vegetation types, such as the swamp meadow, mountain scrub and cushion vegetation types, were also distributed in this region. The latitude span of the Tongtianhe Basin region is large, and the thaw settlement increased with the increase in latitude in this region. While all these parameters have an impact on the thaw settlement, their specific relationships with thaw settlement need to be further studied.
In order to clarify the significance of the mean annual ground temperatures and active-layer thicknesses in the different regions, variance analysis was used, as shown in Table 6. The larger the F value and the smaller the Sig value, the more significant the factors.
As can be seen from Table 6, the areas where the mean annual ground temperatures have a significant impact are the Kunlun Mountains, Chumar River Plain, Fenghuo Mountain and Tongtianhe Basin regions. This is especially the case in the Chumar River Plain region: its F value was 7.497, and the impact is very significant. These areas have wide distributions of high-temperature, unstable permafrost and low-temperature, basically stable permafrost. Therefore, in those areas with mean annual ground temperatures between −2 and −0.5 °C, the impact of these temperatures on the thaw risk is more significant. Those areas where the active-layer thicknesses have a significant impact are mainly the Hoh Xil Mountain, Tuotuohe Basin, Kaixinling Mountain, Wenquan Faulted Basin and Tanggula Mountain regions. The active-layer thicknesses in these regions are basically all more than 2 m; therefore, high active-layer thicknesses have a more significant impact on the thaw settlement than lower thicknesses.
5. Conclusions
In this paper, the thaw settlement of permafrost in the Qinghai–Tibet engineering corridor was studied using the thaw depth and the thaw settlement coefficient. Further, the thaw settlement risk levels in various regions in the study area were determined, and a thaw settlement disaster risk zoning map of the study region was obtained. The following conclusions can be drawn from the study results:
- (1)
- Large thaw depth areas were widely distributed in the Qinghai–Tibet engineering corridor, among which thaw depths of more than 9 m were mainly distributed in the Gaerqu River Basin and Riachiqu River Basin, and thaw depths of 6–9 m were mainly distributed in the Beiluhe River Basin, Riachiqu River Basin and Buqu River Basin regions.
- (2)
- Thaw settlement risk was divided into four risk levels, namely significant risk (I ≥ 0.5), high risk (0.25 ≤ I < 0.5), medium risk (0.1 ≤ I < 0.25) and low risk (I < 0.1) levels, with the areas of these four risk levels covering 3868.67 km2, 1594.21 km2, 2456.10 km2 and 558.78 km2, respectively. The main thaw settlement risk in the Qinghai–Tibet engineering corridor was the significant risk level, which was distributed across the Chumar River Basin, Beiluhe River Basin, Gaerqu River Basin and Tanggula Mountain regions.
- (3)
- Ice content was found to be the most significant influence factor of regional thaw settlement, while the elevation, surface temperature, vegetation index and latitude factors also had an impact on the thaw settlement, although their specific relationships with thaw settlement need to be further studied.
This study established a quantitative prediction model of thaw settlement risk in the Qinghai–Tibet engineering corridor and analyzed the region’s risk distribution characteristics. While it should therefore hold great reference value for the construction of permafrost subgrade, the study did have some deficiencies. The accuracy of the prediction model still needs to be further improved, and as ice content plays an important role in thaw settlement risk, its risk effects in different regions with different risk levels should be analyzed in more detail in future studies.
Author Contributions
Conceptualization, Z.L. and J.C.; methodology, Z.L., F.C., Y.Z. and J.C.; writing—original draft, Z.L., W.Z. and Y.Z.; writing—review and editing, F.C., Y.Z. and J.L.; investigation, J.C. and W.Z.; resources, J.C., H.Y. and W.Z.; data curation, Z.L. and Y.Z.; formal analysis, J.L., H.Y. and J.C.; validation, Y.Z. and J.C. All authors have read and agreed to the published version of the manuscript.
Funding
This research was supported by the National Natural Science Foundation of China (Grant No. 42230712, 51574037), the Natural Science Foundation of Shaanxi Province (Grant No. 2022JM-143) and the Fundamental Research Funds for the Central Universities, CHD (Grant No. 300102262104).
Data Availability Statement
Data will be made available on request.
Acknowledgments
We are grateful to the editors and anonymous reviewers who provided constructive comments in order to improve this manuscript.
Conflicts of Interest
The authors declare no conflict of interest.
References
- Zhao, L.; Wu, T.H.; Xie, C.W.; Li, R.; Wu, X.D.; Yao, J.M.; Yue, G.Y.; Xiao, Y. Permafrost survey and monitoring provide scientific support for geoscience research, environmental protection and engineering construction in the Qinghai Tibet Plateau. J. Chin. Acad. Sci. 2017, 32, 1159–1168. [Google Scholar] [CrossRef]
- Akhtar, S.; Hollaender, H.; Yuan, Q.Y. Impact of heat and contaminants transfer from landfills to permafrost subgrade in arctic climate: A review. Cold Reg. Sci. Technol. 2023, 206, 103737. [Google Scholar] [CrossRef]
- Varlamov, S.P. Thermal monitoring of railway subgrade in a region of ice-rich permafrost, Yakutia, Russia. Cold Reg. Sci. Technol. 2018, 155, 184–192. [Google Scholar] [CrossRef]
- Ahmed, A.; Islam, M.A. Effect of using geosynthetics in mitigation of freeze-thaw through numerical analysis. In Proceedings of the 4th Session on Geotechnical Earthquake Engineering and Special Topics at Geo-Congress on Vision, Insight, Outlook, Minneapolis, MN, USA, 25–28 February 2020. [Google Scholar] [CrossRef]
- Antonovskaya, G.N.; Orlova, I.P.; Kapustian, N.K. Ultralow-frequency seismic sounding of railway subgrade state by passing trains. Can. Geotech. J. 2022, 59, 2151–2162. [Google Scholar] [CrossRef]
- Bommer, C.; Fitze, P.; Schneider, H. Thaw-Consolidation Effects on the Stability of Alpine Talus Slopes in Permafrost. Permafr. Periglac. Process. 2012, 23, 267–276. [Google Scholar] [CrossRef]
- Patton, A.I.; Rathburn, S.L.; Capps, D.M. Ongoing Landslide Deformation in Thawing Permafrost. Geophys. Res. Lett. 2021, 48, 16. [Google Scholar] [CrossRef]
- Weinstein, Y.; Rotem, D.; Kooi, H. Radium isotope fingerprinting of permafrost—Applications to thawing and intra-permafrost processes. Permafr. Periglac. Process. 2019, 30, 104–112. [Google Scholar] [CrossRef]
- Erik, R.; Pullman, M.; Torre, J.; Yuri, S. Thaw settlement in soils of the arctic coastal plain, alaska. Arct. Antarct. Alp. Res. 2007, 39, 468–476. [Google Scholar]
- Song, Y.; Jin, L.; Wang, H.B. Vegetation Changes along the Qinghai-Tibet Plateau Engineering Corridor Since 2000 Induced by Climate Change and Human Activities. Remote Sens. 2018, 10, 95. [Google Scholar] [CrossRef] [Green Version]
- Pandey, A.C.; Ghosh, T.; Parida, B.R. Modeling Permafrost Distribution Using Geoinformatics in the Alaknanda Valley, Uttarakhand, India. Sustainability 2022, 14, 15731. [Google Scholar] [CrossRef]
- Osokin, A.B. Permafrost Temperature Dynamics in Subgrade and Foundation Reliability Enhancement. Soil Mech. Found. Eng. 2015, 52, 282–285. [Google Scholar] [CrossRef]
- Dashjamts, D.; Altantsetseg, J. Research on consolidation of frozen soils upon thawing. In Proceedings of the 2011 6th International Forum on Strategic Technology, Harbin, China, 22–24 August 2011. [Google Scholar] [CrossRef]
- Ma, W.; Wen, Z.; Sheng, Y.; Wu, Q.B.; Wang, D.Y.; Feng, W.J. Remedying embankment thaw settlement in a warm permafrost region with thermosyphons and crushed rock revetment. Can. Geotech. J. 2012, 49, 1005–1014. [Google Scholar] [CrossRef]
- Sun, Z.Z.; Ma, W.; Zhang, S.J.; Mu, Y.H.; Yun, H.B.; Wang, H.L. Characteristics of thawed interlayer and its effect on embankment settlement along the Qinghai-Tibet Railway in permafrost regions. J. Mt. Sci. 2018, 15, 1090–1100. [Google Scholar] [CrossRef]
- Yu, G.M.; Ge, R.X.; Zeng, X.K.; Yu, Y.N.; Zhang, Z.; Meng, X.G.; Qin, Y.J. Particularity and prediction method of ground settlement caused by subway tunnel construction in permafrost area. Transp. Soil Eng. Cold Reg. 2020, 49, 531–539. [Google Scholar] [CrossRef]
- Wang, D.R.; Tighe, S.L.; Yin, S.D. Preliminary analysis of permafrost degradation in Ingraham Trail, Northwest Territories. In Proceedings of the Canadian Society of Civil Engineering Annual Conference, Singapore, 18 May 2022. [Google Scholar] [CrossRef]
- Hjort, J.; Streletskiy, D.; Dore, G. Impacts of permafrost degradation on infra-structure. Nat. Rev. Earth Environ. 2022, 3, 24–38. [Google Scholar] [CrossRef]
- Niu, F.J.; Ma, W.; Wu, Q.B. Thermal stability and freezing-thawing hazards of main permafrost roadbed projects on Qinghai-Tibet Railway. J. Earth Sci. Environ. 2011, 33, 196–206. [Google Scholar]
- Ruan, G.F.; Zhang, J.M.; Chai, M.T. Research on Risk zoning of melt-sink disaster in Qinghai-Tibet Engineering Corridor under climate change. J. Glaciol. Geocryol. 2014, 36, 811–817. [Google Scholar]
- Hong, E.; Perkins, R.; Trainor, S. Thaw Settlement Hazard of Permafrost Related to Climate Warming in Alaska. Arctic 2014, 67, 93–103. [Google Scholar] [CrossRef] [Green Version]
- Zaretskii, Y.K. Scientific legacy of NA Tsytovich. Soil Mech. Found. Eng. 2000, 37, 131–139. [Google Scholar] [CrossRef]
- Tang, L.Y.; Yang, L.J.; Wang, X.G.; Yang, G.S.; Ren, X.; Li, Z.; Li, G.Y. Numerical analysis of frost heave and thawing settlement of the pile–soil system in degraded permafrost region. Environ. Earth Sci. 2021, 80, 693. [Google Scholar] [CrossRef]
- Liu, X.L.; Chen, Y.X.; Meng, Q.L.; Song, J.B.; Zhang, X.M. Thaw settlement of runways in permafrost regions under aircraft load. Eur. J. Environ. Civ. Eng. 2022, 27, 500–518. [Google Scholar] [CrossRef]
- Ni, J.; Wu, T.; Zhu, X.; Wu, X.; Pang, Q.; Zou, D.; Chen, J.; Li, R.; Hu, G.; Du, Y.; et al. Risk assessment of potential thaw settlement hazard in the permafrost regions of Qinghai-Tibet Plateau. Sci. Total Environ. 2021, 776, 145855. [Google Scholar] [CrossRef]
- Sun, Z.; Zhao, L.; Hu, G.; Zhou, H.; Liu, S.; Qiao, Y.; Du, E.; Zou, D.; Xie, C. Numerical Simulation of Thaw Settlement and Permafrost Changes at Three Sites Along the Qinghai-Tibet Engineering Corridor in a Warming Climate. Geophys. Res. Lett. 2022, 49, 10. [Google Scholar] [CrossRef]
- Yang, B.; Liu, H.X.; Kang, E.L. Spatio-temporal Cokriging method for assimilating and downscaling multi-scale remote sensing data. Remote Sens. Environ. 2021, 255, 112190. [Google Scholar] [CrossRef]
- Hassan, W.; Raza, M.F.; Alshameri, B. Statistical interpolation and spatial mapping of geotechnical soil parameters of District Sargodha, Pakistan. Bull. Eng. Geol. Environ. 2023, 82, 37. [Google Scholar] [CrossRef]
- Zhang, J.M. Research on the Stability of Frozen Soil Roadbeds in the Qinghai Tibet Plateau and the Classification of Permafrost in Highway Engineering. Ph.D. Thesis, Institute of Environment and Engineering in Cold and Dry Regions, Chinese Academy of Sciences, Beijing, China, 2004. [Google Scholar]
- Cui, F.Q.; Chen, J.B.; Liu, Z.Y.; Zhu, W.; Wang, W.; Zhang, W. Prediction Model of Thermal Thawing Sensibility and Thaw Depth for Permafrost Embankment along the Qinghai-Tibet Engineering Corridor Using MODIS Data. J. Sens. 2020, 2020, 8819476. [Google Scholar] [CrossRef]
- Luo, J.; Lin, Z.J.; Yin, G.A.; Niu, F.J.; Liu, M.H.; Gao, Z.Y.; Fan, X.W. The ground thermal regime and permafrost warming at two upland, sloping, and undisturbed sites, Kunlun Mountain, Qinghai-Tibet Plateau. Cold Reg. Sci. Technol. 2019, 167, 102862. [Google Scholar] [CrossRef]
- Way, R.G.; Lewkowicz, A.G. Environmental controls on ground temperature and permafrost in Labrador, northeast Canada. Permafr. Periglac. Process. 2018, 29, 73–85. [Google Scholar] [CrossRef]
- Zorigt, M.; Kwadijk, J.; Van-Beek, E.; Kenner, S. Estimating thawing depths and mean annual ground temperatures in the Khuvsgul region of Mongolia. Environ. Earth Sci. 2016, 75, 10. [Google Scholar] [CrossRef]
- Yang, K. Variation and numerical simulation of temperature field in permafrost subgrade. China Sci. Technol. Inf. 2022, 14, 81–83. [Google Scholar] [CrossRef]
- Chaves, D.A.; Lyra, G.B.; Francelino, M.R.; Silva, L.D.B.; Thomazini, A.; Schaefer, C.E.G.R. Active layer and permafrost thermal regime in a patterned ground soil in Maritime Antarctica, and relationship with climate variability models. Sci. Total Environ. 2017, 584, 572–585. [Google Scholar] [CrossRef]
- Baral, P.; Haq, M.A. Spatial prediction of permafrost occurrence in Sikkim Himalayas using logistic regression, random forests, support vector machines and neural networks. Geomorphology 2020, 371, 107331. [Google Scholar] [CrossRef]
- Deluigi, N.; Lambiel, C.; Kanevski, M. Data-driven mapping of the potential mountain permafrost distribution. Sci. Total Environ. 2017, 590, 370–380. [Google Scholar] [CrossRef] [PubMed] [Green Version]
- Aalto, J.; Karjalainen, O.; Hjort, J.; Luoto, M. Statistical Forecasting of Current and Future Circum-Arctic Ground Temperatures and Active Layer Thickness. Geophys. Res. Lett. 2018, 45, 4889–4898. [Google Scholar] [CrossRef] [Green Version]
- Ni, J.; Wu, T.; Zhu, X.; Hu, G.; Zou, D.; Wu, X.; Li, R.; Xie, C.; Qiao, Y.; Pang, Q.; et al. Simulation of the Present and Future Projection of Permafrost on the Qinghai-Tibet Plateau with Statistical and Machine Learning Models. J. Geophys. Res.-Atmos. 2021, 126, 2. [Google Scholar] [CrossRef]
- Wang, L. Principle, classification and application of artificial neural network. J. Inf. Sci. Technol. 2014, 360, 240–241. [Google Scholar] [CrossRef]
- Pang, Q.Q.; Li, S.X.; Wu, T.H.; Zhang, W.G. Simulation of active layer thickness distribution in permafrost area of Qinghai-Tibet Plateau. J. Glaciol. Geocryol. 2006, 28, 390–395. [Google Scholar]
- Bang-Andreasen, T.; Schostag, M.; Prieme, A.; Elberling, B.; Jacobsen, C.S. Potential microbial contamination during sampling of permafrost soil assessed by tracers. Sci. Rep. 2017, 7, 43338. [Google Scholar] [CrossRef]
- Morgalev, Y.N.; Lushchaeva, I.V.; Morgaleva, T.G.; Kolesnichenko, L.G.; Loiko, S.V.; Krickov, I.V.; Lim, A.; Raudina, T.V. Bacteria primarily metabolize at the active layer/permafrost border in the peat core from a permafrost region in western Siberia. Polar Biol. 2017, 40, 1645–1659. [Google Scholar] [CrossRef]
- Liu, Z.Y.; Huang, C.; Yu, H.; Zhong, Z.T.; Cui, F.Q. Prediction model and distribution characteristics of active layer thickness in Qinghai-Tibet Engineering Corridor. J. Glaciol. Geocryol. 2021, 43, 1458–1467. [Google Scholar] [CrossRef]
- Peng, H.; Ma, W.; Mu, Y.H. Qinghai-Tibet highway ordinary fill subgrade deformation characteristics and the roadbed disease investigation analysis. Rock Soil Mech. 2015, 4, 2049–2056. [Google Scholar] [CrossRef]
- Wu, Y.H. The first phase of Publicity and Implementation Meeting of Design Code for Highway Subgrade JTG D30—2015 was successfully held in Guangzhou. Eng. Constr. Stand. 2015, 198, 70. [Google Scholar] [CrossRef]
- Ku, X.B.; Dong, X.F.; Wu, Q.B. Analysis of engineering complexity in permafrost regions of Qinghai—Tibet railway. J. Eng. Geol. 2007, 62, 739–745. [Google Scholar] [CrossRef]
Figure 1.
Distribution of monitoring points in the study area.
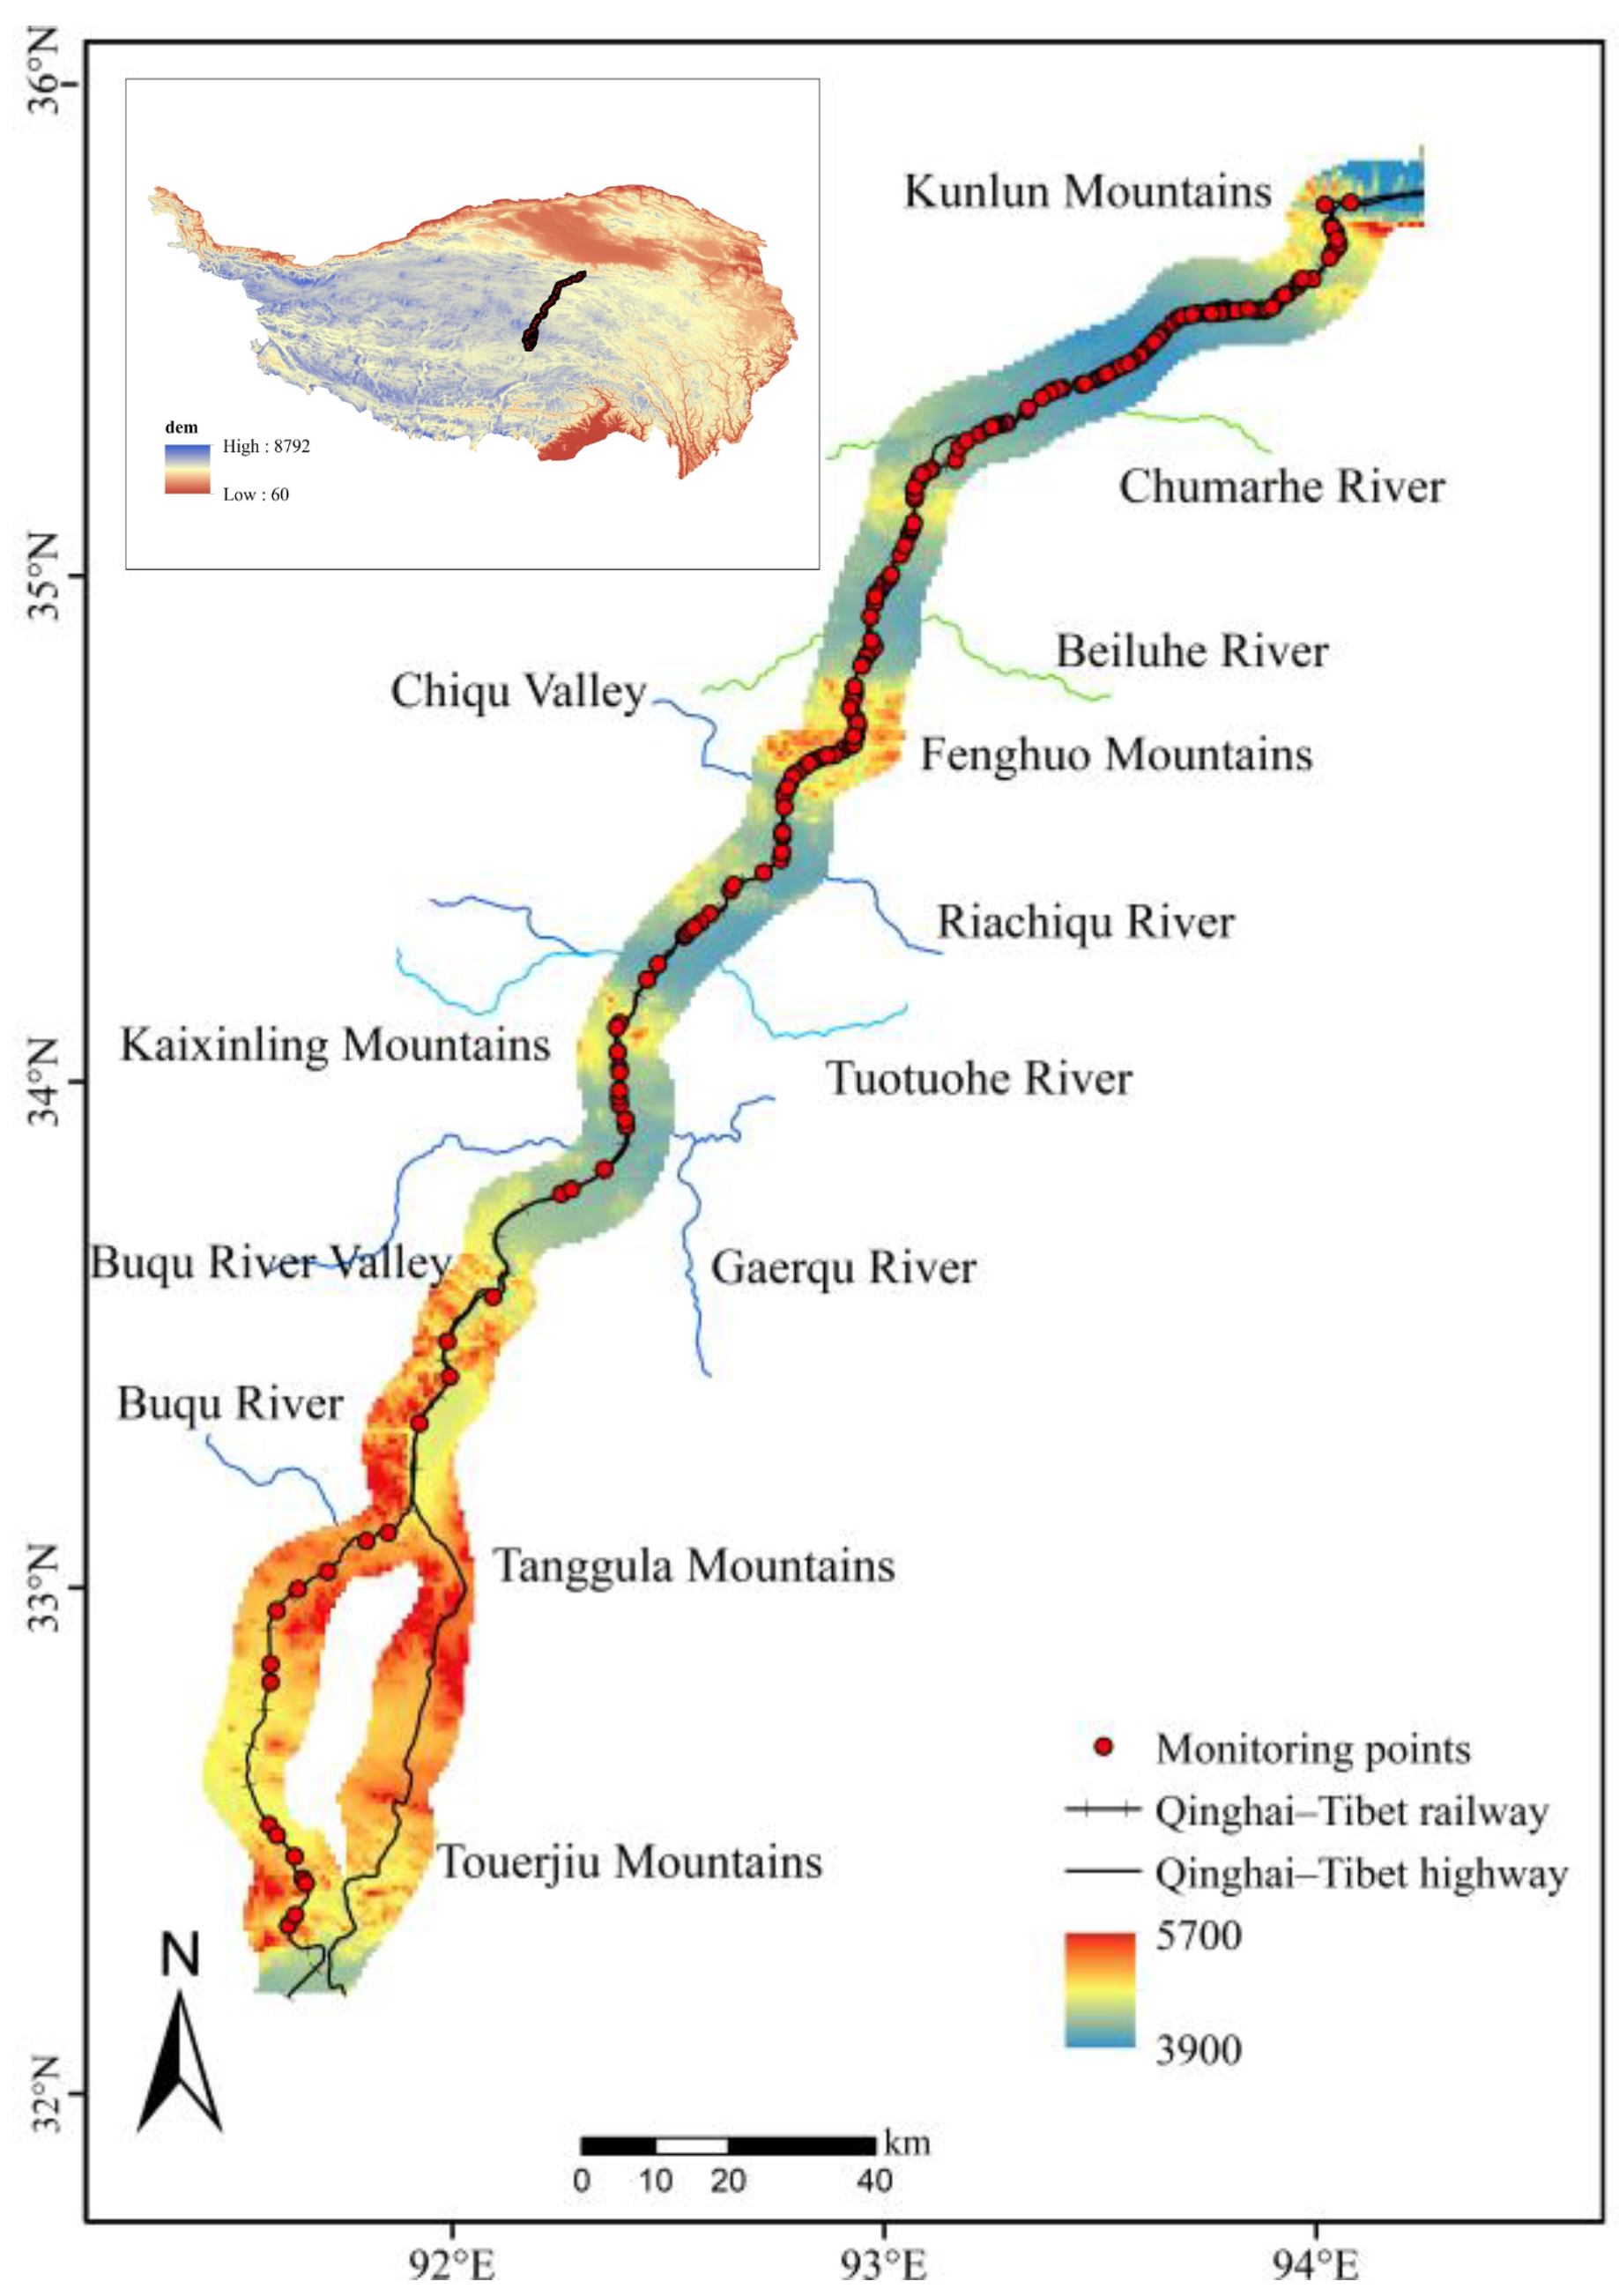
Figure 2.
On-site drilling detection diagram.
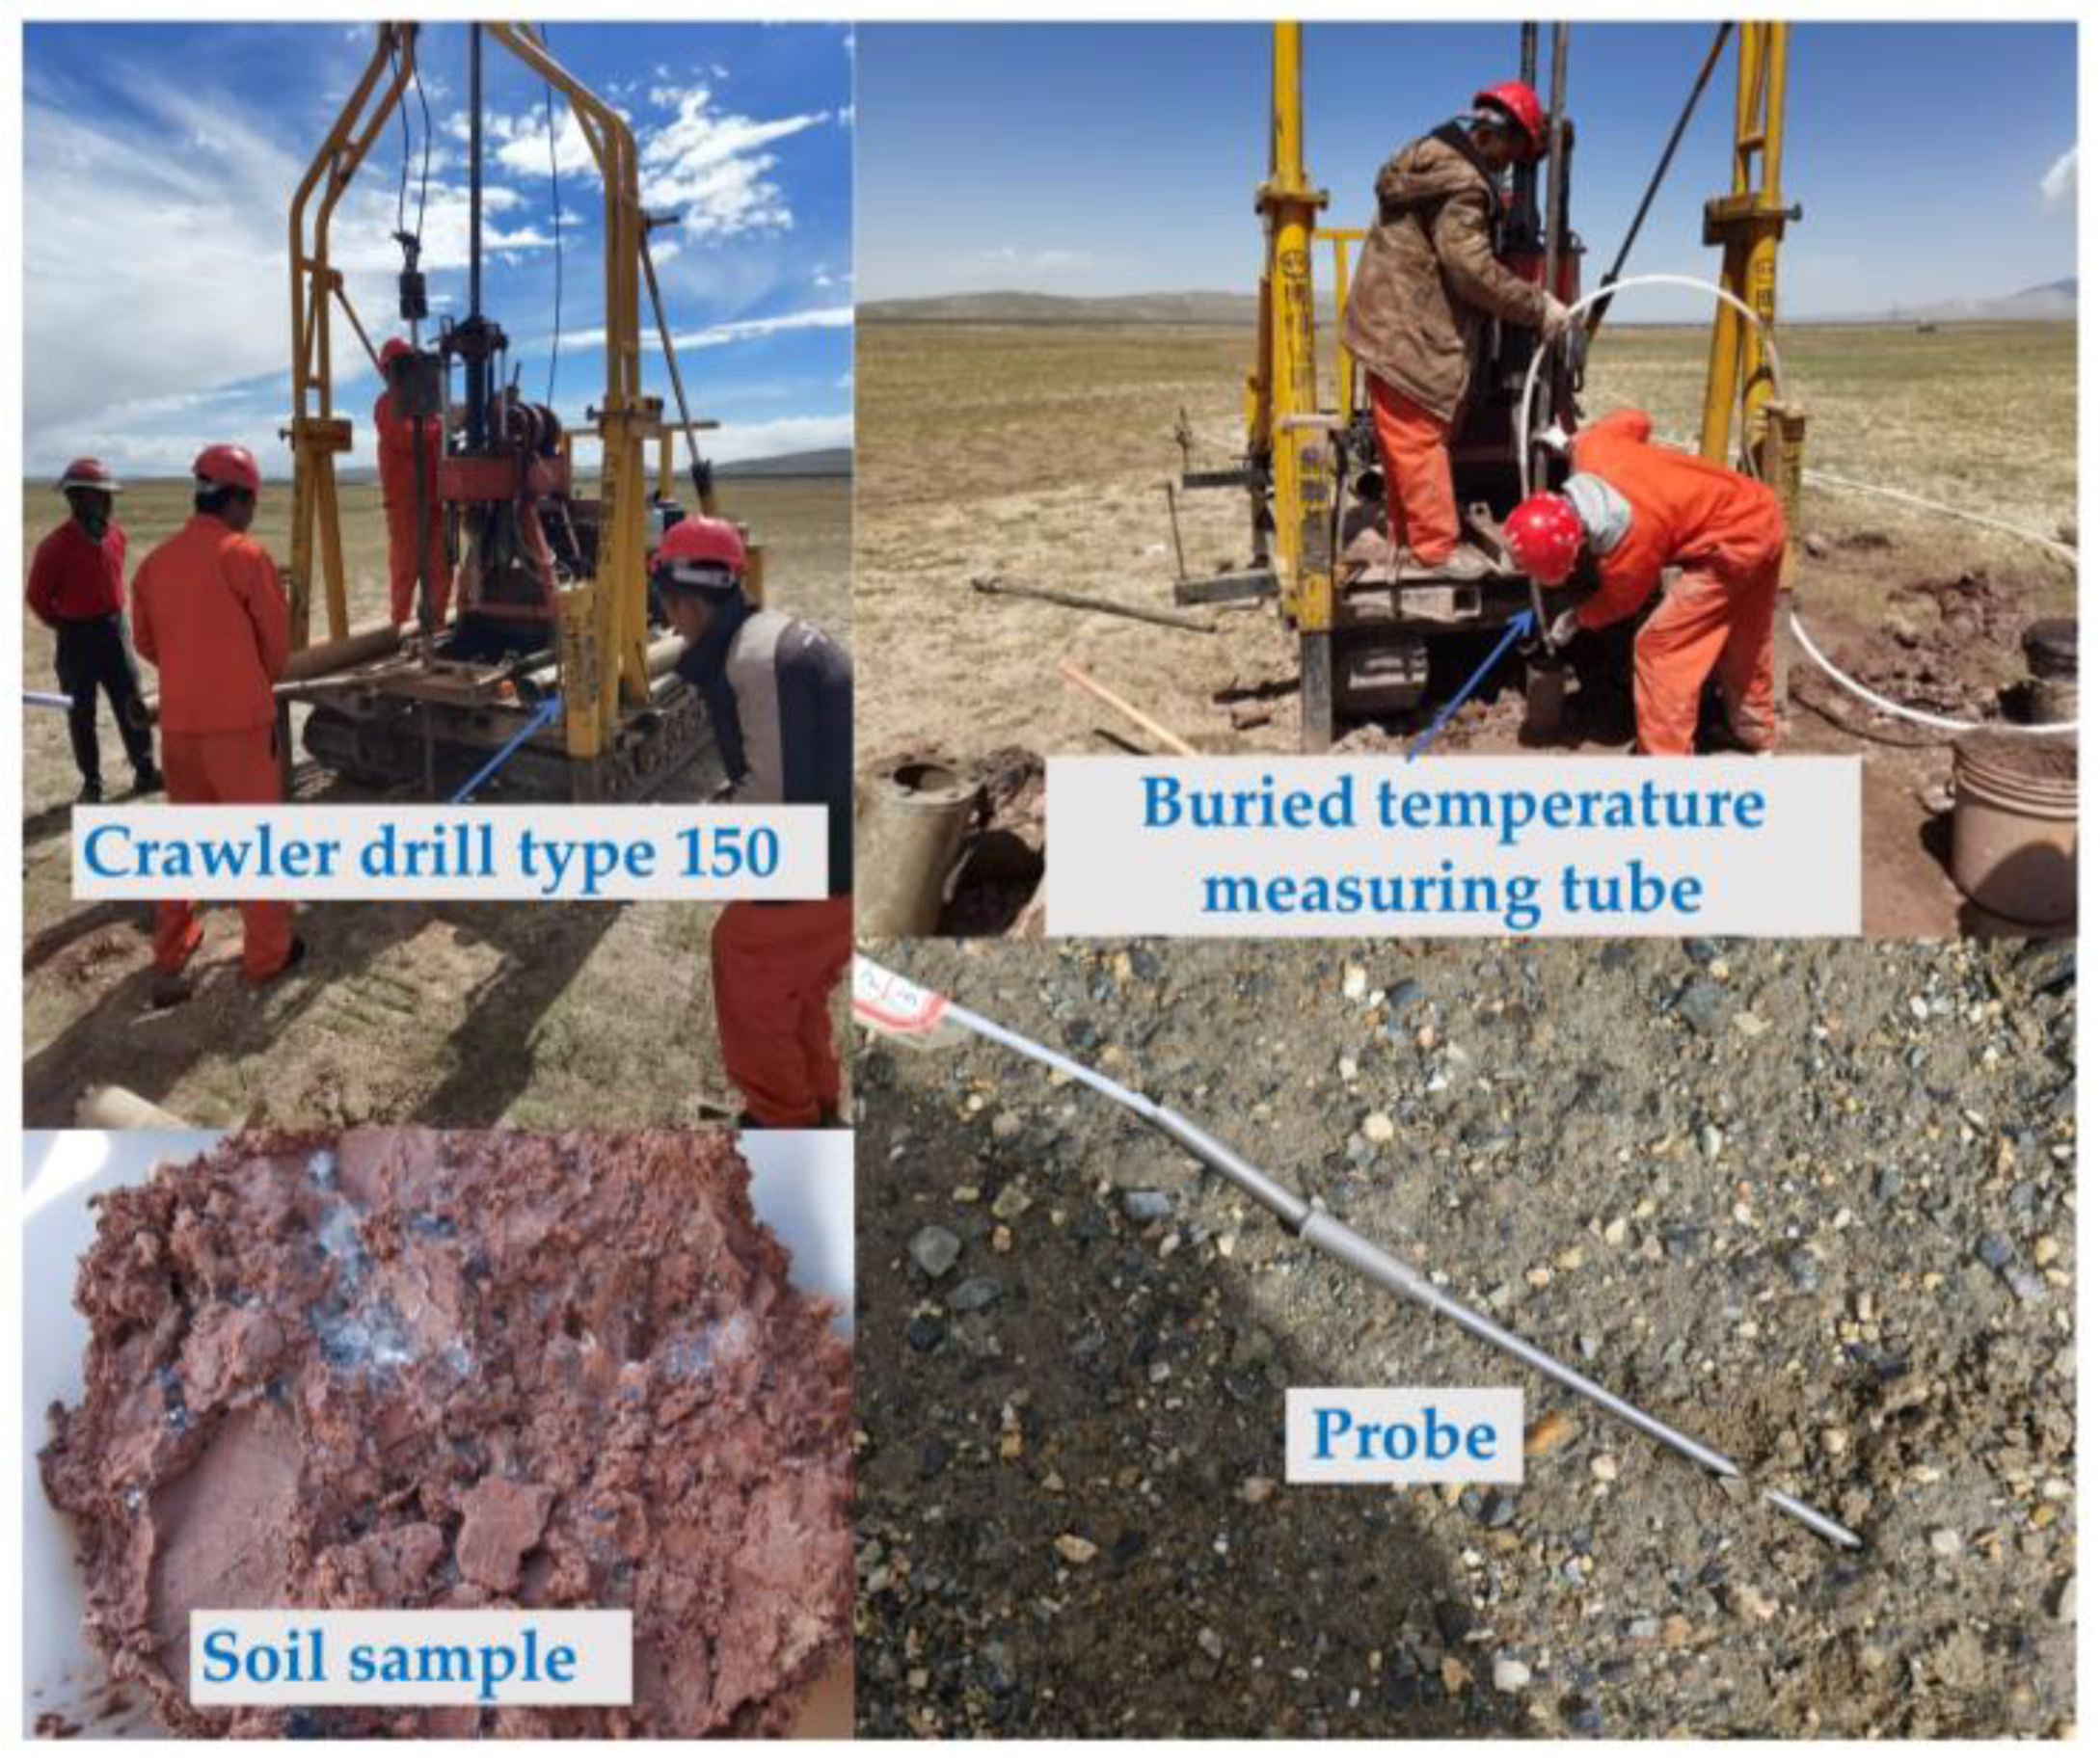
Figure 3.
Ice content distribution in the study area.

Figure 4.
Calculation process of thaw settlement.
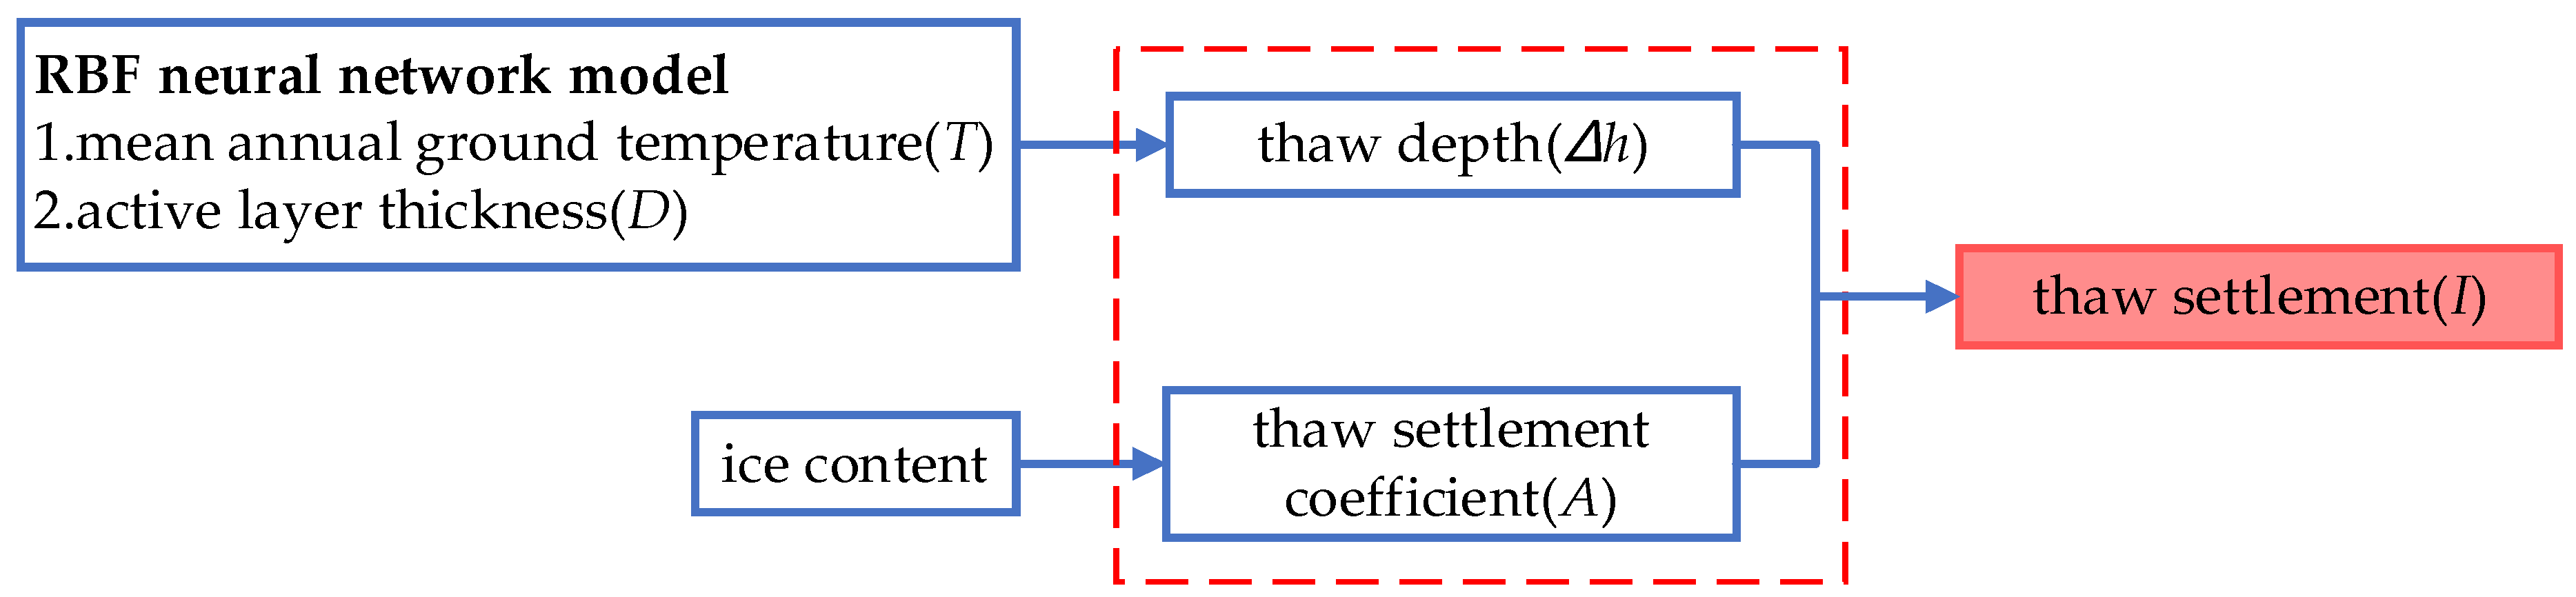
Figure 5.
Structure diagram of RBF neural network model: (a) mean annual ground temperature RBF neural network model; (b) active-layer thickness.
Figure 5.
Structure diagram of RBF neural network model: (a) mean annual ground temperature RBF neural network model; (b) active-layer thickness.
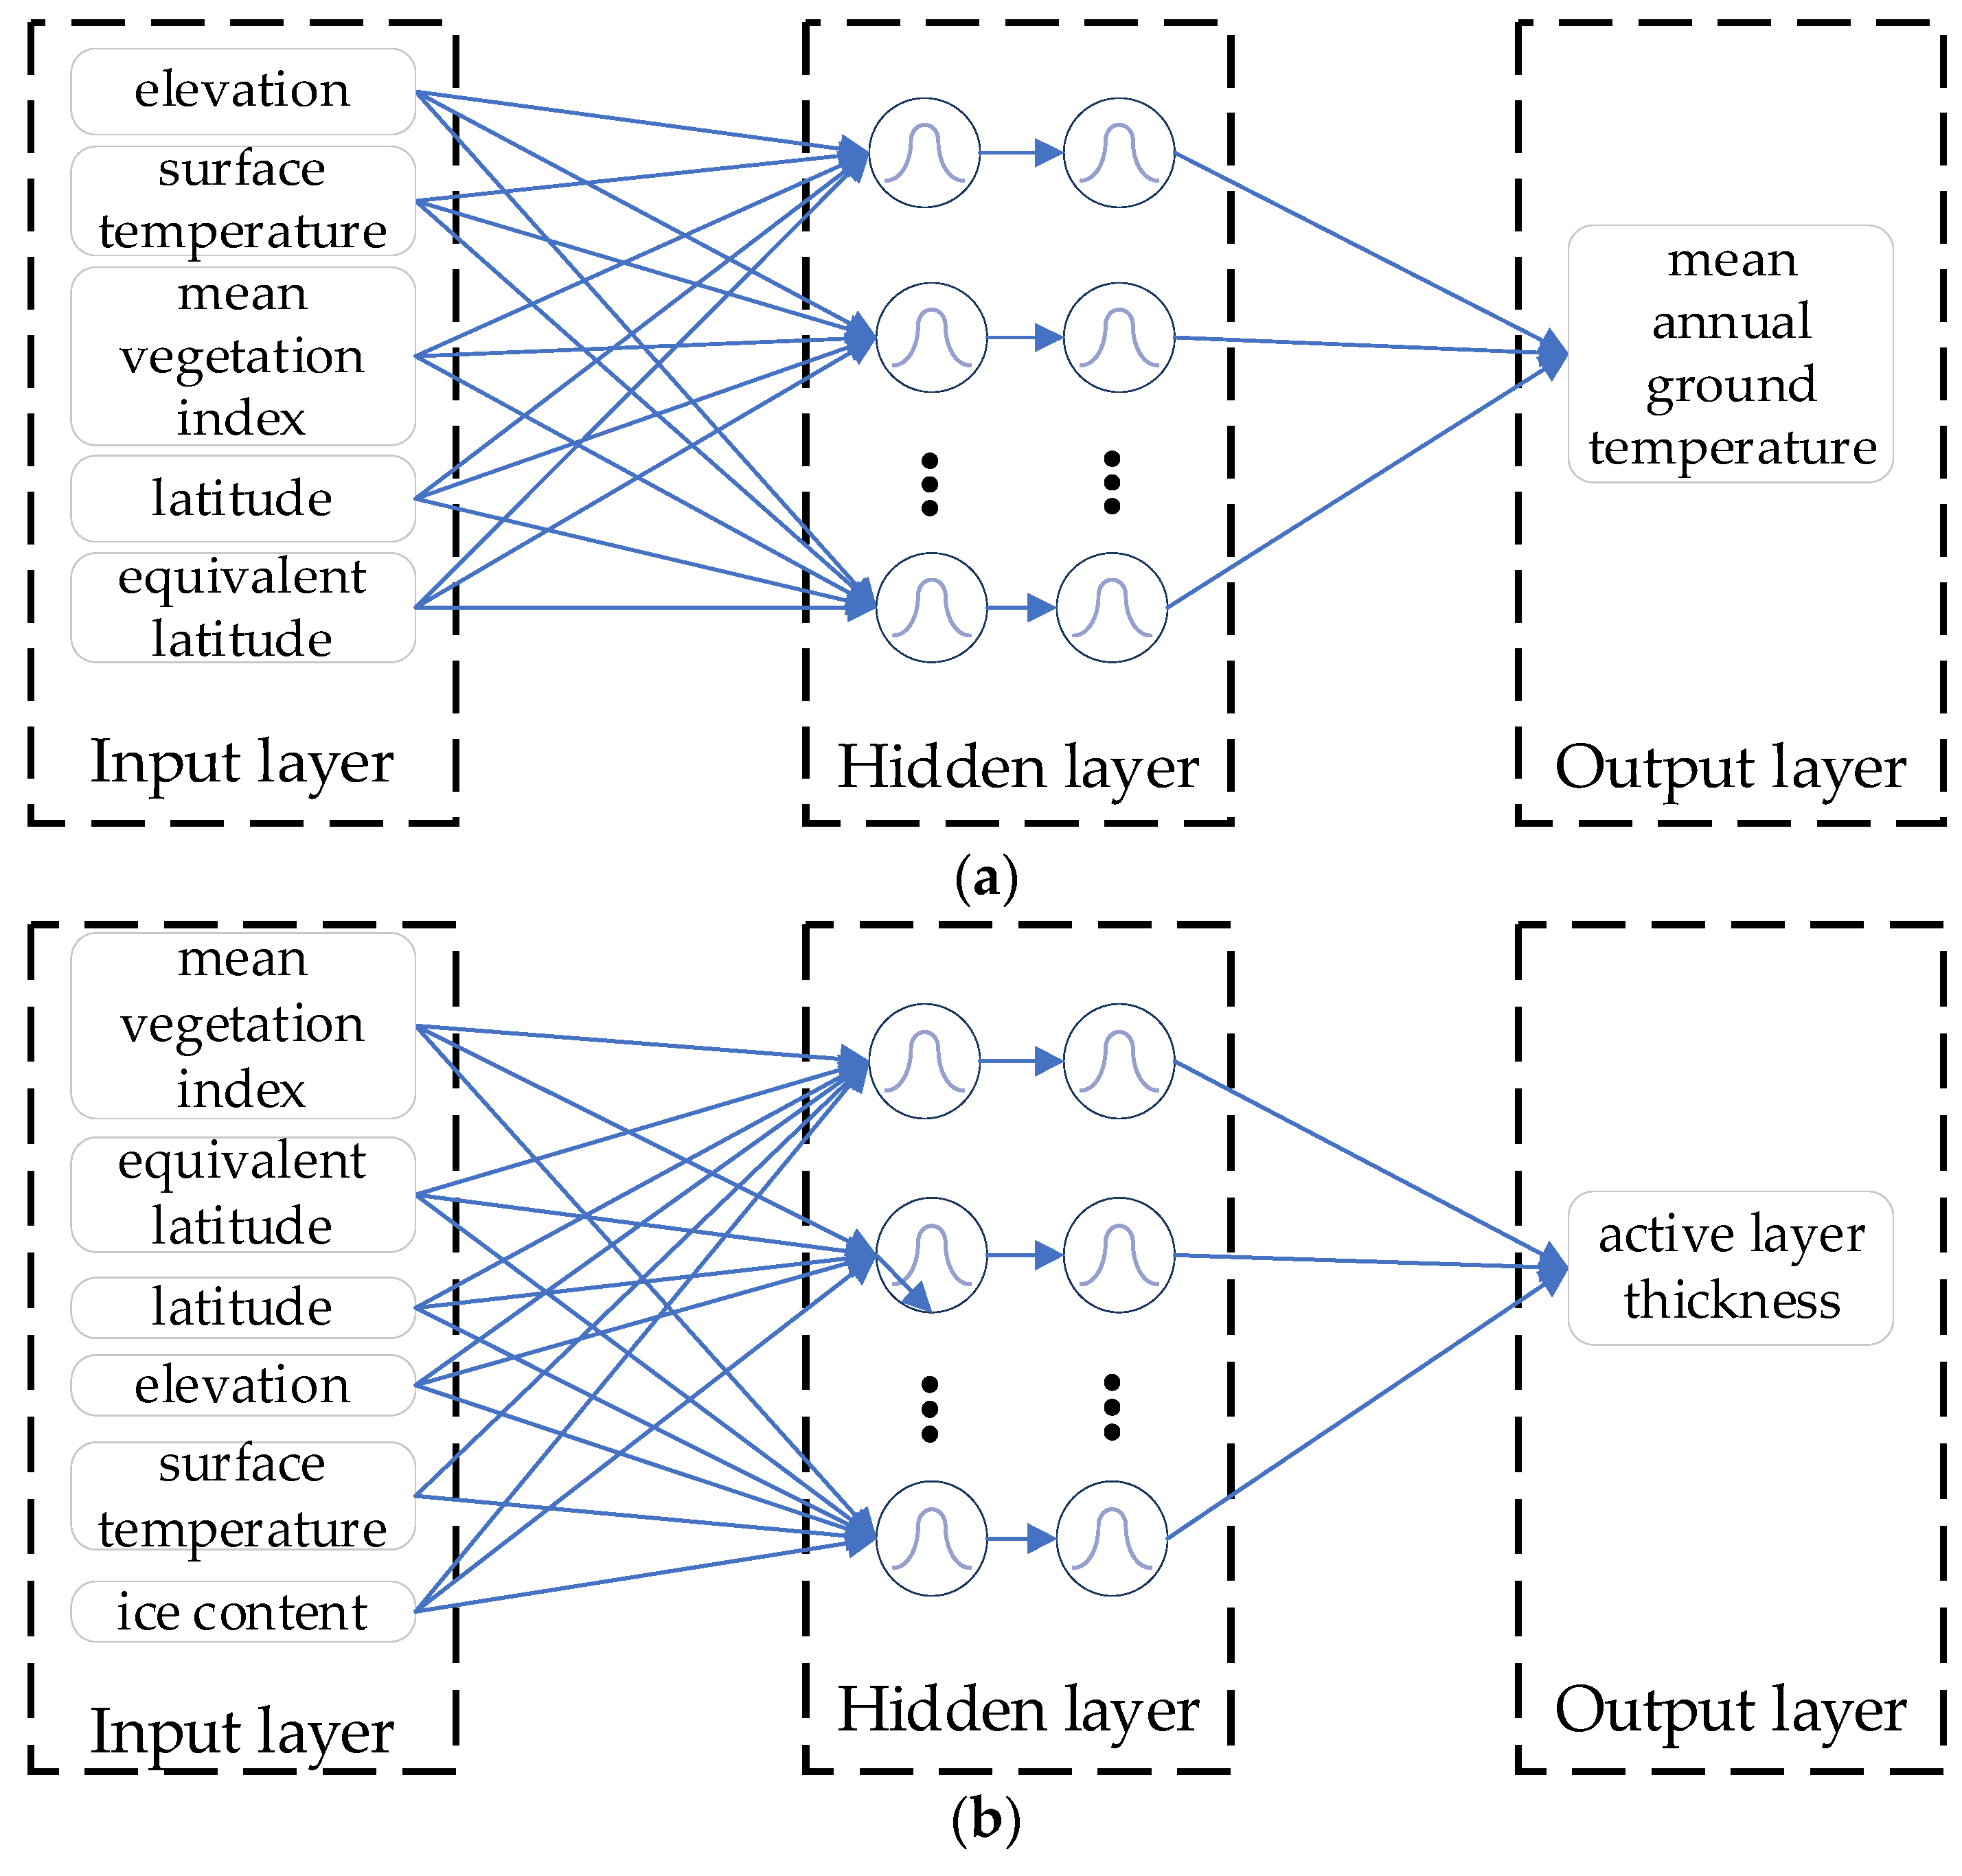
Figure 6.
Distribution maps: (a) mean annual ground temperature; (b) active-layer thickness.

Figure 7.
Thaw depth distribution in the study area.

Figure 8.
Thaw settlement risk distribution in the study area.
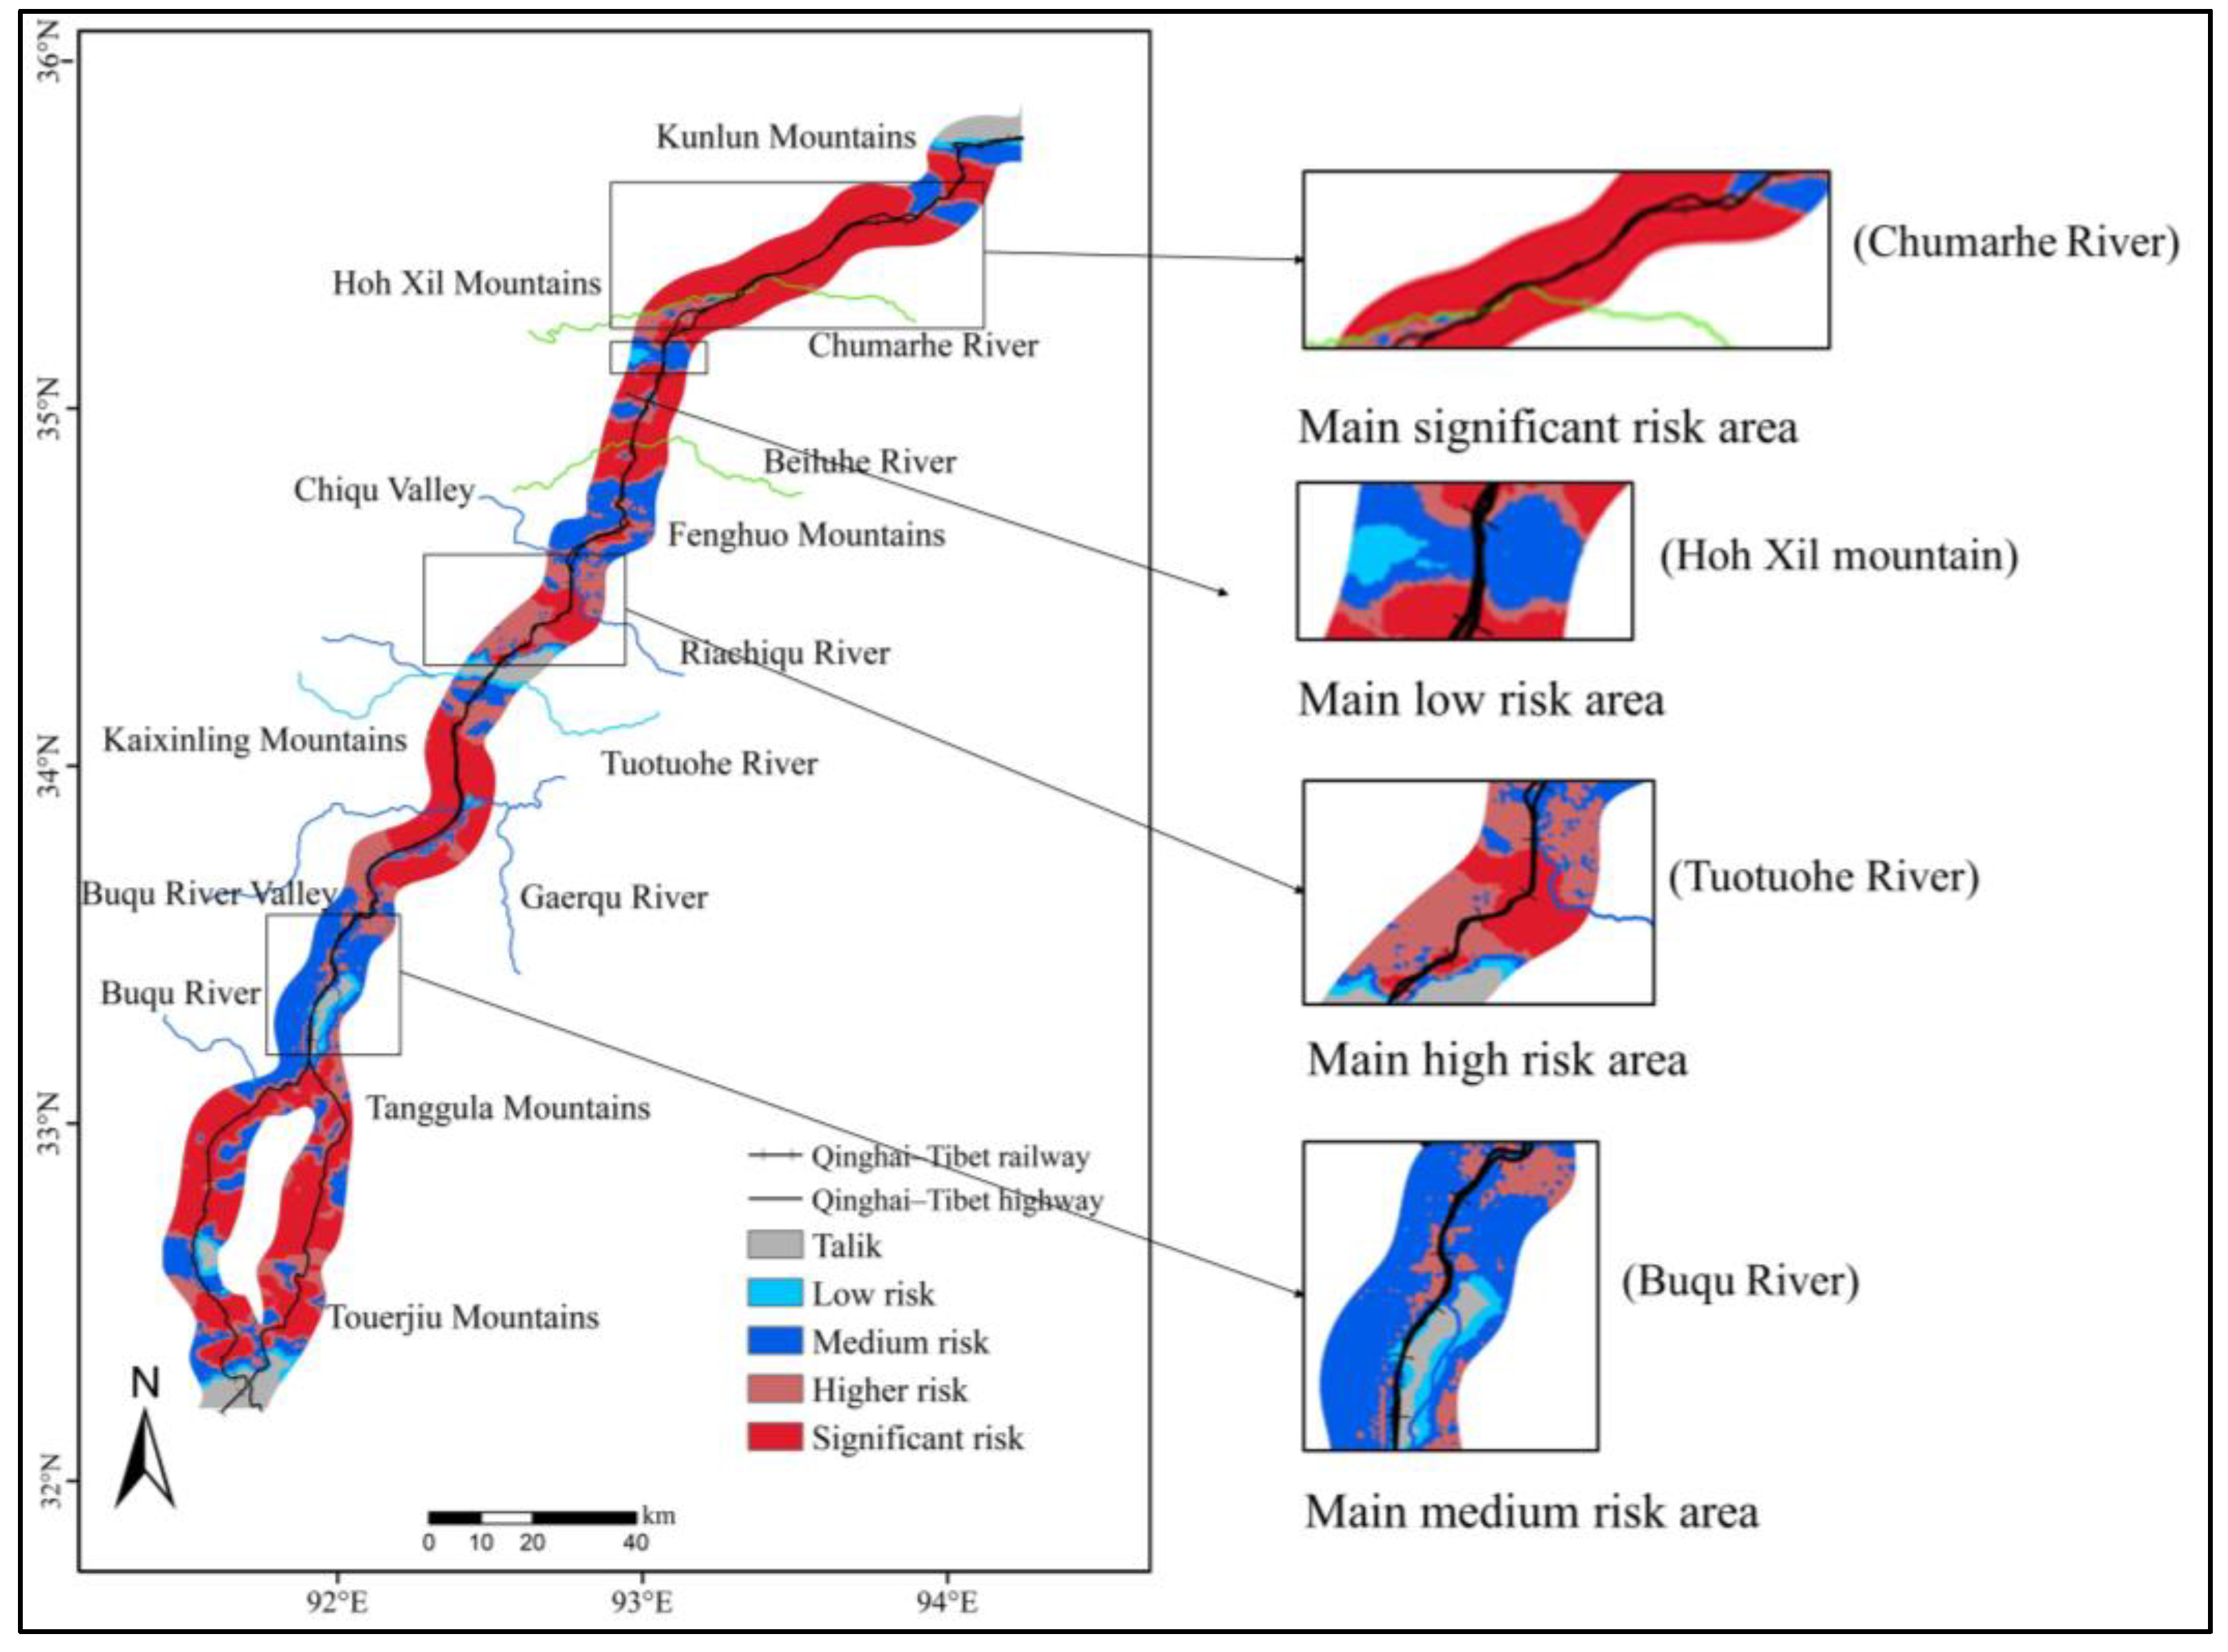
Figure 9.
Areas and proportions of various types of risk in the study area.
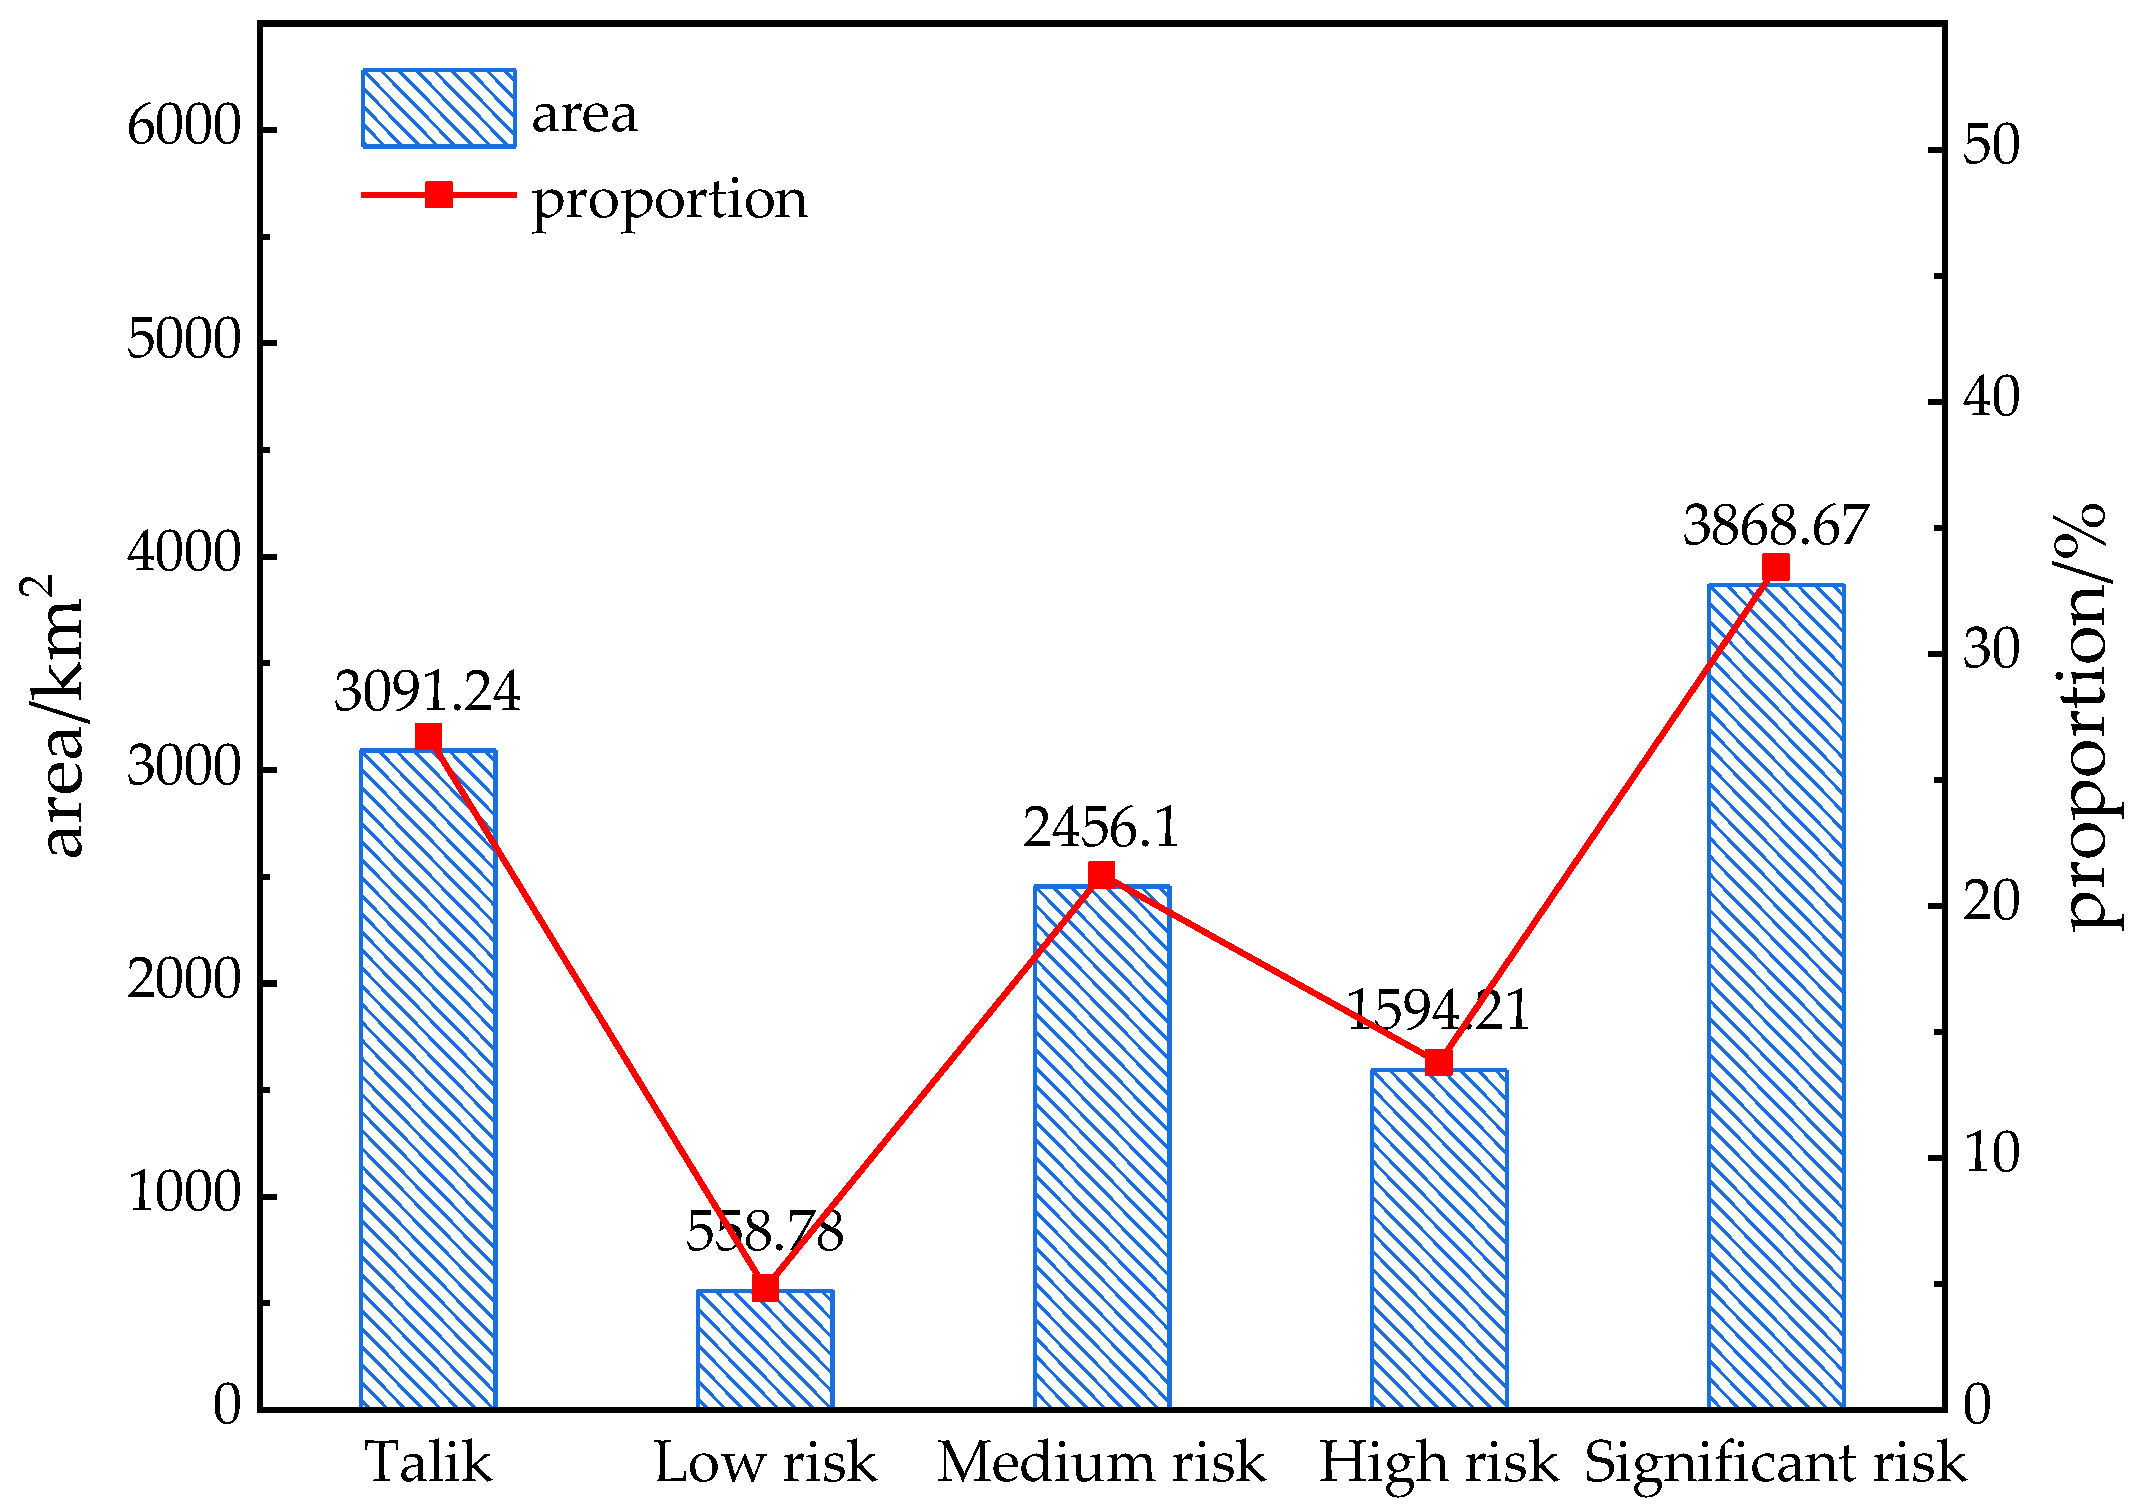
Figure 10.
The proportions of risk in different regions.
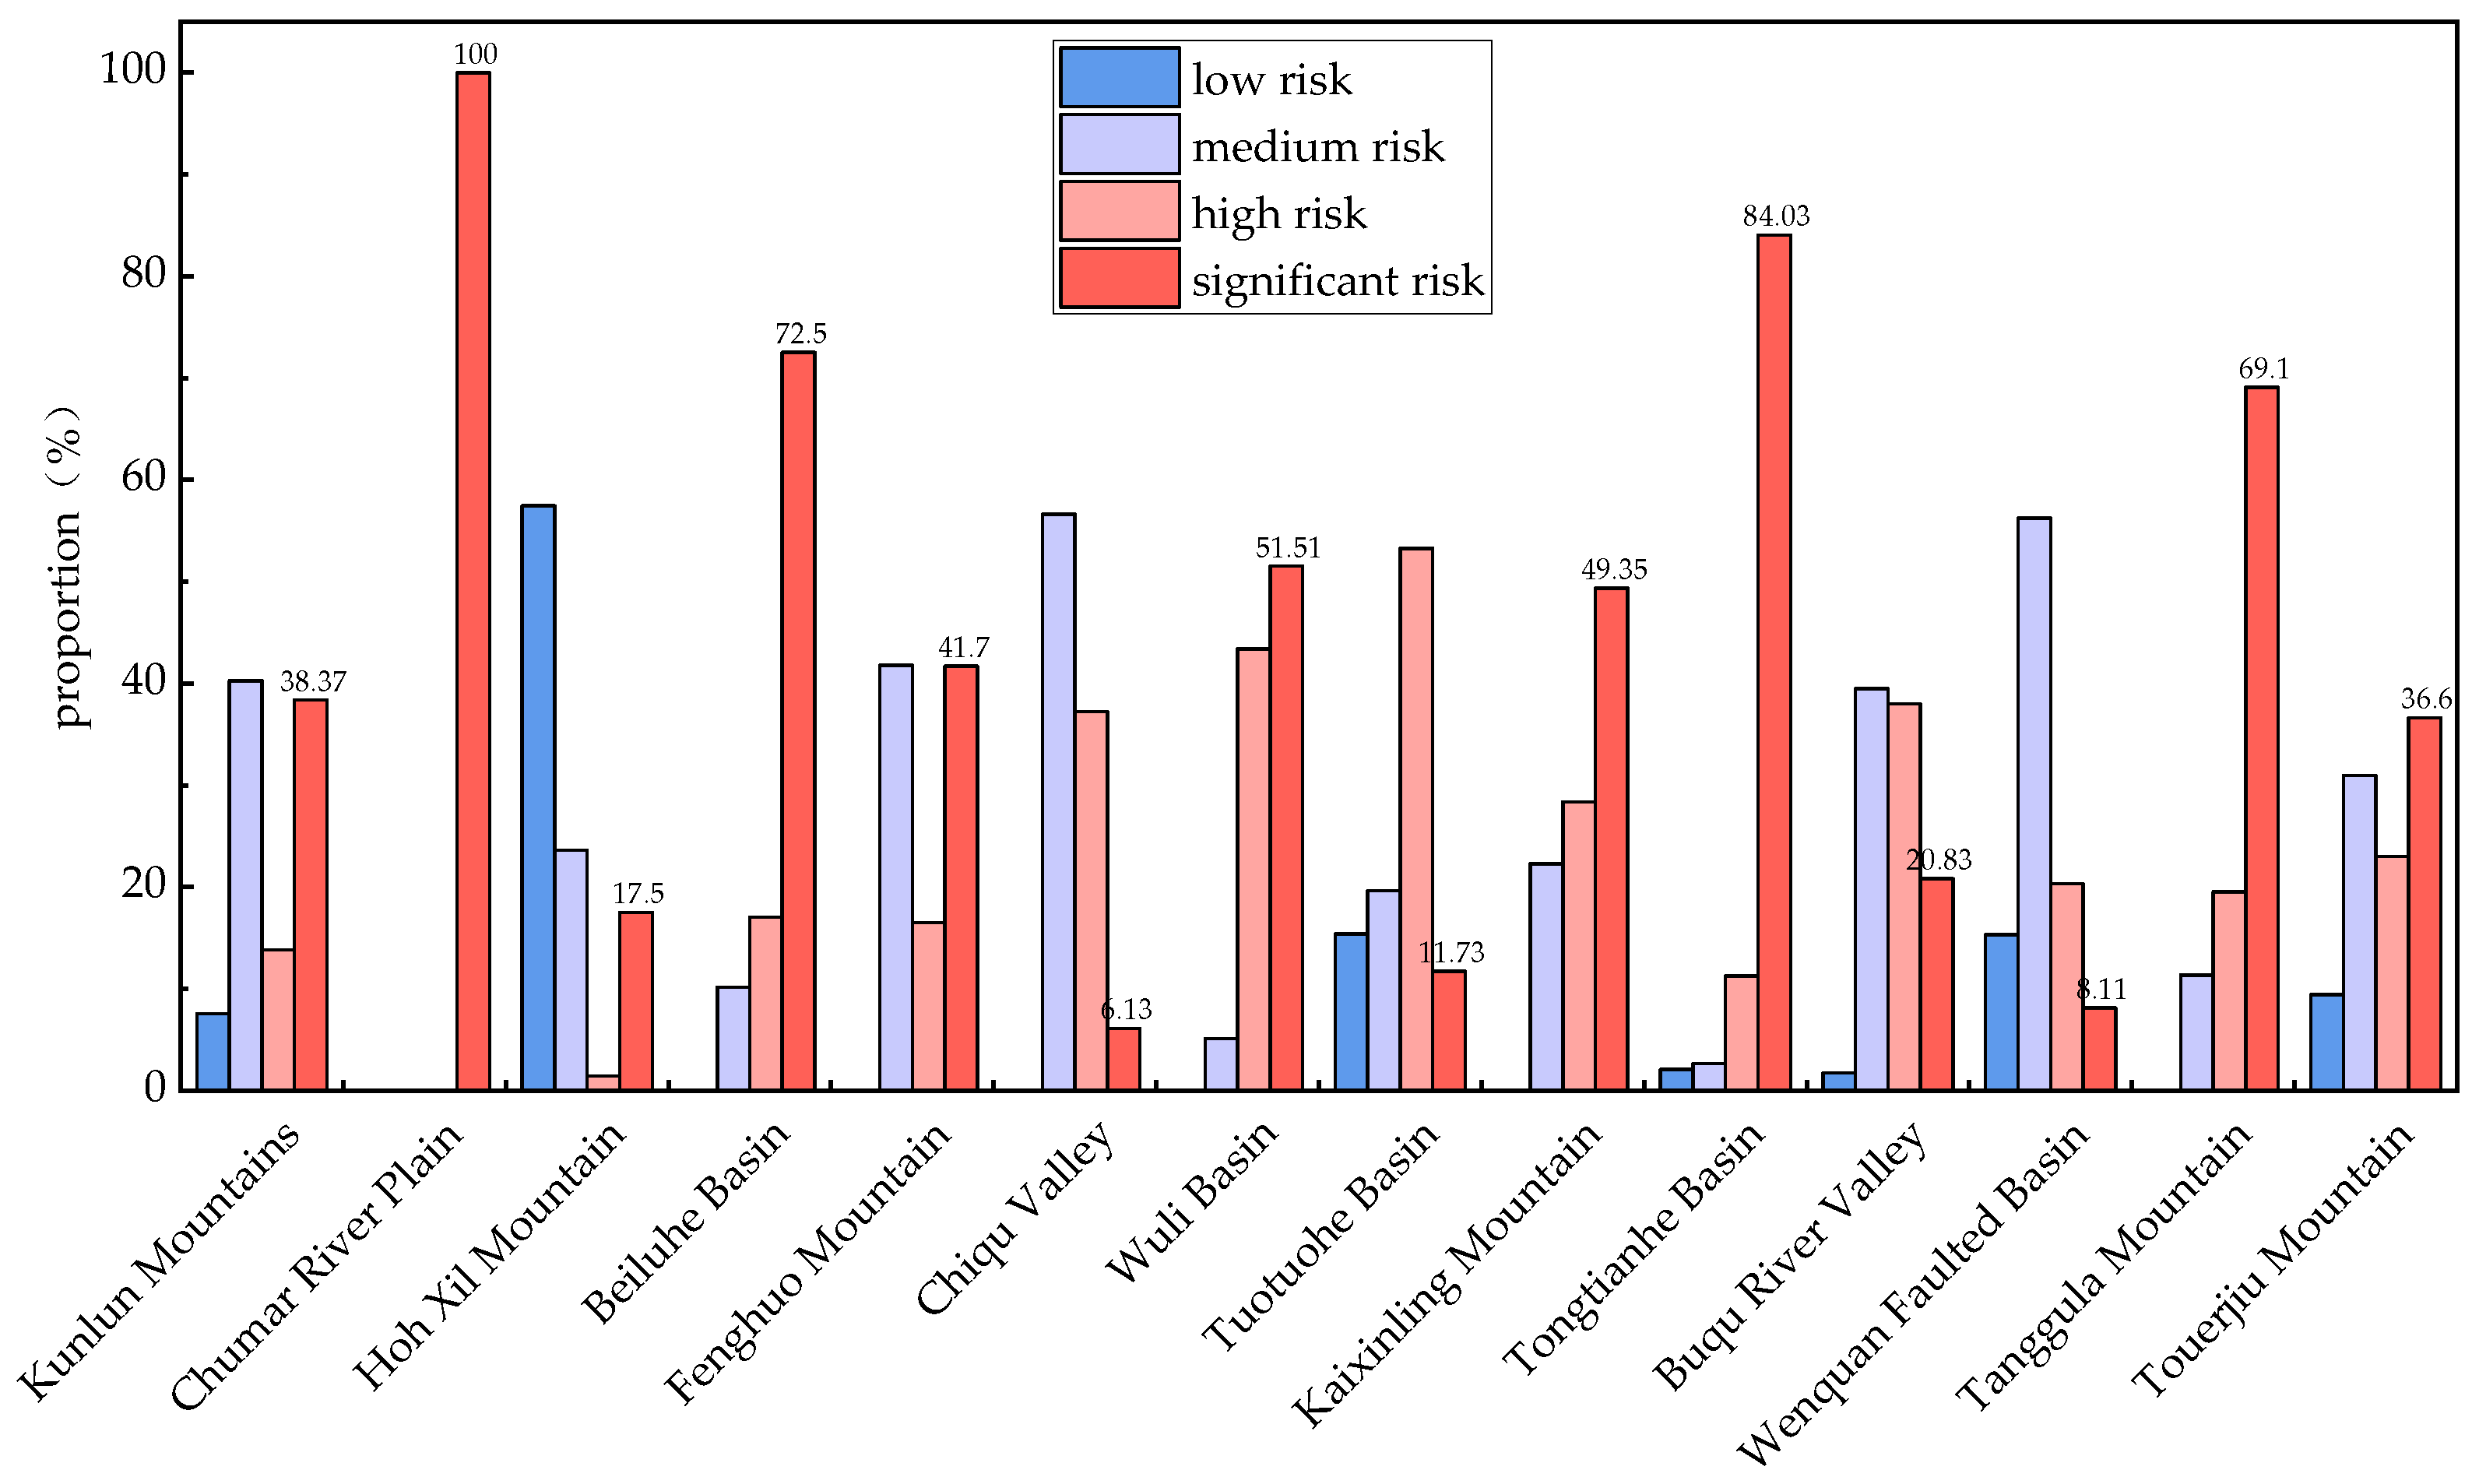
Figure 11.
Thaw settlement probability curves of four types of ice content.

Figure 12.
Comparisons of the predictive values and actual values: (a) mean annual ground temperatures; (b) active-layer thicknesses.
Figure 12.
Comparisons of the predictive values and actual values: (a) mean annual ground temperatures; (b) active-layer thicknesses.
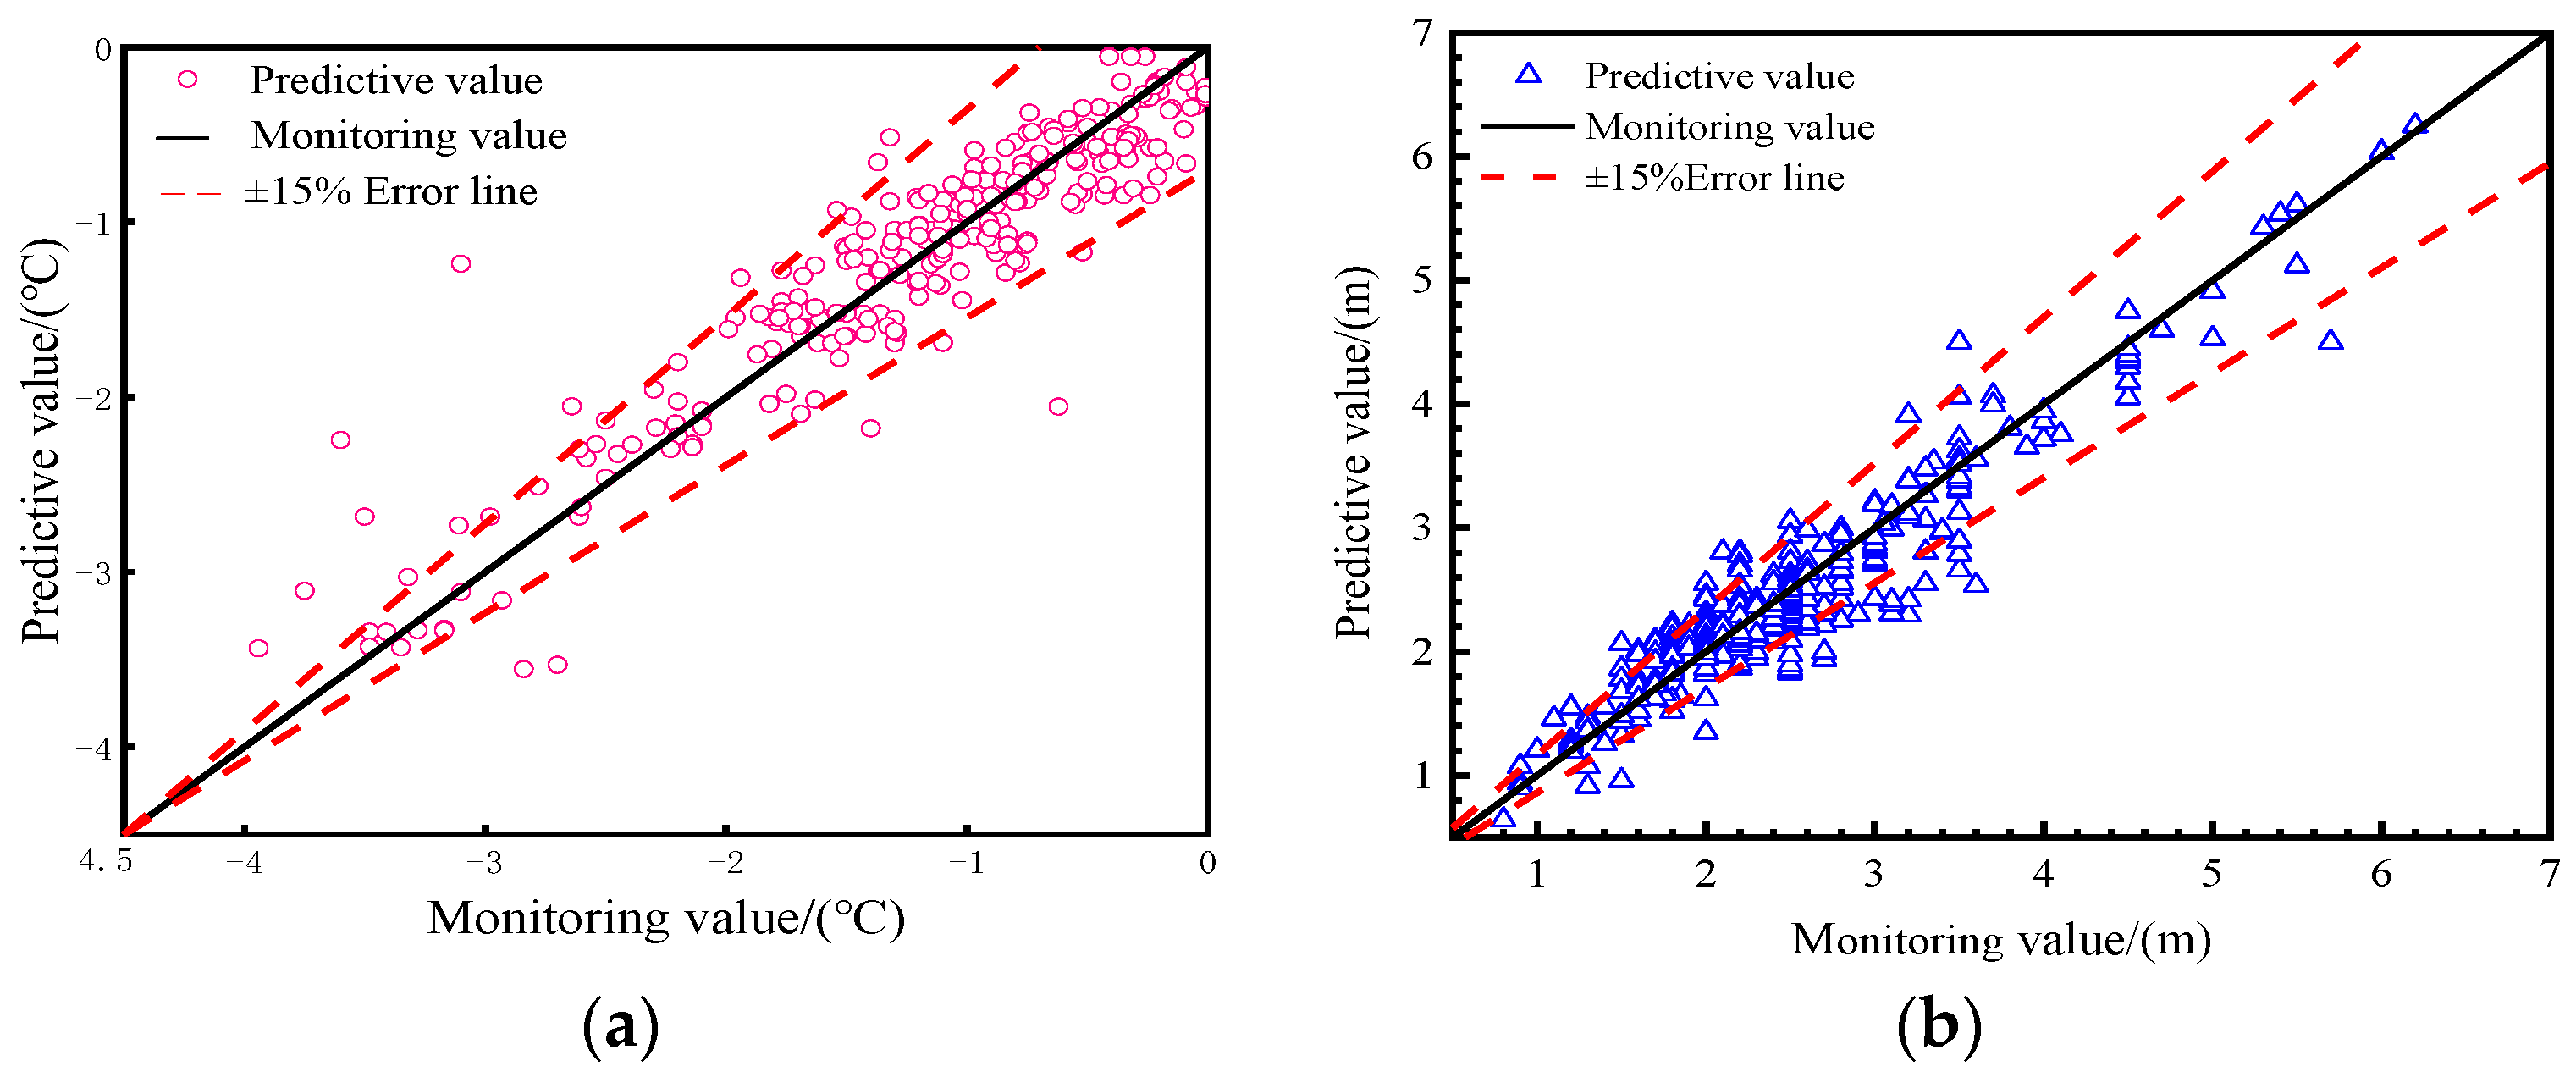
Figure 13.
Relationships between parameters and thaw settlement: (a) elevation; (b) surface temperature; (c) vegetation index; (d) latitude.
Figure 13.
Relationships between parameters and thaw settlement: (a) elevation; (b) surface temperature; (c) vegetation index; (d) latitude.


Table 1.
Sources and resolutions of remote sensing data.
| Data | Source | Resolution |
|---|---|---|
| Elevation | SRTM DEM | 90 × 90 m |
| Surface temperature | MOD11A2 (2000~2016) | 1000 × 1000 m |
| Vegetation index (NDVI) | MOD13Q1 (2000~2016) | 250 × 250 m |
Table 2.
Thaw settlement coefficient values of permafrost with different ice contents.
| Ice Content | Ice-Poor | Icy Soil | Ice-Rich | Ice-Saturated | Ice Layer with Soil Inclusions |
|---|---|---|---|---|---|
| Thaw settlement coefficient | 0.01 | 0.03 | 0.065 | 0.175 | 0.25 |
Table 3.
Risk classification standard for thaw settlement.
| Thaw Settlement/m | I < 0.1 | 0.1 ≤ I < 0.25 | 0.25 ≤ I < 0.5 | I ≥ 0.5 |
|---|---|---|---|---|
| Risk classification | Low risk | Medium risk | High risk | Significant risk |
Table 4.
Error analysis of RBF neural network models’ prediction results.
| Evaluating Indicator | Mean Annual Ground Temperatures | Active-Layer Thicknesses |
|---|---|---|
| R2 | 0.81 | 0.84 |
| MAE | 0.27 | 0.11 |
| RMSE | 0.37 | 0.33 |
Table 5.
Correlations between different factors and thaw settlement.
| Impact Factor | Ice Content | Elevation | Equivalent Latitude | Surface Temperature | Vegetation Index | Latitude |
|---|---|---|---|---|---|---|
| Kunlun Mountains | 0.120 | 0.097 | −0.300 | 0.072 | 0.037 | −0.438 ** |
| Chumar River Plain | 0.258 ** | −0.664 ** | 0.020 | 0.464 ** | 0.314 ** | −0.313 ** |
| Hoh Xil Mountains | 0.582 ** | −0.441 ** | −0.116 ** | 0.328 ** | −0.410 ** | 0.209 ** |
| Beiluhe Basin | 0.859 | −0.147 ** | −0.012 | 0.234 ** | −0.406 ** | −0.157 ** |
| Fenghuo Mountains | 0.889 ** | −0.569 ** | −0.072 | 0.577 ** | −0.372 ** | 0.583 ** |
| Chiqu Valley | 0.544 ** | −0.189 ** | 0.022 | 0.174 ** | −0.035 | −0.024 |
| Wuli Basin | 0.250 ** | −0.259 ** | 0.040 | −0.087 | 0.035 | −0.160 * |
| Tuotuohe Basin | 0.067 | −0.487 ** | 0.100 | 0.156 * | −0.388 ** | −0.026 |
| Kaixinling Mountains | 0.160 ** | −0.043 | −0.159 ** | 0.061 | −0.096 | −0.739 ** |
| Tongtianhe Basin | 0.074 | −0.179 ** | −0.135 ** | −0.110 ** | 0.230 ** | 0.670 ** |
| Buqu River Valley | 0.194 ** | −0.548 ** | 0.072 * | 0.490 ** | −0.044 | 0.429 ** |
| Wenquan Faulted Basin | −0.026 | −0.293 ** | 0.032 | 0.176 ** | 0.300 ** | −0.257 ** |
| Tanggula Mountains | 0.054 * | −0.425 ** | −0.119 ** | 0.345 ** | 0.137 ** | −0.267 ** |
| Touerjiu Mountains | 0.049 | −0.192 ** | −0.028 | 0.104 ** | 0.258 ** | −0.080 * |
“*” represents p < 0.05; “**” represents p < 0.01.
Table 6.
Significance analysis of mean annual ground temperatures and active-layer thicknesses.
| Region | Mean Annual Ground Temperatures | Active-Layer Thicknesses | ||
|---|---|---|---|---|
| F | Sig | F | Sig | |
| Kunlun Mountains | 1.566 | 0.281 | 1.306 | 0.383 |
| Chumar River Plain | 7.497 | 0 | 1.478 | 0.055 |
| Hoh Xil Mountains | 2.654 | 0 | 3.418 | 0 |
| Beiluhe Basin | 1.429 | 0.143 | 1.531 | 0.034 |
| Fenghuo Mountains | 2.450 | 0.031 | 1.323 | 0.065 |
| Chiqu Valley | 1.531 | 0.022 | 1.830 | 0 |
| Wuli Basin | 1.312 | 0.212 | 2.470 | 0.001 |
| Tuotuohe Basin | 5.885 | 0 | 7.846 | 0 |
| Kaixinling Mountains | 1.579 | 0.001 | 1.795 | 0 |
| Tongtianhe Basin | 6.594 | 0 | 5.145 | 0.116 |
| Buqu River Valley | 1.304 | 0.035 | 2.421 | 0.002 |
| Wenquan Faulted Basin | 8.307 | 0 | 11.073 | 0 |
| Tanggula Mountains | 1.385 | 0.684 | 8.607 | 0 |
| Touerjiu Mountains | 2.851 | 0.037 | 2.875 | 0.019 |
Disclaimer/Publisher’s Note: The statements, opinions and data contained in all publications are solely those of the individual author(s) and contributor(s) and not of MDPI and/or the editor(s). MDPI and/or the editor(s) disclaim responsibility for any injury to people or property resulting from any ideas, methods, instructions or products referred to in the content. |
© 2023 by the authors. Licensee MDPI, Basel, Switzerland. This article is an open access article distributed under the terms and conditions of the Creative Commons Attribution (CC BY) license (https://creativecommons.org/licenses/by/4.0/).
Share and Cite
MDPI and ACS Style
Liu, Z.; Zhu, Y.; Chen, J.; Cui, F.; Zhu, W.; Liu, J.; Yu, H. Risk Zoning of Permafrost Thaw Settlement in the Qinghai–Tibet Engineering Corridor. Remote Sens. 2023, 15, 3913. https://doi.org/10.3390/rs15153913
AMA Style
Liu Z, Zhu Y, Chen J, Cui F, Zhu W, Liu J, Yu H. Risk Zoning of Permafrost Thaw Settlement in the Qinghai–Tibet Engineering Corridor. Remote Sensing. 2023; 15(15):3913. https://doi.org/10.3390/rs15153913
Chicago/Turabian StyleLiu, Zhiyun, Yu Zhu, Jianbing Chen, Fuqing Cui, Wu Zhu, Jine Liu, and Hui Yu. 2023. "Risk Zoning of Permafrost Thaw Settlement in the Qinghai–Tibet Engineering Corridor" Remote Sensing 15, no. 15: 3913. https://doi.org/10.3390/rs15153913
Note that from the first issue of 2016, this journal uses article numbers instead of page numbers. See further details here.