Abstract
The utilization of unmanned aerial vehicles (UAVs) for the precise and convenient detection of litchi fruits, in order to estimate yields and perform statistical analysis, holds significant value in the complex and variable litchi orchard environment. Currently, litchi yield estimation relies predominantly on manual rough counts, which often result in discrepancies between the estimated values and the actual production figures. This study proposes a large-scene and high-density litchi fruit recognition method based on the improved You Only Look Once version 5 (YOLOv5) model. The main objective is to enhance the accuracy and efficiency of yield estimation in natural orchards. First, the PANet in the original YOLOv5 model is replaced with the improved Bi-directional Feature Pyramid Network (BiFPN) to enhance the model’s cross-scale feature fusion. Second, the P2 feature layer is fused into the BiFPN to enhance the learning capability of the model for high-resolution features. After that, the Normalized Gaussian Wasserstein Distance (NWD) metric is introduced into the regression loss function to enhance the learning ability of the model for litchi tiny targets. Finally, the Slicing Aided Hyper Inference (SAHI) is used to enhance the detection of tiny targets without increasing the model’s parameters or computational memory. The experimental results show that the overall value of the improved YOLOv5 model has been effectively increased by 22%, compared to the original YOLOv5 model’s value of 50.6%. Specifically, the value for detecting small targets has increased from 27.8% to 57.3%. The model size is only 3.6% larger than the original YOLOv5 model. Through ablation and comparative experiments, our method has successfully improved accuracy without compromising the model size and inference speed. Therefore, the proposed method in this paper holds practical applicability for detecting litchi fruits in orchards. It can serve as a valuable tool for providing guidance and suggestions for litchi yield estimation and subsequent harvesting processes. In future research, optimization can be continued for the small target detection problem, while it can be extended to study the small target tracking problem in dense scenarios, which is of great significance for litchi yield estimation.
1. Introduction
Litchi is a significant economic crop primarily grown in the subtropical regions, specifically in southern China and Southeast Asia. In 2019, global litchi production reached approximately 4 million tons. China stands as the leading producer with the largest planting area and production worldwide. The average annual output and planting area in China account for more than 50% of the total global production [1]. The national technology system for the litchi and longan industries in China forecasts a rise in China’s litchi planting area to 526,100 and a total output of approximately 2.2227 million tons by 2022 [2]. The litchi market season typically takes place from May to July. During this period, exposure to high temperatures can lead to the development of litchi acid, which causes spoilage and affects the overall flavor of the fruit. Consequently, it becomes crucial to predict the yield of litchi fruit in orchards in advance. This prediction helps farmers to plan their storage and harvesting activities effectively and enables them to devise early supply strategies.
Traditional yield estimation methods often rely on manual counting, where the procedure involves rough estimation of the number of fruits followed by multiplying it with the average weight of each fruit. However, this approach heavily relies on individual experience and is susceptible to human factors. As a result, there can be significant discrepancies between the estimated values obtained through this method and the actual values reflecting the true yield.
Along with the maturity of UAV technology, its application in agriculture has natural advantages considering its excellent mobility and flexibility, which can be easily and quickly deployed in agricultural environments. An increasing number of UAV applications have been explored for agricultural applications in recent years [3,4]. Junos et al. proposed an improved YOLOv3 model for detecting oil palm fruits from UAV images, in which the FPS reached 29.3 with an average accuracy of 99.76% [5]. Due to the good resolution of the images captured by the UAV, it is suitable for natural orchard fruit detection.
In recent years, computer vision has made significant progress due to the rapid advancements in computer technology. The application of computer vision technology in agriculture aims to address challenges such as high labor intensity and low productivity, ultimately improving agricultural efficiency. There are many related works in this field. For example, Maldonado Jr and Barbosa developed a method to automatically count green fruits on orange trees based on traditional digital image processing techniques [6]. Bhargava and Bansal split the background by color channel, using multiple features to distinguish fruit types and for fruit quality assessment, comparing four types of classifiers: k-Nearest Neighbor (k-NN), Sparse Representative Classifier (SRC), Artificial Neural Network (ANN), and Support Vector Machine (SVM), where SVM accuracy reached the highest accuracy of 95.72% [7]. Xiong et al. detected litchi by their color features and confirmed that the YIQ color model is the model with the best practice in nighttime litchi detection [8]. Wang et al. developed three classifiers for litchi images and a clustering algorithm for fruit matching, and the matching success rate could reach up to 96.96%, but it was greatly influenced by the environment [9]. The aforementioned techniques for fruit detection are based on machine learning technology, which categorizes and recognizes by extracting information from the target fruit’s color, geometric shape, and texture. They are frequently impacted by the environment and the recognition accuracy fluctuates greatly, with poor robustness when encountering factors such as occlusion and weather. These characteristics are more suited for somewhat constant situations but they are hardly applicable in real orchards with complex environments.
With the advancements in deep learning technology, various object detection models have been developed and applied to fruit detection, effectively addressing the aforementioned challenges. One-stage and two-stage detection models can be categorized under the category of object detection. Girshick et al. pioneered a two-stage detection model that uses regions with a Convolutional Neural Network (CNN) feature called R-CNN for object detection [10]. It consists of three main modules: first, generating a category-independent region proposal; second, extracting region proposal features using CNN; and third, using an SVM classifier for category delineation. There are several fruit detection methods based on this model. For example, Apolo-Apolo et al. employed Faster R-CNN for citrus detection, which could achieve 90% accuracy rate and F1 score greater than 0.98 [11]. Gao et al. proposed a multi-class apple detection method based on Faster R-CNN that can effectively detect four classes of apples, i.e., no shading, leaf shading, branch shading, and fruit shading, with an average accuracy rate of 87.9% and an FPS of only 4.15 [12]. Zhang et al. employed VGG19 as the backbone for Faster R-CNN to detect apples and branches, with an average accuracy of of 82.4% and F1 score of 0.86, but FPS of only 2.22 [13].
The two-stage object detection approach has good performance but, because of its slow inference speed, it is challenging to apply to situations with high real-time requirements. Thus, in pursuit of the balance of accuracy and inference speed, Redmon et al. proposed the one-stage object detection method called YOLO [14]. It is characterized by obtaining target information directly in the model, which greatly improves the inference speed but reduces accuracy. Due to its fast and efficient characteristics, its series of models are more often applied in the real-time detection of orchard fruits. For example, Lin et al. proposed a detection algorithm for litchi flower clusters based on YOLOv4 with an average accuracy of 87.87% and an FPS of 23.26 [15]. Finally, a model for estimating the number of litchi clusters was constructed via equation fitting. Wang et al. proposed an improved network based on YOLOv5 with Shufflenetv2 as the backbone network to achieve a light weight and, in addition, developed a mobile application with of 92.4% while achieving FPS of 78.13, demonstrating that this network can be usefully applied to a real orchard environment [16]. Liang et al. innovatively introduced BiFPN and swin-transformer modules to enhance the cross-scale fusion capability of the network while accelerating network convergence and improving network accuracy [17].
The issue of small object detection is invariably confronted in order to accomplish accurate yield estimation for large scenarios of litchi fruit. The detection of small targets still has to be enhanced, despite the fact that the existing object detection algorithm can successfully detect medium and big objects in a real environment. Small targets are challenging to detect for the following reasons: it is difficult for the model to learn the feature information of small targets due to the lack of feature information in small targets themselves; small target data are typically small in the dataset, making model learning difficult; small target anchor boxes can be challenging to match due to small changes, which aggravates the difficulty of model learning. Numerous algorithms have been proposed to increase the accuracy of small target recognition. For instance, Liu et al. proposed a feedback-driven loss function to balance the loss distribution and relieve the inadequate supervision on the small targets [18]; Gong et al. discovered that adjusting the fusion factor of adjacent layers of FPN can adaptively drive the shallow layers to focus on learning tiny objects [19], thereby improving detection efficiency. There are still comparatively few small object optimization studies for litchi fruit, despite the fact that there are many studies for small object improvement on public datasets and all of them have achieved significant progress.
This study aims to develop a litchi fruit detection model based on the YOLOv5 model for natural litchi orchards that can be applied to UAV shooting scenarios. In order to be better applied to litchi fruit yield estimation, the small target detection of litchi is especially improved and the maturity of litchi fruit is divided for better practicality. To improve small target detection, the original Path Aggregation Network (PANet) is replaced by an improved BiFPN and the P2 feature layer is fused into the BiFPN. NWD and CIoU weighted loss are utilized as regression loss functions to enhance the learning ability of the model for tiny target features to enhance the detection of tiny target litchi and finally SAHI is utilized as a post-processing step to solve the detection problem of tiny target litchi. The improved YOLOv5 model in this paper is named YOLOv5-TinyLitchi. The improved model has excellent detection ability for small target litchi, and still has good robustness under the influence of environment and occlusion. Meanwhile, the application of the slicing mechanism greatly reduces the missed detection of small target litchi and improves the realism of yield prediction.
2. Materials and Methods
2.1. Image Data Collection
In this study, the litchi fruits were studied in a large scene, and the images were collected mainly from two locations: one is the Litchi Expo in Conghua District, Guangzhou City, Guangdong Province, China (), where the main variety is Jingganghongnuo, and the other is the Mache New Fruit Farm in Zengcheng District, Guangzhou City, Guangdong Province, China (), where the main varieties are Xianjinfeng and Nuomici (Figure 1). More than 100 litchi trees were sampled and they were planted at spacing ranging from five to ten meters apart with an average height of about three meters. The shooting equipment utilized in this study was the DJI MAVIC PRO UVA, and the image acquisition was conducted between 9:00 a.m. and 5:00 p.m. from 21 June to 15 July 2022. The main shooting method was large scene shooting with pixels, which was used to capture as many litchi fruits as possible from a single viewpoint, supplemented by partial shooting to ensure the diversity of the dataset and prevent overfitting of the model. To ensure that the litchi were clearly visible, the horizontal distance between the shooting device and the litchi tree was between 2 and 3 m, while the collected images contain litchi of different maturities. The average flight height was between 3 and 5 m and the mode of image acquisition was pinhole camera model. A front perspective and a top perspective of the litchi tree were usually taken when shooting. The front perspective was taken by hovering the UAV about two meters in front of the tree, at half the height of the tree and shooting directly in front of it. Top perspective was taken by hovering the UAV at a distance about two meters above the tree and shooting directly below it. In order to make the collected data fit the daily use scenario of this research method and ensure the practicality of the model, the image format was uniformly set to JPEG.
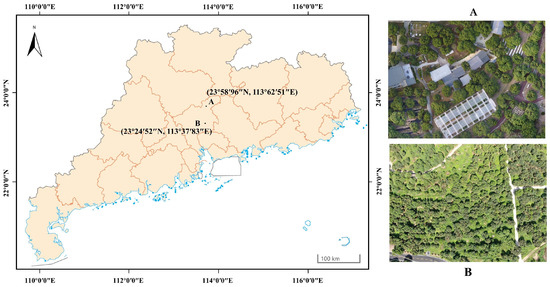
Figure 1.
Image collection location: (A) Litchi Expo, (B) Mache New Fruit Farm.
2.2. Dataset Construction
For the purpose of enhancing the applicability of this study, the litchi are divided into two categories: mature and immature, during data processing. Mature litchi peel shows red color, the surface is crack-like, and the shape is mostly heart-shaped or elliptical. Immature litchi peel shows lime green or yellow-green, and some are interspersed with red and yellow, the shape is oval or long elliptical. Due to uncertainties such as light or wind shaking that can cause blurred images that are difficult to annotate, eventually four hundred images of dense and well-shot litchi fruit are selected from the captured dataset. In addition, we also test the distribution of ground truth region size on the self-built litchi dataset and find that, when the pixel size is in the range of less than pixels, between and pixels, and more than pixels the litchi fruit are categorized as small, medium, and large targets, respectively.
This study chose to use the open source image annotation tool LabelImg, which can export three formats of annotation files: xml format for the PASCALL-VOC dataset, json format for the MS-COCO dataset, and txt format for YOLOv5. In this study, the txt format of YOLOv5 is selected as the training label import format and the json format of the MS-COCO dataset is used as the format for calculating model evaluation metrics. Statistically, there are a total of 43,156 real labeled targets in this dataset, with an average of 107 litchi targets in one image. After the completion of labeling, the dataset is randomly divided into a training set, a validation set, and a test set in the ratio of 7:1:2 for training, testing, and evaluation of the model. Details are given in Table 1.

Table 1.
Detailed information about the litchi image dataset.
2.3. Experimental Environment Setup
The training environment employed in this study included a Windows 10 21H2 64-bit operating system, 16 GB of memory, and an NVIDIA GeForce RTX 3060 graphics card. The model building and training environments were Python 3.10.5, PyTorch 1.12.1, and CUDA 11.3.
The images were processed uniformly at pixels, the batch size was set to 8, and the epoch was 300, using stochastic gradient descent (SGD) as the optimizer, with an initial learning rate of 0.01 and a weight decay of 0.0005, using a cosine warm-up learning strategy and mosaic-4 for data enhancement.
2.4. Evaluation Metrics
To evaluate the detection performance of the model on the litchi dataset, this study uses common evaluation metrics in object detection algorithms, including average precision (AP), model size (weights), and the number of frames per second (FPS). The specific formula is shown in (1)–(4). The inference speed is based on the average inference speed of forty images in the NVIDIA GeForce RTX 3060 graphics card environment.
where denotes correctly detected litchi fruit (true positive), denotes incorrectly detected litchi fruit (false positive), and denotes incorrectly detected incorrect litchi target (false negative). The refers to the area of the precision–recall (PR) curve. However, in practice, an approximated average precision is usually used in the calculation. Q is the total number of categories, denotes the value of category q, and is the arithmetic mean sum of the values of all categories, which usually represents the detection performance of the algorithm. Without special specification, in this study is represented as when IoU is 50%. metrics are further divided into , , , , and for small, medium, large, mature, and immature litchi targets, respectively.
2.5. Overview of YOLOv5
Since CNNs were introduced into the field of computer vision, the field of object detection can be divided into two categories. One is the two-step detection represented by R-CNN. The core of R-CNN is to select the region proposal by selective search algorithm and then perform classification and regression on the region proposal to complete the object detection task. This series of algorithms have: Fast R-CNN [20], Faster R-CNN [21]. Thanks to the generation of region proposal, these methods usually have a high recognition rate but the real-time performance is slightly worse. The other one is the one-step detection algorithm represented by YOLO. The YOLO series was started by Redmon et al. [14]; the aim is to predict the bounding box and category probability of a complete image by a single evaluation of a single neural network. And the basic idea is twofold: one is to solve the object detection problem as a regression problem by using a network to output the bounding box of categories; the second is that, instead of extracting the region proposal, the prediction is performed on the whole image. The main algorithms are: YOLOv3 [22], YOLOv4 [23], YOLOv5, RetinaNet [24], and SSD [25]. Because of the direct generation of the bounding box, these methods sacrifice some accuracy for higher real-time performance.
The idea of YOLOv5 is inherited from the YOLO series and the main structure is divided into three layers: backbone, neck, and head. Backbone is responsible for feature extraction, neck for feature fusion, and head for generating bounding boxes and categories. The backbone uses cross-stage partial networks, which solves the problem of duplication of gradient information in network optimization and integrates the gradients of each layer into the feature map, ensuring the inference speed and accuracy, and reducing the model size. The backbone network is shown in Figure 2. Neck adopts PANet, which makes full use of the accurate localization information of the underlying features through bottom-up path enhancement on the basis of FPN networks. Head consists of three detection heads with different resolutions, and uses a loss function consisting of Regression, Objectness, and Classification for detection and non-maximum suppression to select the best detection. Five versions, YOLOv5n, YOLOv5s, YOLOv5m, YOLOv5l, and YOLOv5x, are available according to the detection requirements, which are achieved by replacing the number of residual blocks and downsampling convolutions in the BottleneckCSP of the neck. Going from YOLOv5n to YOLOv5x is characterized by higher detection accuracy and slower inference speed with larger model size.
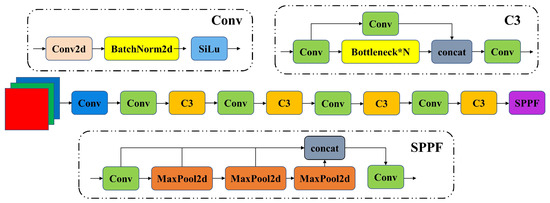
Figure 2.
CSP-Darknet53 architecture for YOLOv5 backbone network. Bottleneck*N indicates the number of times Bottleneck is repeated.
2.6. The Proposed Model
Combining the model size, inference speed, and detection accuracy of the five versions of YOLOv5, this study concludes that the base model that is most compatible with the detection of litchi fruits under large scenes in orchards is the YOLOv5s model. For the purpose of making the YOLOv5s model applicable to orchard litchi detection, particularly for the difficult problem of small target litchi detection, this study developed an improved YOLOv5s model based on version 6.2 and its network structure is shown in Figure 3. In the improved model, in order to compensate for the loss of receptive field from downsampling and increase the accuracy of small target detection, the original PANet is replaced with BiFPN fused with the P2 feature layer to enhance the feature fusion capability of the neck; NWD is integrated into the loss function to make the model sensitive to tiny target detection. Finally, post-processing is performed using SAHI to re-detect the undetected tiny litchi targets. More details of the theory are stated below.
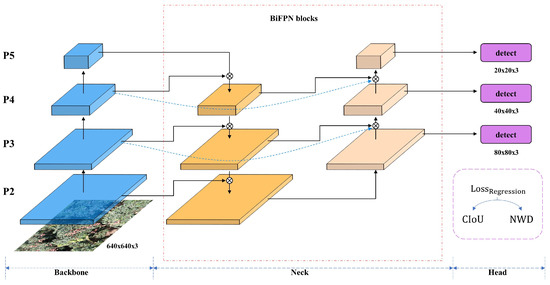
Figure 3.
Network architecture of YOLOv5-TinyLitchi. Backbone: a feed-forward CSP-Darknet53 architecture extracts the multi-scale feature maps. Neck: the P2 feature layer fused into BiFPN in order to fuse more localization information. Head: NWD was added to the regression loss function.
2.6.1. BiFPN with P2 Feature Layer Fusion
BiFPN was proposed by Tan et al. [26]. It is believed that the contribution of high-level and low-level feature fusion to the output features is unequal, so the weight coefficients are added to the feature fusion. Meanwhile, to solve the problem of inadequate feature fusion in PANet, cross-level multi-scale fusion is proposed by adding an extra edge from the original input node to the output node if they are at the same level, as shown in Formulas (5) and (6). And each direction (top-down and bottom-up) is considered a feature network layer, which is reused several times to obtain more high-level feature fusion. The structure of BiFPN is shown in Figure 4b. Several studies have been conducted to demonstrate that BiFPN can accurately enhance the detection ability of the model for small target objects [27,28,29].
where is the intermediate feature at level 4 on the top-down pathway, is the layer 4 feature extracted from the backbone, and is the output feature at level 4 on the bottom-up pathway. w and are the weight of each feature map, and is a constant. All other features are constructed in a similar manner.
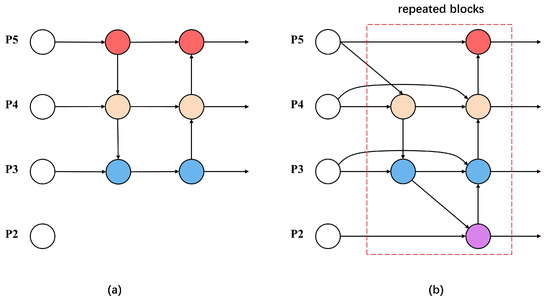
Figure 4.
Schematic diagram of PANet and BiFPN structures: (a) original YOLOv5 PANet, (b) proposed YOLOv5 BiFPN.
Since there are more litchi due to distance issues in the image occupying fewer pixel points when performing large scene litchi fruit object detection and litchi fruits are not fully mature when performing litchi fruit yield estimation, the scene usually contains immature litchi with smaller targets of its own. In order to identify these two targets, the P2 shallow feature layer is added to BiFPN without significantly increasing the number of parameters at the same time, so that the model can obtain a higher resolution receptive field feature fusion and have more accurate localization information.
2.6.2. NWD
Wang et al. proposed the NWD [30], which can consistently respond to the distance between distributions and is better than IoU in measuring the similarity between tiny objects. First, it models bounding boxes as two-dimensional Gaussian distributions, where the center pixel of the bounding box has a higher weight and the importance of the pixel decreases from the center to the boundary. Then, the similarity between bounding box and ground truth is calculated and normalized to obtain NWD, as shown in Formulas (7) and (8).
where is the Gaussian Wasserstein Distance between two bounding boxes, C is a constant closely related to the dataset, and is a distance measure. and are Gaussian distributions modeled by and , where are the coordinates, width, and height of the bounding box, respectively. is the Gaussian Wasserstein Distance after normalization in exponential form.
The NWD metric can also be easily embedded into the assignment, non-maximum suppression, and loss function of any anchor-based detector to replace the commonly used IoU metric. Several studies have applied the NWD metric to the non-maximum suppression and loss function, which achieves good performance of the model [31,32,33].
We aim to enhance the model’s ability to detect tiny targets by introducing the NWD metric into the regression loss function of the original YOLOv5, as shown in Formulas (9) and (10).
where w is the weight of each loss, and CIoU and NWD are composed of with different proportion factors , respectively.
2.6.3. SAHI
The slicing method is very effective in the inference step and the SAHI proposed by Akyon et al. aims to solve the problem of small target detection on high resolution images while maintaining a higher memory utilization. First, the original image I is sliced into l number of overlapping patches , ,…, . Then, each patch is resized while preserving the aspect ratio. After that, object detection forward pass is applied independently to each overlapping patch. Finally, the overlapping prediction results and full inference results are merged back into the original size using NMS. During NMS, bounding boxes having higher IoU ratios than a predefined matching threshold are retained and the rest of bounding boxes are removed [34]. See Figure 5 for details.
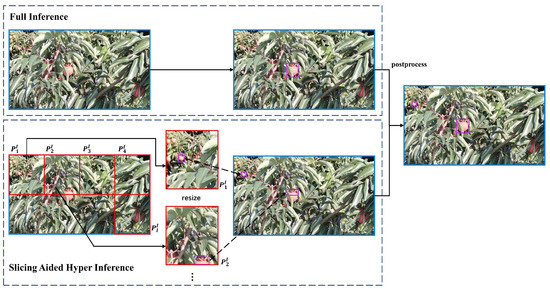
Figure 5.
Slicing Aided Hyper Inference schematic.
3. Experimental Results and Comparative Analysis
3.1. Ablation Experiments
We did comprehensive experiments for each module on the test litchi dataset to evaluate their effects on model performance, combining and analyzing the modules one by one, and evaluated the effects of the number of repetitions of BiFPN blocks and the assigned weight of NWD and CIoU in the loss function on the regression model effects. The results are shown in Table 2. The addition of NWD improved the of immature litchi from 24.0% to 31.6%, while the addition of BiFPN and P2 feature layer enabled the improved model to reach the highest value of for immature litchi at 47.8%, and the of mature litchi detection improved from 77.3% to 80.4%. The of mature and immature litchi reached high values of 86.4% and 58.8% after using SAHI, respectively. Since the FPS of SAHI is affected by the number of slice counts, it is not shown in Table 2. In our tests, when the number of slices is 2, the FPS is about 35.
Table 2.
Ablation experiment results.
We show the curves during training in Figure 6. The curve for most models rises rapidly after 5 epochs and reaches convergence at 175 epochs. It is obvious from the figure that our results are better than the original YOLOv5, while the strategy of BiFPN and fusing P2 feature layers is feasible; although adding NWD will reduce the model convergence speed, it can improve the detection accuracy of the model without increasing the model size, which is meaningful for detecting small target litchi. Specifically, at 50–175 epochs, the curve of “YOLOv5 + FuseP2 + NWD + BiFPN” has a slower convergence rate than that the curve of “YOLOv5 + FuseP2 + BiFPN” but the convergence rate is accelerated after 175 epochs. And, finally, the value of “YOLOv5 + FuseP2 + NWD + BiFPN” is better than that of “YOLOv5 + FuseP2 + BiFPN”.
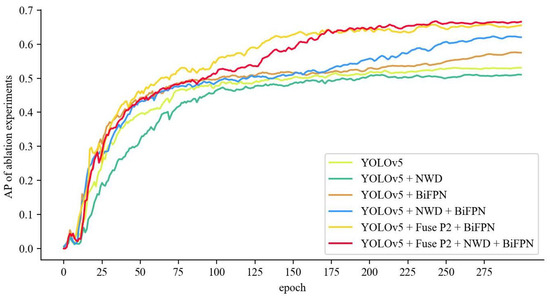
Figure 6.
The AP of ablation experiments.
3.1.1. BiFPN
This paper compared the model performance of BiFPN when the number of repetitions in the model was 1, 2, and 3, respectively, to explore how many times the model performance was best. The experimental results are shown in Table 3, where 1× indicates the number of repetitions is 1 and so on.
Table 3.
Effect of BiFPN repeated blocks on model weight and parameters.
The experimental results show that increasing the number of repetitions of BiFPN blocks significantly increases the model size and the number of parameters, and the of the model increases only 0.1% when the repetition blocks change from 1 to 2, but the model size increases from 14.2 to 20.3, the number of parameters increases from 7.24 to 10.4, and the model increases by 5.9 MB. When the repetition blocks are increased to 3, the instead ushered in a decrease, from 64.2% to 58.7%. We speculate that the deepening of the model leads to a decrease in its learning ability and there is also a decrease in the accuracy of small targets, which indicates that the deepening of the model leads to a decrease in the learning ability of certain shallow layer features as well. This leads us to conclude that, when the number of repetitions is 2, there is limited improvement in the performance of the model, but instead an additional increase in the model size and the number of parameters, which is not necessary for application in orchard litchi fruit yield estimation. The model’s performance decreases when the number of repetitions is 3. So the repetition number of 1 for BiFPN blocks is optimal.
Benefiting from the cross-scale fusion and weighted feature fusion of BiFPN, the network can obtain more and more efficient feature information fusion to better cope with the problem of difficult detection of small targets. As can be seen from Table 2, applying BiFPN for feature fusion increases the from 50.6% to 55.2%, while the increase from 27.8% to 31.6%, but the model size only increases by 0.1 MB and the number of parameters increases by 0.07 M, while the inference speed is improved. Overall, we replace PANet with BiFPN and set the number of repetitions to 1, which is very helpful for small-target litchi detection.
In order to verify the feature extraction ability of the improved model, we compared the visualized feature maps before and after the model improvement, and the results are shown in Figure 7. It can be found that the improved model extracts more prominent features compared to the original YOLOv5 model, which enhances the recognition ability of the network.
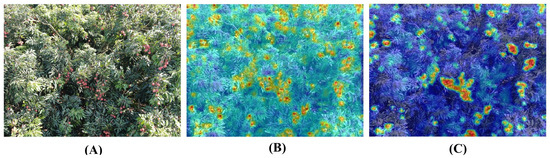
Figure 7.
Comparison of visualization feature maps. (A) Original image. (B) Feature map of the YOLOv5 model. (C) Feature map of the proposed model.
3.1.2. P2 Feature Layer Fusion
The P2 layer features are fused on top of the BiFPN used, with the aim of retaining more high-resolution information to make the feature map after BiFPN fusion retain more localization information about the small target litchi. According to Figure 8, it can be seen that the classification loss generally decreases the fastest at 0–25 epochs and approaches convergence at 175–300 epochs. The model after the P2 feature layer fuse has a faster decline when trained to about 125 epochs, while the model with the added P2 feature layer fusion has lower classification loss and faster convergence than the model without the fused P2 feature layer.
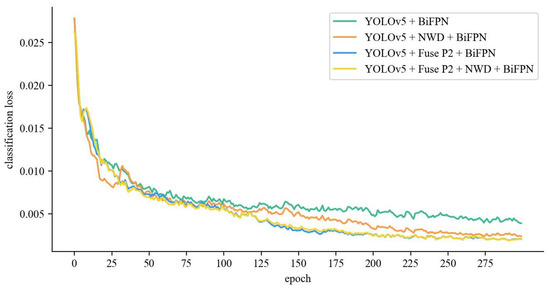
Figure 8.
Classification loss of P2 feature layer fusion.
These advantages also make it effective to incorporate the P2 feature layer into feature fusion; as can be seen briefly in Table 2, the increases from 55.2% to 62.9% after fusing the P2 feature layer, while the detection accuracy for small targets also improves, specifically from 31.6% to 35.9%. These figures indicate that the localization information of the litchi target is effectively transferred to the feature map, making the detection more efficient.
3.1.3. NWD
To explore the contribution of NWD and CIoU to the regression loss function, we explored the effect of these two metrics on small target detection by adjusting the ratio between them and the results are shown in Table 4.
Table 4.
Comparative effect of CIoU and NWD ratio adjustment.
In our experiments, we found that replacing NWD completely with CIoU is effective but not very helpful for small target litchi, and setting the proportion factor of each of them to 0.5 is the most effective for improving the recognition accuracy of small targets, but the recognition accuracy of medium and large targets is slightly reduced compared to the model with NWD set to 1. The overall recognition accuracy of the model is improved by setting the proportion factor of CIoU to 0.2 and the proportion factor of NWD to 0.8, compared to the model with the proportion factor of NWD set to 1. Although its are smaller than the combination of the proportion factor set to 0.5 and 0.5, we believe that the recognition accuracy of medium and large targets is equally important for litchi fruit yield estimation. Therefore, we believe that the combination of NWD and CIoU with proportion factors of 0.2 and 0.8, respectively, is optimal.
However, as can be seen from Table 2, the performance of NWD on the original YOLOv5 model is not satisfactory and the is degraded. Nevertheless, when using BiFPN for feature fusion, NWD shows good performance, probably because the BiFPN cross-scale fusion and weighted feature fusion make the fused features more informative and accurate, enabling NWD to work better. More specifically, the use of NWD increases the from 55.2% to 63.6% and from 31.6% to 35.8%, while the model size and parameters do not change. This is a good demonstration that NWD can have a positive effect on the detection of small targets.
3.1.4. SAHI
From the above experimental results, it can be concluded that using SAHI as the post-processing step of this model can significantly increase the detection accuracy of the model for small litchi, as shown in Table 2. The increases by 8.5% after using SAHI and the detection accuracy of small targets increases by 21.1%, but at the same time the detection accuracy of large targets decreases by 2%. Since there is no need to obtain a larger feature map, the use of SAHI can significantly reduce the memory requirements of the network. Usually the number of slices and the overlap rate between slices are linearly related to the computation time, and the number of slices and the overlap rate can be flexibly adjusted dynamically according to the usage requirements to achieve real-time and adaptable devices.
In order to investigate the reason for the decrease in large object recognition accuracy after using SAHI, we compared the prediction results before and after using SAHI. As shown in Figure 9, the detection of small targets (orange area) can be effectively improved after using SAHI, which is due to the slicing method of SAHI. But at the same time, some medium and large targets are incorrectly detected (purple area) due to the use of the slicing method, which is the reason for the decrease in the detection accuracy of medium and large targets. Meanwhile, this paper observes that usually the areas of small targets on the screen are often in the edge and corner regions of the image, so using an appropriate slicing strategy can be a good solution to this problem and optimize the inference speed of SAHI, which will be the next research direction. In addition, since the SAHI slicing operation causes an increase in inference time, we suggest not using SAHI for post-processing when orchard rough yield estimation is needed and employing SAHI processing when accurate yield estimation data is needed, which will effectively improve yield estimation efficiency.
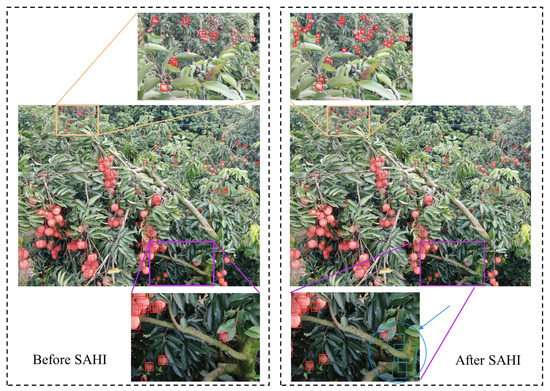
Figure 9.
The detection effect comparison before and after using SAHI. Orange region demonstrates the improved detection of SAHI for small targets, and purple region demonstrates the misdetection of SAHI for medium and large targets.
4. Comparative Discussion
4.1. Comparison with Other Object Detection Algorithms
The above study shows that our proposed model has a better detection effect than the original YOLOv5. To further explore the advantages and disadvantages between the performance of our proposed model and the current excellent object detection models, we trained a variety of excellent object detection models, including DETR [35], Faster R-CNN [21], RetinaNet [24], SSD [25], YOLOX [36], and FCOS [37], under the same experimental environment and datasets. We divide the proposed models into two versions, which are called YOLOv5-TinyLitchi and YOLOv5-TinyLitchi with SAHI. The results are shown in Table 5.
Table 5.
Detection results of different object detection algorithms on litchi images.
The following can be concluded from Table 5. Firstly, YOLOv5-TinyLitchi with SAHI is superior to other models in , , , and , with reaching a high value of 57.3%, indicating that the model can be usefully applied with orchard litchi yield estimation for all three sizes of litchi with good detection effect. Although the of YOLOv5-TinyLitchi (64.1%) is lower than that of YOLOX (68.1%), the (88.0%) is higher than that of YOLOX (80.3%) and the of YOLOv5-TinyLitchi is still better than that of Faster R-CNN. Furthermore, the of YOLOv5-TinyLitchi with SAHI (72.6%) is higher than that of YOLOX (68.1%), the FPS of YOLOv5-TinyLitchi is three times that of YOLOX, and the model size is much smaller than that of YOLOX, which is more favorable to the real-time requirements of orchard litchi object detection and is also friendly to the deployment and implementation of the model.
4.2. Analysis of Model Detection Effects
In this study, a variety of detection situations are analyzed to explore the detection performance of the model for litchi fruits in different states. From Figure 10A,B, it can be seen that the improved model has good detection performance for both mature and immature litchis of tiny targets.
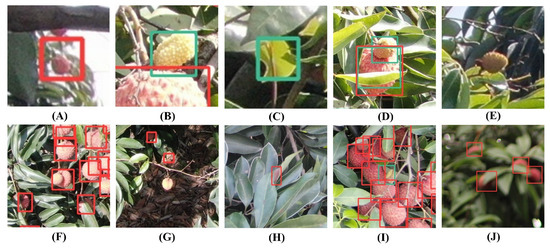
Figure 10.
Examples of various detections in the dataset. (A,B) Correct detection results. (C–H) Missed and misdirected detections affected by factors such as the environment and illumination. (I,J) Detection effect in occlusion and blurring situations. The red box denotes that the detection is for mature litchi and the green box denotes that the detection is for immature litchi.
However, with the analysis of more detection data, we also found the following problems. The litchi in the early stage of rapid growth of the pericarp tends to be smaller and the color is similar to the background color, even if the human eye also depends on the contour information to distinguish them, which leads to the model being able to only learn the color features to identify the leaves as immature litchi, resulting in a false detection, as shown in Figure 10C. In addition, in the late stage of rapid growth of the pericarp, the litchi profile is similar to the mature litchi profile, which, in the case of inadequate learning of color features, is often considered by the model as mature litchi, resulting in wrong detection, as shown in Figure 10D. At the same time, the combination of low resolution and being too small itself makes it difficult to detect such immature litchi, as shown in Figure 10E.
As litchi tend to grow in clusters, the inner litchi will be obscured by the outer litchi, and the model has limited ability to detect litchi with large obscured areas, especially for two litchis overlapping together when it is difficult to distinguish them, which will always have an impact on accurate yield estimation, as in Figure 10F. Due to the effect of daytime lighting, some litchi show overexposure in the image, resulting in inaccurate color characteristics, which are not conducive to model detection, as in Figure 10G. In addition, as some leaves turn reddish-brown, they can be easily detected as litchi with insufficient resolution, as shown in Figure 10H. Despite this, our model still has certain detection ability for occluded immature fruits, as in Figure 10I. Meanwhile, owing to the enhanced feature extraction network, the present model still has certain robustness to fuzzy fruits, as shown in Figure 10J. Finally, due to this experiment, while applying UAV remote sensing images for target detection, limited by the lack of pixels of the UAV camera, there are requirements for flight altitude. Usually the litchi is growing horizontally, and the canopy is usually large and dense. When encountering a tree crown that is too large, the UAV can not collect the complete crown image all at once, making this model less practical in this situation.
Although the present model makes it difficult to detect litchi targets with missing pixel information, it still has better performance for small target litchi that possess better pixel information retention.
4.3. Test Results on Datasets
Compared with the original YOLOv5 model, our proposed model has a significant advantage for small targets, see the purple region in Figure 11. In addition, for occluded objects, our proposed model has better recognition ability, see the orange region in Figure 11.
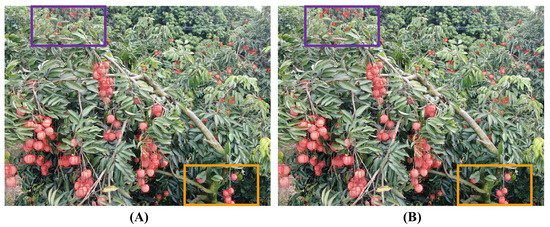
Figure 11.
Comparison of the effects of the proposed model and the original model. Purple region shows the detection for the small target litchi and orange region shows the detection for the occluded litchi. (A) Original YOLOv5 model. (B) Proposal model.
We selected six pictures from three different photographic perspectives, namely: front view perspective (Figure 12(A1,A2)), top view perspective (Figure 12(B1,B2)), and other perspective (Figure 12(C1,C2)) to detect litchi fruits, and then compared with the results of manual counting to calculate the correct detection rate and error detection rate. The results are shown in the Table 6.
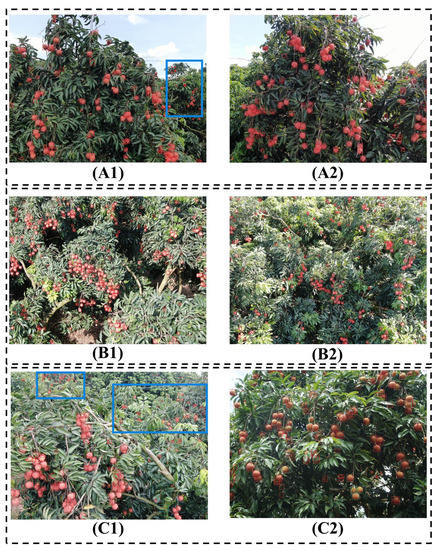
Figure 12.
The detection effect on three different photographic perspectives. (A1,A2) Front view perspective of litchi tree. (B1,B2) Top view perspective of litchi tree. (C1,C2) Other perspective of litchi tree. Blue region demonstrates the excellent detection ability of the proposed model for small target litchi.
Table 6.
The test results on three different photographic perspectives.
According to Table 6, although the correct detection rate in Figure 12(A1,C1) is lower than 90%, this is caused by the missed detection due to the limited number of pixel points presented on the image due to the partial distance of the litchi in the blue area of the figure. The low correct detection rate in Figure 12(B2) is caused by the distance from the target when the image is captured, while in Figure 12(B1) the correct detection rate reaches 93.4% because the sampling distance is appropriate, so the sampling distance should be strictly controlled when the image is captured, especially in the dense litchi image collection; even if the number of litchi on the image is close to 300, the model can still have good accuracy.
It can be seen that the model can be applied to the actual yield estimation application of the orchard, in which the actual production can sample the front view, side view, back view, and top view of the fruit tree to establish a regression model, and then can get the estimation data, which will also be the subsequent research direction of this study.
5. Conclusions
This paper proposes a litchi small target detection method based on an improved YOLOv5 model, using the litchi dataset obtained from large scenes and combining NWD, BiFPN, and SAHI with YOLOv5, leading to the development of the YOLOv5-TinyLitchi model. This model improves the from 50.6% to 72.6%, while the model size only increases by 0.23 MB. It can still be applied under a variety of shooting perspectives with good robustness. Meanwhile the reached 71.4. This will make it possible for UAVs to estimate litchi yields in orchard scenarios real time, and can provide data support for growers to make quick pricing decisions and decide on harvest time. Moreover, it can provide guidance for early crop water and fertilizer management. There are certain problems in our model; due to the need for small target litchi detection, our only reached 57.3%. This will have an impact on the yield estimation of small target litchi. Therefore, future research can continue to optimize our model, developing a more robust and accurate yield estimation, thereby producing greater application value for the litchi industry. Nonetheless, the model proposed in this paper remains highly practical and can provide valuable technical support to fruit farmers for yield estimation and guidance for litchi harvesting.
In addition, this model can be deployed in smartphone terminals to provide yield estimation services to individual growers. Alternatively, it can be deployed in the cloud to provide a smart orchard management scheme for large-scale planters.
Author Contributions
Conceptualization, Z.X. and L.W.; methodology, Z.X.; software, Z.X.; validation, Z.X., L.W. and Y.Z.; formal analysis, Y.Z.; investigation, L.W.; resources, L.W.; data curation, Y.Z.; writing—original draft preparation, Z.X. and L.W.; writing—review and editing, Z.X. and L.W.; visualization, Y.Z.; supervision, Y.L.; project administration, Y.L.; funding acquisition, Y.L. All authors have read and agreed to the published version of the manuscript.
Funding
This research was funded by the Laboratory of Lingnan Modern Agriculture Project (Grant No. NT2021009), the Key-Area Research and Development Program of Guangdong Province (Grant No. 2019B020214003), and Top Talents Program for One Case One Discussion of Shandong Province, the 111 Project (Grant No. D18019).
Conflicts of Interest
The authors declare no conflict of interest.
References
- Wen’E, Q.; Houbin, C.; Tao, L.; Fengxian, S. Development Status, Trend and Suggestion of Litchi Industry in Mainland China. Guangdong Agric. Sci. 2019, 46, 132–139. [Google Scholar] [CrossRef]
- Qi, W.; Chen, H.; Li, J. Status, Trend and Countermeasures of Development of Litchi Industry in the Mainland of China in 2022. Guangdong Agric. Sci. 2023, 1–10. [Google Scholar]
- Lan, Y.; Huang, Z.; Deng, X.; Zhu, Z.; Huang, H.; Zheng, Z.; Lian, B.; Zeng, G.; Tong, Z. Comparison of machine learning methods for citrus greening detection on UAV multispectral images. Comput. Electron. Agric. 2020, 171, 105234. [Google Scholar] [CrossRef]
- Chen, P.; Douzals, J.P.; Lan, Y.; Cotteux, E.; Delpuech, X.; Pouxviel, G.; Zhan, Y. Characteristics of unmanned aerial spraying systems and related spray drift: A review. Front. Plant Sci. 2022, 13, 870956. [Google Scholar] [CrossRef]
- Junos, M.H.; Mohd Khairuddin, A.S.; Thannirmalai, S.; Dahari, M. Automatic detection of oil palm fruits from UAV images using an improved YOLO model. Vis. Comput. 2022, 38, 2341–2355. [Google Scholar] [CrossRef]
- Maldonado, W., Jr.; Barbosa, J.E.C. Automatic green fruit counting in orange trees using digital images. Comput. Electron. Agric. 2016, 127, 572–581. [Google Scholar] [CrossRef]
- Bhargava, A.; Bansal, A. Automatic Detection and Grading of Multiple Fruits by Machine Learning. Food Anal. Methods 2020, 13, 751–761. [Google Scholar] [CrossRef]
- Xiong, J.; Lin, R.; Liu, Z.; He, Z.; Tang, L.; Yang, Z.; Zou, X. The recognition of litchi clusters and the calculation of picking point in a nocturnal natural environment. Biosyst. Eng. 2018, 166, 44–57. [Google Scholar] [CrossRef]
- Wang, C.; Tang, Y.; Zou, X.; Luo, L.; Chen, X. Recognition and Matching of Clustered Mature Litchi Fruits Using Binocular Charge-Coupled Device (CCD) Color Cameras. Sensors 2017, 17, 2564. [Google Scholar] [CrossRef]
- Girshick, R.; Donahue, J.; Darrell, T.; Malik, J. Rich Feature Hierarchies for Accurate Object Detection and Semantic Segmentation. In Proceedings of the 2014 IEEE Conference on Computer Vision and Pattern Recognition, Columbus, OH, USA, 23–28 June 2014; pp. 580–587. [Google Scholar] [CrossRef]
- Apolo-Apolo, O.E.; Martinez-Guanter, J.; Egea, G.; Raja, P.; Pérez-Ruiz, M. Deep learning techniques for estimation of the yield 556 and size of citrus fruits using a UAV. Eur. J. Agron. 2020, 115, 126030. [Google Scholar] [CrossRef]
- Gao, F.; Fu, L.; Zhang, X.; Majeed, Y.; Li, R.; Karkee, M.; Zhang, Q. Multi-class fruit-on-plant detection for apple in SNAP system using Faster R-CNN. Comput. Electron. Agric. 2020, 176, 105634. [Google Scholar] [CrossRef]
- Zhang, J.; Karkee, M.; Zhang, Q.; Zhang, X.; Yaqoob, M.; Fu, L.; Wang, S. Multi-class object detection using faster R-CNN and estimation of shaking locations for automated shake-and-catch apple harvesting. Comput. Electron. Agric. 2020, 173, 105384. [Google Scholar] [CrossRef]
- Redmon, J.; Divvala, S.; Girshick, R.; Farhadi, A. You only look once: Unified, real-time object detection. In Proceedings of the IEEE Conference on Computer Vision and Pattern Recognition, Las Vegas, NV, USA, 27–30 June 2016; pp. 779–788. [Google Scholar] [CrossRef]
- Lin, P.; Li, D.; Jia, Y.; Chen, Y.; Huang, G.; Elkhouchlaa, H.; Yao, Z.; Zhou, Z.; Zhou, H.; Li, J.; et al. A novel approach for estimating the flowering rate of litchi based on deep learning and UAV images. Front. Plant Sci. 2022, 13, 966639. [Google Scholar] [CrossRef]
- Wang, L.; Zhao, Y.; Xiong, Z.; Wang, S.; Li, Y.; Lan, Y. Fast and precise detection of litchi fruits for yield estimation based on the improved YOLOv5 model. Front. Plant Sci. 2022, 13, 965425. [Google Scholar] [CrossRef]
- Liang, J.; Chen, X.; Liang, C.; Long, T.; Tang, X.; Shi, Z.; Zhou, M.; Zhao, J.; Lan, Y.; Long, Y. A detection approach for late-autumn shoots of litchi based on unmanned aerial vehicle (UAV) remote sensing. Comput. Electron. Agric. 2023, 204, 107535. [Google Scholar] [CrossRef]
- Liu, G.; Han, J.; Rong, W. Feedback-driven loss function for small object detection. Image Vis. Comput. 2021, 111, 104197. [Google Scholar] [CrossRef]
- Gong, Y.; Yu, X.; Ding, Y.; Peng, X.; Zhao, J.; Han, Z. Effective fusion factor in FPN for tiny object detection. In Proceedings of the IEEE/CVF Winter Conference on Applications of Computer Vision, Waikoloa, HI, USA, 5–9 January 2021; pp. 1160–1168. [Google Scholar] [CrossRef]
- Girshick, R. Fast R-CNN. In Proceedings of the 2015 IEEE International Conference on Computer Vision (ICCV), Santiago, Chile, 7–13 December 2015; pp. 1440–1448. [Google Scholar] [CrossRef]
- Ren, S.; He, K.; Girshick, R.; Sun, J. Faster R-CNN: Towards Real-Time Object Detection with Region Proposal Networks. IEEE Trans. Pattern Anal. Mach. Intell. 2017, 39, 1137–1149. [Google Scholar] [CrossRef]
- Redmon, J.; Farhadi, A. Yolov3: An incremental improvement. arXiv 2018, arXiv:1804.02767. [Google Scholar] [CrossRef]
- Bochkovskiy, A.; Wang, C.Y.; Liao, H.Y.M. Yolov4: Optimal speed and accuracy of object detection. arXiv 2020, arXiv:2004.10934. [Google Scholar] [CrossRef]
- Lin, T.Y.; Goyal, P.; Girshick, R.; He, K.; Dollar, P. Focal Loss for Dense Object Detection. In Proceedings of the IEEE International Conference on Computer Vision (ICCV), Venice, Italy, 22–29 October 2017. [Google Scholar] [CrossRef]
- Liu, W.; Anguelov, D.; Erhan, D.; Szegedy, C.; Reed, S.; Fu, C.Y.; Berg, A.C. SSD: Single Shot MultiBox Detector. In Computer Vision—ECCV 2016; Leibe, B., Matas, J., Sebe, N., Welling, M., Eds.; Springer: Cham, Switzerland, 2016; pp. 21–37. [Google Scholar] [CrossRef]
- Tan, M.; Pang, R.; Le, Q.V. Efficientdet: Scalable and efficient object detection. In Proceedings of the IEEE/CVF Conference on Computer Vision and Pattern Recognition, Seattle, WA, USA, 13–19 June 2020; pp. 10781–10790. [Google Scholar] [CrossRef]
- Chen, J.; Mai, H.; Luo, L.; Chen, X.; Wu, K. Effective Feature Fusion Network in BIFPN for Small Object Detection. In Proceedings of the 2021 IEEE International Conference on Image Processing (ICIP), Anchorage, AK, USA, 19–22 September 2021; pp. 699–703. [Google Scholar] [CrossRef]
- Lv, J.; Xu, H.; Han, Y.; Lu, W.; Xu, L.; Rong, H.; Yang, B.; Zou, L.; Ma, Z. A visual identification method for the apple growth forms in the orchard. Comput. Electron. Agric. 2022, 197, 106954. [Google Scholar] [CrossRef]
- Liu, X.; Li, G.; Chen, W.; Liu, B.; Chen, M.; Lu, S. Detection of dense Citrus fruits by combining coordinated attention and cross-scale connection with weighted feature fusion. Appl. Sci. 2022, 12, 6600. [Google Scholar] [CrossRef]
- Wang, J.; Xu, C.; Yang, W.; Yu, L. A normalized Gaussian Wasserstein distance for tiny object detection. arXiv 2021, arXiv:2110.13389. [Google Scholar] [CrossRef]
- Yang, J.; Yang, H.; Wang, F.; Chen, X. A modified YOLOv5 for object detection in UAV-captured scenarios. In Proceedings of the 2022 IEEE International Conference on Networking, Sensing and Control (ICNSC), Shanghai, China, 15–18 December 2022; pp. 1–6. [Google Scholar] [CrossRef]
- Yu, Z.; Huang, H.; Chen, W.; Su, Y.; Liu, Y.; Wang, X. YOLO-FaceV2: A Scale and Occlusion Aware Face Detector. arXiv 2022, arXiv:2208.02019. [Google Scholar] [CrossRef]
- Xu, C.; Wang, J.; Yang, W.; Yu, H.; Yu, L.; Xia, G.S. Detecting tiny objects in aerial images: A normalized Wasserstein distance and a new benchmark. ISPRS J. Photogramm. Remote Sens. 2022, 190, 79–93. [Google Scholar] [CrossRef]
- Akyon, F.C.; Onur Altinuc, S.; Temizel, A. Slicing Aided Hyper Inference and Fine-Tuning for Small Object Detection. In Proceedings of the 2022 IEEE International Conference on Image Processing (ICIP), Bordeaux, France, 16–19 October 2022; pp. 966–970. [Google Scholar] [CrossRef]
- Carion, N.; Massa, F.; Synnaeve, G.; Usunier, N.; Kirillov, A.; Zagoruyko, S. End-to-end object detection with transformers. In European Conference on Computer Vision; Springer: Berlin/Heidelberg, Germany, 2020; pp. 213–229. [Google Scholar] [CrossRef]
- Ge, Z.; Liu, S.; Wang, F.; Li, Z.; Sun, J. Yolox: Exceeding yolo series in 2021. arXiv 2021, arXiv:2107.08430. [Google Scholar] [CrossRef]
- Tian, Z.; Shen, C.; Chen, H.; He, T. FCOS: Fully Convolutional One-Stage Object Detection. In Proceedings of the IEEE/CVF International Conference on Computer Vision (ICCV), Seoul, Republic of Korea, 27 October–2 November 2019. [Google Scholar]


Disclaimer/Publisher’s Note: The statements, opinions and data contained in all publications are solely those of the individual author(s) and contributor(s) and not of MDPI and/or the editor(s). MDPI and/or the editor(s) disclaim responsibility for any injury to people or property resulting from any ideas, methods, instructions or products referred to in the content. |
© 2023 by the authors. Licensee MDPI, Basel, Switzerland. This article is an open access article distributed under the terms and conditions of the Creative Commons Attribution (CC BY) license (https://creativecommons.org/licenses/by/4.0/).