Communication

Drone-Based Assessment of Marine Megafauna off Wave-Exposed Sandy Beaches

1
National Marine Science Centre and Marine Ecology Research Centre, Southern Cross University, P.O. Box 4321, Coffs Harbour, NSW 2450, Australia
2
New South Wales Department of Primary Industries, P.O. Box 4321, Coffs Harbour, NSW 2450, Australia
3
School of Science and Engineering, University of the Sunshine Coast, Maroochydore, QLD 4556, Australia
4
National Parks and Wildlife Service, Coffs Harbour, NSW 2450, Australia
*
Author to whom correspondence should be addressed.
Remote Sens. 2023, 15(16), 4018; https://doi.org/10.3390/rs15164018
Submission received: 28 June 2023 / Revised: 1 August 2023 / Accepted: 10 August 2023 / Published: 14 August 2023
(This article belongs to the Special Issue Remote Sensing for Applied Wildlife Ecology)

Abstract

:
The wave-impacted waters off exposed sandy beaches support marine megafauna, including dolphins, whales, sharks, rays and turtles. To characterise variation in megafaunal assemblages in this challenging habitat, we used drone-based remote sensing to survey marine megafauna off 23 beaches along 1050 km of the New South Wales (NSW, Australia) coast from 2017 to 2020. The surveys occurred from September to May and included 17,085 drone flights, with megafaunal abundances standardised by flight hours. In total, we identified 3838 individual animals from 16 taxa, although no megafauna was observed off 5 of the 23 beaches surveyed. Bottlenose dolphins were the most commonly sighted taxa and accounted for 82.3% of total megafaunal abundance. Cownose (6.7%) and eagle (3.4%) rays were the next most abundant taxa, with potentially dangerous sharks being rarely sighted (<1% of total megafauna). The megafaunal assemblages off wave-exposed beaches in northern NSW significantly differed from those in the central region, whereas the assemblages off the central region and southern NSW did not differ significantly. Wave exposure and water temperature were the best predictors of megafaunal assemblage structure. The richness of marine megafauna off ocean beaches was significantly greater in northern than southern NSW, and turtles were only observed off beaches in the northern region. However, variation in megafaunal richness, as well as the abundances of total megafauna, dolphins, rays, sharks and turtles were not significantly explained by water temperature, wave height, distance to estuary, or proximity to the nearest reef. Overall, drone-based surveys determined that megafaunal assemblages off wave-exposed beaches are characterised by sparse individuals or small groups of sharks, turtles and rays, punctuated by occasional large aggregations of dolphins, cownose rays and schooling sharks. The exception to this pattern was bottlenose dolphins, which routinely patrolled some beaches in northern NSW.

Graphical Abstract

1. Introduction

Sandy beaches represent approximately 31% of the world’s ice-free shorelines and dominate the coastlines of many nations [1,2]. Sandy beaches are used by people for many activities, such as sunbathing, walking, swimming, surfing, wildlife observation, fishing, education, boating, off-road driving, sand mining and mineral extraction [3,4,5]. Marine and terrestrial wildlife also use sandy beaches for feeding, nesting, breeding and raising young [6]. Furthermore, some beaches support spectacular wildlife events, such as seal pups being taken by orca [7], male elephant seals battling for beach territories [8], or sea turtles nesting on mass [2]. Despite their ecological and socio-economic value, sandy beach ecosystems are threatened by multiple stressors, such as increased beach use by humans, declining water quality, global climate change, overfishing and coastal development [3,5,9].
The dynamic waters off ocean beaches support assemblages of marine megafauna [10,11], which can include large fishes (e.g., game fish, sharks and rays), reptiles (e.g., turtles and crocodiles), mammals (e.g., pinnipeds, sirenians and cetaceans) and large marine birds (e.g., large penguins). The marine megafauna off sandy beaches includes threatened, protected and economically important species, such as green turtles Chelonia mydas [2], dolphins [12] and large mulloway Argyrosomus japonicus [13], respectively. The large wildlife using the sub-tidal waters off wave-exposed beaches often engage in activities that are transient in nature, such as efficiently moving among reefs or seeking respite during migrations. However, some of these transient activities (e.g., hunting sparse prey or feeding on temporary bait fish aggregations) still contribute to the top-down processes of sandy beach ecosystems [6,10,14]. Although the populations of some species of megafauna using waters off sandy beaches are relatively stable, others are in decline due to increasing anthropogenic stress [10]. To date, there is limited baseline information about megafaunal assemblages off wave-exposed beaches due to the logistical challenge of accurately sampling large subtidal animals in and around dynamic surf zones.
The rapid development of reliable and affordable remotely piloted aircraft (hereafter called drones) with high-resolution cameras has provided a useful method for sampling marine wildlife [15,16,17], as well as the structure and diversity of megafaunal assemblages [10,18]. Drones have been used to successfully survey many types of marine megafauna, such as whales [19,20], porpoises and dolphins [12,21], sirenians [22,23], sea turtles [24,25], sharks [26,27], pinnipeds [28,29,30,31], rays [32,33] and game fish [10]. As well as making it easier to sample marine wildlife in challenging habitats, drones have also made it safer to sample potentially dangerous predators (e.g., sharks [26] and crocodiles [34]). Drones are often more cost-effective than crewed aircraft for sampling marine wildlife [35], and provide more accurate and precise estimates of megafauna off wave-exposed beaches than using trained observers in helicopters [11]. To date, the vast majority of drone sampling of marine megafauna has been location specific. Although pragmatic, this localised approach has limited the capacity of drone monitoring to support management and conservation efforts at regional levels.
Here, we used drone-based remote sensing to assess spatial variation in the structure and diversity of marine megafaunal assemblages off 23 wave-exposed beaches situated along 1050 km of coastline in New South Wales (NSW, Australia). These assemblages contained 16 megafaunal taxa, including dolphins, sharks, rays, sea turtles and whales. As well as documenting spatial patterns of megafauna off ocean beaches over 8.4° of latitude, we tested the hypotheses that the structure of megafaunal assemblages varies among beaches in northern, central and southern NSW, Australia. We also tested whether the richness and abundance of megafauna off beaches are significantly influenced by ocean temperature and wave climate, as well as distances from estuaries and nearby rocky reefs.

2. Materials and Methods

2.1. Sampling Methodology

Marine megafauna was sampled using drones off 23 ocean beaches in NSW on the east coast of Australia (Figure 1). These beaches, situated between Kingscliff (28.255883°S, 153.578608°E) and Pambula (36.941306°S, 149.910049°E), were wave-exposed and are popular amongst beachgoers [36]. A 1–2 km stretch of coastline was sampled off each beach, focusing on the area directly outside the surf break. Beaches were intensively sampled from September to May in 2017/2018, 2018/2019 and 2019/2020. Although nearly all species of marine megafauna routinely found off NSW beaches can be observed during our sampling period, some migratory megafauna (e.g., humpback whales) are particularly common in cooler months (June to October). During our three sampling periods, 17,085 individual drone flights were undertaken to assess marine megafauna off beaches. Observations of megafauna for each beach were standardised by flight hours because the total number and frequency of flights, as well as individual days sampled, varied among beaches (Figure 1).
On each beach, two flights were typically carried out every hour from 0900 to 1600 on each day of sampling. Individual drone flights were less than 25 min, with an average (±SD) flight time of 16.5 (±4.1) min. Drone flights occurred during rain-free periods with light to moderate winds. Drones were typically operated at 60 m altitude, but would be lowered to improve the accuracy of megafauna identifications where required.
Drone surveys were carried out with either a DJI Mavic 2 enterprise or a DJI Phantom 4 quadcopter. All observed megafauna were filmed in 1080 HD resolution and later reviewed in the laboratory on a high-resolution computer monitor. This approach provides more accurate and precise data than real-time identifications during drone flights [11,16]. Any observed megafauna were identified to the lowest possible taxonomic resolution. In cases where taxonomic characteristics were not visible from the air, aggregated taxa were used (i.e., whaler sharks, Carcharhinus spp. or hammerhead sharks, Sphyrna spp.). Even when a species could normally be identified from drone footage, it was still not possible to classify all individuals to species due to a range of factors (e.g., low water clarity, sun glint, depth of the animal below the surface or wind ripples). In such cases, animals were placed into unknown categories (e.g., unknown ray, unknown shark or unknown turtle). Although these data were not included in multivariate analyses of megafaunal assemblages, they were included in univariate analyses of overall abundances.
Along with marine megafauna, environmental data was collected for each of the 23 beaches using the methods described in Monteforte et al. [27]. Briefly, Google Earth PRO 7.3.4.8248 was used to measure the distance to the nearest permanently opened estuary and rocky reef. We included these predictors, as reefs and estuaries can support high densities of prey for marine megafauna, and therefore could influence the megafaunal abundances off nearby beaches [10]. We also included data on wave exposure and ocean temperature because these predictors are known to be important for sandy beach ecosystems [6]. For each beach, data on wave characteristics were obtained from the Manly Hydraulics Laboratory. Data on water temperature was sourced from the New South Wales Department of Primary Industries’ SMART drumlines and tagged shark listening stations.

2.2. Analysis of Data

Permanova [37] was used to test the hypothesis that megafaunal assemblages varied significantly among beaches in northern, central and southern NSW (Figure 1). These analyses were based on Bray–Curtis distance measures and 4999 permutations. Prior to analysis, data were transformed with a square root function, to reduce over-dispersion associated with schooling species (e.g., cownose rays and bottlenose dolphins) and to down-weight the contribution of abundant taxa to provide a more balanced view of assemblage composition [38]. The five beaches with no megafaunal sightings (i.e., Yamba, Woolgoolga, Avoca, Kiama and Malua Bay) were excluded from multivariate analyses.
Distance-based linear modelling (DistLM, [39]) was used to assess the relationships among megafaunal assemblages and predictor variables. These analyses used permutation routines to calculate a distance-based multiple regression for a linear model based on a forward ‘step’ selection procedure using the Akaike Information Criteria (AICc). The normalised predictor variables for each beach included water temperature and wave height, as well as the distance from estuaries and rocky reefs. Analysis of co-linearity found no strong relationships among predictor variables.
Generalised additive models (GAMs) were used to evaluate whether regions and key predictors explained significant variation in the richness and abundance of megafauna, as well as the numbers per flight hour of sharks, dolphins, and rays. The abundance data was transformed with a log (x + 1) function to control variance heterogeneity and the normality of the residuals. The predictor variables used were similar to those described for the DistLM analyses and fitted with a cubic spline basis to allow for potential non-linearity. Tukey’s post hoc tests were used to elucidate significant differences among regions. All models were run using a forward selection procedure in the R environment [40].

3. Results

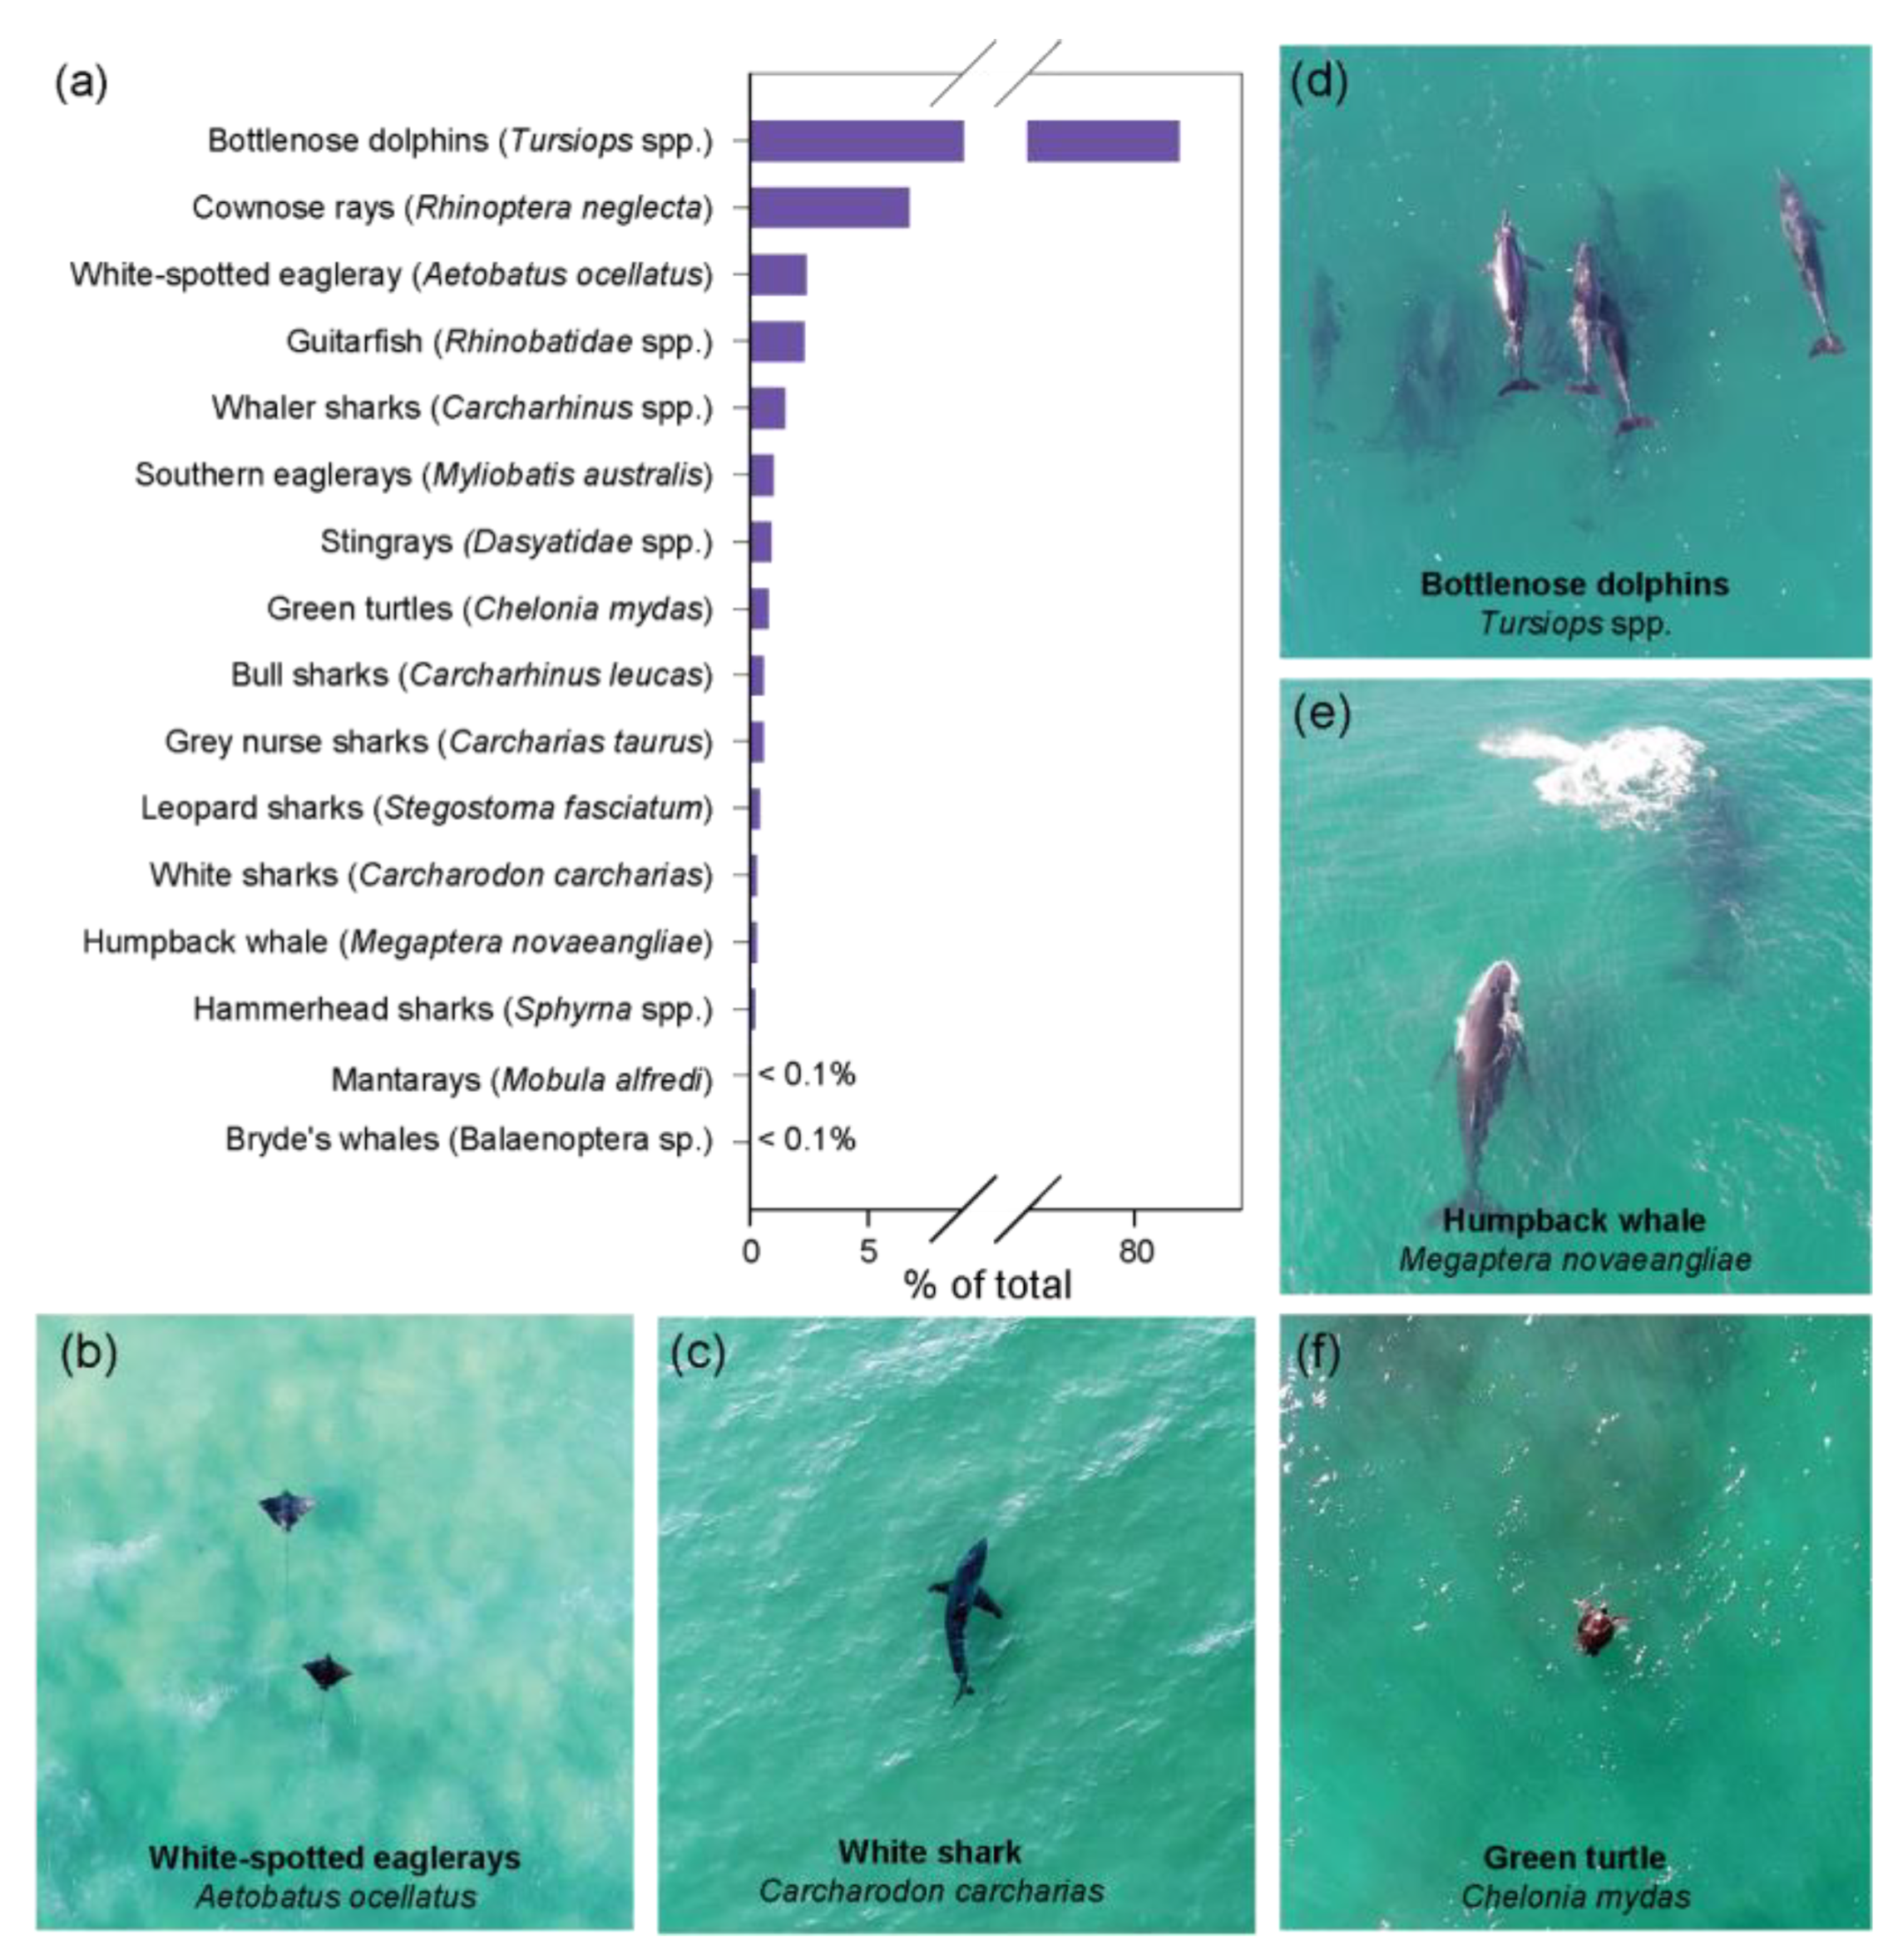
We identified 3838 individual animals from 16 megafaunal taxa in our drone surveys. The megafaunal assemblages off ocean beaches were dominated by bottlenose dolphins (Tursiops spp.), which accounted for 82.3% of the total animals (Figure 2). This was followed by Australian cownose rays (Rhinoptera neglecta, 6.7%), white-spotted eagle rays (Aetobatus ocellatus, 2.4%), shovelnose rays (2.3%), whaler sharks (Carcharhinus spp., 1.5%) and southern eagle rays (Myliobatis australis, 1.0%). Green sea turtles (Chelonia mydas) represented 0.8% of the total megafauna observed. Potentially dangerous sharks were also rare, with white (Carcharodon carcharias) and bull (Carcharhinus leucas) sharks accounting for 0.3% and 0.6% of sighted megafauna, respectively. Humpback whales (Megaptera novaeangliae) were observed close to shore during their annual migration and a Bryde’s whale (Balaenoptera sp.) was observed feeding in very shallow water.
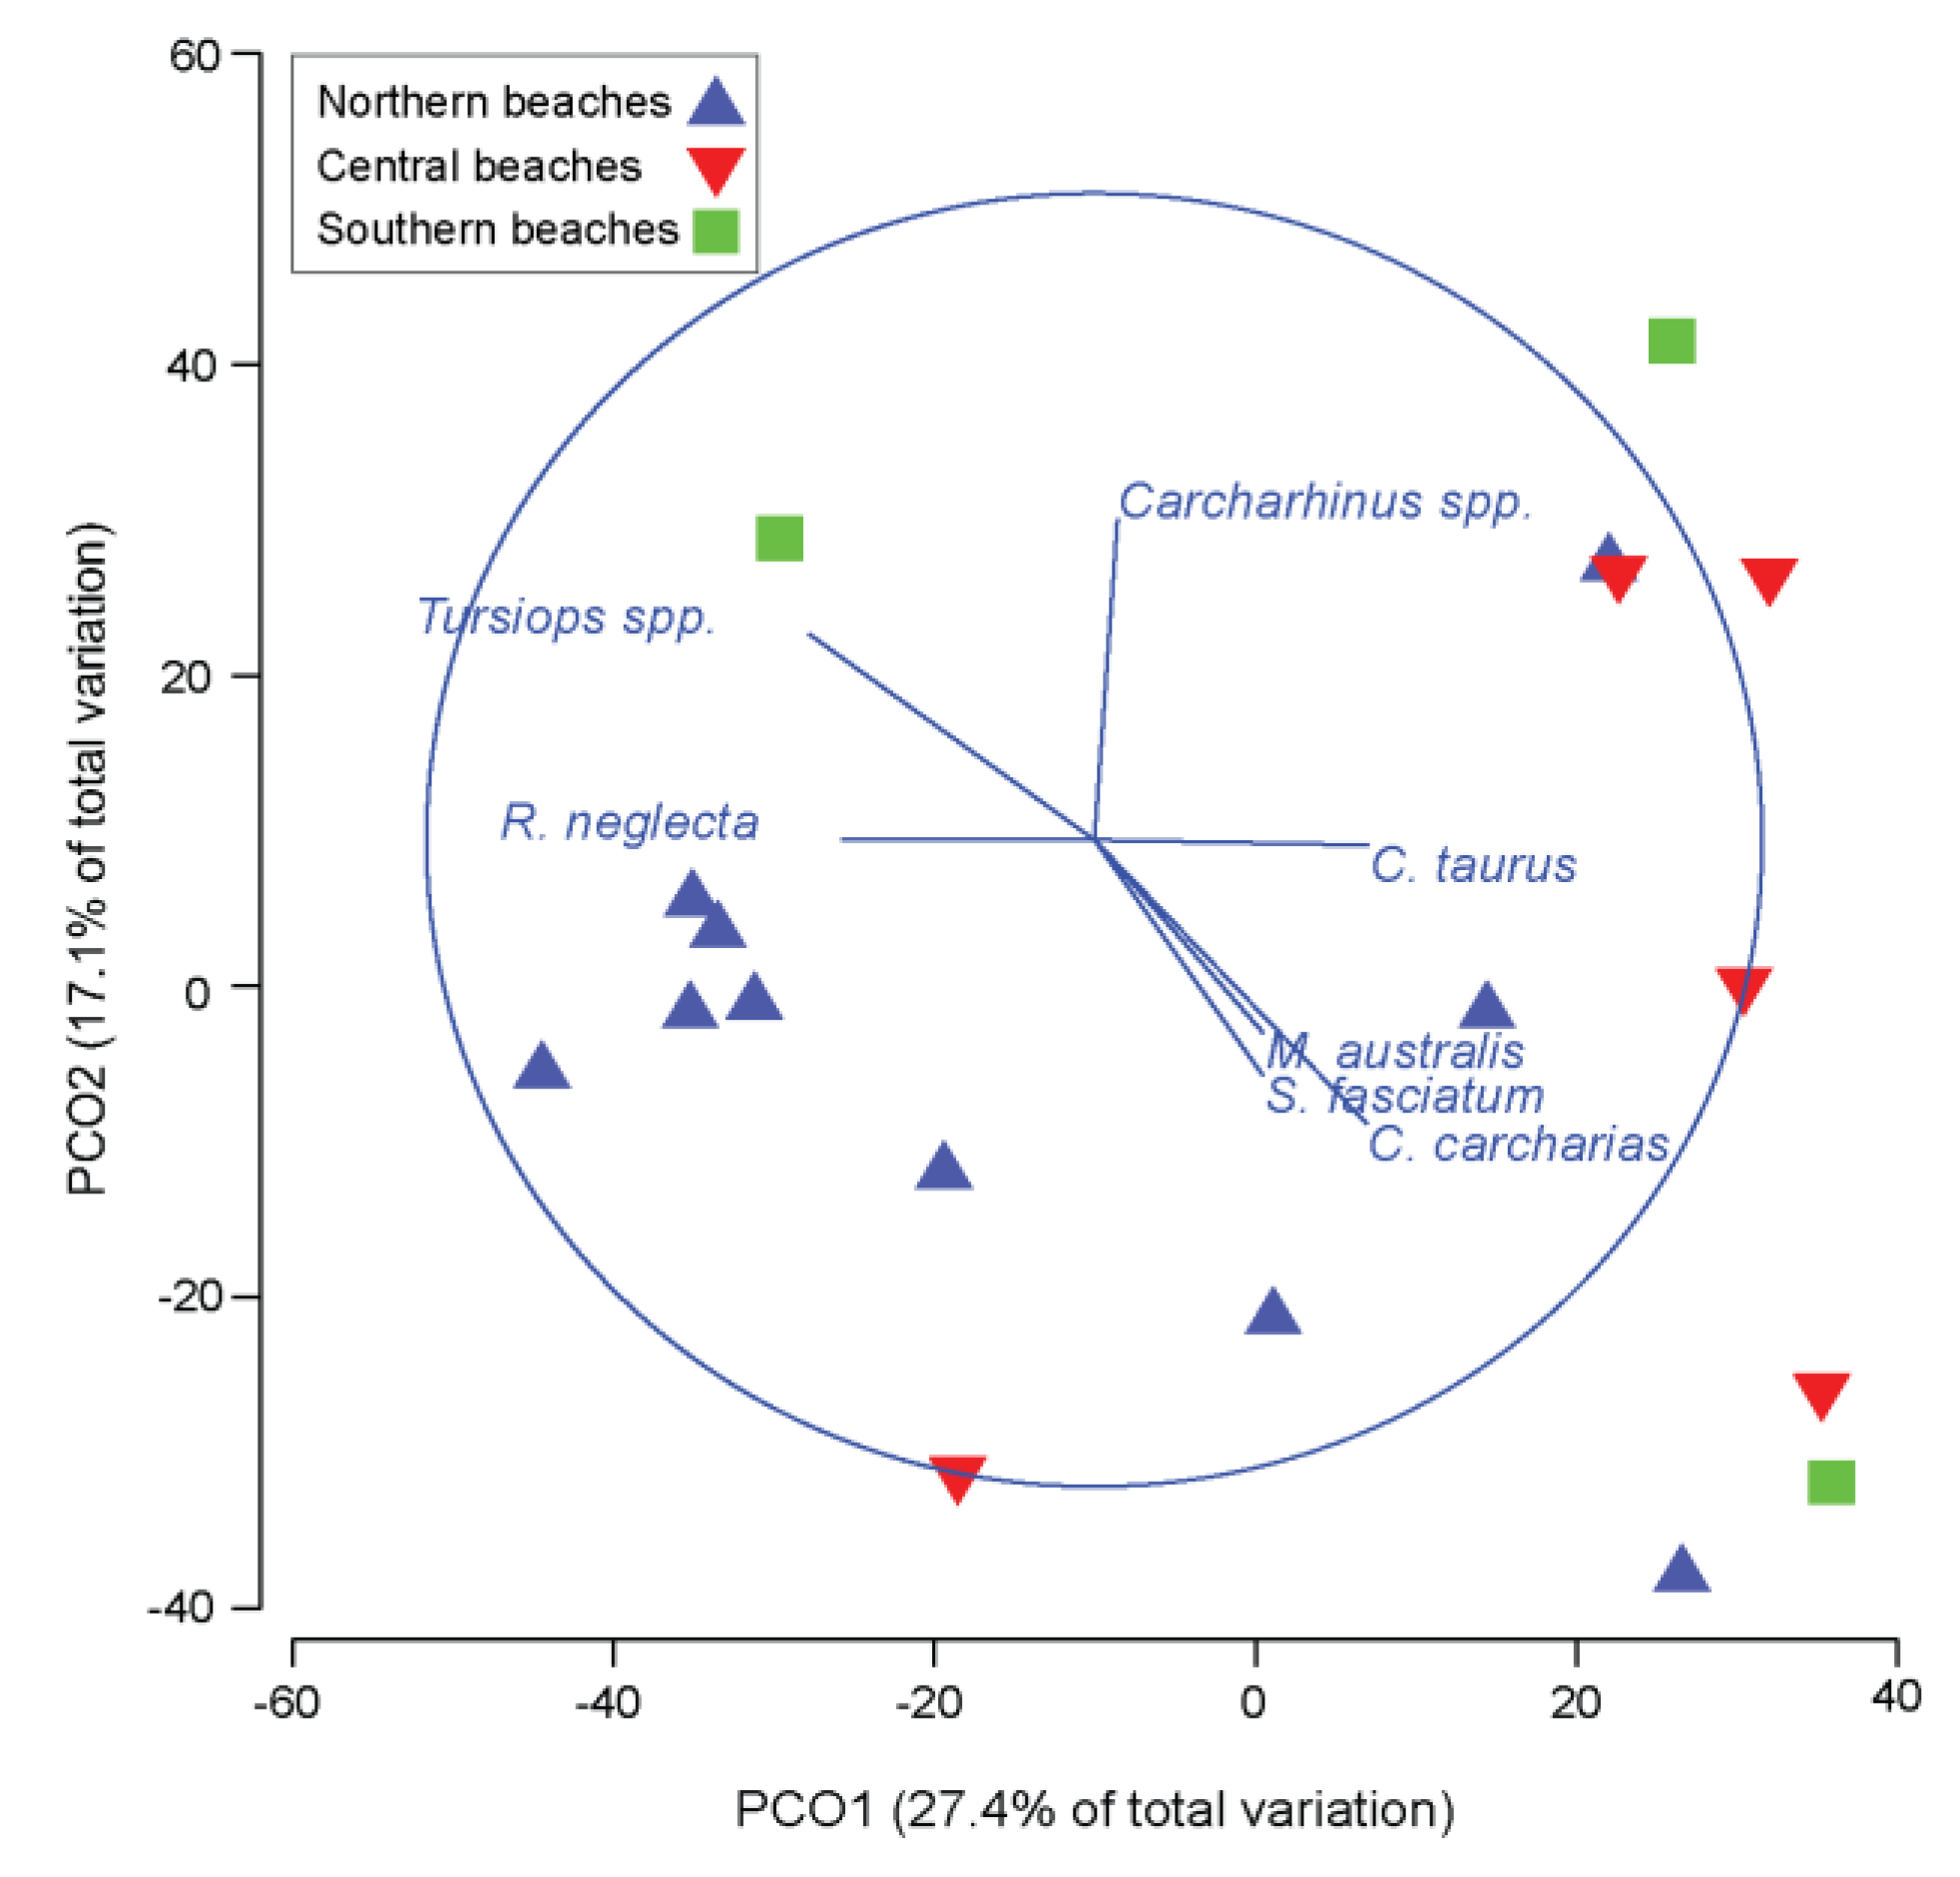
Megafaunal assemblages varied significantly among beaches in the different regions of NSW (pF2,15 = 1.78, p < 0.05, Figure 3). The megafaunal assemblages off beaches in northern NSW varied significantly from the central region (p < 0.05), but not from the beaches in the southern region (p = 0.07). There was also no significant difference between the megafaunal assemblages off beaches in the central and southern regions (p = 0.52). The two best models explaining variation in megafaunal assemblage structure had either just wave exposure (AICc = 147.5, p = 0.07) or water temperature (AICc = 147.7, p = 0.10). The other predictor variables alone (i.e., distance to the closest estuary or to rocky reefs) and combinations of predictor variables all generated AICc’s above 148.2.
Bottlenose dolphins (Tursiops spp.) and cownose rays (R. neglecta) contributed strongly to the dissimilarity between megafaunal assemblages off beaches in northern NSW compared to beaches in central and southern NSW (Figure 3). An exception to this pattern was Mollymook from southern NSW, which recorded 243 bottlenose dolphins on a single day. As analyses were based on averages, this single dolphin aggregation event had a large influence on the location of Mollymook in the principal co-ordinate analysis (see the furthest left green square in Figure 3). The structure of megafaunal assemblages off beaches in central and southern NSW was influenced by southern eagle rays (M. australis), leopard sharks (Stegostoma fasciatum), white sharks (C. carcharias) and grey nurse sharks (Carcharias taurus).
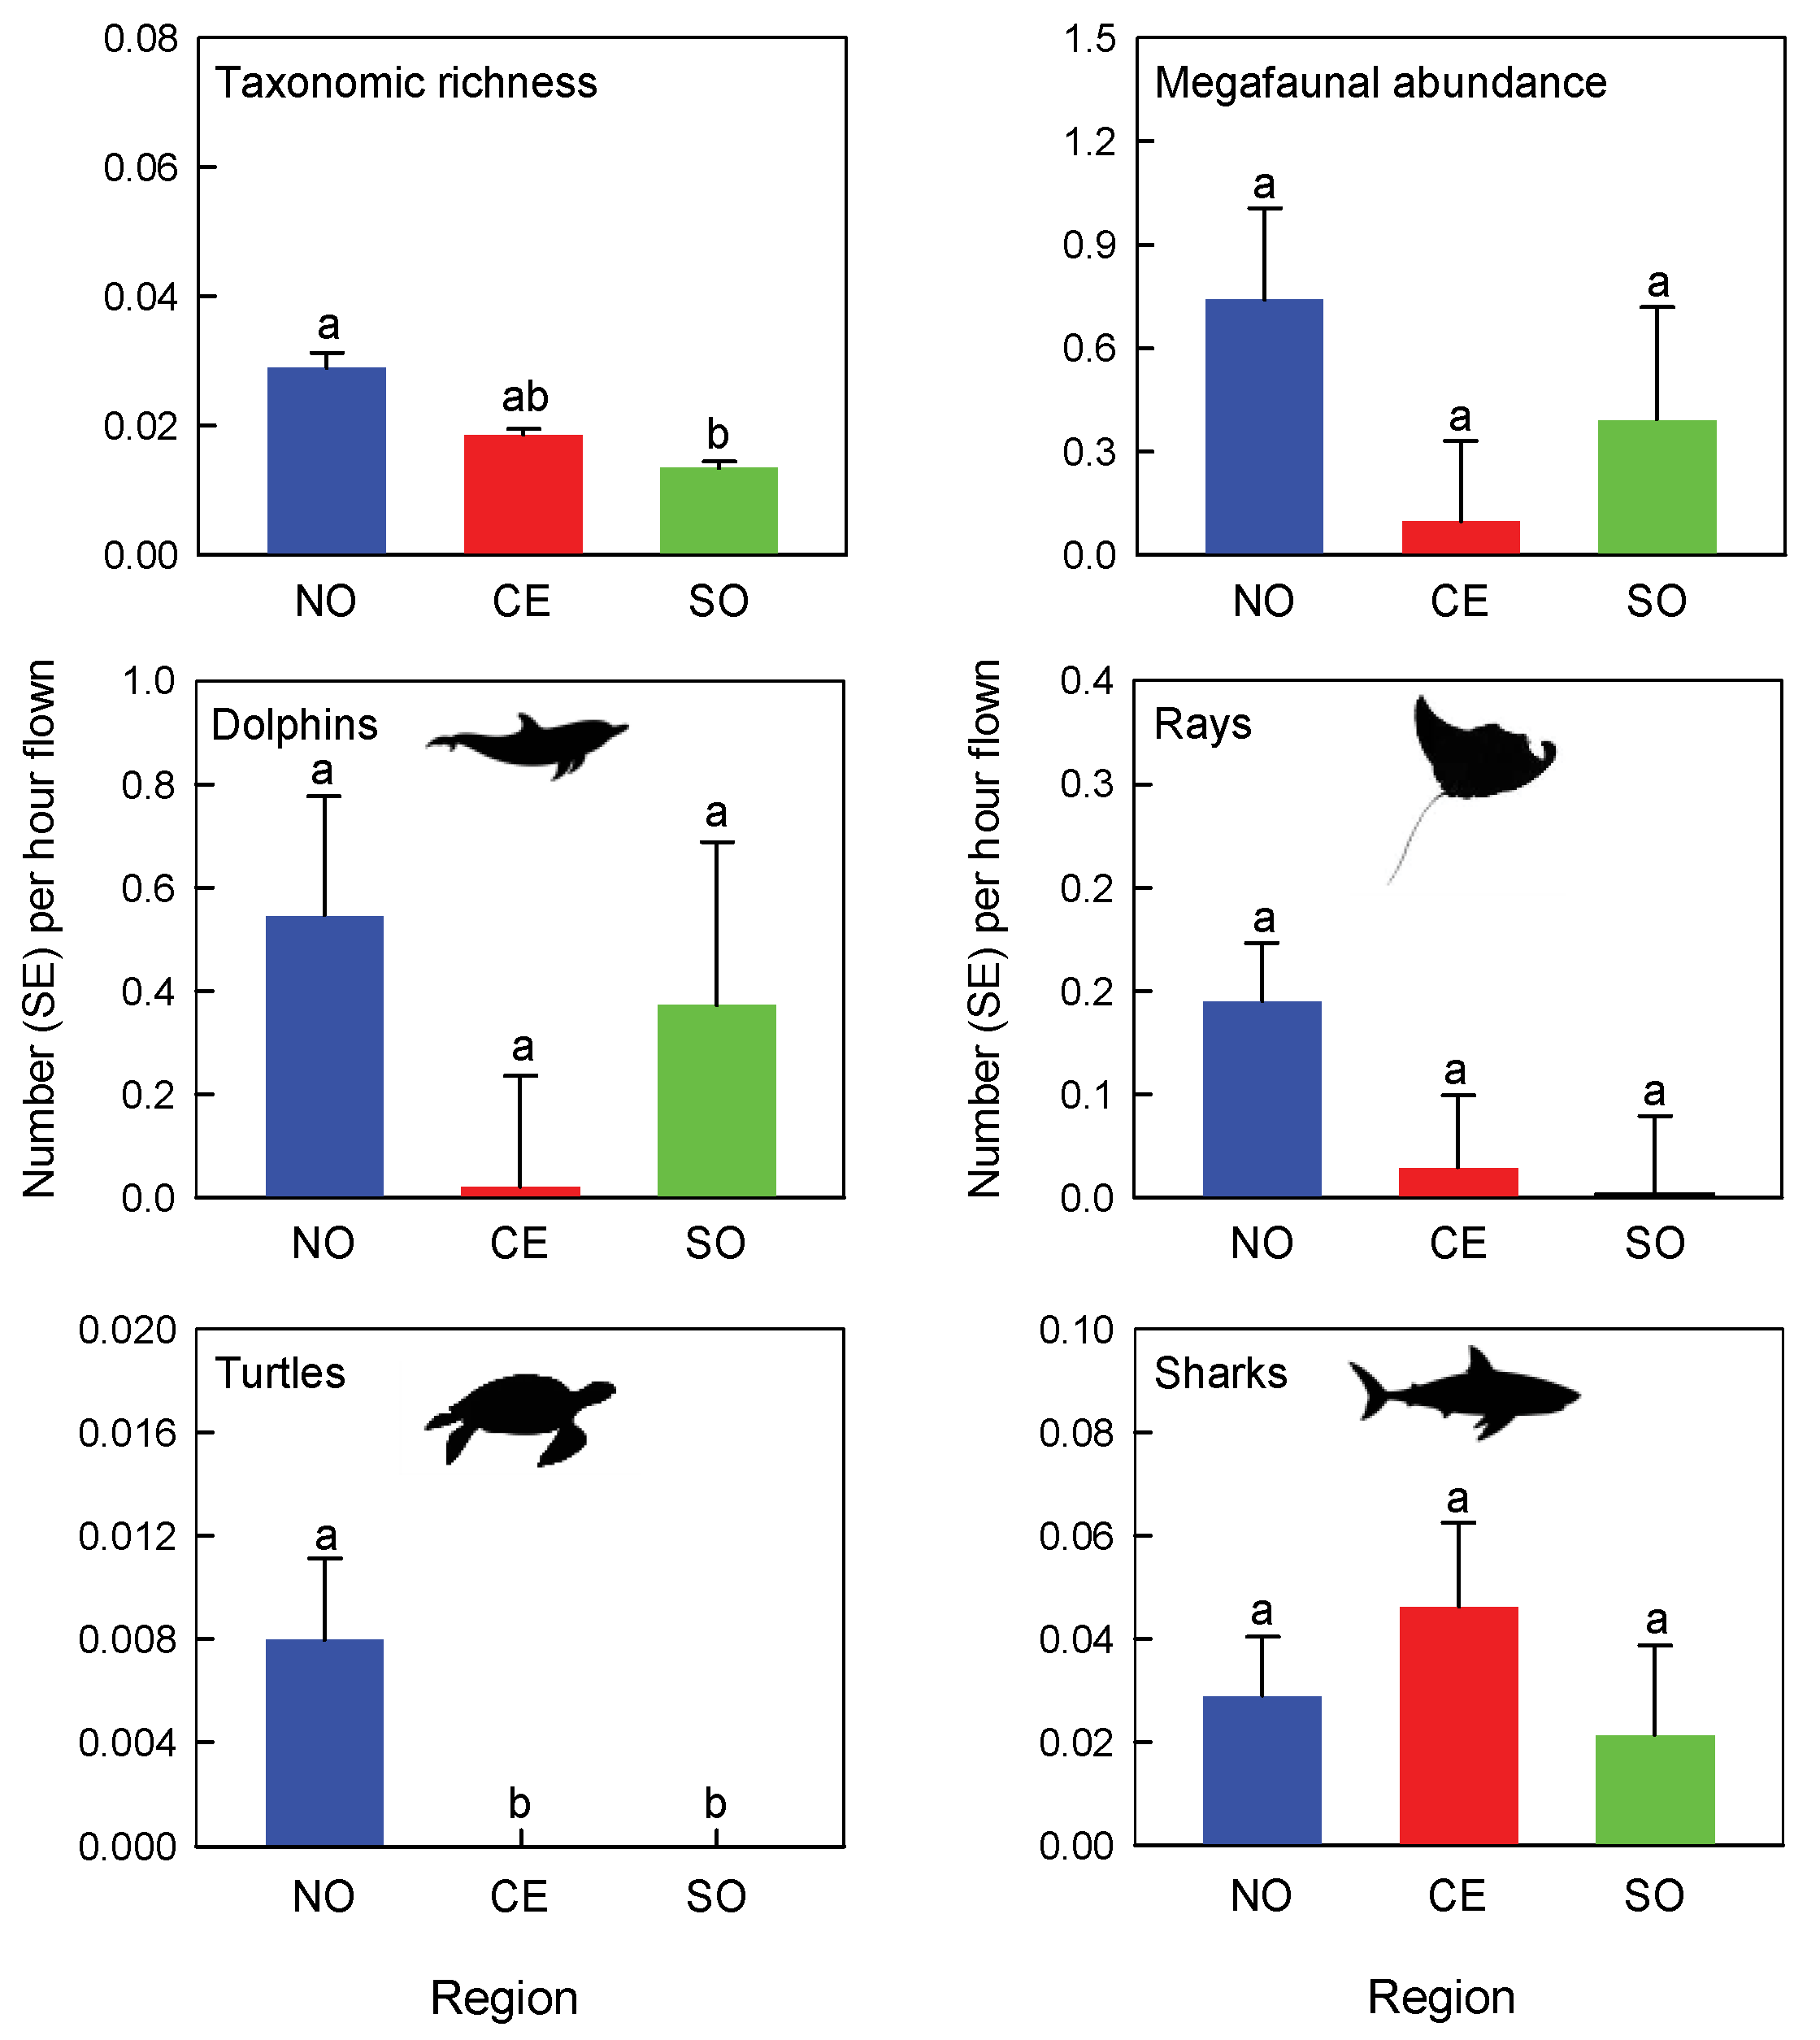
Megafaunal richness differed significantly among regions (GAM, p < 0.05, Figure 4). Although the mean abundance of megafauna decreased from northern to central to southern NSW (Figure 4), only the beaches in the northern and southern regions differed significantly (Tukey, p < 0.05). Because of substantial variation within regions, there were no significant differences in overall megafaunal abundance or in the numbers of dolphins, sharks and rays among beaches in northern, central and southern NSW (GAMs, p > 0.05, Figure 4). There was, however, a trend for reduced numbers of bottlenose dolphins off beaches in central NSW, with this region having 96.0% and 94.1% fewer dolphins per flight hour than in the northern and southern regions, respectively (Figure 4). As bottlenose dolphins were by far the most observed taxa, their patterns of abundance contributed to the variation in the overall megafaunal abundances among regions (Figure 4). Compared to beaches in northern NSW, there were 84.8% and 98.1% fewer rays in the central and southern regions. In part, this result could be explained by more frequent fevers of cownose rays, R. neglecta, off the beaches in northern NSW. The mean abundances of sharks per hour of flight time in central NSW were 58.8% and 116.2% larger than off beaches in the northern and southern regions, respectively. Sea turtles were only observed on beaches in the northern region (Figure 4).
Variation in the richness and abundance of megafauna, as well as the numbers of sharks, dolphins and rays per flight hour was not significantly explained by water temperature or wave height, as well as the distance to the nearest estuary or rocky reef (GAMs, p > 0.05 for all tests).

4. Discussion

The waters directly off wave-exposed sandy beaches on the NSW coast of Australia provide habitat for marine megafauna, including dolphins, rays, sharks, turtles and whales. These assemblages included threatened species under Australian legislation, such as white sharks (C. carcharias, listed as vulnerable), grey nurse sharks (C. taurus, listed as critically endangered), green turtles (C. mydas, listed as vulnerable) and humpback whales (M. novaeangliae, listed as vulnerable), as well as protected species, including Bryde’s (Balaenoptera sp.) whales and bottlenose dolphins (Tursiops spp.). The marine megafauna mostly moved through the turbulent waters just behind the surf break as individuals or in small groups, punctuated by occasional large aggregations of dolphins, cownose rays or sharks. The megafaunal assemblages were dominated by bottlenose dolphins, followed by rays. Potentially dangerous sharks (e.g., white, bull or tiger sharks) were rare (<1% of the total). Overall, the megafauna off NSW beaches was sparsely distributed, with no observations of animals recorded from 5 of the 23 beaches sampled. However, megafauna were observed frequently off beaches in the far north of NSW, which is consistent with previous drone-based surveys in this area [10,11,16].
The marine megafauna off wave-exposed beaches in NSW were generally transitory in nature, moving in and out of the subtidal beach ecosystems. In some cases, megafauna were simply undertaking their migrations in waters off ocean beaches. For example, humpback whales were observed using the waters behind surf breaks as rest stops on their annual migrations to and from the Southern Ocean [41]. Sharks and sea turtles also make migrations on the east coast of Australia [42,43] and their presence off sandy beaches may have been for predator avoidance, feeding opportunities or to take advantage of long-shore currents. In particular, white sharks swim parallel to the beach line using a combination of energy-conserving motion and active foraging, as well as inquisitive behaviour towards various potential food and non-food items [26]. Although fur seals (Arctocephalus spp.), leopard seals (Hydrurga leptonyx) and crab eater seals (Lobodon carcinophaga) have been seen hauling out on wave-exposed beaches in NSW, these rare events were not observed in our drone-based surveys.
The northern NSW beaches had different assemblage structures, higher diversity and greater abundances of marine megafauna than the central or southern regions, although these trends were not always significant. The north coast of NSW is a subtropical area that supports mixed assemblages of tropical and temperate species, which contributed to the significantly higher megafaunal richness when compared to the temperate southern region. For example, the northern NSW beaches supported a good mix of white-spotted eagle rays and southern eagle rays, as well as the most cownose rays of any NSW region [33]. However, the higher latitude beaches in NSW mostly only had southern eagle rays. In addition, relatively tropical species, such as green sea turtles, were only observed in the northern region in our drone surveys. As our overall sampling program encompassed subtropical and temperate beaches in a latitudinal gradient, our dataset now provides a baseline to assess changes in megafaunal assemblages in a climate change hotspot [44].
In northern NSW, ocean beaches adjacent to large river entrances are highly productive areas that attract more megafaunal predators compared to other beaches [10]. Despite more replication in the present study, there was no significant relationship between the diversity and abundance of megafauna and distance to the nearest estuary. Here, the closest estuaries to the sampled beaches included a range of estuary types, such as coastal lakes, creeks and bays. Compared to the large rivers in northern NSW, smaller estuaries may have less influence on ocean productivity and therefore be less important to marine megafauna. Similarly, these smaller estuaries may be less important as breeding and nursery sites for some marine wildlife (e.g., bull sharks). As our drone-based surveys were not specifically designed to assess the relationship between estuary type and wildlife abundance, it is not possible to make firm conclusions about the association between estuaries and the structure of megafaunal assemblages. There is an opportunity for future research to test such a hypothesis with a specifically designed experiment with ocean beaches directly adjacent to different types of estuaries, which are appropriately replicated.
Bottlenose dolphins (Tursiops spp.) numerically dominated the waters off wave-exposed beaches and were observed in more flights than any other megafaunal taxa (see also [10]). Bottlenose dolphins mostly occurred in small groups (<30 individuals), although there were occasionally large aggregations exceeding 150 individuals. The dolphins surveyed were Indo-Pacific bottlenose dolphins (Tursiops aduncus), although it was not always possible to distinguish this species from offshore bottlenose dolphins (Tursiops truncatus) [10,18]. Bottlenose dolphins are known for their fission/fusion societies where pods may become bigger or smaller on a daily basis depending on individual preferences [45]. The water in and around surf zones can provide ideal hunting grounds for bottlenose dolphins, particularly when there are schools of bait fish present. Ocean beaches can also provide gathering spots for social interactions among bottlenose dolphins, including mating, re-establishing bonds and play [46]. The longshore currents off some wave-exposed beaches can also facilitate energy-efficient travel between reefs and other key habitats. Indo-pacific bottlenose dolphins in northern NSW are known for forming resident pods that routinely patrol beaches inside their territories [46].
There were substantially fewer bottlenose dolphins observed off wave-exposed beaches in central NSW compared to the northern and southern regions. This observation has been further supported by the results of an expanded drone sampling program of 42 beaches in 2021/2022, which found very few dolphins off beaches in the highly urbanised parts of central NSW (NSW DPI, unpublished data). Furthermore, a drone sampling program off Sydney (NSW, Australia) observed ten times as many sharks than bottlenose dolphins [18], which was the opposite pattern to what we found in the northern and southern regions of NSW (also see [10]). Although bottlenose dolphins are a protected species in NSW and there are few recorded interactions with commercial fishing gear, highly urbanised coasts come with a host of other threats to cetaceans, such as pollution [47], habitat degradation [48], marine noise [49], increased disease risk [50], biotoxins [51], harassment [52] or tourism operations [53]. Given the high profile of dolphins, research is needed on the causes of lower abundances of bottlenose dolphins in the highly urbanised parts of central NSW and consideration should be given to management interventions that could restore their populations.
Small (<2 kg) consumer drones provided an appropriate platform to survey marine megafauna off wave-exposed beaches [11,15,35]. The small drones used in our study were mostly inobtrusive for beach users and wildlife, although bottlenose dolphins can detect and respond to drones lower than 60 m [12]. Land-based and boat-based surveys (e.g., [46]), balloons [54], crewed fixed-wing aircraft [35] and crewed helicopters [11] have also been used to remotely survey marine megafauna off wave-exposed beaches. Land- and boat-based surveys are limited in their capacity to survey some megafauna below the water surface. In addition, crewed aircraft are more expensive, noisier and significantly more dangerous than drone-based sampling [11,35]. Given the alternatives, small consumer drones appear to be a cost-effective method for remote surveys of marine megafauna off wave-exposed beaches when conditions are good. Nonetheless, the effectiveness of drone-based surveys decreases when wind chop, surf foam, sun glare or water clarity obscures permanently submerged megafauna [27,55] or the water becomes too deep to see submerged wildlife [16,17].

5. Conclusions

Our drone-based remote surveys of marine megafauna off sandy beaches included 23 locations distributed over more than 1000 km of coastline. These surveys constitute one of the most comprehensive baselines for the diversity and abundance of marine megafauna off wave-exposed beaches to date. In general, megafauna were sparsely distributed and were numerically dominated by bottlenose dolphins and rays, with potentially dangerous sharks being rare. Our survey provides the first baseline of marine megafauna off wave-exposed subtropical to temperate beaches in a hotspot of ocean warming and coastal development. Our dataset will, therefore, be a valuable resource for examining changes in megafaunal assemblages off ocean beaches over time, particularly for those species that are already threatened with extinction from human activities.

Author Contributions

Conceptualization, B.P.K. and P.A.B.; methodology, B.P.K., K.I.M., P.A.B. and D.T.M.; formal analysis, S.G.M. and B.P.K.; investigation, B.P.K., K.I.M., J.P.T. and P.A.B.; resources, B.P.K. and P.A.B.; data curation, B.P.K., J.P.T. and K.I.M.; writing—original draft preparation, B.P.K.; writing—review and editing, B.P.K., P.A.B., K.I.M., S.G.M., D.T.M., T.A.S. and J.P.T.; visualization, B.P.K. and S.G.M.; project administration, B.P.K. and P.A.B.; funding acquisition, B.P.K., T.A.S. and P.A.B. All authors have read and agreed to the published version of the manuscript.

Funding

The drone monitoring program was funded by the NSW Government through the NSW Shark Management Program. Analysis of the video and data was supported by a SeaWorld Research and Rescue Foundation Inc. grant (SWR/5/2020) to B.P.K., P.A.B. and T.A.S. Drone flights were made under New South Wales Department of Primary Industries (NSW DPI) and Office of Environment & Heritage (OEH) scientific permits (Ref. P01/0059; MWL000102746) and animal ethics (16/09–SIMS).

Data Availability Statement

The data presented in this study are available on request to the NSW Government through the NSW Shark Management Program.

Acknowledgments

We thank Surf Life Saving NSW for undertaking drone flights and providing video footage for analysis.

Conflicts of Interest

The authors declare no conflict of interest.

References

  1. Luijendijk, A.; Hagenaars, G.; Ranasinghe, R.; Baart, F.; Donchyts, G.; Aarninkhof, S. The state of the world’s beaches. Sci. Rep. 2018, 8, 6641. [Google Scholar] [CrossRef] [PubMed]
  2. Lutz, P.L.; Musick, J.A. The Biology of Sea Turtles, 3rd ed.; CRC Press: Boca Raton, FL, USA, 2013. [Google Scholar]
  3. Jones, A.R.; Schlacher, T.A.; Schoeman, D.S.; Weston, M.A.; Withycombe, G.M. Ecological research questions to inform policy and the management of sandy beaches. Ocean. Coast. Manag. 2017, 148, 158–163. [Google Scholar] [CrossRef]
  4. Nel, R.; Campbell, E.E.; Harris, L.; Hauser, L.; Schoeman, D.S.; McLachlan, A.; du Preez, D.R.; Bezuidenhout, K.; Schlacher, T.A. The status of sandy beach science: Past trends, progress, and possible futures. Estuar. Coast. Shelf Sci. 2014, 150, 1–10. [Google Scholar] [CrossRef]
  5. Schlacher, T.A.; Dugan, J.; Schoeman, D.S.; Lastra, M.; Jones, A.; Scapini, F.; McLachlan, A.; Defeo, O. Sandy beaches at the brink. Divers. Distrib. 2007, 13, 556–560. [Google Scholar] [CrossRef] [Green Version]
  6. McLachlan, A.; Defeo, O. The Ecology of Sandy Shores, 3rd ed.; Academic Press: London, UK, 2017. [Google Scholar]
  7. Guinet, C. Intentional stranding apprenticeship and social play in killer whales (Orcinus orca). Can. J. Zool. 1991, 69, 2712–2716. [Google Scholar] [CrossRef]
  8. Le Boeuf, B.J.; Peterson, R.S. Social status and mating activity in elephant seals. Science 1969, 163, 91–93. [Google Scholar] [CrossRef]
  9. Defeo, O.; McLachlan, A.; Schoeman, D.S.; Schlacher, T.A.; Dugan, J.; Jones, A.; Lastra, M.; Scapini, F. Threats to sandy beach ecosystems: A review. Estuar. Coast. Shelf Sci. 2009, 81, 1–12. [Google Scholar] [CrossRef]
  10. Kelaher, B.P.; Colefax, A.P.; Tagliafico, A.; Bishop, M.J.; Giles, A.; Butcher, P.A. Assessing variation in assemblages of large marine fauna off ocean beaches using drones. Mar. Freshw. Res. 2020, 71, 68–77. [Google Scholar] [CrossRef] [Green Version]
  11. Kelaher, B.P.; Peddemors, V.M.; Hoade, B.; Colefax, A.P.; Butcher, P.A. Comparison of sampling precision for nearshore marine wildlife using unmanned and manned aerial surveys. J. Unmanned Veh. Syst. 2020, 8, 30–43. [Google Scholar] [CrossRef]
  12. Giles, A.B.; Butcher, P.A.; Colefax, A.P.; Pagendam, D.E.; Mayjor, M.; Kelaher, B.P. Responses of bottlenose dolphins (Tursiops spp.) to small drones. Aquat. Conserv. Mar. Freshw. Ecosyst. 2021, 31, 677–684. [Google Scholar] [CrossRef]
  13. Ferguson, G.F.; Ward, T.M.; Ivey, A.R.; Barnes, T.C. Life history of Argyrosomus japonicus, a large sciaenid at the southern part of its global distribution: Implications for fisheries management. Fish. Res. 2014, 151, 148–157. [Google Scholar] [CrossRef]
  14. Olds, A.D.; Vargas-Fonseca, E.; Connolly, R.M.; Gilby, B.L.; Huijbers, C.M.; Hyndes, G.A.; Layman, C.A.; Whitfield, A.K.; Schlacher, T.A. The ecology of fish in the surf zones of ocean beaches: A global review. Fish Fish. 2018, 19, 78–89. [Google Scholar] [CrossRef]
  15. Butcher, P.A.; Colefax, A.P.; Gorkin, R.A., III; Kajiura, S.M.; Lopez, N.A.; Mourier, J.; Purcell, C.R.; Skomal, G.B.; Tucker, J.P.; Walsh, A.J.; et al. The drone revolution of shark science: A review. Drones 2021, 5, 8. [Google Scholar] [CrossRef]
  16. Colefax, A.P.; Butcher, P.A.; Pagendam, D.E.; Kelaher, B.P. Reliability of marine faunal detections in drone-based monitoring. Ocean Coast. Manag. 2019, 174, 108–115. [Google Scholar] [CrossRef]
  17. Yang, Z.; Yu, X.; Dedman, S.; Rosso, M.; Zhu, J.; Yang, J.; Xia, Y.; Tian, Y.; Zhang, G.; Wang, J. UAV remote sensing applications in marine monitoring: Knowledge visualization and review. Sci. Total Environ. 2022, 838, 155939. [Google Scholar] [CrossRef]
  18. Pirotta, V.; Hocking, D.P.; Iggleden, J.; Harcourt, R. Drone observations of marine life and human and wildlife Interactions off Sydney, Australia. Drones 2022, 6, 75. [Google Scholar] [CrossRef]
  19. Fiori, L.; Martinez, E.; Bader, M.K.-F.; Orams, M.B.; Bollard, B. Insights into the use of an unmanned aerial vehicle (UAV) to investigate the behavior of humpback whales (Megaptera novaeangliae) in Vava’u, Kingdom of Tonga. Mar. Mammal Sci. 2020, 36, 209–223. [Google Scholar] [CrossRef]
  20. Russell, G.; Colefax, A.; Christiansen, F.; Fowler, Z.; Cagnazzi, D. Body condition and migratory timing of east Australian humpback whales. Mar. Ecol. Prog. Ser. 2022, 692, 169–183. [Google Scholar] [CrossRef]
  21. Brennecke, D.; Siebert, U.; Kindt-Larsen, L.; Midtiby, H.S.; Egemose, H.D.; Ortiz, S.T.; Knickmeier, K.; Wahlberg, M. The fine-scale behavior of harbor porpoises towards pingers. Fish. Res. 2022, 255, 106437. [Google Scholar] [CrossRef]
  22. Hodgson, A.; Kelly, N.; Peel, D. Unmanned aerial vehicles (UAVs) for surveying marine fauna: A dugong case study. PLoS ONE 2013, 8, e79556. [Google Scholar] [CrossRef] [Green Version]
  23. Yauri, S.; Ramos, E.; Castelblanco-Martínez, N.; Niño Torres, C.; Searle, L. Using small drones to photo-identify Antillean manatees: A novel method for monitoring an endangered marine mammal in the Caribbean Sea. Endanger. Species Res. 2020, 41, 79–90. [Google Scholar] [CrossRef] [Green Version]
  24. Dickson, L.C.D.; Negus, S.R.B.; Eizaguirre, C.; Katselidis, K.A.; Schofield, G. Aerial drone surveys reveal the efficacy of a protected area network for marine megafauna and the value of sea turtles as umbrella species. Drones 2022, 6, 291. [Google Scholar] [CrossRef]
  25. Dunstan, A.; Robertson, K.; Fitzpatrick, R.; Pickford, J.; Meager, J. Use of unmanned aerial vehicles (UAVs) for mark-resight nesting population estimation of adult female green sea turtles at Raine Island. PLoS ONE 2020, 15, e0228524. [Google Scholar] [CrossRef]
  26. Colefax, A.P.; Kelaher, B.P.; Pagendam, D.E.; Butcher, P.A. Assessing white shark (Carcharodon carcharias) behavior along coastal beaches for conservation-focused shark mitigation. Front. Mar. Sci. 2020, 7, 268. [Google Scholar] [CrossRef]
  27. Monteforte, K.I.P.; Butcher, P.A.; Morris, S.G.; Kelaher, B.P. The relative abundance and occurrence of sharks off ocean Beaches of New South Wales, Australia. Biology 2022, 11, 1456. [Google Scholar] [CrossRef] [PubMed]
  28. Allan, B.M.; Ierodiaconou, D.; Hoskins, A.J.; Arnould, J.P.Y. A rapid UAV method for assessing body condition in fur seals. Drones 2019, 3, 24. [Google Scholar] [CrossRef] [Green Version]
  29. Fudala, K.; Bialik, R.J. Breeding colony dynamics of southern elephant seals at Patelnia Point, King George Island, Antarctica. Remote Sens. 2020, 12, 2964. [Google Scholar] [CrossRef]
  30. McIntosh, R.R.; Holmberg, R.; Dann, P. Looking without landing—Using remote piloted aircraft to monitor fur seal populations without disturbance. Front. Mar. Sci. 2018, 5, 202. [Google Scholar] [CrossRef] [Green Version]
  31. Krause, D.J.; Hinke, J.T.; Goebel, M.E.; Perryman, W.L. Drones minimize Antarctic predator responses relative to ground survey methods: An appeal for context in policy advice. Front. Mar. Sci. 2021, 8, 648772. [Google Scholar] [CrossRef]
  32. Oleksyn, S.; Tosetto, L.; Raoult, V.; Joyce, K.E.; Williamson, J.E. Going batty: The challenges and opportunities of using drones to monitor the behaviour and habitat use of rays. Drones 2021, 5, 12. [Google Scholar] [CrossRef]
  33. Tagliafico, A.; Butcher, P.A.; Colefax, A.P.; Clark, G.F.; Kelaher, B.P. Variation in cownose ray Rhinoptera neglecta abundance and group size on the central east coast of Australia. J. Fish Biol. 2020, 96, 427–433. [Google Scholar] [CrossRef] [PubMed]
  34. Ezat, M.; Fritsch, C.; Downs, C. Use of an unmanned aerial vehicle (drone) to survey Nile crocodile populations: A case study at Lake Nyamithi, Ndumo game reserve, South Africa. Biol. Conserv. 2018, 223, 76–81. [Google Scholar] [CrossRef]
  35. Colefax, A.P.; Butcher, P.A.; Kelaher, B.P. The potential for unmanned aerial vehicles (UAVs) to conduct marine fauna surveys in place of manned aircraft. ICES J. Mar. Sci. 2018, 75, 1–8. [Google Scholar] [CrossRef] [Green Version]
  36. Provost, E.J.; Coleman, M.A.; Butcher, P.A.; Colefax, A.; Schlacher, T.A.; Bishop, M.J.; Connolly, R.M.; Gilby, B.L.; Henderson, C.J.; Jones, A.; et al. Quantifying human use of sandy shores with aerial remote sensing technology: The sky is not the limit. Ocean Coast. Manag. 2021, 211, 105750. [Google Scholar] [CrossRef]
  37. Anderson, M.J. Permutational multivariate analysis of variance (PERMANOVA). Wiley StatsRef Stat. Ref. Online 2017. [Google Scholar] [CrossRef]
  38. Clarke, K.R. Non-parametric multivariate analyses of changes in community structure. Aust. J. Ecol. 1993, 18, 117–143. [Google Scholar] [CrossRef]
  39. Anderson, M.J. Distance-based tests for homogeneity of multivariate dispersions. Biometrics 2006, 62, 245–253. [Google Scholar] [CrossRef]
  40. R-Development-Core-Team. R: A Language and Environment for Statistical Computing; R Foundation for Statistical Computing: Vienna, Austria, 2023. [Google Scholar]
  41. McCulloch, S.; Meynecke, J.-O.; Franklin, T.; Franklin, W.; Chauvenet, A.L.M. Humpback whale (Megaptera novaeangliae) behaviour determines habitat use in two Australian bays. Mar. Freshw. Res. 2021, 72, 1251–1267. [Google Scholar] [CrossRef]
  42. Read, T.C.; Wantiez, L.; Werry, J.M.; Farman, R.; Petro, G.; Limpus, C.J. Migrations of green turtles (Chelonia mydas) between nesting and foraging grounds across the Coral Sea. PLoS ONE 2014, 9, e100083. [Google Scholar] [CrossRef] [Green Version]
  43. Smoothey, A.F.; Lee, K.A.; Peddemors, V.M. Long-term patterns of abundance, residency and movements of bull sharks (Carcharhinus leucas) in Sydney Harbour, Australia. Sci. Rep. 2019, 9, 18864. [Google Scholar] [CrossRef] [Green Version]
  44. Frusher, S.; Jennings, S.; Haward, M.; Holbrook, N.; Pecl, G.; Hobday, A.; Creighton, C.; D’Silva, D.; Nursey-Bray, M. The short history of research in a marine climate change hotspot: From anecdote to adaptation in south-east Australia. Rev. Fish Biol. Fish. 2013, 24, 593–611. [Google Scholar] [CrossRef]
  45. Connor, R.C.; Wells, R.S.; Mann, J.; Read, A.J. The bottlenose dolphin: Social relationships in a fission-fusion society. In Cetacean Societies: Field Studies of Dolphins and Whales; Mann, J., Connor, R.C., Tyack, P.L., Whitehead, H., Eds.; The University of Chicago Press: Chicago, IL, USA, 2000; pp. 91–126. [Google Scholar]
  46. Hawkins, E.R.; Gartside, D.F. Social and behavioural characteristics of Indo-Pacific bottlenose dolphins (Tursiops aduncus) in northern New South Wales, Australia. Aust. Mammal. 2008, 30, 71–82. [Google Scholar] [CrossRef]
  47. Grattarola, C.; Minoia, L.; Giorda, F.; Consales, G.; Capanni, F.; Ceciarini, I.; Franchi, E.; Ascheri, D.; Garibaldi, F.; Dondo, A.; et al. Health status of stranded common bottlenose dolphins (Tursiops truncatus) and contamination by immunotoxic pollutants: A threat to the Pelagos Sanctuary—Western Mediterranean Sea. Diversity 2023, 15, 569. [Google Scholar] [CrossRef]
  48. Bearzi, G.; Fortuna, C.M.; Reeves, R.R. Ecology and conservation of common bottlenose dolphins Tursiops truncatus in the Mediterranean Sea. Mammal Rev. 2009, 39, 92–123. [Google Scholar] [CrossRef]
  49. Sørensen, P.M.; Haddock, A.; Guarino, E.; Jaakkola, K.; McMullen, C.; Jensen, F.H.; Tyack, P.L.; King, S.L. Anthropogenic noise impairs cooperation in bottlenose dolphins. Curr. Biol. 2023, 33, 749–754.e744. [Google Scholar] [CrossRef] [PubMed]
  50. Barratclough, A.; Wells, R.S.; Schwacke, L.H.; Rowles, T.K.; Gomez, F.M.; Fauquier, D.A.; Sweeney, J.C.; Townsend, F.I.; Hansen, L.J.; Zolman, E.S.; et al. Health assessments of common bottlenose dolphins (Tursiops truncatus): Past, present, and potential conservation applications. Front. Vet. Sci. 2019, 6, 444. [Google Scholar] [CrossRef] [Green Version]
  51. Schwacke, L.H.; Twiner, M.J.; De Guise, S.; Balmer, B.C.; Wells, R.S.; Townsend, F.I.; Rotstein, D.C.; Varela, R.A.; Hansen, L.J.; Zolman, E.S.; et al. Eosinophilia and biotoxin exposure in bottlenose dolphins (Tursiops truncatus) from a coastal area impacted by repeated mortality events. Environ. Res. 2010, 110, 548–555. [Google Scholar] [CrossRef]
  52. Vail, C.S. An overview of increasing incidents of bottlenose dolphin harassment in the Gulf of Mexico and possible dolutions. Front. Mar. Sci. 2016, 3, 110. [Google Scholar] [CrossRef] [Green Version]
  53. Kassamali-Fox, A.; Christiansen, F.; May-Collado, L.J.; Ramos, E.A.; Kaplin, B.A. Tour boats affect the activity patterns of bottlenose dolphins (Tursiops truncatus) in Bocas del Toro, Panama. PeerJ 2020, 8, e8804. [Google Scholar] [CrossRef] [Green Version]
  54. Adams, K.; Broad, A.; Ruiz-García, D.; Davis, A.R. Continuous wildlife monitoring using blimps as an aerial platform: A case study observing marine megafauna. Aust. Zool. 2020, 40, 407–415. [Google Scholar] [CrossRef]
  55. Giles, A.B.; Davies, J.E.; Ren, K.; Kelaher, B. A deep learning algorithm to detect and classify sun glint from high-resolution aerial imagery over shallow marine environments. ISPRS J. Photogramm. Remote Sens. 2021, 181, 20–26. [Google Scholar] [CrossRef]
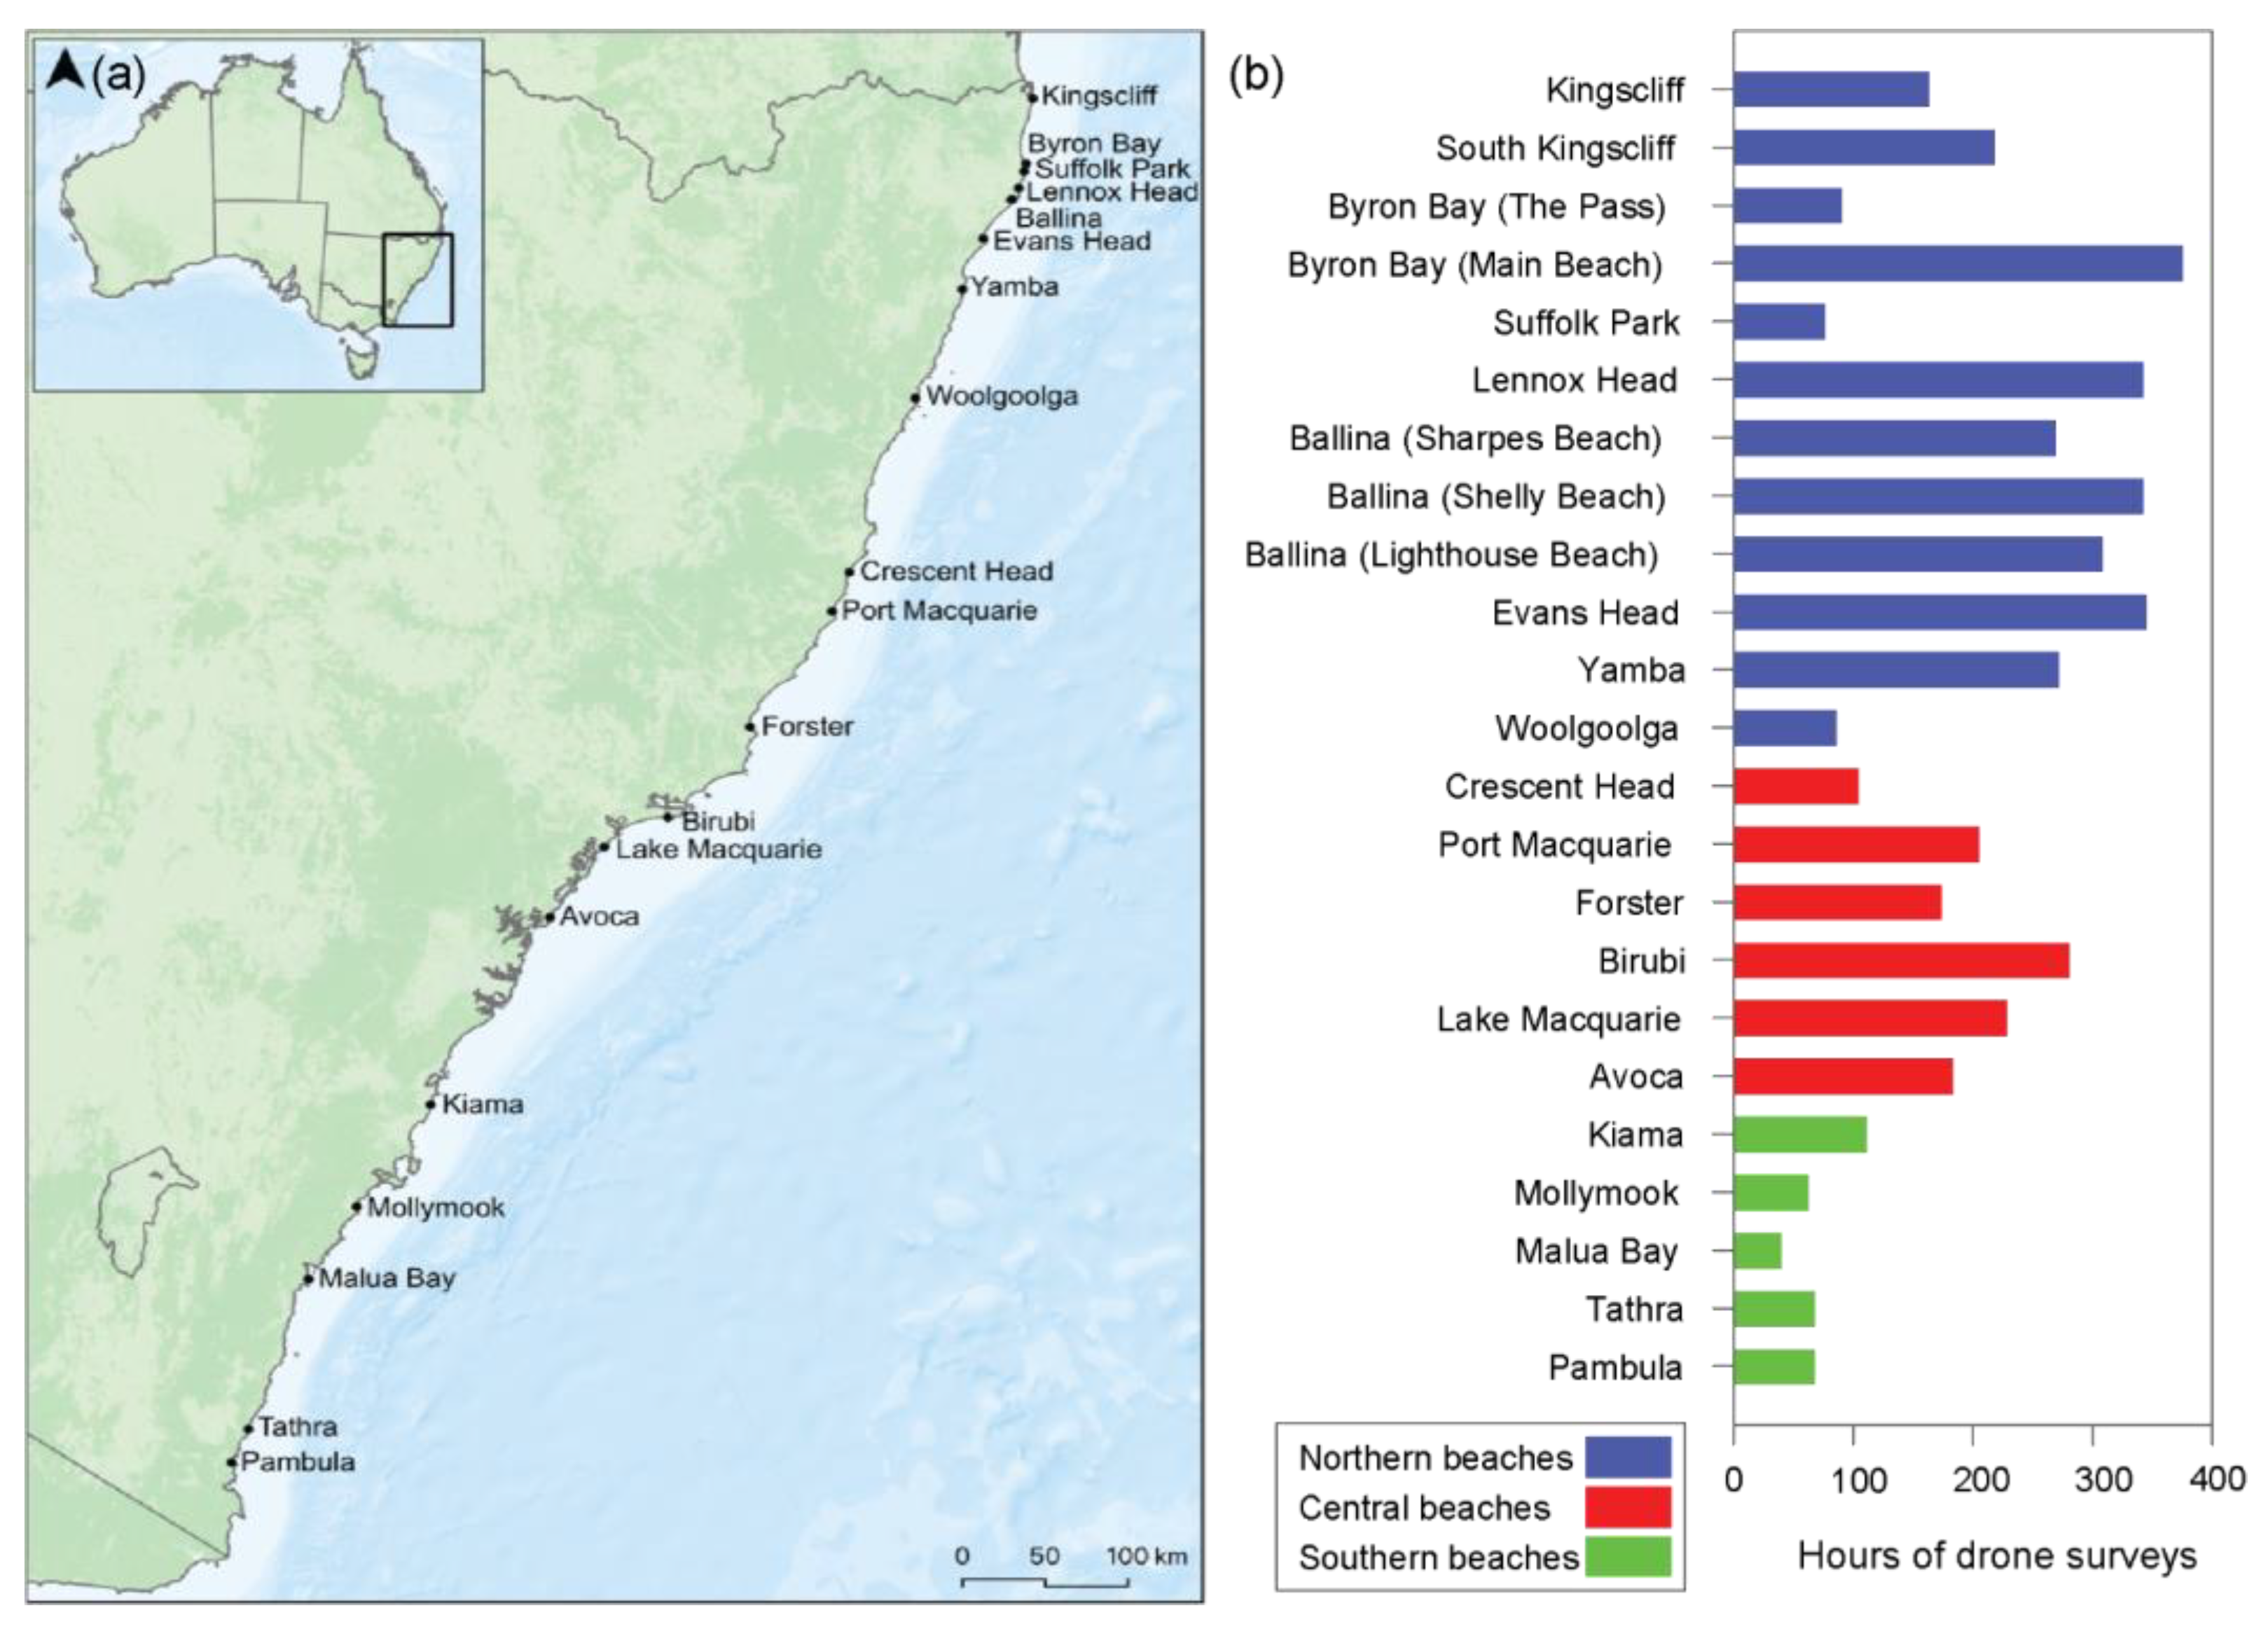
Figure 1. (a) Locations of beaches surveyed off the coast of New South Wales (NSW, Australia). (b) The total hours flown over the three sampling seasons at each of the beaches sampled in northern (blue bars), central (red bars) and southern NSW (green bars).
Remotesensing 15 04018 g001
Figure 2. (a) The percentage contribution of each taxa to the total number of megafauna observed during this study. These calculations did not include individuals in the unknown shark, ray and turtle categories, which represented 2.1% of the total individuals. (bf) Examples of megafauna observed off the coast of New South Wales (NSW, Australia).
Remotesensing 15 04018 g002
Figure 3. Principle co-ordinate plot of megafaunal assemblages off wave-exposed beaches in New South Wales (NSW, Australia). The plot shows the relationships among megafaunal assemblages off beaches in the northern (blue triangles), central (inverted red triangles) and southern (green squares) regions of NSW. The vector overlay shows the relationships among species with large contributions (Pearson’s coefficient > 0.35) to the dissimilarity among beaches.
Remotesensing 15 04018 g003
Figure 4. Mean (SE) megafaunal richness, overall abundance and the abundance of dolphins, rays, turtles and sharks off beaches in northern (NO, blue bars), central (CE, red bars) and southern (SO, green bars) regions of New South Wales (NSW, Australia). The data are standardised per hour of flight time. Letters above bars indicate significant differences among regions (p < 0.05). For turtles, the letters indicate that these animals were only observed in the northern region.
Remotesensing 15 04018 g004
Disclaimer/Publisher’s Note: The statements, opinions and data contained in all publications are solely those of the individual author(s) and contributor(s) and not of MDPI and/or the editor(s). MDPI and/or the editor(s) disclaim responsibility for any injury to people or property resulting from any ideas, methods, instructions or products referred to in the content.