Article

Evaluation of HY-2C and CFOSAT Satellite Retrieval Offshore Wind Energy Using Weather Research and Forecasting (WRF) Simulations

1
School of Atmospheric Physics, Nanjing University of Information Science and Technology, Nanjing 210044, China
2
School of Electrical Engineering, Nantong University, Nantong 226019, China
*
Author to whom correspondence should be addressed.
Remote Sens. 2023, 15(17), 4172; https://doi.org/10.3390/rs15174172
Submission received: 19 July 2023 / Revised: 10 August 2023 / Accepted: 22 August 2023 / Published: 25 August 2023
(This article belongs to the Special Issue Remote Sensing and Parameterization of Air-Sea Interaction)

Abstract

:
This study simulated the spatial distribution of wind speeds and wind energy density by using the WRF model, and we used the WRF-simulated results to evaluate the sea surface wind speeds retrieved from the HY-2C and CFOSAT satellite-borne microwave scatterometers over the Yellow Sea region. The main conclusions were as follows: (1) The combination of the MRF boundary layer parameterization scheme, the MM5 near-surface parameterization scheme, and the Global Data Assimilation System (GDAS) initial field demonstrated the best performance in simulating the 10 m wind speed in the Yellow Sea region, with a root-mean-square error (RMSE) of 1.57, bias of 1.24 m/s, and mean absolute percentage error (MAPE) of 17%. (2) The MAPE of the HY-2C inversion data was 9%, while the CFOSAT inversion data had an MAPE of 6%. The sea surface wind speeds derived from the HY-2C and CFOSAT satellite scatterometer inversions demonstrated high accuracy and applicability in this region. (3) The wind speed was found to increase with altitude over the Yellow Sea, with higher wind speeds observed in the southern region compared to the northern region. The wind power density increased with altitude, and the wind power density in the southern area of the Yellow Sea was higher than in the northern region. (4) The CFOSAT satellite inversion products were in good agreement with the WRF simulation results under low wind speed conditions. In contrast, the HY-2C satellite inversion products showed better agreement under moderate wind speed conditions. Under high wind speed conditions, both satellite inversion products exhibited minor deviations, but the HY-2C product had an overall overestimation, while the CFOSAT product remained within the range of −1 to 1 m/s. (6) The wind power density increased with the satellite-inverted 10 m wind speed. When the 10 m wind speed was less than 9 m/s, the wind power density exhibited a roughly cubic trend of increase. However, when the 10 m wind speed exceeded 9 m/s, the wind power density no longer increased with the rise in 10 m wind speed. These findings provide valuable insights into wind energy resources in the Yellow Sea region and demonstrate the effectiveness of satellite scatterometer inversions for wind speed estimation. The results have implications for renewable energy planning and management in the area.

1. Introduction

The Yellow Sea, located in eastern China, is suitable for installing offshore wind turbines, considering that most of its water depths are less than 80 m. It holds significant potential for wind energy development. By studying the accuracy of sea surface wind speed retrieval using HY-2C and CFOSAT satellites, it becomes possible to assess the distribution of wind power in the airspace above the ocean. This evaluation enables the effective utilization of the abundant wind energy resources in the Yellow Sea, contributing to carbon emission reductions and reduced reliance on imported energy through a diversified energy supply.
Wind speed is regarded as the most significant factor affecting wind energy, and the most commonly employed approach for wind energy assessment involves the installation of anemometers at the ground level [1,2,3,4] and using ground-based remote sensing devices for measurements [5]. Driven by the advancements in computer technology and numerical simulation methods, the research on wind energy assessment [6,7] has shifted its focus from primarily relying on field measurements, statistical analysis, and empirical models [8] to increasingly adopting numerical simulation-based methods [9,10]. Downscaling wind field predictions [11,12,13] enables the transformation of large-scale meteorological forecast data to smaller spatial scales, facilitating more precise wind field information. Utilizing downscaled wind field simulations for wind energy density assessment is an internationally recognized research area, with the WRF model [14,15,16] as a prominent tool for evaluating wind energy resources. The methods for downscaled wind speed simulation based on the WRF model [17] primarily include the WRF coarse-grid statistical interpolation method [18], the WRF nesting method [19], and the dynamical downscaling method [20]. The WRF coarse-grid statistical interpolation method is simple and computationally efficient, making it suitable for rapidly estimating wind energy resources over large areas. It can provide large-scale wind speed information relatively quickly, which benefits wind farm planning and forecasting. However, due to statistical interpolation, it may be necessary to look into some microscale variations in the wind field, leading to less accurate wind speed estimates in specific regions. On the other hand, the WRF nesting method employs multiple grids with different spatial resolutions to simulate the wind field, allowing for more refined wind speed predictions at smaller spatial scales. Nonetheless, the nesting simulation requires more computational resources and time, and its results may be influenced by boundary and initial conditions, necessitating careful consideration of the data accuracy. Meanwhile, the dynamical downscaling method can provide a more accurate representation of meteorological processes and the impact of complex terrain on the wind field. However, it involves more complex computations and relies on a more significant amount of observation data for model verification and calibration. Whether it is for future wind power forecasting using the WRF model or wind resource assessment in a specific region, the choice of different physical schemes (parameterizations) for the planetary boundary layer (PBL) and land surface model (LSM) has a significant impact on wind speed predictions within the boundary layer [21,22,23,24,25,26,27]. The performance of PBL schemes in WRF depends on the simulated region and time, making it challenging to determine a universally optimal model configuration [28]. Several approaches exist in WRF for choosing suitable parameterization schemes. Research by Stishovites et al. [29], which involved the analysis of the WRF model and optical turbulence intensity (Fried parameter), revealed that the YSU boundary layer parameterization scheme used in the WRF model was accurate for the Baikal Lake region. Additionally, a study by Hui Ma et al. [30] highlighted the superior performance of the MRF scheme in forecasting high-latitude areas in China. Salvao et al. [31] utilized the WRF model to assess the wind resources near the Atlantic Ocean. Giannakopoulos et al. [32] employed mesoscale modeling techniques to accurately simulate offshore wind and stability conditions, resulting in more precise wind resource assessments for offshore wind farm development.
From 2016 to 2021, the added capacity of offshore wind power in China witnessed significant growth, rising from 590,000 kilowatts in 2016 to 16,900,000 kilowatts in 2021 [33]. With offshore wind power transitioning from the exploration and cultivation stages to a high-growth phase, the spatial distribution of offshore wind farms has gradually expanded from near-shore areas to deeper and more remote offshore regions [34]. In assessing wind power density in deep-sea regions, installing wind measurement devices is cost prohibitive and it only provides a comprehensive evaluation of wind power density across some areas. On the other hand, methods such as WRF simulation and CFD simulation [35] require substantial computational resources. Therefore, satellite-based wind speed retrieval has emerged as an economically practical approach for assessing wind power density. Satellite retrieval involves using satellite observation data to estimate surface meteorological parameters. With the continuous development of satellite technology and data analysis algorithms, many researchers have widely adopted satellite data for wind energy assessment and the retrieval of wind field information. The evaluation of wind energy resources in the European North Sea region was first conducted by Christiansen [36] in 2006 using Envisat ASAR data. The study showcased the capability of satellite data to provide precise spatial information for the planning process of offshore wind farms. Similarly, Hasager [37] employed ERS-1/-2 data to assess European offshore wind energy resources. The two marine satellites evaluated in this study were the Sino–French Oceanography Satellite (CFOSAT) and the Haiyang-2C (HY-2C) satellite. Xiaoheng et al. [38] utilized the CFOSAT scatterometer (CSCAT) to analyze the temporal variations in CSCAT winds. They proposed a marine calibration based on the operating window to assess the consistency of CSCAT radar backscatter. In previous studies, the HY-2 series satellite Ku-band scatterometer was utilized by some researchers [39,40] for cross-calibration of backscatter measurements. Furthermore, scatterometer wind data from the HY-2B satellite were employed to characterize the intensity of tropical cyclones.
The applicability of the HY-2C and CFOSAT satellite-borne microwave scatterometers for retrieving sea surface wind speeds over the Yellow Sea was verified in this study using WRF-simulated wind speeds. This verification aimed to enhance the utilization of the retrieved sea surface wind speeds from these satellite-borne microwave scatterometers for estimating the spatial distribution of wind power density over the Yellow Sea. The findings can provide a scientific basis for the development of offshore wind power, facilitate the establishment of reasonable wind power planning, optimize resource utilization, and promote the coordinated development of the economy and the environment.

2. Materials and Methods

2.1. Dataset

2.1.1. GFS, GDAS Reanalysis Dataset

The Global Forecast System (GFS) (http://rda.ucar.edu/datasets/ds083.2/ (accessed on 19 June 2023)) [41] and Global Data Assimilation System (GDAS) (http://rda.ucar.edu/datasets/ds083.3/ (accessed on 19 June 2023)) [42] are two meteorological reanalysis datasets developed and maintained by the National Oceanic and Atmospheric Administration (NOAA) of the United States. These two datasets contain variables such as temperature, wind speed, humidity, precipitation, cloud cover, etc. The GFS and GDAS datasets used in this study were from October 2021, with a temporal resolution of 6 h and a spatial resolution of 0.25° × 0.25°.

2.1.2. ERA5 Hourly Data on Single Levels

ERA5 is the fifth-generation atmospheric reanalysis dataset of global climate from January 1950, developed by the European Centre for Medium-Range Weather Forecasts (ECMWF). In this study, we utilized ERA5 hourly data on single levels from the dataset (available at https://cds.climate.copernicus.eu/cdsapp#!/dataset/reanalysis-era5-single-levels?tab=overview (accessed on 6 August 2023)). Specifically, we selected the 10 m wind speed data within the geographical range of 119°E to 127°E and 30.5°N to 37.5°N for October 2021. The dataset is updated every hour, and its spatial resolution is 0.25° × 0.25° [43].

2.1.3. HY-2C and CFOSAT Satellite-Borne Scatterometers Dataset

The microwave scatterometer accomplishes retrieving sea surface wind speeds by measuring the radar backscatter signal from the sea surface. The microwave scatterometers used for this purpose operate in the C-band or Ku-band. The formation and distribution of sea surface waves are influenced by wind speeds, which alter radar backscatter intensity from the sea surface. The sea surface wind speeds can be retrieved by measuring the intensity of the backscattered echo signals from the sea surface.
HY-2C, the third satellite in the Chinese Marine Dynamic Environment Satellite series, is a non-sun-synchronous (inclined) satellite. It is equipped with a Ku-band Scatterometer (HSCAT), primarily for remote sensing inversion of global sea surface wind fields. This study utilized the sea surface wind speed products derived from the HSCAT scatterometer onboard the HY-2C satellite (http://osdds.nsoas.org.cn/ (accessed on 19 June 2023)). Its orbital altitude was 782 km and its operating frequency was 13.256 GHz, with a working bandwidth of 1 MHz. The polarization modes were HH and VV, with an HH polarization swath width exceeding 1350 km and a VV polarization swath width of 1700 km. The measurement accuracy for s° was 0.5 dB, and the range for s° was from −40 dB to +20 dB. These products have a 25 km × 25 km spatial resolution and an overall wind speed accuracy of approximately 1.2 m/s.
CFOSAT is a collaborative project between China and France to develop an oceanographic satellite. China is responsible for satellite carrying, launching, and telemetry, and the fan-beam rotating scanning scatterometer (SCAT) operating at the Ku-band frequency (13.256 GHz). The swath width is greater than 1000 km and the measurement accuracy for the backscatter coefficient is better than 0.5 dB, with a measurement range of at least 45 dB (−21 dB to 24 dB). The sea surface wind speed products derived from the SCAT scatterometer onboard the CFOSAT satellite (http://osdds.nsoas.org.cn/ (accessed on 18 July 2023)) were utilized in this study. The wind speed retrievals from CFOSAT have a 25 km × 25 km spatial resolution and a wind speed accuracy of approximately 1.3 m/s [44].
In October 2021, there were 26 observations recorded using the HY-2C in over 80% of the study area, while CFOSAT made 20 observations recorded in over 80% of the study area. The transit times with intervals less than 3 h for both satellites are presented in Table 1.

2.1.4. Measured Wind Speed

Wind speeds used for sensitivity experiments were sampled every 15 min from the 96 offshore turbines at the Datang Binhai Wind Farm (120.57°E, 34.26°N; 92 m above sea level).
The hourly 10 m measured wind speeds, which extended from 15 October 2021, 09:00 (UTC), to 16 October 2021, 12:00 (UTC), used to validate the results of the sensitivity experiment were from the WMO station 54953 (Chao Lian Island, Shandong: 120.87°E, 35.89°N) and nearby land-based WMO stations 58264 (Rudong, Jiangsu: 121.14°E, 32.24°N) and 58265 (Lusi, Jiangsu: 121.54°E, 32.10°N) in the Yellow Sea. The hourly wind speeds were from the China Meteorological Administration.

2.2. Methodology

2.2.1. WRF Model

The WRF model (version 4.2 applied in this work), a new-generation mesoscale forecasting model and assimilation system, plays a crucial role in wind energy assessment by simulating and predicting atmospheric circulation and wind field distribution. WRF can simulate the variations in wind fields in specific regions and periods by incorporating data such as topography, land use, and sea surface temperature.

2.2.2. Assessment of Model Performance

The accuracy of wind speed simulation was evaluated in this paper using metrics such as the correlation coefficient, bias, root-mean-square error (RMSE), and mean absolute percentage error (MAPE). RMSE serves as a reliable indicator of the precision of the predicted data sequence. At the same time, MAPE was employed to describe the extent of error dispersion and circumvent the issue of offsetting biases in sequential data. Among them were the following:
Correlation   coefficient = r X , Y = C o v X , Y V a r X V a r Y
where the covariance between variables X and Y is represented by Cov(X, Y), while Var[X] and Var[Y] represent the variances of variables X and Y, respectively. In probability theory and statistics, covariance is employed to quantify the overall error between the two variables. Variance, as a particular case of covariance, describes the situation where the two variables are identical. The formulas for their calculations are as follows:
C o v ( X ,   Y ) = E X E X Y E Y
V a r X = X X 1 2 n 1
where X is the variable, X1 is the sample mean, n is the sample size, and E represents the expectation.
B i a s = i = 1 n P i P i n
R M S E = 1 n i = 1 n ( P i P i ) 2
M A P E = 1 n i = 1 n P i P i P i
where the sample size is denoted by n, the predicted value of the ith sample by the model is represented by Pi′, and the measured value of the ith sample is indicated by Pi.
The wind direction agreement rate (WDAR) is commonly used to evaluate the accuracy of wind direction predictions. It is an indicator in meteorology that measures the similarity between two wind direction datasets. The calculation involves counting the matching wind direction values in both datasets and dividing that count by the total number of deals to obtain the agreement rate. For example, if both datasets represent wind direction values in the 0 to 360 degrees range, discounts with a difference of less than or equal to 22.5 degrees would agree. The wind direction agreement rate is typically presented as a percentage and helps assess the similarity between the two wind direction datasets. In meteorology, the wind direction agreement rate is frequently employed to evaluate the forecast accuracy of meteorological models. Usually, there exists a certain amount of error between the wind direction predicted by the model and the observed wind direction. The wind direction agreement rate can be used to quantify the magnitude of this error. A higher wind direction agreement rate indicates a higher forecast accuracy of the model.

2.2.3. Sensitivity Experiments

The WRF sensitivity experiments aimed to investigate and assess the impact of different parameterization schemes, initial conditions, and other variables on the simulation results. In this study we conducted two sets of sensitivity experiments to examine the influence of different boundary layer and near-surface parameterization schemes and different initial conditions on wind speed simulations.

Different Boundary Layer and Near-Ground Parameterization Schemes (Sensitivity Experiment A)

The simulated domain in this study is located in the Yellow Sea, with a center coordinate of (34.26°N, 120.57°E) (as shown in Figure 1). Three nested schemes were employed for WRF simulation, with horizontal grid resolutions of 150 × 150 (9 km), 136 × 136 (3 km), and 124 × 124 (1 km), respectively. The simulation period was initiated on 11 October 2021 at 00:00 (UTC), and concluded on 18 October 2021 at 18:00 (UTC), with a time interval of 15 min. The GDAS data, updated every 6 h, were utilized as the initial fields. A forecast lead time of 6 h was applied, and the spatial resolution was set at 0.25° × 0.25°. The microphysics scheme employed in WRF was the Lin scheme, with the longwave radiation scheme implemented as rrtmg. The land surface process was modeled using the Noah scheme, and the K–F scheme was chosen for cumulus parameterization (with the cumulus parameterization scheme deactivated in the second and third nested domains).
In this paper, seven experiments were designed to assess the impact of boundary layer and near-surface parameterization schemes on wind speed simulations. The turbulence and mixing option selected evaluated mixing terms in physical space. The eddy coefficient option adopts a first-order closure model using horizontal Smagorinsky, while no 6th-order diffusion was applied. Furthermore, Rayleigh damping with a damping coefficient of 0.2 was implemented. The specific experimental setups and assessment results are shown in Table 2. To ensure the accuracy and reliability of the simulation results, a spin-up process was carried out prior to the WRF simulations. The initial 4 h period of the WRF simulations was designated as the spin-up phase, aiming to attain a stable model state. This procedure guaranteed the physical validity of the initial conditions, preventing abrupt jumps and reducing errors and instabilities during the simulation.
As shown in Table 2, exp1 (employed the YSU boundary layer scheme and MM5 near-surface scheme) exhibited better simulation results with a correlation coefficient of 0.92, RMSE of 1.95, bias of 1.57, and MAPE of 0.21. Similarly, Exp2 also had good performance with a correlation coefficient of 0.92, RMSE of 1.61, bias of 1.21, and MAPE of 0.18, making it the best-performing combination among the seven setups. Conversely, exp6 and exp7 displayed relatively poor simulation results. Exp6, employing the MYNN2.5 boundary layer scheme and MYNN near-surface scheme, resulted in a low correlation coefficient of 0.11, RMSE of 3.38, bias of 2.61, and MAPE of 0.40. Exp7, adopting the QNSE boundary layer scheme and QNSE near-surface scheme, yielded a correlation coefficient of 0.59, RMSE of 5.68, bias of 5.00, and MAPE of 0.72. Considering the correlation coefficient, RMSE, bias, and MAPE, it can be concluded that exp1 and exp2 demonstrated superior simulation performance, while exp6 and exp7 performed relatively poorly. Therefore, the MRF boundary layer parameterization scheme and MM5 near-surface parameterization scheme were selected for subsequent simulations in this study.

Different Initial Fields

The analysis of Group A’s sensitivity experiments determined that the MRF boundary layer parameterization scheme and MM5 near-surface parameterization scheme (i.e., exp2) exhibited the best simulation performance. The experiments utilized the GDAS’s initial field. To investigate the influence of using GDAS reanalysis data versus GFS reanalysis data as the initial field, a comparative experiment was conducted using GFS reanalysis data as the initial field. This comparative experiment, combined with exp2 from Group A, constituted a sensitivity experiment examining different initial fields. The simulated results from these two experiments were then compared against the observed data, and the statistical results are shown in Table 3.
According to the data in Table 3, it can be observed that the simulation results of exp1 and exp2 were relatively good, and similar performance was shown by both experiments in terms of the correlation coefficient and error indicators. This suggests that accurate simulation results can be obtained using both GDAS and GFS reanalysis data as the initial field. However, slightly better simulation results were achieved when GDAS reanalysis data was used as the initial field compared to GFS reanalysis data. This difference can be attributed to the higher spatial resolution of GDAS reanalysis data, which is 0.25° × 0.25 °, whereas GFS reanalysis data has a spatial resolution of 1° × 1°. Therefore, GDAS reanalysis data was used as the initial field in the subsequent research.

2.2.4. WRF Simulation for the Yellow Sea Region in October 2021

In this study, WRF simulations were carried out for the Yellow Sea region in October 2021 with a focus on lower temporal and spatial resolution requirements than the previous sensitivity experiments. A two-layer nesting strategy was employed, and the simulation center was centered at 34°N, 123°E, as depicted in Figure 2. The horizontal grid resolutions were configured as 300 × 300 (9 km) and 286 × 286 (3 km). The second-level nested area encompassed a significant portion of the Yellow Sea, certain regions along the coasts of Shandong and Jiangsu in China, and parts of the Korean Peninsula. The simulation period extended from 1 October 2021 at 00:00 (UTC), to 31 October 2021 at 18:00 (UTC), with outputs generated at 60 min intervals. The initial field was derived from GDAS data, which was updated every six hours, and the forecast had a lead time of six hours. The spatial resolution was set at 0.25° × 0.25°. The Lin microphysics scheme, rrtmg longwave radiation scheme, Noah land surface model, K–F cumulus parameterization scheme (with the cumulus parameterization scheme disabled for the second-level nested area), MRF boundary layer parameterization scheme, and MM5 near-surface parameterization scheme were utilized in the WRF model. For the purpose of maintaining the accuracy of the simulation results and mitigating the impact of accumulated errors, ten simulations were performed, with each simulation lasting for 96 h. The data from the final 24 to 96 h of each simulation was extracted for subsequent analysis.
As an integral part of the climate system, the ocean has its sea surface temperature (SST) updated to maintain the model’s consistency with real-world conditions. During the simulation process, SST undergoes temporal variations, exerting an influence on atmospheric dynamics and thermodynamics, thereby enhancing the accuracy and reliability of the simulation results. Consequently, dynamic SST was utilized in this simulation, with SST data provided by the GDAS reanalysis serving as one of the inputs for the initial conditions in the WRF model.

2.2.5. Dataset Validation

A. WRF model applicability validation
To validate the generality of the proposed experimental scheme in the designated marine area, this study selected three WMO stations, namely 54953, 58264, and 58265, for verification. The chosen timeframe spanned from 15 October 2021 at 09:00 (UTC), to 16 October 2021 at 12:00 (UTC). The wind speed was high during this period, with average values of 13.96 m/s, 7.41 m/s, and 10.91 m/s for the 54953, 58264, and 58265 WMO stations, respectively. These wind speeds represented conditions of significant power output for offshore wind energy and can effectively represent the typical conditions of the ocean surface while minimizing errors arising from terrain and instrument measurements. The validation results are shown in Table 4.
It is shown in Table 4 that the MAPEs between the observed wind speeds from three WMO stations and the simulated wind speeds from WRF were all below 20%. Similar results were obtained for other evaluation metrics, which were consistent with the outcomes of the sensitivity experiments. The WDAR at all three WMO stations was also greater than 75%. Hence, based on these observational findings, it was concluded that the results generated using GDAS reanalysis data as initial conditions in the WRF numerical simulation, combined with the implementation of the MRF boundary layer parameterization scheme and MM5 near-surface parameterization scheme, were highly reliable.
B. Verification of the applicability of satellite inversion wind speeds
To ascertain the accuracy and applicability of wind speed retrieval products from the HY-2C and CFOSAT ocean satellites in the study area, the inversion data from the HY-2C satellite, which commenced at 08:45:15 on 16 October, and the inversion data from the CFOSAT satellite, which commenced at 09:56:42 on 16 October, were chosen for validation. Due to the temporal scope of the retrieval products typically encompassing a period before and after the designated time, the WRF simulated 10 m wind speeds at 09:00 and 10:00 on 16 October were selected for comparison. A total of 526 grid-point observations was obtained from the HY-2C satellite within the chosen area, while the CFOSAT satellite provided 507 grid-point observations. These observational data were compared with the corresponding grid-point WRF-simulated wind speeds, as shown in Table 5.
The difference in the RMSE between the HY-2C inversion data and the WRF simulated data was 1.19, accompanied by a bias of 0.95 m/s, and an average error rate of 6%. Similarly, the CFOSAT inversion data exhibited an RMSE of 1.25, a bias of 0.97 m/s, and an average error rate of 6% when compared to the WRF simulated data. The errors observed between the wind speed retrieval products from both satellite platforms and the WRF-simulated 10 m wind speeds were relatively small.
The satisfactory performance of wind speed retrieval products from the HY-2C and CFOSAT satellites in the study area was concluded based on the verification results mentioned above. This conclusion provides a reliable foundation for the further investigation and practical utilization of these products.

2.2.6. Wind Energy Calculation

Wind power density is a comprehensive index used to evaluate the status of wind energy resources in a certain area. It is precisely defined as the wind energy vertically passing through a unit area of airflow within a unit of time. Wind energy is influenced by factors such as the magnitude of wind speed, the frequency distribution of wind speeds, and air density. The following is an expression for wind power density:
D W P = 1 2 n i = 1 n ρ v i 3
where n represents the number of records within the designated period, ρ denotes air density, and vi3 represents the cube of the wind speeds recorded for the ith observation. DWP is the wind power density expressed in units of W/m2. The air density ρ is measured in units of kg/m3, and its calculation method is as follows:
ρ = P R T
In the equation, P represents atmospheric pressure, R denotes the gas constant, and T represents the temperature in Kelvin. The value of R used in this paper is 287 J/kg·K.

3. Results

3.1. WRF Simulation of Wind Speeds in the East China Sea

3.1.1. WRF Simulation of the Vertical Distribution of Wind Speeds over the East China Sea

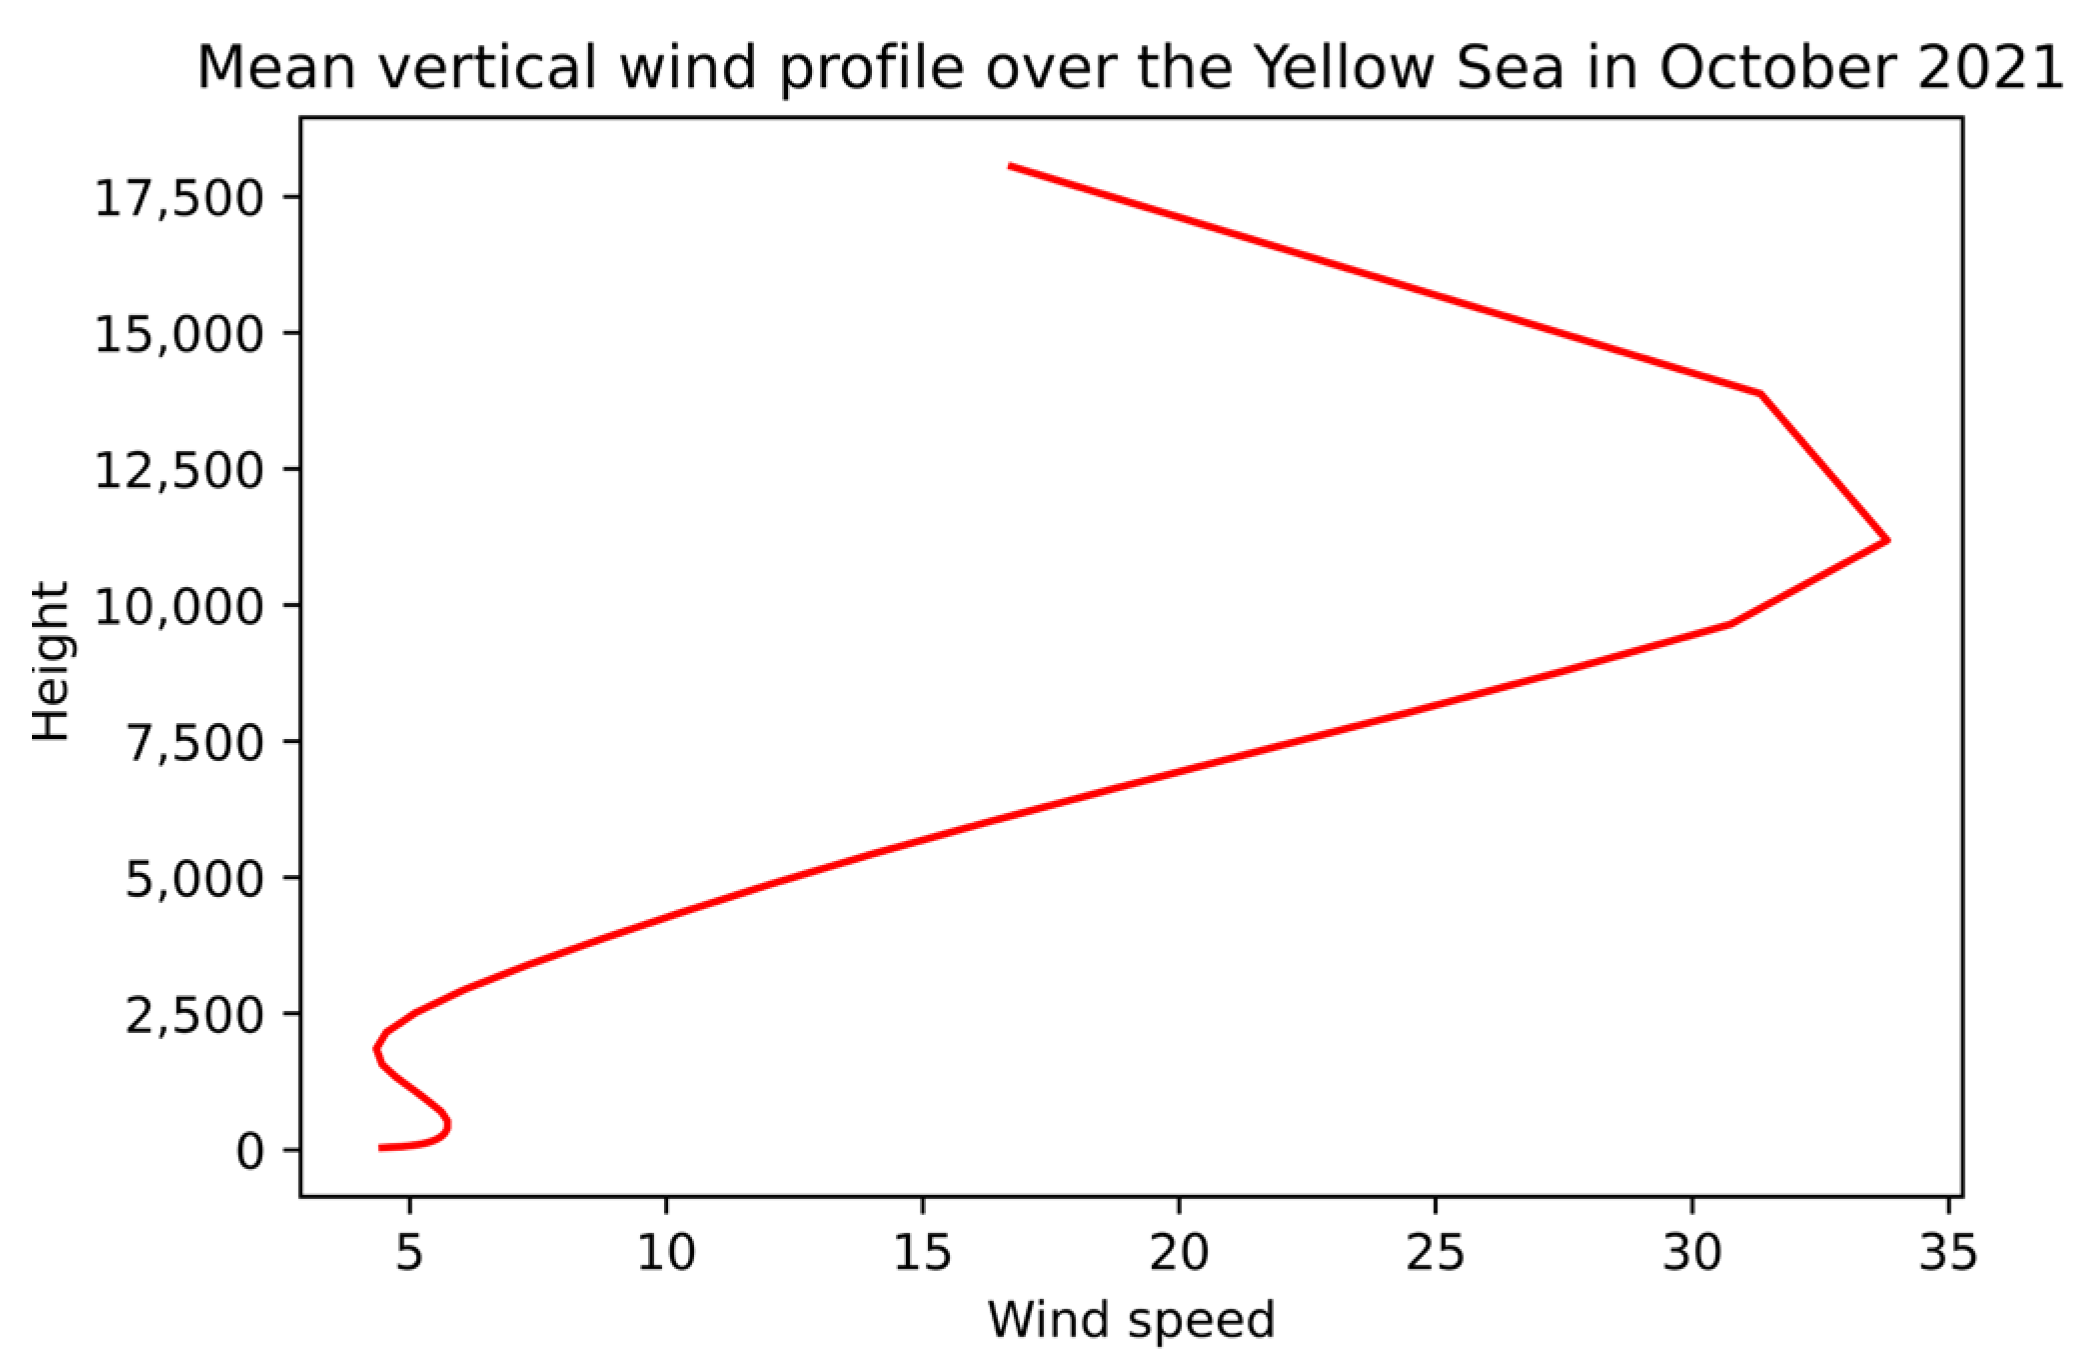
The wind speeds over the Yellow Sea in October 2021 were processed by averaging along this study’s southerly, zonal, and temporal directions. As a result, the vertical wind speed profiles over the Yellow Sea during the specified period were obtained. Figure 3 illustrates the variation in wind speed across the entire altitudinal range. Specifically, the wind speeds increased with increasing altitude from sea level to 500 m, decreased between 500 m and 1800 m, increased from 1800 m to 11,000 m, and fell above 11,000 m.
In conclusion, when evaluating wind energy and planning wind farm layouts over the Yellow Sea, the influence of wind speed variations at different altitude ranges on wind energy resources must be considered. Specifically, a thorough analysis and evaluation of wind energy distribution should be emphasized at an altitude below 500 m to accurately assess the availability of wind energy resources and plan the layout of wind farms.

3.1.2. Time-Series Distribution of Wind Speeds over the East China Sea Simulated Using WRF

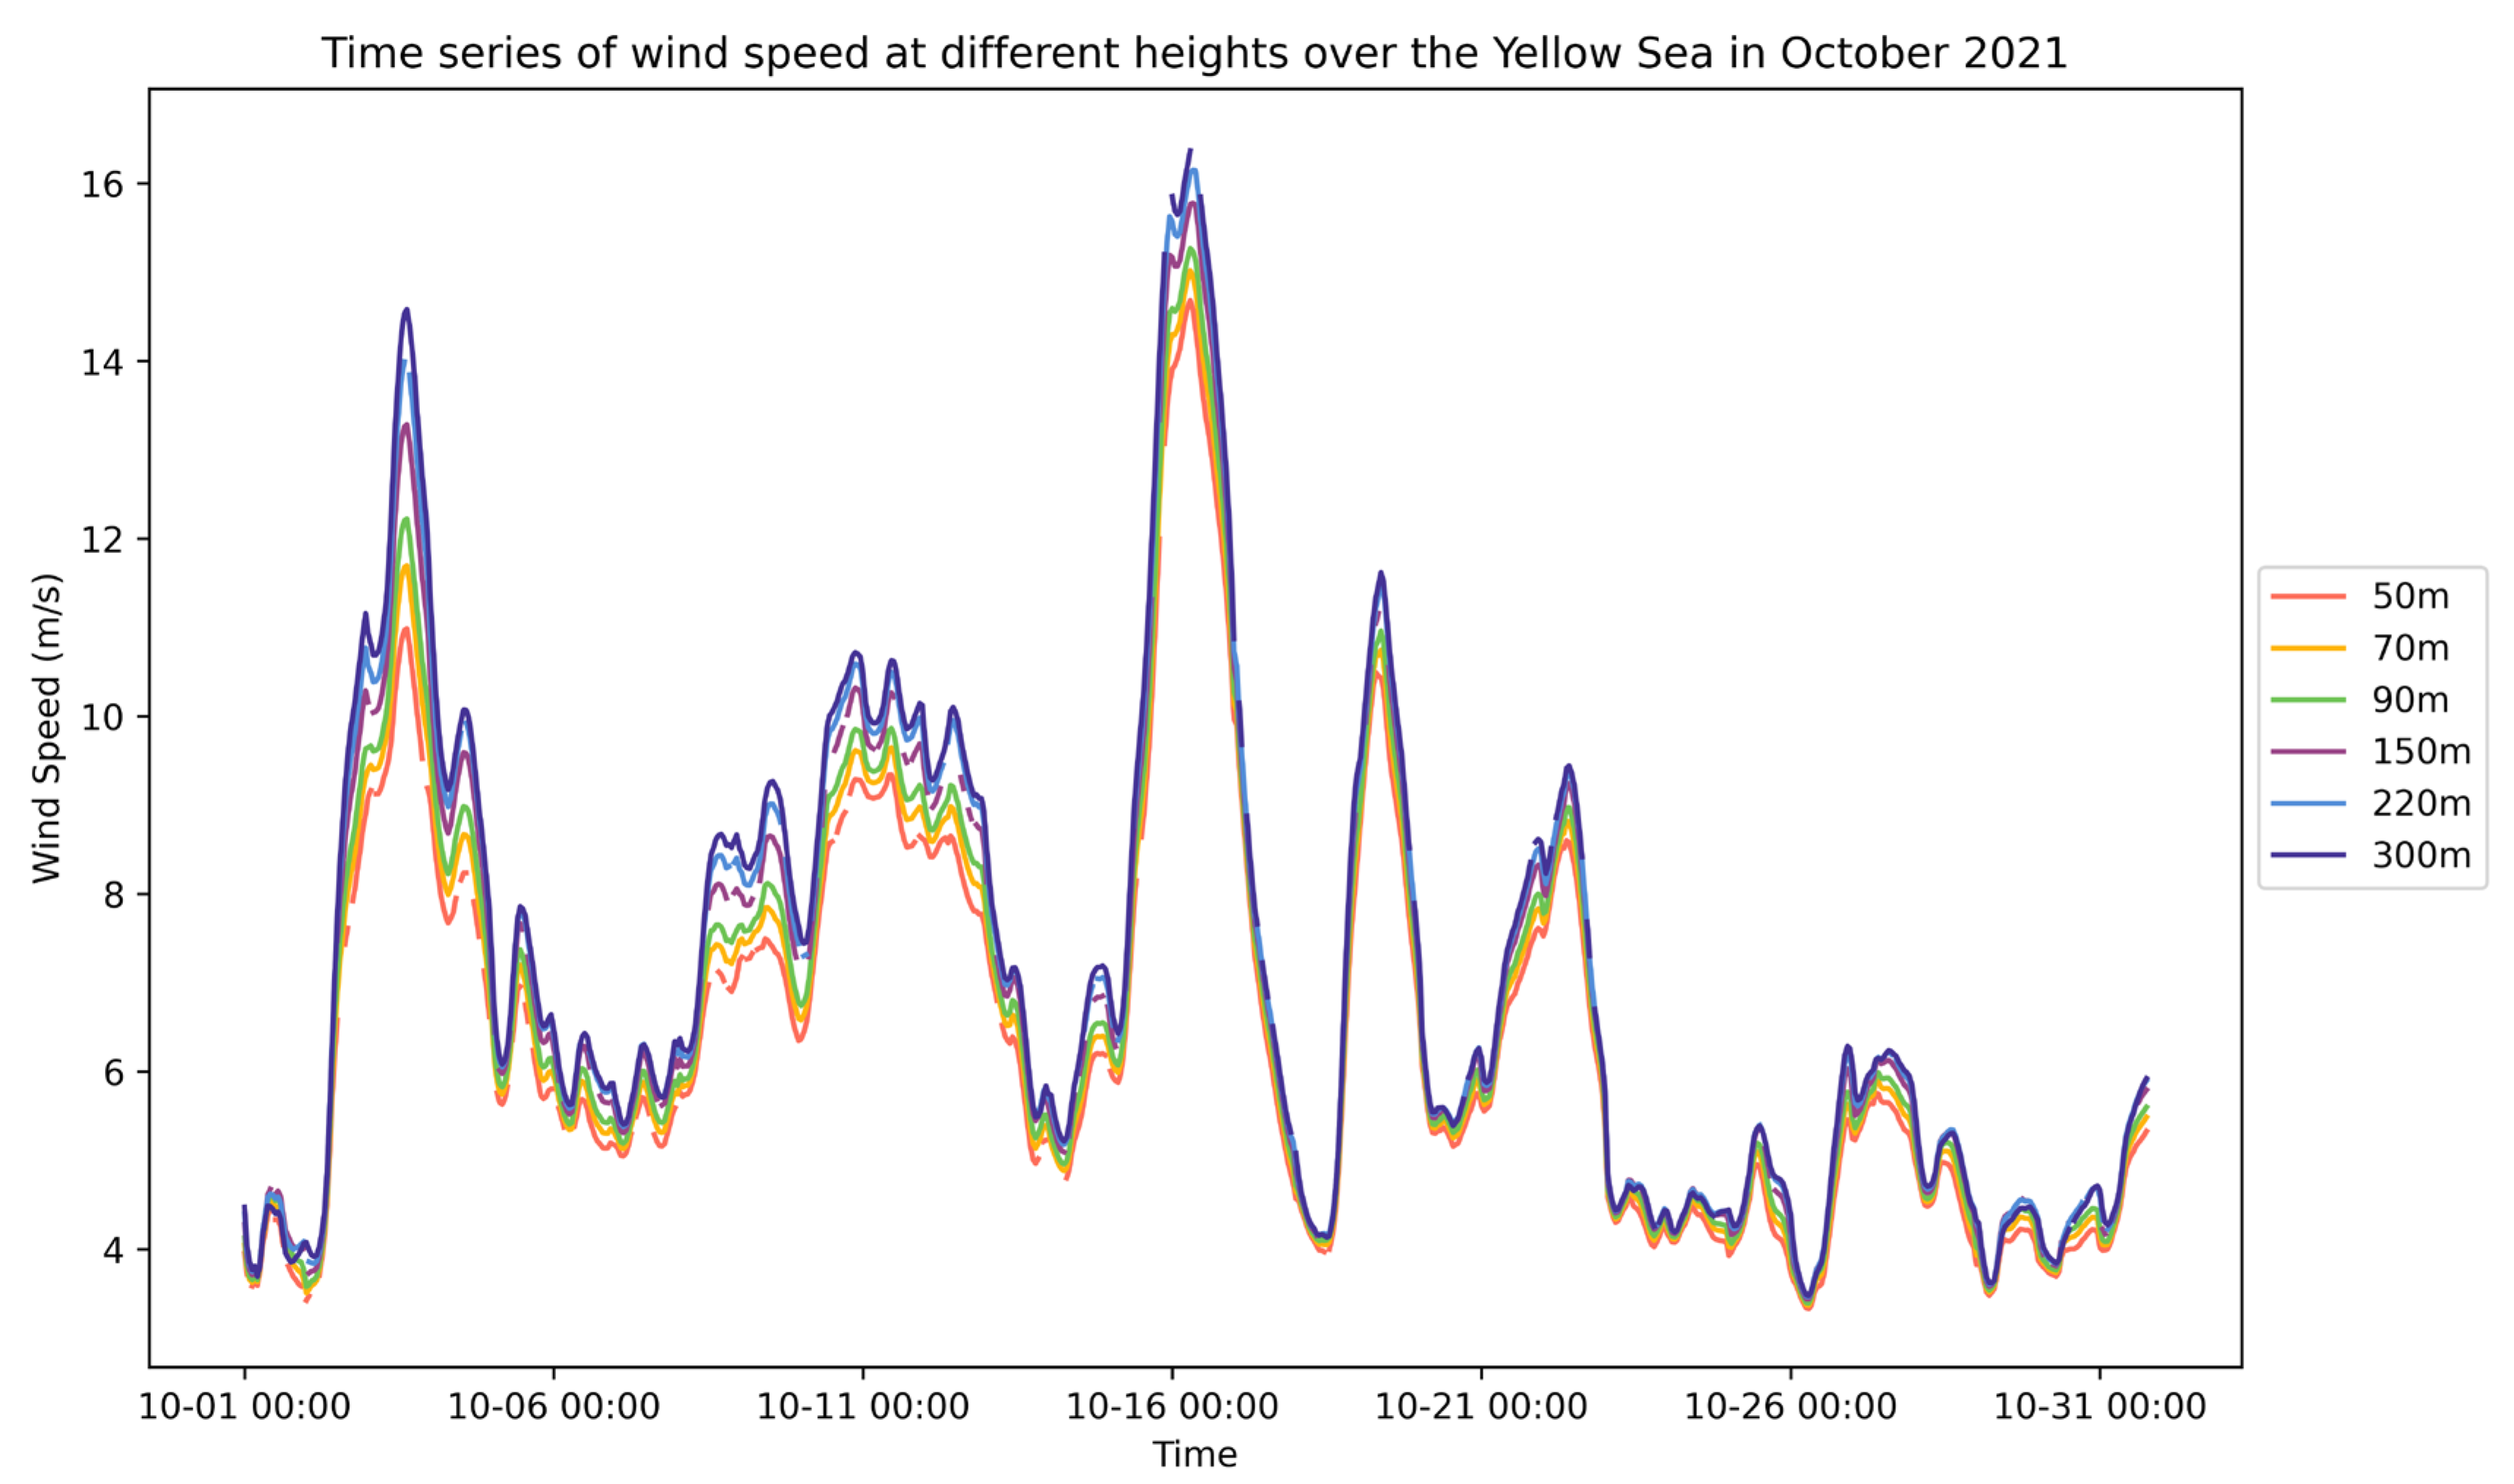
The wind speeds at heights of 50 m, 70 m, 90 m, 150 m, 220 m, and 300 m over the Yellow Sea in October 2021 were averaged in both the meridional and zonal directions in this study. Figure 4 illustrates the temporal evolution in wind speeds at these different heights. The figure shows that the wind speeds at various heights, from 50 to 300 m, exhibited prominent temporal variations and shared a consistent trend. As the height increased, the wind speeds gradually increased as well. Specifically, the average wind speed at 50 m was 6.39 m/s, while at 300 m, it was 7.15 m/s.
During the first half of October, the wind speeds reached their highest point, up to 15 m/s. As the second half of the month approached, the wind speeds increased, peaking at 17 m/s. Nevertheless, as the latter part of the month progressed, the wind speeds gradually diminished and exhibited fluctuations from 4 m/s to 6 m/s.

3.1.3. Horizontal Distribution of Wind Speeds at Each Height in the Yellow Sea Simulated by WRF

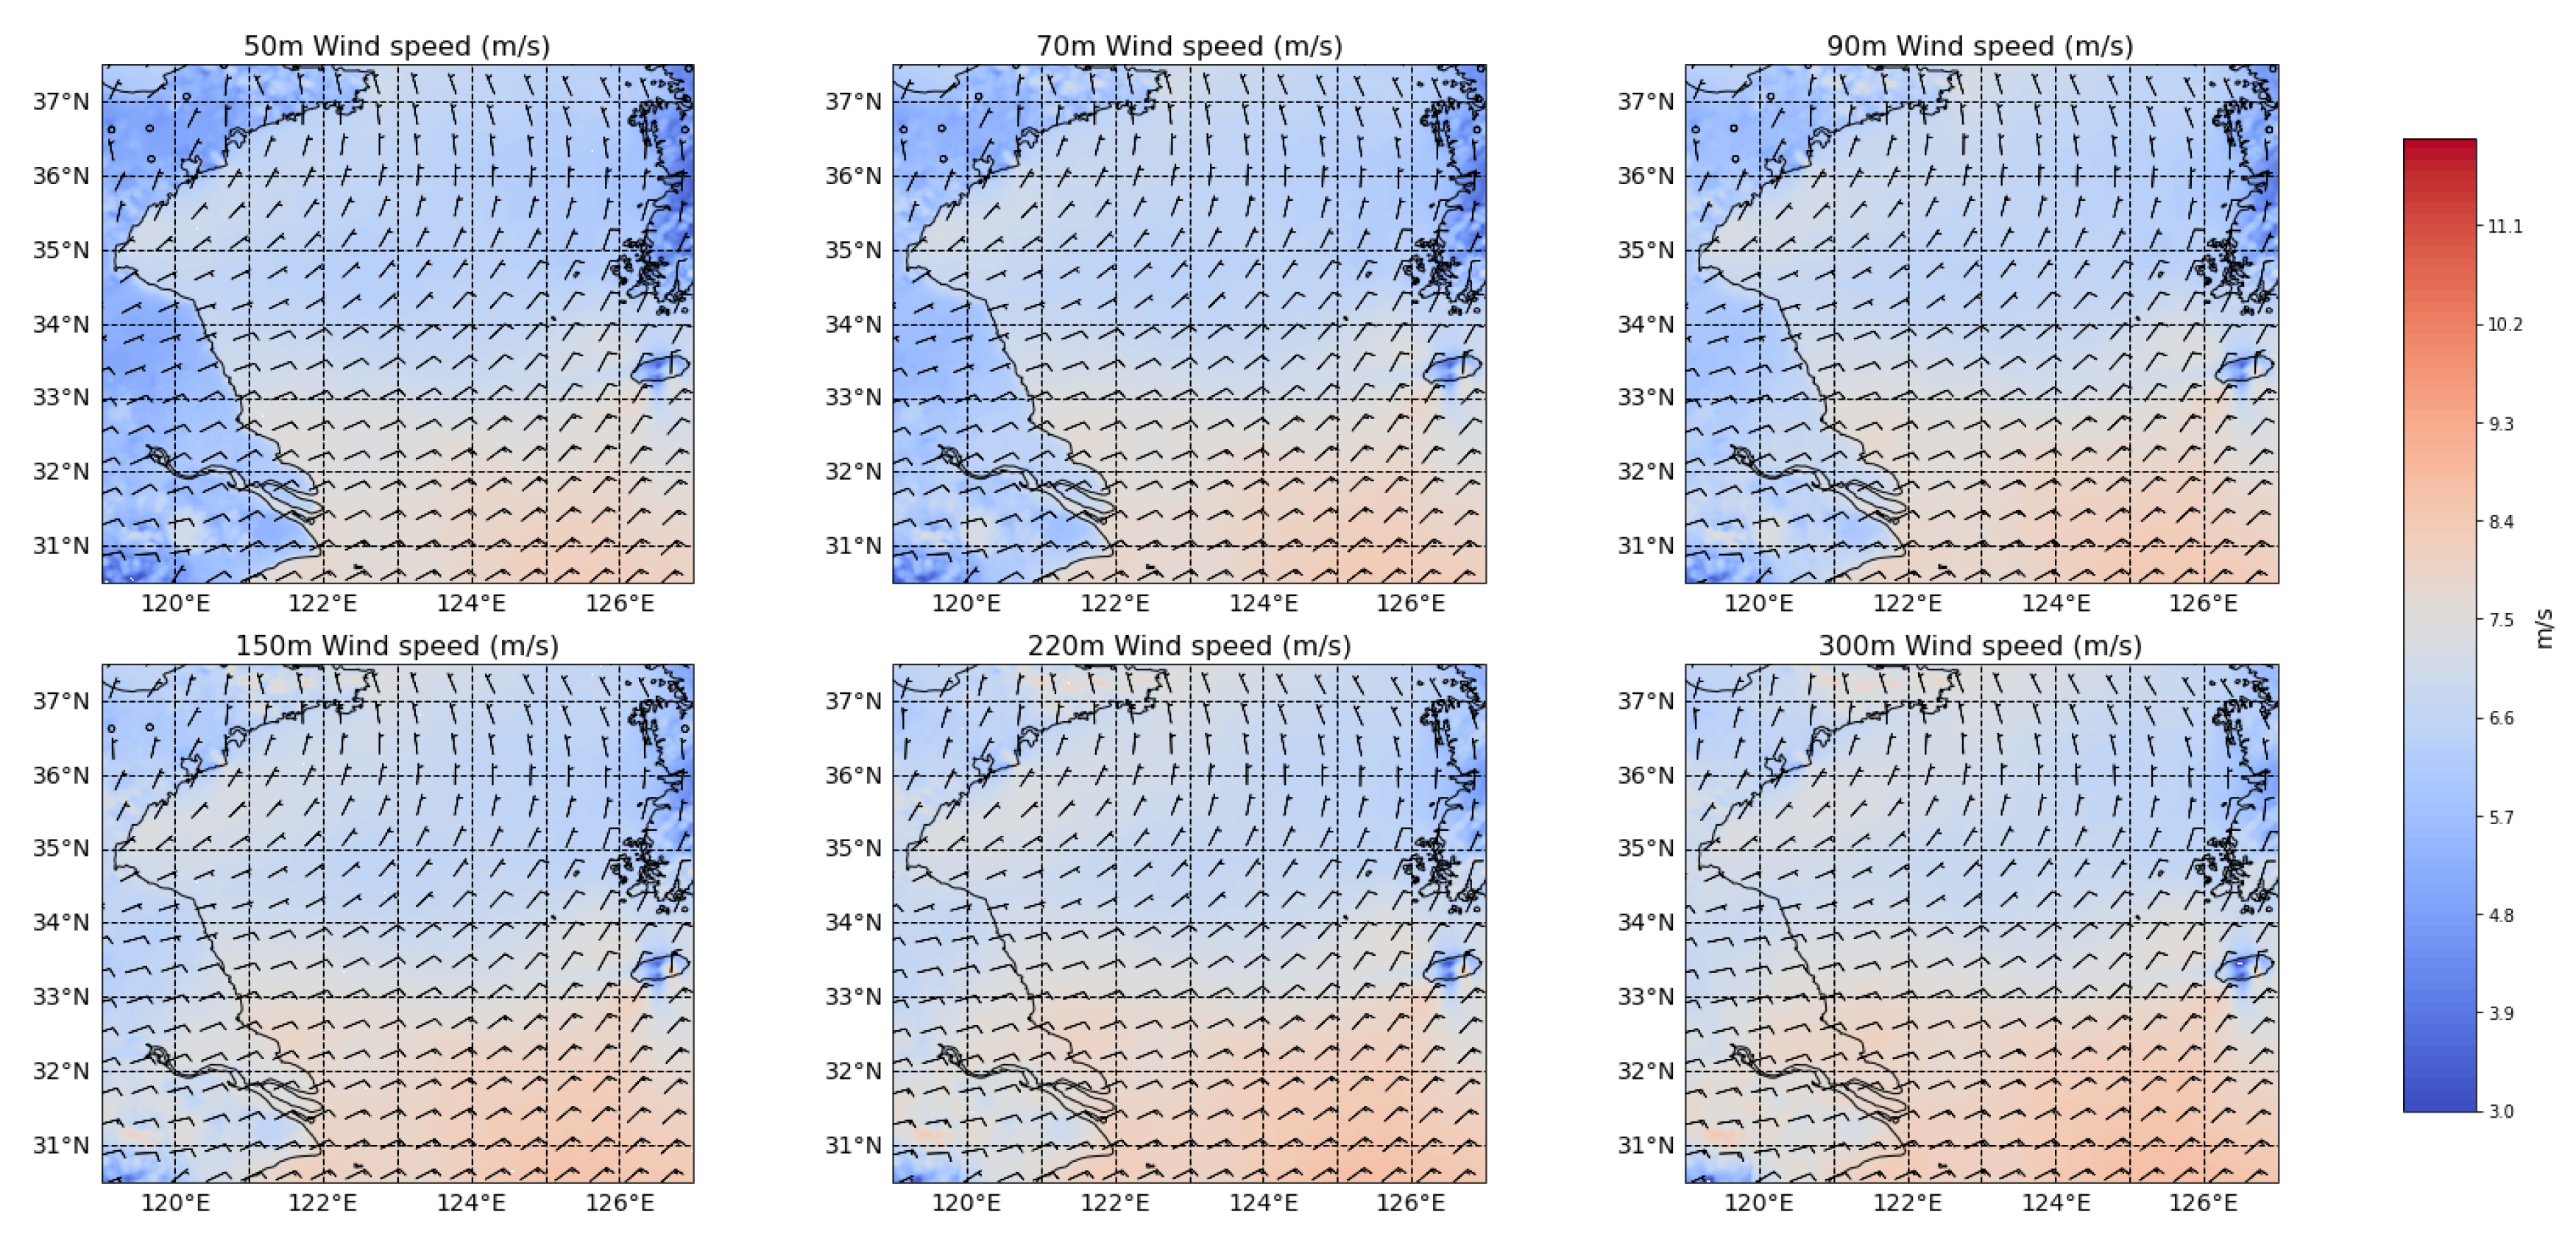
The horizontal wind field distribution at heights of 50 m, 70 m, 90 m, 150 m, 220 m, and 300 m was obtained through vertical linear interpolation (Figure 5). It was evident that the horizontal wind direction remained nearly constant across various heights. The northern part of the Yellow Sea was primarily characterized by a northerly wind, while the southern part experienced prevailing winds from the northeast. Moreover, the wind speeds over the ocean were generally higher than those over land. Along the coastal region of the Yellow Sea in China, the land wind speeds exceeded those over the Korean Peninsula. In the marine area between the Shandong Peninsula and the Korean Peninsula, where the mountainous terrain obstructs the wind flow, the wind speeds were relatively lower, ranging from 6 to 8 m/s. However, in the marine area between the southwest of Jeju Island and the Yangtze River Delta, where there is no land obstruction from the northeast due to the presence of the northwest Pacific Ocean, the wind speeds were significantly higher than in the northern part of the Yellow Sea, reaching above 9 m/s. Additionally, the wind speeds over the ocean increased with increasing height, while the wind speeds over land exhibited a more pronounced increase with height, particularly when compared to the ocean.

3.2. WRF Simulates the Horizontal Distribution of Wind Energy in the Yellow Sea

The analysis revealed that the wind speeds over the ocean were noticeably greater in the lower atmosphere than over land. This discrepancy was primarily attributable to obstructing objects on land surfaces. However, it is essential to note that the wind speeds of large lakes, such as Lake Tai, were comparable to those of nearby coastal regions. Furthermore, Figure 6 highlights that the disparity in wind power density between the ocean and land gradually diminished with increasing height. The offshore region west of Jeju Island exhibited the highest wind power density within the simulation area. For example, at a height of 50 m, the wind power density in this area was approximately 400 W/m². As the height increased, the wind power density in this region rose further, reaching levels of 600–700 W/m² at a height of 300 m.

3.3. Satellite Inversion 10 m Wind Field

3.3.1. HY-2C, CFOSAT Inversion 10 m Wind Field Distribution

As satellites cannot simultaneously cover the entire global ocean surface, the following assumptions were made in this study: It was assumed that for locations with available satellite data in October 2021, the data would be cumulatively accumulated, and the mean value of all non-empty data points would be interpolated onto a 0.25° × 0.25° grid. The spatial region encompassed by 30.5°N to 37.5°N, and 119°E to 127°E, was chosen as the focus of analysis. The Haversine formula [45] was used to calculate the meridional average distance, which was approximately 735.6 km, while the zonal average length was approximately 778 km. In this analysis, the region included 29.4 × 31.1 wind cells, each measuring 25 km × 25 km, which closely approximated the coverage of satellite observations. Hence, the assumptions mentioned above are considered valid.
Based on the assumptions discussed above, in this study we conducted the following analysis: Figure 7 illustrates the average distribution of 10 m wind speeds over the Yellow Sea in October 2021, obtained from HY-2C and CFOSAT retrievals, as well as the WRF model simulation. The left panel of Figure 7 illustrates the 10 m wind field over the Yellow Sea derived from HY-2C and CFOSAT retrievals in October 2021. The image shows that the Yellow Sea wind field retrieved by HY-2C provided coverage for a substantial portion of the region, with a concentration of missing data primarily observed in near-shore areas. The wind speeds in the southern part of the Yellow Sea were greater than those in the northern region, and the maximum wind speeds were observed near the Zhoushan Islands. The middle panel displays the 10 m wind field over the Yellow Sea derived from CFOSAT scatterometer observations in October 2021. The image shows that the scatterometer observations effectively covered a significant portion of the Yellow Sea, with missing data primarily concentrated in near-shore regions. Wind speeds were higher in the southern part of the Yellow Sea than in the northern part, with wind speeds along the coastal areas of the Korean Peninsula being lower than those along the coasts of Shandong and Jiangsu in China. The maximum wind speeds were observed in the vicinity of the Zhoushan Islands. Compared to the wind field derived from the HY-2C retrieval, the missing data range was similar for CFOSAT. HY-2C observations covered the northern part of the sea area extending beyond Jeju Island, and the 10 m wind speeds derived from the HY-2C retrieval were more significant in the northern part of the Yellow Sea compared to the CFOSAT retrieval. The right panel shows the average distribution of 10 m wind speeds over the Yellow Sea and its surrounding areas simulated using the Weather Research and Forecasting (WRF) model. It was evident from the image that wind speeds over the ocean were significantly higher than those over land. The maximum wind speeds over the ocean were observed in the southwestern waters of Jeju Island, while over land, they occurred over large inland lakes.
Figure 8 presents the differences between the two satellite retrieval products and the simulated wind speeds from the WRF model under different wind speed conditions. The differences were calculated by subtracting the simulated values from the corresponding grid points of the satellite retrievals. For the low wind speeds conditions, the transit data of the HY-2C satellite retrieval on 23 October at 07:19:20 (UTC), 24 October at 21:29:38 (UTC), and October 25 at 21:47:04 (UTC), as well as the CFOSAT satellite retrieval on 23 October at 09:49:15 (UTC), 24 October at 22:14:48 (UTC), and 25 October at 22:00:09 (UTC), were chosen. In this study, wind speeds below 6 m/s were considered low wind speeds. The figure shows that under common wind speed conditions, the HY-2C retrieval results tended to be lower in most areas. At the same time, CFOSAT exhibited lower values in the northern part and higher values in the southern region. Hence, the CFOSAT satellite retrieval product better agree with the WRF simulation results under common wind speed conditions.
The selected transit data for moderate wind speeds conditions included the HY-2C satellite retrieval data for 10 October at 10:28:44 and 18 October at 23:13:03, as well as the CFOSAT satellite retrieval data for 10 October at 10:19:50 and 18 October at 23:07:33. Moderate wind speeds were defined as wind speeds ranging from 6 m/s to 12 m/s. The figure shows that under moderate wind speed conditions, both satellite retrieval products tended to exhibit higher values in the northern part and lower values in the southern region.
The transit data for high wind speed conditions included the HY-2C satellite retrieval data for 16 October at 08:45:15, as well as the CFOSAT satellite retrieval data for 16 October at 09:56:42. High wind speeds were defined as wind speeds greater than 12 m/s. The figure shows that both satellite retrieval products exhibited minor deviations in most sea areas. Overall, the HY-2C satellite retrieval product generally showed higher values, while the CFOSAT satellite retrieval product fell within the −1 to 1 m/s range.

3.3.2. Comparison of HY-2C and CFOSAT Inversion 10 m Wind Field

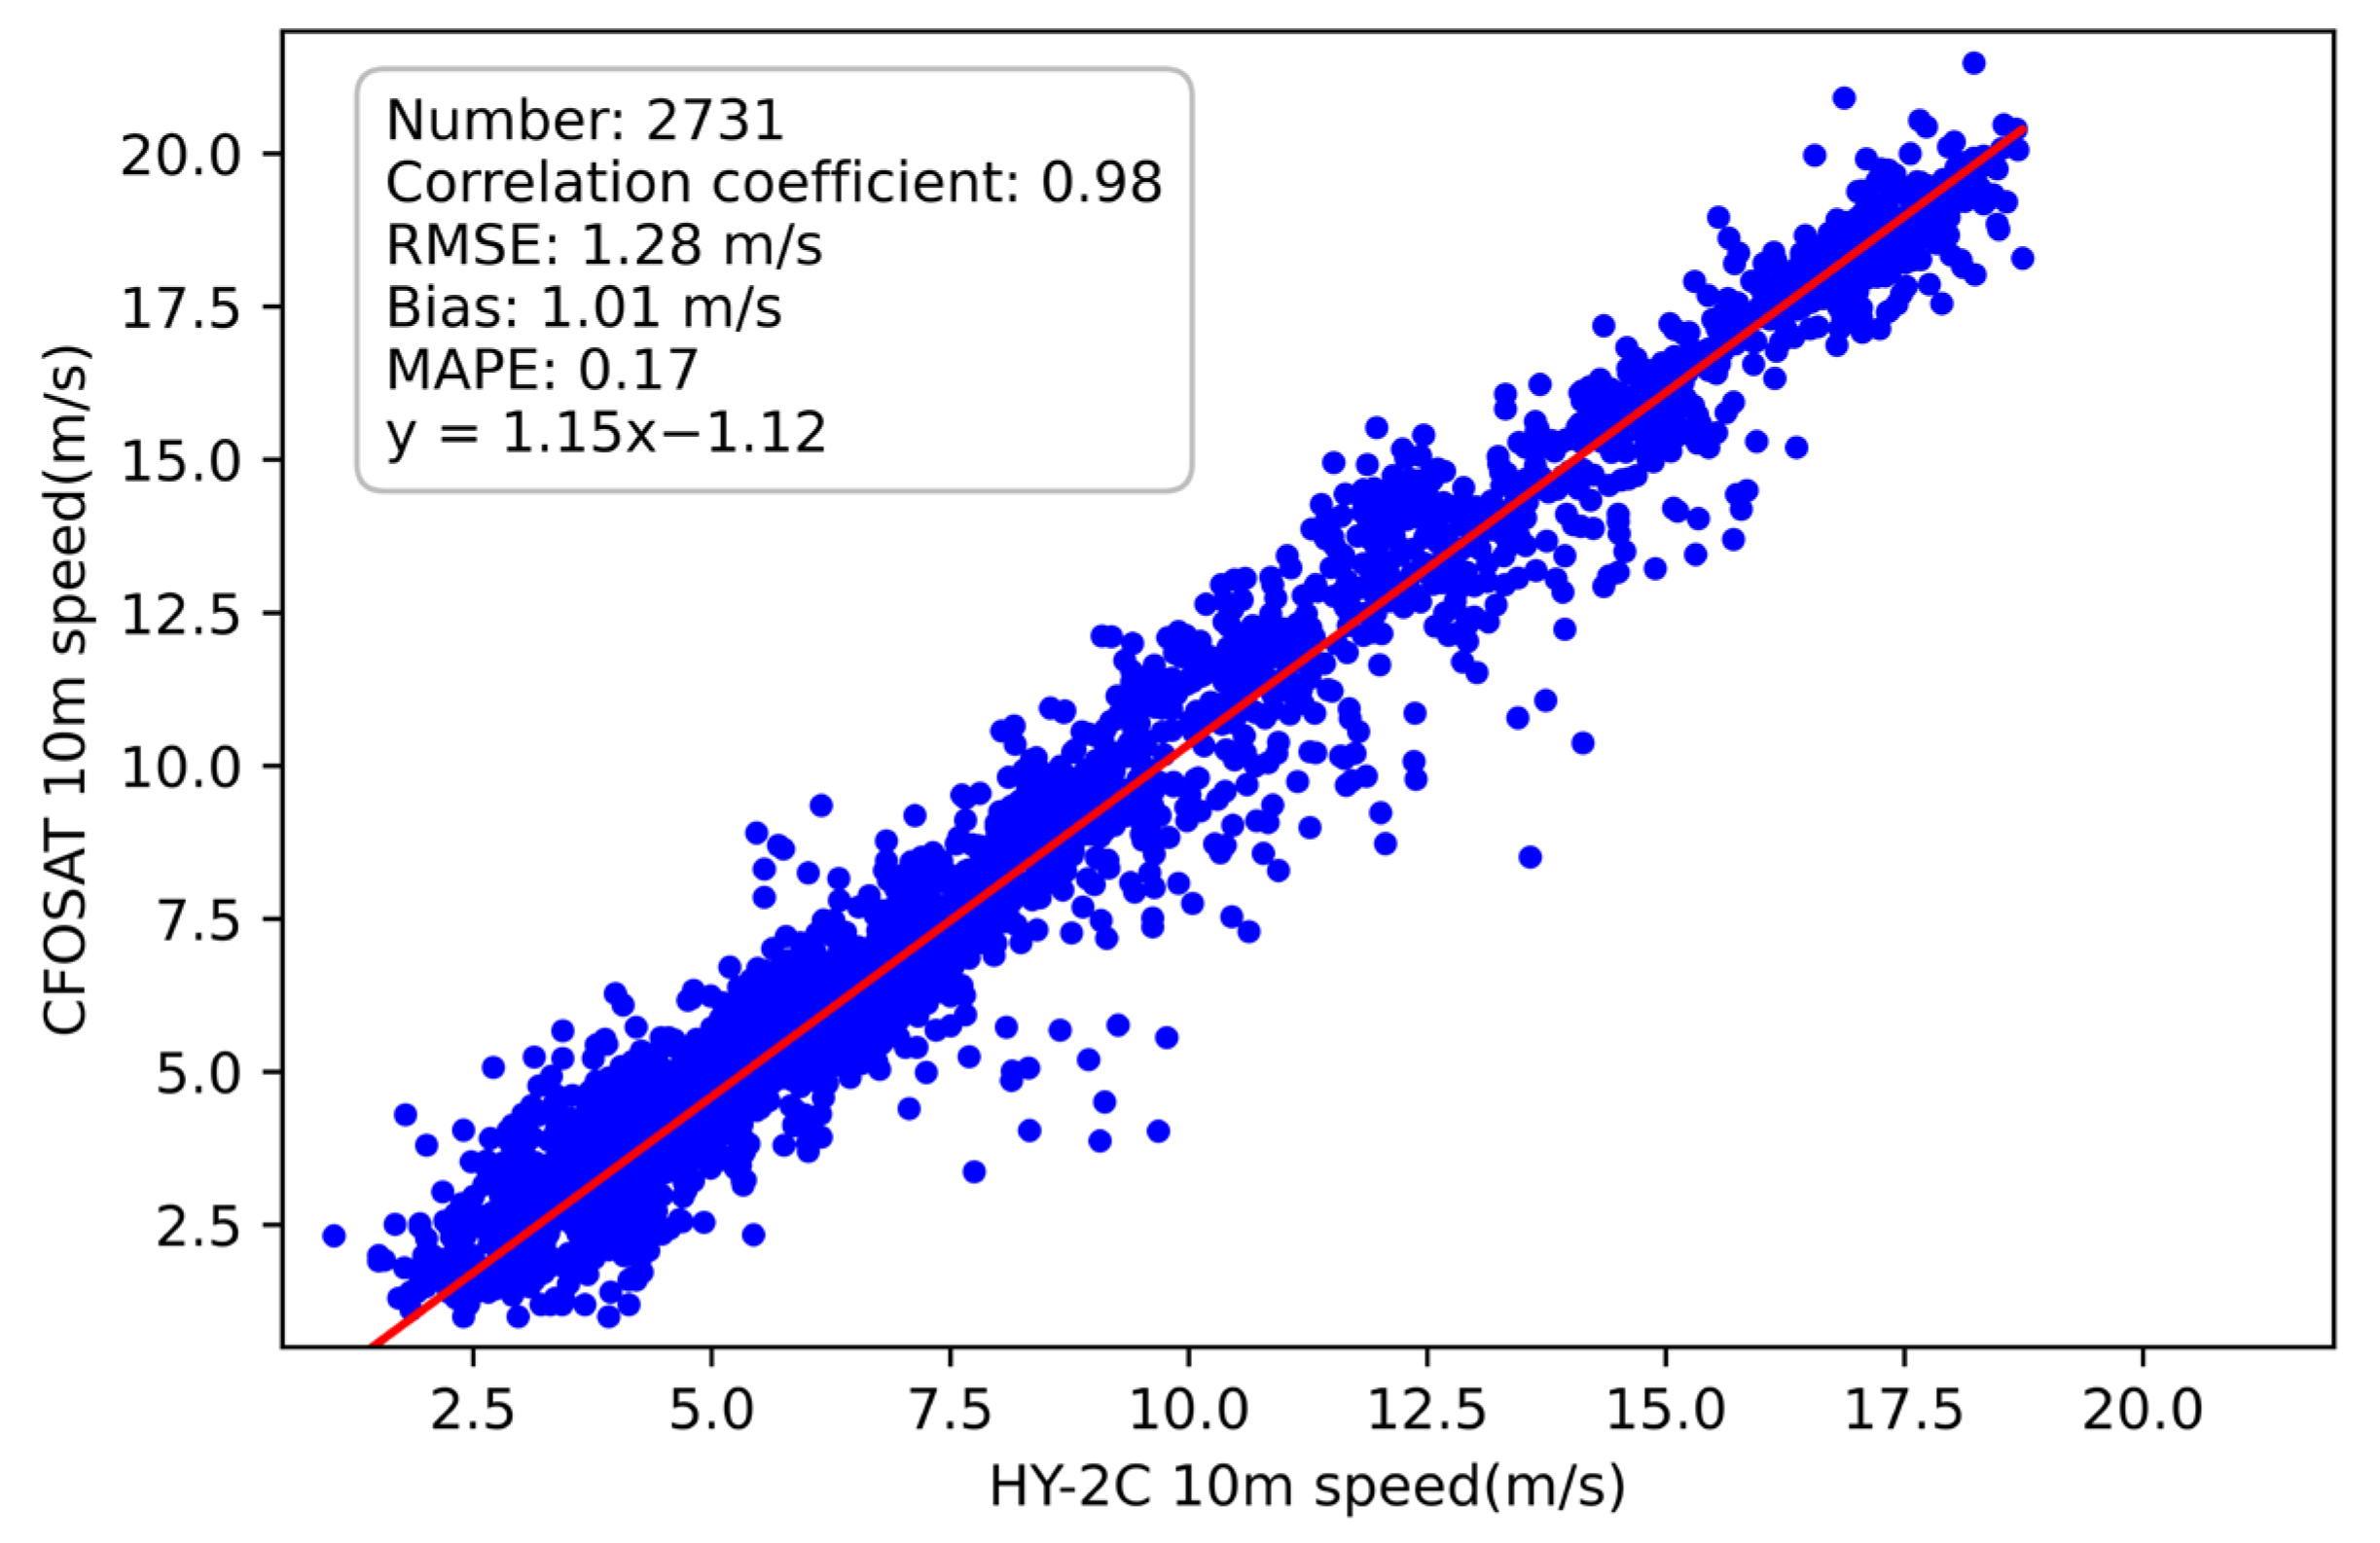
Figure 9 compares the 10 m wind fields over the Yellow Sea derived from HY-2C and CFOSAT retrievals during similar periods. The following analysis results were based on the evaluation metrics obtained from comparing the 10 m wind fields between HY-2C and CFOSAT.
The correlation coefficient of 0.615 indicated a certain level of linear relationship between the 10 m wind fields derived from the HY-2C and CFOSAT data. This implies that the wind field data from the two satellites varied in conjunction with each other to some extent, indicating comparable detection capabilities for the 10 m wind fields over the Yellow Sea. The root-mean-square error of 1.28 and the mean bias ratio of 0.17 indicated a close agreement in the detection capabilities of the two satellites for the 10 m wind fields over the Yellow Sea. The linear regression equation, y = 1.15 x − 1.12, revealed the linear relationship between the 10 m wind fields of HY-2C and CFOSAT data. This equation suggests that the dependent variable increased proportionally with the increase in the independent variable. However, it is important to note that there was no direct mapping relationship between the x-axis and y-axis. Thus, this regression equation describes the overall trend between the two variables. Furthermore, some points may deviate significantly due to the slight mismatch in transit times between the two satellites.

3.4. Relationship between Satellite Inversion Wind Field and Wind Energy Density over the Yellow Sea

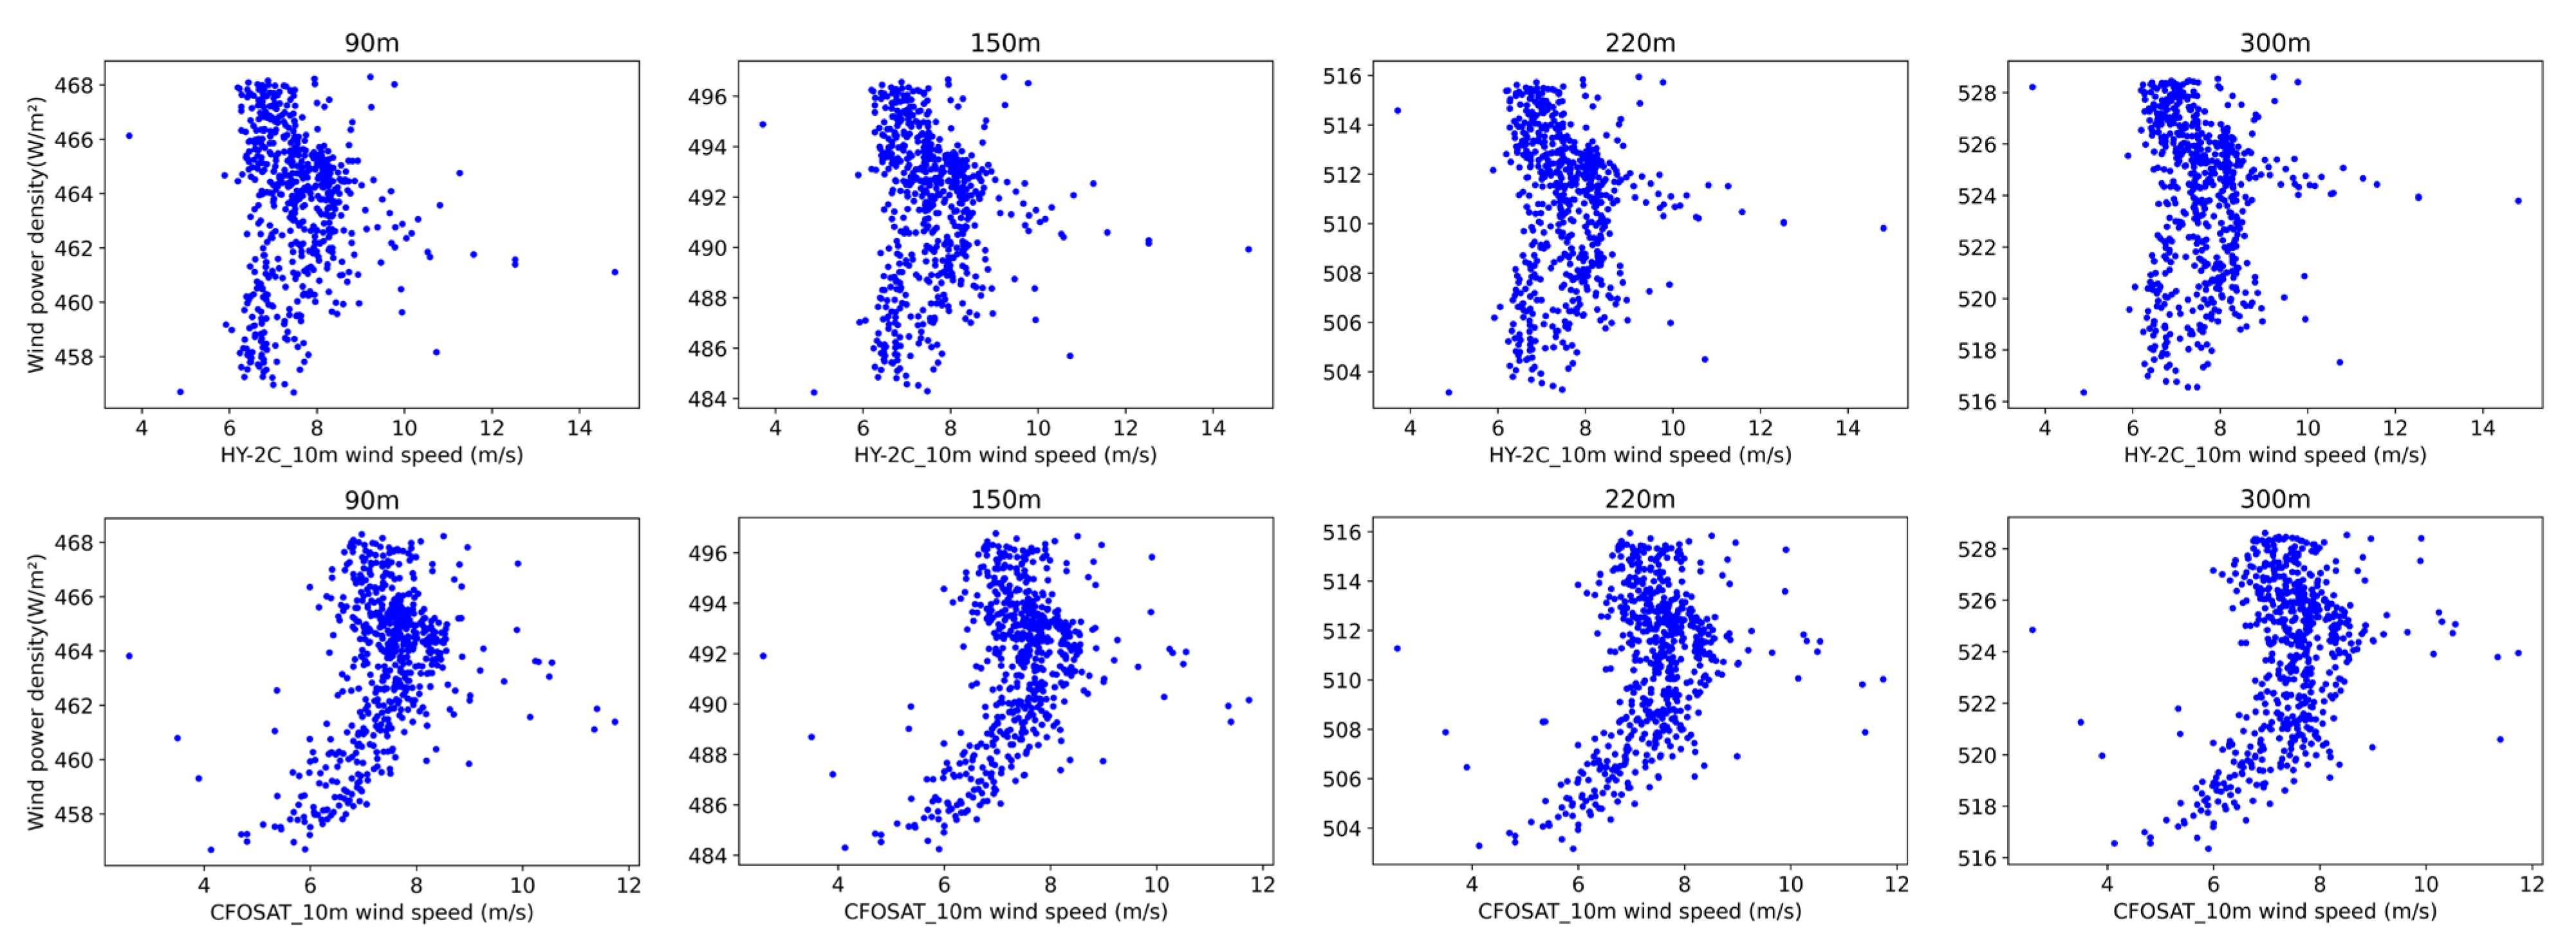
Figure 10 compares the 10 m wind fields derived from HY-2C and CFOSAT satellite retrievals with the wind power density simulated using WRF at various heights. The wind power density also increased as the 10 m wind speeds increased in HY-2C observations. When the 10 m wind speed was less than 9 m/s, it followed a cubic trend of increase. However, when the 10 m wind speed exceeded 9 m/s, the wind power density no longer increased with the wind speeds. Due to the concentration of HY-2C observations on the Yellow Sea surface in the range of 6–10 m/s, the data points on the graph were relatively clustered, and the cubic relationship between the wind power density and wind speed was not apparent.
Similarly, as the 10 m wind speeds increased in CFOSAT observations, the wind power density also increased. When the 10 m wind speed was less than 9 m/s, it followed a cubic trend of increase. However, when the 10 m wind speed exceeded 9 m/s, the wind power density no longer increased with the wind speed.

4. Discussion

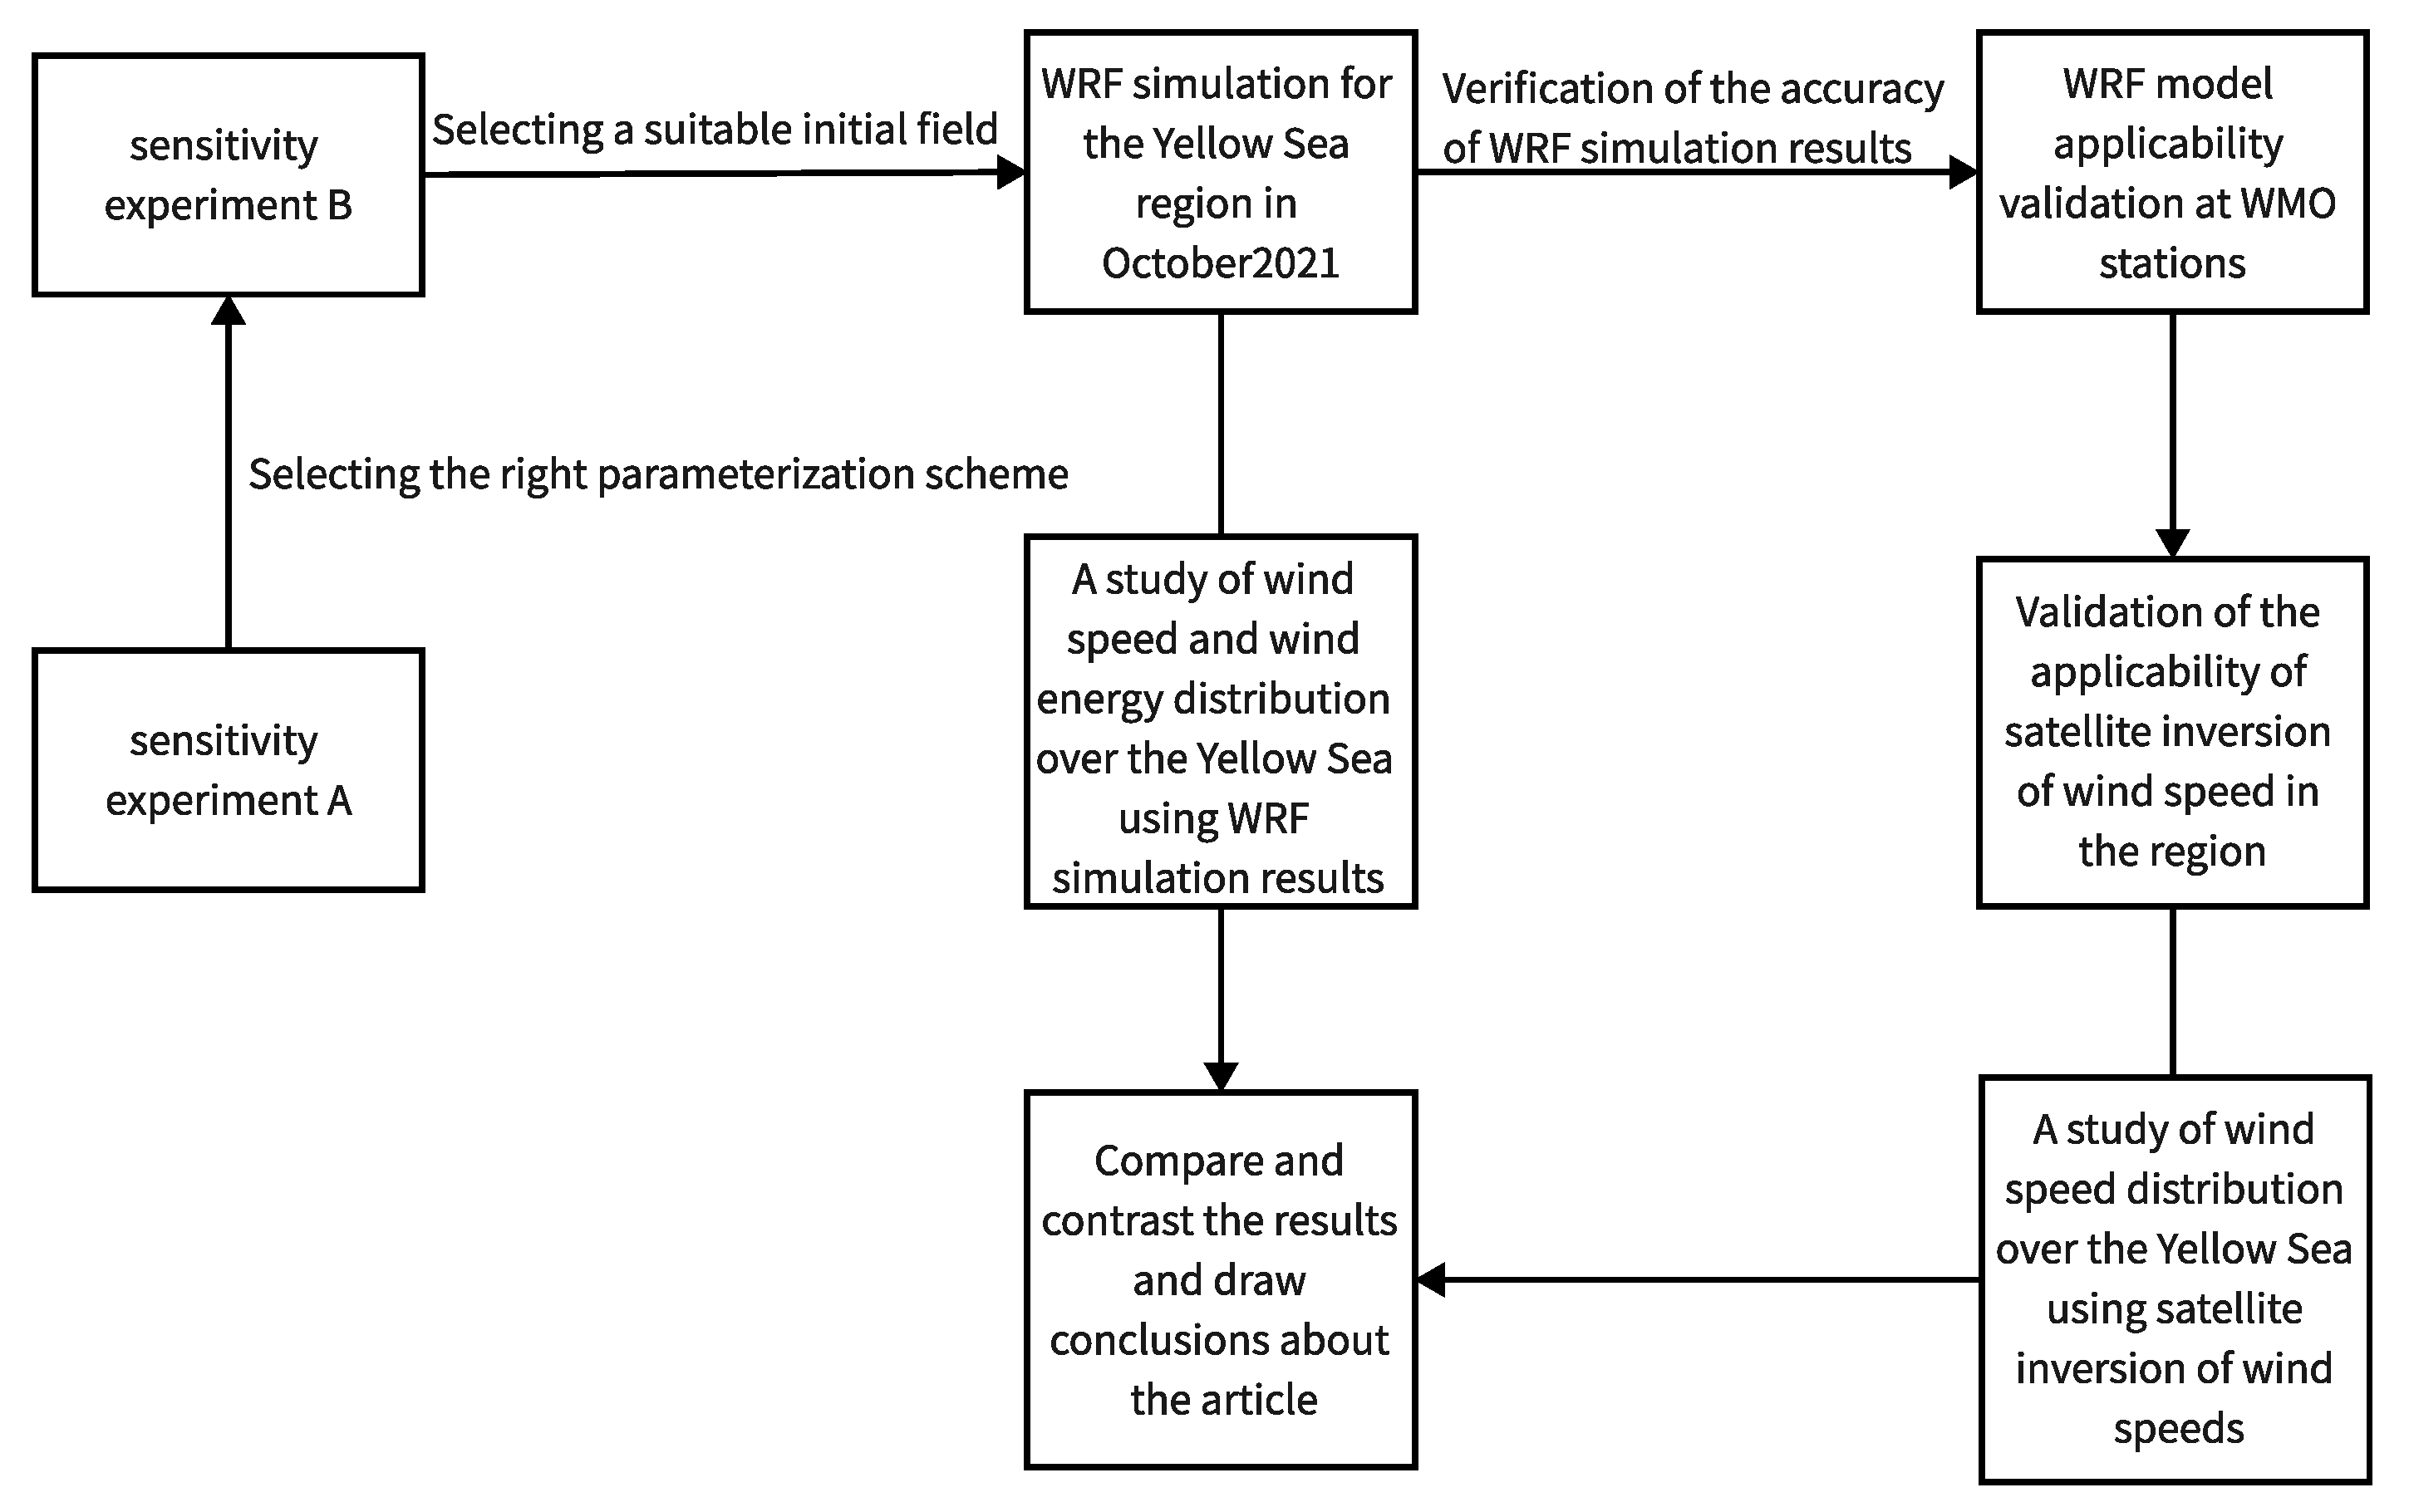
This study simulated meteorological field at different heights over the Yellow Sea and its surrounding areas in October 2021 using the WRF model at 50 m, 70 m, 90 m, 150 m, 220 m, and 300 m. By comparing the simulated results with observations from nearby meteorological stations, the rationality of the chosen WRF parameterization schemes and the applicability of the WRF model in the study area were validated. Furthermore, the usability of these two retrieval products was demonstrated by comparing the WRF simulation data with two ocean satellite-derived wind speed products. Figure 11 represents the flowchart of this study. This study analyzed the vertical wind profiles of the entire atmospheric column during the study period, as well as the average wind fields at different heights over the near-sea surface, and calculated the distribution of wind power density over the near-sea surface. These results provided the necessary theoretical support for selecting offshore wind farm locations. Additionally, this study analyzed the performance of the HY-2C and CFOSAT ocean satellites over the Yellow Sea in October 2021 and presented a qualitative relationship between satellite-retrieved surface wind speeds and high-altitude wind power density. In the following sections, a comparative analysis will be conducted between the ocean’s ten-meter wind speeds derived from the satellite inversions and ERA5 data. Additionally, this study will present the outlook for future research.

4.1. Comparison of HY-2C and CFOSAT Inversion Data with ERA5

This study assessed the accuracy of satellite-retrieved sea surface wind speed data by comparing CFOSAT and HY-2C satellite-retrieved wind data with ERA5 reanalysis wind data for the same period as in Section 3.3.1. By subtracting the satellite-retrieved wind speed values at the corresponding times from the ERA5 reanalysis wind speed values, the results shown in Figure 12 were obtained.
Figure 12 shows that CFOSAT’s retrieved sea surface wind speed during the low wind speed period was slightly lower than the ERA5 reanalysis data in the northern Yellow Sea, while it was somewhat higher in the southern Yellow Sea. Near 34°N, the wind speeds of both datasets exhibited a similar performance. Similar trends were also evident in HY-2C’s retrieved sea surface wind speeds, which were lower than ERA5 reanalysis data in the northern Yellow Sea and slightly higher in the southern Yellow Sea, with a relatively large deviation of up to 8 m/s in the south of the region.
During the moderate wind speed period, CFOSAT’s retrieved sea surface wind speed was slightly higher than ERA5 reanalysis data in the northern Yellow Sea and somewhat lower in the southern Yellow Sea. Near 33.5°N, both datasets showed relatively similar wind speed patterns. Compared to CFOSAT, HY-2C’s retrieved sea surface wind speed also exhibited identical results to ERA5 reanalysis data during the moderate wind speed period. However, HY-2C had slightly larger errors relative to ERA5 reanalysis data.
In the high wind speed period, both satellite datasets generally overestimated the wind speed values over most oceanic regions, with some overestimation observed in the northwestern Yellow Sea. Overall, CFOSAT and HY-2C satellite-retrieved sea surface wind speed data showed significant deviations when compared to ERA5 reanalysis data, with higher discrepancies than those observed in comparison with WRF simulation results.
In conclusion, careful analysis and evaluation of error patterns in different wind speed periods and regions are necessary to ensure the accuracy and reliability of satellite-retrieved sea surface wind speed data. Additionally, when using satellite-retrieved data, consideration should be given to potential error sources arising from different satellite instruments and data processing algorithms to enhance data quality and credibility further.

4.2. The Limitations of This Study and Future Research Prospects

The findings can provide a scientific basis for the development of offshore wind power, facilitate the establishment of reasonable wind power planning, optimize resource utilization, and promote the coordinated development of the economy and the environment. However, some things could be improved in this study. For future research prospects, efforts should be directed toward improving the temporal and spatial resolution of satellite-derived wind data to enhance the accuracy of comparisons with reanalysis datasets. Implementing advanced parameterization schemes and incorporating more comprehensive atmospheric parameters into the simulations may provide a more holistic analysis. Moreover, investigating the impacts of various satellite instruments on the wind speed retrieval process could provide valuable insights for further refinement. When selecting the optimal parameterization scheme for the WRF simulation, we only used observational data from a single station for the selection process and verified the chosen scheme using data from three meteorological stations. Since the number of marine meteorological observation stations is limited, the representativeness of the results may be restricted. In order to establish a more accurate quantitative mapping relationship between satellite-retrieved surface wind speeds and high-altitude wind power density, future research could consider employing advanced techniques such as machine learning.
To summarize, this study has significant implications for understanding the wind field characteristics of the Yellow Sea, the suitability of HY-2C and CFOSAT satellite-retrieved wind speeds in the region, and the relationship between satellite-retrieved surface wind speeds and high-altitude wind power density. Future research can enhance the theoretical support for offshore wind farm site selection and provide more accurate references for sustainable energy development by further refining the methodology and expanding the data sources.

5. Conclusions

In this study, we simulated the spatial distribution of wind speeds and wind energy density by using a WRF model. Meanwhile, the modeled results were used to evaluate the sea surface wind speeds retrieved from the HY-2C and CFOSAT satellite-borne microwave scatterometers over the Yellow sea region. The main conclusions are as follows:
Among the combinations tested for simulating the 10 m wind speeds in the Yellow Sea region, the combination of the MRF boundary layer parameterization scheme, the MM5 surface layer parameterization scheme, and the GDAS initial field performed the best. In addition, this combination achieved good results in the 10 m wind speed simulations at the 54953, 58264, and 58265 WMO stations, which proved the high reliability and wide applicability of the WRF model over the Yellow Sea region.
Comparing the wind speed products obtained from HY-2C and CFOSAT satellites with the WRF model’s simulated 10 m wind speed, the MAPE for HY-2C was 9% and for CFOSAT it was 6%, with biases of less than 1.5 m/s. These satellite-derived wind speed products showed satisfactory accuracy and applicability in the study area.
Analysis of the vertical mean wind speed revealed an increase in the wind speed below 500 m, a decrease between 500 m and 1800 m, another increase from 1800 m to 11,000 m, and a decrease above 11,000 m. The horizontal wind direction showed consistent patterns at different heights, with a predominant northerly wind in the northern Yellow Sea and a predominant northeasterly wind in the southern part. Additionally, wind speeds in the southern Yellow Sea were higher than those in the northern part, and coastal regions in China had higher wind speeds than the Korean Peninsula. Wind power density distribution varied significantly with height, region, and land–sea differences. Wind power density increased with height, and wind power density over the ocean was generally greater than over land. The southern Yellow Sea exhibited higher wind power density than the northern part, and the wind power density of large lakes was comparable to coastal regions.
A comparison of wind speed inversion results from HY-2C and CFOSAT satellites with the WRF model revealed specific differences under different wind speed conditions. At low wind speeds, CFOSAT satellite inversion products were closer to the WRF simulation results, while under moderate wind speeds, HY-2C satellite inversion products were closer to the WRF simulation results. At high wind speeds, the deviations of the two satellite inversion products were small, but HY-2C tended to overestimate, while CFOSAT’s deviations were within the range −1 to 1 m/s. The two satellites showed a linear relationship in detecting the 10 m wind field over the Yellow Sea, but some discrepancies existed between the two products.
The comparison of wind power density at different heights from satellite inversion and the WRF model simulation showed that wind power density increased with increasing 10 m wind speed. However, when the wind speed exceeded 9 m/s, the wind power density no longer increased with wind speed.
These findings provide valuable insights into the spatial distribution of wind speed, wind power density, and the accuracy of satellite wind speed products in the Yellow Sea region. This study contributes to a better understanding of the wind energy potential in the area and establishes a reliable basis for further research in this field.

Author Contributions

Conceptualization, Z.L.; methodology, Z.L., Z.D. and B.W.; software, Z.L. and Y.H.; validation, Y.Y.; formal analysis, Z.D.; investigation, Z.L. and H.C.; resources, Z.L. and H.C.; data curation, Z.L. and H.C.; writing—original draft preparation, Z.L.; writing—review and editing, Z.D. and B.W.; visualization, Z.L.; supervision, Z.L.; project administration, Z.L., Z.D. and B.W.; funding acquisition, B.W. All authors have read and agreed to the published version of the manuscript.

Funding

This work was funded by the Jiangsu Funding Program for Excellent Postdoctoral Talent (Number: 2023ZB012).

Data Availability Statement

HY-2C and CFOSAT data are available at https://osdds.nsoas.org.cn/ (accessed on 20 June 2023), and GFS and GDAS data are available at https://www2.mmm.ucar.edu/wrf/users/download/free_data.html (accessed on 18 July 2023). ERA5 hourly data on single levels from the dataset are available at https://cds.climate.copernicus.eu/cdsapp#!/dataset/reanalysis-era5-single-levels?tab=overview (accessed on 18 July 2023).

Acknowledgments

The authors would like to thank Haochen Chen, Yucheng Wang and Li’ao Zhou for their help and discussions on the article illustrations.

Conflicts of Interest

The authors declare no conflict of interest.

References

  1. Liu, F.; Sun, F.; Liu, W.; Wang, T.; Wang, H.; Wang, X.; Lim, W.H. On wind speed pattern and energy potential in China. Appl. Energy 2019, 236, 867–876. [Google Scholar] [CrossRef]
  2. Shu, Z.R.; Jesson, M. Estimation of Weibull parameters for wind energy analysis across the UK. J. Renew. Sustain. Energy 2021, 13, 023303. [Google Scholar] [CrossRef]
  3. Morgan, E.C.; Lackner, M.; Vogel, R.M.; Baise, L.G. Probability distributions for offshore wind speeds. Energy Convers. Manag. 2011, 52, 15–26. [Google Scholar] [CrossRef]
  4. Bagci, K.; Arslan, T.; Celik, H.E. Inverted Kumarswamy distribution for modeling the wind speed data: Lake Van, Turkey. Renew. Sustain. Energy Rev. 2020, 135, 110110. [Google Scholar] [CrossRef]
  5. He, J.Y.; Chan, P.W.; Li, Q.S.; Lee, C.W. Characterizing coastal wind energy resources based on sodar and microwave radiometer observations. Renew. Sustain. Energy Rev. 2022, 163, 112498. [Google Scholar] [CrossRef]
  6. Li, Z.; Zhu, R. Research on wind energy resource assessment technology and methods. Acta Meteor. Sin. 2007, 5, 708–717. (In Chinese) [Google Scholar]
  7. Zhou, J. Wind Farm Regional Wind Energy Resource Assessment. In Proceedings of the 6th Symposium on Energy Conservation and Emission Reduction in Power Industry, Yixing, China, 28–30 June 2011; pp. 182–184. [Google Scholar]
  8. Archer, C.L.; Jacobson, M.Z. Evaluation of global wind power. J. Geophys. Res. Atmos. 2005, 110. [Google Scholar] [CrossRef]
  9. He, X.; Zhou, R.; Zhu, R. Research on classification methods for numerical simulation evaluation of wind energy resources. Acta Meteor. Sin. 2015, 73, 975–984. (In Chinese) [Google Scholar]
  10. Du, M.; Yi, K. Research on applicability of different physical parameterization scheme combinations in WRF model to offshore wind energy resource assessment in China. Mar. Forecast. 2023, 40, 65–78. [Google Scholar]
  11. Li, J. Research on the Application of Dynamic Downscaling and System Integration Technology to Fine Wind Field Forecast. Master’s Thesis, Nanjing University of Information Science & Technology, Nanjing, China, 2017. [Google Scholar]
  12. Tang, J.; Gao, H. A statistical downscaling method for wind energy change in China in the 21st century under the IPC-A2 scenario. Acta Energiae Solaris Sin. 2009, 30, 655–666. [Google Scholar]
  13. Storm, B.; Dudhia, J.; Basu, S.; Swift, A.; Giammanco, I. Evaluation of the Weather Research and Forecasting Model on Forecasting Low-level Jets: Implications for Wind Energy. Wind. Energy 2009, 12, 81–90. [Google Scholar] [CrossRef]
  14. Shin, H.H.; Hong, S.Y. Intercomparison of Planetary Boundary-Layer Parametrizations in the WRF Model for a Single Day from CASES-99. Bound. Layer Meteorol. 2011, 139, 261–281. [Google Scholar] [CrossRef]
  15. Deppe, A.J.; Gallus, W.A., Jr.; Takle, E.S. A WRF ensemble for improved wind speed forecasts at turbine height. Weather Forecast. 2013, 28, 212–228. [Google Scholar] [CrossRef]
  16. Draxl, C.; Hahmann, A.N.; Pena, A.; Giebel, G. Evaluating winds and vertical wind shear from Weather Research and Forecasting model forecasts using seven planetary boundary layer schemes. Wind Energy 2013, 17, 39–55. [Google Scholar] [CrossRef]
  17. Zuo, H.; Sun, Y. Comparative analysis of the effect of three downscaling schemes of WRF model in wind power forecast service. Power Syst. Clean Energy 2013, 29, 105–108. [Google Scholar]
  18. Chao, Z. Statistical downscaling of temperature data in western China. Arid. Zone Res. 2011, 28, 879–884. [Google Scholar] [CrossRef]
  19. Ma, J.; Liu, Z. Research on fine evaluation of wind resources based on WRF-Windsim microscale coupling technology. Ningxia Electr. Power 2023, 1, 1–5. [Google Scholar]
  20. Zhang, H.; Li, Y. Study on disturbance construction method of initial value for regional ensemble forecasting based on dynamic downscaling. Meteorol. Mon. 2017, 43, 1461–1472. [Google Scholar]
  21. Ramos, D.N.D.S.; Lyra, R.F.D.F.; Silva, R.S.d., Jr. Previsão do vento utilizando o modelo atmosférico WRF para o estado de Alagoas. Rev. Bras. Meteorol. 2013, 28, 163–172. [Google Scholar] [CrossRef]
  22. Tuchtenhagen, P.; Basso, J.; Yamasaki, Y. Wind power assessment over Brazil in 2011. Ciência Nat. 2014, 36, 390–401. [Google Scholar] [CrossRef]
  23. Krogsaeter, O.; Reuder, J. Validation of boundary layer parameterization schemes in the Weather Research and Forecasting (WRF) model under the aspect of offshore wind energy applications—Part II: Boundary layer height and atmospheric stability. Wind. Energy 2015, 18, 1291–1302. [Google Scholar] [CrossRef]
  24. García-Díez, M.; Fernández, J.; Fita, L.; Yagüe, C. Seasonal dependence of WRF model biases and sensitivity to PBL schemes over Europe. Q. J. R. Meteorol. Soc. 2013, 139, 501–514. [Google Scholar] [CrossRef]
  25. Zhao, Z.; Li, Z. Research on wind field simulation of complex terrain based on NWP/CFD nesting. Acta Energiae Solaris Sin. 2021, 42, 205–210. [Google Scholar] [CrossRef]
  26. Amjad, M.; Zafar, Q.; Khan, F.; Sheikh, M.M. Evaluation of weather research and forecasting model for the assessment of wind resource over Gharo, Pakistan. Int. J. Climatol. 2015, 35, 1821–1832. [Google Scholar] [CrossRef]
  27. Skamarock, W.C.; Klemp, J.B.; Dudhia, J.; Gill, D.O.; Barker, D.M.; Duda, M.G.; Huang, X.-Y.; Wang, W.; Powers, J.G. A Description of the Advanced Research WRF Version 3; NCAR Technical Note, NCAR/TN-468+STR; NCAR: Boulder, CO, USA, 2008. [Google Scholar]
  28. Liu, W. Wind Energy and Wind Power Technology; Chemical Industry Press: Beijing, China, 2006. [Google Scholar]
  29. Shikhovtsev, A.Y.; Kovadlo, P.G.; Lezhenin, A.A.; Korobov, O.A.; Kiselev, A.V.; Russkikh, I.V.; Kolobov, D.Y.; Shikhovtsev, M.Y. Influence of Atmospheric Flow Structure on Optical Turbulence Characteristics. Appl. Sci. 2023, 13, 1282. [Google Scholar] [CrossRef]
  30. Ma, H.; Cao, X.; Ma, X.; Su, H.; Jing, Y.; Zhu, K. Improving the Wind Power Density Forecast in the Middle- and High-Latitude Regions of China by Selecting the Relatively Optimal Planetary Boundary Layer Schemes. Atmosphere 2022, 13, 2034. [Google Scholar] [CrossRef]
  31. Salvao, N.; Guedes Soares, C. Wind resource assessment offshore the Atlantic Iberian coast with the WRF model. Energy 2018, 145, 276–287. [Google Scholar] [CrossRef]
  32. Giannakopoulou, E.M.; Nhili, R. WRF Model Methodology for Offshore Wind Energy Applications. Adv. Meteorol. 2014, 2014, 68–79. [Google Scholar] [CrossRef]
  33. China National Energy Administration. Available online: http://www.nea.gov.cn/ (accessed on 13 July 2023).
  34. Summary of Replies to Proposal No. 01612 (No. 103 in the Category of Economic Development) of the Fifth Session of the 13th National Committee of the Chinese People’s Political Consultative Conference. Available online: http://zfxxgk.nea.gov.cn/2022-08/23/c_1310665817.htm (accessed on 13 July 2023).
  35. Juan, Y.H.; Wen, C.Y.; Chen, W.Y.; Yang, A.S. Numerical assessments of wind power potential and installation arrangements in realistic highly urbanized areas. Renew. Sustain. Energy Rev. 2021, 135, 110165. [Google Scholar] [CrossRef]
  36. Christiansen, M.B.; Koch, W.; Horstmann, J.; Hasager, C.B.; Nielsen, M. Wind resource assessment from C-band SAR. Remote Sens. Environ. 2006, 105, 68–81. [Google Scholar] [CrossRef]
  37. Hasager, C.B.; Mouche, A.; Badger, M.; Bing?L, F.; Karagali, I.; Driesenaar, T.; Stoffelen, A.; Pe?A, A.; Longépé, N. Offshore wind climatology based on synergetic use of Envisat ASAR, ASCAT and QuikSCAT. Remote Sens. Environ. 2015, 156, 247–263. [Google Scholar] [CrossRef]
  38. Mou, X.; Lin, W.; He, Y. Towards a Consistent Wind Data Record for the CFOSAT Scatterometer. Remote Sens. 2023, 15, 2081. [Google Scholar] [CrossRef]
  39. Liu, S.; Lin, W.; Portabella, M.; Wang, Z. Characterization of Tropical Cyclone Intensity Using the HY-2B Scatterometer Wind Data. Remote Sens. 2022, 14, 1035. [Google Scholar] [CrossRef]
  40. Wang, Z.; Zou, J.; Zhang, Y.; Stoffelen, A.; Lin, W.; He, Y.; Feng, Q.; Zhang, Y.; Mu, B.; Lin, M. Intercalibration of Backscatter Measurements among Ku-Band Scatterometers Onboard the Chinese HY-2 Satellite Constellation. Remote Sens. 2021, 13, 4783. [Google Scholar] [CrossRef]
  41. Research Data Archive. NCAR RDA Dataset Ds083.2. Available online: http://rda.ucar.edu/datasets/ds083.2/ (accessed on 19 June 2023).
  42. Research Data Archive. NCAR RDA Dataset Ds083.3. Available online: http://rda.ucar.edu/datasets/ds083.3/ (accessed on 19 June 2023).
  43. Copernicus Climate Data Store. Available online: https://cds.climate.copernicus.eu/cdsapp#!/dataset/reanalysis-era5-single-levels?tab=overview (accessed on 6 August 2023).
  44. OSDDS.NSOAS.ORG.CN. Available online: http://osdds.nsoas.org.cn/ (accessed on 20 June 2023).
  45. Haversine Formula Introduction. Available online: http://blog.csdn.net/gaocuisheng/article/details/126060795 (accessed on 17 June 2023).
Figure 1. Simulation area of sensitivity experiment A: the red pentagram shows the location of the wind farm.
Remotesensing 15 04172 g001
Figure 2. WRF nested-area map. (a) shows the first level of nesting, and (b) shows the second level of nesting, i.e., d02 in (a).
Remotesensing 15 04172 g002
Figure 3. Mean vertical wind profile over the Yellow Sea in October 2021.
Remotesensing 15 04172 g003
Figure 4. Time-series distribution of wind speeds at each height over the Yellow Sea.
Remotesensing 15 04172 g004
Figure 5. Wind fields at various heights over the Yellow Sea. The solid black line in the figure indicates the location of the coastline in the Yellow Sea region. The shoreline on the left side of the figure represents the inland area of mainland China, while the shoreline on the right side represents the inland area of the Korean Peninsula. This arrangement applies to the subsequent images as well.
Remotesensing 15 04172 g005
Figure 6. Wind power density distribution by height over the Yellow Sea.
Remotesensing 15 04172 g006
Figure 7. HY-2C, CFOSAT inversion, and WRF simulation of 10 m wind speeds in the mean Yellow Sea surface in October 2021.
Remotesensing 15 04172 g007
Figure 8. Comparison of HY-2C and CFOSAT inversion data with WRF simulation data. The values in the figure represent the difference between the satellite-retrieved wind speeds and WRF simulation data. (a1) represents the difference between HY-2C’s retrieved sea surface wind speed and WRF simulation data during low wind speeds, (a2) represents the difference during moderate wind speeds, and (a3) represents the difference during high wind speeds. Similarly, (b1b3) represent the differences for CFOSAT’s retrieved sea surface wind speed compared to WRF simulation data during low, moderate, and high wind speed conditions, respectively.
Remotesensing 15 04172 g008
Figure 9. Comparison between HY-2C and CFOSAT inversions of the 10 m wind field over the Yellow Sea.
Remotesensing 15 04172 g009
Figure 10. Comparison of wind energy density between HY-2C, CFOSAT satellite inversion 10 m wind field, and WRF simulation at each height.
Remotesensing 15 04172 g010
Figure 11. Research flow chart.
Remotesensing 15 04172 g011
Figure 12. Comparison of HY-2C and CFOSAT inversion data with RA5 reanalysis sea surface wind speeds. The values in the figure represent the difference between the satellite-retrieved wind speeds and ERA5 reanalysis wind speeds. (a1) Represents the difference between CFOSAT’s retrieved sea surface wind speed and ERA5 reanalysis wind speed during low wind speeds, (a2) represents the difference during moderate wind speeds, and (a3) represents the difference during high wind speeds. Similarly, (b1b3) represent the differences for HY-2C’s retrieved sea surface wind speed compared to ERA5 reanalysis wind speed during low, moderate, and high wind speed conditions, respectively.
Remotesensing 15 04172 g012
Table 1. The time interval between the passage of the two satellites, HY-2C and CFOSAT, over the Yellow Sea was less than 3 h of transit time.
DataHY-2CCFOSAT
10 Oct10_10_10:28:4410_10_10:19:50
16 Oct10_16_08:45:1510_16_09:56:42
18 Oct10_18_23:13:0310_18_23:07:33
24 Oct10_24_21:29:3810_24_22:14:48
25 Oct10_25_21:47:0410_25_22:00:09
Table 2. Results of boundary layer and near-surface sensitivity experiments.
NumberBoundary Layer SchemeNear-Surface SchemeCorrelation CoefficientRMSE (m/s)Bias (m/s)MAPE
exp1YSUMM50.921.951.570.21
exp2MRFMM50.921.611.210.18
exp3MYJMO0.892.131.730.23
exp4BLMM50.703.152.520.38
exp5MYNN3MYNN0.703.552.860.45
exp6MYNN2.5MYNN0.113.382.610.40
exp7QNSEQNSE0.595.685.000.72
Table 3. Initial field sensitivity experimental results.
NumberInitial FieldCorrelation CoefficientRMSE (m/s)Bias (m/s)MAPE (m/s)
exp1GDAS0.931.571.240.17
exp2GFS0.921.611.210.18
Table 4. WMO station validation results.
RMSE (m/s)Bias (m/s)MAPEWDAR (%)
549532.732.130.1578.57
582641.631.350.1889.28
582652.691.960.1896.43
Table 5. Comparison of HY-2C, CFOSAT, and WRF.
RMSEBiasMAPE
HY-2C1.190.950.06
CFOSAT1.250.970.06
Disclaimer/Publisher’s Note: The statements, opinions and data contained in all publications are solely those of the individual author(s) and contributor(s) and not of MDPI and/or the editor(s). MDPI and/or the editor(s) disclaim responsibility for any injury to people or property resulting from any ideas, methods, instructions or products referred to in the content.