Article

Analysis of Spatial and Temporal Changes in Vegetation Cover and Driving Forces in the Yan River Basin, Loess Plateau

1
College of Geography and Environmental Science, Henan University, Kaifeng 475004, China
2
Key Laboratory of Geospatial Technology for the Middle and Lower Yellow River Regions, Ministry of Education, Henan University, Kaifeng 475004, China
3
Henan Industrial Technology Academy of Spatio-Temporal Big Data, Henan University, Kaifeng 475004, China
4
Henan Technology Innovation Center of Spatial-Temporal Big Data, Henan University, Kaifeng 475004, China
*
Author to whom correspondence should be addressed.
Remote Sens. 2023, 15(17), 4240; https://doi.org/10.3390/rs15174240
Submission received: 26 July 2023 / Revised: 23 August 2023 / Accepted: 25 August 2023 / Published: 29 August 2023

Abstract

:
The Yan River Basin of the Loess Plateau is a key region for ensuring the environmental protection and sustainable development of the Yellow River Basin. Therefore, it is essential to identify how vegetation cover has changed and determine the factors that have driven these changes. In this study, we applied a three-dimensional vegetation cover model to examine the spatiotemporal variation characteristics of vegetation cover at the watershed scale in the Yan River Basin from 2001 to 2020 and forecast future trends. Subsequently, the driving forces of fractional vegetation cover (FVC) change were quantified based on meteorological, surface, and anthropogenic factors to explore the common driving relationships among these factors. (1) The accuracy of 3DFVC is better than that of FVC in the Yanhe River Basin, where the terrain is complex. (2) The temporal change trends indicated that the vegetation cover in the Yan River Basin significantly recovered and the basin FVC increased rapidly from 2001 to 2013 (S = 0.0152/a, p < 0.01) and increased gradually from 2013 to 2020 (S = 0.0015/a). The main reason for the increase in vegetation cover was the enhanced growth of medium FVC. (3) The vegetation spatial distribution showed that the FVC values varied substantially from north to south, indicating spatial heterogeneity, and 83.9% of the area presented a trend of increasing vegetation. Furthermore, vegetation cover was predicted to improve in the future. (4) The spatial heterogeneity of FVC was mainly influenced by relative humidity and rainfall, and the spatial variations in FVC were mainly determined by climate factors. Land use and cover change variations, which are influenced by human activities, represent major factors underlying the observed spatial heterogeneity. Most interactions between driving factors showed two-way enhancement or non-linear enhancement, with relative humidity and land use patterns presenting the strongest explanatory power. This study provides a scientific basis for vegetation conservation in the Yan River Basin and contributes theoretical support for decision-making regarding ecological environmental protection in the Loess Plateau and sustainable development in the Yellow River Basin.

Graphical Abstract

1. Introduction

Ecosystems represent the foundation of civilization and promote socioeconomic development. However, over the past 50 years, climate change and socioeconomic development have considerably threatened natural ecosystems worldwide [1]. Fractional vegetation cover (FVC) is a measure of plant community structure that expresses the proportion of an observation area occupied by the vertical projection of vegetation, and it indicates the degree of ground cover by plants in a given area [2]. Vegetation is a crucial component of ecosystems that mediates the interactions among the atmospheric [3,4], hydrological [5,6], and pedological processes [7,8]; moreover, it regulates the health of ecosystems and represents an indicator of the health and characteristics of the natural environment. Vegetation reflects the direct impact of socioeconomic activities on environmental change; thus, determining the interaction mechanism between vegetation and its drivers offers a scientific foundation for directing regional ecological development [9].
For the acquisition of vegetation cover, surface measurements and remote sensing measurements are usually used. Due to the spatial heterogeneity of vegetation cover, the surface measurement method has obvious scale limitations and it is difficult to carry out measurements on a large scale, while the remote sensing method can efficiently obtain continuous data with high accuracy on a large scale [10]. Remote sensing methods include the estimation method based on the vegetation index and the estimation method based on data mining technology. Among them, the estimation method based on the vegetation index is simpler and more efficient than the other methods, and it is more generalized because it is not restricted by any conditions [11,12]. The image dichotomous model posits that sensor-obtained information includes both vegetation and soil data, with the effects of atmospheric and soil background as well as vegetation type attenuated by the linear stretching of modifiers [13,14]. Although vegetation occupies a three-dimensional surface in reality, the image meta-dichotomous model considers it a two-dimensional plane within an image, which results in an inaccurate representation of true vegetation cover. To estimate vegetation cover more accurately, this study adopted a three-dimensional vegetation cover model (3DFVC) that accounts for the effects of topography and terrain complexity. Three-dimensional FVC has more physical meaning than FVC and can be applied to various landscapes [15].
The Loess Plateau, a region of high ecological vulnerability and soil erosion in central North China, responds strongly to climatic variations [16]. China has implemented various conservation practices on the Loess Plateau over the past five decades to reduce soil erosion and improve ecological conditions [17]. Among the most prominent ecological restoration initiatives is the “Returning Cultivated Land to Forests and Grasses Project”, which was initiated in 1999. This policy has resulted in a significant enhancement of vegetation cover and quality on the Loess Plateau. Zhang et al. showed that the proportion of the Loess Plateau region presenting an increasing trend in vegetation cover from 1981 to 2016 was 90% and revealed a high overall rate of increase and a significant ecological restoration effect, with Yulin and Yan’an in northern Shaanxi exhibiting rapid increases in vegetation coverage [18]. Zhang et al. showed that from 2001 to 2018, anthropogenic activity had a positive effect on Loess Plateau vegetation cover and corresponded to a trend of 0.36 × 10⁻² a−1 [19]. Ye et al. showed that the vegetation cover of the Loess Plateau in northern Shaanxi increased from 31.7% to 47.1% on average, with some fluctuations, between 2000 and 2020; moreover, they observed significant improvements in vegetation cover and significant spatial dependence between vegetation cover and ecosystem services [20]. Previous studies on vegetation cover changes on the Loess Plateau presented limitations in their design. For instance, some studies only examined the correlation between vegetation and climate change while neglecting the effects of multiple factors on vegetation growth [21,22]. This may lead to biased conclusions because climate is not the only factor influencing vegetation growth. Furthermore, most studies have concentrated on large-scale spatial and temporal changes in vegetation and have not considered the finer-scale variations [23,24]; thus, changes in vegetation at the watershed scale have not been sufficiently studied to provide detailed recommendations on soil and water conservation measures and other aspects.
A basin is a unique geographic unit in nature with a clear physical boundary and a high degree of comprehensiveness. The world is composed of different basins of different sizes [25], and regional ecological and environmental problems are all related to the destruction of basin resources and irrational management, so solving environmental problems and realizing sustainable socio-economic development from the perspective of a basin is a more effective and comprehensive systematic method. Currently, China’s basin-scale ecological and environmental monitoring network is not sound, and the results are scattered, so it is urgent to carry out systematic and comprehensive research [26]. In view of the above existing research deficiencies, this study used the modified 3D vegetation cover model, 3DFVC, to calculate the interannual FVC of the Yan River Basin from 2001 to 2020 and carefully explore the spatial and temporal processes of vegetation cover. The Hurst index was then used to predict the future trend of vegetation development. Our analysis, which was facilitated by a geographic probe, centers on the driving relationships between FVC and an array of factors that include meteorological, surface, and anthropogenic elements. The evaluation considers both climatic and anthropogenic factors that affect plant growth. Our findings may provide a conceptual basis for achieving environmental protection and sustainable economic growth in the Yellow River basin. They also have important implications for enhancing and maintaining regional ecological stability and promoting sustainable socio-economic development.

2. Study Area and Data Sources

2.1. Study Area

The Yan River Basin, located on the Loess Plateau in northern Shaanxi between 108°45′–110°32′E and 36°23′–37°25′N, has a total area of 7687 km2 (Figure 1). The watershed has a warm temperate continental semi-arid monsoon climate, with spring and winter being cold and dry and summer being hot and rainy. Over 75% of the total annual rainfall occurs in summer, while low temperatures and mild rainfall occur in autumn. The average annual rainfall is approximately 500 mm, and it exhibits minor spatial variations and decreases gradually from southeast to northwest. The average annual temperature is approximately 9 °C, and the average daily temperature difference is 13 °C. The soil type is mainly cultivated loessial soils. Vegetation in the region is influenced by topography and climate and varies significantly from north to south, thus showing a vertical geographical variation pattern.

2.2. Data Sources

Data from 2000 to 2020 were used in this study and include satellite images, meteorological data, surface data, and human activity data (Table 1).

3. Methodology

In this study, interannual NDVI data were inferred based on the maximum value compositing (MVC) method, which compensates for the shortcomings of the NDVI, for which vegetation becomes easily saturated in high-cover areas and is difficult to distinguish in low-cover areas [30], and the modified three-dimensional vegetation cover model 3DFVC was used to calculate the FVC. We compare the applicability of FVC and 3DFVC in the Yan River Basin. The spatiotemporal dynamics of FVC were analyzed using the Theil–Sen median method for trend estimation, the Mann–Kendall test for trend significance, and the coefficient of variation for FVC fluctuation. The Hurst index was used to predict the future trend of FVC development. Additionally, we probed the non-linear spatial response of climatic (average annual temperature, average annual precipitation, relative humidity, and sunshine hours), surface (soil type, elevation, and slope), and human activity factors (land use and cover change (LUCC), population density, and gross domestic product (GDP)) to FVC in the Yan River Basin using a geographic probe. This allowed us to identify the dominant factors underlying spatial variations in FVC, quantify their influence, and examine multifactor interactions. The specific methods are described below.

3.1. Three-Dimensional Vegetation Cover Model

This study applied calculus to calibrate the image element dichotomous model. FVC is calculated using a dichotomous model based on the NDVI [11,15,31]. The formula is shown in Equations (1) and (2):
F V C = N D V I N D V I s o i l N D V I v e g N D V I s o i l
3 D F V C = F V C × c o s ( π × s l o p e / 180 )
where FVC is the vegetation cover, NDVI is the normalized difference vegetation index, N D V I v e g is the vegetation index value of pure vegetation soil image elements, N D V I s o i l is the vegetation index value of pure bare soil image elements, and 3DFVC is the three-dimensional vegetation cover model.
The 3DFVC values were categorized into 5 classes based on the equally spaced classification method [32,33] (Table 2). For the sake of science and simplicity in the Section 4, FVC was used uniformly instead of 3DFVC in the Section 4.

3.2. Accuracy Assessment Method of Vegetation Cover

In this study, the sub-pixel comparison method was used to compare the obtained vegetation cover with the actual vegetation cover (MODIS13Q1-NDVI) so that the accuracies of 3DFVC and FVC could be evaluated. The closer the regression coefficient between the vegetation cover to be verified and the actual vegetation cover is to 1, the higher the accuracy of the vegetation cover model [15]. In addition, the root mean square error (RMSE) was used to test the accuracy of the vegetation cover model [34]. The equations are as follows:
R M S E = i = 1 n ( X i Y i ) 2 / n
where X i is the observed vegetation cover; Y i is the actual vegetation cover; and n denotes the number of samples. The smaller the value of R M S E , the higher the model accuracy.

3.3. Theil–Sen Median and Mann–Kendall Methods

The Theil–Sen median is a non-parametric statistical method of trend calculation. The Mann–Kendall trend test method is a non-parametric statistical technique [35]. The calculation formula is as follows:
β = m e d i a n ( F V C p F V C i p i ) ,   i < p
where F V C p and F V C i are FVC time series data. When β > 0, the FVC time series has an increasing trend; when β < 0, the time series has a decreasing trend.
S = i = 1 n 1 p = i + 1 n s i g n ( F V C p F V C i )
v a r ( S ) = n ( n 1 ) ( 2 n + 5 ) i = 1 n t i ( t i 1 ) ( 2 t i + 5 ) 18
Z = {   S 1 v a r ( S )   S > 0 0   S = 0 S + 1 v a r ( S )   S < 0   ( 6 )  
where S is the statistical quantity, F V C p and F V C i are the NDVI values of the studied time series under the corresponding year, n is the number of study years, v a r ( S ) is the variance of statistic S, and Z is the test statistic.
In this paper, the significance level α is 0.05.

3.4. Coefficient of Variation

The coefficient of variation ( C v ) can reflect the degree of dispersion in a set of data [36]. The calculation equation is as follows:
C v = 1 n i = 1 n ( C i C ¯ ) 2 C ¯
where C i is the FVC value in year I, C ¯ is the multi-year average of FVC in the monitoring period, and n is the number of study years.
They are categorized into five categories based on the actual situation [37], as shown in Table 3.

3.5. Hurst Index

The Hurst index is widely used to determine the strength of the persistence or inverse persistence of time series trends [38].
F V C ¯ ( τ ) = 1 τ t = 1 τ F V C ( τ )   τ = 1 , 2 , 3 , , n  
where F V C ( τ ) is the FVC time series.
The cumulative deviation series X ( t , τ ) is defined as follows:
X ( t , τ ) = j = 1 t ( F V C ( t ) F V C ¯ ( τ ) )   1 t τ   1
The extreme difference is defined as follows:
R ( τ ) = max 1 t τ X ( t , τ ) min 1 t τ X ( t , τ )
The standard deviations are defined as follows:
  S ( τ ) = 1 τ t = 1 τ ( F V C ( t ) F V C ¯ ( τ ) ) 2
The Hurst index is as follows:
  R ( τ ) S ( τ ) = ( c τ ) H  
where H is the Hurst index.
The meaning of the Hurst index is shown in Table 4.

3.6. Geodetector

The Geodetector method can directly and reliably measure the interactions and effects of driving forces and is not constrained by the assumptions of traditional statistical methods (Table 5). Moreover, it does not require any assumptions of linearity and is not affected by linearity [39,40]. The influencing factors selected in this paper include three categories—climate, land surface, and human activities (Table 6)—in order to explore the response relationship between vegetation cover changes and factors in the Yanhe River Basin.

4. Results and Analysis

4.1. Quantitative Comparative Analysis of 3DFVC and FVC

In this study, the annual average vegetation cover of FVC and 3DFVC in the Yanhe River Basin from 2001 to 2020 was calculated separately, and the difference between FVC and 3DFVC was obtained by spatially stacking and subtracting (Figure 2). In general, the more complex the terrain, the stronger the differences. The Yanhe River Basin watershed is characterized by complex topography, numerous rivers, and undulating beams and mounts. By comparison, we found that the spatial distribution of high variability showed high similarity with that of a high slope, indicating that the difference between FVC and 3DFVC was not significant in certain areas with relatively simple topography. However, with the complexity of the terrain, the difference between FVC and 3DFVC becomes more obvious.
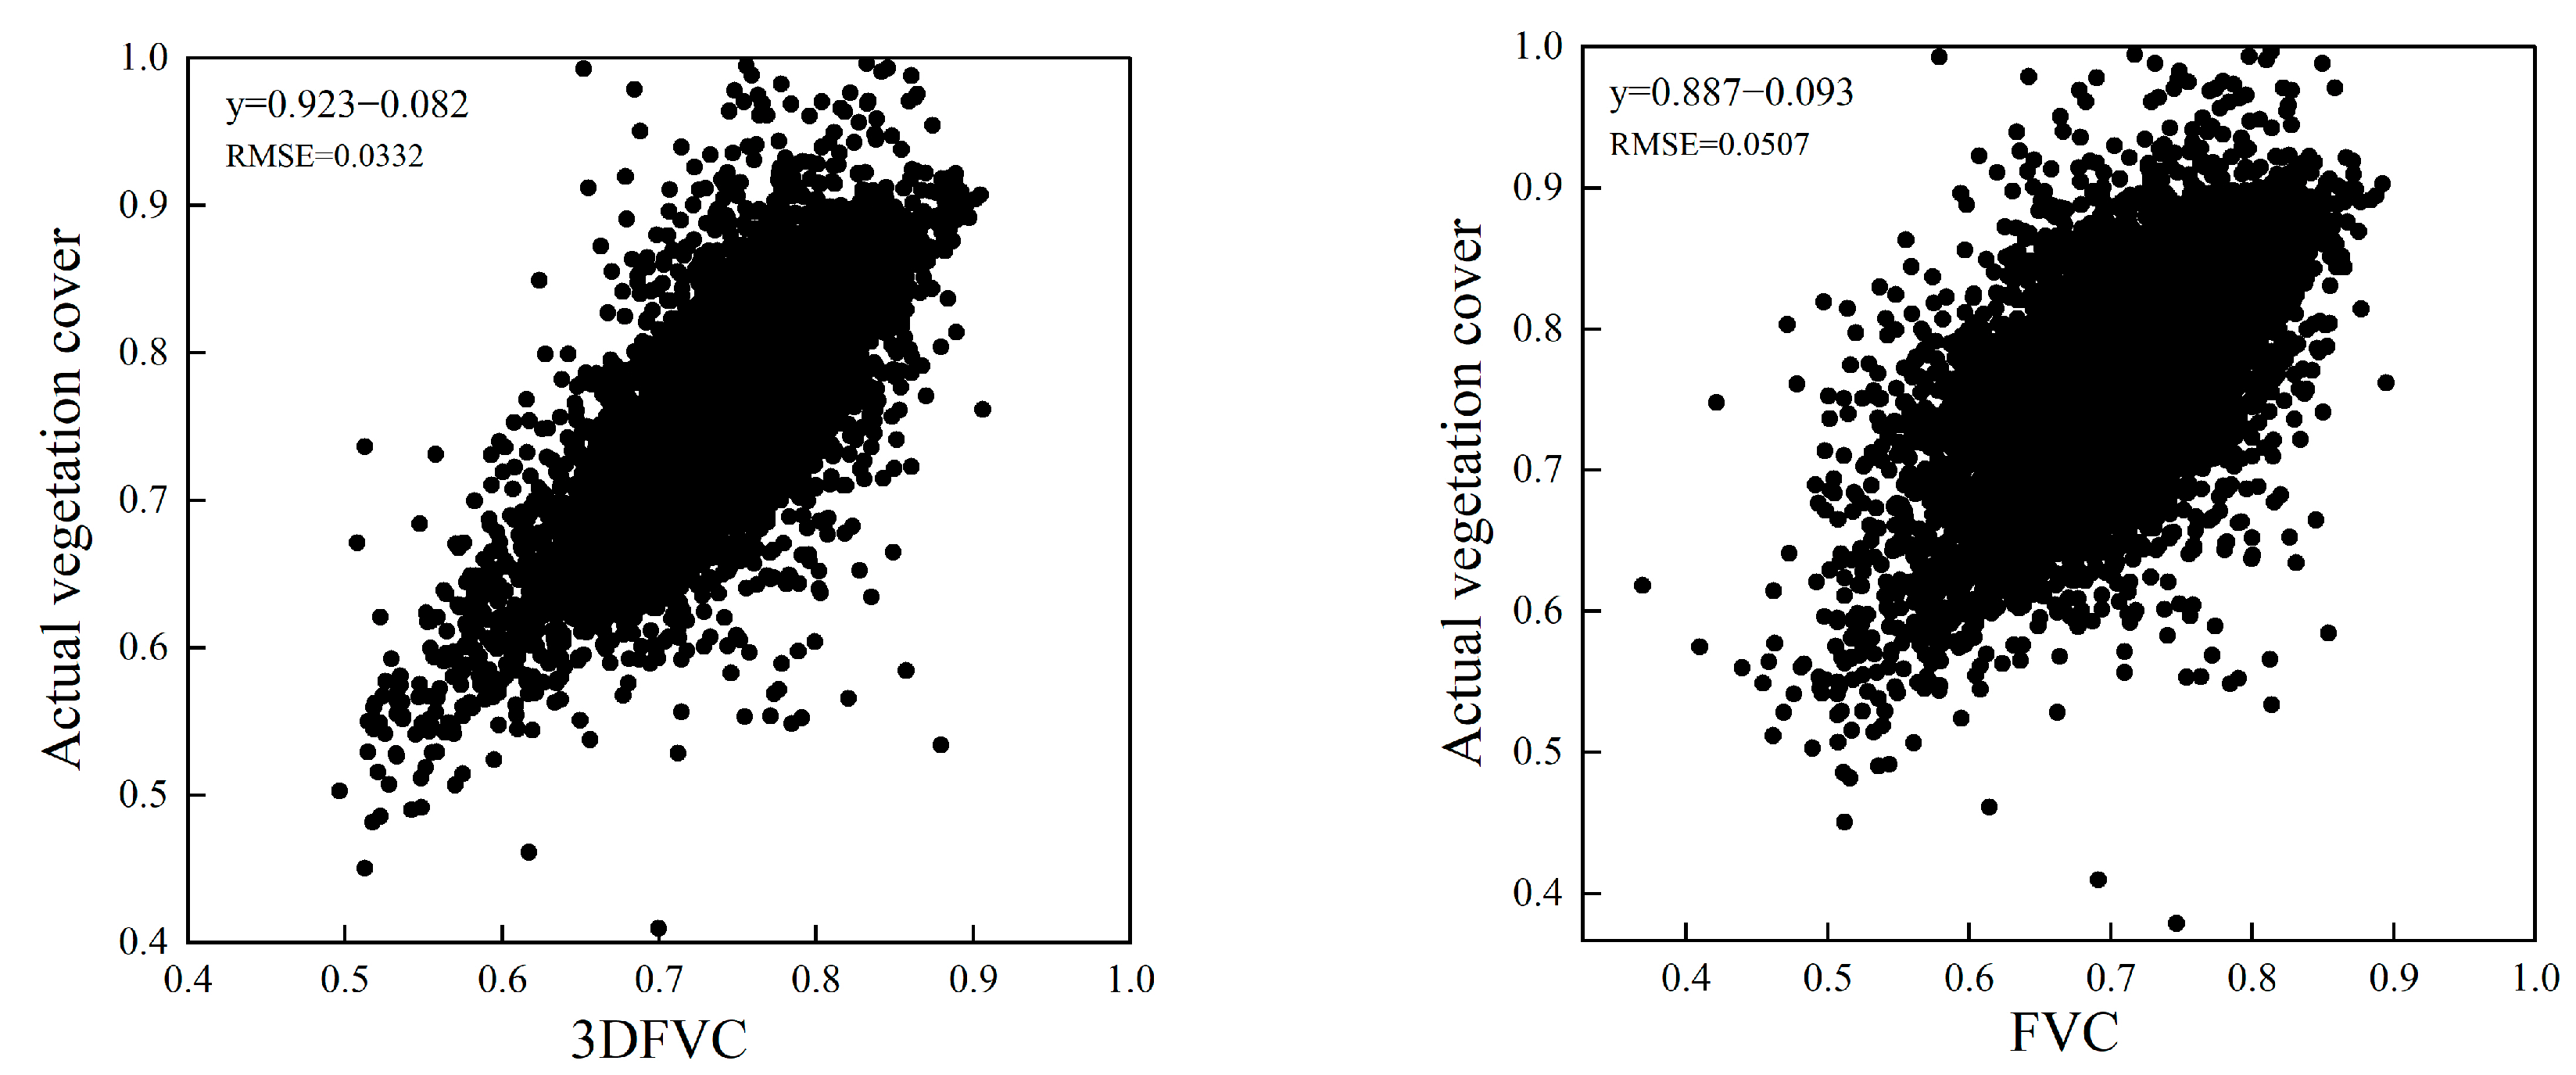
To further verify the extraction accuracy of the model, we used the subpixel comparison method to verify the extraction accuracy of FVC and 3DFVC (Figure 3). The results show that the regression coefficient of 3DFVC is 0.036 higher than that of FVC, which is closer to 1. In addition, the root mean square error (RMSE) of 3DFVC is reduced by 0.0175, which is lower than that of FVC. Obviously, 3DFVC reduces the effect of complex topography on vegetation extraction compared to FVC, which makes it have higher extraction accuracy and stronger applicability.

4.2. Characteristics of Temporal Changes in Vegetation Cover in the Yanhe River Basin and Its Counties, 2001–2020

4.2.1. Temporal Trends in Vegetation Cover in the Yanhe River Basin

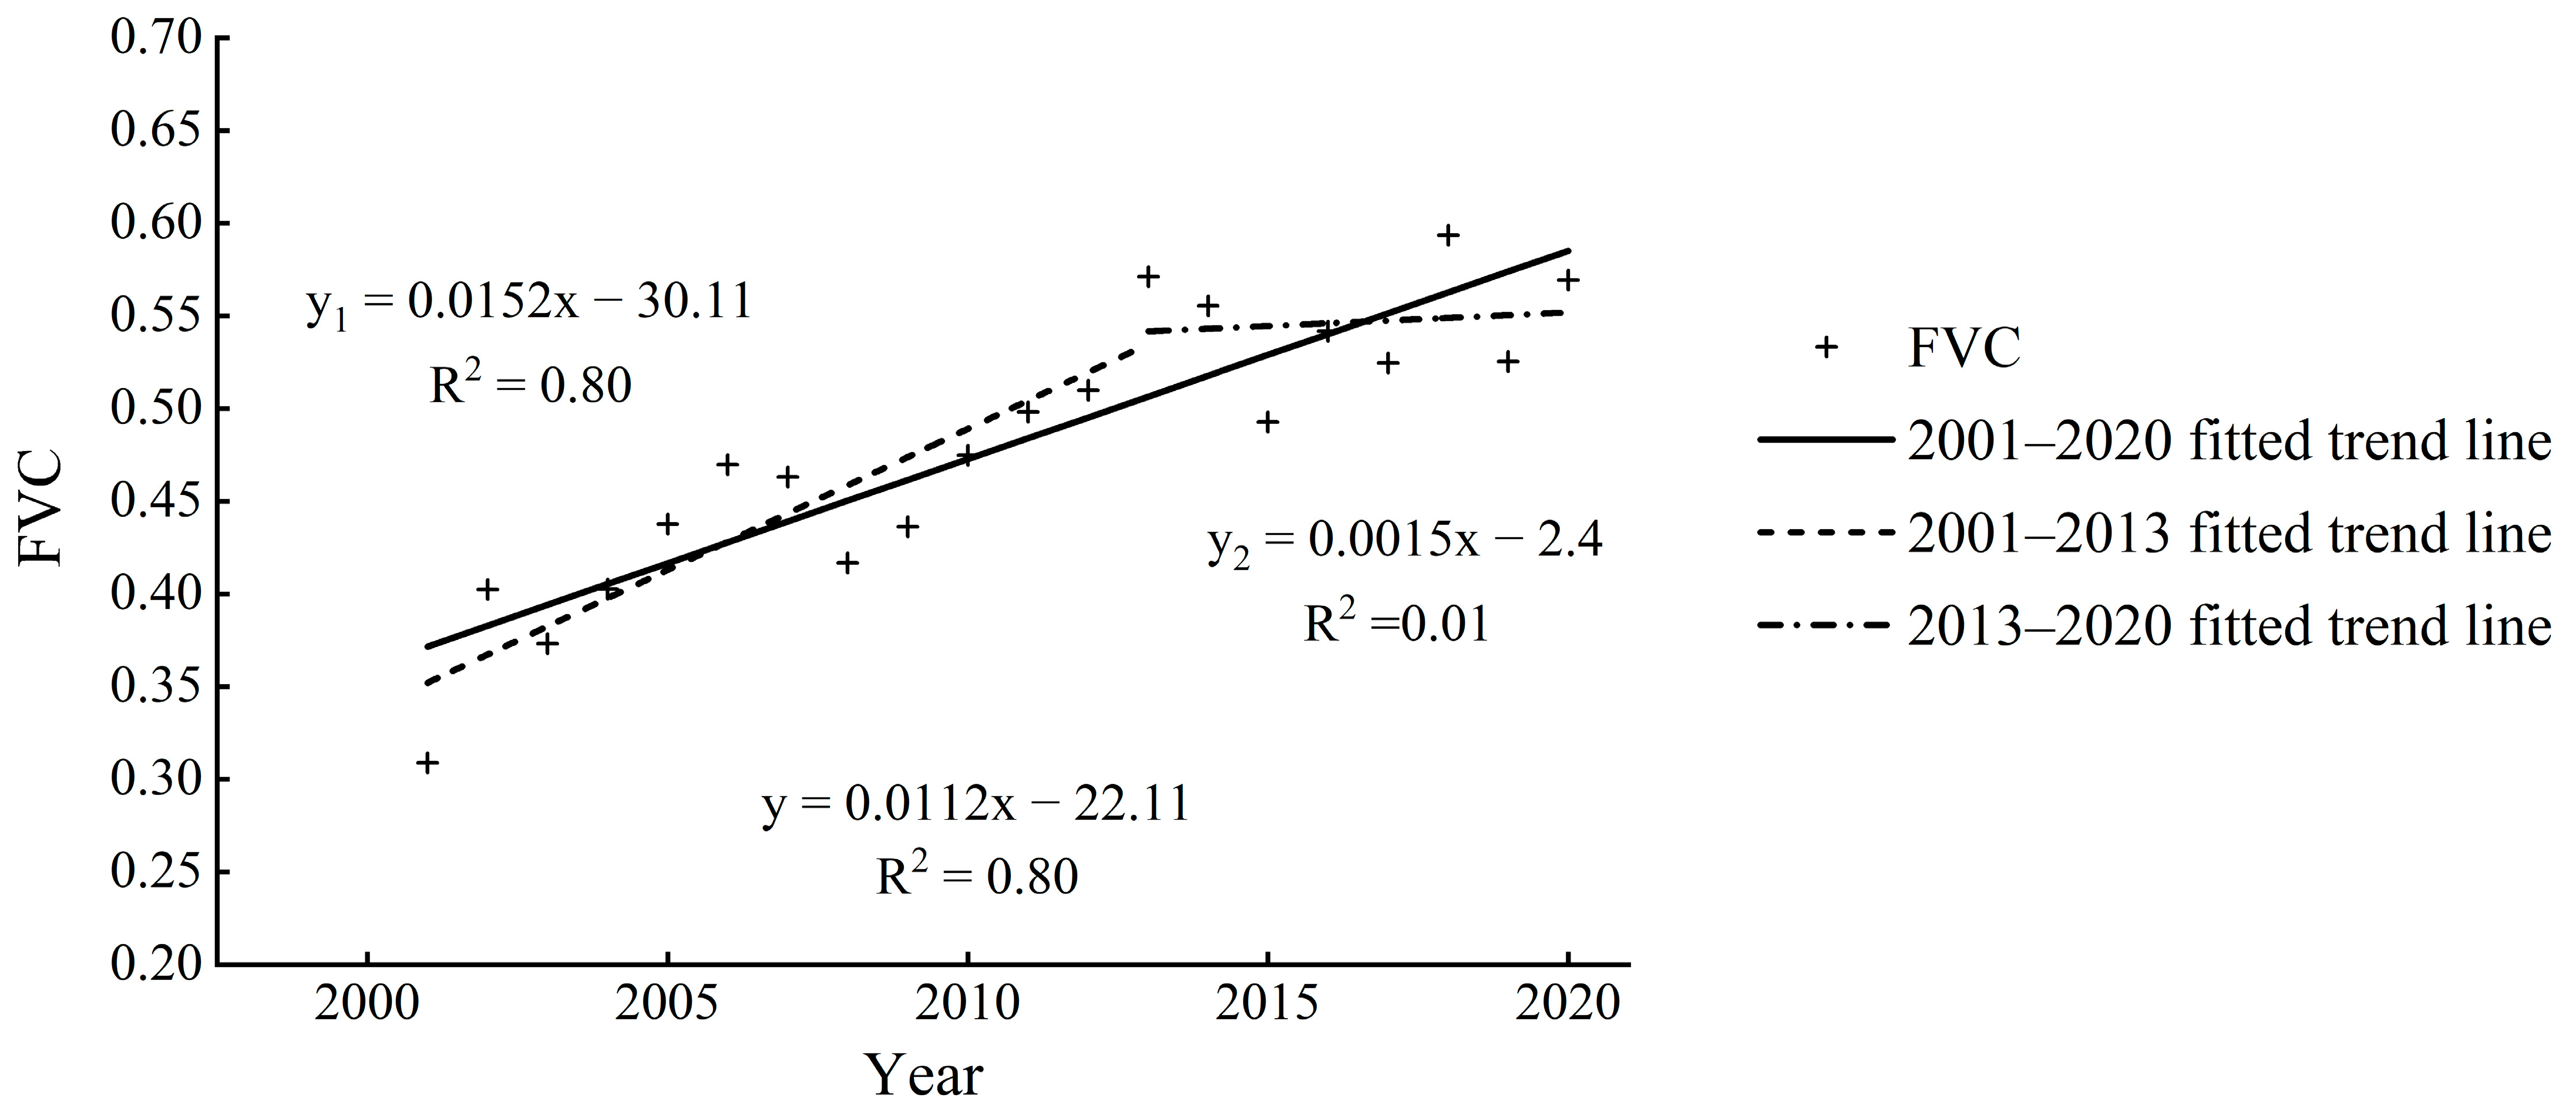
We used linear regression and t-test methodologies to analyze FVC trends in the Yan River Basin from 2001 to 2020 (Figure 4). The analysis showed a highly significant increase in overall FVC over the 20-year period, with an average annual growth rate of 0.0112/a (p < 0.01) and an average FVC of 0.48. During this time frame, the annual average FVC increased from 0.30 to 0.57, the minimum value occurred in 2001 (0.30), and the maximum value occurred in 2018 (0.59).
Based on the partial linear regression (PLR) of the lowest error variance (p < 0.01), FVC can be divided into two phases, with 2013 as the time node. From 2001 to 2013, the average annual FVC exhibited a highly significant and rapid growth trend, as evidenced by an average annual growth rate S of 0.0152/a (p < 0.01), an average FVC of 0.44, and an increase in FVC of 84.9% relative to its value in 2001. From 2013 to 2020, the FVC in the basin showed a highly significant slow growth trend, with an average annual growth rate of 0.0015/a. Moreover, the average value of FVC gradually stabilized above and below 0.55, with a large interannual FVC value change and a significant fluctuating change trend from year to year.
Overall, the FVC in the Yan River Basin experienced two distinct periods in its time series. After reaching its peak growth rate in 2013, the FVC underwent a “rapid growth period” from 2000 to 2013, followed by a “fluctuating change period” from 2013 to 2020, with 2013 serving as the inflection point.

4.2.2. Temporal Trends in Vegetation Classes in the Yanhe River Basin

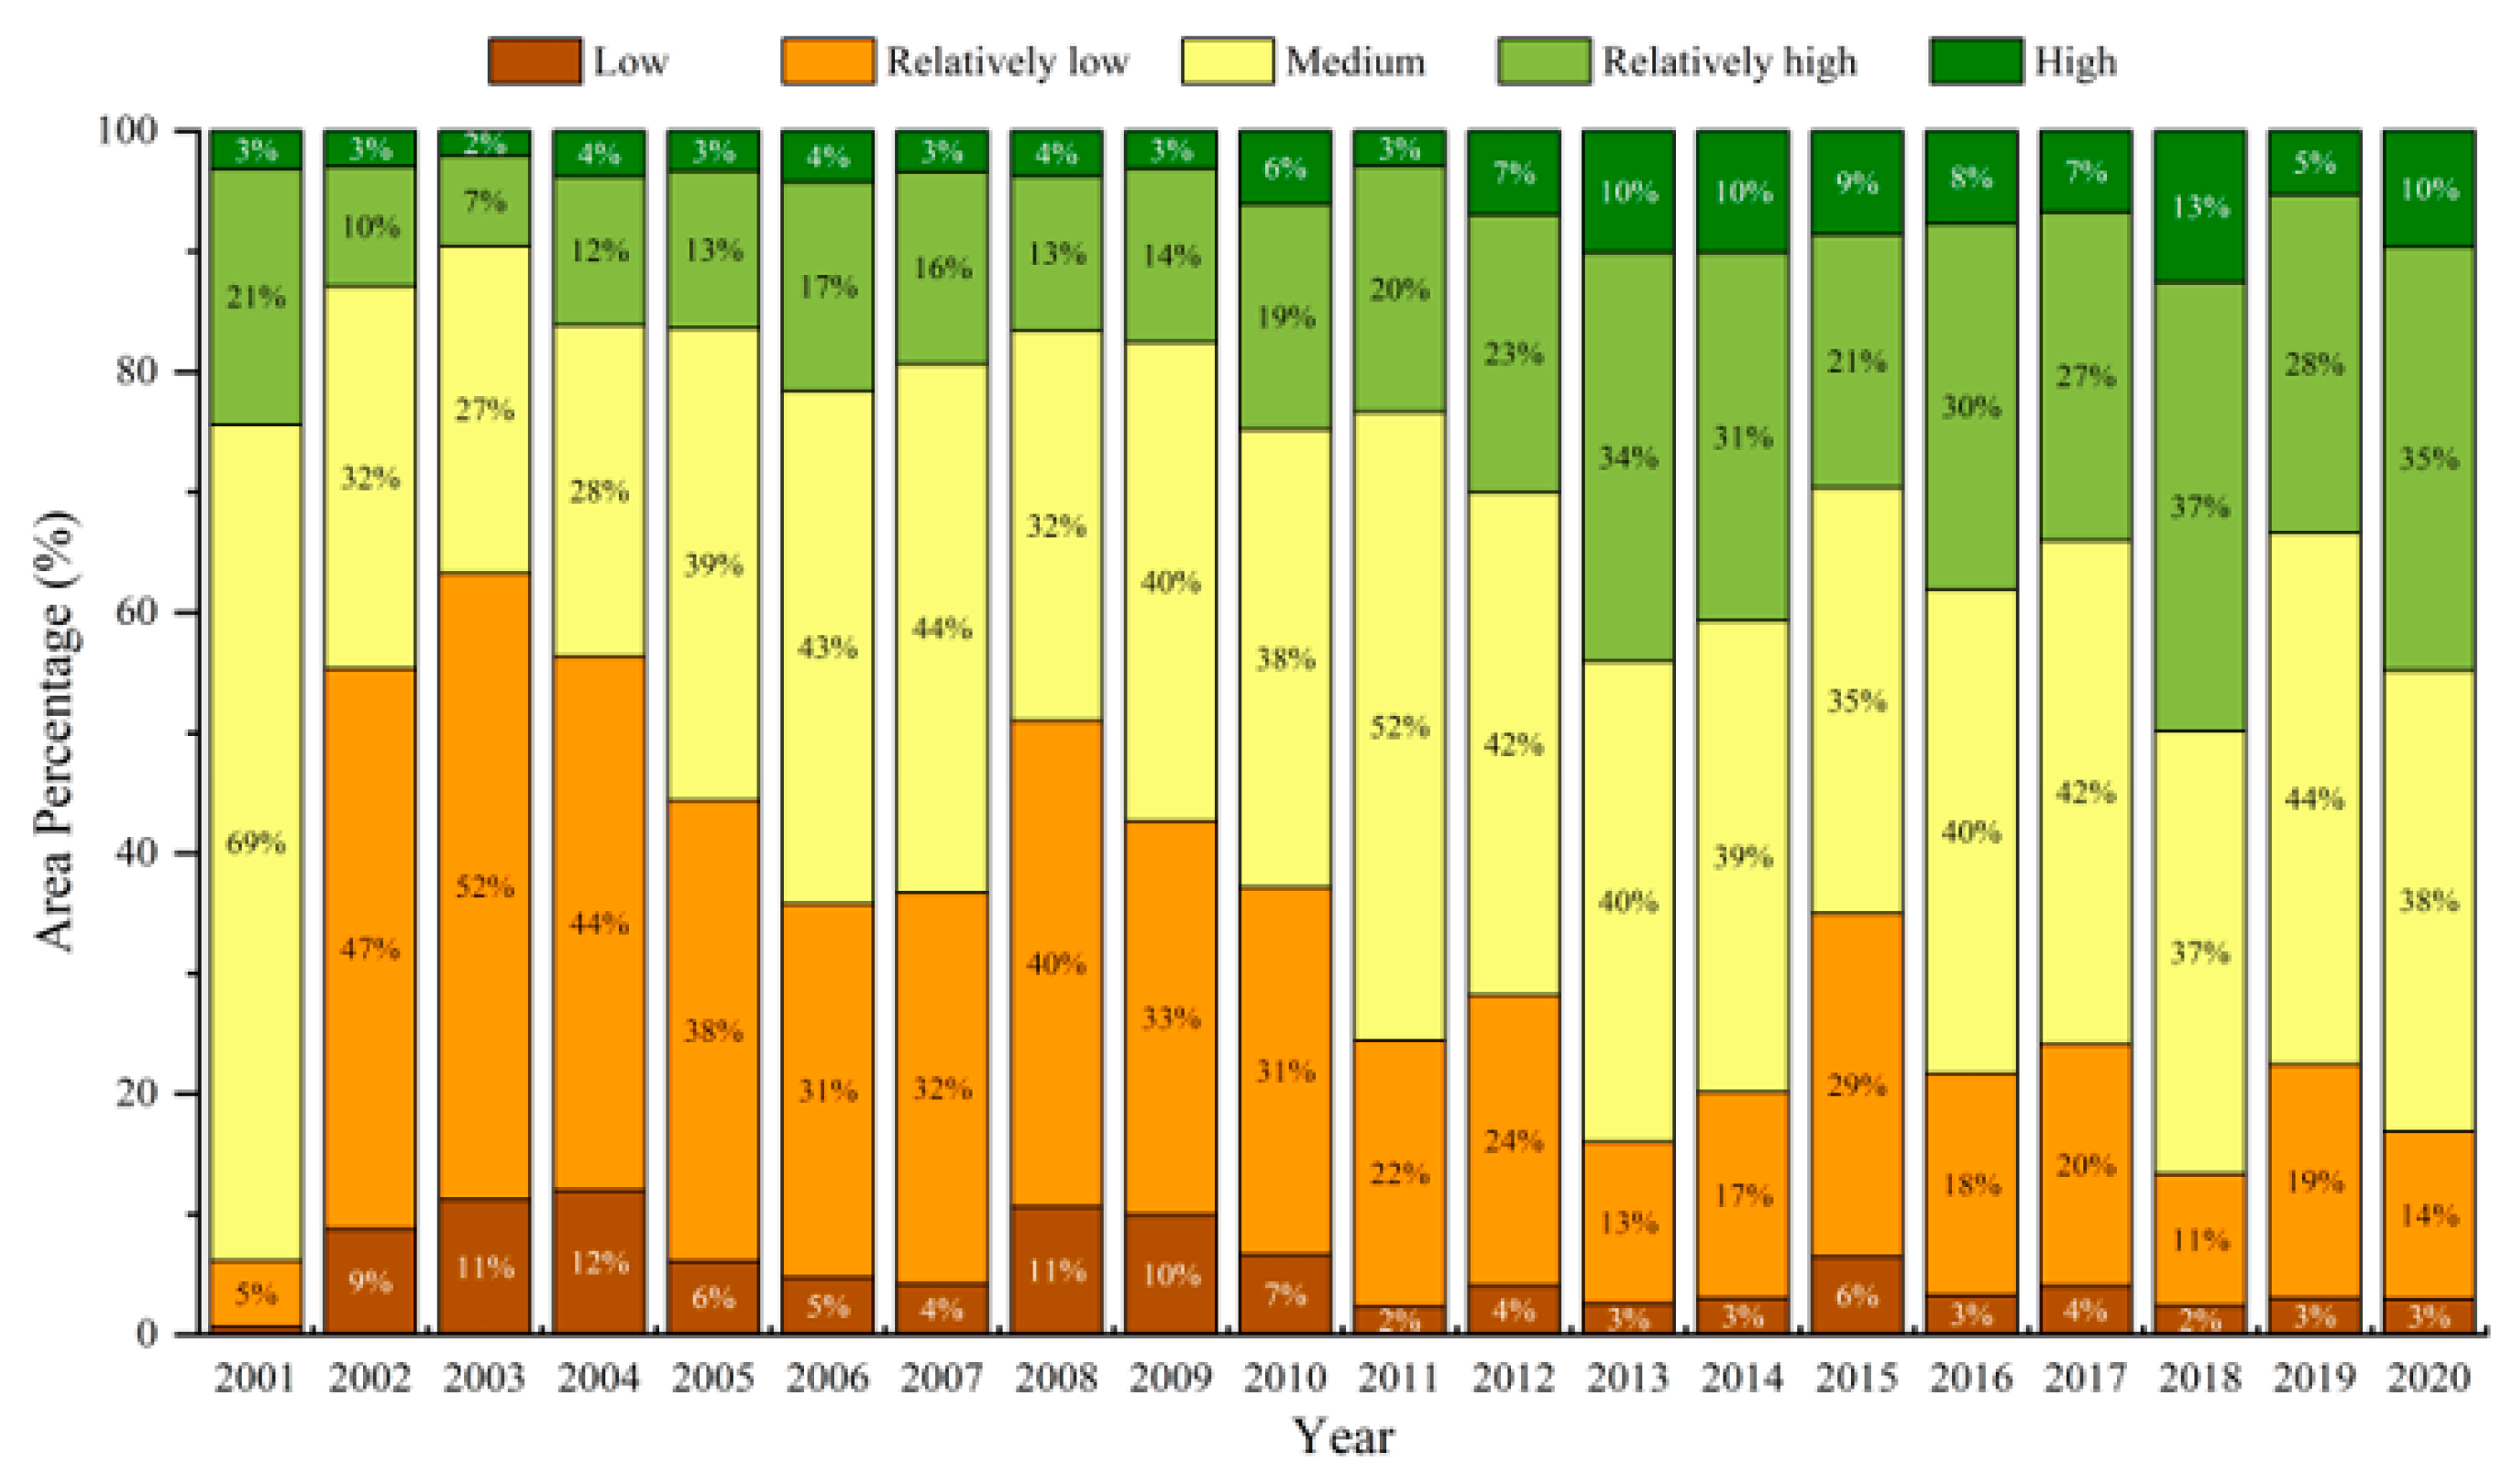
In order to further analyze the vegetation cover in the Yanhe River Basin, the vegetation cover was classified into five categories based on Table 2. Figure 5 shows the temporal distribution of different FVC classes in the Yan River Basin from 2001 to 2020 as a percentage of the total area. In the study area, the percentages of low, relatively low, and medium FVC classes declined over time. Conversely, the percentages of relatively high and high FVC classes increased over time. These findings indicate an overall enhancement in vegetation cover, suggesting a progressive improvement in the vegetation conditions of the Yan River Basin. In addition, the area shares of low and relatively low FVC classes exhibited dynamic changes with a 6-year cycle of rising and then falling, although the overall trend was decreasing. The area shares of the medium FVC class showed a fluctuating decreasing trend from 69.5% in 2001 to 38.3% in 2020. The area shares of relatively high and significantly high classes increased, with the proportion of relatively high areas increasing from 21.3% in 2001 to 35.2% in 2020. Overall, the vegetation cover of the Yan River Basin improved, as evidenced by the increasing proportion of relatively high and high FVC classes. This improvement was primarily due to the enhancement of low- and relatively low-grade vegetation.
In order to understand the details of the changes in each vegetation class, Table 7 presents more statistical data on the transition of different FVC classes in the Yan River Basin from 2001 to 2020. In 2020, it was observed that the areas of low, relatively low, relatively high, and high FVC classes within the Yan River Basin increased by 178.21 km2, 643.76 km2, 1067.29 km2, and 493.91 km2, respectively. Conversely, the area of the medium FVC class decreased by 2383.18 km2. The areas with low, relatively low, relatively high, and high FVC classes in the study area were primarily shifted from areas with medium, relatively low, relatively high, and high FVC classes, with transfers of 118.72 km2, 775.34 km2, 1788.05 km2, and 424.64 km2, respectively. The area with medium FVC was mostly transferred to relatively high FVC, indicating that the enhancement of vegetation cover was mainly driven by the improvement in the medium class.

4.2.3. Temporal Trends in Vegetation Cover of Counties in the Yanhe River Basin

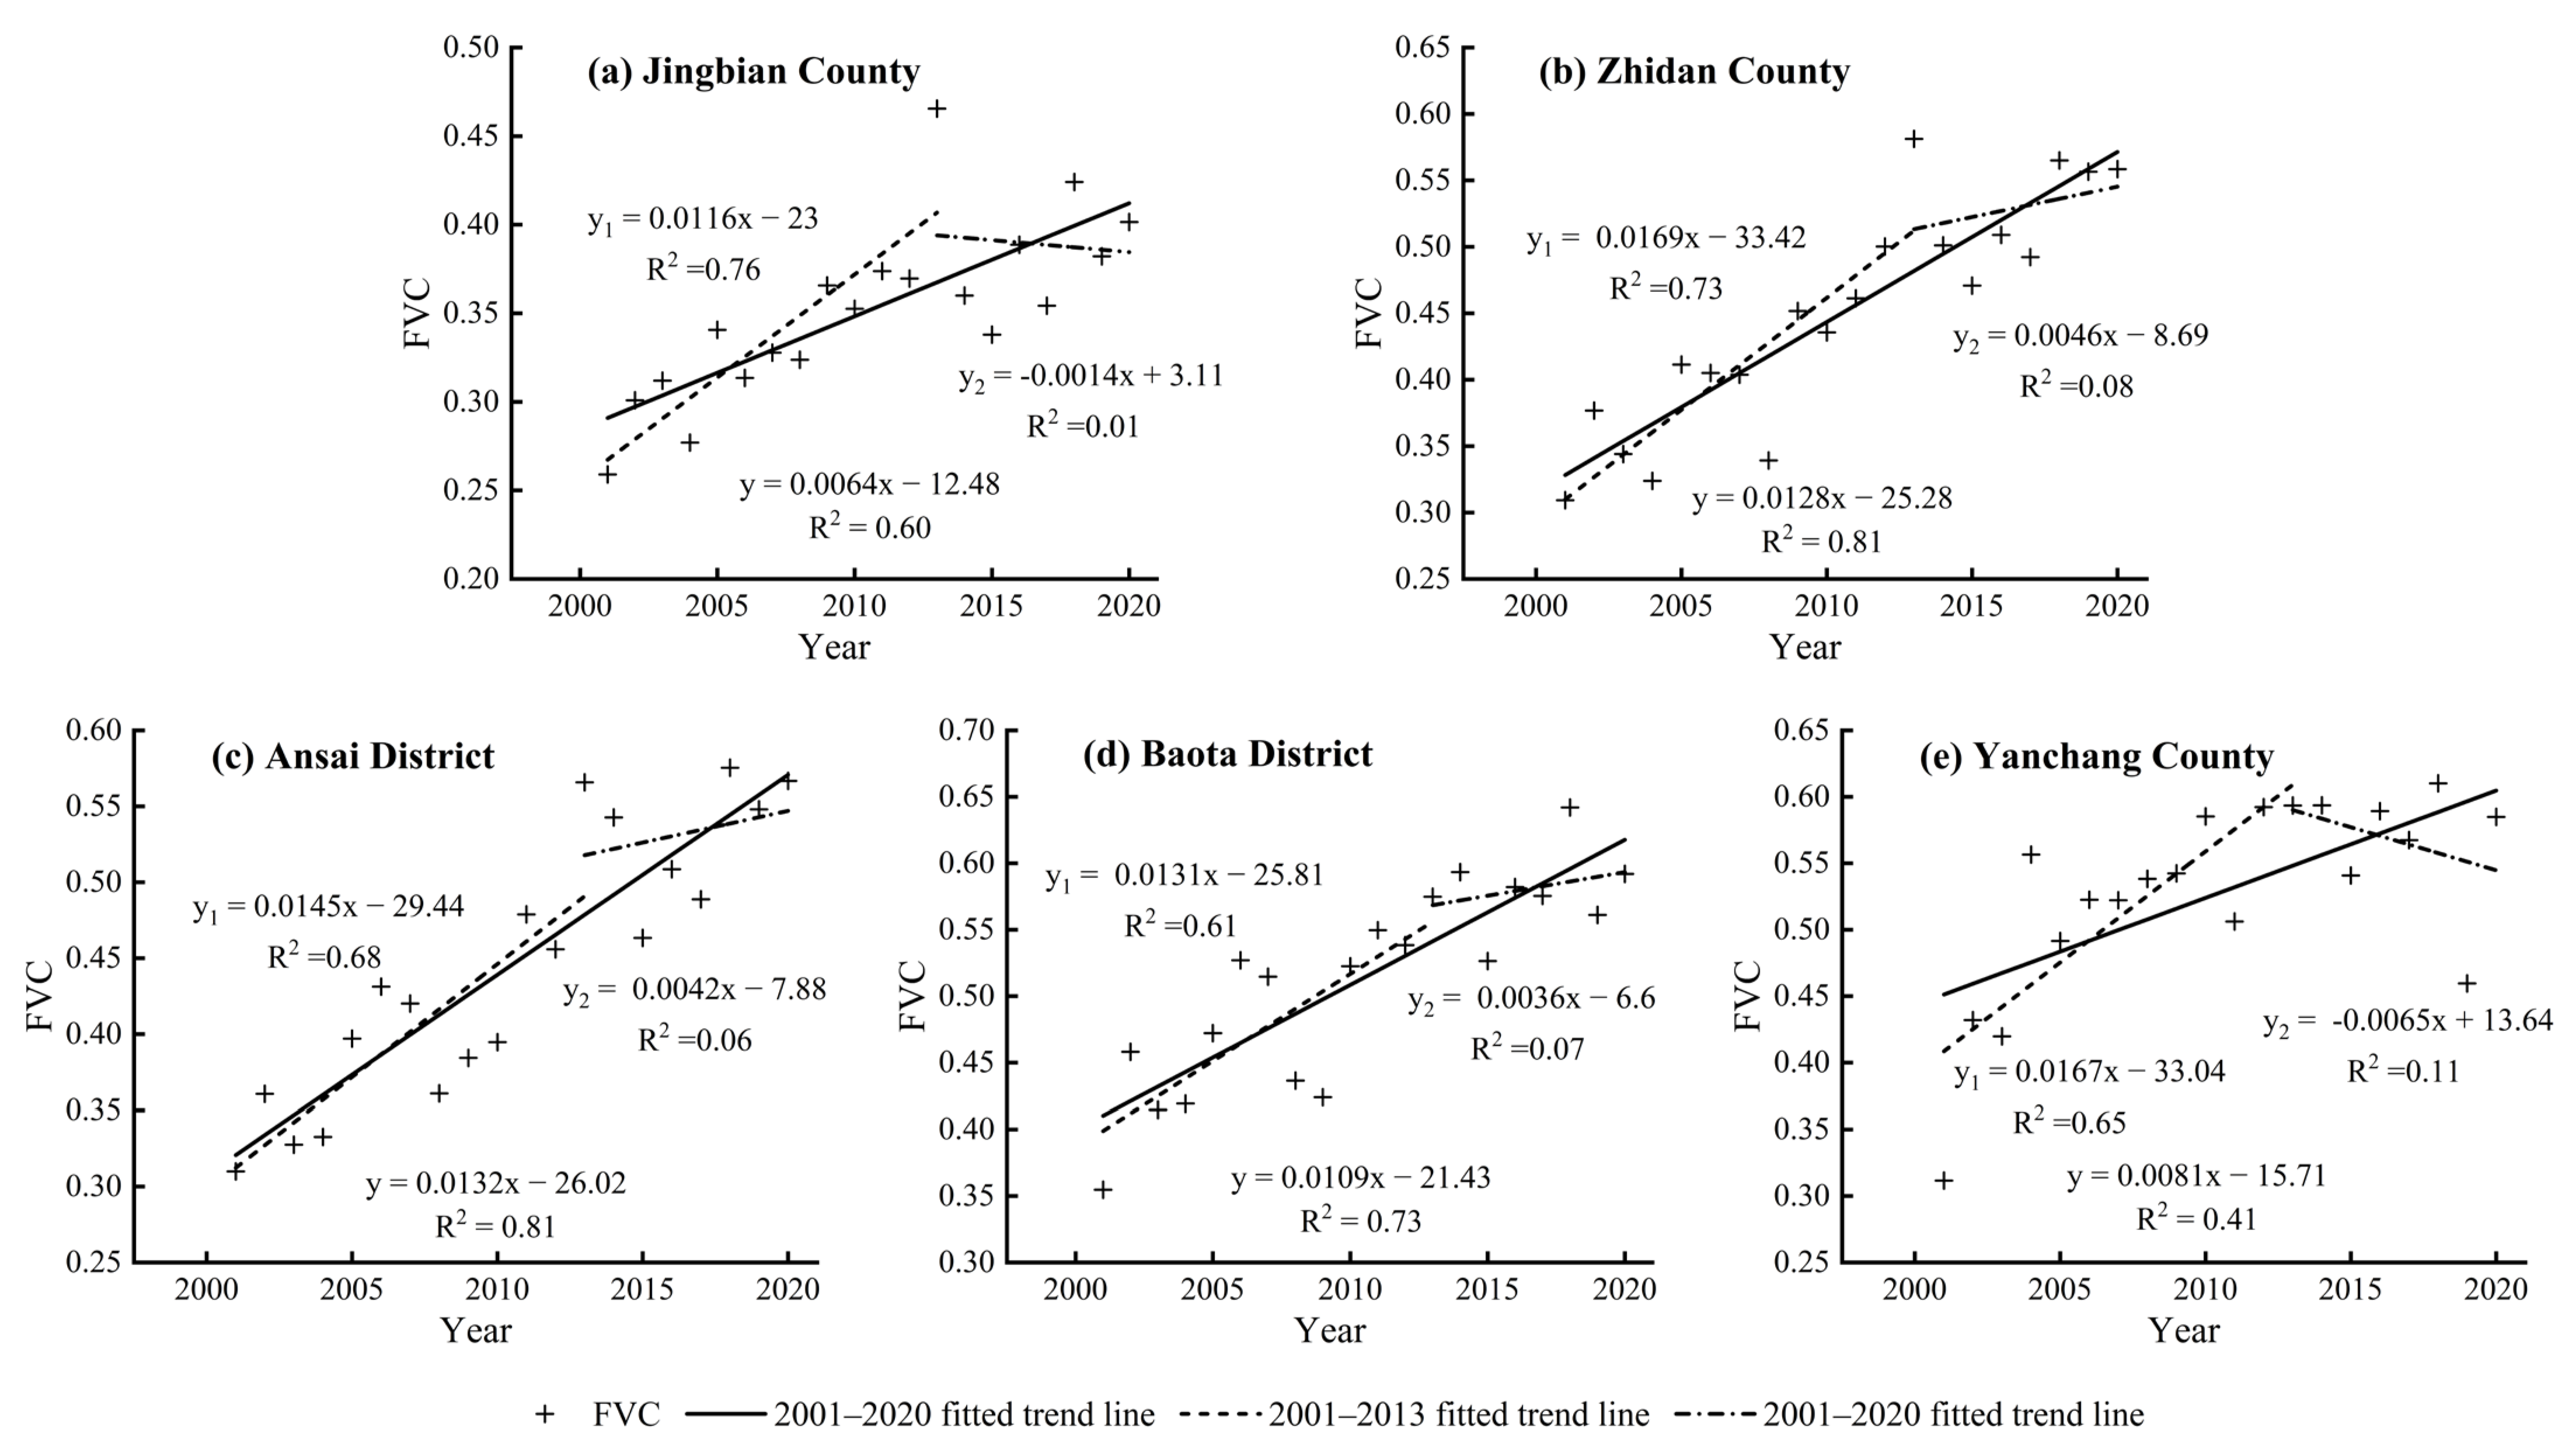
We used linear regression and t-tests to analyze the temporal trends of vegetation cover in the counties (districts) in the Yanhe River Basin from 2001 to 2020 (Figure 6). The FVC in all counties (districts) showed a highly significant growth trend (p < 0.01), with Ansai District having the highest growth rate of 0.0132/a (p < 0.01). In addition, Jingbian County had the slowest growth rate of FVC at 0.0064/a (p < 0.01). On the other hand, Zhidan County, Baota District, and Yanchang County had higher growth rates of 0.0128/a (p < 0.01), 0.0109/a (p < 0.01), and 0.081/a (p < 0.01), respectively.
Based on partial linear regression (PLR) of the lowest error variance (p < 0.01), FVC can be divided into two phases, with 2013 as the time node. From 2001 to 2013, The FVC in all counties (districts) showed a highly significant growth trend (p < 0.01), with Zhidan County having the highest growth rate of 0.0169/a (p < 0.01). In addition, Jingbian County had the slowest growth rate of FVC at 0.0116/a (p < 0.01). On the other hand, Ansai District, Baota District, and Yanchang County had higher growth rates of 0.0145/a (p < 0.01), 0.0131/a (p < 0.01), and 0.0167/a (p < 0.01), respectively. From 2013 to 2020, all counties (districts) except Jingbian and Yanchang showed a highly significant growth trend, with the highest growth rate in Zhidan County at 0.0046/a. Moreover, the growth rate S in the Ansai and Baota districts was 0.0042/a and 0.0036/a, respectively. However, Jingbian and Yanchang counties had a negative growth rate S of −0.0014/a and −0.0065/a, respectively.
Overall, among the counties (districts), the FVC in Ansai District had the fastest growth rate in 20 years and presented a highly significant growth trend, while Jingbian County had the slowest growth rate.

4.3. Spatial Distribution and Change Characteristics of Vegetation Cover in the Yanhe River Basin, 2001–2020

4.3.1. Spatial Distribution Patterns of Vegetation Cover in the Yanhe River Basin, 2001–2020

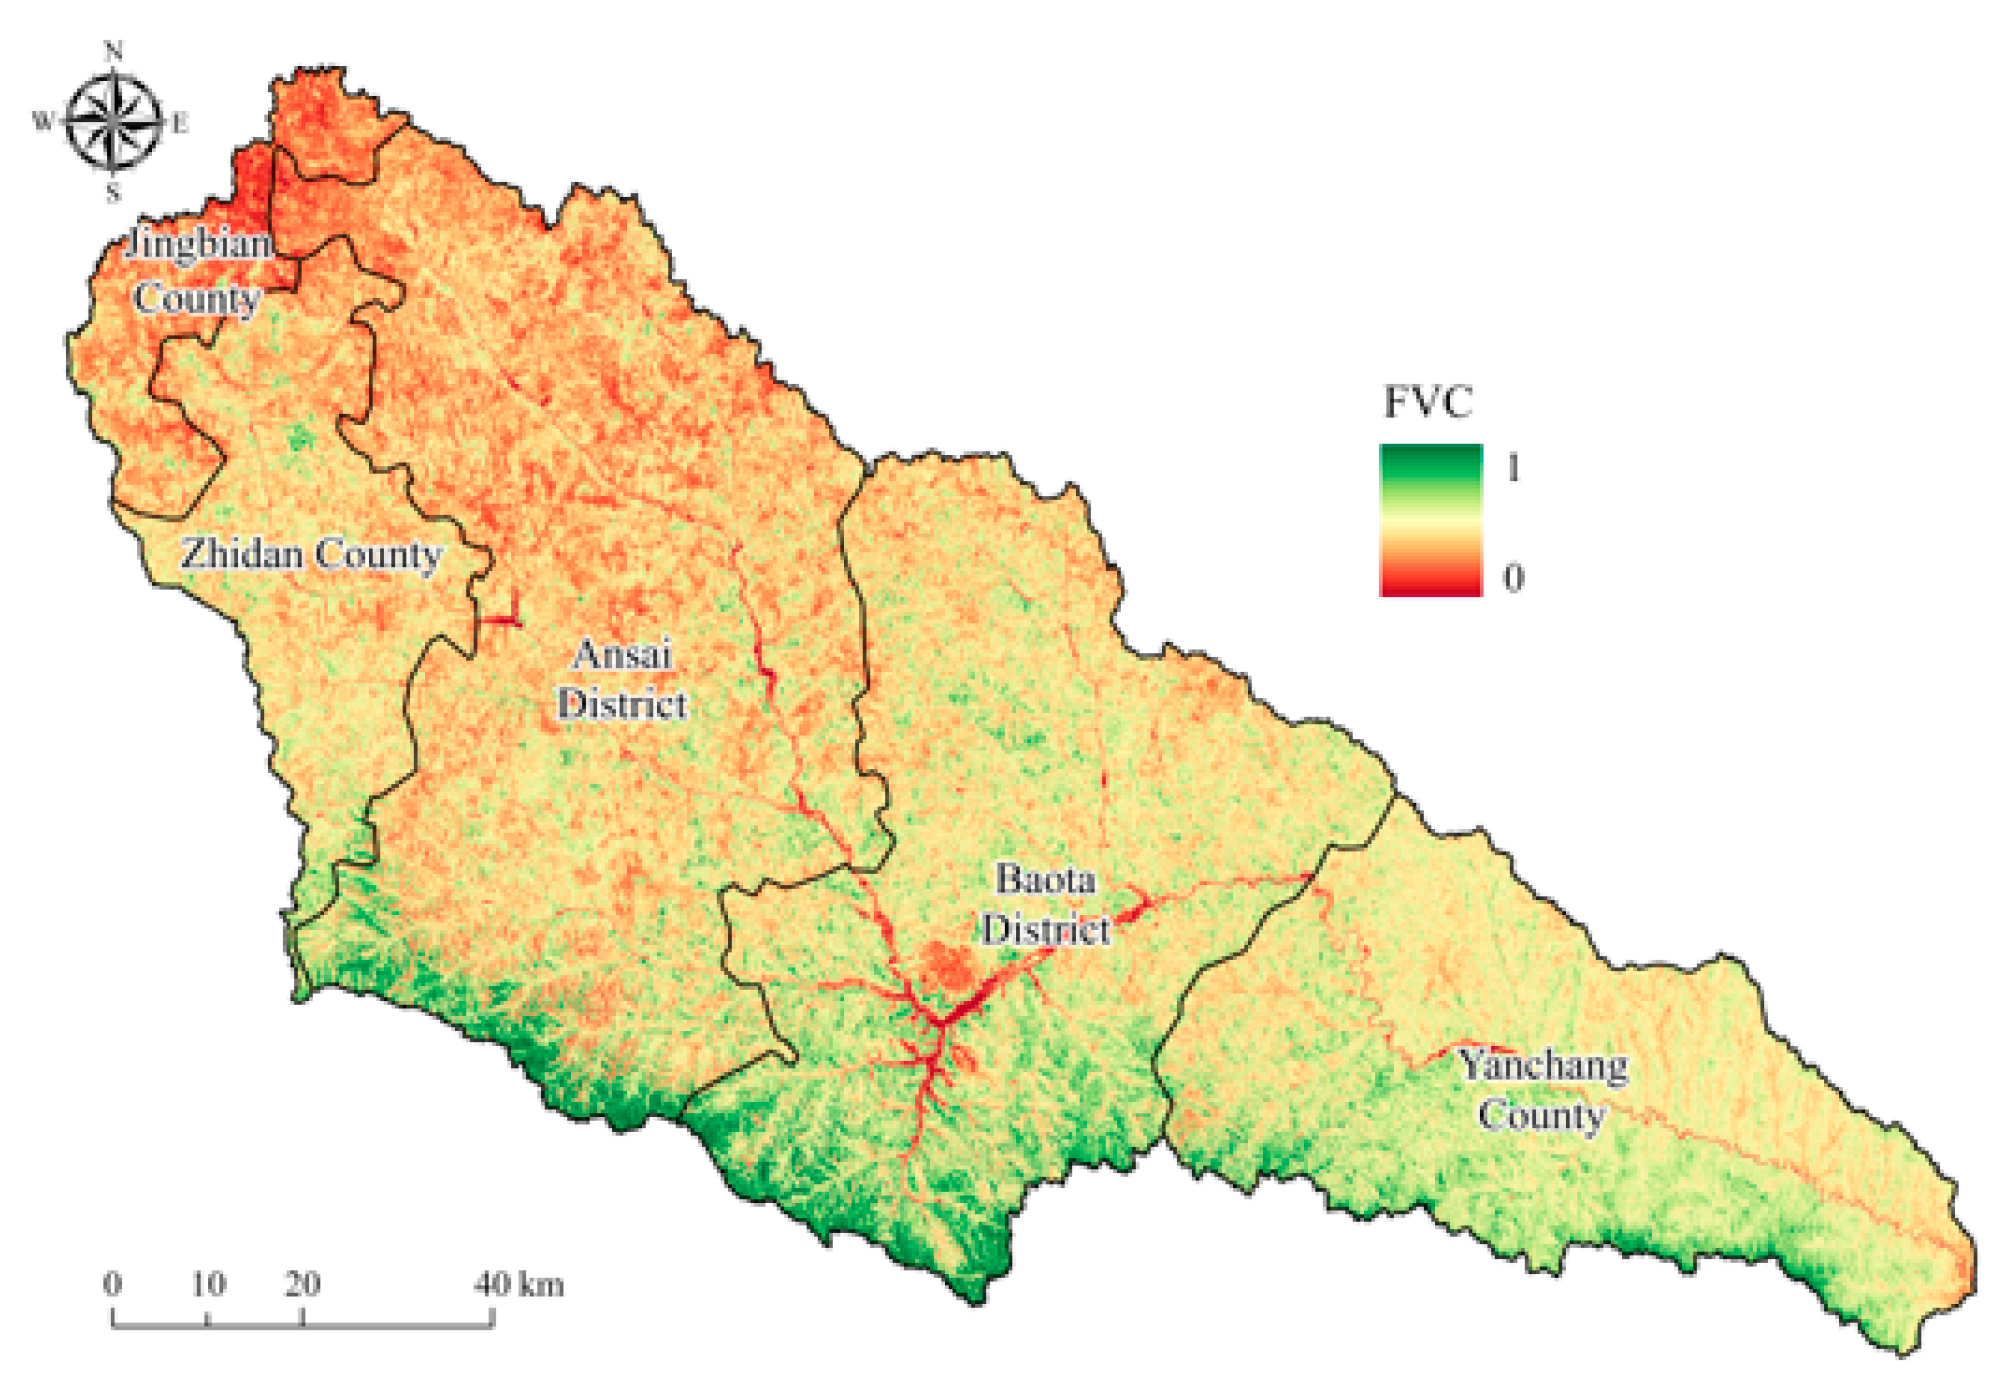
The Yan River Basin was divided into five different regions based on administrative divisions for this study: Jingbian County, Zhidan County, Ansai District, Baota District, and Yanchang County. Figure 7 shows that the spatial distribution pattern of FVC within the Yan River Basin from 2001 to 2020 exhibited considerable variations from north to south, indicating significant spatial heterogeneity. The central region of Baota District had a high level of urbanization, suggesting that urban development had a substantial impact on vegetation cover. The areas with high FVC values were primarily located in Zhidan County, the southern regions of Ansai District and Baota District, and the eastern and western regions of southern Yanchang County. These areas were characterized by tall tree vegetation types, such as white birch, mountain poplar, and oil pine.
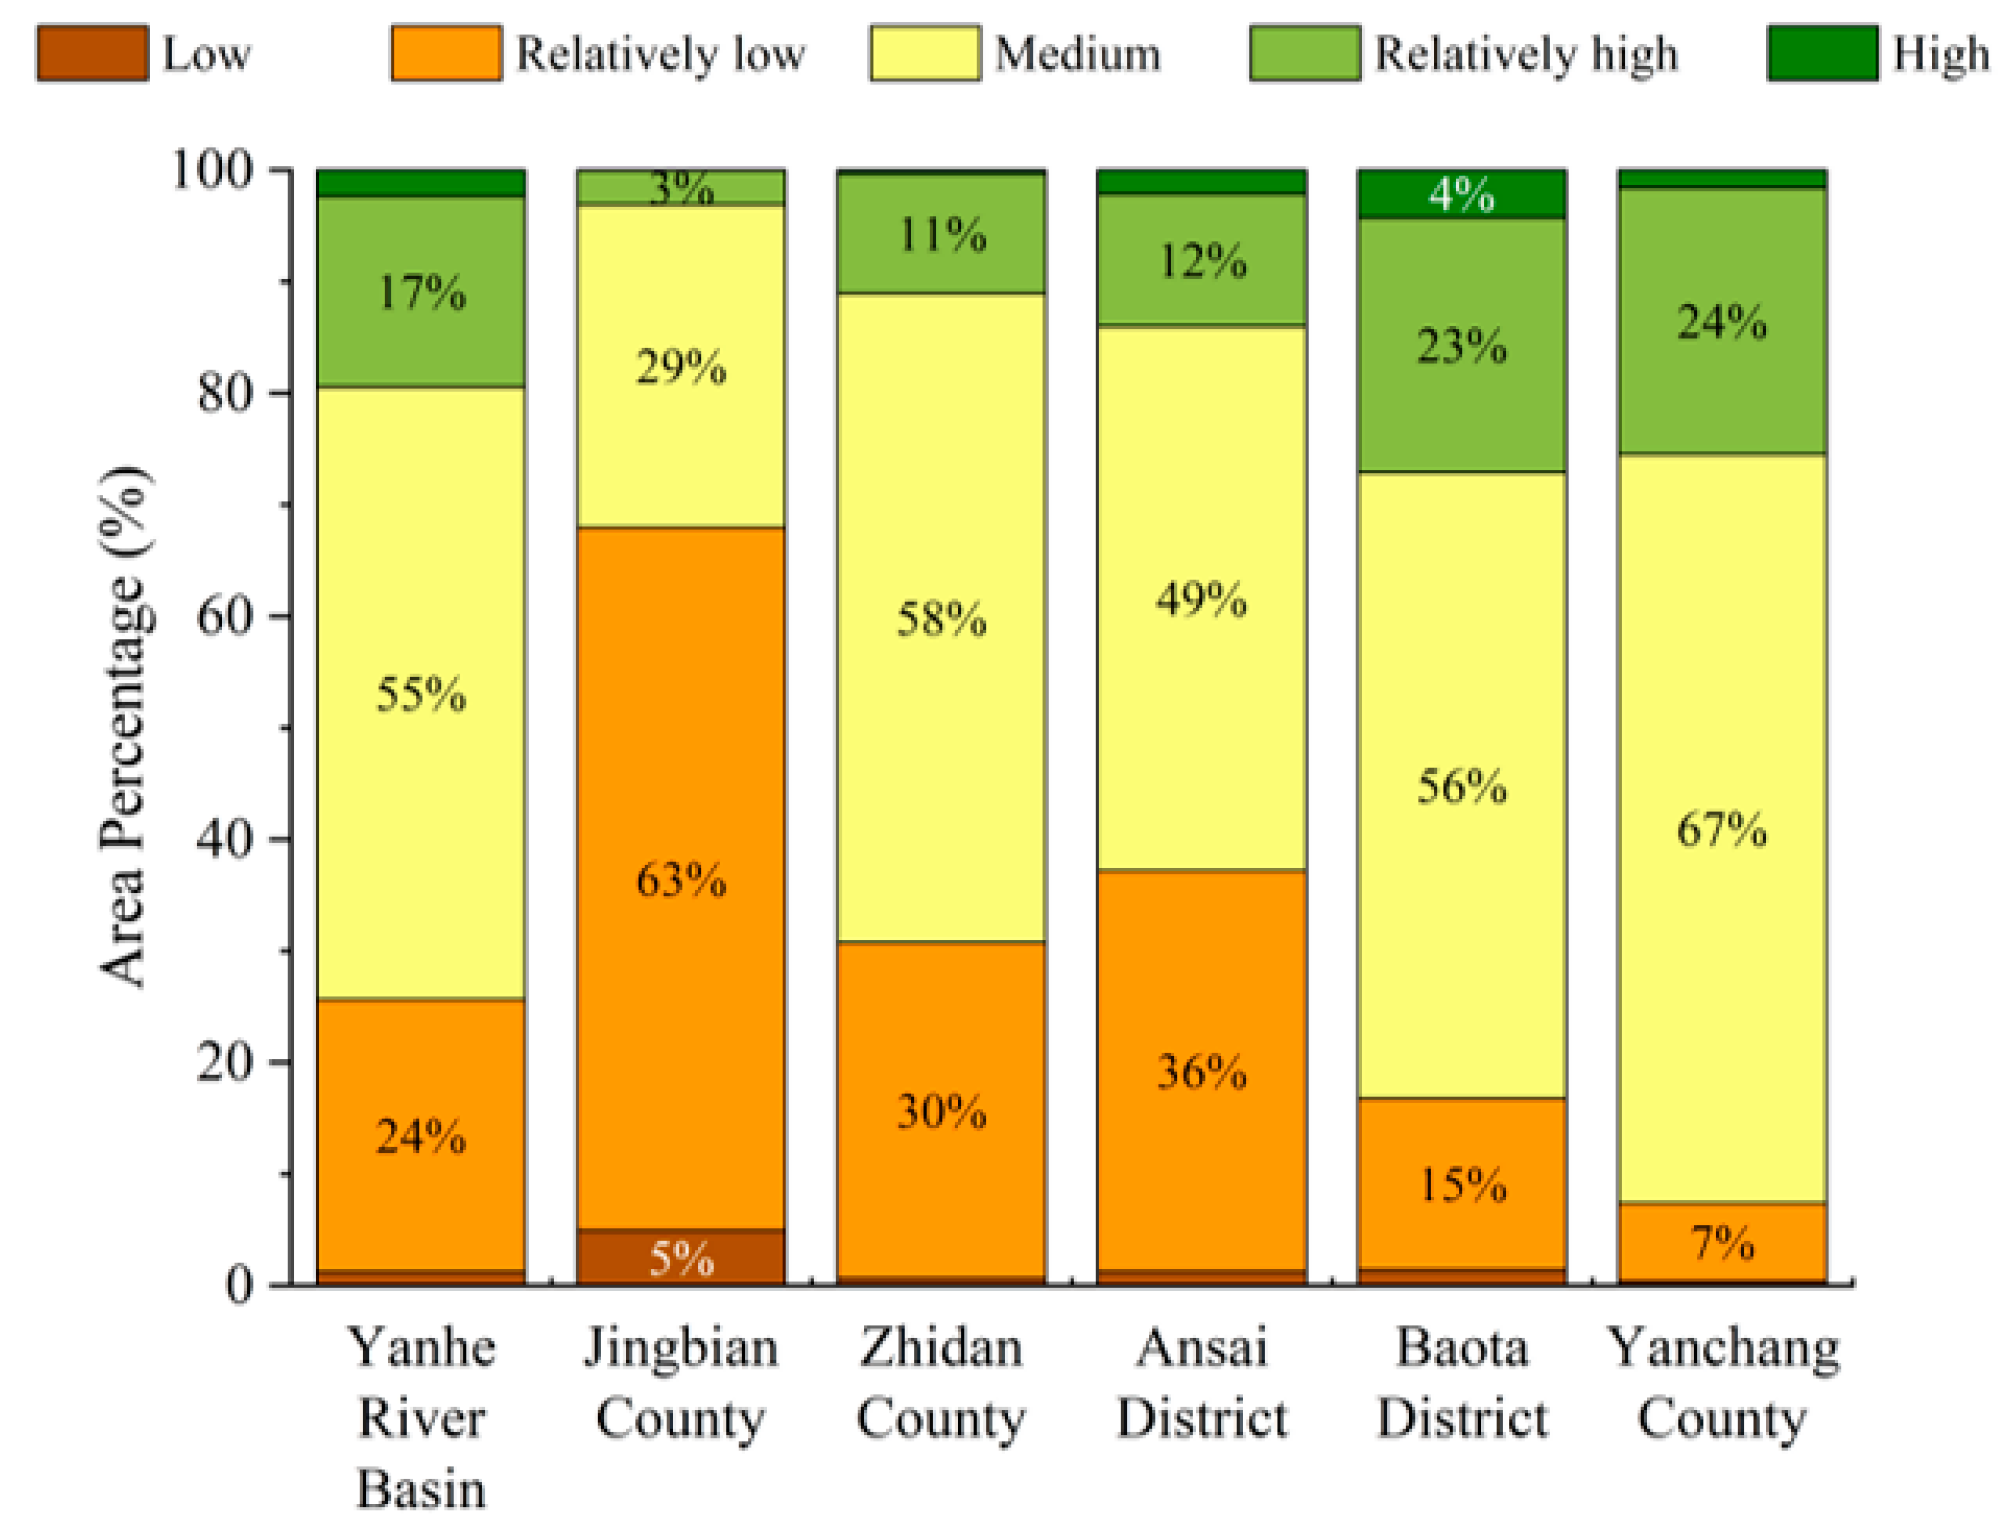
To examine the distribution of vegetation in the Yan River Basin in depth, the 20-year average FVC was classified according to the classification criteria (Table 2). The statistical results of different FVC types are shown in Figure 8, which shows that medium FVC was predominant (54.9%), followed by relatively low FVC (24.4%), while low, relatively high, and high FVC covered 1.2%, 17.1%, and 2.4% of the Yanhe River Basin, respectively. Among the counties (districts), Zhidan County, Ansai District, Baota District, and Yanchang County were all mainly characterized by medium vegetation cover, with area shares of 58.2%, 48.8%, 56.1%, and 67.1%, respectively. Yanchang County is situated in the lower reaches of the Yan River Basin and has a relatively low elevation and gentle slopes that are favorable for vegetation. Tall trees such as birch, mountain poplar, and oleander are found in southern Yanchang County. Jingbian County is dominated by medium to low vegetation cover (62.99%) followed by medium vegetation cover (29%). This county is situated in the transition zone from desert to loess hills, where the surface is largely covered by grass, shrubs, and other low vegetation.

4.3.2. Spatial and Temporal Pattern of Vegetation Change and Its Future Trend in the Yanhe River Basin, 2001–2020

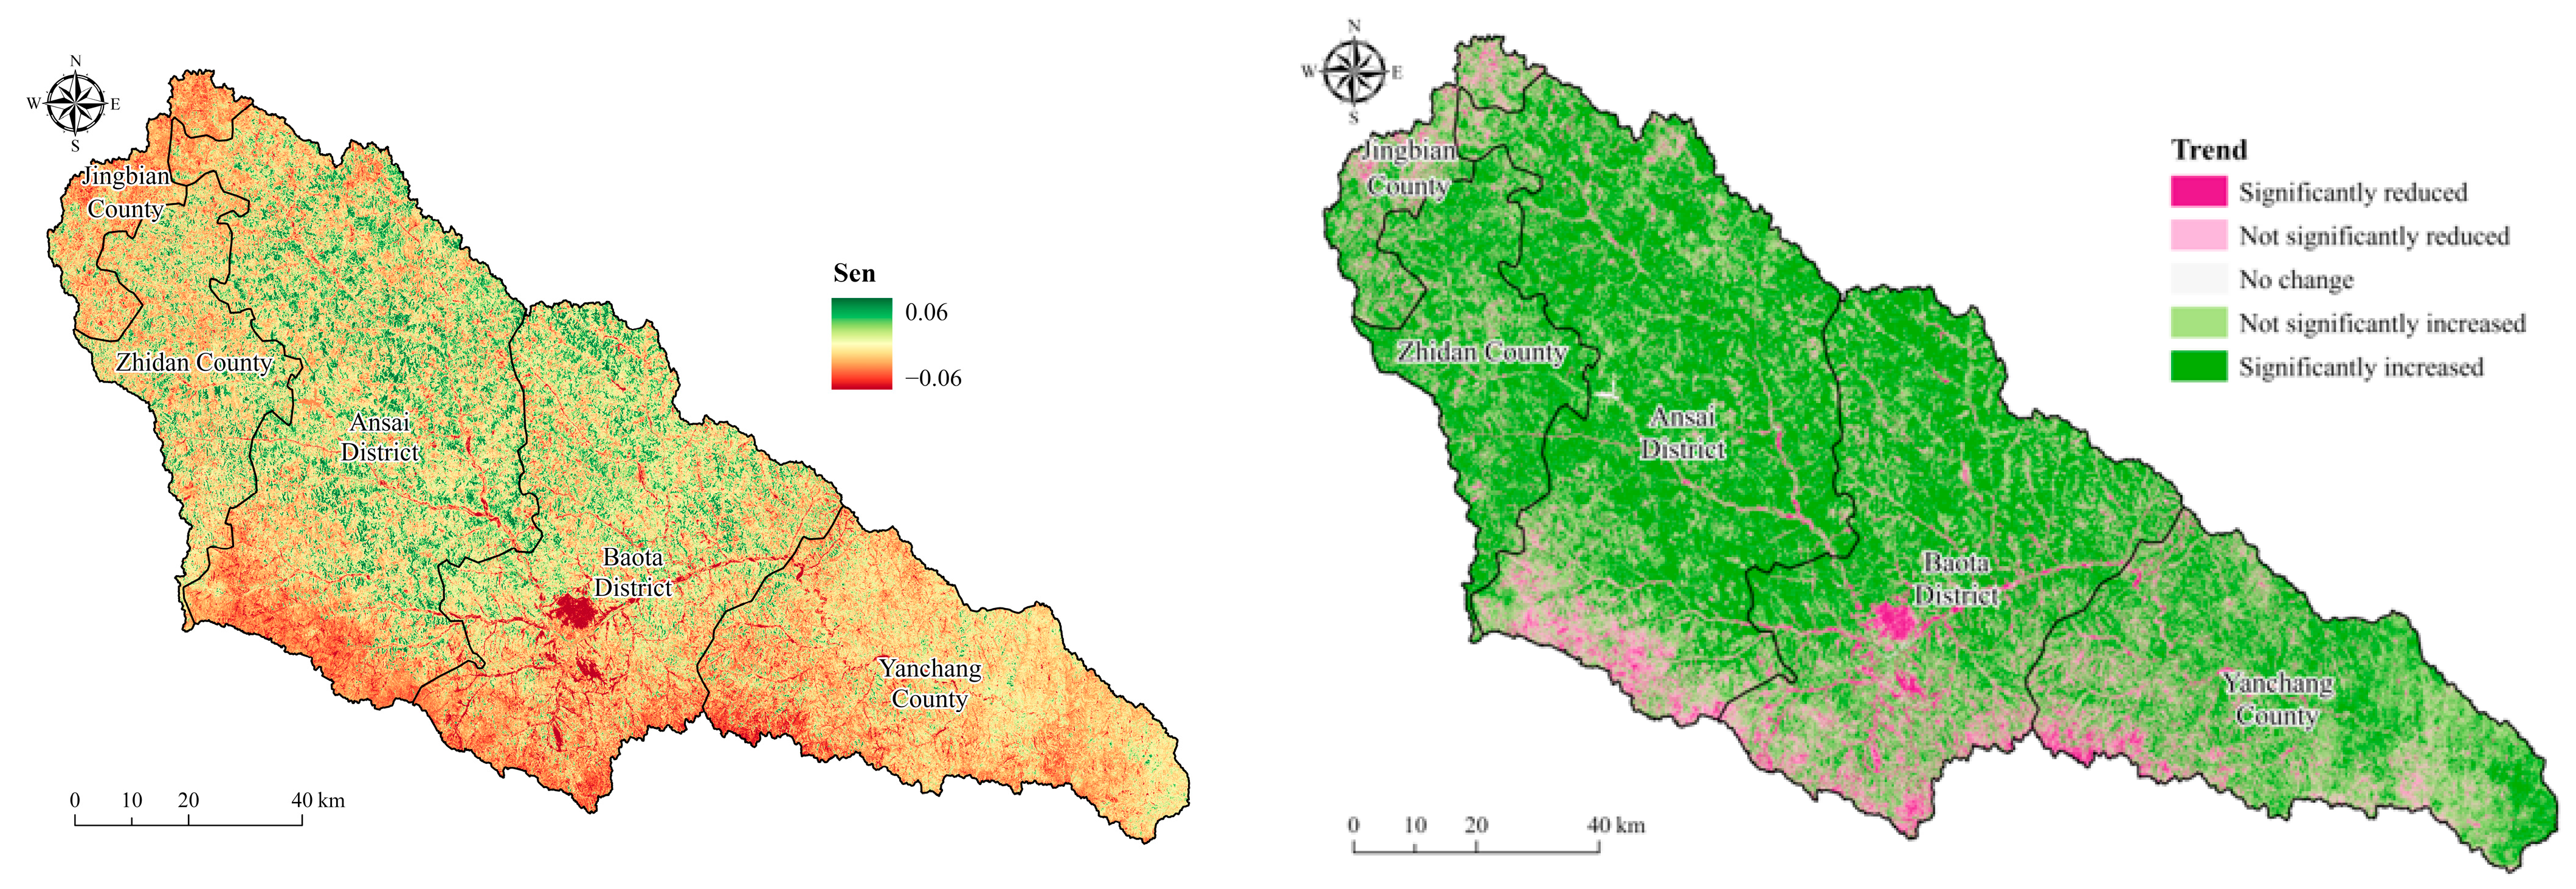
The Theil–Sen median and Mann–Kendall trend analysis methods were used to analyze the spatial and temporal variation characteristics of FVC in the Yan River Basin from 2001 to 2020, as shown in Figure 9. The analysis results show that FVC increased in 83.9% of the Yan River Basin, with a significant increase observed in 55.7% of the area, mainly in the upper and middle reaches. This suggests that the project of returning farmland to forest and grassland was effective in enhancing vegetation growth. However, in 15.9% of the Yan River Basin, FVC decreased, and in 3.9% of the area, FVC showed a significant decreasing trend, mainly in some regions of Jingbian County, Ansai District, Baota District, and Yanchang County. This may indicate that rapid urbanization has adversely affected regional vegetation conditions [41].
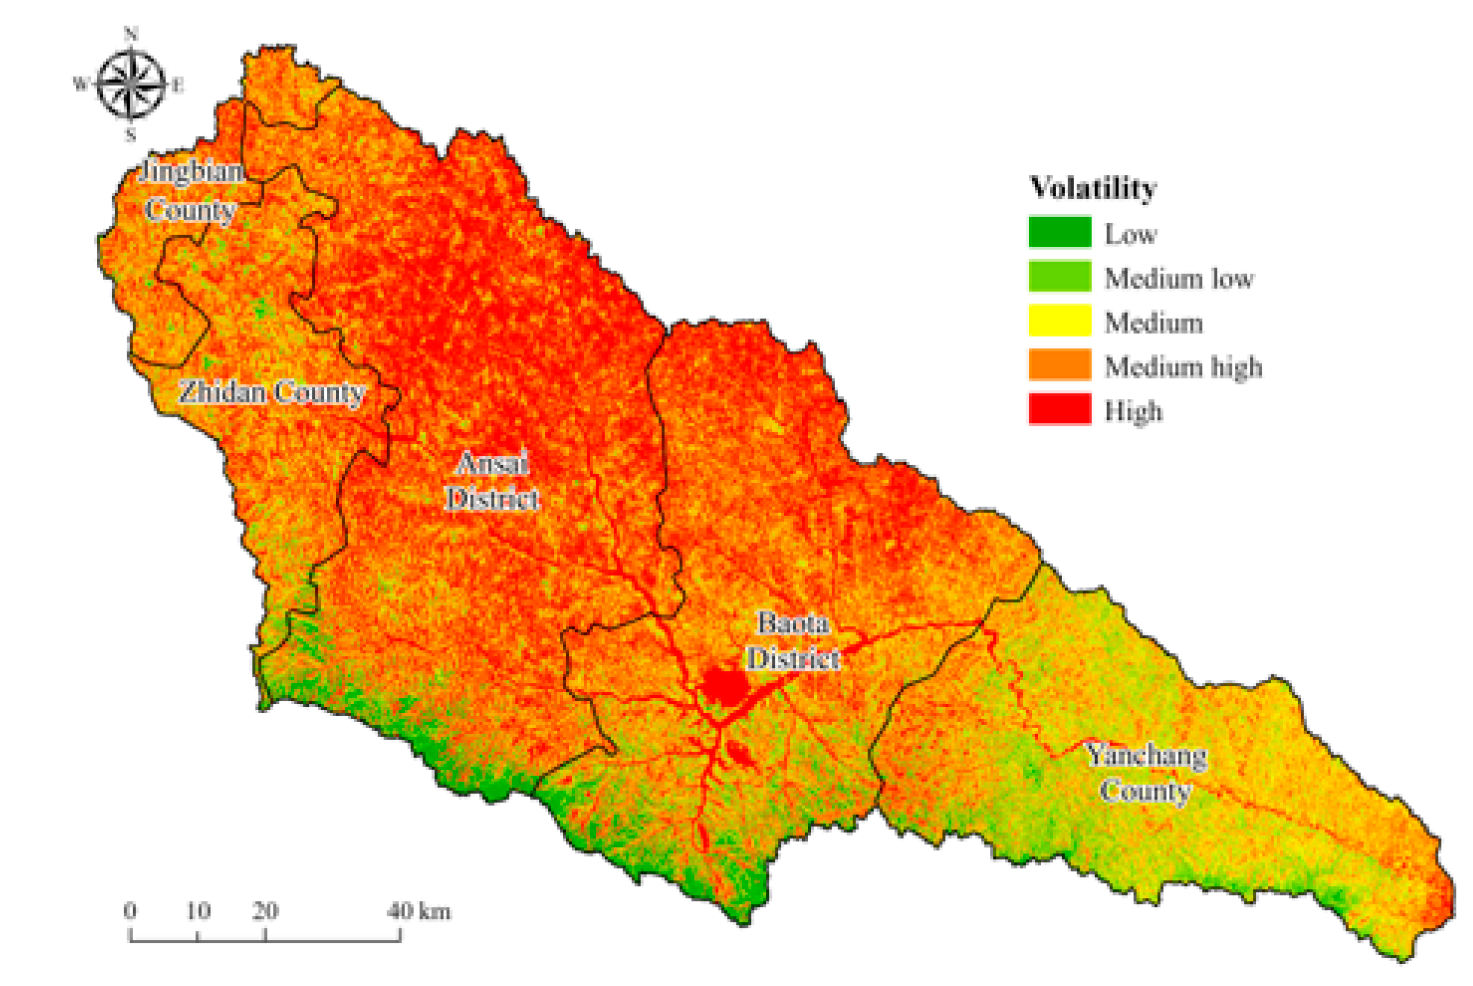
After categorizing the coefficients of variation according to Table 3, Figure 10 shows the fluctuations in FVC in the Yan River Basin from 2001 to 2020. Areas with high FVC fluctuations covered 30.26% of the total area, and they were mainly observed in some regions of the Ansai and Baota Districts. This may be due to the combined influence of human activities, such as ecological management and resource development. Additionally, areas with low and medium fluctuations accounted for 16.28% of the total and were primarily located in the southern and southeastern border regions of the Yan River Basin.
Despite the usefulness of the Theil–Sen median and Mann–Kendall trend analysis methods for analyzing the spatial and temporal evolution of vegetation, it should be noted that these methods cannot forecast future trends. To address this, the Hurst and Sen indexes were overlaid to explore future vegetation change. Judging the results of the Hurst index according to Table 4, Figure 11 presents the Hurst index for FVC within the Yan River Basin from 2001 to 2020. The analysis revealed a maximum value of 0.99, a minimum value of 0.08, and a mean value of 0.5. The results indicated that most regions (50.77%) may show an anti-sustainability trend in the future, particularly in the Ansai, Baota, and Yanchang districts. Furthermore, 49.23% of the vegetation cover within the basin exhibited persistence, particularly in regions such as Zhidan County, northwest and northeast Ansai District, central Baota District, and east and southeast western Yanhe County. Further analysis of the future trend of FVC combined with Sen’s rate of change was performed, and the results are shown in Figure 11. The FVC showed a future growth trend in 51.9% of the region, with 42.5% showing continuous growth (improvement—improvement), mainly in Zhidan County and northwest of Ansai District. Sustained growth (degradation—improvement) was observed in 9.4% of the area, mainly in Jingbian County, southern Ansai District, southeast and southwest Baota District, and southwest Yanhe County. A decline in anti-sustained conditions (improvement—degradation) was observed in 41.5% of the area under study. This phenomenon was primarily evident in northern and south-central Ansai District, northwestern Baota District, and central and eastern Yanchang County. In contrast, persistent decline (degradation—degradation) was observed in 6.6% of the area, mainly in the townships of Baota District and their surrounding areas and the southeast and southwest Yanchang County.

4.4. Analysis of Factors Influencing Vegetation Cover

4.4.1. Factor Detector

The spatiotemporal analysis revealed that vegetation cover in the Yan River Basin is spatially heterogeneous. However, the presence of severe multicollinearity among the explanatory variables may hinder the model’s capacity to effectively account for this heterogeneity. On the other hand, the geographic detector used in this study is robust to the effects of multicollinearity among independent variables, which allows it to accurately assess the individual impact of each factor on the spatial distribution of vegetation cover. An analysis using the factor detector to examine the influence of various factors on the spatial variation in FVC at different stages showed that although all factors had a significant impact on the spatial variation in FVC (p < 0.01), the extent to which each factor could explain this variation varied (Table 8). In descending order of explanatory power, the factors are relative humidity, precipitation, sunshine hours, elevation, temperature, LUCC, population density, soil type, GDP, and slope. The spatial distribution of vegetation cover in the Yan River Basin was mainly influenced by climatic factors related to moisture, as evidenced by the high q values (>20%) of relative humidity (29%), precipitation (26.2%), and sunshine hours (23.8%). Elevation, temperature, and LUCC had moderate effects on the spatial variation in FVC, with q values of 11.2%, 9.6%, and 9.4%, respectively. Thus, they were classified as secondary factors. Conversely, population density, soil type, GDP, and slope had relatively low explanatory power for vegetation cover, as evidenced by their q values, which were all below 5%.

4.4.2. Interaction Detector and Ecological Detector

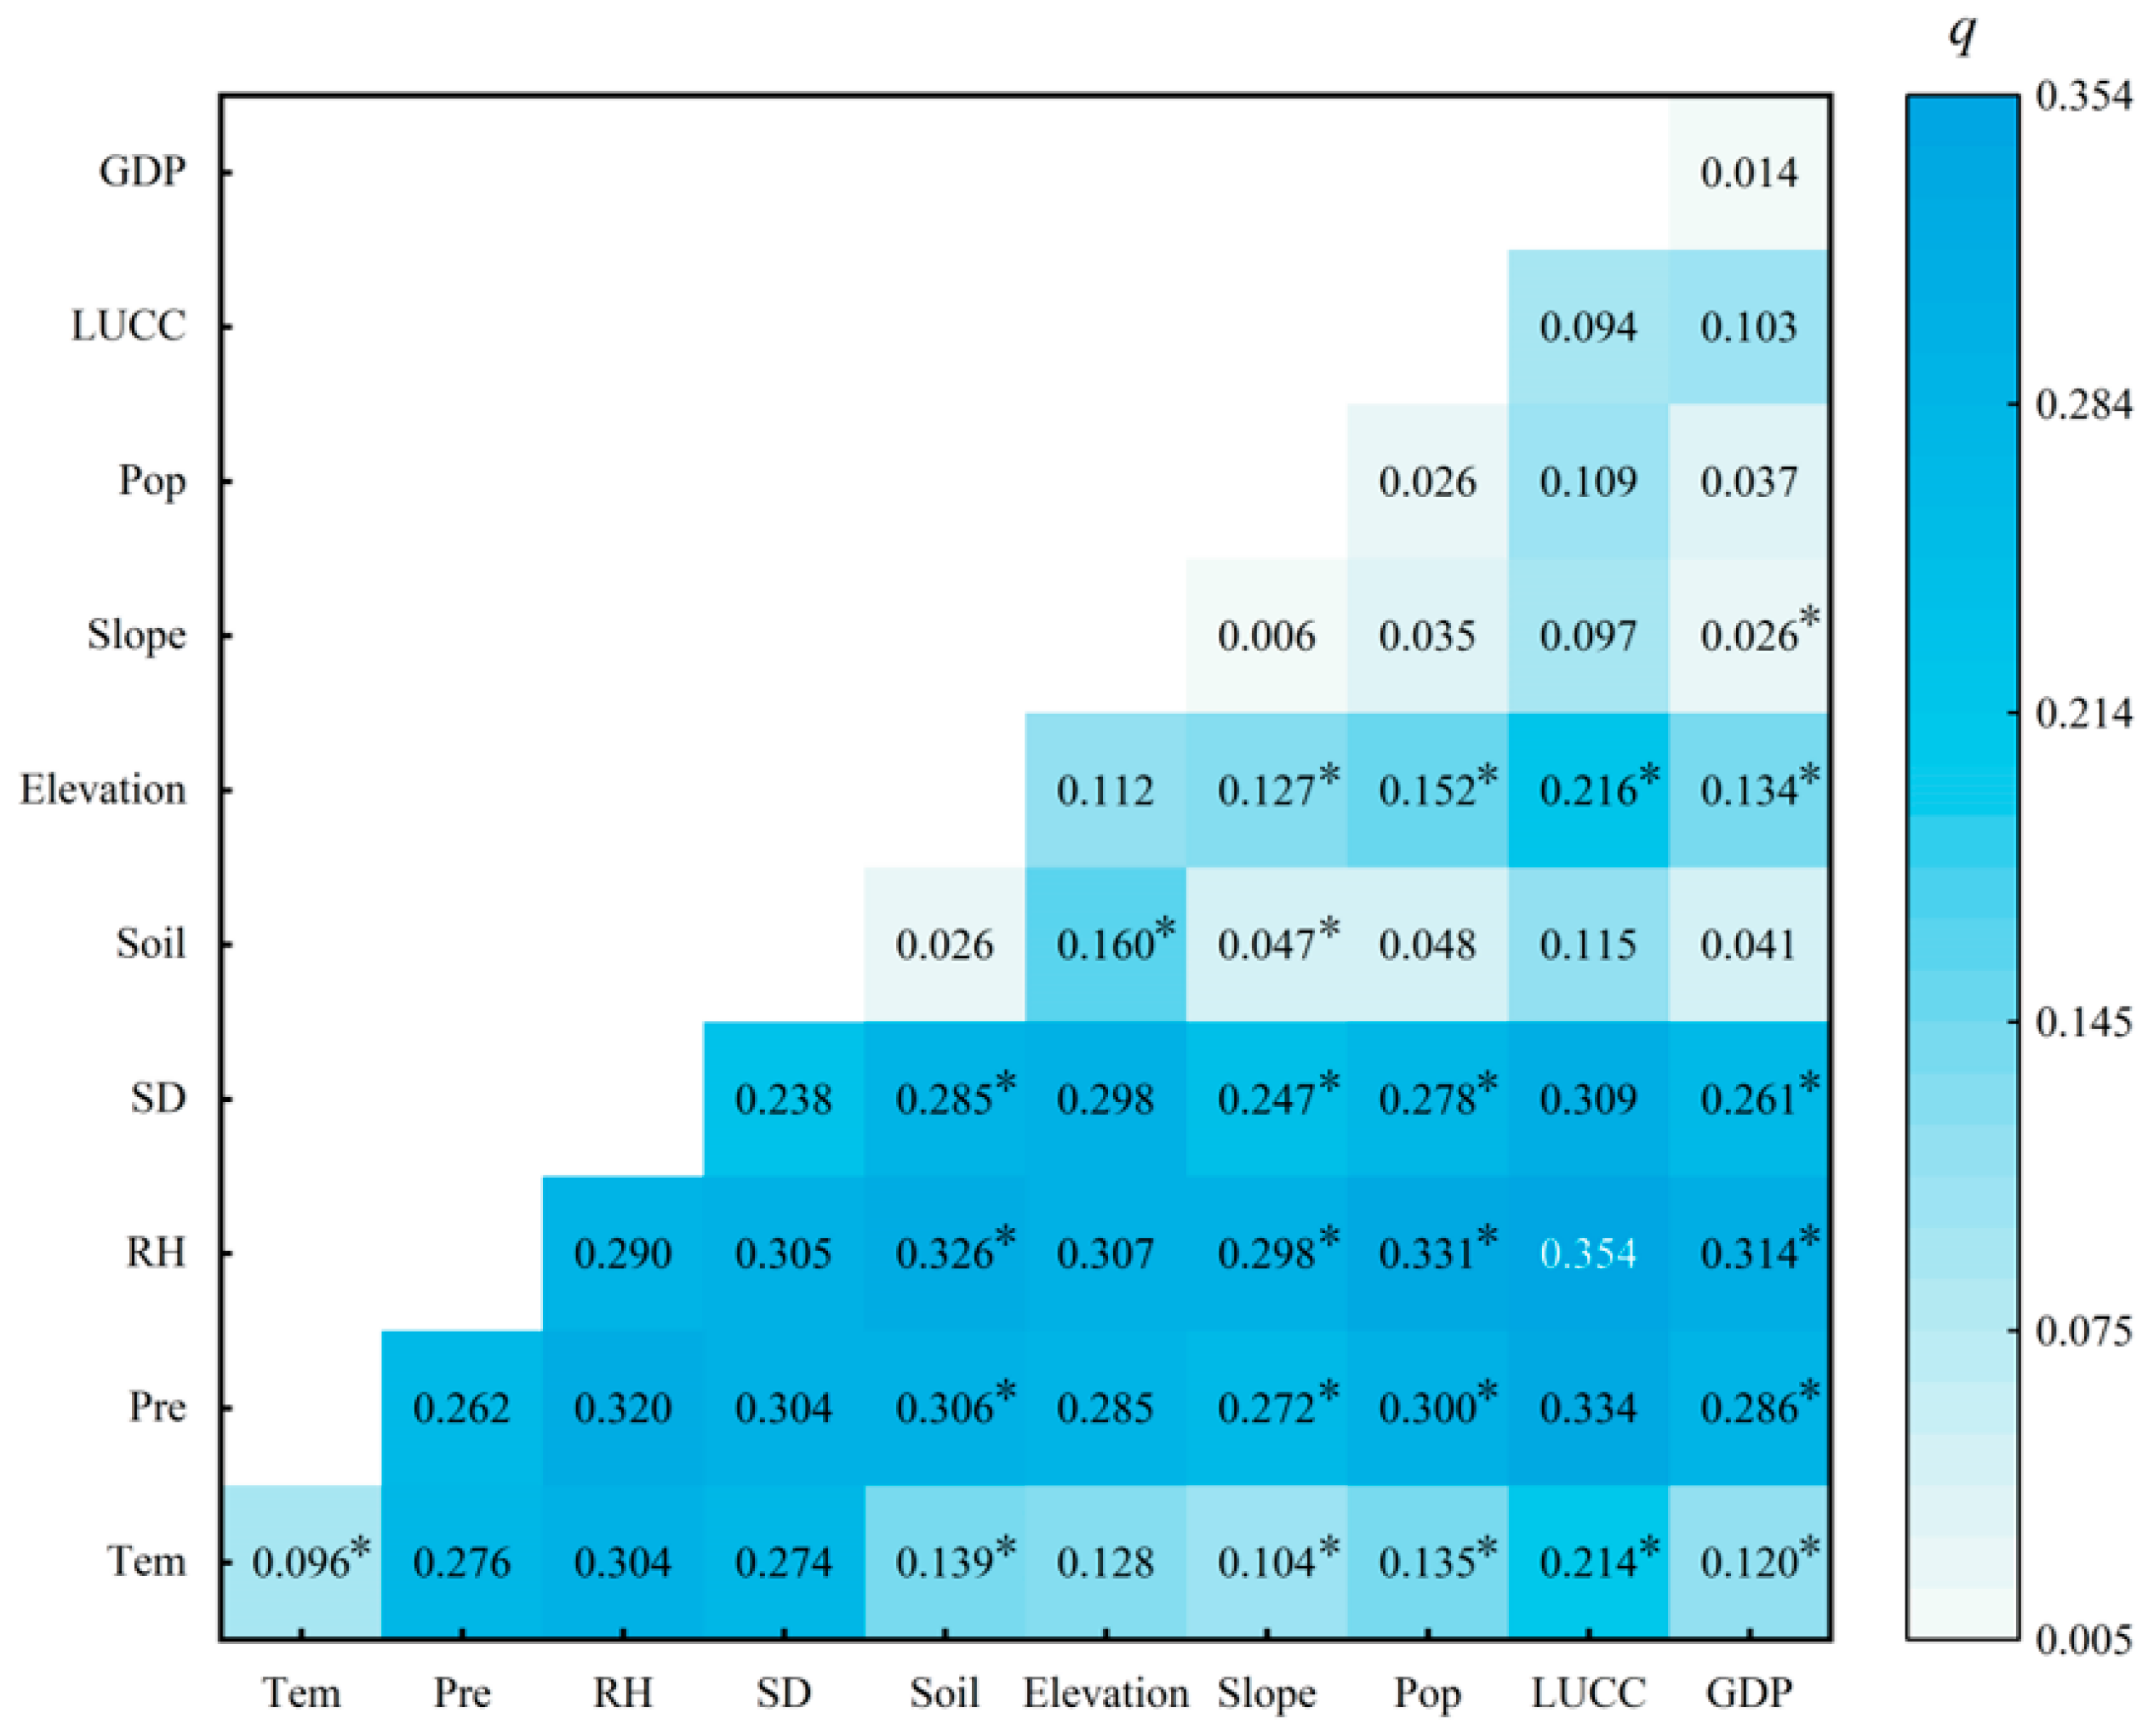
The interaction detector method revealed a significant interrelationship between the driving factors underlying changes in vegetation FVC, as shown in Figure 12. After two interactions, the factors had an enhanced effect on FVC, indicating that their effects were synergistic rather than independent. The effects of interaction were classified into two categories, two-factor enhancement and nonlinear enhancement, which refer to the different ways that two factors can amplify each other’s impact. Nonlinear enhancement was found to be more prevalent and influential than two-factor enhancement. We applied the ecological detector method to examine the spatial variation in FVC across different combinations of factors (Table 9).
The strongest explanatory power occurred for the interaction between relative humidity and land use, which reached a two-factor interaction q value of 0.354 and there is a significant difference in the effect of their combination on the spatial distribution of FVC. The worst explanatory power was observed for the interaction of slope and GDP, which may have been due to the poor explanatory power of slope and GDP for FVC, and there is no significant difference in the effect of their combination on the spatial distribution of FVC; thus, insufficient explanatory power was observed for this two-factor interaction. Meanwhile, the combination of relative humidity with most of the factors produced higher q values, and there are significant differences in the effects of its combination with each of the other factors on the spatial distribution of FVC, with the lowest observed for the combination of relative humidity and slope, which reached 0.298. Slope and GDP interacted with most of the factors with low explanatory power.
The effects of each factor on the FVC spatial distribution were significantly different (Table 9). The spatial distribution of vegetation cover significantly differed between each pair of factors except for temperature with elevation, precipitation, and sunshine hours; soil type with GDP; elevation with temperature; slope with GDP; and population density with soil type, which did not lead to significant differences.

4.4.3. Risk Detector

The risk detector methodology can determine the average FVC value that corresponds to a specific range or category of factors known to exert an influence on vegetation growth (Figure 13). Among meteorological factors, increases in temperature led to a gradual increase in FVC and stable values, and the maximum FVC was observed at 9.9–10.5 °C. As precipitation levels increased, an initial corresponding rise in FVC values was observed, followed by a decline. The maximum FVC value was recorded within a precipitation range of 620–634 mm. Similarly, increases in relative humidity led to an increase in FVC, with the maximum reached at 56–57% relative humidity. Increases in sunshine hours led to a decrease in FVC, and the maximum was reached at 18.6–19.3 h of sunshine. Thus, the suitable growth conditions for vegetation in the Yan River Basin include low insolation, high rainfall, and high humidity.
Among surface factors, different soil types corresponded to the FVC in the Yanhe basin. Vegetation cover was greatest for black clay soil, indicating that black clay soil is most suitable for vegetation growth.
As elevation increased, the FVC fluctuated and then decreased, and the maximum was reached at 1088–1205 m. As the slope increased, FVC fluctuated, and the maximum was reached at 22–27°. The fact that elevation possesses a larger q value in comparison to slope suggests that among surface factors, elevation is the primary driver of vegetation change within the Yan River Basin.
Among human activity factors, as population density increased, FVC showed a decreasing trend followed by a small increase, and the maximum was reached at a population density of 0–1122 persons/km2. With different land use types, the FVC in the Yan River Basin differed, and the largest FVC value corresponded to the shrub land use type. With increases in GDP, FVC initially decreased and then gradually fluctuated, and the maximum was observed when the GDP value was 0–18.7 million CNY. Therefore, the suitable growth conditions for vegetation in the Yan River Basin include a low population density, low GDP, and the shrub land use type.

5. Discussion

5.1. Impacts of Climate Change on Vegetation Cover Change

Prior research has established that vegetation cover has significantly improved within the Yan River Basin over time [42,43]. Water scarcity limits the vegetation development in the arid region of the Loess Plateau [44]. As the fundamental source of water for vegetation growth, precipitation exerts a delayed influence on vegetation and plays a crucial role in determining vegetation cover [45]. The semi-arid climate of the Yan River Basin results in vegetation that is sensitive to changes in water supply. The factor detector methodology revealed that relative humidity and precipitation in the study region presented q values of 29% and 26.2%, respectively, with both factors exhibiting a gradual increase in influence from northwest to southeast. Precipitation enhances plant growth by activating plant physiology and biochemistry, increasing soil moisture, and improving plant health [46]. As a result, the vegetation in the basin exhibited a gradual geographical differentiation pattern and transitioned from forest to forest-steppe, to typical grassland, and finally to desert grassland based on precipitation levels. Moreover, the results obtained through the application of the interaction detector revealed that the combined influence of relative humidity and temperature, when considered in conjunction with other factors, served to amplify the overall impact of these factors on vegetation. In areas with relatively high precipitation levels, favorable moisture conditions were provided for vegetation growth. Sunshine hours had a q value of 23.8%, which is because sunshine is essential for photosynthesis. Therefore, the duration of light exposure can be considered to exert a direct influence on the growth and development of vegetation. The most important factor affecting FVC was the interaction of precipitation, humidity, and sunshine. Sunlight could also affect precipitation, which could change the relative humidity and the spatial variation and development of vegetation, with implications for the ecosystem dynamics [47].
Temperature is well known to have a positive effect on vegetation cover. This influence is primarily manifested through the extension of the growing period and the enhancement of photosynthetic processes and water use efficiency in plants. These factors collectively contribute to promoting plant growth and overall ecosystem productivity. For instance, the average temperature in Yanchang County was higher than that of Jingbian County, which could account for the observed differences in vegetation cover between the two counties. Moreover, areas with excessively high temperatures may experience negative impacts on vegetation growth because higher temperatures can accelerate plant transpiration, reduce soil moisture levels, increase evaporation rates, and inhibit photosynthesis, all of which can be detrimental to vegetation growth [48]. Previous research has indicated that rainfall is the main driver of vegetation growth in arid regions, while temperature is more influential in semi-humid regions. In semi-arid regions, both temperature and rainfall play significant roles in influencing vegetation growth [49].
Elevation, as a key topographic factor, has been shown to influence plant growth and physiological metabolism through its effects on environmental variables, such as light, temperature, and precipitation. These changes can subsequently impact vegetation cover [50]. In the Yan River Basin, for example, vegetation cover exhibited an initial gentle increase followed by a significant downward trend with increasing elevation. This indicates that elevation influences vegetation development.

5.2. Impact of Human Activities on Changes in Vegetation Cover

Besides meteorological factors, vegetation cover change is also driven by human activities, such as land use change due to arable land expansion, urbanization, and afforestation. Land use analysis in the Yan River Basin from 2001 to 2020 showed significant changes in forests, grasslands, and croplands, with a forest area increase of 776.29 km2 (Table 10). The majority of the increase in forested areas was transferred from grasslands and croplands. Vegetation cover increased significantly in most parts of the basin, especially in the central and northern areas of the middle reaches, after the implementation of the farmland-to-forest and grassland conversion project in 1999. This indicates that human activities have enhanced vegetation cover, as supported by previous studies. For example, He et al. found that urbanization and economic development in the Yellow River Basin of Shaanxi improved the ecological environment and vegetation growth. The most notable increase in vegetation cover was observed in the northern Shaanxi areas, where forest and grassland restoration efforts were undertaken [43]. The Yellow River Basin of Shaanxi has experienced a major trend of synergistic development between economic and ecological quality. This indicates that human interventions, such as farmland-to-forest and grassland conversion and soil and water conservation projects, have been essential for improving vegetation growth and ecosystem health in northern Shaanxi [34]. However, it is important to note that human activities can also negatively impact vegetation cover. For example, Yan’an has implemented a project to expand and develop the city by creating a flat mountain [51]. This project is the world’s largest geotechnical project, and it is being conducted in a wet sink loess gully area. The speed and intensity of action far exceed the geological force; thus, it has had a large impact on the geological environment and greatly impacted vegetation cover. Land use change due to reforestation projects and urban expansion will disturb and alter the regional ecological environment to varying extents in the long term.

5.3. Suitable Intervals for Vegetation Growth

Using the risk detector, we determined the optimal range or type of environmental factors for vegetation growth based on the highest mean FVC (Table 11). The factor interval with the highest mean FVC indicated the best condition for enhancing vegetation growth [52]. The suitable growth conditions for vegetation in the Yan River Basin included low sunlight, high rainfall, and high humidity. The FVC was greatest at elevations of 1088–1205 m and slopes of 22–27° when the soil type was black clay, which is probably due to the reduced human activity in areas with high altitude and steep terrain. In addition, the three anthropogenic factors also showed significant differences in their effects on FVC, with the vegetation being suitable for low population density and low GDP environments and the shrub land use type being most suitable for vegetation growth.

5.4. Limitations and Prospects

We analyzed the spatial and temporal variation in FVC in the Yan River Basin at the basin scale, using the GEE platform, Landsat series Earth observation data, and Geodetectors. We also quantitatively explored the driving relationships among meteorological, surface, and human activity factors. Despite utilizing high-quality remote sensing data and employing well-established analytical models, however, the results of this study may have some errors due to certain factors, such as the displacement of remote sensing sensors, complex meteorological conditions, topographical variations, and model selection biases [53]. Although this study included difficult-to-quantify human activity variables (LUCC, population density, and GDP) in the factor analysis, the diversity of human activities and the difficulty of quantification mean that the driving relationship of these factors on FVC and their interaction with other factors have not been fully revealed in the research results. This study concludes that vegetation restoration in the Yan River Basin must consider local natural conditions and socioeconomic development under future climate change scenarios. Moreover, protection and restoration plans should be formulated in a scientifically rigorous and objective manner and incorporate robust legal constraints to ensure a balance among water, food, and ecological security and realize the national “carbon neutral” strategy for promoting sustainable regional development.

6. Conclusions

We analyzed the spatial and temporal patterns and changes in vegetation cover in the Yan River Basin over the past two decades using an enhanced three-dimensional vegetation cover model. We also used a geographic probe to quantify the spatial heterogeneity of FVC in the Yan River Basin. Our study incorporated human activity variables, including land use patterns, population density, and GDP, which are often challenging to quantify, into the factor analysis process and considered the interactions among these factors. We summarize the results as follows.
  • Three-dimensional FVC has better accuracy than FVC. Three-dimensional FVC has higher regression coefficients and lower RMSE, which indicates that 3DFVC is better than FVC in vegetation cover extraction. In addition, 3DFVC is better than FVC for the Yanhe River Basin, which has complex topography.
  • The FVC in the Yan River Basin varied significantly over time from 2001 to 2020, with an overall significant but gradually increasing trend (S = 0.01/a, p < 0.01). The year 2013 was identified as the time change point. The overall FVC increased significantly and rapidly before 2013 (S = 0.0152/a, p < 0.01) and showed a significant slow-increasing trend after 2013 (S = 0.0015/a). We found that the vegetation cover in the Yan River Basin improved significantly, as shown by the increasing proportion of areas with high and relatively high FVC. The main reason for the increase in vegetation cover was the enhanced growth of medium FVC. Among the counties (districts), the FVC in Ansai District had the fastest growth rate in 20 years and presented a highly significant growth trend, while Jingbian County had the slowest growth rate.
  • Our analysis of the spatial distribution of FVC within the Yan River Basin from 2001 to 2020 revealed a pattern of gradually increasing spatial distribution from north to south, with significant differences observed between these regions. High-value areas were primarily located in Zhidan County, southern Ansai District, southern Baota District, and the eastern and western parts of southern Yanchang County, with Yanchang County exhibiting the most favorable vegetation cover. We found that the FVC of all counties (districts) in the Yan River Basin mainly increased, as shown in 83.9% of the area, especially in the upper and middle reaches. This indicates the effectiveness of the project of returning farmland to forest and grassland. The FVC in the river basin fluctuated considerably over the past two decades, and our analysis suggests that the FVC in the Yan River Basin will likely increase further in the future.
  • The main factors causing spatial variation in FVC from 2001 to 2020 were relative humidity and rainfall, which had an explanatory power of over 25%. The spatial variation in the imaged FVC was mainly influenced by climate factors. Anthropogenic LUCC (mainly decreasing arable and grassland areas and increasing forest areas) was also a key driver of spatial and temporal changes in vegetation cover and differences. Most of the interactions between drivers were linear or nonlinear enhancement, with the strongest interaction being relative humidity and land use, which explained 35.4% of the variation. The suitable growth conditions for Yan River Basin vegetation included low sunlight, high rainfall, high humidity, 1088–1205 m elevation, 22–27° slope, black clay soil, low population density, low GDP, and shrub land use type.
This paper can quantify the effects of multiple factors on the spatial heterogeneity of vegetation, thus offering a scientific reference for realizing ecological civilizations, sustainable development, and ecological protection in watersheds.

Author Contributions

Project administration and funding acquisition, F.Q.; writing—review and editing, F.Q.; writing—original draft and methodology, Z.H.; investigation, T.Y., Y.C., W.M. and M.X. All authors have read and agreed to the published version of the manuscript.

Funding

This study was supported by the High-Resolution Satellite Project of the State Administration of Science, Technology, and Industry for National Defense of the PRC, grant number 80-Y50G19-9001-22/23; the National Science and Technology Platform Construction Project, grant number 2005DKA32300; the Key Projects of National Regional Innovation Joint Fund, grant number U21A2014; the Major Research Projects of the Ministry of Education, grant number 16JJD770019; and the Open Program of Collaborative Innovation Center of Geo-Information Technology for Smart Central Plains Henan Province, grant number G202006.

Data Availability Statement

Not applicable.

Conflicts of Interest

The authors declare no conflict of interest.

References

  1. Jin, K.; Wang, F.; Han, J.; Shi, S.; Ding, W. Contribution of climatic change and human activities to vegetation NDVI change over China during 1982–2015. Acta Geogr. Sin. 2020, 75, 961–974. [Google Scholar]
  2. Gitelson, A.A.; Kaufman, Y.J.; Stark, R.; Rundquist, D. Novel algorithms for remote estimation of vegetation fraction. Remote Sens. Environ. 2002, 80, 76–87. [Google Scholar] [CrossRef]
  3. Liu, M.; Liu, Y.; Chen, M.; Li, Q.; Liang, Q.; Zou, J.; Qiaolipanguli, T. Spatiotemporal Evolution of Vegetation Coverage and Its Response to Climate Change in Upper Reaches of Ganjiang River Basin during 2000–2018. Bull. Soil Water Conserv. 2020, 40, 284–290. [Google Scholar]
  4. Guo, M.; Zhang, T.; Zhang, J.; Chen, L.; Zhang, X. Response of Vegetation Coverage to Climate Change in the Loess Plateau in 1982–2006. Res. Soil Water Conserv. 2014, 21, 35–40, 48. [Google Scholar]
  5. Wang, H.; Chen, W.; He, L.; Li, H. Responses of aquatic vegetation coverage to interannual variations of water level in different hydrologically connected sub -lakes of Poyang Lake, China. Yingyong Shengtai Xuebao 2022, 33, 191–200. [Google Scholar] [PubMed]
  6. Wang, W.; Hu, P.; Wang, J.; Yang, Z.; Liu, H.; Yang, Q. Response of Vegetation Cover and Structure to Meteorological and Hydrologic Factors in Zhalong Wetland. J. Hydroecol. 2020, 41, 89–97. [Google Scholar]
  7. Deng, B.; Chen, H.; Li, H.; Lei, S. Influence of dump vegetation coverage and topographic changes on soil and water loss in drainage basin. Coal Sci. Technol. 2022, 50, 299–308. [Google Scholar]
  8. Xu, H.; He, H.; Huang, S. Analysis of fractional vegetation cover change and its impact on thermal environment in the Hetian basinal area of County Changting, Fujian Province, China. Acta Ecol. Sin. 2013, 33, 2954–2963. [Google Scholar]
  9. Liu, R.; Xu, L.; Feng, F.; Liu, Y.; Zhang, X. Spatiotemporal Variation of Vegetation Coverage in Wuhai City from 2000 to 2018. Res. Soil Water Conserv. 2022, 29, 265–273. [Google Scholar]
  10. Qin, W.; Zhu, Q.; Zhang, X.; Li, W.; Fang, B. Review of vegetation covering and its measuring and calculating method. J. Northwest Sci-Tech Univ. Agric. For. 2006, 34, 163–170. [Google Scholar]
  11. Li, M.; Wu, B.; Yan, C.; Zhou, W. Estimation of Vegetation Fraction in the Upper Basin of Miyun Reservoir by Remote Sensing. Resour. Sci. 2004, 26, 153–159. [Google Scholar]
  12. Cheng, H.; Zhang, W.; Chen, F. Advances In Researches on Application of Remote Sensing Method to Estimating Vegetation Coverage. Remote Sens. Land Resour. 2008, 20, 13–18. [Google Scholar]
  13. Peng, W.; Wang, G.; Zhou, J.; Xu, X.; Luo, H.; Zhao, J.; Yang, C. Dynamic monitoring of fractional vegetation cover along Minjiang River from Wenchuan County to Dujiangyan City using multi-temporal landsat 5 and 8 images. Acta Ecol. Sin. 2016, 36, 1975–1988. [Google Scholar]
  14. Li, D.; Fan, J.; Wang, J. Change characteristics and their causes of fractional vegetation coverage(FVC) in Shaanxi Province. Chin. J. Appl. Ecol. 2010, 21, 2896. [Google Scholar]
  15. Li, M.; Yan, Q.; Li, G.; Yi, M.; Li, J. Spatio-Temporal Changes of Vegetation Cover and Its Influencing Factors in Northeast China from 2000 to 2021. Remote Sens. 2022, 14, 5720. [Google Scholar] [CrossRef]
  16. Chen, S.; Wen, Z. Zonal Species Distribution Response to Climate Change in Yanhe River Catchment. J. Soil Water Conserv. 2011, 25, 157–161. [Google Scholar]
  17. Zhao, J.; Van Oost, K.; Chen, L.; Govers, G. Moderate topsoil erosion rates constrain the magnitude of the erosion-induced carbon sink and agricultural productivity losses on the Chinese Loess Plateau. Biogeosciences 2016, 13, 4735–4750. [Google Scholar] [CrossRef]
  18. Zhang, F.; Yang, L.; Yang, Y. Change of Vegetation NDVI and Its Response to Climatic and Human Activities in the Loess Plateau During 1981–2016. Res. Soil Water Conserv. 2023, 30, 230–237. [Google Scholar]
  19. Zhang, C.; Bai, Z.; Li, X.; Ran, Q.; Wei, Z.; Lei, T.; Wang, N. Spatio-temporal evolution and attribution analysis of human effects of vegetation cover on the Loess Plateau from 2001 to 2018. Arid Land Geogr. 2021, 44, 188–196. [Google Scholar]
  20. Xuan, Y.; Shuai-zhi, K.; Yong-hua, Z.; Lei, H.; Xi-ming, X.; Fan, L. Spatio-temporal relationship between vegetation restoration and ecosystem services in the Loess Plateau of Northern Shaanxi, China. Chin. J. Appl. Ecol. 2022, 33, 2760–2768. [Google Scholar]
  21. Xie, H.; Tong, X.; Li, J.; Zhang, J.; Liu, P.; Yu, P. Changes of NDVI and EVI and their responses to climatic variables in the Yellow River Basin during the growing season of 2000–2018. Acta Ecol. Sin. 2022, 42, 4536–4549. [Google Scholar]
  22. Chen, C.; Wang, Y.; Li, Y.; Zhou, S. Vegetation Changes and Influencing Factors in Different Climatic Regions of Yellow River Basin from 1982 to 2015. J. Yangtze River Sci. Res. Inst. 2022, 39, 56–62, 81. [Google Scholar]
  23. Zhang, J.; Li, C.; Wang, T. Dynamic Changes of Vegetation Coverage on the Loess Plateau and Its Factors. Res. Soil Water Conserv. 2022, 29, 224–230, 241. [Google Scholar]
  24. Zhang, J.; Hu, A.; Zhang, D. Vegetation coverage variation in Loess Plateau Area of Shaanxi-Gansu-Ningxia. J. Northwestern Teach. Univ. Nat. Sci. Ed. 2021, 57, 71–76. [Google Scholar]
  25. Maes, J.; Egoh, B.; Willemen, L.; Liquete, C.; Vihervaara, P.; Schagner, J.P.; Grizzetti, B.; Drakou, E.G.; La Notte, A.; Zulian, G.; et al. Mapping ecosystem services for policy support and decision making in the European Union. Ecosyst. Serv. 2012, 1, 31–39. [Google Scholar] [CrossRef]
  26. Qian, C.; Gong, J.; Zhang, J.; Liu, D.; Ma, X. Change and tradeoffs-synergies analysis on watershed ecosystem services: A case study of BailongjiangWatershed, Gansu. Acta Geogr. Sin. 2018, 73, 868–879. [Google Scholar]
  27. He, Q.; Wang, M.; Liu, K.; Jiang, Z. GPRChinaTemp1km: A high-resolution monthly air temperature dataset for China (1951–2020) based on machine learning. Copernic. GmbH 2021, 1–29. [Google Scholar] [CrossRef]
  28. Zhao, N.; Liu, Y.; Cao, G.; Samson, E.L.; Zhang, J. Forecasting China’s GDP at the pixel level using nighttime lights time series and population images. Mapp. Sci. Remote Sens. 2017, 54, 407–425. [Google Scholar] [CrossRef]
  29. Yang, J.; Huang, X. The 30 m annual land cover dataset and its dynamics in China from 1990 to 2019. Earth Syst. Sci. Data 2021, 13, 3907–3925. [Google Scholar] [CrossRef]
  30. Yin, D.; Wang, Y. Temporal and spatial changes of vegetation coverage and its topographic differentiation in temperate continental semi-arid monsoon climate region. Acta Ecol. Sin. 2021, 41, 1158–1167. [Google Scholar]
  31. Qi, J.; Marsett, R.C.; Moran, M.S.; Goodrich, D.C.; Zhang, X.X. Spatial and temporal dynamics of vegetation in the San Pedro River basin area. Agric. For. Meteorol 2000, 105, 55–68. [Google Scholar] [CrossRef]
  32. Fu, H.; Wang, R.; Wang, X. Analysis of Spatiotemporal Variations and Driving Forces of NDVI in the Yellow River Basin during 1999–2018. Res. Soil Water Conserv. 2022, 29, 145–153, 162. [Google Scholar]
  33. Nie, T.; Dong, G.; Jiang, X.; Gu, J. Spatiotemporal Variation and Driving Forces of Vegetation Coverage in Yan′an Area. Res. Soil Water Conserv. 2021, 28, 340–346. [Google Scholar]
  34. Chen, Y.; Wang, W.; Guan, Y.; Liu, F.; Zhang, Y.; Du, J.; Feng, C.; Zhou, Y. An integrated approach for risk assessment of rangeland degradation: A case study in Burqin County, Xinjiang, China. Ecol. Indic. 2020, 113, 106203. [Google Scholar] [CrossRef]
  35. Sen, P.K. Estimates of the Regression Coefficient Based on Kendall’s Tau. J. Am. Stat. Assoc. 1968, 63, 1379–1389. [Google Scholar] [CrossRef]
  36. He, T.; Shao, Q. Spatial-temporal Variation of Terrestrial Evapotranspiration in China from 2001 to 2010 Using MOD16 Products. J. Geo-Inf. Sci. 2014, 16, 979–988. [Google Scholar]
  37. Wang, X.; Shi, S.; Chen, J. Change and driving factors of vegetation coverage in the Yellow River Basin. China Environ. Sci. 2022, 42, 5358–5368. [Google Scholar]
  38. Hurst, H. Methods of Using Long-Term Storage in Reservoirs. ICE Proc. 1956, 5, 519–543. [Google Scholar] [CrossRef]
  39. Nie, T.; Dong, G.; Jiang, X.; Lei, Y. Spatio-Temporal Changes and Driving Forces of Vegetation Coverage on the Loess Plateau of Northern Shaanxi. Remote Sens. 2021, 13, 613. [Google Scholar] [CrossRef]
  40. Wang, J.; Xu, C. Geodetector: Principle and prospective. Acta Geogr. Sin. 2017, 72, 116–134. [Google Scholar]
  41. Du, J.; Fu, Q.; Fang, S.; Wu, J.; He, P.; Quan, Z. Effects of rapid urbanization on vegetation cover in the metropolises of China over the last four decades. Ecol. Indic. 2019, 107, 105458. [Google Scholar] [CrossRef]
  42. Yue, M.; Geng, G.; Wang, T.; Yang, R.; Gu, Q. Spatiotemporal Variation of Vegetation NDVI and Its Driving Factors in theShaanxi Section of the Yellow River Basin from 2000 to 2019. Res. Soil Water Conserv. 2023, 30, 238–246, 255. [Google Scholar]
  43. He, H.; Wang, Z.; Dong, J.; Wang, J.; Zou, J. Synergy and trade-off between vegetation change and urbanization development in the Yellow River Basin of Shaanxi Province based on satellite remote sensing data. Acta Ecol. Sin. 2022, 42, 3536–3545. [Google Scholar]
  44. BAO, C.; FANG, C. Impact of Water Resources Exploitation and Utilization on Eco-environment in Arid Area: Progress and Prospect. Prog. Geogr. 2008, 27, 38–46. [Google Scholar]
  45. Xie, Y.; Xia, Z.; Wang, T.; Zhang, Z.; Zhu, D. Temporal and spatial variation of vegetation net primary product and its response to hydrothermal conditions and grain for green project in the Yellow River basin. Bull. Surv. Mapp. 2023, 0, 15–20. [Google Scholar]
  46. Chen, S.; Zhang, Q.; Chen, Y.; Zhou, H.; Xiang, Y.; Liu, Z.; Hou, Y. Vegetation Change and Eco-Environmental Quality Evaluation in the Loess Plateau of China from 2000 to 2020. Remote Sens. 2023, 15, 424. [Google Scholar] [CrossRef]
  47. Guo, B.; Wang, Y.; Pei, L.; Yu, Y.; Liu, F.; Zhang, D.; Wang, X.; Su, Y.; Zhang, D.; Zhang, B.; et al. Determining the effects of socioeconomic and environmental determinants on chronic obstructive pulmonary disease (COPD) mortality using geographically and temporally weighted regression model across Xi’an during 2014–2016. Sci. Total Environ. 2021, 756, 143869. [Google Scholar] [CrossRef]
  48. Dong, Y.; Yin, D.; Li, X.; Huang, J.; Su, W.; Li, X.; Wang, H. Spatial–Temporal Evolution of Vegetation NDVI in Association with Climatic, Environmental and Anthropogenic Factors in the Loess Plateau, China during 2000–2015: Quantitative Analysis Based on Geographical Detector Model. Remote Sens. 2021, 13, 4380. [Google Scholar] [CrossRef]
  49. Xie, B.; Jia, X.; Qin, Z.; Shen, J.; Chang, Q. Vegetation dynamics and climate change on the Loess Plateau, China: 1982–2011. Reg. Environ. Chang. 2016, 16, 1583–1594. [Google Scholar] [CrossRef]
  50. Bueno, M.L.; Rezende, V.L.; De Paula, L.F.A.; Meira-Neto, J.A.A.; Pinto, J.R.R.; Neri, A.V.; Pontara, V. Understanding how environmental heterogeneity and elevation drives the distribution of woody communities across vegetation types within the campo rupestre in South America. J. Mt. Sci.-Engl. 2021, 18, 1192–1207. [Google Scholar] [CrossRef]
  51. Pu, C.; Xu, Q.; Zhao, K.; Jiang, Y.; Guo, P.; Du, P.; Yuan, S. Remote sensing analysis of land subsidence and vegetation restoration characteristics in excavation and filling areas of mountain region for urban extension in Yan’an. J. Eng. Geol. 2020, 28, 597–609. [Google Scholar]
  52. Meng, X.; Gao, X.; Li, S.; Lei, J. Spatial and Temporal Characteristics of Vegetation NDVI Changes and the Driving Forces in Mongolia during 1982–2015. Remote Sens. 2020, 12, 603. [Google Scholar] [CrossRef]
  53. Dumka, U.C. A Long-Term Spatiotemporal Analysis of Vegetation Greenness over the Himalayan Region Using Google Earth Engine. Climate 2021, 9, 109. [Google Scholar]
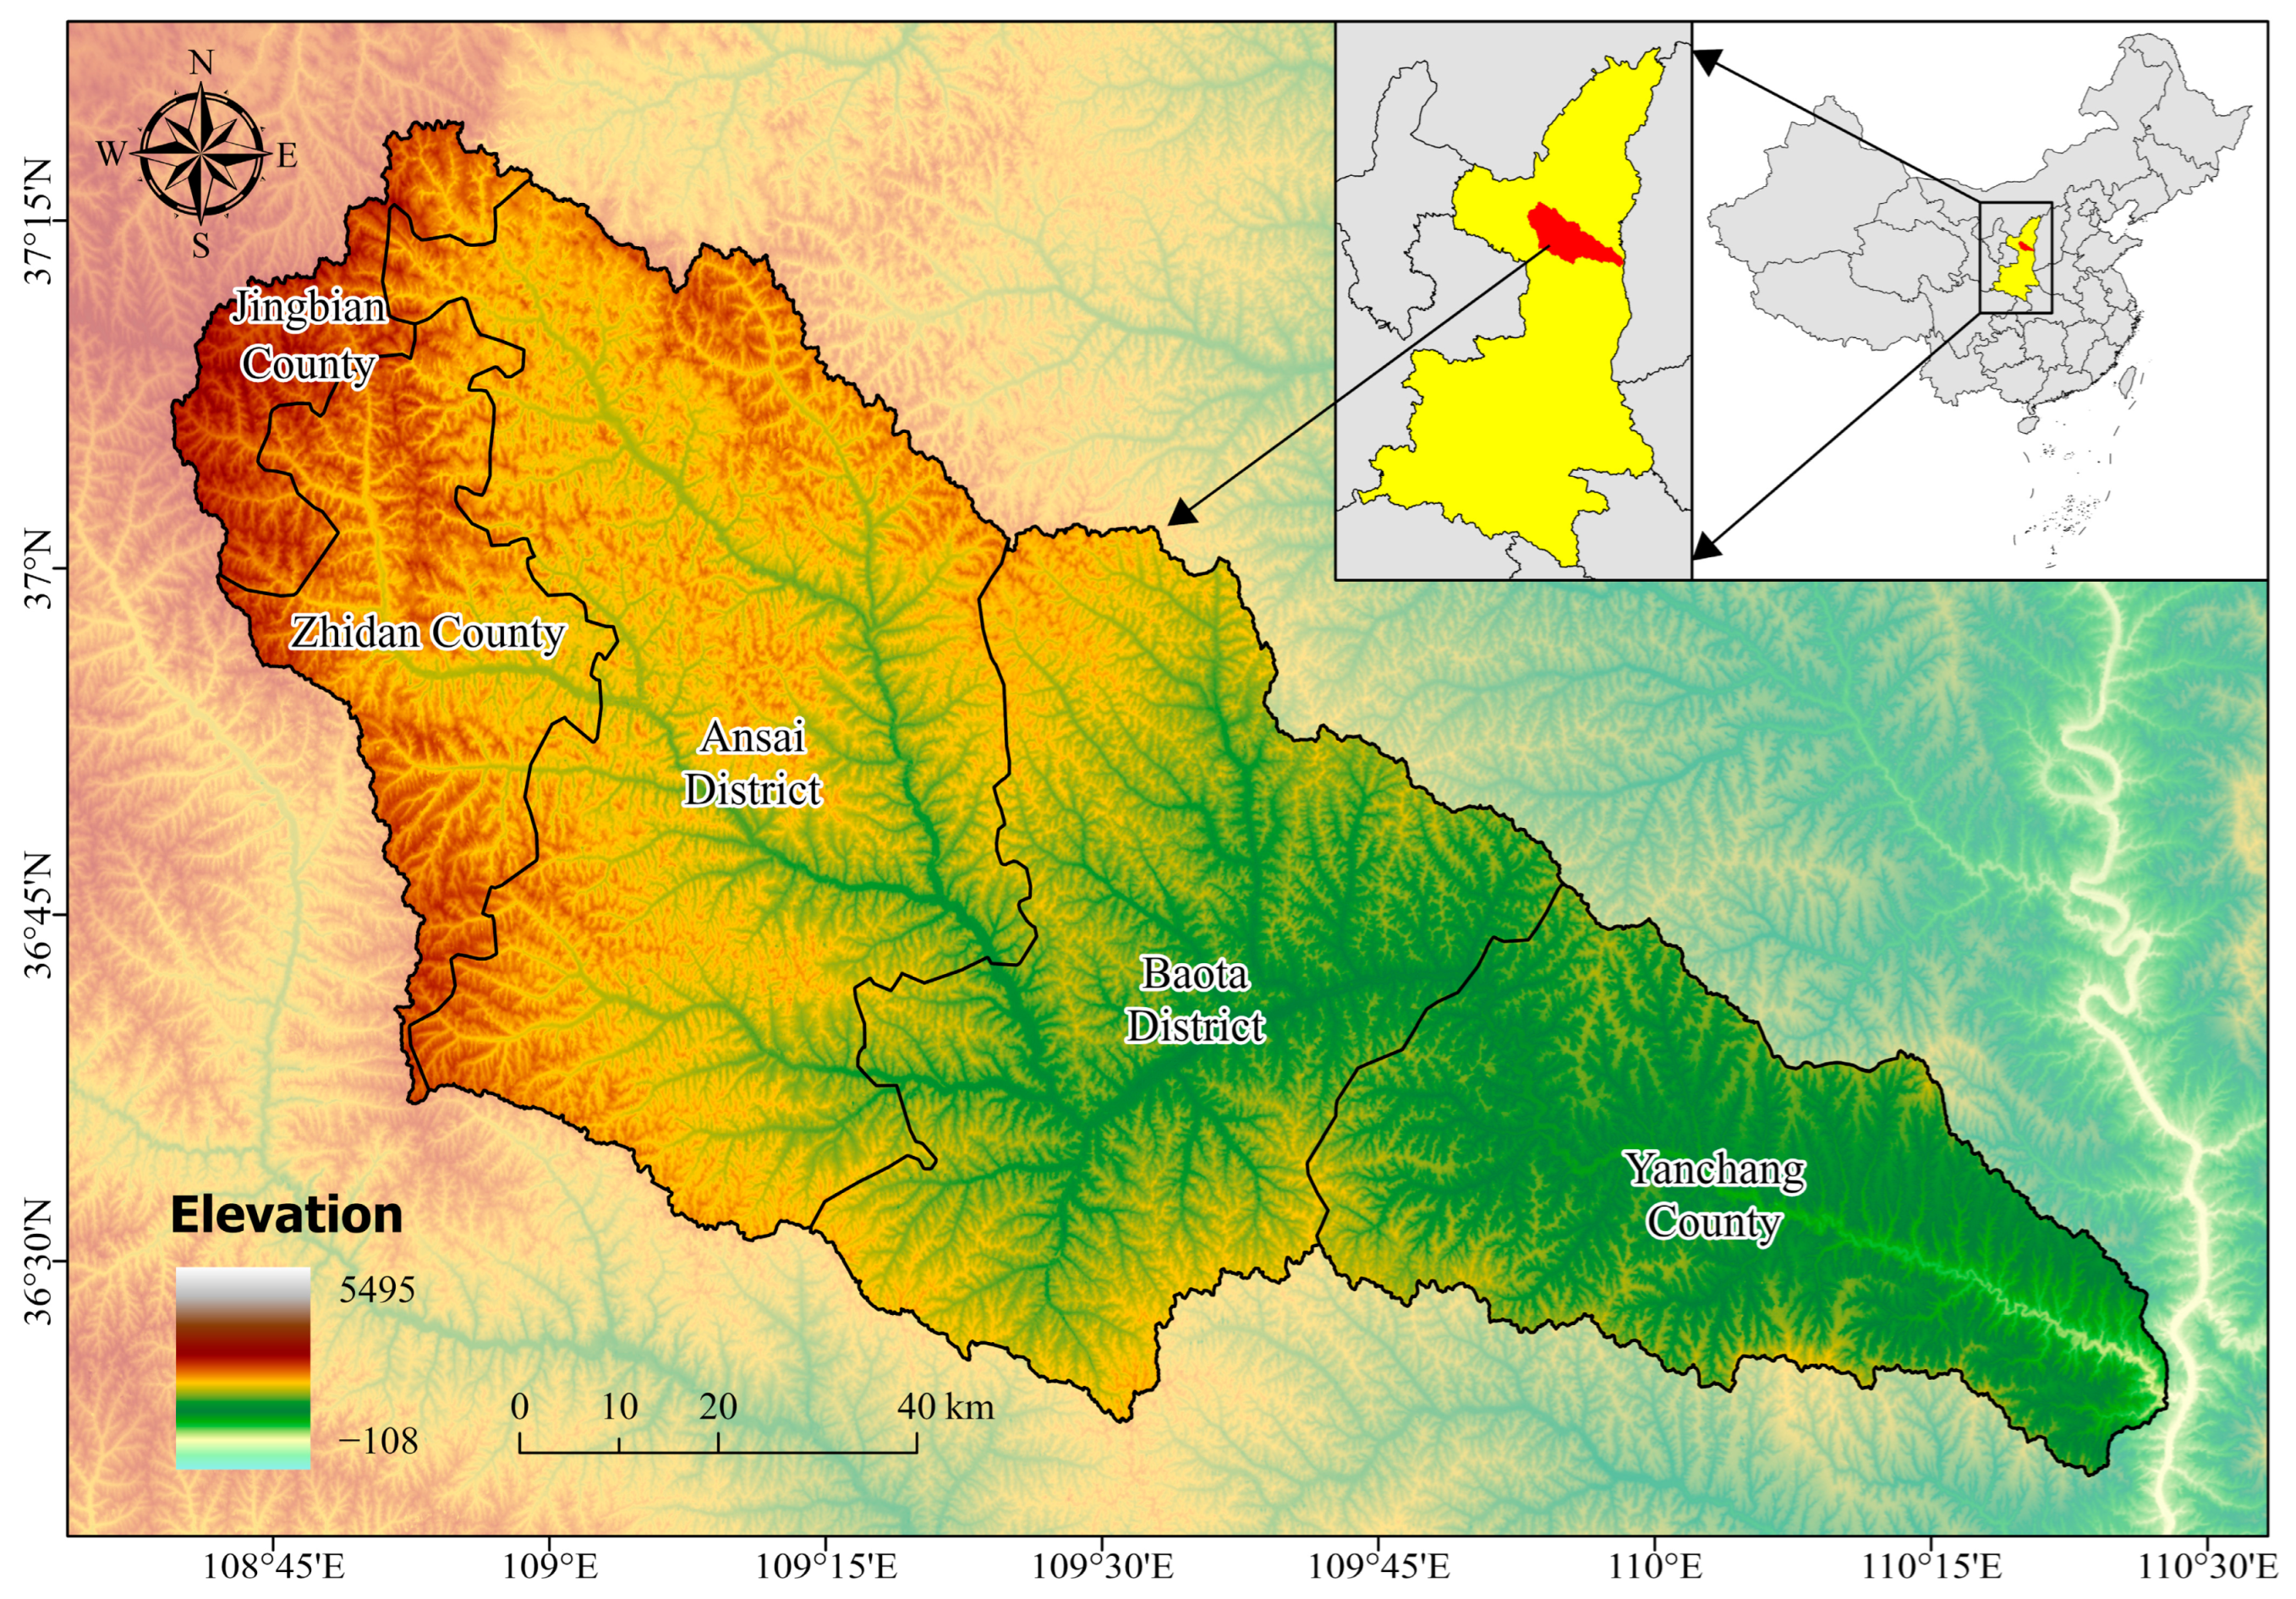
Figure 1. Location of the study area.
Remotesensing 15 04240 g001
Figure 2. Differential distribution of FVC and 3DFVC and slope distribution in the Yanhe River Basin.
Remotesensing 15 04240 g002
Figure 3. Accuracy comparison between 3DFVC and FVC.
Remotesensing 15 04240 g003
Figure 4. Temporal trends in vegetation cover in the Yanhe River Basin, 2001–2020.
Remotesensing 15 04240 g004
Figure 5. Area percentage of different classes of FVC in the Yan River Basin for 2001–2020.
Remotesensing 15 04240 g005
Figure 6. Temporal trends of vegetation cover in counties (districts) of the Yanhe River Basin, 2001–2020.
Remotesensing 15 04240 g006
Figure 7. Spatial distribution pattern of mean vegetation cover in the Yanhe River Basin, 2001–2020.
Remotesensing 15 04240 g007
Figure 8. Average area shares of vegetation cover classes in the Yanhe River Basin and its counties (districts), 2001–2020.
Remotesensing 15 04240 g008
Figure 9. Spatial distribution of average growth rates and overall trends in vegetation cover in the Yanhe River Basin, 2001–2020.
Remotesensing 15 04240 g009
Figure 10. Spatial distribution pattern of the degree of volatility of vegetation cover change in the Yanhe River Basin, 2001–2020.
Remotesensing 15 04240 g010
Figure 11. Spatial distribution patterns of the Hurst index of vegetation cover and its future trends in the Yanhe River Basin, 2001–2020.
Remotesensing 15 04240 g011
Figure 12. Interaction detector results. Values marked with * are non-linear enhancements; the remaining values are two-factor enhancements.
Remotesensing 15 04240 g012
Figure 13. Statistical results of FVC at each level for different impact factors.
Remotesensing 15 04240 g013
Table 1. Data sources.
Data CategoryData NameData ProductsResolutionData Source
ImageMODISMOD13Q1-NDVI250 mGoogle Earth Engine
(https://earthengine.google.com/, accessed on 22 March 2023)
LandsatLandsat 5/7/8 Surface Reflectance Tier 130 m
Meteorological dataTemperatureGPRChinaTemp1 km [27] 1 kmZenodo
(https://zenodo.org/, accessed on 22 March 2023)
Precipitation
Relative humidityChina Relative Humidity DatasetNational Earth System
Science Data Center
(www.geodata.cn, accessed on 22 March 2023)
Sunshine hoursChina Sunshine Hours Dataset
Surface dataSoilSoil Type1 kmResource and Environmental Science Data Center (www.resdc.cn, accessed on 22 March 2023)
DEMNASADEM30 mEARTHDATA
(www.earthdata.nasa.gov, accessed on 22 March 2023)
Human activity dataPopulation densityLandScan Global1 kmLandScan
(landscan.ornl.gov, accessed on 22 March 2023)
GDPChinaGDP [28] Zenodo
(https://zenodo.org/, accessed on 22 March 2023)
LUCCCLCD [29]30 m
Note: DEM, digital elevation model; LUCC, land use and cover change; CLCD, China Land Cover Dataset; GDP, gross domestic product.
Table 2. Vegetation cover class classification standard.
ClassClassification Criteria
Low0 ≤ 3DFVC < 0.2
Relatively low0.2 ≤ 3DFVC < 0.4
Medium0.4 ≤ 3DFVC < 0.6
Relatively high0.6 ≤ 3DFVC < 0.8
High0.8 ≤ 3DFVC < 1
Table 3. The coefficient of variation classification standard.
ClassClassification Criteria
Low variation 0   <   C v ≤ 0.05
Relatively low variation 0.05   <   C v ≤ 0.10
Medium variation 0.10   <   C v ≤ 0.15
Relatively high variation 0.15   <   C v ≤ 0.20
High variation C v > 0.20
Table 4. Hurst index classification criteria.
Type of Trend ChangeJudgment Basis
Anti-Continuity0 < H < 0.5
IndependenceH = 0.5
Sustainability0.5 < H < 1
Table 5. Role of the Geodetector modules.
Detector TypeFunction
Factor detectorInvestigating the spatial heterogeneity of Y and its dependence on factor X
Interaction detectorsInteraction between different influences on X and independent variables was identified
Risk detectorDetermining the significance of the difference in the mean values of the attributes between the two subregions
Ecological detectorComparing the significance of the difference between the effects of factors X1 and X2 on the spatial distribution of attribute Y
Table 6. Drivers of vegetation cover.
Factor CategoryDriving FactorUnit
Meteorological factorTemperature°C
Precipitationmm
Relative humidity%
Sunshine hoursh
Surface factorSoil-
DEMm
Slope°
Human activity factorPopulation densitypersons/km2
GDPmillion CNY
LUCC-
Table 7. Transfer matrix for different classes of FVC in the Yan River Basin, 2001–2020 (km2).
20012020
LowRelatively LowMediumRelatively HighHighTotalTransfer out
Low36.804.195.172.830.5649.5512.75
Relatively low17.67123.39153.56102.6222.15419.40296.00
Medium118.72775.342204.431788.05424.645311.183106.76
Relatively high52.45150.26520.22694.47208.221625.62931.15
High2.119.9744.63104.9479.20240.85161.65
Total227.761063.162928.002692.92734.76
Transfer to190.96939.77723.581998.45655.57
Amount of change178.21643.76−2383.181067.29493.91
Table 8. Decision value q of each driving factor.
FactorTemPreRHSDSoilElevationSlopePopLUCCGDP
q0.0960.2620.2900.2380.0260.1120.0060.0260.0940.014
p0.0000.0000.0000.0000.0000.0000.0000.0000.0000.000
Note: Tem, temperature; Pre, precipitation, RH, relative humidity; SD, sunshine duration; Pop, population density; LUCC, land use and cover change; GDP, gross domestic product.
Table 9. Statistical significance of the detection factors.
FactorTemPreRHSDSoilElevationSlopePopLUCCGDP
Tem
PreY
RHYY
SDYNY
SoilYYYY
ElevationNYYYY
SlopeYYYYYY
PopYYYYNYY
LUCCYYYYYYYY
GDPYYYYNYNYY
Note: Tem, temperature; Pre, precipitation, RH, relative humidity; SD, sunshine duration; Pop, population density; LUCC, land use and cover change; GDP, gross domestic product. Y stands for significant; N stands for not significant.
Table 10. LUCC transfer matrix for the Yan River Basin from 2001 to 2020.
20012020
CroplandForestShrubGrasslandWaterBarrenImperviousTotalTransfer out
Cropland499.2443.500.20383.360.750.1523.23950.43451.18
Forest2.74502.260.201.250.000.000.03506.474.22
Shrub0.076.870.975.450.000.000.0013.3612.39
Grassland315.55730.085.305060.301.030.5010.066122.831062.53
Water0.480.050.000.092.620.000.313.560.94
Barren0.010.000.000.040.000.000.010.070.06
Impervious0.010.000.000.000.020.0026.5826.610.03
Total818.101282.766.665450.504.430.6660.21
Transfer to318.85780.515.70390.191.810.6633.64
Amount of change−132.33776.29−6.69−672.340.870.5933.61
Table 11. Factor suitability interval (at 95% confidence level).
FactorSuitable Type or Range of FVCFVC
Tem9.9–10.5 °C0.797
Pre620–634 mm0.811
RH56–57%0.834
SD18.6–19.3 h0.821
SoilBlack clay0.824
Elevation1088–1205 m0.794
Slope22–27°0.766
Pop0–1122 persons/km20.762
LUCCShrub0.834
GDP0–18.7 million CNY0.760
Note: FVC, fractional vegetation cover; Tem, temperature; Pre, precipitation, RH, relative humidity; SD, sunshine duration; Pop, population density; LUCC, land use and cover change; GDP, gross domestic product.
Disclaimer/Publisher’s Note: The statements, opinions and data contained in all publications are solely those of the individual author(s) and contributor(s) and not of MDPI and/or the editor(s). MDPI and/or the editor(s) disclaim responsibility for any injury to people or property resulting from any ideas, methods, instructions or products referred to in the content.