Abstract
The Sustainable Development Goals Science Satellite-1 (SDGSAT-1) Glimmer Imager for Urbanization (GIU) data is very sensitive to low radiation and capable of detecting weak light sources from vessels at night while significantly improving the spatial resolution compared to similar products. Most existing methods fail to use the relevant characteristics of vessels effectively, and it is difficult to deal with the complex shape of vessels in high-resolution Nighttime Light (NTL) data, resulting in unsatisfactory detection results. Considering the overall sparse distribution of vessels and the light source diffusion phenomenon, a novel vessel detection method is proposed in this paper, utilizing the high spatial resolution of the SDGSAT-1. More specifically, noise separation is completed based on a local contrast-weighted RPCA. Then, artificial light sources are detected based on a density clustering algorithm, and an inter-cluster merging method is utilized to realize vessel detection further. We selected three research areas, namely, the Bohai Sea, the East China Sea, and the Gulf of Mexico, to establish a vessel dataset and applied the algorithm to the dataset. The results show that the total detection accuracy and the recall rate of the detection algorithm in our dataset are 96.84% and 96.67%, which is significantly better performance than other methods used for comparison in the experiment. The algorithm overcomes the dataset’s complex target shapes and noise conditions and achieves good results, which proves the applicability of the algorithm.
1. Introduction
At present, achieving large-scale and long-term active monitoring of maritime vessels is an urgent task for improving maritime jurisdiction and safety internationally [1,2]. Optical remote sensing technology provides a long-distance and economical dynamic observation method, which has the advantages of a wide observation range and long observation time and can achieve large-scale and multi-element monitoring and analysis at sea [3]. Numerous research results have already been obtained in these areas at present [4,5,6,7]. However, traditional optical remote sensing relies on detecting sunlight reflection and cannot provide adequate nighttime data. As a new direction and cutting-edge hotspot in remote sensing development, the low-light remote sensing technology can detect weak light sources on the surface at night or dusk, compensate for the limitations of traditional optical remote sensing methods, and provide Nighttime Light (NTL) products [8,9]. Low-light remote sensing technology is expected to achieve nighttime vessel detection by capturing the light emitted by vessels at night. Currently, relevant research has demonstrated the potential of NTL images for detecting vessels at night [10,11].
Many researchers have designed methods for nighttime vessel detection according to the relevant characteristics of low-light remote sensing. Unlike traditional optical remote sensing, which mainly uses reflectivity to reflect surface features, low-light remote sensing detects artificial light sources on the surface to form radiation products [12]. This results in vessels displayed as “bright spots” in NTL data, such as pixels or small areas with higher radiance values than the surrounding background.
Therefore, some researchers designed detection methods based on radiance features. The main idea behind these methods is to control noise, suppress background, enhance contrast to highlight vessel lighting information in the preprocessing stage, and design more flexible threshold methods based on local statistical data in the vessel detection stage. For example, Elvidge et al. [13] first enhanced the contrast of features by logarithmically enhancing the radiance values during the preprocessing phase to highlight the vessel and then used a region-adaptive Weiner filter to flatten the noise of the entire strip. The Spike Median Index (SMI) was adopted in the vessel identification stage to further suppress light source diffusion and background noise by subtracting the regional median. Elvidge et al. [14] improved their method by determining the threshold with the average radiance value data corresponding to a set of maximum gradient values in the data, which overcomes the difficulty of threshold selection caused by local condition changes. They applied this method to the ship tracking [15,16] and fishery monitoring [14]. Lebona et al. [17] applied Constant False Alarm Rate (CFAR), an adaptive threshold method commonly used in Synthetic Aperture Radar (SAR) images, to nighttime remote sensing data. Zhong Liang et al. [18] proposed a vessel detection method based on a two-parameter CFAR [19] and conducted it on Luojia1-01 data. Guo Gang et al. [20] improved the feature enhancement of radiation differences between light fishing vessels and background pixels using SMI. Also, they designed threshold segmentation and local peak detection using the maximum entropy method.
Some researchers linked the relevant characteristics of vessels with natural phenomena and used empirical models to acquire more accurate radiance information. Kim Euihyun et al. [21] introduced the lunar phase into the preprocessing stage and calculated the bias parameter used for correction through an empirical model for lunar phase correction. Xue et al. [22] processed noise information through adaptive filtering and quantitatively calculated and compensated for the loss of light sources spreading by establishing atmospheric transmission and diffusion models.
Some researchers have applied deep learning methods to extract the relevant characteristics of the ship target automatically. For example, Shao et al. [23] proposed an improved YOLOv5 [24] algorithm and named it TASFF YOLOv5. This algorithm is designed based on the idea of multi-scale feature fusion to enhance the performance of small object detection. Motomura et al. [25] designed FishNet based on the image segmentation network U-net [26], adding temporal feature input to roughly estimate the number of vessels in the area. Liu et al. [27] proposed an improved Fast R-CNN [28] method, namely Scale Expansion Attention Fusion Fast R-CNN (SEAFF), to detect luminous vessels in complex backgrounds.
There are still many characteristics that could be improved in current research. Due to the lack of other relevant features, such as contour or textures, the current target detection algorithm based on the image features applied in computer vision is unsuitable for vessel recognition tasks in NTL data. The methods developed to utilize the brightness feature have limitations and result poorly in complex scenarios. The threshold selection is usually based on manual experience or local statistical data. The manually selected threshold is not flexible enough to cope with different actual situations of vessels’ artificial light sources; the threshold may be too high or too low in different areas, leading to detection errors. The local environment significantly interferes with the threshold determined by local statistical data. Establishing empirical models based on natural phenomena sounds promising but requires atmospheric models, atmospheric inversion products, and diffusion reference data. Most of these reference data lack nighttime records, significantly impacting model accuracy. Moreover, due to the complexity of the types of vessel light sources and the actual manual setting, the physical model designed based on the ideal situation is difficult to deal with, which may cause unreliable detection results. The idea of deep learning is currently not effectively adjusted based on the actual condition of lacking contour, texture, and other related features, resulting in the inability to obtain convincing results while consuming a large number of computational resources.
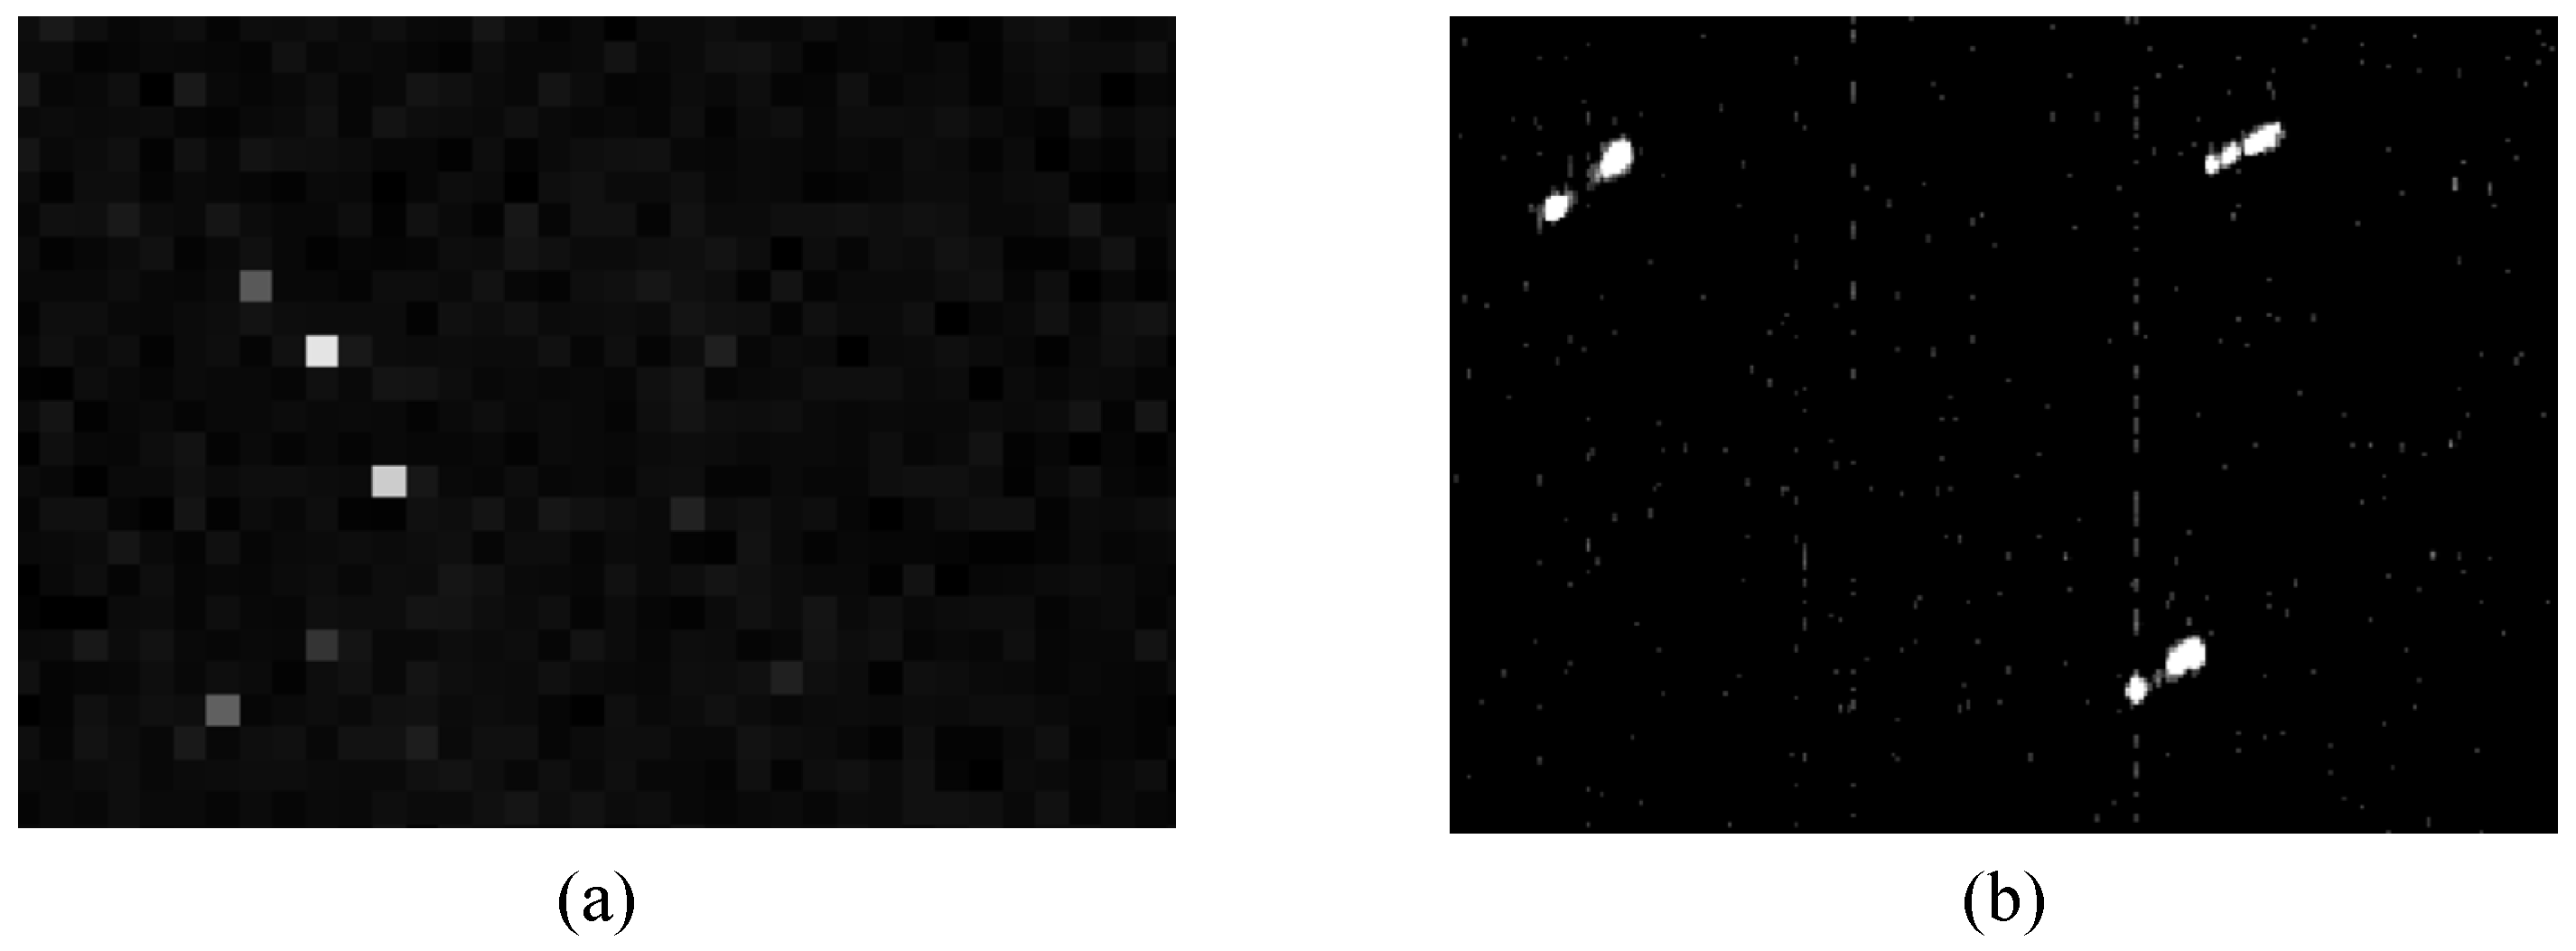
In addition, most of the other current methods are based on low-resolution NTL data and cannot be applied to higher-resolution data. For many years, the option for researchers to study low-light remote sensing was the U. S. Air Force Defense Meteorological Satellite Program (DMSP) Operational Linescan System (OLS) [12] and the Visible Infrared Imaging Radiometer Suite (VIIRS) Day/Night Band (DNB) data [29] provided by the SNPP and JPSS-1 satellites. The spatial resolution of OLS and DNB data is 3 km × 3 km [30] and 742 m × 742 m [31], respectively. This makes the vessel display a sub-pixel target, meaning that the vessel takes only one pixel. However, with the continuous development of low-light remote sensing technology, low-light remote sensing satellites with much higher spatial resolution, including Luojia1-01 [32] and Sustainable Development Goals Science Satellite-1 (SDGSAT-1) [33], have been launched and produced remote sensing data. The comparison under different resolution images of the vessel is shown in Figure 1. In high-resolution data, vessels are represented as a collection of 10 to 100-pixel-sized light source targets with irregular shapes, sometimes internally disconnected with multiple peak points. The detection object of the existing detection algorithms is a single pixel rather than a ship target composed of multiple pixels. When applied to high-resolution data, the vessel will be detected repeatedly. Therefore, the existing low-light vessel detection algorithms cannot be applied to the latest low-light remote sensing data due to the spatial resolution difference, and algorithms based on high spatial resolution data are relatively lacking.

Figure 1.
Comparison under different resolution images of the vessel; both were taken in the Gulf Sea of Mexico area. Among them: (a) DNB data; (b) SDGSAT-1 GIU data.
In this study, we developed an unsupervised vessel detection method for the Glimmer Imager for Urbanization (GIU) NTL data of the SDGSAT-1. We have established a vessel dataset containing 30 images and 562 vessels, which includes vessel data from different sea areas and spatial resolution to ensure diversity in the dataset. On this basis, we have designed a robust and unsupervised nighttime vessel detection algorithm. We observe that the background changes smoothly and slowly; the brightness of the random noise is low, and the ship targets are sparsely distributed in the NTL data. Therefore, we adopted a background noise separation method based on the Robust Principal Component Analysis (RPCA) [34] and added local contrast weights to realize the complete preservation of the vessel while removing background and noise. Considering that the artificial light source diffuses locally to form a high-light pixel cluster and the ship target is composed of one or more high-light pixel clusters, we use Density-Based Spatial Clustering of Applications with Noise (DBSCAN) [35] to detect vessel light sources and then use relative interconnection index to merge different light sources of the same vessel to obtain accurate target detection results. This method guarantees target detection’s robustness when the target size and brightness vary greatly and the background noise is complex and changeable, performing well in our dataset.
The rest of this article is organized as follows. Section 2 introduces the SDGSAT-1 GIU data and discusses the characteristics of the vessels displayed in high-resolution GIU data; Section 3 provides a detailed description of the vessel detection method designed in this article; Section 4 introduces the experimental results of applying this method to our vessel dataset; Section 5 draws conclusions.
2. Data
2.1. Overview of the SDGSAT-1 GIU Data
Sustainable Development Goals Science Satellite-1 (SDGSAT-1) is the world’s first scientific satellite dedicated to serving the 2030 Agenda [33]. The SDGSAT-1 is designed to carry three payloads with multiple observation modes to realize all-day, multi-load coordinated observation. The Glimmer/Multispectral Imager of the SDGSAT-1 satellite adopts a multi-mode common optical path imaging design, which can realize day/night switching imaging. The Glimmer imager is designed with a panchromatic band, divided into a low gain (Panchromatic Low, PL), high gain (Panchromatic High, PH), and high and low gain fusion (High Dynamic Range, HDR). In addition, there are three color bands (RGB). Technical details about SDGSAT-1 and GIU data are shown in Table 1.

Table 1.
Technical details about SDGSAT-1 and GIU data.
2.2. Characteristics of Vessels in GIU Data
In the GIU data, the vessel presents many unique characteristics. Figure 1b shows the vessel in the SDGSAT-1 GIU data. Vessels in GIU data mainly have the following characteristics:
- The vessels are presented as a local bright spot or bright spot with an irregular shape;
- Compared with the vast and empty background, the vessels are small in size and sparsely distributed, accounting for a low proportion of the overall image;
- Part of the vessels are unconnected targets, consisting of several close but disconnected bright spots;
- The image noise is complex, but the noise brightness value is generally lower than the target peak area of the vessels.
These unique characteristics are closely related to the imaging process of low-light remote sensing imager. The glimmer imager of SDGSAT-1 is designed to detect artificial light sources carried by human beings. It cannot detect detailed information such as the vessel’s geometric shape, contour, and texture. Compared with the maximum spatial resolution of 10 m, the light source carried by the vessel can be regarded as a point light source. The process of point light source transmission from the ground through the atmosphere to the satellite sensor is complex and will be affected by many aspects. It will produce a diffusion phenomenon, manifesting as light source leakage to the surrounding area. This phenomenon is shown in the GIU data, as the point light source occupies the local peak point in the data, and the neighboring pixels are also lightened up, resulting in the vessel appearing as a regional bright spot. This diffusion phenomenon is affected by atmospheric conditions, random noise of satellite sensors, and other factors in the imaging process. It is also closely related to the design and function of the light source and the running direction and state of the vessel itself. The complex influence factors make the diffusion of vessels unpredictable, resulting in irregular shapes and different sizes of diffusion bright spots. Moreover, considering that some large vessels are equipped with multiple light sources, these light sources are far away, and the diffusion of light sources is not enough to connect, which causes these vessels to become unconnected targets. Last but not least, due to the weak artificial light source at night, the large gain of low-light imager leads to poor signal-to-clutter ratio and complex noise. At the same time, there is also a certain probability of cloud and moonlight interference factors.
In summary, although the characteristics of GIU data and the light source of the vessel bring many difficulties to the design of detection methods, these characteristics also bring the basis for distinguishing the vessel from background and noise. We designed the vessel detection algorithm based on these characteristics.
3. Method
In this section, the low-light remote sensing vessel detection method used in this paper is described in detail. The main idea of this method is to separate the target from the background noise in the preprocessing stage to obtain the target map and then use the idea of density clustering for target detection. In the post-processing stage, the inter-cluster clustering method merges the non-connected light sources of the same vessel. The details are presented in the following subsections. The process diagram of our vessel detection method is shown in Figure 2.
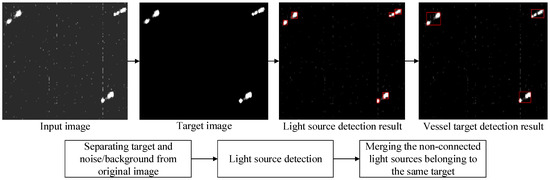
Figure 2.
The process diagram of our vessel detection method.
3.1. Noise and Background Separation through Weighted RPCA
Generally, the low-light remote sensing data of relevant sea areas containing vessels can be formulated as
where D is the original remote sensing data; B is the background image; T is the target image, and N is random noise. Usually, background images are considered to be slowly changing, meaning that regions in the background image are highly correlated, indicating that background image B can be regarded as a low-rank matrix.
where r is a constant used to reflect the complexity of the background image. The larger the value of r, the more complex the background. Obviously, r is much smaller than size of B.
In practical applications, a vessel usually keeps changing all the time. The brightness may vary from dim to bright, and its size may vary from 2 × 2 to more than 10 × 10 (in pixels). However, the size of the vessel is small compared to the background, and the distribution in the remote sensing data accounts for a small proportion. The target image T is a sparse matrix, namely,
where denotes the norm (i.e., the number of non-zero elements in the vector), and K (K ≪ m × n, m × n is the size of the target image) is an integer determined by the number and size of the small target.
According to the actual situation of the remote sensing data we observed, we assume that the random noise is i.i.d. and for some . Thus, we have
where is the Frobenius norm, (i.e., ).
Based on the above discussions, B can be considered a low-rank component, and T can be regarded as a sparse component. Using the correlation characteristics of components, the traditional vessel noise and background separation problem can be transformed into an RPCA optimization problem.
where denotes the norm (i.e., ), and denotes the nuclear norm (i.e., the sum of singular values). Given that dealing with the non-convex norm and is NP-hard (non-deterministic polynomial), we use norm and nuclear norm to replace them for tractable computation [36,37]. is a balance parameter.
Random noises existing in GIU images are non-target sparse points. Due to the influence of the vessel diffusion phenomenon, the brightness value of some target edge areas is close to random noise, which makes it difficult to suppress it effectively only through the norm. As a weight coefficient to control the trade-off between background and target in Equation (5), a larger λ can suppress non-target sparse points and background effectively but will cause the target to shrink excessively, that is, only separating the target peak area, damaging the local density information of the vessel. Conversely, smaller λ can preserve the local density information but will introduce non-target noise. Because λ can only control the target image globally, it is easy to neglect one aspect and lose the other. We can control the separation of targets and noise more accurately in different regions by adopting a weighted norm [38] determined by local statistical data.
In the GIU data, the brightness value of non-target sparse points is usually much lower than the central high brightness area of the vessel, and its local variation [39] situation is different from the edge area of the target. We utilize the above characteristics to design a weighted norm based on brightness values and local variation. We first set the local variation calculation
where and are 8-neighbor pixels in x.
The local variation is calculated based on local image blocks; we take the maximum total variation of each point in the blocks as a measure of the total degree of change in the local area:
We set ξ as a 5 × 5 block of x.
Based on local contrast and pixel brightness, the reweighted norm is designed and used as follows:
where are weights for the elements of ; denotes the absolute value operator; denotes the Hadamard product; is a positive constant.
Then, the target-noise separation model based on the proposed weight norm can be formulated as follows:
We solve the model through the Inexact Augmented Lagrangian multiplier (IALM) method [36]. The augmented Lagrange function of (10) is formulated as
where Y is the Lagrange multiplier matrix; is a penalty scalar; is the regularization term to ensure the convergence of the function; denotes the inner product operator.
Next, B and T can be solved alternately as
According to [36], Equations (12) and (13) can be solved as
where and are the soft thresholding operators formulated as
As we solve B and T, matrix Y is updated via
The solution of our weighted RPCA method via IALM is shown in Algorithm 1.
| Algorithm 1 Solution via Inexact ALM Method |
| Input: Original image , Weighting parameter Initialize: ; , , While not converged do: Update : ; Update : ; Update : ; Update : ; Check the convergence conditions ; Update k: ; End while Output: Background image , Target image |
3.2. Light Source Detection Based on DBSCAN
After we separated the interference of background and noise in GIU data and obtained the target image, we expect that the vessel can be accurately and automatically identified through the target image by a target detection algorithm. As mentioned in Section 2.2, several characteristics limit the application of traditional target detection methods. Firstly, the vessel’s shape, size, and brightness values in SDG data are irregular. As a result, no reliable feature can be utilized, and target detection based on these features may lead to missed detection. Secondly, since many vessels carry different light sources at different positions, many vessels are non-connected targets, which may lead to false detection. We observe that due to the artificial light diffusion phenomenon, the local density of high-brightness pixels in the target area is significantly larger, as shown in Figure 3a. Based on this feature, we can convert the highlighted pixels into objects and then use local object density clustering to complete the object detection, as shown in Figure 3b.
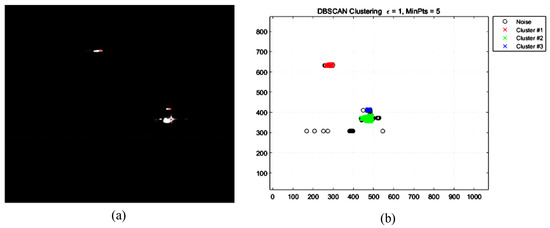
Figure 3.
The diagram of the DBSCAN-based detection method. (a) is the artificial light source in the NTL data; (b) is the processing result of DBSCAN. It can be seen from Figure (b) that the bright pixels are converted into objects and divided into three clusters and some noise objects, which correspond to the detection result of the artificial light source.
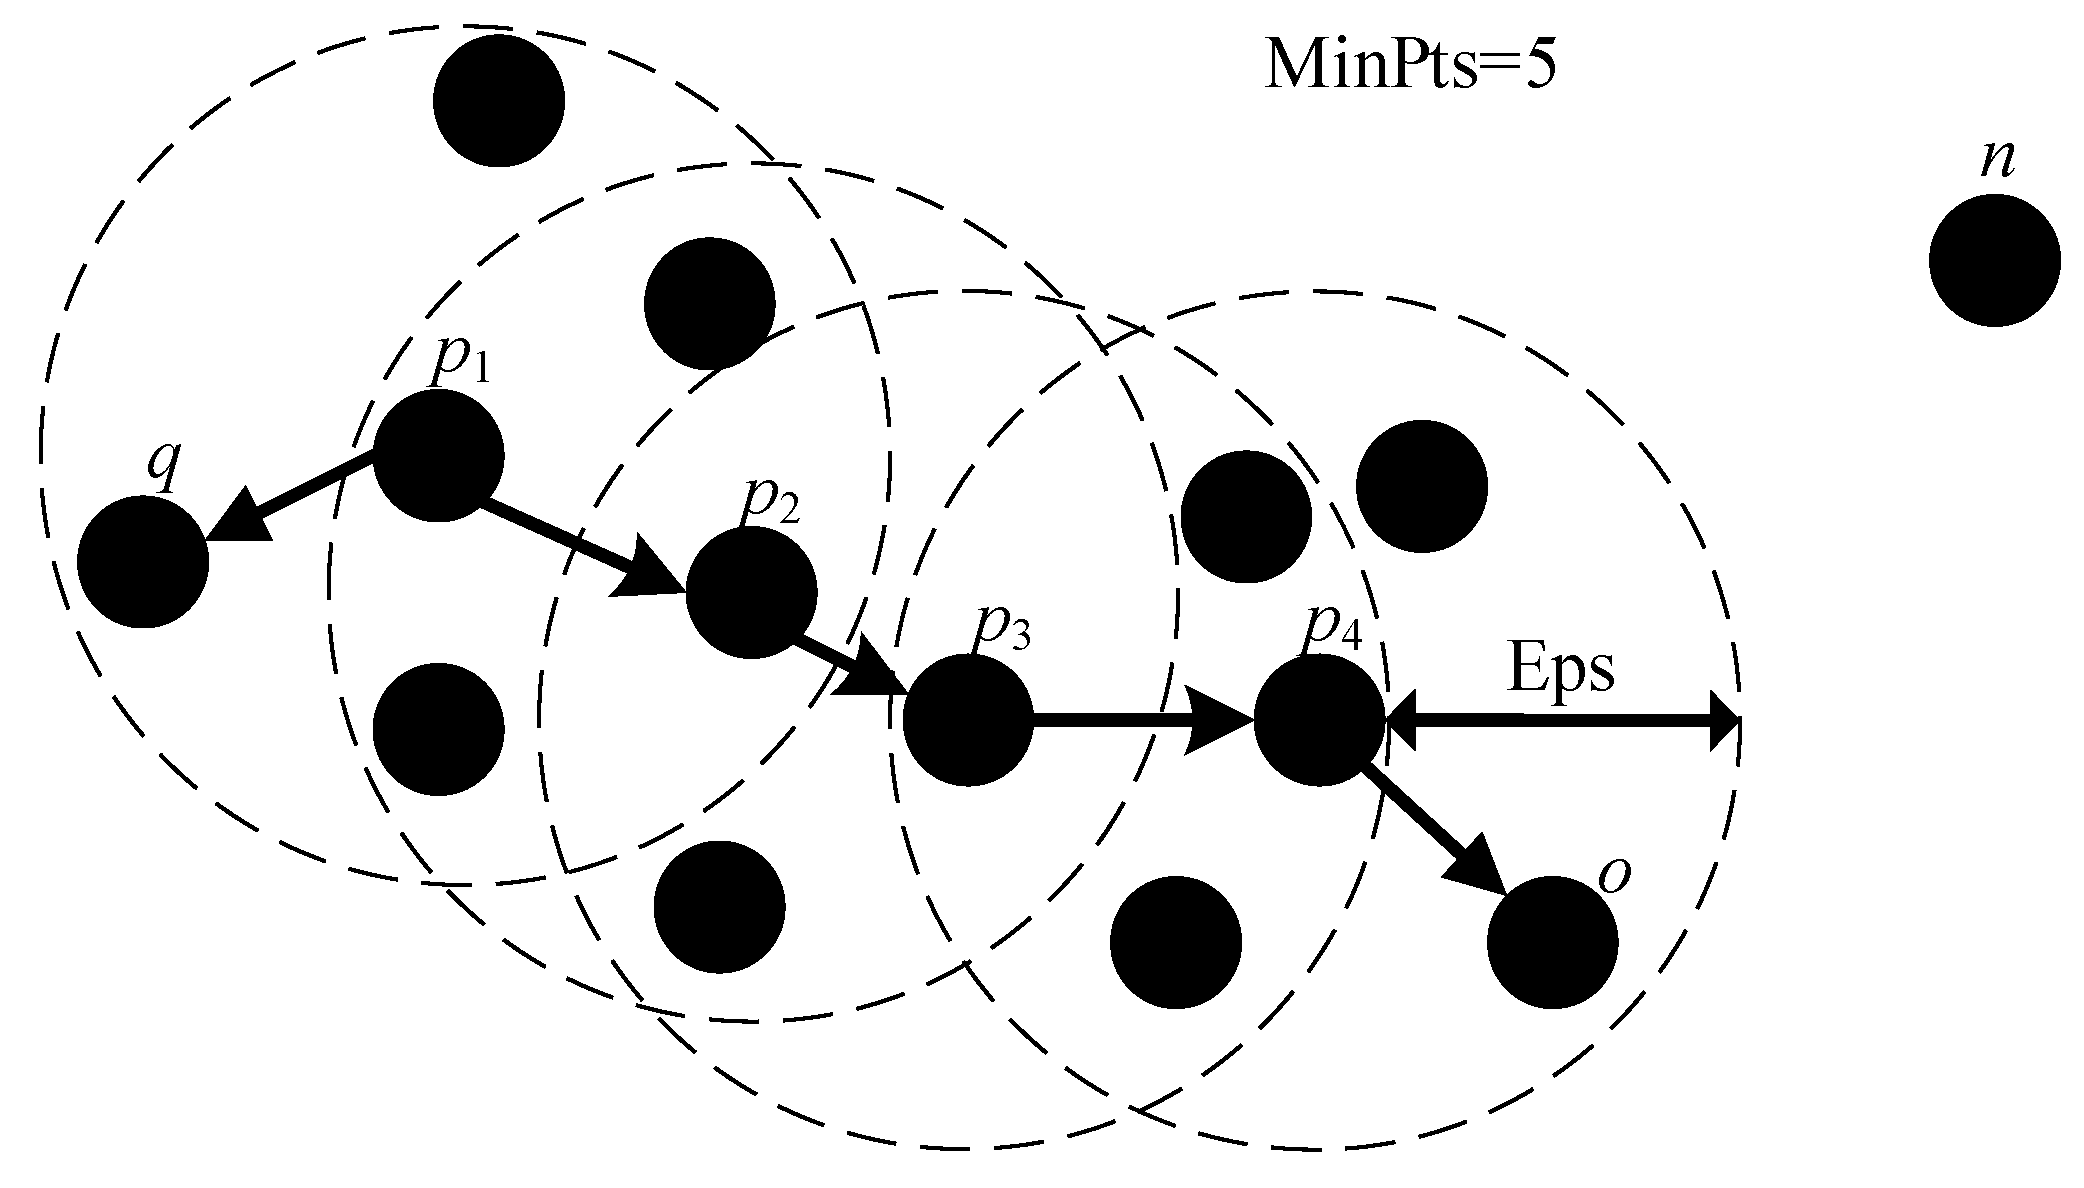
We use density-based spatial clustering of applications with noise (DBSCAN) algorithm [35] for vessel light source detection. DBSCAN is widely used in various disciplines because of its unsupervised characteristics. It has a good clustering effect without the need to specify the number of clusters and cluster centers. The main idea of DBSCAN is that for each object in a cluster, the number of objects in the EPS neighborhood must be greater than or equal to a given threshold. Related concepts are as follows.
Definition 1.
Eps neighborhood: The Eps neighborhood of an object p denoted by is defined by
Definition 2.
Core Object: The number of sample objects in the Eps neighborhood of a given object is greater or equal to the threshold MinPts:
Definition 3.
Boundary Object: A non-core object in the Εps neighborhood of the core object.
Definition 4.
Noise object: Object that is not a core object or boundary object.
Definition 5.
Direct density-reachable: For object p, q in object set , if the object q is in the Εps neighborhood of p, and p is the core object, then the object q is directly density-reachable from object p.
Definition 6.
Density-reachable: For the object set , given a series of sample objects , if every object is directly density-reachable by , then object p is density-reachable from q.
Definition 7.
Density-connected: For objects p, q, o in object set , if objects o can be density-reachable from both p and q, then p and q are density-connected.
A schematic of the related concepts of DBSCAN is shown in Figure 4. Among them, are core objects; q and o are boundary objects; n is noise object; q is directly density-reachable from ; is density-reachable from ; q and o are density-connected.

Figure 4.
Schematic of the related concepts of DBSCAN.
For the input object set, there can be more than one core object in each object cluster, and these objects are density-reachable with each other. Therefore, the process of the DBSCAN algorithm is mainly to iteratively obtain the maximum density connected sample set derived from the density reachability relation. The detailed process is shown in Algorithm 2.
| Algorithm 2 Light source detection via DBSCAN |
| Input: target image T, Initialize: MinPts = 5, Eps = 1, object set , For pixel ai in image T: If , ; End if End for While all objects in are not traversed Take an untraversed object p from ; If p is a core object, Initialize Target cluster set traverse to find all objects which are Density-reachable from p, traverse to find all objects , which are Directly Density-reachable from any object in , ; ; k = k + 1; end if end while Output: target cluster result |
3.3. Clusters Merging through Relative Interconnection Index
Since many vessels carry different light sources at different positions, a large part of the vessels are non-connected targets. In addition, due to the high brightness of the light sources carried by some vessels, dazzling light and reflection inside the lens are produced in the imaging process. The density clustering in the previous step identifies these targets as multiple clusters. There is an obvious need to merge these adjacent light source clusters belonging to the same target. The interconnectivity index between objects is designed based on the brightness value of objects and the distance between objects. Then, the relative interconnectivity index between clusters is obtained based on the normalization of internal interconnectivity. Based on this index, we merge the adjacent clusters of the same target to complete the vessel detection. The measure of interconnectivity between objects is as follows:
where represent the brightness value of the target image corresponding to these two-pixel object positions p and q; , meaning the distance between two objects. is a constant term.
To deal with the difficulty of threshold setting caused by the complexity of the actual vessels, we normalize their absolute interconnection by using internal interconnection to obtain the relative interconnection index [40,41] between clusters:
where is a pair of clusters; ; p and q are the pixel objects inside and , respectively. We set a threshold based on to conduct the merging process. The algorithm of the cluster merging process through the relative interconnection index is shown in Algorithm 3.
| Algorithm 3 Clusters merging through relative interconnection index |
| Input: target cluster result Initialize: , , , , , While While , for if , , , end if end for end while , , end while , Output: Vessel detection result |
4. Results
This article selects four scenarios of HDR and RGB-level moonless SDGSAT-1 GIU images from three study areas to validate the proposed algorithm: the area around the Bohai Sea; the Gulf of Mexico; and the East China Sea. More details about the data we select are shown in Table 2. The vessel’s position is marked by artificial visual interpretation, and the detection results are compared with the manual marking results to verify the performance of the proposed method. The main process of artificial vision interpretation of the vessel is to identify the vessel light sources and mark the closely related light sources as targets. We adopt this method in [13] to distinguish lighting objects such as vessels, oil platforms, and minor islands through VIIRS band M10 and the land–sea mask data. We use the VIIRS band M10 data to conduct combustion source detection and locate the position of the offshore oil platforms. We also used the land–sea mask data to locate the positions of minor islands in relevant areas. Considering the memory capacity limit, we roughly cropped the original remote sensing data to form an experimental dataset. Data containing offshore oil platforms and minor island areas were eliminated from the dataset. The final dataset has 25 images of different sizes, with 570 vessels recorded by artificial visual interpretation. These vessels have different environmental conditions, directions, and sizes, which can effectively test the algorithm’s applicability.
Table 2.
Information about the GIU data we select.
We computed the grayscale brightness from RGB data through Equation (23) [42]
We chose precision, recall, and F1 score as the performance evaluation metrics for the quantitative analysis of the vessel detection. Precision and recall can be expressed as follows:
where TP represents true positive, that is, the detected vessel is the actual target; FP stands for false positive, indicating that the detected target is not the real vessel; FN stands for false negative and represents a real vessel that is not detected.
To be able to consider both the precision and recall of these two metrics, the F1 score is also introduced as follows:
which is the harmonic average of precision and recall rate.
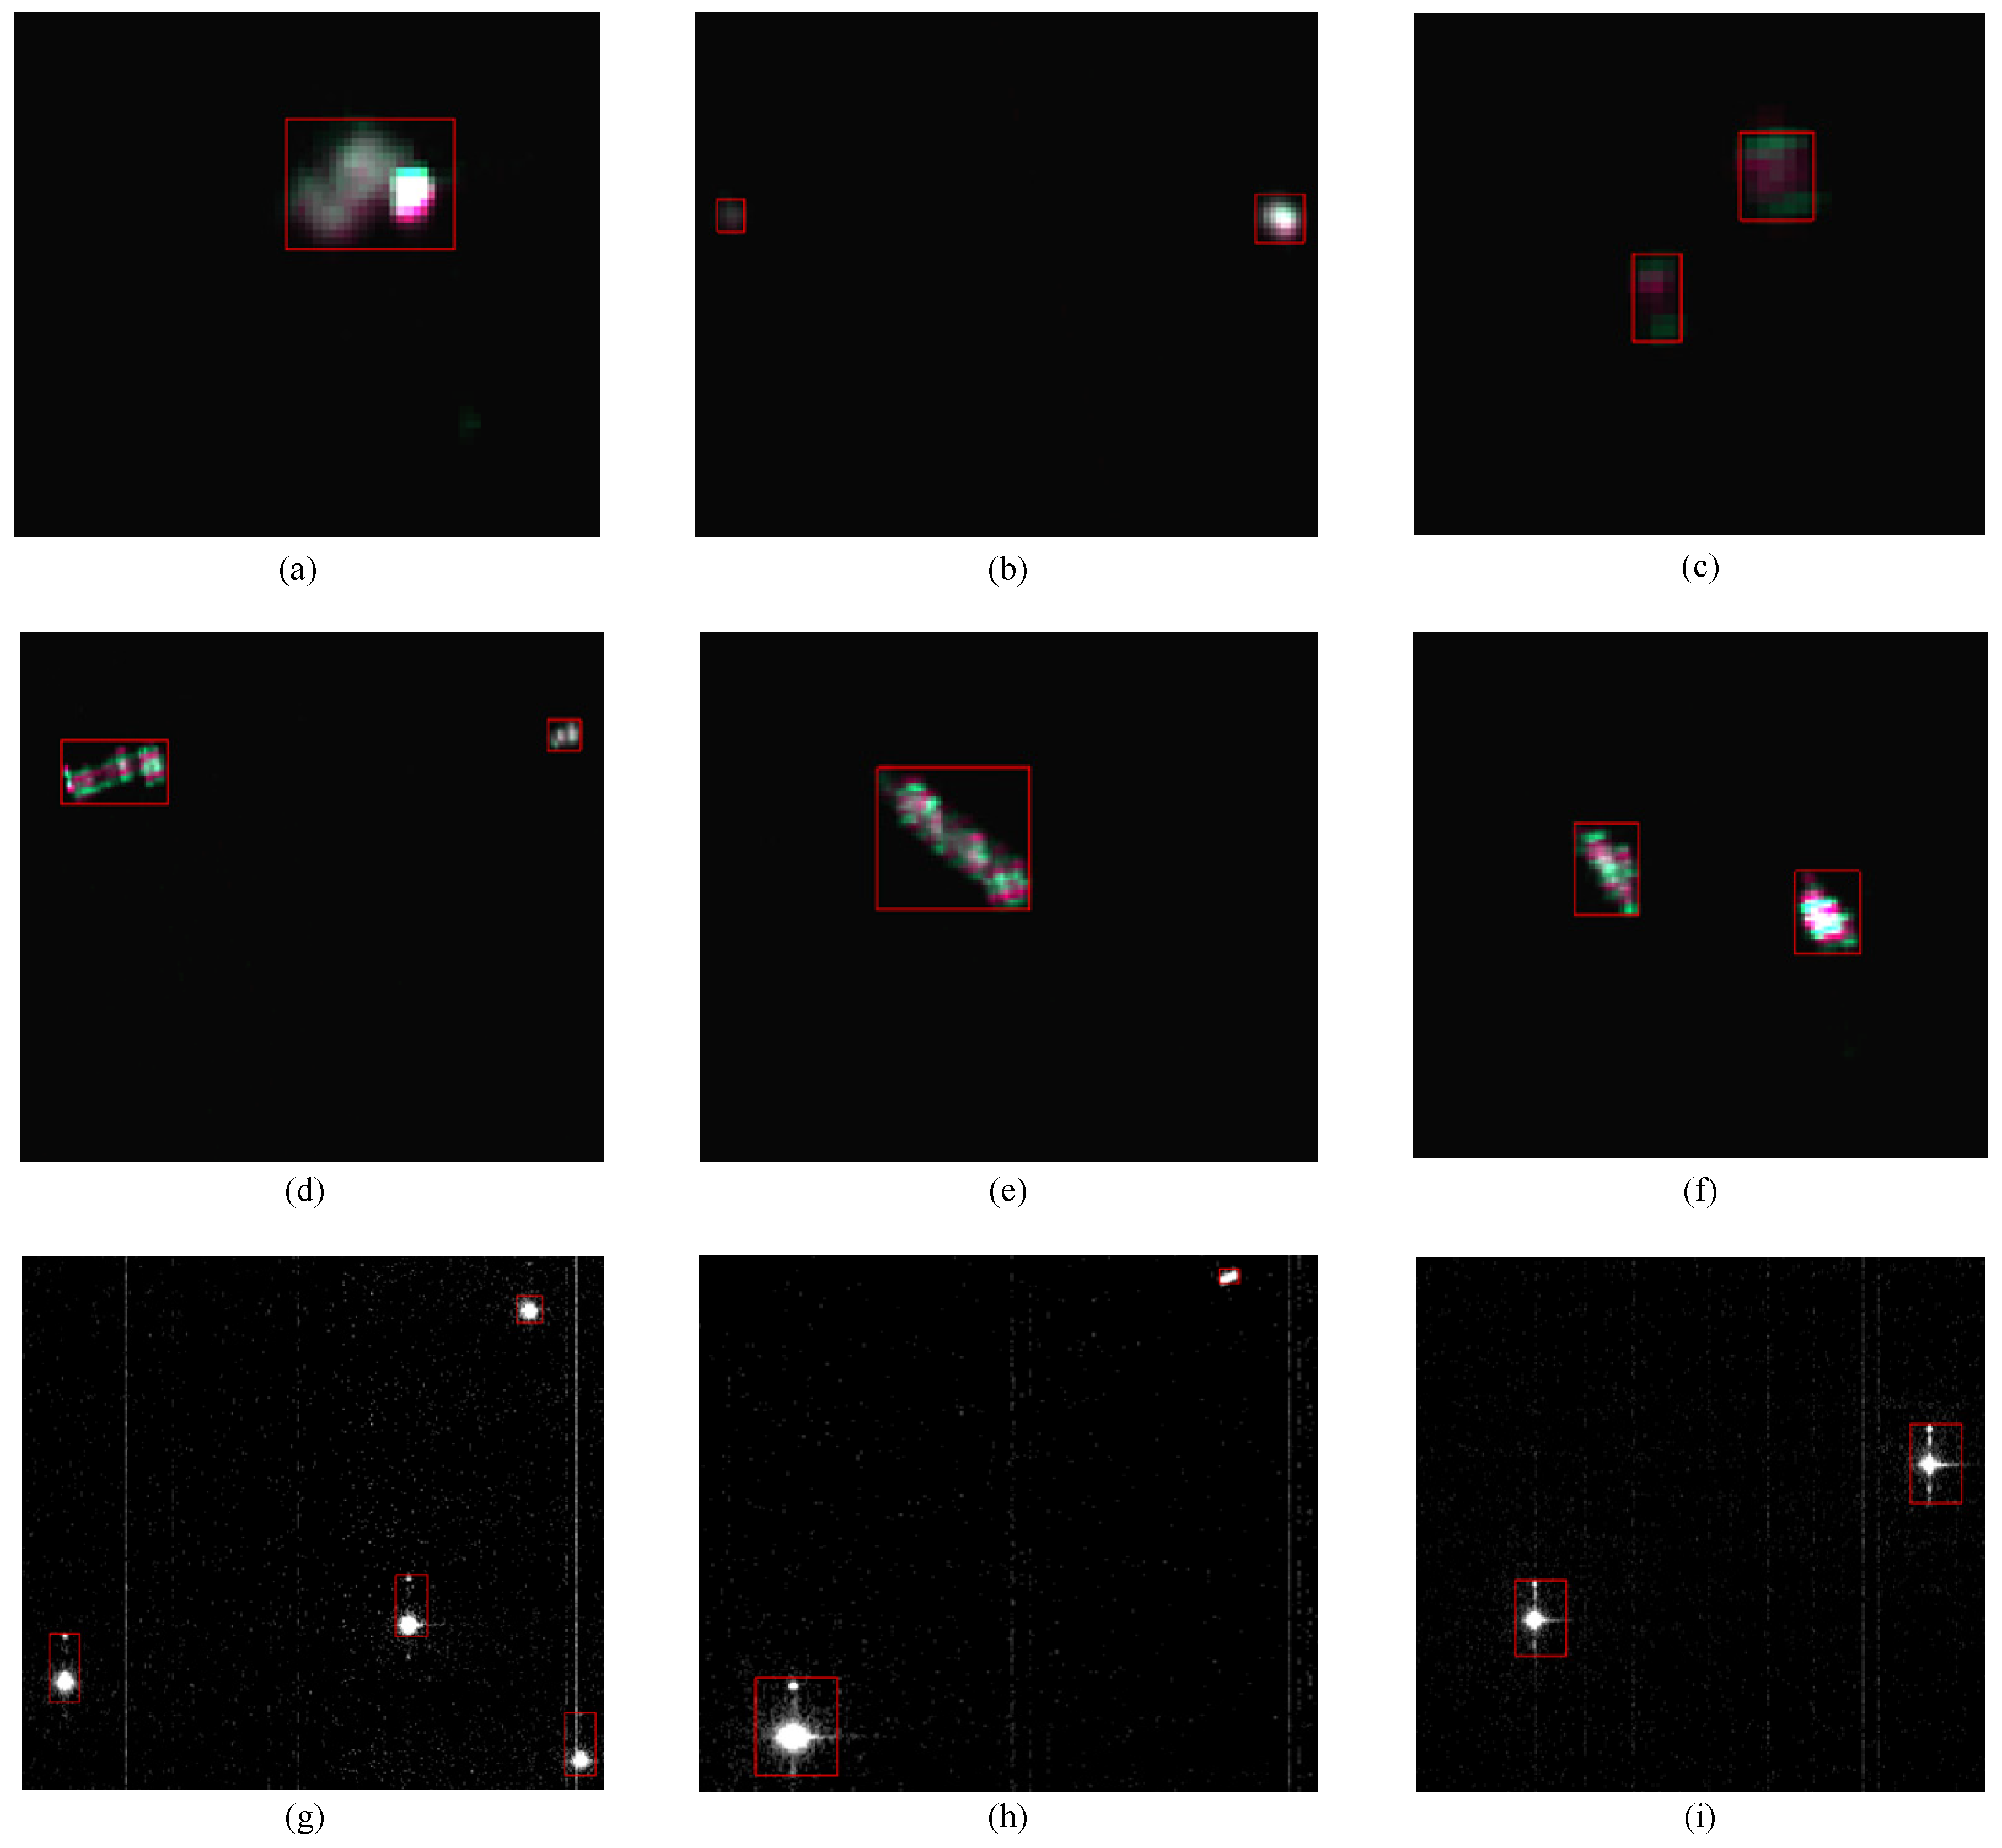
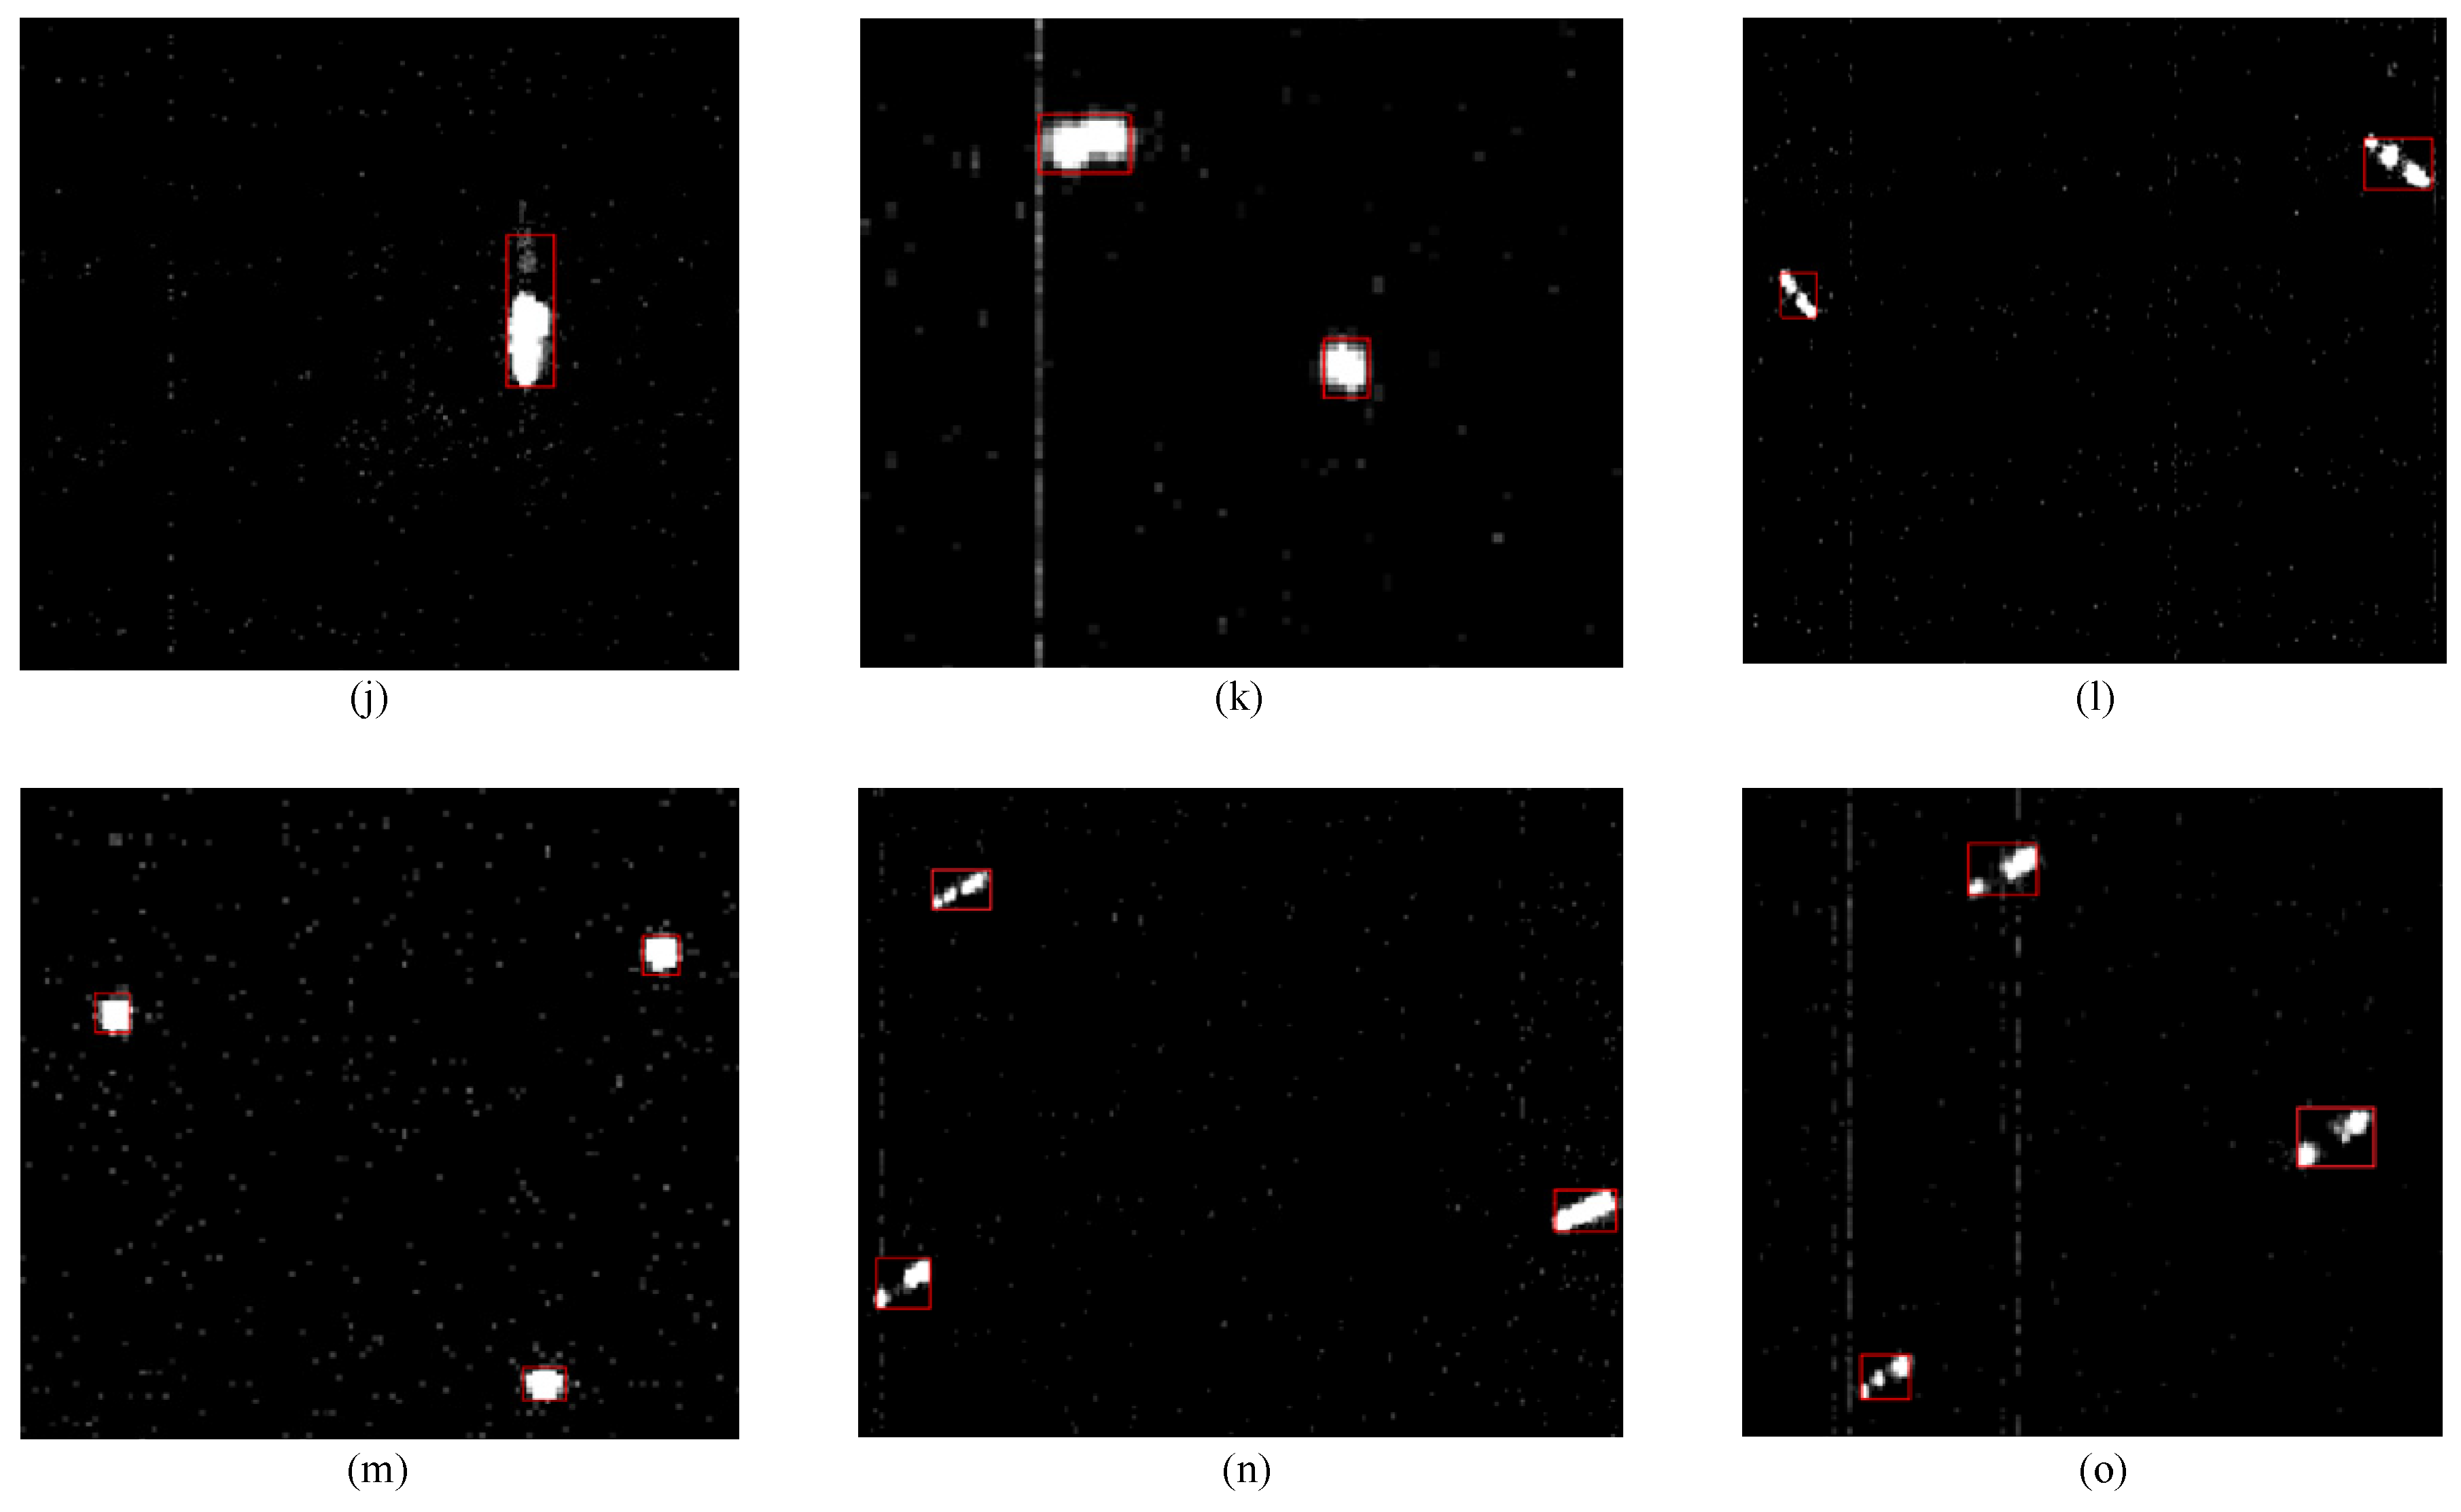
The schematic diagram of the detection results in this study’s sea areas is shown in Figure 5, where the red box represents the location of the vessel determined by the detection algorithm. Figure 5 presents the data for several different cases. Here, Figure 5a–f shows RGB data, and Figure 5g–o shows HDR data. It can be seen from Figure 5 that the shapes and sizes of the vessels in these data have significant differences. Moreover, Figure 5i,l,o,n contains non-connected targets. These complex factors bring more difficulties to the detection algorithm.

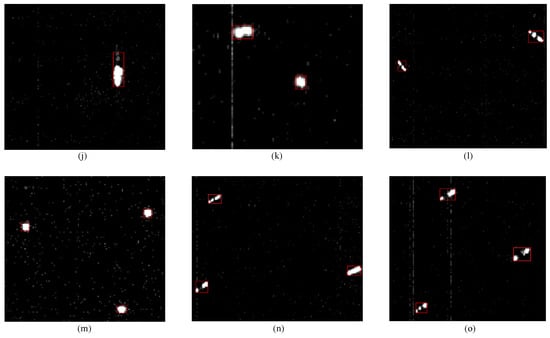
Figure 5.
Schematic diagram of the detection results in this study’s sea areas, where (a–f) shows RGB data, and (g–o) shows HDR data. The red box denotes the detection results.
The detection results of our method in three study areas are shown in Table 2. It can be seen that the total precision and recall are 96.84% and 96.71%, respectively. Obviously, our method achieves more than 95% in both precision and recall in different regions; it proves that the method we proposed can handle complex data situations well and accurately identify most vessel targets.
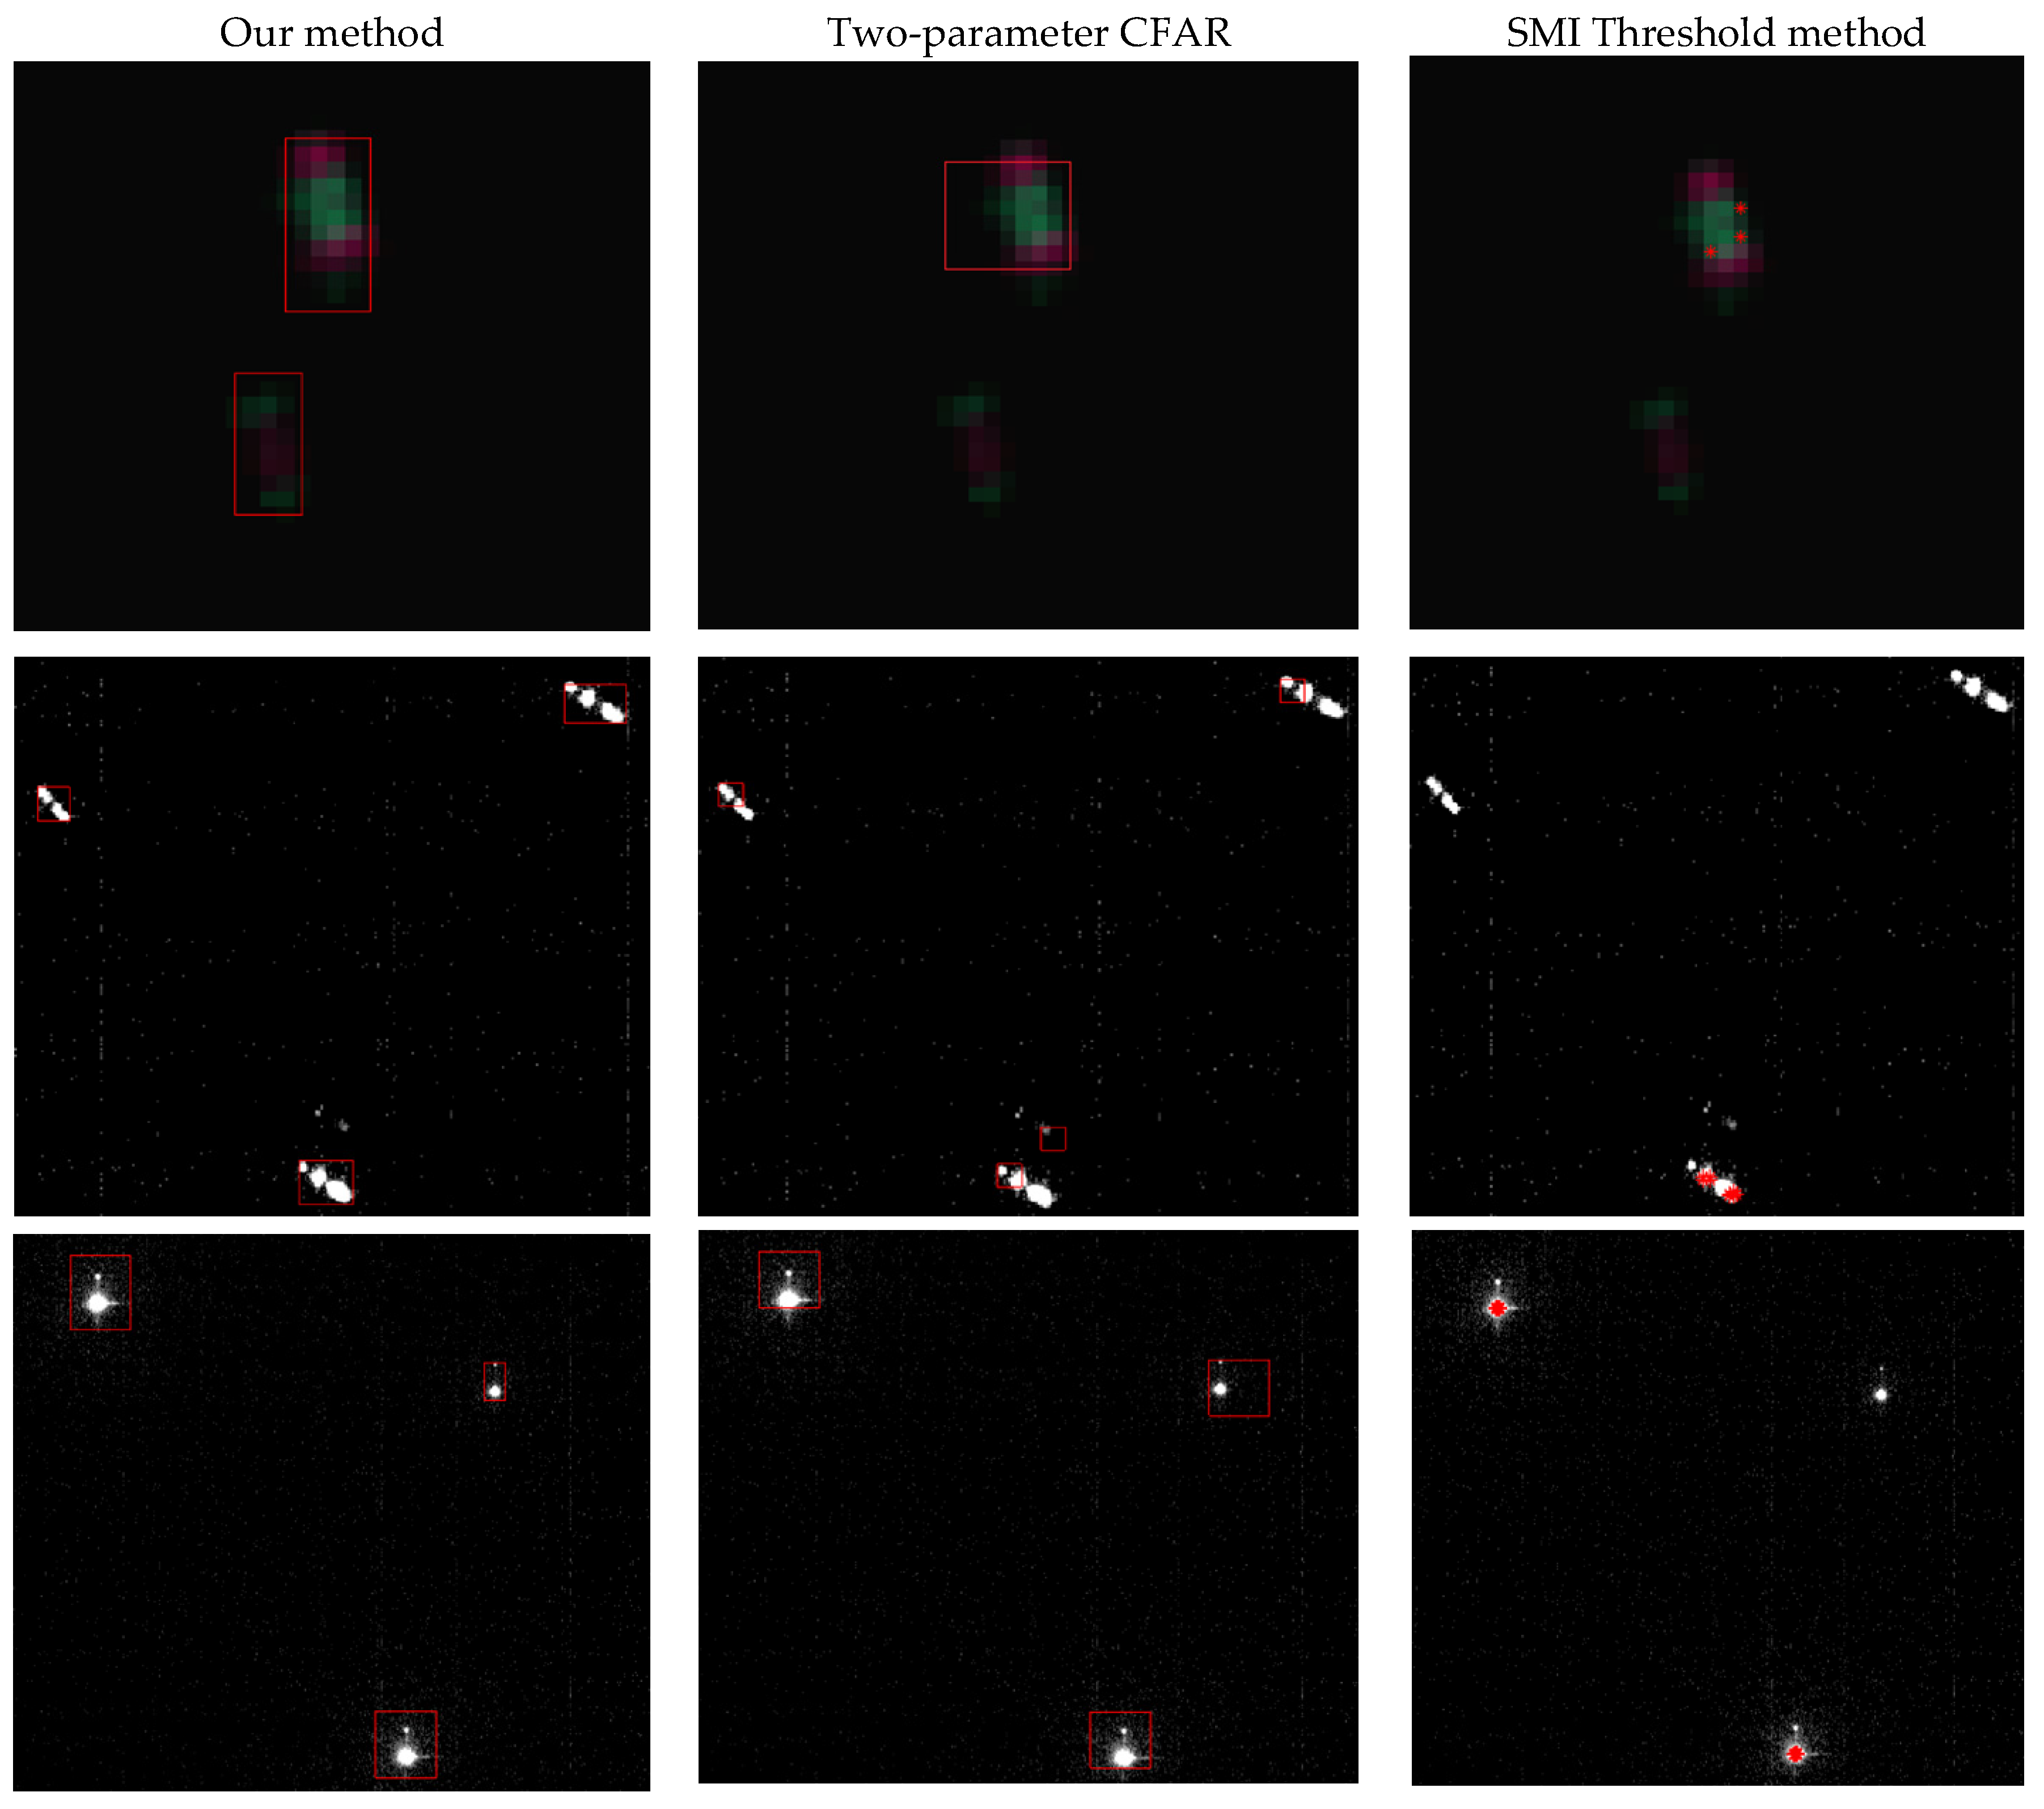
We chose the methods proposed by Elvidge et al. [14] and Zhong Liang et al. [18] to conduct experiments on our dataset and compare the detection performance with our method. Elvidge’s method is designed for low-resolution NTL data, which has a wide influence and has produced a large number of ship target detection products based on DNB data. Zhong’s method is the only method currently designed for high-resolution NTL data that can achieve good detection results without requiring massive data as a training set, which is suitable for the actual situation of our experimental environment. Therefore, we choose these two methods for comparison. The detection results of the comparison method are shown in Table 3. Among them, the total precision and recall calculated by the algorithm proposed by Elvidge et al. are 55.33% and 61.05%, respectively, which is lower than the method proposed in this study. The experimental results show that the vessel detection algorithm designed based on DNB data is unsuitable for the higher-resolution data. Figure 6 shows several typical detection error cases of the compared threshold methods. It can be seen from the actual detection result figure that the exact brightness value of different vessels in the actual data varies greatly, and the detection algorithm based on the threshold method cannot deal with this situation, resulting in the missed detection of low brightness vessel and the repeated detection of high brightness vessel. The main reason for this phenomenon is that the detection object of the methods designed for DNB data is a single pixel rather than a vessel composed of multiple pixels. When applied to high-resolution data, the vessel will be detected repeatedly. Our method can avoid this situation by detecting clusters of highlighted pixels. As for the Two-parameter CFAR method proposed by Zhong Liang et al., the total precision and recall are 76.29% and 72.81%, respectively. In general, this method has a certain effect on detecting vessels, but this method needs to adjust the size of the target candidate box manually, and the size of the candidate box is fixed in the same image, so the detection effect of this method is not robust on the data with large differences in the size of different targets. The detection method based on DBSCAN can automatically adapt to ship targets with different shapes and sizes to obtain better detection results.
Table 3.
Calculation Results of Performance Assessment Index.
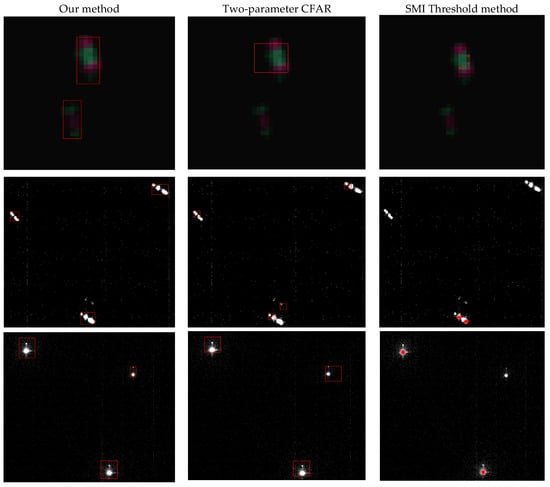
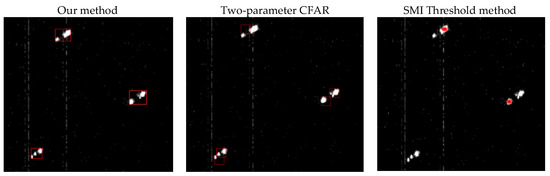
Figure 6.
The representative results of different methods on four real NTL images, where the red box and * denote the detection results.
5. Discussion
It can be seen from the experimental results that our method achieves better detection results in complex detection tasks and successfully detects the vast majority of ship targets compared to the comparison methods. The occurrence of a small number of false positives and false negatives is mainly related to the following two factors: First, a small number of vessel targets are relatively smaller than other targets, accounting for only 10–20 pixels, and their radiance is much lower, too. In the meantime, these targets are in areas with relatively high noise levels. These situations lead to the vessel target being suppressed in the noise removal stage and, subsequently, ignored in the artificial light source detection stage, which eventually results in missed reports. Second, the independent artificial light source carried by some vessels is relatively far away, and its brightness is low. Hence, the relative connectivity index between clusters is lower than the fixed threshold, and the mechanism of merging clusters belonging to the same target fails to work.
There are still potential investigation values and prospects in the aspect of nighttime vessel detection. We expect to further improve our method to enhance the detection of weak and complex targets in future work. We also hope to further investigate the process of point light source transmission from the ground through the atmosphere to the satellite sensor, analyze the characteristics generated by this process, and design relevant methods to achieve better detection results.
6. Conclusions
In this paper, we propose an object detection method based on Robust PCA and density clustering to automatically detect nighttime vessels from SDGSAT-1 GIU data. In the first step, the target image and the background noise image are transformed into a constrained optimization problem based on RPCA. At the same time, a local contrast factor is designed to suppress the sparse noise based on the characteristics of the relevant sea night image, and then, the optimization problem is solved based on IALM. In the second step, based on the artificial light diffusion phenomenon, the highlighted pixels are transformed into objects, and the artificial light is detected by DBSCAN. In the third step, the relative interconnectivity index between clusters is designed to characterize the relation between light sources clusters quantitatively, and the non-connected light sources belonging to the same vessel are merged by comparing with a threshold to complete the vessel detection.
To test the performance of the algorithm, we selected three research areas, the Bohai Sea, the East China Sea, and the Gulf of Mexico, to establish a vessel dataset and applied the algorithm to the dataset. We annotated the target through artificial visual interpretation. We applied the algorithm to this dataset, and the results show that the total detection accuracy and recall rate of the detection algorithm in the three research areas are 96.84% and 96.67%, respectively. The algorithm overcomes the data’s complex vessel shape and noise situation and achieves good results, showing that the algorithm is reliable.
In future work, we plan to further explore the relevant characteristics of the vessel light source, expecting to improve the performance of the detection algorithm. In addition, the light settings of different types of vessels will be investigated, and a vessel recognition algorithm will be designed and implemented on this basis.
Author Contributions
Z.Z. proposed and realized the detection method, analyzed the results, and wrote this paper; S.Q., Y.Q. (Yonggang Qian), and Y.C. gave important advice about the experiments; S.Q. edited this paper; F.C. helped provide the satellite data; H.C. assisted with data processing; H.C., Y.Z., F.C., Y.C., E.K., and Y.Q. (Yuanyuan Qiu) reviewed this paper. All authors have read and agreed to the published version of the manuscript.
Funding
This research was funded by the State Key Laboratory of Applied Optics under grant number E2C1060200.
Data Availability Statement
It is acknowledged that the SDGSAT-1 data are kindly provided by the International Research Center of Big Data for Sustainable Development Goals (CBAS); the data acquired by SDGSAT-1 will be available to the scientific community globally free of charge through SDGSAT-1 Open Science Program (www.sdgsat.ac.cn (accessed on 8 December 2022)).
Acknowledgments
We thank the CBAS for providing the SDGSAT-1 GIU data. Meanwhile, we express gratitude to Elvidge’s and Zhong’s published method for comparison. The comments and recommendations by the anonymous reviewers are also greatly appreciated.
Conflicts of Interest
The authors declare no conflict of interest.
References
- Perera, L.P.; Oliveira, P.; Soares, C.G. Maritime traffic monitoring based on vessel detection, tracking, state estimation, and trajectory prediction. IEEE Trans. Intell. Transp. Syst. 2012, 13, 1188–1200. [Google Scholar] [CrossRef]
- Kroodsma, D.A.; Mayorga, J.; Hochberg, T.; Miller, N.A.; Boerder, K.; Ferretti, F.; Wilson, A.; Bergman, B.; White, T.D.; Block, B.A.J. Tracking the global footprint of fisheries. Science 2018, 359, 904–908. [Google Scholar] [CrossRef]
- Kanjir, U.; Greidanus, H.; Oštir, K.J. Vessel detection and classification from spaceborne optical images: A literature survey. Remote Sens. Environ. 2018, 207, 1–26. [Google Scholar] [CrossRef]
- Li, B.; Xie, X.; Wei, X.; Tang, W. Ship detection and classification from optical remote sensing images: A survey. Chin. J. Aeronaut. 2021, 34, 145–163. [Google Scholar] [CrossRef]
- Ophoff, T.; Puttemans, S.; Kalogirou, V.; Robin, J.-P.; Goedemé, T.J. Vehicle and vessel detection on satellite imagery: A comparative study on single-shot detectors. Remote Sens. 2020, 12, 1217. [Google Scholar] [CrossRef]
- Farahnakian, F.; Heikkonen, J.J. Deep learning based multi-modal fusion architectures for maritime vessel detection. Remote Sens. 2020, 12, 2509. [Google Scholar] [CrossRef]
- Ding, K.; Yang, J.; Lin, H.; Wang, Z.; Wang, D.; Wang, X.; Ni, K.; Zhou, Q. Towards real-time detection of ships and wakes with lightweight deep learning model in Gaofen-3 SAR images. Remote Sens. Environ. 2023, 284, 113345. [Google Scholar] [CrossRef]
- Miller, S.D.; Mills, S.P.; Elvidge, C.D.; Lindsey, D.T.; Lee, T.F.; Hawkins, J.D.J. Suomi satellite brings to light a unique frontier of nighttime environmental sensing capabilities. Proc. Natl. Acad. Sci. USA 2012, 109, 15706–15711. [Google Scholar] [CrossRef] [PubMed]
- Miller, S.D.; Straka, W., III; Mills, S.P.; Elvidge, C.D.; Lee, T.F.; Solbrig, J.; Walther, A.; Heidinger, A.K.; Weiss, S.C.J. Illuminating the capabilities of the suomi national polar-orbiting partnership (NPP) visible infrared imaging radiometer suite (VIIRS) day/night band. Remote Sens. 2013, 5, 6717–6766. [Google Scholar] [CrossRef]
- Liu, Y.; Saitoh, S.-I.; Hirawake, T.; Igarashi, H.; Ishikawa, Y.J. Detection of squid and pacific saury fishing vessels around Japan using VIIRS Day/Night Band image. Proc. Asia-Pac. Adv. Netw. 2015, 39, 28. [Google Scholar] [CrossRef]
- Straka, W.C., III; Seaman, C.J.; Baugh, K.; Cole, K.; Stevens, E.; Miller, S.D.J. Utilization of the suomi national polar-orbiting partnership (npp) visible infrared imaging radiometer suite (viirs) day/night band for arctic ship tracking and fisheries management. Remote Sens. 2015, 7, 971–989. [Google Scholar] [CrossRef]
- Elvidge, C.D.; Cinzano, P.; Pettit, D.; Arvesen, J.; Sutton, P.; Small, C.; Nemani, R.; Longcore, T.; Rich, C.; Safran, J. The Nightsat mission concept. Int. J. Remote Sens. 2007, 28, 2645–2670. [Google Scholar] [CrossRef]
- Elvidge, C.D.; Zhizhin, M.; Baugh, K.; Hsu, F.-C.J. Automatic boat identification system for VIIRS low light imaging data. Remote Sens. 2015, 7, 3020–3036. [Google Scholar] [CrossRef]
- Elvidge, C.D.; Baugh, K.; Zhizhin, M.; Hsu, F.-C.; Ghosh, T. Supporting international efforts for detecting illegal fishing and GAS flaring using viirs. In Proceedings of the 2017 IEEE International Geoscience and Remote Sensing Symposium (IGARSS), Fort Worth, TX, USA, 23–28 July 2017; pp. 2802–2805. [Google Scholar]
- Hsu, F.-C.; Elvidge, C.D.; Baugh, K.; Zhizhin, M.; Ghosh, T.; Kroodsma, D.; Susanto, A.; Budy, W.; Riyanto, M.; Nurzeha, R. Cross-matching VIIRS boat detections with vessel monitoring system tracks in Indonesia. Remote Sens. 2019, 11, 995. [Google Scholar] [CrossRef]
- Elvidge, C.D.; Ghosh, T.; Baugh, K.; Zhizhin, M.; Hsu, F.-C.; Katada, N.S.; Penalosa, W.; Hung, B.Q. Rating the effectiveness of fishery closures with visible infrared imaging radiometer suite boat detection data. Front. Mar. Sci. 2018, 5, 132. [Google Scholar] [CrossRef]
- Lebona, B.; Kleynhans, W.; Celik, T.; Mdakane, L. Ship detection using VIIRS sensor specific data. In Proceedings of the 2016 IEEE International Geoscience and Remote Sensing Symposium (IGARSS), Beijing, China, 10–15 July 2016; pp. 1245–1247. [Google Scholar]
- Zhong, L.; Liu, X.S. Application of LJ1-01 Remote Sensing Data in Marine Vessel detection. Remote Sens. Inf. 2019, 34, 126–131. [Google Scholar] [CrossRef]
- Crisp, D.J. The state-of-the-art in ship detection in synthetic aperture radar imagery; Department of Defence: Canberra, Australia, 2004; p. 115.
- Guo, G.; Fan, W.; Xue, J.; Zhang, S.; Zhang, H.; Tang, F.; Cheng, T. Identification for operating pelagic light-fishing vessels based on NPP/VIIRS low light imaging data. Trans. Chin. Soc. Agric. Eng. 2017, 33, 245–251. [Google Scholar]
- Kim, E.; Kim, S.-W.; Jung, H.C.; Ryu, J.-H.J. Moon phase based threshold determination for VIIRS boat detection. Korean J. Remote Sens. 2021, 37, 69–84. [Google Scholar]
- Xue, C.; Gao, C.; Hu, J.; Qiu, S.; Wang, Q. Automatic boat detection based on diffusion and radiation characterization of boat lights during night for VIIRS DNB imaging data. Opt. Express 2022, 30, 13024–13038. [Google Scholar] [CrossRef]
- Shao, J.; Yang, Q.; Luo, C.; Li, R.; Zhou, Y.; Zhang, F.J. Vessel detection from nighttime remote sensing imagery based on deep learning. IEEE J. Sel. Top. Appl. Earth Obs. Remote Sens. 2021, 14, 12536–12544. [Google Scholar] [CrossRef]
- Zhu, X.; Lyu, S.; Wang, X.; Zhao, Q. TPH-YOLOv5: Improved YOLOv5 based on transformer prediction head for object detection on drone-captured scenarios. In Proceedings of the IEEE/CVF International Conference on Computer Vision, Montreal, BC, Canada, 11–17 October 2021; pp. 2778–2788. [Google Scholar]
- Motomura, K.; Nagao, T. Fishing activity prediction from satellite boat detection data. In Proceedings of the 2020 IEEE International Conference on Systems, Man, and Cybernetics (SMC), Toronto, ON, Canada, 11–14 October 2020; pp. 2870–2875. [Google Scholar]
- Ronneberger, O.; Fischer, P.; Brox, T. U-net: Convolutional networks for biomedical image segmentation. In Proceedings of the Medical Image Computing and Computer-Assisted Intervention–MICCAI 2015: 18th International Conference, Munich, Germany, 5–9 October 2015; Proceedings, Part III 18. pp. 234–241. [Google Scholar]
- Liu, W.; Nie, Y.; Chen, X.; Li, J.; Zhao, L.; Zheng, F.; Han, Y.; Liu, S. Deep Learning Method in Complex Scenes Luminous Ship Target Detection. Spacecr. Recovery Remote Sens. 2022, 43, 124–137. [Google Scholar]
- Ren, S.; He, K.; Girshick, R.; Sun, J. Faster r-cnn: Towards real-time object detection with region proposal networks. In Proceedings of the Advances in Neural Information Processing Systems, Montreal, QC, Canada, 7–12 December 2015. [Google Scholar]
- Lee, T.E.; Miller, S.D.; Turk, F.J.; Schueler, C.; Julian, R.; Deyo, S.; Dills, P.; Wang, S. The NPOESS VIIRS day/night visible sensor. Bull. Am. Meteorol. Soc. 2006, 87, 191–200. [Google Scholar] [CrossRef]
- Elvidge, C.D.; Baugh, K.E.; Kihn, E.A.; Kroehl, H.W.; Davis, E.R. Mapping city lights with nighttime data from the DMSP Operational Linescan System. Photogramm. Eng. Remote Sens. 1997, 63, 727–734. [Google Scholar]
- Liao, L.; Weiss, S.; Mills, S.; Hauss, B. Suomi NPP VIIRS day-night band on-orbit performance. J. Geophys. Res. Atmos. 2013, 118, 12705–12718. [Google Scholar] [CrossRef]
- Li, D.; Zhang, G.; Shen, X.; Zhong, X.; Jiang, Y.; Wang, T.; Tu, J.; Li, Z. Design and processing night light remote sensing of LJ-1 01 satellite. J. Remote Sens. 2019, 23, 1011–1022. [Google Scholar] [CrossRef]
- Guo, H.; Dou, C.; Chen, H.; Liu, J.; Fu, B.; Li, X.; Zou, Z.; Liang, D. SDGSAT-1: The world’s first scientific satellite for sustainable development goals. Sci. Bull. 2022, 68, 34–38. [Google Scholar] [CrossRef]
- Wright, J.; Ganesh, A.; Rao, S.; Peng, Y.; Ma, Y. Robust principal component analysis: Exact recovery of corrupted low-rank matrices via convex optimization. In Proceedings of the Advances in Neural Information Processing Systems, Vancouver, BC, Canada, 7–10 December 2009. [Google Scholar]
- Ester, M.; Kriegel, H.-P.; Sander, J.; Xu, X. Density-based spatial clustering of applications with noise. In Proceedings of the International Conference Knowledge Discovery and Data Mining, Portland, OR, USA, 2–4 August 1996. [Google Scholar]
- Lin, Z.; Chen, M.; Ma, Y. The Augmented Lagrange Multiplier Method for Exact Recovery of Corrupted Low-Rank Matrices. arXiv 2010, arXiv:1009.5055. [Google Scholar]
- Gao, C.; Meng, D.; Yang, Y.; Wang, Y.; Zhou, X.; Hauptmann, A.G. Infrared patch-image model for small target detection in a single image. IEEE Trans. Image Process 2013, 22, 4996–5009. [Google Scholar] [CrossRef]
- Guo, J.; Wu, Y.; Dai, Y. Small target detection based on reweighted infrared patch-image model. IET Image Proc. 2018, 12, 70–79. [Google Scholar] [CrossRef]
- Vu, C.T.; Chandler, D.M. S3: A spectral and spatial sharpness measure. In Proceedings of the 2009 First International Conference on Advances in Multimedia, Colmar, France, 20–25 July 2009; pp. 37–43. [Google Scholar]
- Blanchet, G.; Moisan, L.; Rougé, B. Measuring the global phase coherence of an image. In Proceedings of the 2008 15th IEEE International Conference on Image Processing, San Diego, CA, USA, 12–15 October 2008; pp. 1176–1179. [Google Scholar]
- Karypis, G.; Han, E.-H.; Kumar, V. Chameleon: Hierarchical clustering using dynamic modeling. Computer 1999, 32, 68–75. [Google Scholar] [CrossRef]
- Guo, B.; Hu, D.; Zheng, Q. Potentiality of SDGSAT-1 glimmer imagery to investigate the spatial variability in nighttime lights. Int. J. Appl. Earth Obs. Geoinf. 2023, 119, 103313. [Google Scholar] [CrossRef]


Disclaimer/Publisher’s Note: The statements, opinions and data contained in all publications are solely those of the individual author(s) and contributor(s) and not of MDPI and/or the editor(s). MDPI and/or the editor(s) disclaim responsibility for any injury to people or property resulting from any ideas, methods, instructions or products referred to in the content. |
© 2023 by the authors. Licensee MDPI, Basel, Switzerland. This article is an open access article distributed under the terms and conditions of the Creative Commons Attribution (CC BY) license (https://creativecommons.org/licenses/by/4.0/).