
Light-Pollution-Monitoring Method for Selected Environmental and Social Elements


Abstract
:1. Introduction
2. Materials and Methods
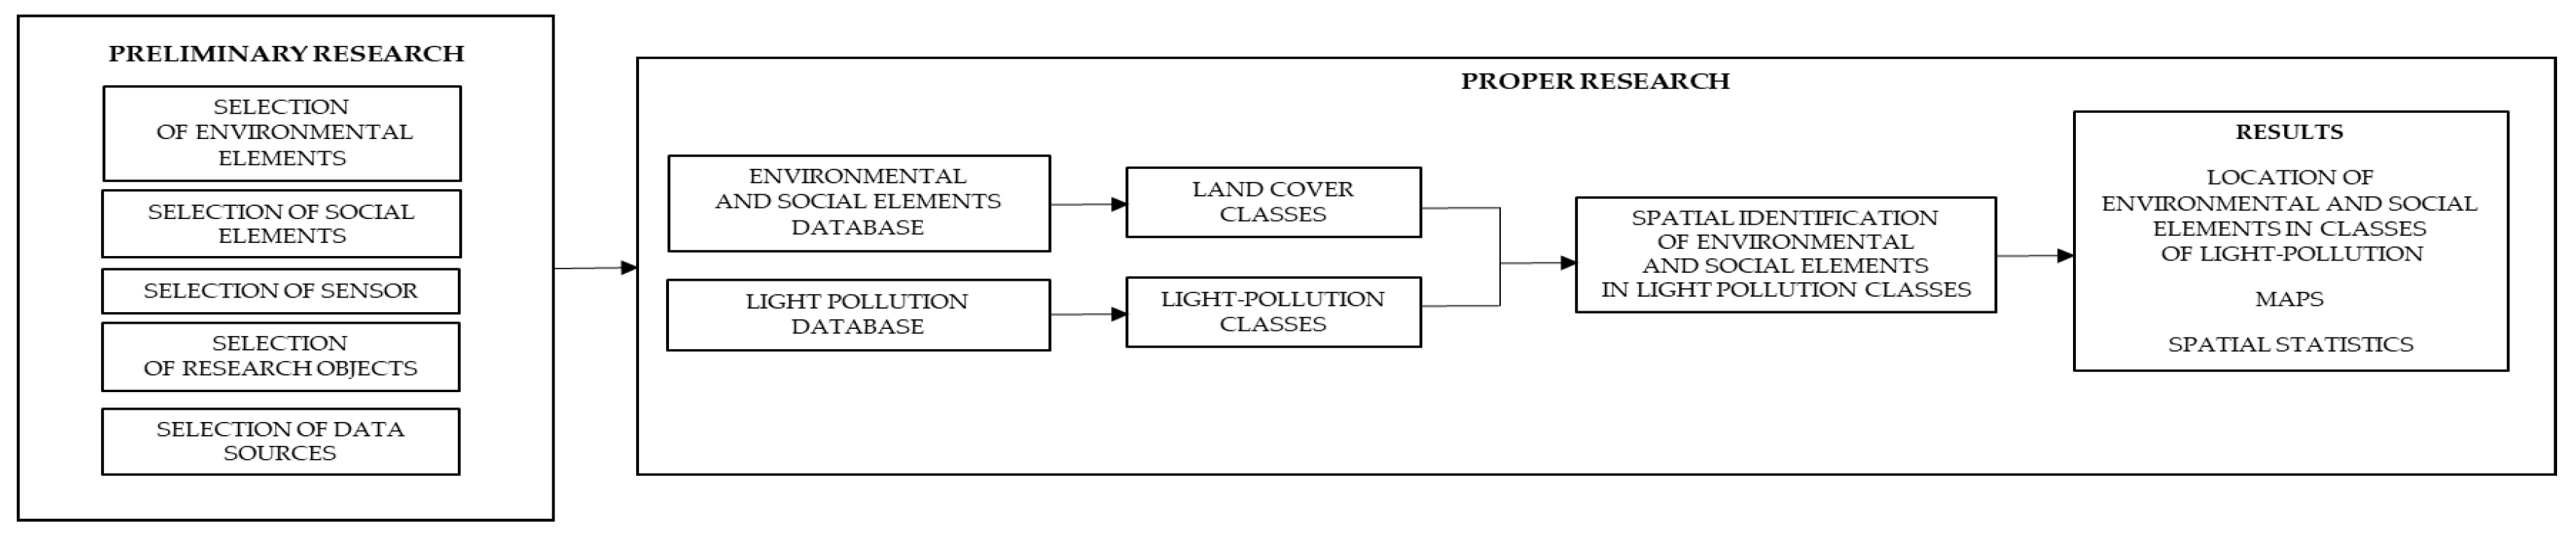
2.1. Preliminary Research
2.1.1. Selection of Environmental and Social Elements
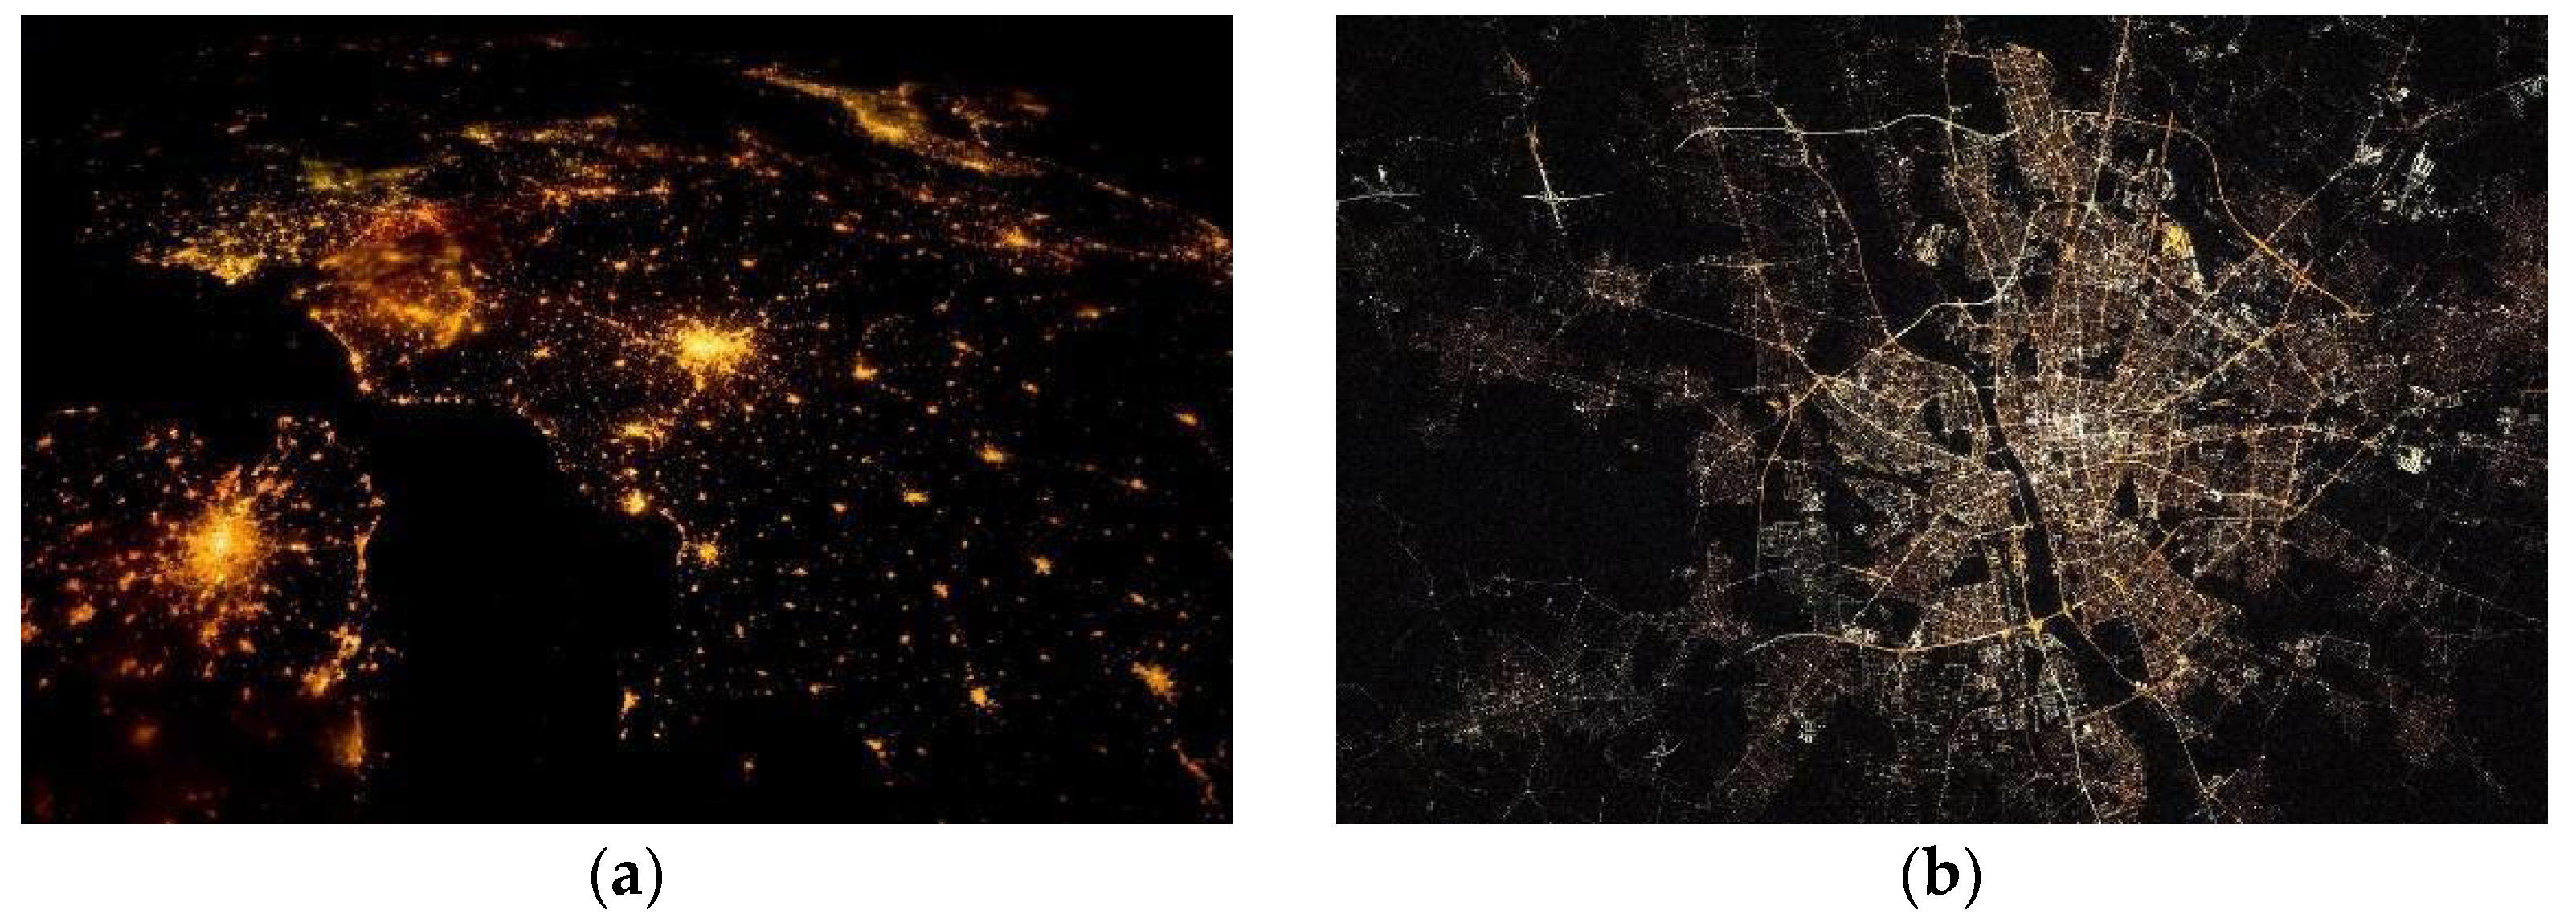
2.1.2. Selection of Sensors
2.1.3. Selection of Research Area
2.1.4. Selection of Data Sources
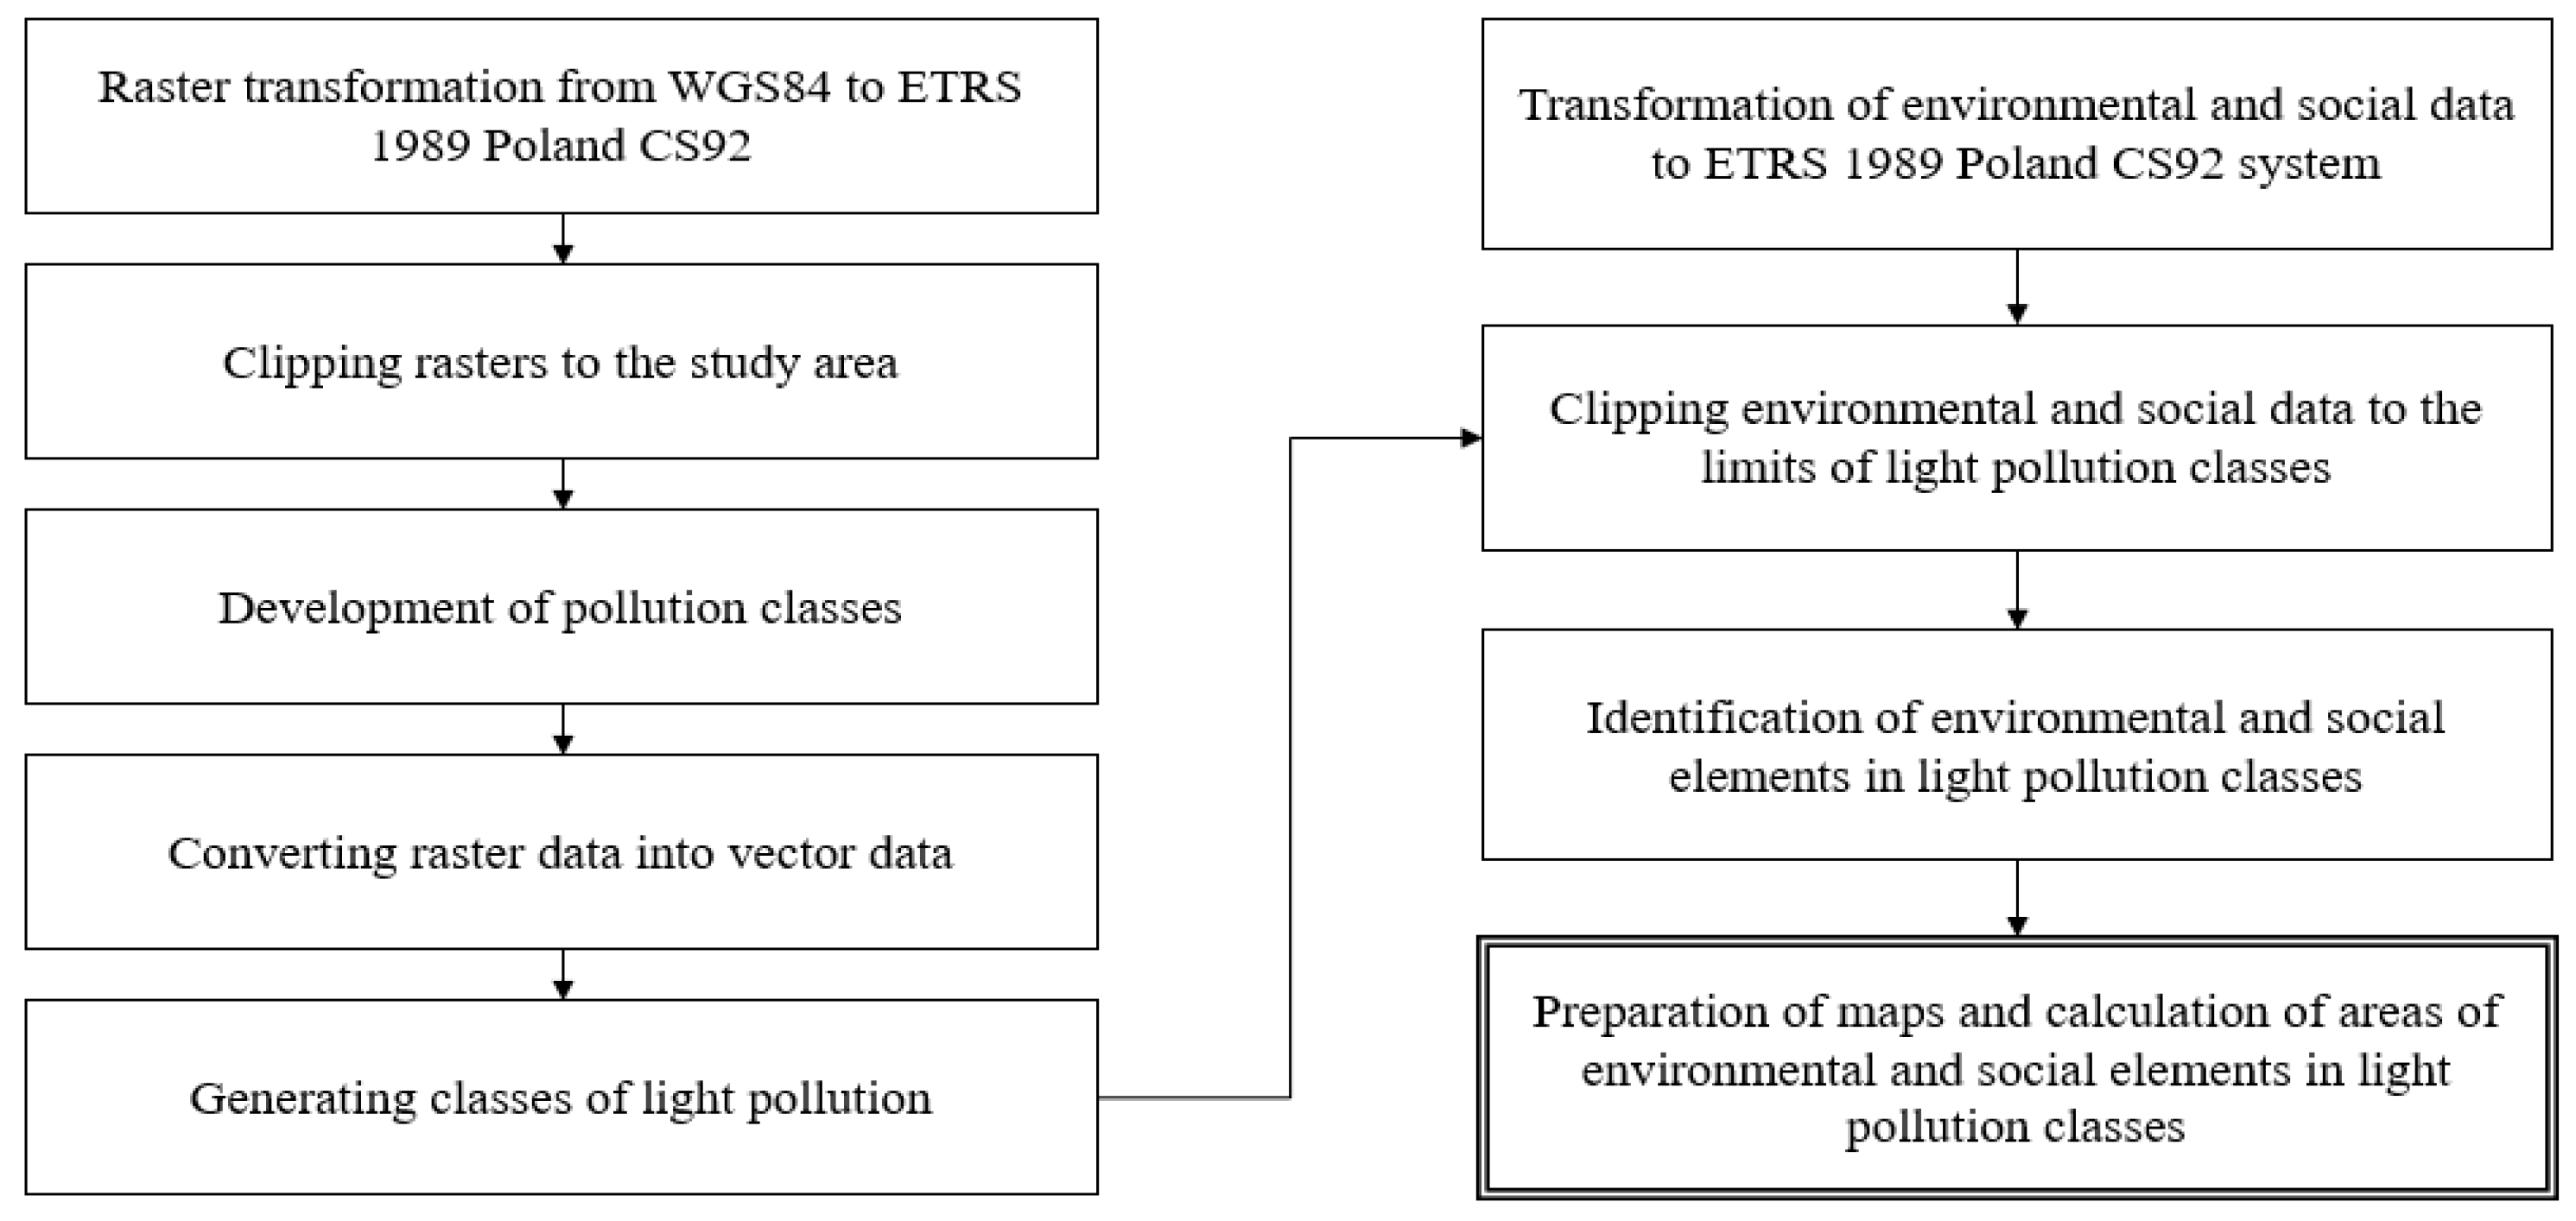
2.2. Proper Research
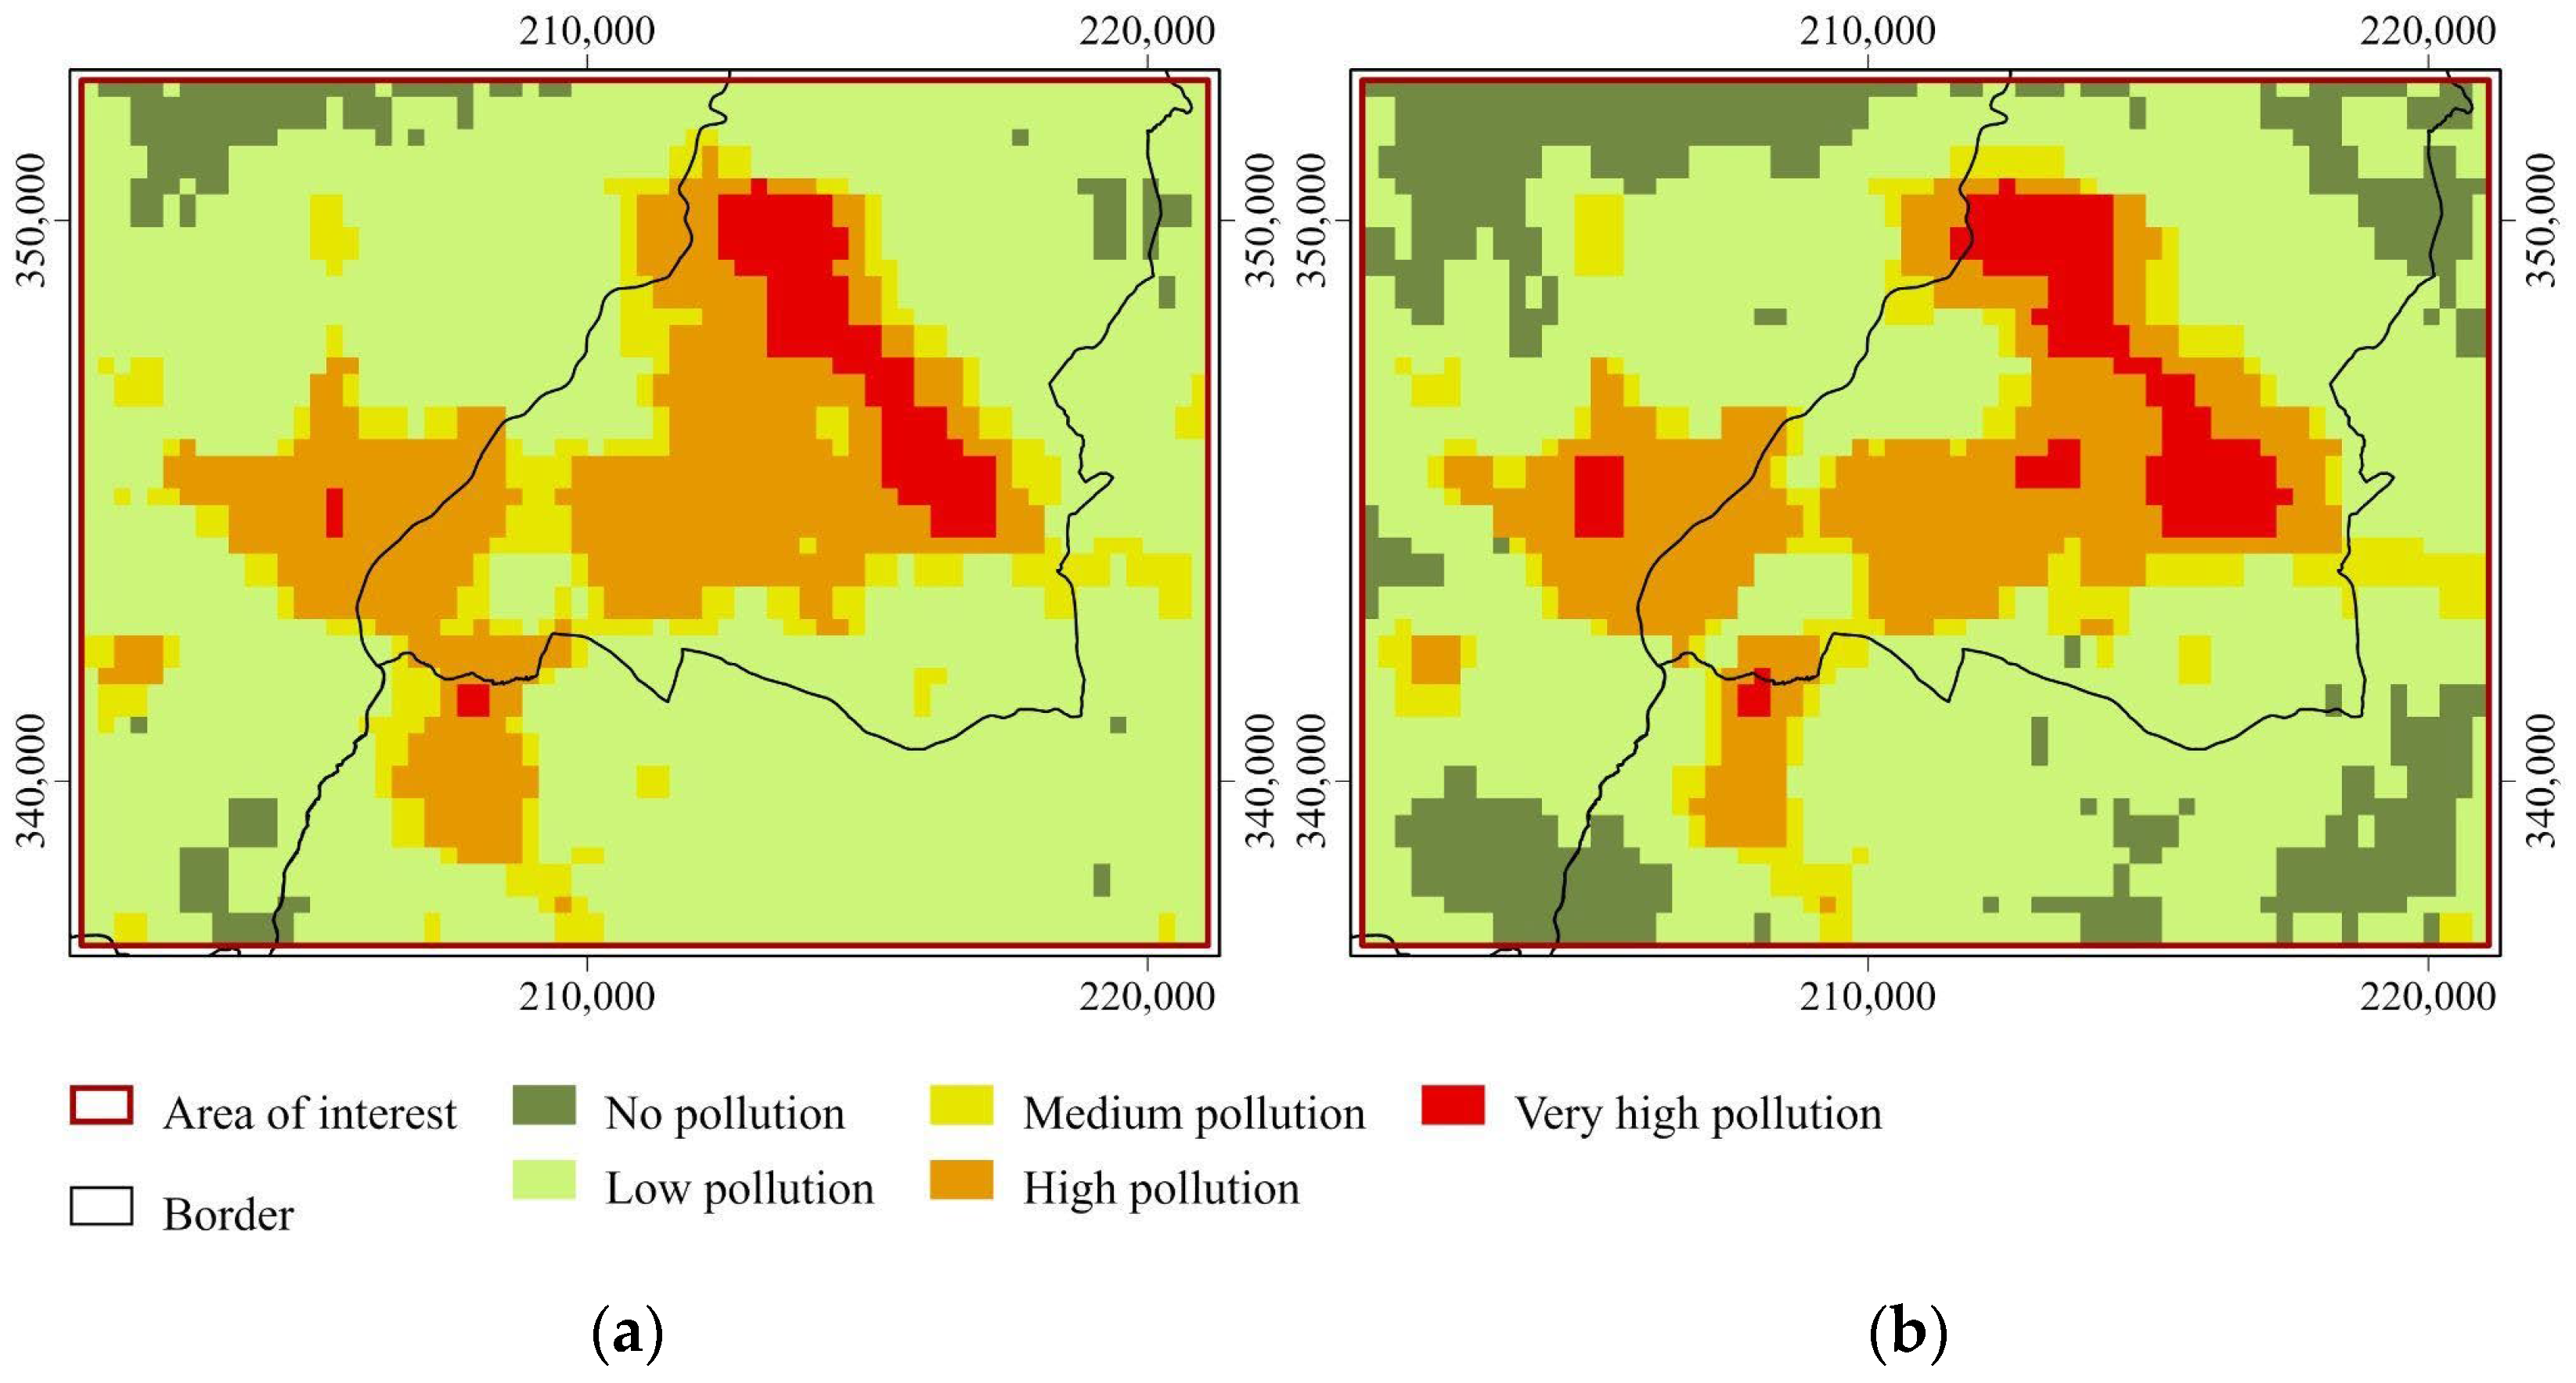
3. Results and Discussion
4. Conclusions
Author Contributions
Funding
Data Availability Statement
Conflicts of Interest
Appendix A
| 2014 | Area of Terrain Coverage in Light Pollution Classes | ||||
| Number of Classes | Class 1 [km2] | Class 2 [km2] | Class 3 [km2] | Class 4 [km2] | Class 5 [km2] |
| AnA | 0.02 | 9.95 | 4.58 | 14.96 | 3.95 |
| IA | 0.20 | 5.58 | 3.85 | 20.32 | 2.39 |
| AA | 6.86 | 126.47 | 15.07 | 15.27 | 1.19 |
| FA | 5.56 | 60.37 | 4.71 | 5.08 | 3.08 |
| WA | 0.00 | 0.53 | 0.21 | 0.12 | 0.00 |
| Part of Terrain Coverage Area in Relation to Light Pollution Class Areas. | |||||
| Number of Classes | Class 1 [%] | Class 2 [%] | Class 3 [%] | Class 4 [%] | Class 5 [%] |
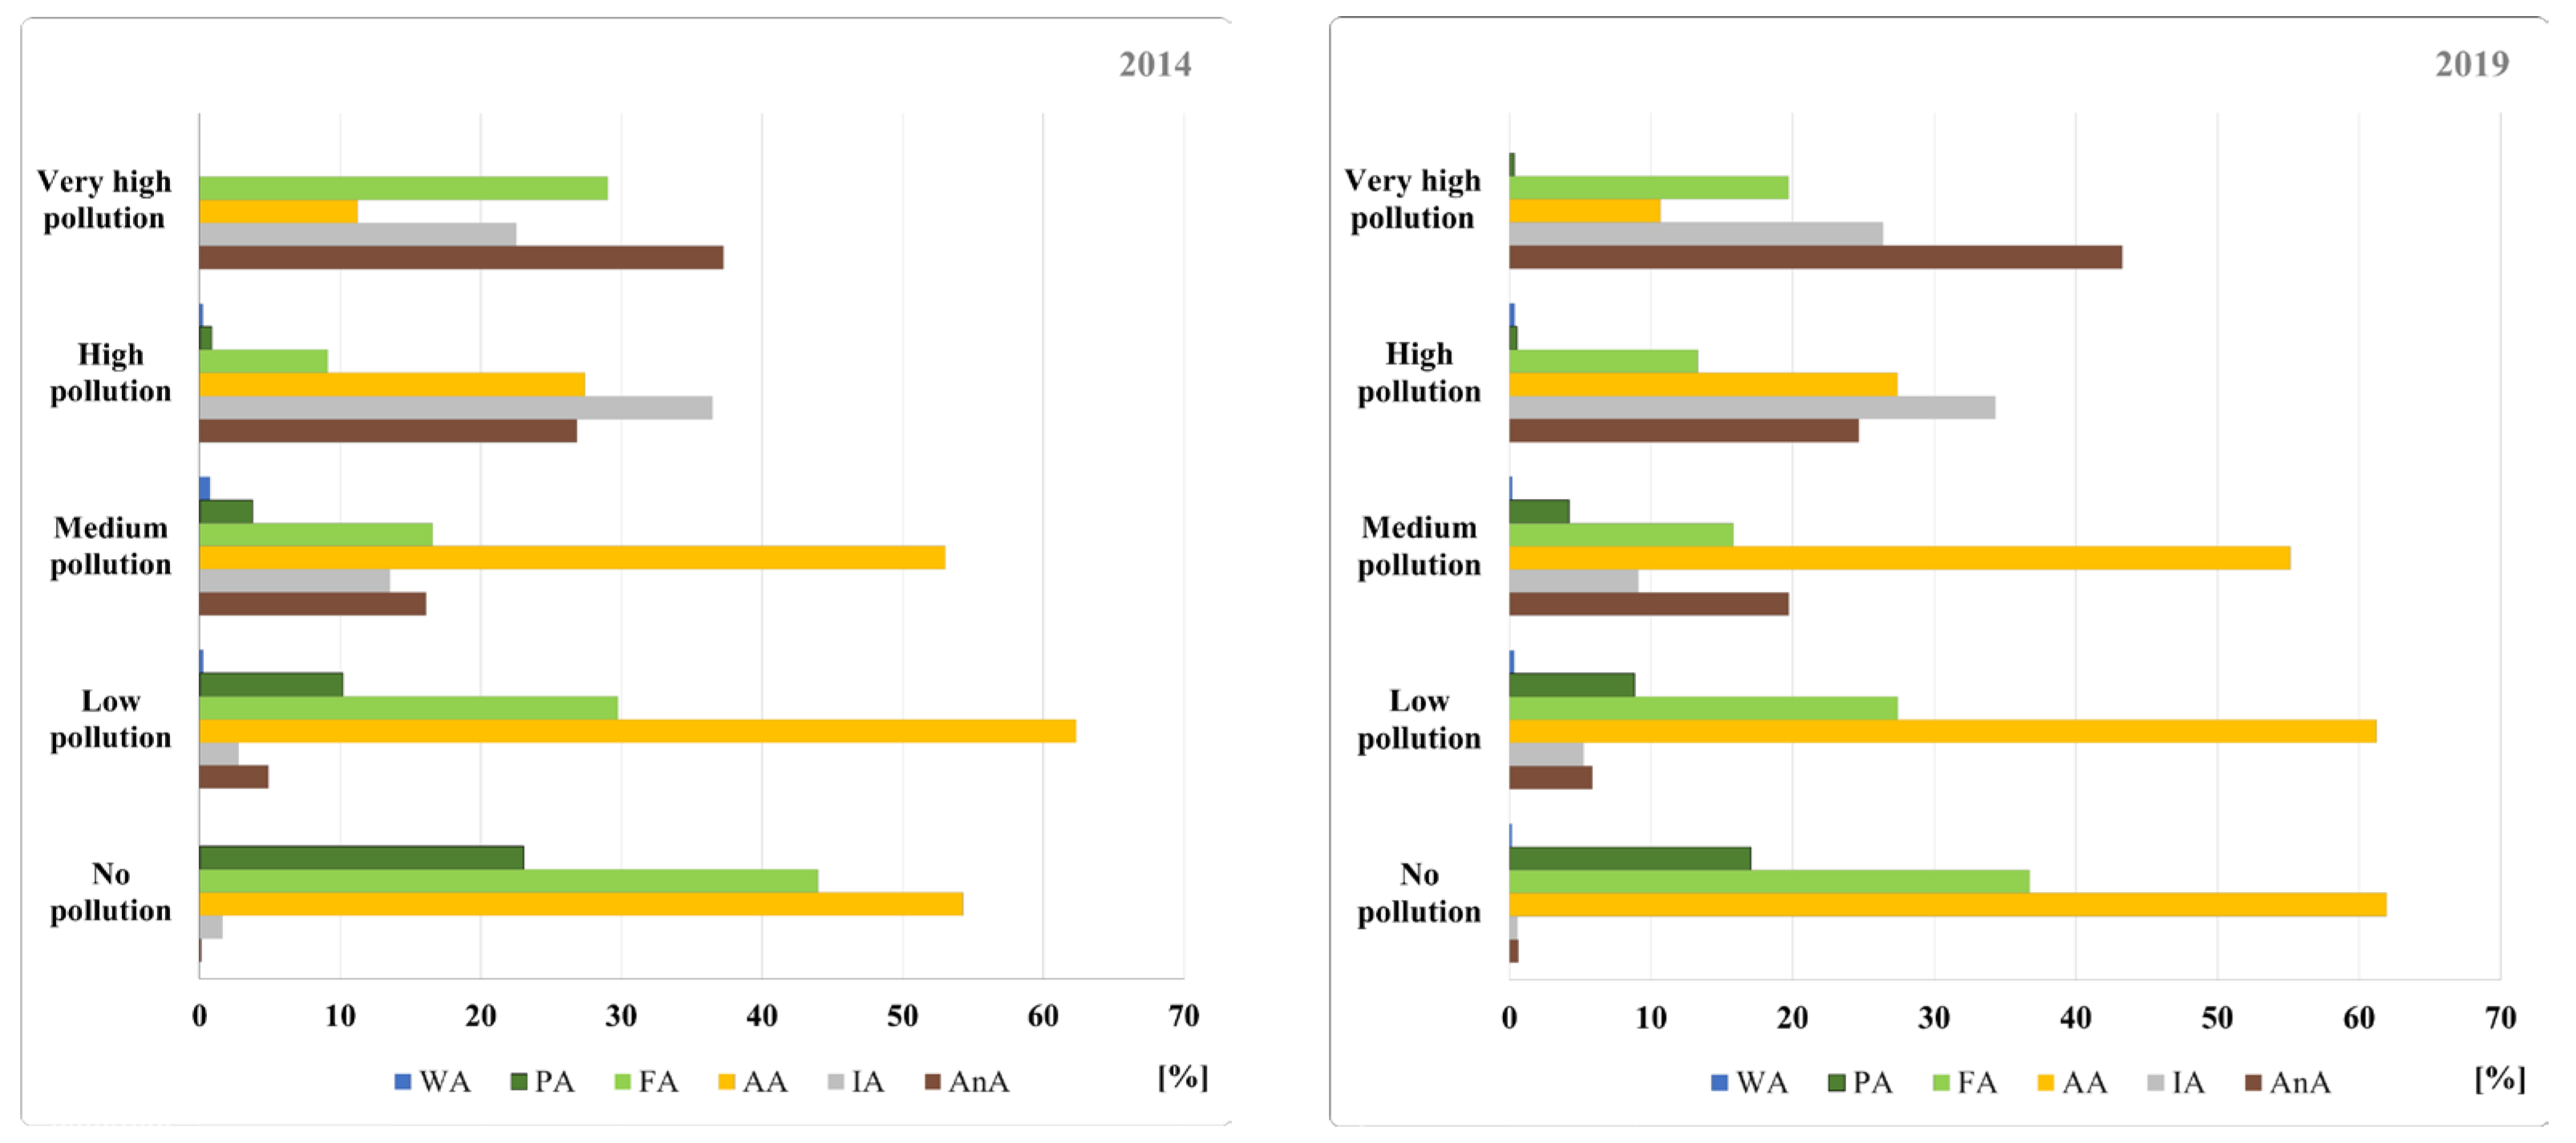
| AnA | 0.1 | 4.9 | 16.1 | 26.8 | 37.3 |
| IA | 1.6 | 2.7 | 13.5 | 36.5 | 22.5 |
| AA | 54.3 | 62.3 | 53.0 | 27.4 | 11.2 |
| FA | 44.0 | 29.8 | 16.6 | 9.1 | 29.0 |
| WA | 0.0 | 0.3 | 0.8 | 0.2 | 0.0 |
| 2019 | Area of Terrain Coverage in Light Pollution Classes. | ||||
| Number of Classes | Class 1 [km2] | Class 2 [km2] | Class 3 [km2] | Class 4 [km2] | Class 5 [km2] |
| AnA | 0.31 | 9.89 | 4.92 | 12.46 | 5.87 |
| IA | 0.29 | 8.89 | 2.27 | 17.31 | 3.58 |
| AA | 31.95 | 103.88 | 13.76 | 13.82 | 1.45 |
| FA | 18.95 | 46.51 | 3.95 | 6.71 | 2.68 |
| WA | 0.08 | 0.55 | 0.05 | 0.19 | 0.00 |
| Part of Terrain Coverage Area in Relation to Light Pollution Class Areas. | |||||
| Number of Classes | Class 1 [%] | Class 2 [%] | Class 3 [%] | Class 4 [%] | Class 5 [%] |
| AnA | 0.6 | 5.8 | 19.7 | 24.7 | 43.3 |
| IA | 0.6 | 5.2 | 9.1 | 34.3 | 26.4 |
| AA | 61.9 | 61.2 | 55.1 | 27.4 | 10.7 |
| FA | 36.7 | 27.4 | 15.8 | 13.3 | 19.7 |
| WA | 0.2 | 0.3 | 0.2 | 0.4 | 0.0 |
References
- Peña-García, A.; Sędziwy, A. Optimizing Lighting of Rural Roads and Protected Areas with White Light: A Compromise among Light Pollution, Energy Savings, and Visibility. LEUKOS J. Illum. Eng. Soc. 2020, 16, 147–156. [Google Scholar] [CrossRef]
- Menéndez-Velázquez, A.; Morales, D.; García-Delgado, A.B. Light Pollution and Circadian Misalignment: A Healthy, Blue-Free, White Light-Emitting Diode to Avoid Chronodisruption. Int. J. Environ. Res. Public Health 2022, 19, 1849. [Google Scholar] [CrossRef]
- Kyba, C.C.M.; Kuester, T.; Sánchez de Miguel, A.; Baugh, K.; Jechow, A.; Hölker, F.; Bennie, J.; Elvidge, S.D.; Gaston, K.J.; Guanter, L. Artificially lit surface of Earth at night increasing in radiance and extent. Sci. Adv. 2017, 3, 1–8. [Google Scholar] [CrossRef]
- Zielińska-Dabkowska, K.M.; Xavia, K.; Bobkowska, K. Assessment of Citizens’ Actions against Light Pollution with Guidelines for Future Initiatives. Sustainability 2020, 12, 4997. [Google Scholar] [CrossRef]
- Maggi, E.; Bongiorni, L.; Fontanini, D.; Capocchi, A.; Dal Bello, M.; Giacomelli, A.; Bendetti-Cecchi, L. Artificial light at night erases positive interactions across trophic levels. Funct. Ecol. 2020, 34, 694–706. [Google Scholar] [CrossRef]
- NASA Earth Observatory. January 2023. Available online: https://earthobservatory.nasa.gov/ (accessed on 10 February 2023).
- Gateway to Astronaut Photography of Earth—NASA. January 2023. Available online: https://eol.jsc.nasa.gov/ (accessed on 10 February 2023).
- Massetti, L.; Paterni, M.; Merlino, S. Monitoring Light Pollution with an Unmanned Aerial Vehicle: A Case Study Comparing RGB Images and Night Ground Brightness. Remote Sens. 2022, 14, 2052. [Google Scholar] [CrossRef]
- Checa, J.; Nel·lo, O. Urban Intensities. The Urbanization of the Iberian Mediterranean Coast in the Light of Nighttime Satellite Images of the Earth. Urban Sci. 2018, 2, 115. [Google Scholar] [CrossRef]
- Huang, Y.; Zhang, Y. Research on Digital Application of Lighting Design in Public Space Based on Cloud Computing and Data Mining. Wirel. Commun. Mob. Comput. 2021, 2021, 8802458. [Google Scholar] [CrossRef]
- Espey, B.R. Empirical Modelling of Public Lighting Emission Functions. Remote Sens. 2021, 13, 3827. [Google Scholar] [CrossRef]
- Škvareninová, J.; Tuhárska, M.; Škvarenina, J.; Babálová, D.; Slobodníková, L.; Slobodník, B.; Středová, H.; Minďaš, J. Effects of light pollution on tree phenology in the urban environment. Morav. Geogr. Rep. 2017, 25, 282–290. [Google Scholar] [CrossRef]
- Barentine, J.C. Methods for Assessment and Monitoring of Light Pollution around Ecologically Sensitive Sites. J. Imaging 2019, 5, 54. [Google Scholar] [CrossRef]
- Chalkias, C.; Petrakis, M.; Psiloglou, B.; Lianou, M. Modelling of light pollution in suburban areas using remotely sensed imagery and GIS. J. Environ. Manag. 2006, 79, 57–63. [Google Scholar] [CrossRef]
- Mu, H.; Li, X.; Du, X.; Huang, J.; Su, W.; Hu, T.; Wen, Y.; Yin, P.; Han, Y.; Xue, F. Evaluation of Light Pollution in Global Protected Areas from 1992 to 2018. Remote Sens. 2021, 13, 1849. [Google Scholar] [CrossRef]
- Kolláth, Z.; Száz, D.; Kolláth, K. Measurements and Modelling of Aritificial Sky Brightness: Combining Remote Sensing from Satellites and Ground-Based Observations. Remote Sens. 2021, 13, 3653. [Google Scholar] [CrossRef]
- Barentine, J.C.; Walczak, K.; Gyuk, G.; Tarr, C.; Longcore, T.A. Case for a New Satellite Mission for Remote Sensing of Night Lights. Remote Sens. 2021, 13, 2294. [Google Scholar] [CrossRef]
- Aubé, M.; Houle, J.-P.; Desmarais, J.; Veilleux, N.; Bordeleau, É. Modeling the Spectral Properties of Obtrusive Light Incident on a Window: Application to Montréal, Canada. Remote Sens. 2021, 13, 2767. [Google Scholar] [CrossRef]
- Ściężor, T. Effect of Street Lighting on the Urban and Rural Night-Time Radiance and the Brightness of the Night Sky. Remote Sens. 2021, 13, 1654. [Google Scholar] [CrossRef]
- Bustamante-Calabria, M.; Sánchez de Miguel, A.; Martín-Ruiz, S.; Ortiz, J.-L.; Vílchez, J.M.; Pelegrina, A.; García, A.; Zamorano, J.; Bennie, J.; Gaston, K.J. Effects of the COVID-19 Lockdown on Urban Light Emissions: Ground and Satellite Comparison. Remote Sens. 2021, 13, 258. [Google Scholar] [CrossRef]
- Jechow, A.; Hölker, F. Evidence That Reduced Air and Road Traffic Decreased Artificial Night-Time Skyglow during COVID-19 Lockdown in Berlin, Germany. Remote Sens. 2020, 12, 3412. [Google Scholar] [CrossRef]
- Bennie, J.; Davies, T.W.; Duffy, J.P.; Inger, R.; Gaston, K.J. Contrasting trends in light pollution across Europe based on satellite observed night time lights. Sci. Rep. 2014, 4, 3789. [Google Scholar] [CrossRef] [PubMed]
- de Jong, M.; Caro, S.P.; Gienapp, P.; Spoelstra, K.; Visser, M.E. Early Birds by Light at Night: Effects of Light Color and Intensity on Daily Activity Patterns in Blue Tits. J. Biol. Rhythm. 2017, 32, 323–333. [Google Scholar] [CrossRef]
- Hölker, F.; Wolter, C.H.; Perkin, E.K.; Tockner, K. Light pollution as a biodiversity threat. Trends Ecol. Evol. 2010, 25, 681–682. [Google Scholar] [CrossRef]
- Stone, T. Light Pollution: A Case Study in Framing an Environmental Problem. Ethics Policy Environ. 2017, 20, 279–293. [Google Scholar] [CrossRef]
- Hölker, F.; Bolliger, J.; Davies, T.W.; Giavi, S.; Jechow, A.; Kalinkat, G.; Longcore, T.; Spoelstra, K.; Tidau, S.; Visser, M.E.; et al. 11 Pressing Research Questions on How Light Pollution Affects Biodiversity. Front. Ecol. Evol. 2021, 9, 767177. [Google Scholar] [CrossRef]
- Zielińska-Dabkowska, K.M. Healthier and Environmentally Responsible Sustainable Cities and Communities. A New Design Framework and Planning Approach for Urban Illumination. Sustainability 2022, 14, 14525. [Google Scholar] [CrossRef]
- de Jong, M.; Ouyang, J.Q.; van Grunsven, R.H.A.; Visser, M.E.; Spoelstra, K. Do Wild Great Tits Avoid Exposure to Light at Night? PLoS ONE 2016, 11, e0157357. [Google Scholar] [CrossRef] [PubMed]
- Grubisic, M.; Haim, A.; Bhusal, P.; Dominoni, D.M.; Gabriel, K.M.A.; Jechow, A.; Kupprat, F.; Lerner, A.; Marchant, P.; Riley, W.; et al. Light Pollution, Circadian Photoreception, and Melatonin in Vertebrates. Sustainability 2019, 11, 6400. [Google Scholar] [CrossRef]
- Bjelajac, D.; Đerčan, B.; Kovačić, S. Dark skies and dark screens as a precondition for astronomy tourism and general well-being. Inf. Technol. Tour. 2021, 23, 19–43. [Google Scholar] [CrossRef]
- Rajput, S.; Naithani, M.; Meena, K.; Rana, S. Light pollution: Hidden perils in light and links to cancer. Sleep Vigil. 2021, 5, 5–16. [Google Scholar] [CrossRef]
- Widmer, K.; Beloconi, A.; Marnane, I.; Vounatsou, P. Review and Assessment of Available Information on Light Pollution in Europe (Eionet Report—ETC HE 2022/8). ISBN 978-82-93970-08-8, ETC HE c/o NILU, Kjeller, Norway. 2022. Available online: https://www.eionet.europa.eu/etcs/all-etc-reports (accessed on 10 February 2023).
- Gaston, K.J.; Davies, T.W.; Nedelec, S.L.; Holt, L.A. Impacts of Artificial Light at Night on Biological Timings. Annu. Rev. Ecol. Evol. Syst. 2017, 48, 49–68. [Google Scholar] [CrossRef]
- La Sorte, F.A.; Fink, D.; Buler, J.J.; Farnsworth, A.; Cabrera-Cruz, S.A. Seasonal associations with urban light pollution for nocturnally migrating bird populations. Glob. Change Biol. 2017, 23, 4609–4619. [Google Scholar] [CrossRef]
- Pauwels, J.; Le Viol, I.; Azam, C.; Valet, N.; Julien, J.-F.; Bas, Y.; Lemarchand, C.; Sanchez de Miguel, A.; Kerbiriou, C. Accounting for artificial light impact on bat activity for a biodiversity-friendly urban planning. Landsc. Urban Plan. 2019, 183, 12–25. [Google Scholar] [CrossRef]
- Grenis, K.; Murphy, S.M. Direct and indirect effects of light pollution on the performance of an herbivorous insect. Insect Sci. 2018, 26, 770–776. [Google Scholar] [CrossRef] [PubMed]
- Owens, A.C.S.; Cochard, P.; Durrant, J.; Farnworth, B.; Perkin, E.K.; Seymoure, B. Light pollution is a driver of insect declines. Biol. Conserv. 2020, 241, 108259. [Google Scholar] [CrossRef]
- Reyes-Riveros, R.; Altamirano, A.; De La Barrera, F.; Rozas-Vásquez, D.; Vieli, L.; Meli, P. Linking public urban green spaces and human well-being: A systematic review. Urban For. Urban Green. 2021, 61, 127105. [Google Scholar] [CrossRef]
- Veerkamp, C.J.; Schipper, A.M.; Hedlund, K.; Lazarova, T.; Nordin, A.; Hanson, H.I. A Review of Studies Assessing Ecosystem Services Provided by Urban Green and Blue Infrastructure. Ecosyst. Serv. 2021, 52, 101367. [Google Scholar] [CrossRef]
- López-Muciño, L.A.; García-García, F.; Cueto-Escobedo, J.; Acosta-Hernández, M.; Venebra-Muñoz, A.; Rodríguez-Alba, J.C. Sleep loss and addiction. Neurosci. Biobehav. Rev. 2022, 141, 104832. Available online: https://www.sciencedirect.com/science/article/abs/pii/S0149763422003219 (accessed on 10 January 2023). [CrossRef]
- Maithili, P.; Sharmitha, D.; Vigneshwaran, R.; Jeganath, R.; Suresh, M. Energy Efficient and Eco-Friendly Street Lighting. In Proceedings of the IEEE International Conference on Innovations in Green Energy and Healthcare Technologies (ICIGEHT’17), Coimbatore, India, 16–18 March 2017. [Google Scholar] [CrossRef]
- Rakonjac, I.; Zorić, A.; Rakonjac, I.; Milošević, J.; Marić, J.; Furundžić, D. Increasing the Livability of Open Public Spaces during Nighttime: The Importance of Lighting on Waterfront Areas. MDPI Sustainability 2022, 14, 6058. [Google Scholar] [CrossRef]
- Lynn, K.D.; QuijOn, P.A. Casting a Light on the Shoreline: The Influence of Light Pollution on Intertidal Settings. Front. Ecol. Evol. 2022, 10, 980776. [Google Scholar] [CrossRef]
- Kołomański, S. Light Pollution and Darkness “Go to the dark side of the night”. In Environmental and Social Effects of Light Pollution; Roge-Wiśniewska, M., Tomasik, K., Eds.; University of Warsaw Publishing House: Warszawa, Poland, 2015; ISBN 978-83-235-1872-3. [Google Scholar]
- Sánchez de Miguel, A.; Zamorano, J.; Castaño, J.G.; Pascual, S. Evolution of the energy consumed by street lighting in Spain estimated with DMSP-OLS data. J. Quant. Spectrosc. Radiat. Transf. 2014, 139, 109–117. [Google Scholar] [CrossRef]
- Walczak, K.; Gyuk, G.; Kruger, A.; Byers, E.; Huerta, S. NITESat: A High Resolution, Full-Color, Light Pollution Imaging Satellite Mission. Int. J. Sustain. Light. 2017, 19, 48–55. [Google Scholar] [CrossRef]
- Kyba, C.C.M.; Garz, S.; Kuechly, H.; De Miguel, A.S.; Zamorano, J.; Fischer, J.; Hölker, F. High-Resolution Imagery of Earth at Night: New Sources, Opportunities and Challenges. Remote Sens. 2015, 7, 1–23. [Google Scholar] [CrossRef]
- Robles, J.; Zamorano, J.; Pascual, S.; Sánchez de Miguel, A.; Gallego, J.; Gaston, K.J. Evolution of Brightness and Color of the Night Sky in Madrid. Remote Sens. 2021, 13, 1511. [Google Scholar] [CrossRef]
- Walczak, K.; Gyuk, G.; Garcia, J.; Tarr, C. Light Pollution Mapping from a Stratospheric High-Altitude Balloon Platform. Int. J. Sustain. Light. 2021, 23, 20–32. [Google Scholar] [CrossRef]
- Kuechly, H.U.; Kyba, C.h.C.M.; Ruhtz, T.; Lindemann, C.; Wolter Ch Fischer, J.; Hölker, F. Aerial survey and spatial analysis of sources of light pollution in Berlin, Germany. Remote Sens. Environ. 2012, 126, 39–50. [Google Scholar] [CrossRef]
- Deverchère, P.; Vauclair, S.; Bosch, G.; Moulherat, S.; Cornuau, J.H. Towards an absolute light pollution indicator. Sci. Rep. 2022, 12, 17050. [Google Scholar] [CrossRef]
- Puschnig, J.; Wallner, S.; Schwope, A.; Näslund, M. Long-term trends of light pollution assessed from SQM measurements and an empirical atmospheric model. Mon. Not. R. Astron. Soc. 2023, 518, 4449–4465. [Google Scholar] [CrossRef]
- Sánchez de Miguel, A.; Aubé, M.; Zamorano, J.; Kocifaj, M.; Roby, J.; Tapia, C. Sky Quality Meter measurements in a colour-changing world. Mon. Not. R. Astron. Soc. 2017, 467, 2966–2979. [Google Scholar] [CrossRef]
- ESA European Space Agency. Types of Orbit. January 2023. Available online: https://www.esa.int (accessed on 10 January 2023).
- Doll, C.N.H. CIESIN Thematic Guide to Night-time Light Remote Sensing and its Applications. Center for International Earth Science Information Network (CIESIN); Columbia University: Palisades, NY, USA, 2008; The Trustees of Columbia University in the City of New York; Available online: https://www.researchgate.net/publication/266160887 (accessed on 10 January 2023).
- Butt, M.J. Estimation of Light Pollution Using Satellite Remote Sensing and Geographic Information System Techniques. GIScience Remote Sens. 2012, 49, 609–621. [Google Scholar] [CrossRef]
- Small, C.H.; Pozzi, F.; Elvidge, C.D. Spatial analysis of global urban extent from DMSP-OLS night lights. Remote Sens. Environ. 2005, 96, 277–291. [Google Scholar] [CrossRef]
- Li, X.; Zhou, Y. Urban mapping using DMSP/OLS stable night-time light: A review. Int. J. Remote Sens. 2017, 38, 6030–6046. [Google Scholar] [CrossRef]
- Sutton, P. Modeling population density with night-time satellite imagery and GIS. Comput. Environ. Urban Syst. 1997, 21, 227–244. [Google Scholar] [CrossRef]
- Huang, Q.; Yang, X.; Gao, B.; Yang, Y.; Zhao, Y. Application of DMSP/OLS Nighttime Light Images: A Meta-Analysis and a Systematic Literature Review. Remote Sens. 2014, 6, 6844–6866. [Google Scholar] [CrossRef]
- Zhou, L.; Divakarla, M.; Liu, X.; Layns, A.; Goldberg, M. An Overview of the Science Performances and Calibration/Validation of Joint Polar Satellite System Operational Products. Remote Sens. 2019, 11, 698. [Google Scholar] [CrossRef]
- NESDIS National Environmental Satellite Data and Information Service. January 2023; JPSS Mission and Instruments. Available online: https://www.nesdis.noaa.gov/ (accessed on 10 January 2023).
- Elvidge, C.H.D.; Baugh, K.E.; Zhizhin, M.N.; Hsu, F.C.H. Why VIIRS data are superior to DMSP for mapping nighttime lights. Proc. Asia-Pac. Adv. Netw. 2013, 35, 62–69. [Google Scholar] [CrossRef]
- LP DAAC The Land Processes Distributed Active Archive Center. January 2023; VIIRS Overview. Available online: https://lpdaac.usgs.gov/ (accessed on 10 January 2023).
- Bagheri, S.; Karimzadeh, S.; Feizizadeh, B. Investigation and modeling of physical development of urban areas and its effects on light pollution using night light data. Int. J. Eng. Geosci. 2023, 8, 98–110. [Google Scholar] [CrossRef]
- Czarnecka, K.; Błażejczyk, K.; Morita, T. Characteristics of light pollution—A case study of Warsaw (Poland) and Fukuoka (Japan). Environ. Pollut. 2021, 291, 118113. [Google Scholar] [CrossRef]
- Nisar, H.; Sarwar, F.; Shirazi, S.A.; Amjad, D.; Aslam, R.W. Assessment and Monitoring of VIIRS-DNB and SQML-L light Pollution in Lahore-Pakistan. Int. J. Innov. Sci. Technol. 2022, 4, 94–109. Available online: https://journal.50sea.com/index.php/IJIST/article/view/144 (accessed on 10 January 2023). [CrossRef]
- Nurbandi, W.; Yusuf, F.R.; Prasetya, R.; Afrizal, M.D. Using Visible Infrared Imaging Radiometer Suite (VIIRS). Imagery to identify and analyze light pollution. IOP Conf. Ser. Earth Environ. Sci. 2016, 47, 012040. [Google Scholar] [CrossRef]
- Cozzolino, E.; Lasta, C.A. Use of VIIRS DNB satellite images to detect jigger ships involved in the Illex argentinus fishery. Remote Sens. Appl. Soc. Environ. 2016, 4, 167–178. [Google Scholar] [CrossRef]
- Yamaguchi, T.; Asanuma, I.; Park, J.G.; Mackin, K.J.; Mittleman, J. Estimation of vessel traffic density from Suomi NPP VIIRS day/night band. In Proceedings of the OCEANS 2016 MTS/IEEE Monterey, Monterey, CA, USA, 19–23 September 2016; pp. 1–5. [Google Scholar] [CrossRef]
- Bankert, R.L.; Solbrig, J.E.; Lee, T.F.; Miller, S.D. Automated Lightning Flash Detection in Nighttime Visible Satellite Data. Weather. Forecast. 2011, 26, 399–408. [Google Scholar] [CrossRef]
- Polivka, T.N.; Wang, J.; Ellison, L.T.; Hyer, E.J.; Ichoku, C.M. Improving Nocturnal Fire Detection With the VIIRS Day-Night Band. IEEE Trans. Geosci. Remote Sens. 2016, 54, 5503–5519. [Google Scholar] [CrossRef]
- Guo, W.; Lu, D.; Wu, Y.; Zhang, J. Mapping Impervious Surface Distribution with Integration of SNNP VIIRS-DNB and MODIS NDVI Data. Remote Sens. 2015, 7, 12459–12477. [Google Scholar] [CrossRef]
- Cao, C.; Shao, X.; Uprety, S. Detecting Light Outages After Severe Storms Using the S-NPP/VIIRS Day/Night Band Radiances. IEEE Geosci. Remote Sens. Lett. 2013, 10, 1582–1586. [Google Scholar] [CrossRef]
- Kocifaj, M.; Bará, S. Aerosol characterization using satellite remote sensing of light pollution sources at night. Mon. Not. R. Astron. Soc. Lett. 2020, 495, L76–L80. [Google Scholar] [CrossRef]
- Levin, N.; Kyba, C.h.C.M.; Zhang, Q.; Sánchez de Miguel, A.; Román, M.O.; Li, X.; Portnov, B.A.; Molthan, A.L.; Jechow, A.; Miller, S.D.; et al. Remote sensing of night lights: A review and an outlook for the future. Remote Sens. Environ. 2020, 237, 111443. [Google Scholar] [CrossRef]
- Stare, J. Help Using lightpollutionmap.info. ©2023 Microsoft Corporation ©2023 TomTom. December 2023. Available online: https://www.lightpollutionmap.info/help.html (accessed on 10 December 2023).
- Falchi, F.; Cinzano, P.; Duriscoe, D.; Kyba, C.h.C.M.; Elvidge, C.D.; Baugh, K.; Portnov, B.A.; Rybnikova, N.A.; Furgoni, R. The new world atlas of artificial night sky brightness. Sci. Adv. 2016, 2, e1600377. [Google Scholar] [CrossRef]
- Han, P.; Huang, J.; Li, R.; Wang, L.; Hu, Y.; Wang, J.; Huang, W. Monitoring Trends in Light Pollution in China Based on Nighttime Satellite Imagery. Remote Sens. 2014, 6, 5541–5558. [Google Scholar] [CrossRef]
- Stare, J. Light Pollution Map ©2023 Microsoft Corporation ©2023 TomTom. December 2023. Available online: https://www.lightpollutionmap.info (accessed on 10 December 2023).
- Copernicus Land Monitoring Service. January 2023. Available online: https://land.copernicus.eu/ (accessed on 5 January 2023).
- EEA European Environment Agency. January 2023. Available online: https://www.eea.europa.eu/ (accessed on 5 January 2023).
- Protected Planet. December 2023. Available online: https://www.protectedplanet.net/ (accessed on 10 December 2023).
- UNEP-WCMC. World Database on Protected Areas User Manual 1.4. UNEP-WCMC: Cambridge, UK, January 2016. Available online: http://wcmc.io/ (accessed on 10 February 2023).
- Radiance Lights Trends. January 2023. Available online: https://lighttrends.lightpollutionmap.info (accessed on 10 January 2023).
- Microsoft® Bing™ Maps Platform API. 2023. Available online: https://www.microsoft.com (accessed on 10 January 2023).
- GEOEssential HORIZON 2020—ERA-PLANET the European Network for Observing Our Changing Planet. January 2023. Available online: https://www.geoessential.eu/ (accessed on 10 January 2023).
- LAADS DAAC Level-1 and Atmosphere Archive & Distribution System Distributed Active Archive Center. VNP46A4—VIIRS/NPP Lunar BRDF-Adjusted Nighttime Lights Yearly L3 Global 15 arc Second Linear Lat Lon Grid. 2023. Available online: https://ladsweb.modaps.eosdis.nasa.gov/ (accessed on 10 January 2023).
- Tukey, J.W. Exploratory Data Analysis; Addison-Wesley Publishing Company: Boston, MA, USA, 1977; ISBN 0-201-07616-072. [Google Scholar]
- EARTHDATA Open Access for Open Science. Nighttime Lights. Backgrounder on VIIRS Day/Night Band and Its Applications. January 2023. Available online: https://www.earthdata.nasa.gov/ (accessed on 10 January 2023).
- Román, M.O.; Wang, Z.; Shrestha, R.; Yao, T.; Kalb, V. VIIRS Black Marble User Guide (Version 1.2); NASA: Washington, DC, USA, 2021. Available online: https://viirsland.gsfc.nasa.gov/PDF/BlackMarbleUserGuide_v1.2_20210421.pdf (accessed on 10 February 2023).
- SMA State Mining Authority. Information No. 46/2016/EW about a Dangerous Event Consisting in the Loss of Stability of the Slopes of the Internal Heap (Slide), which Occurred on 26 September 2016 at approx. 21, in the Mining Plant of PGE GiEK S.A. KWB Turów. December 2023. Available online: https://www.wug.gov.pl/ (accessed on 10 February 2023).
- Kuliś, A.; Tomaszkiewicz, J.; Kilińska, M. Environmental Impact Report, Continuation of exploitation of the Turów Lignite Deposit, Non-Technical Summary; PGE GIEK S.A. KWB Turów: Bogatynia, Poland, 2018. [Google Scholar]
- GUGiK Head Office of Geodesy and Cartography. February 2023. Available online: https://www.geoportal.gov.pl/ (accessed on 10 February 2023).
- NOAA National Centers for Environmental Information. Image and Data processing by NOAA’s National Geophysical Data Center. January 2023. Available online: https://www.ngdc.noaa.gov/ (accessed on 10 January 2023).
- Resolution Adopted by the General Assembly on 25 September 2015, A/70/L.1. Transforming Our World: The 2030 Agenda for Sustainable Development. Available online: https://documents-dds-ny.un.org/doc/UNDOC/GEN/N15/291/89/PDF/N1529189.pdf?OpenElement (accessed on 10 February 2023).
- Anderson, R.; Bayer, P.E.; Edwards, D. Climate change and the need for agricultural adaption. Curr. Opin. Plant Biol. 2020, 56, 197–202. [Google Scholar] [CrossRef]
- EU Biodiversity Strategy for 2030. Bringing Nature Back into Our Lives, COM(2020)380final. 2020. Available online: https://eur-lex.europa.eu/legal-content/EN/TXT/?uri=CELEX:52020DC0380 (accessed on 10 January 2023).
- Directive 2009/147/EC of the European Parliament and of the Council of 30 November 2009 on the Conservation of Wild Birds. 2009. Available online: https://eur-lex.europa.eu/legal-content/EN/TXT/PDF/?uri=CELEX:32009L0147 (accessed on 10 January 2023).
- Directive 2002/49/EC on the Assessment and Management of Environmental Noise. 2002. Available online: https://eur-lex.europa.eu/legal-content/PL/LSU/?uri=CELEX:32002L0049 (accessed on 10 January 2023).
- Resolution No. LXXXVIII/674/18 on Adopting a Local Spatial Development Plan for Separate Areas in the City and Commune of Bogatynia—Area 1. Available online: http://bip.bogatynia.pl/?a=10101 (accessed on 10 January 2023).
- Resolution No. XIV/87/19 on Adopting the Local Spatial Development Plan for Specified Areas in the City and Commune of Bogatynia-Areas 2 and 3. Available online: http://bip.bogatynia.pl/?a=10952 (accessed on 10 January 2023).
- Environmental Protection Programme for the Town and Municipality of Bogatynia for the Period 2020–2023 with an Outlook for 2027. Available online: http://bip.bogatynia.pl/?a=12824 (accessed on 10 January 2023).


| Class Number | Class Name | Radiance Value [nW/cm2/sr] | Pixel Value | Symbolization |
|---|---|---|---|---|
| 1 | No pollution | 0.000 | 1 |  |
| 2 | Low pollution | 0.001–1.500 | 2 |  |
| 3 | Medium pollution | 1.501–3.000 | 3 |  |
| 4 | High pollution | 3.001–15.000 | 4 |  |
| 5 | Very high pollution | 15.001–60.000 | 5 |  |
| Name | Symbol | Description | Code CLC | Symbolization |
|---|---|---|---|---|
| Anthropogenic areas | AnA | Continuous urban fabric | 111 |  |
| Discontinuous urban fabric | 112 | |||
| Communication areas | 122 | |||
| Green urban areas | 141 | |||
| Sport and leisure facilities | 142 | |||
| Industrial area | IA | Industrial or commercial units Mineral extraction sites Dump sites | 121 131 132 |  |
| Agricultural areas | AA | Non-irrigated arable land Pastures Complex cultivation patterns Land principally occupied by agriculture, with significant areas of natural vegetation | 211 231 242 243 |  |
| Forest areas | FA | Broad-leaved forest Coniferous forest Mixed forest Natural grasslands Transitional woodland–shrub | 311 312 313 321 324 |  |
| Water areas | WA | Water bodies | 512 |  |
| Class | 2014 | 2019 |
|---|---|---|
| Class 1 No pollution | 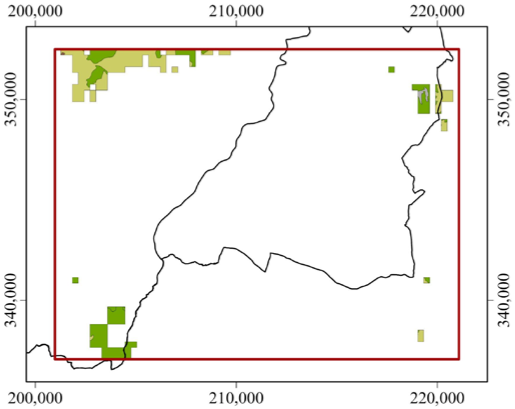 | 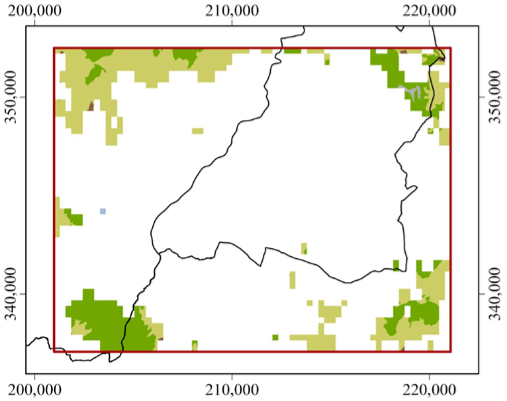 |
| Class 2 Low pollution | 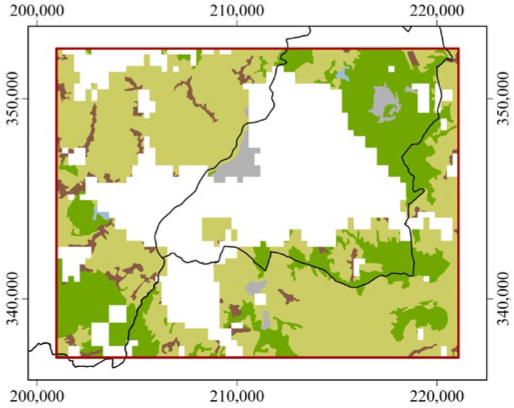 |  |
| Class 3 Medium pollution | 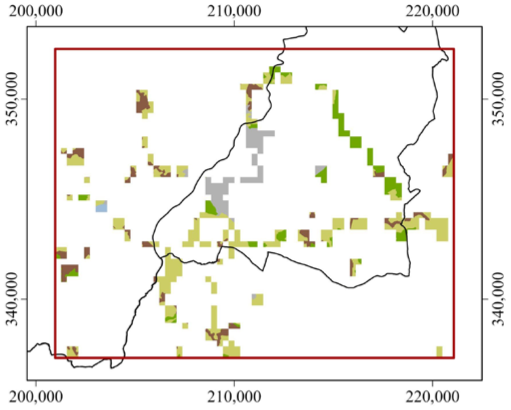 | 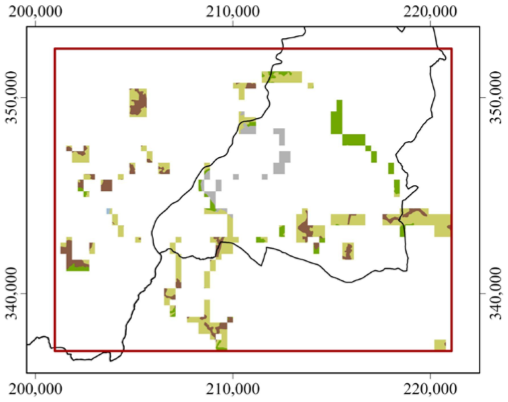 |
| Class 4 High pollution |  |  |
| Class 5 Very high pollution |  |  |
| State Before Event | State After Event |
|---|---|
23 May 2016  | 25 July 2019  |
| Orthophotomap [94] | |
January 2016  Image and data processing by NOAA’s National Geophysical Data Center, Microsoft® Bing™ Maps Platform APIs. [95] | October 2016 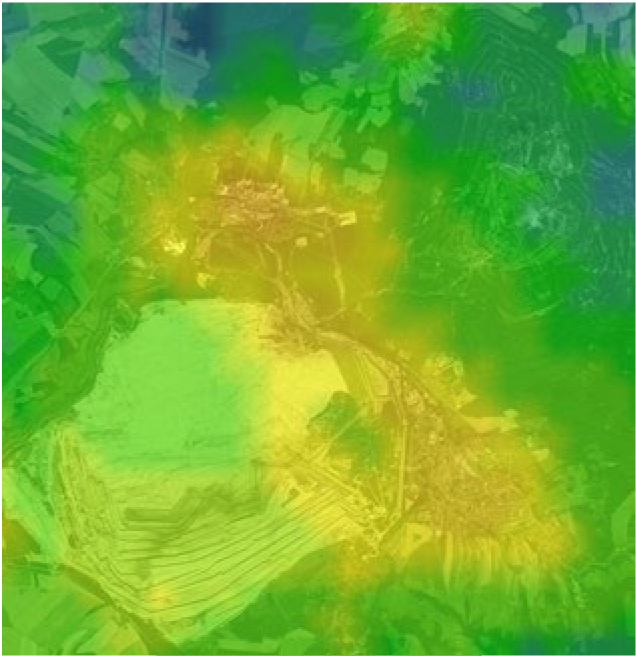  |
Disclaimer/Publisher’s Note: The statements, opinions and data contained in all publications are solely those of the individual author(s) and contributor(s) and not of MDPI and/or the editor(s). MDPI and/or the editor(s) disclaim responsibility for any injury to people or property resulting from any ideas, methods, instructions or products referred to in the content. |
© 2024 by the authors. Licensee MDPI, Basel, Switzerland. This article is an open access article distributed under the terms and conditions of the Creative Commons Attribution (CC BY) license (https://creativecommons.org/licenses/by/4.0/).
Share and Cite
Górniak-Zimroz, J.; Romańczukiewicz, K.; Sitarska, M.; Szrek, A. Light-Pollution-Monitoring Method for Selected Environmental and Social Elements. Remote Sens. 2024, 16, 774. https://doi.org/10.3390/rs16050774
Górniak-Zimroz J, Romańczukiewicz K, Sitarska M, Szrek A. Light-Pollution-Monitoring Method for Selected Environmental and Social Elements. Remote Sensing. 2024; 16(5):774. https://doi.org/10.3390/rs16050774
Chicago/Turabian StyleGórniak-Zimroz, Justyna, Kinga Romańczukiewicz, Magdalena Sitarska, and Aleksandra Szrek. 2024. "Light-Pollution-Monitoring Method for Selected Environmental and Social Elements" Remote Sensing 16, no. 5: 774. https://doi.org/10.3390/rs16050774