
Modeling Landslide Susceptibility in Forest-Covered Areas in Lin’an, China, Using Logistical Regression, a Decision Tree, and Random Forests
 , , , and
Abstract
:1. Introduction
2. Materials and Methods
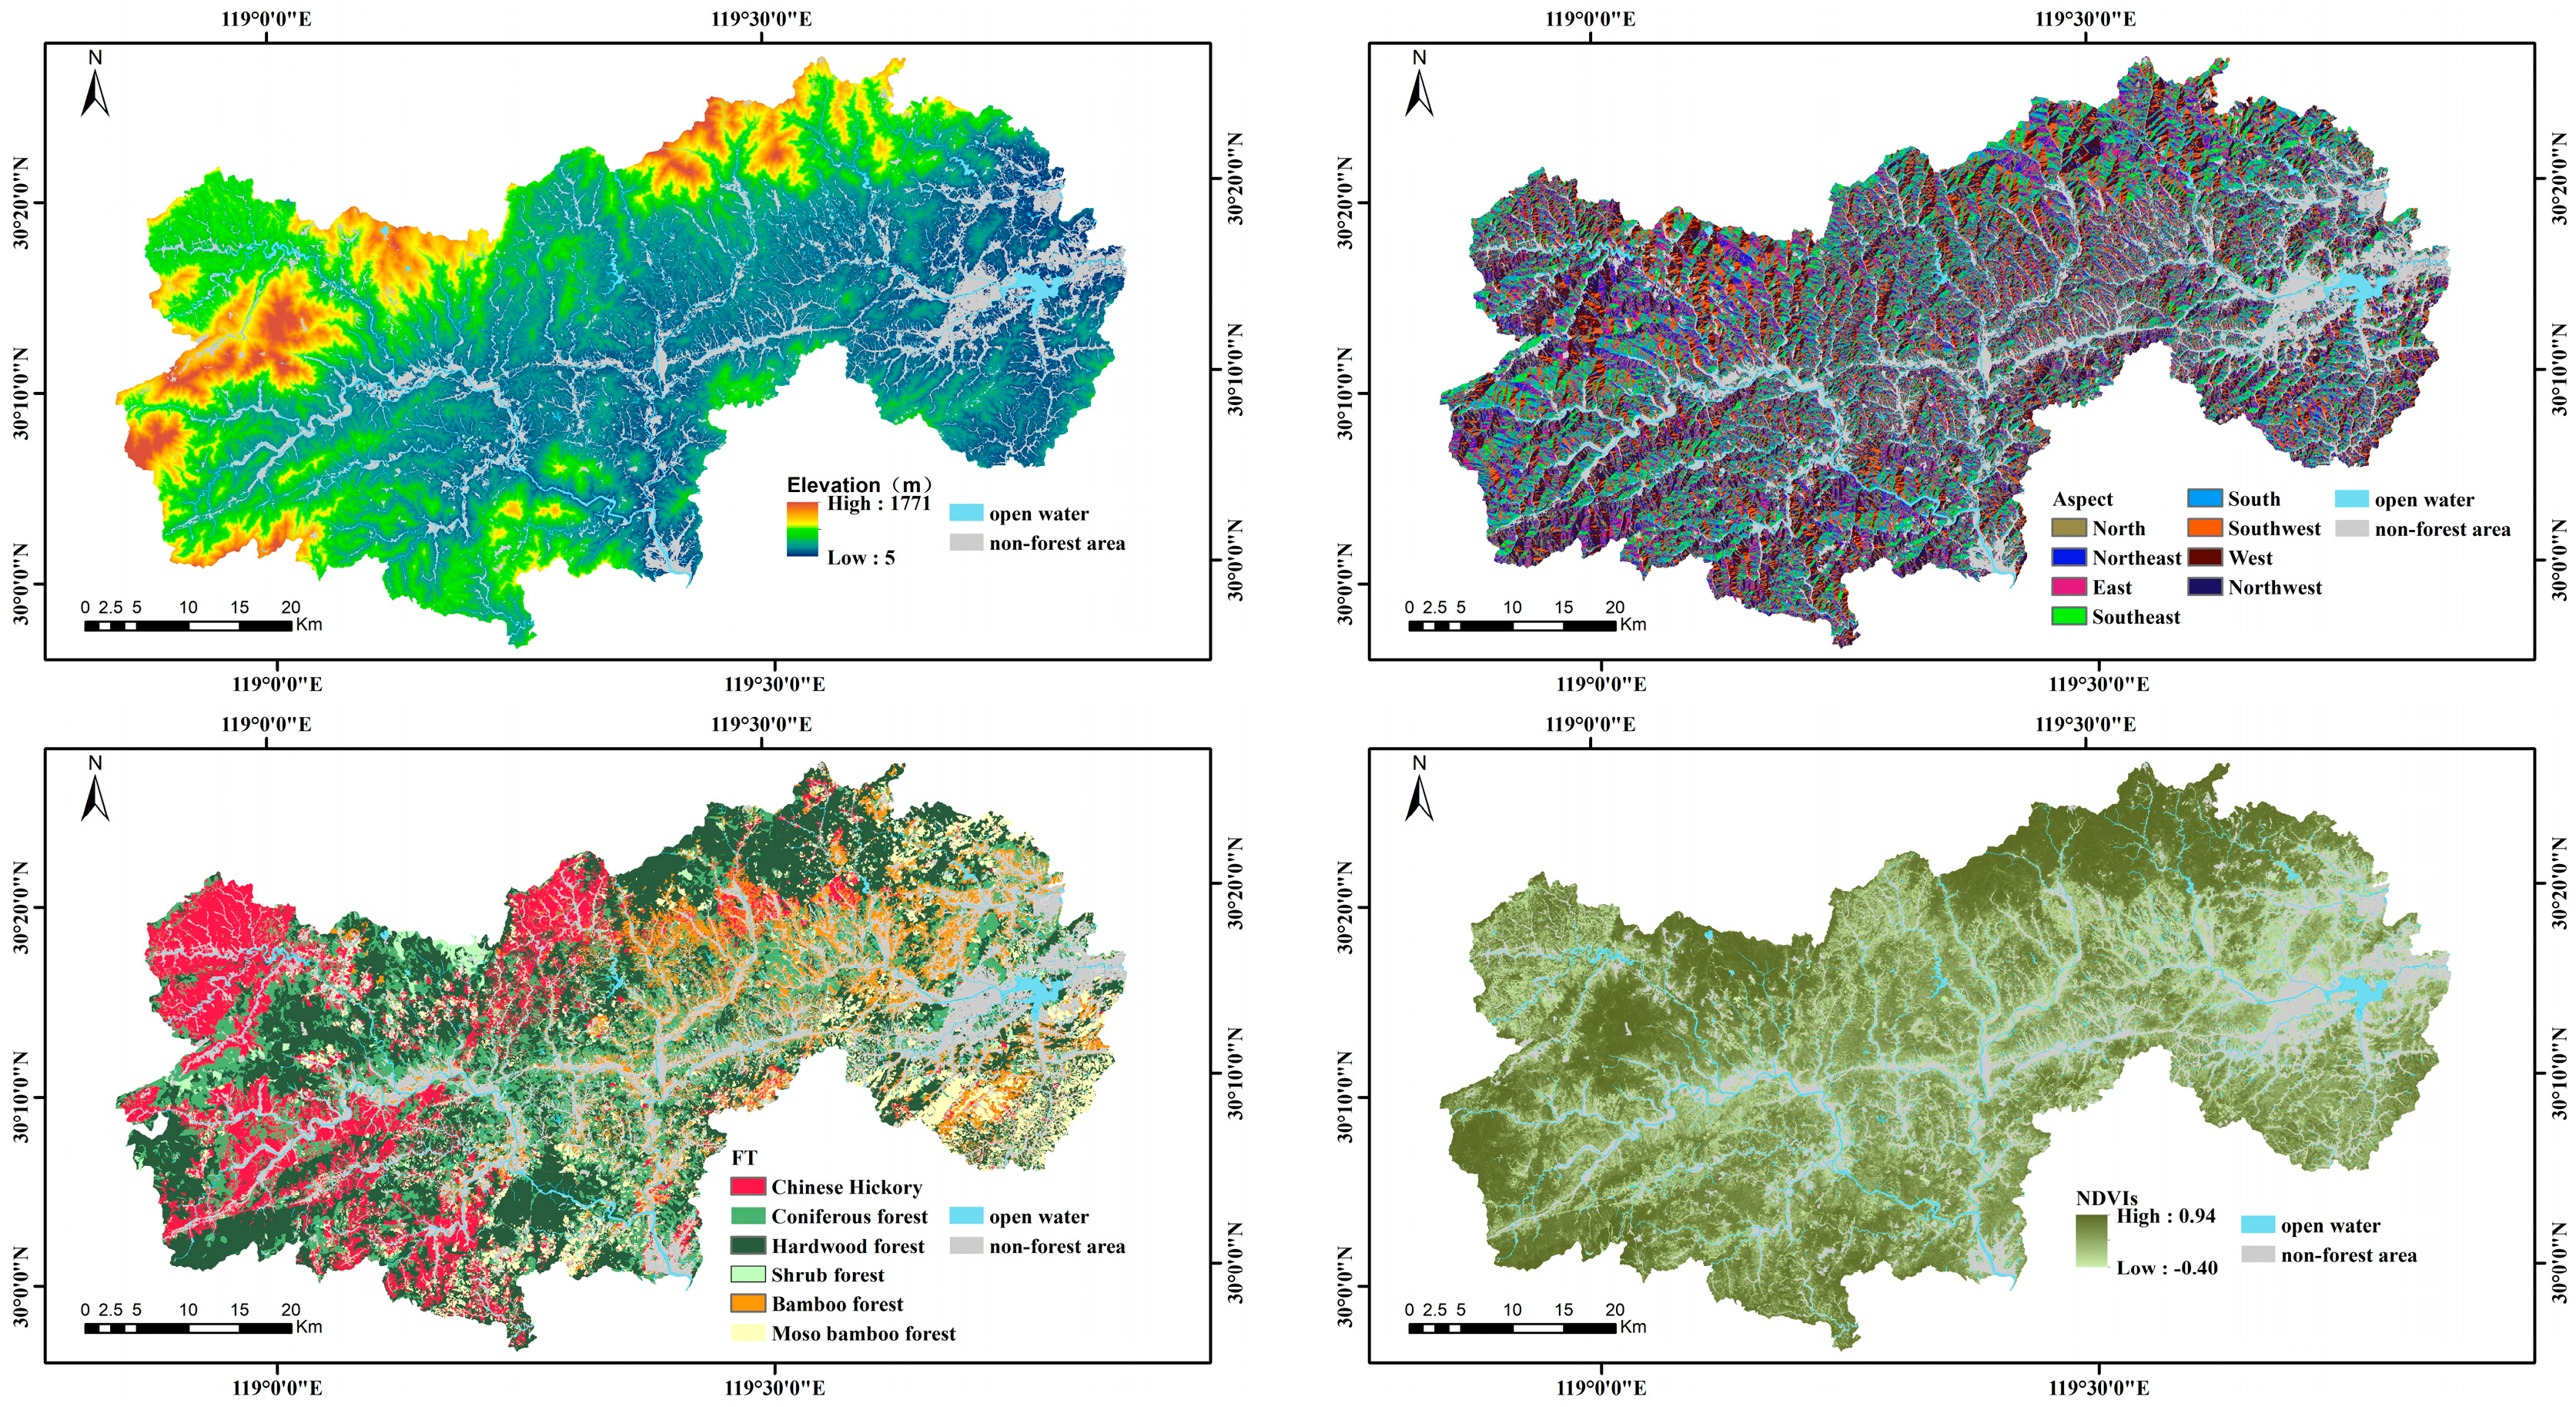
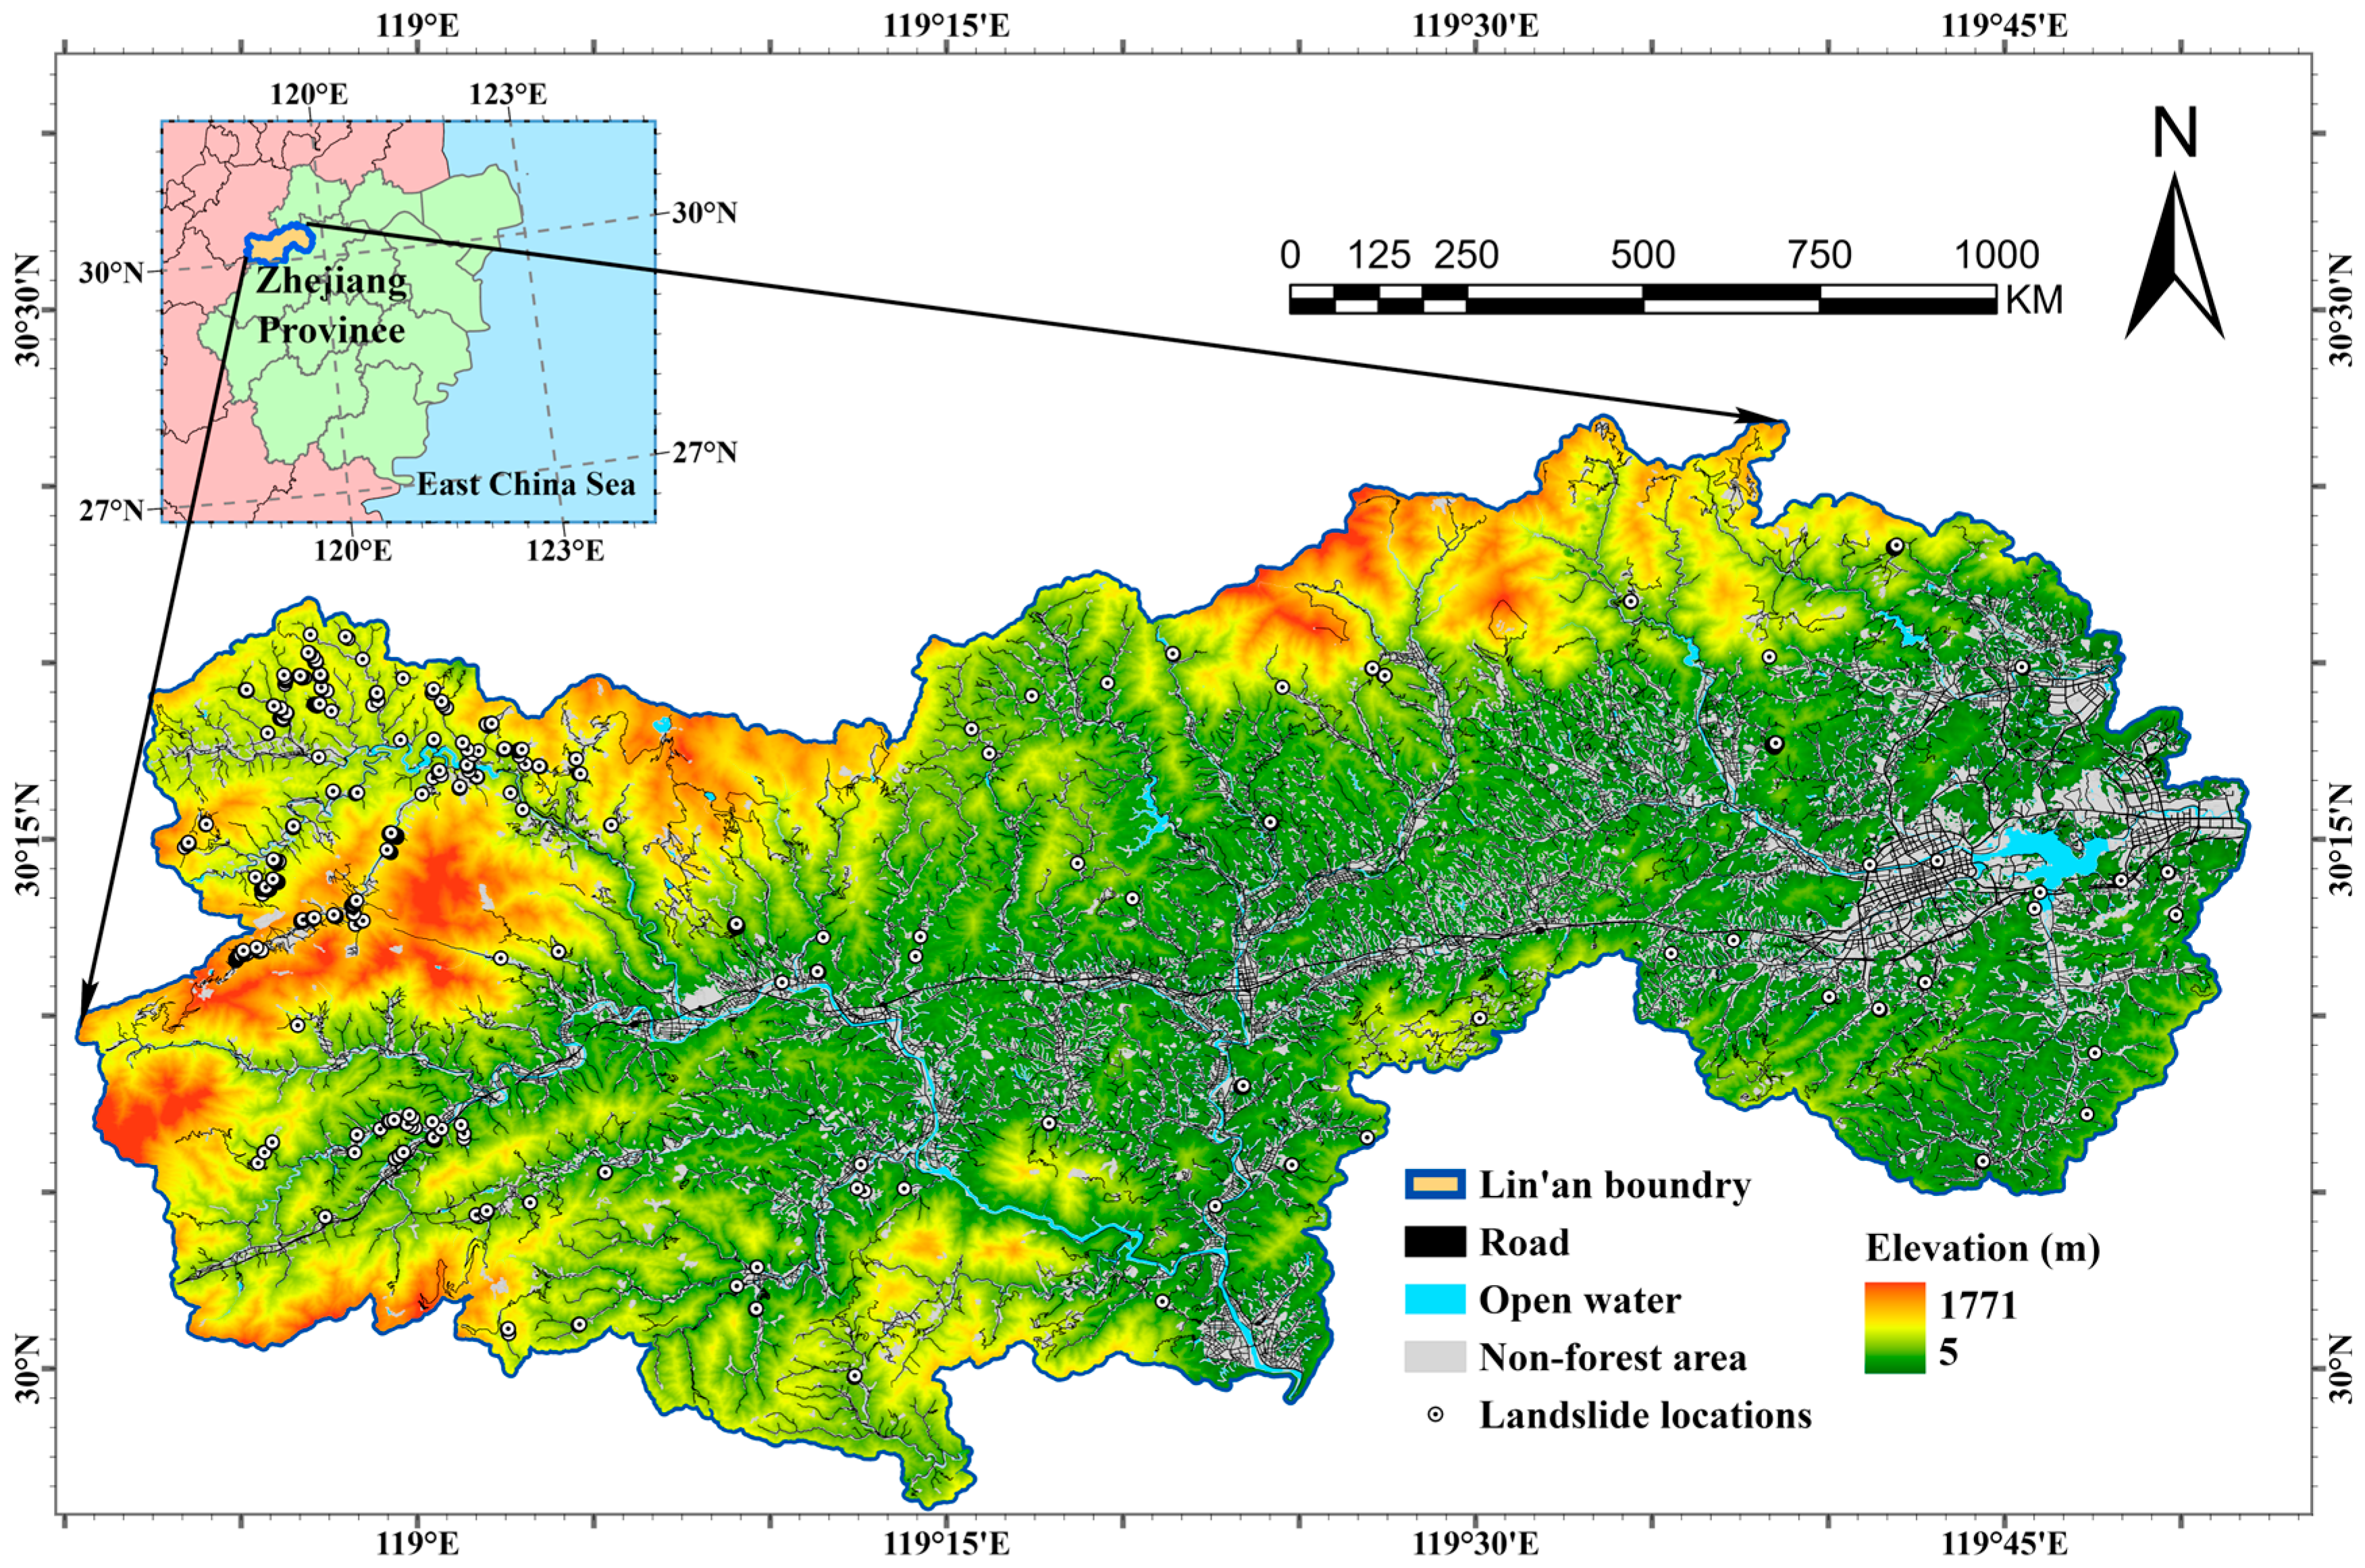
2.1. Study Area
2.2. Data Preparation
2.3. Model Development
2.3.1. Logistical Regression (LR)
2.3.2. Decision Tree (DT)
2.3.3. Random Forest (RF)
2.4. Model Evaluation
2.5. Developing the Landslide Susceptibility Maps
3. Results
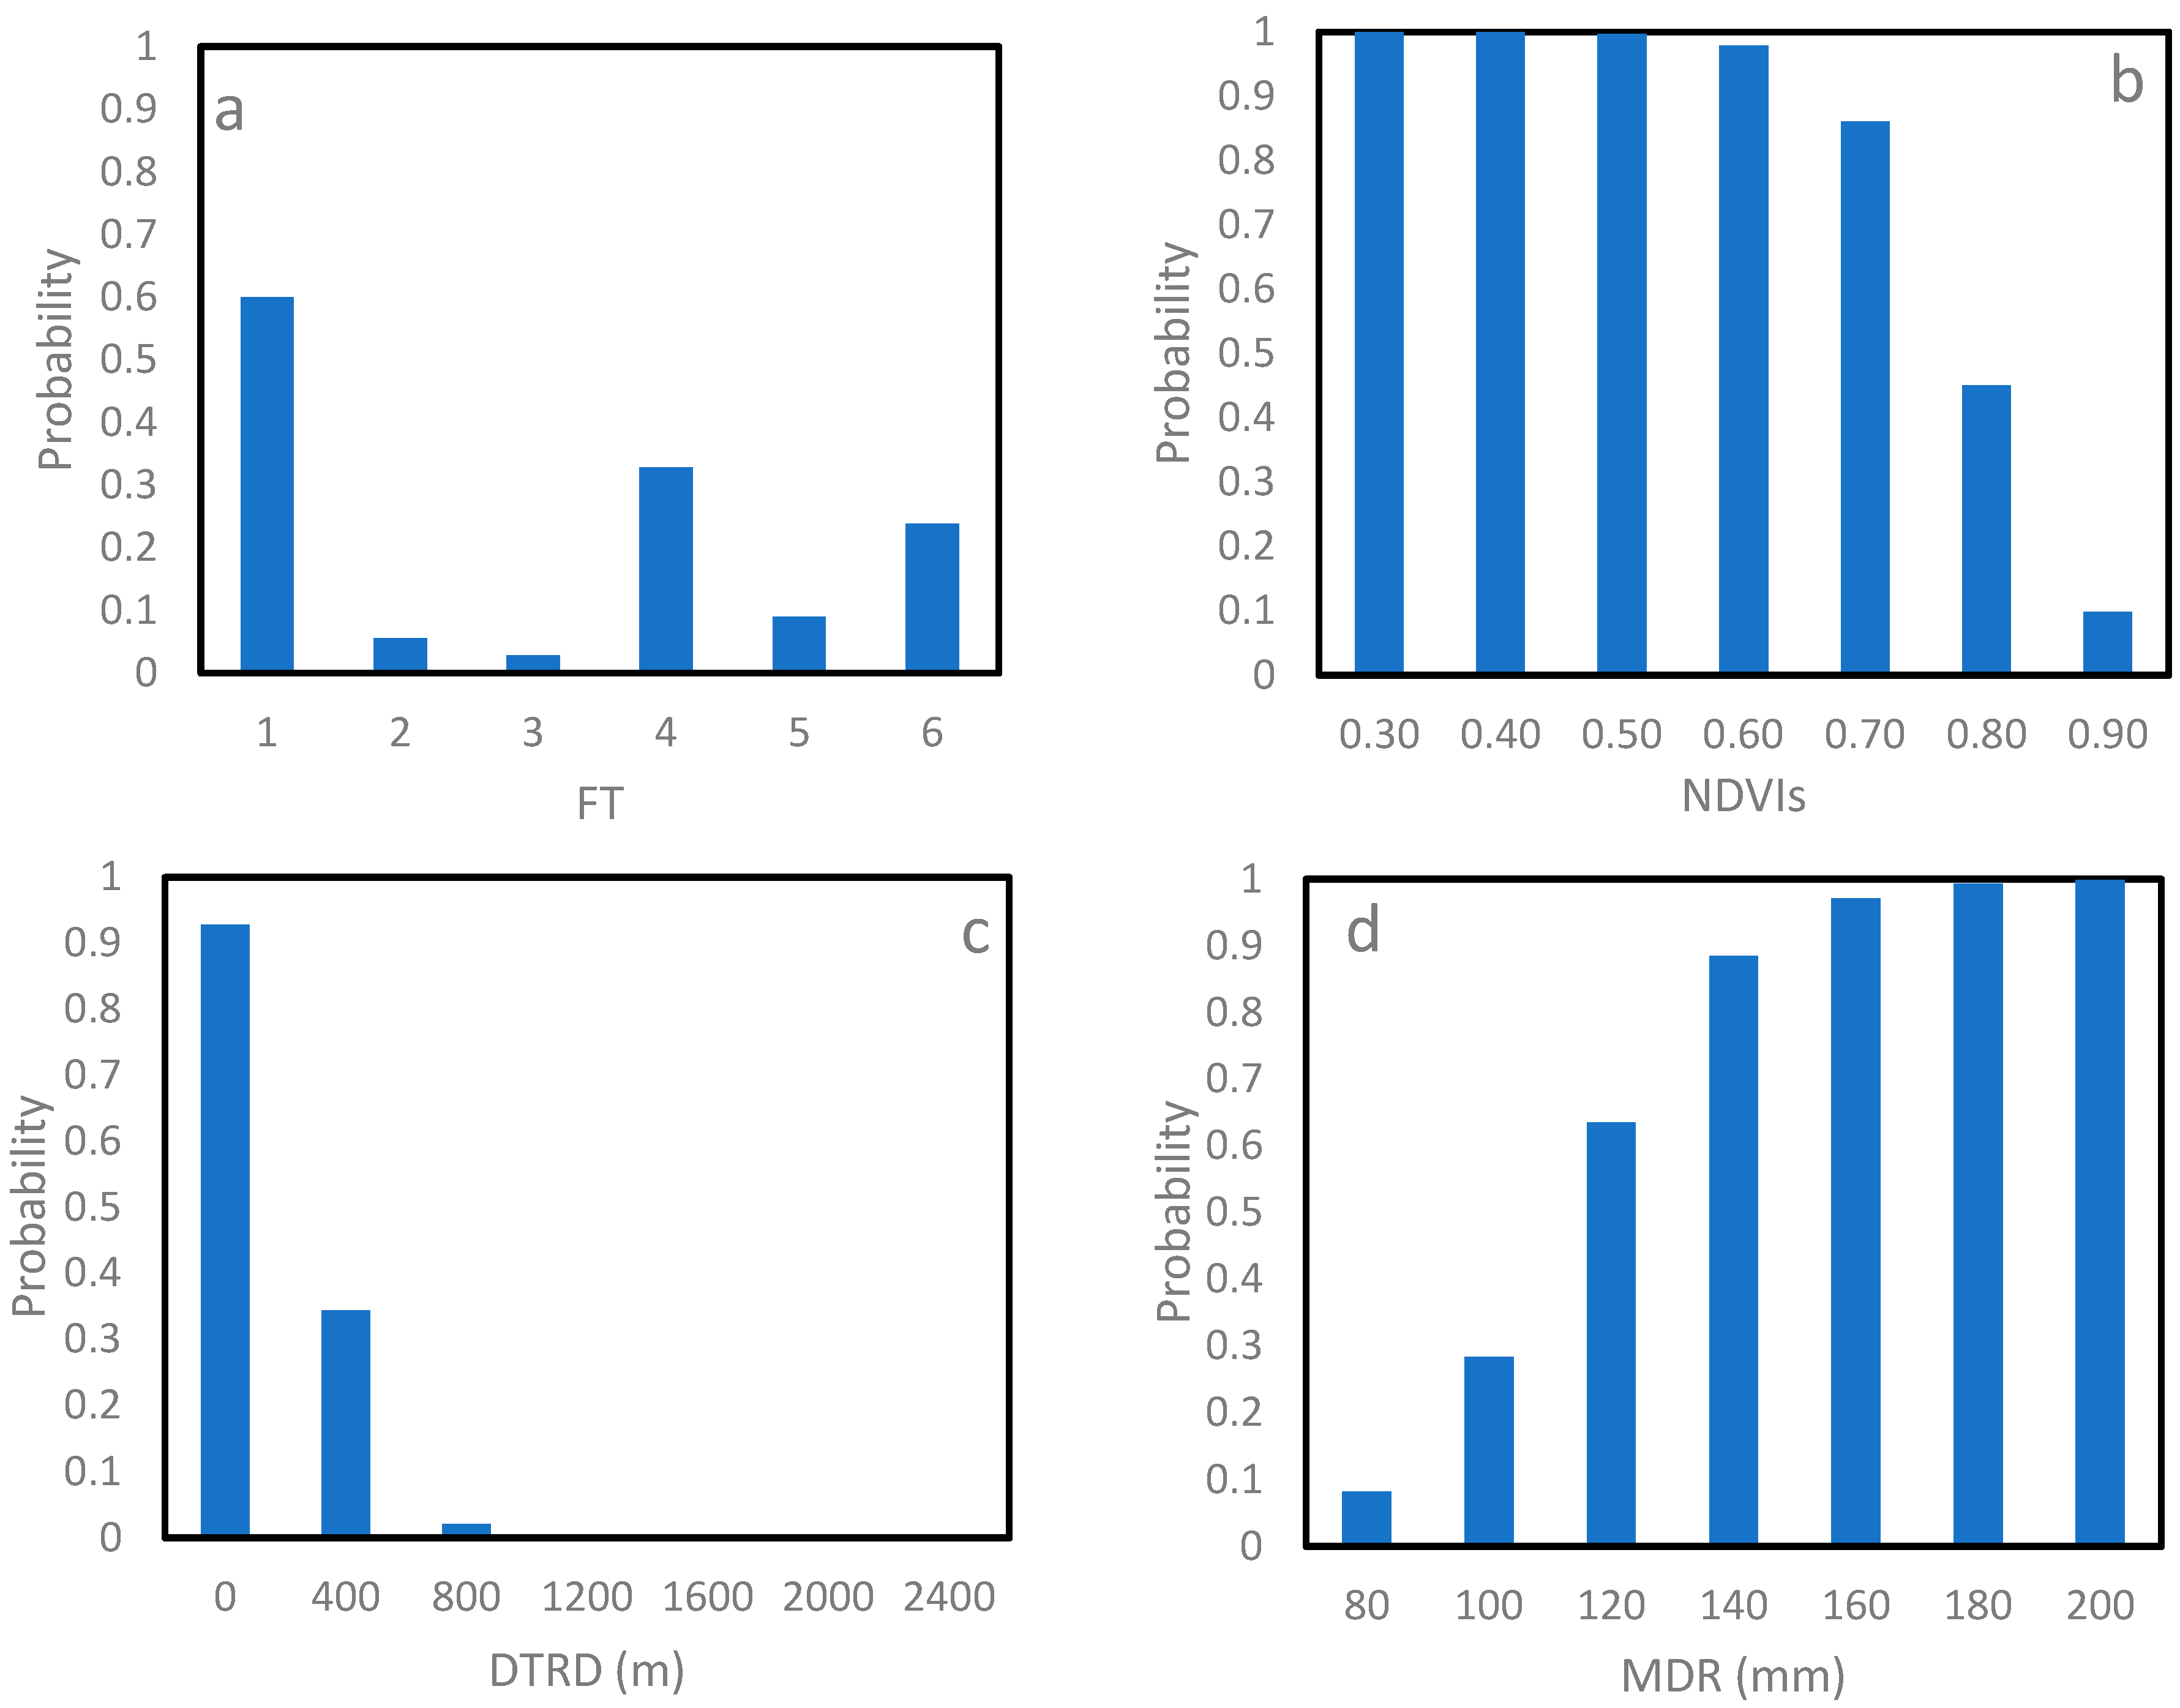
3.1. Logistical Regression
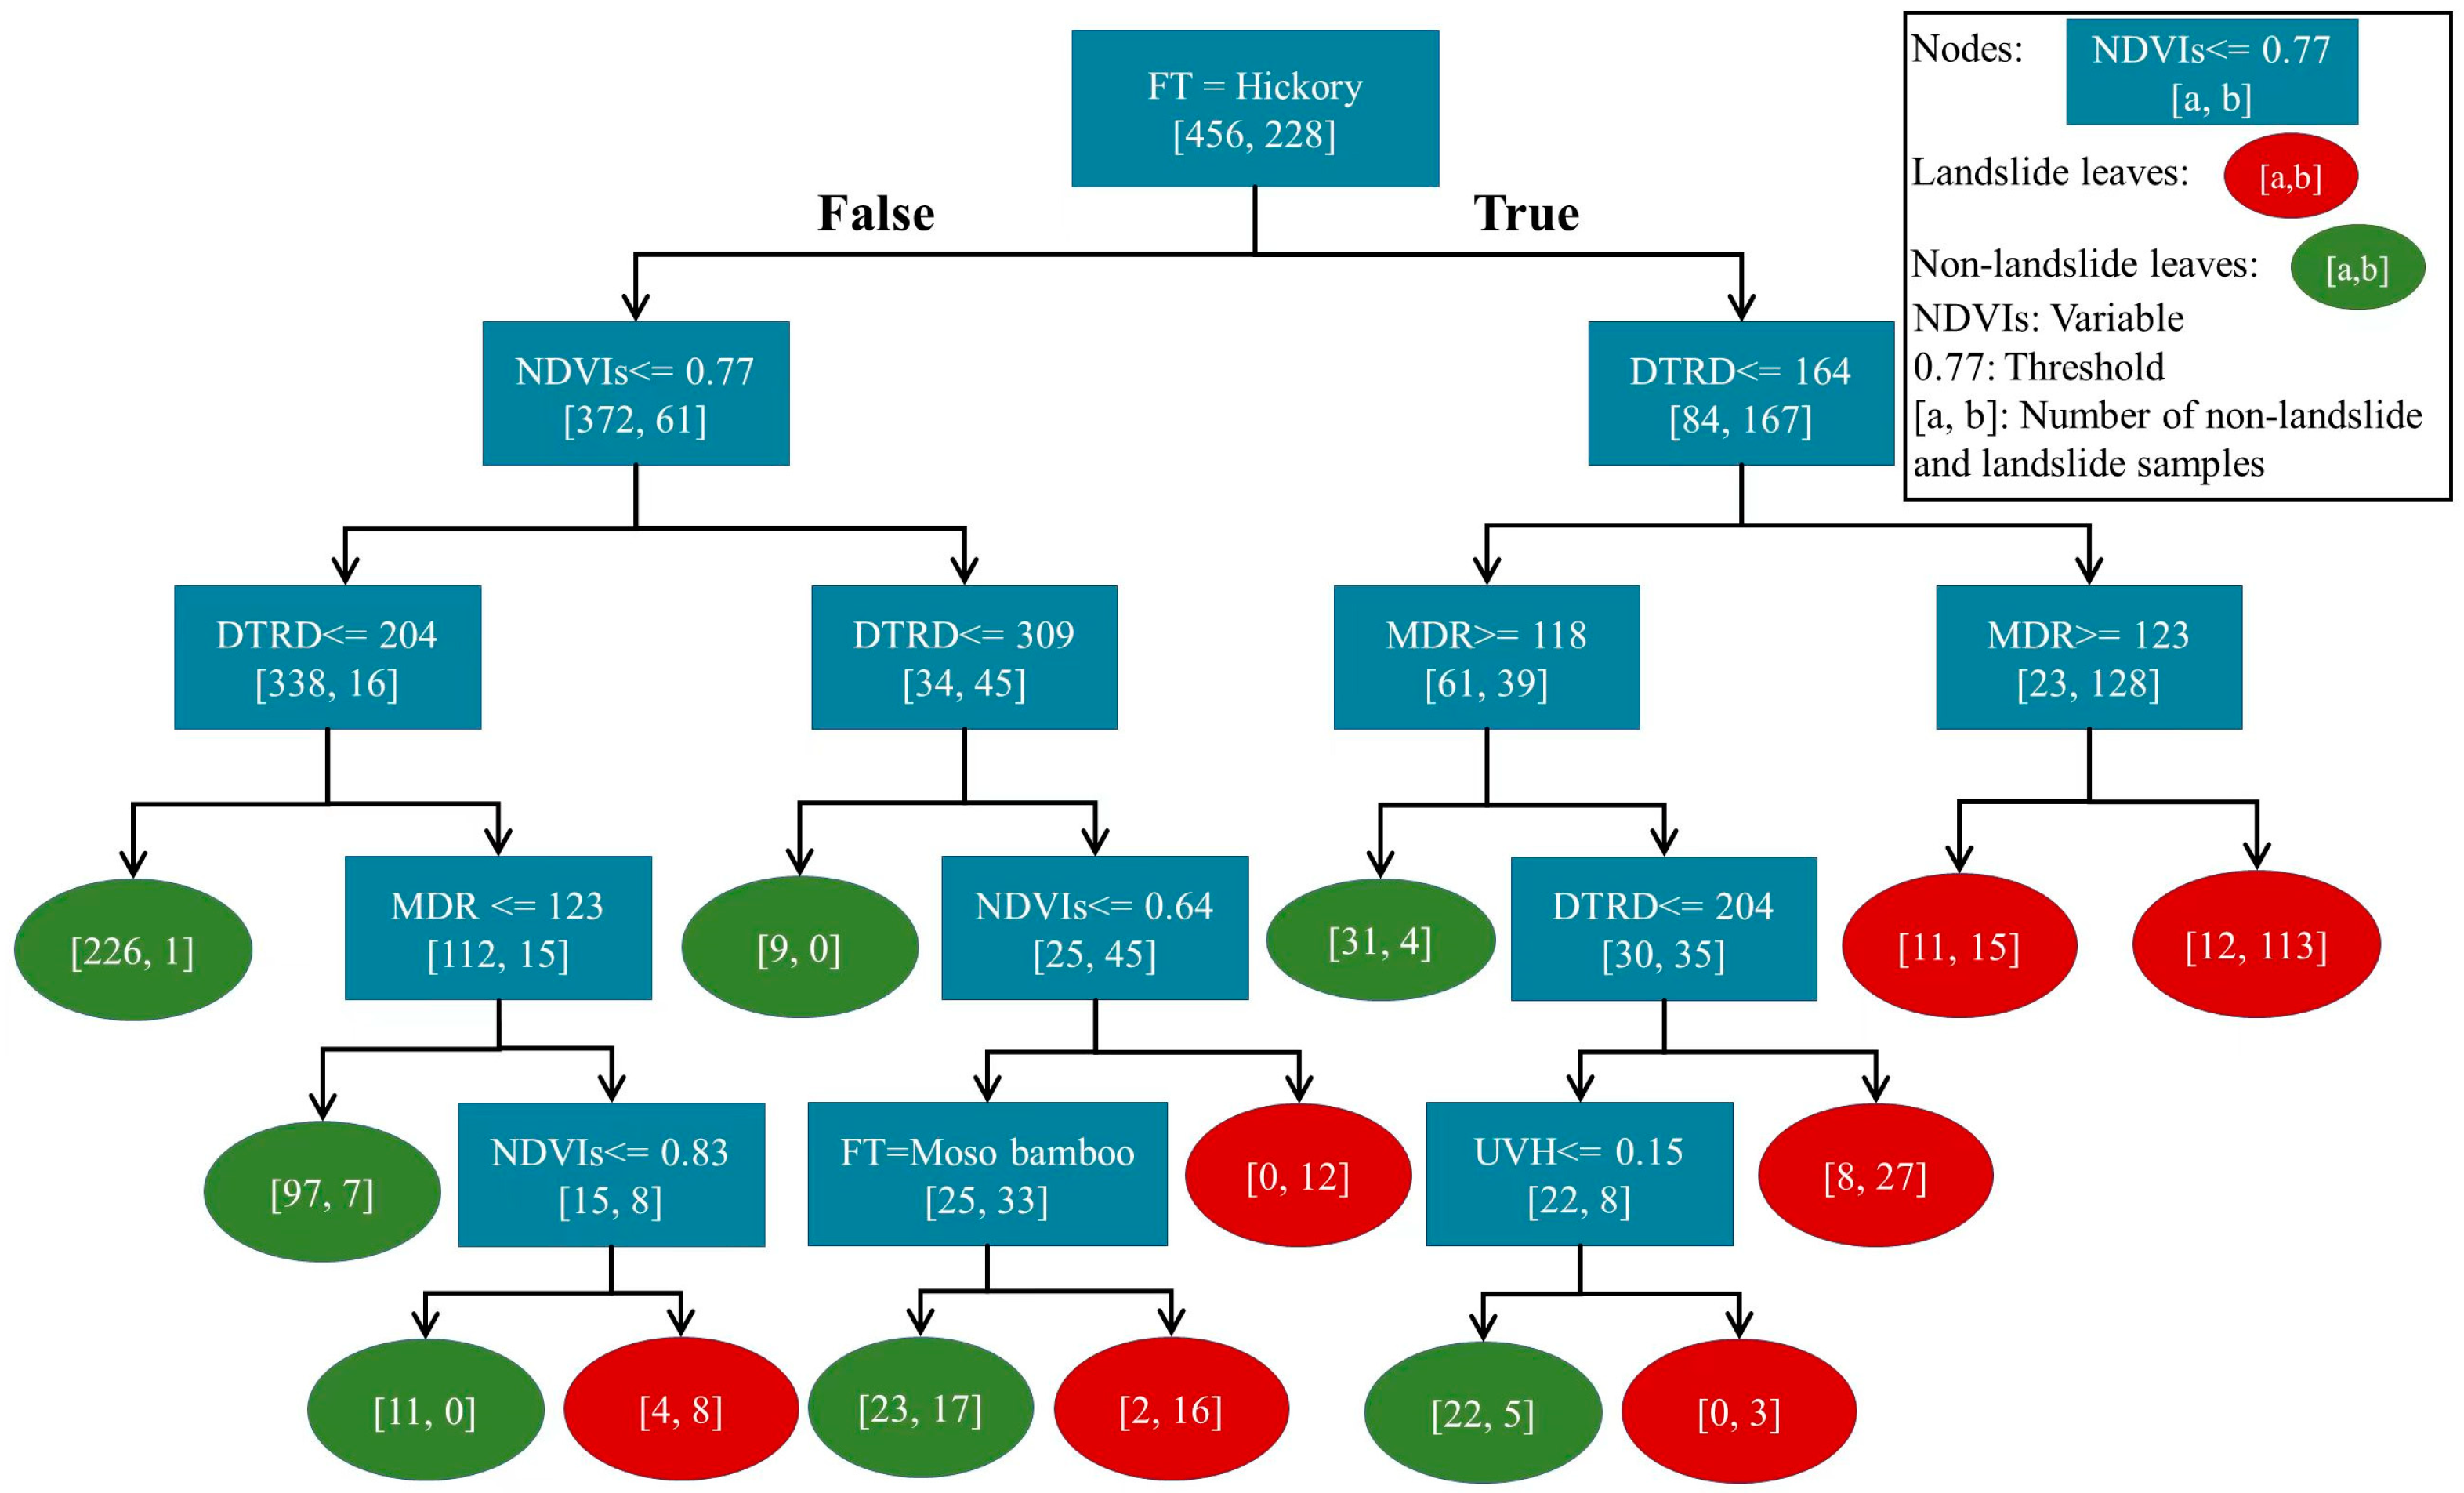
3.2. Decision Tree
3.3. Random Forests
3.4. Model Evaluation
3.5. Landslide Susceptibility Mapping
4. Discussion
5. Conclusions
Author Contributions
Funding
Data Availability Statement
Acknowledgments
Conflicts of Interest
Appendix A

| Variable | Mean | CV (%) | Std |
|---|---|---|---|
| Elevation (m) | 453.54 | 64.249 | 291.396 |
| Slope (°) | 23.051 | 41.919 | 9.663 |
| Curvature | −0.100 | −1904.250 | 1.918 |
| PLC | 0.002 | 56,796.020 | 0.984 |
| PRC | 0.105 | 1111.040 | 1.162 |
| Roughness | 1.110 | 9.904 | 0.109 |
| DTF (m) | 2229.600 | 98.766 | 2202.06 |
| DTRD (m) | 302.420 | 114.899 | 347.476 |
| SD (m) | 5.656 | 19.573 | 1.107 |
| HD (m) | 2.789 | 22.940 | 0.639 |
| UVH(m) | 0.889 | 69.162 | 0.615 |
| NDVIs | 0.787 | 9.847 | 0.077 |
| NDVIw | 0.480 | 24.678 | 0.118 |
| TWI | 6.355 | 58.256 | 3.702 |
| DTRR (m) | 790.830 | 87.311 | 690.489 |
| AP (mm) | 1803.400 | 8.642 | 155.850 |
| PWS (mm) | 701.110 | 9.549 | 66.954 |
| PDS (mm) | 264.420 | 6.9130 | 18.279 |
| ATRD (day) | 5.264 | 16.706 | 0.879 |
| MDR (mm) | 117.120 | 13.082 | 15.322 |
Appendix B

Appendix C
| PLC | PRC | Landform | Roughness | ST | FT | UVH | UVT | DTR | NDVIs | AP | PWS | PDS | MDR | |
|---|---|---|---|---|---|---|---|---|---|---|---|---|---|---|
| Elevation | 0.35 | 0.39 | 0.38 | 0.37 | 0.57 | 0.55 | ||||||||
| Slope | 0.35 | |||||||||||||
| Curvature | 0.86 | −0.90 | 0.61 | |||||||||||
| PLC | 0.55 | 0.55 | ||||||||||||
| PRC | 0.53 | |||||||||||||
| RA | 0.80 | |||||||||||||
| Roughness | 0.34 | |||||||||||||
| ST | 0.32 | |||||||||||||
| FT | 0.79 | 0.48 | 0.48 | 0.36 | 0.40 | 0.37 | 0.37 | |||||||
| UVH | 0.77 | 0.38 | ||||||||||||
| UVT | 0.39 | |||||||||||||
| DTR | 0.39 | |||||||||||||
| NDVIs | ||||||||||||||
| AP | 0.88 | 0.72 | 0.79 | |||||||||||
| PWS | 0.57 | 0.87 | ||||||||||||
| PDS | 0.51 |
References
- Lin, Q.; Wang, Y. Spatial and temporal analysis of a fatal landslide inventory in China from 1950 to 2016. Landslides 2018, 15, 2357–2372. [Google Scholar] [CrossRef]
- Nadim, F.; Kjekstad, O.; Peduzzi, P.; Herold, C.; Jaedicke, C. Global landslide and avalanche hotspots. Landslides 2006, 3, 159–173. [Google Scholar] [CrossRef]
- Budimir, M.E.A.; Atkinson, P.M.; Lewis, H.G. A systematic review of landslide probability mapping using logistic regression. Landslides 2015, 12, 419–436. [Google Scholar] [CrossRef]
- Huang, F.; Chen, J.; Du, Z.; Yao, C.; Huang, J.; Jiang, Q.; Chang, Z.; Li, S. Landslide Susceptibility Prediction Considering Regional Soil Erosion Based on Machine-Learning Models. ISPRS Int. J. Geo-Inf. 2020, 9, 377. [Google Scholar] [CrossRef]
- Reichenbach, P.; Rossi, M.; Malamud, B.D.; Mihir, M.; Guzzetti, F. A review of statistically-based landslide susceptibility models. Earth Sci. Rev. 2018, 180, 60–91. [Google Scholar] [CrossRef]
- Farooq, T.; Shakoor, A.; Wu, X.; Li, Y.; Rashid, M.; Zhang, X.; Gilani, M.; Kumar, U.; Chen, X.; Yan, W. Perspectives of plantation forests in the sustainable forest development of China. iForest—Biogeosci. For. 2021, 14, 166–174. [Google Scholar] [CrossRef]
- Bruschi, V.M.; Bonachea, J.; Remondo, J.; Gómez-Arozamena, J.; Rivas, V.; Barbieri, M.; Capocchi, S.; Soldati, M.; Cendrero, A. Land Management Versus Natural Factors in Land Instability: Some Examples in Northern Spain. Environ. Manag. 2013, 52, 398–416. [Google Scholar] [CrossRef] [PubMed]
- Dandridge, C.; Stanley, T.; Kirschbaum, D.; Amatya, P.; Lakshmi, V. The influence of land use and land cover change on landslide susceptibility in the Lower Mekong River Basin. Nat. Hazards 2022, 115, 1499–1523. [Google Scholar] [CrossRef]
- Zhang, Y.; Shen, C.; Zhou, S.; Luo, X. Analysis of the Influence of Forests on Landslides in the Bijie Area of Guizhou. Forests 2022, 13, 1136. [Google Scholar] [CrossRef]
- Jennifer, J.J.; Saravanan, S. Artificial neural network and sensitivity analysis in the landslide susceptibility mapping of Idukki district, India. Geocarto Int. 2021, 37, 5693–5715. [Google Scholar] [CrossRef]
- Chen, W.; Xie, X.; Wang, J.; Pradhan, B.; Hong, H.; Bui, D.T.; Duan, Z.; Ma, J. A comparative study of logistic model tree, random forest, and classification and regression tree models for spatial prediction of landslide susceptibility. Catena 2017, 151, 147–160. [Google Scholar] [CrossRef]
- Chen, W.; Xie, X.; Peng, J.; Shahabi, H.; Hong, H.; Bui, D.T.; Duan, Z.; Li, S.; Zhu, A.-X. GIS-based landslide susceptibility evaluation using a novel hybrid integration approach of bivariate statistical based random forest method. Catena 2018, 164, 135–149. [Google Scholar] [CrossRef]
- Jin, J.; Huang, X.; Wu, J.; Zhao, W.; Fu, W. A 10-year field experiment proves the neutralization of soil pH in Chinese hickory plantation of southeastern China. J. Soils Sediments 2022, 22, 2995–3005. [Google Scholar] [CrossRef]
- Lu, W.; Lu, D.; Wang, G.; Wu, J.; Huang, J.; Li, G. Examining soil organic carbon distribution and dynamic change in a hickory plantation region with Landsat and ancillary data. Catena 2018, 165, 576–589. [Google Scholar] [CrossRef]
- You, S.; Zheng, Q.; Chen, B.; Xu, Z.; Lin, Y.; Gan, M.; Zhu, C.; Deng, J.; Wang, K. Identifying the spatiotemporal dynamics of forest ecotourism values with remotely sensed images and social media data: A perspective of public preferences. J. Clean. Prod. 2022, 341, 130715. [Google Scholar] [CrossRef]
- You, S.; Zheng, Q.; Lin, Y.; Zhu, C.; Li, C.; Deng, J.; Wang, K. Specific Bamboo Forest Extraction and Long-Term Dynamics as Revealed by Landsat Time Series Stacks and Google Earth Engine. Remote Sens. 2020, 12, 3095. [Google Scholar] [CrossRef]
- Cheng, Z.; Lu, D.; Li, G.; Huang, J.; Sinha, N.; Zhi, J.; Li, S. A Random Forest-Based Approach to Map Soil Erosion Risk Distribution in Hickory Plantations in Western Zhejiang Province, China. Remote. Sens. 2018, 10, 1899. [Google Scholar] [CrossRef]
- Xi, Z.; Lu, D.; Liu, L.; Ge, H. Detection of Drought-Induced Hickory Disturbances in Western Lin An County, China, Using Multitemporal Landsat Imagery. Remote Sens. 2016, 8, 345. [Google Scholar] [CrossRef]
- Zhao, K.; Zhang, L.; Dong, J.; Wu, J.; Ye, Z.; Zhao, W.; Ding, L.; Fu, W. Risk assessment, spatial patterns and source apportionment of soil heavy metals in a typical Chinese hickory plantation region of southeastern China. Geoderma 2020, 360, 114011. [Google Scholar] [CrossRef]
- Lacroix, P.; Dehecq, A.; Taipe, E. Irrigation-triggered landslides in a Peruvian desert caused by modern intensive farming. Nat. Geosci. 2019, 13, 56–60. [Google Scholar] [CrossRef]
- Brabb, E.E. Innovative Approaches to Landslide Hazard and Risk Mapping. In International Landslide Symposium Proceedings, Toronto, Canada, Proceedings of the IVth International Conference and Field Workshop in Landslides, Tokyo, Japan, 23–31 August 1985; Japan Landslide Society: Tokyo, Japan, 1985; Volume 1, pp. 17–22. [Google Scholar]
- Vanacker, V.; Vanderschaeghe, M.; Govers, G.; Willems, E.; Poesen, J.; Deckers, J.; De Bievre, B. Linking hydrological, infinite slope stability and land-use change models through GIS for assessing the impact of deforestation on slope stability in high Andean watersheds. Geomorphology 2003, 52, 299–315. [Google Scholar] [CrossRef]
- Agrawal, N.; Dixit, J. Assessment of landslide susceptibility for Meghalaya (India) using bivariate (frequency ratio and Shannon entropy) and multi-criteria decision analysis (AHP and fuzzy-AHP) models. All Earth 2022, 34, 179–201. [Google Scholar] [CrossRef]
- Jaafari, A.; Najafi, A.; Pourghasemi, H.R.; Rezaeian, J.; Sattarian, A. GIS-based frequency ratio and index of entropy models for landslide susceptibility assessment in the Caspian forest, northern Iran. Int. J. Environ. Sci. Technol. 2014, 11, 909–926. [Google Scholar] [CrossRef]
- Shao, X.; Ma, S.; Xu, C.; Zhou, Q. Effects of sampling intensity and non-slide/slide sample ratio on the occurrence probability of coseismic landslides. Geomorphology 2020, 363, 107222. [Google Scholar] [CrossRef]
- Merghadi, A.; Yunus, A.P.; Dou, J.; Whiteley, J.; ThaiPham, B.; Bui, D.T.; Avtar, R.; Abderrahmane, B. Machine learning methods for landslide susceptibility studies: A comparative overview of algorithm performance. Earth Sci. Rev. 2020, 207, 103225. [Google Scholar] [CrossRef]
- Aleotti, P.; Chowdhury, R. Landslide hazard assessment: Summary review and new perspectives. Bull. Eng. Geol. Environ. 1999, 58, 21–44. [Google Scholar] [CrossRef]
- Tanyu, B.F.; Abbaspour, A.; Alimohammadlou, Y.; Tecuci, G. Landslide susceptibility analyses using Random Forest, C4.5, and C5.0 with balanced and unbalanced datasets. Catena 2021, 203, 105355. [Google Scholar] [CrossRef]
- Safavian, S.; Landgrebe, D. A survey of decision tree classifier methodology. IEEE Trans. Syst. Man Cybern. 1991, 21, 660–674. [Google Scholar] [CrossRef]
- Breiman, L. Random forests. Mach. Learn. 2001, 45, 5–32. [Google Scholar] [CrossRef]
- Pradhan, B. A comparative study on the predictive ability of the decision tree, support vector machine and neuro-fuzzy models in landslide susceptibility mapping using GIS. Comput. Geosci. 2013, 51, 350–365. [Google Scholar] [CrossRef]
- Yeon, Y.-K.; Han, J.-G.; Ryu, K.H. Landslide susceptibility mapping in Injae, Korea, using a decision tree. Eng. Geol. 2010, 116, 274–283. [Google Scholar] [CrossRef]
- Trigila, A.; Iadanza, C.; Esposito, C.; Scarascia-Mugnozza, G. Comparison of Logistic Regression and Random Forests techniques for shallow landslide susceptibility assessment in Giampilieri (NE Sicily, Italy). Geomorphology 2015, 249, 119–136. [Google Scholar] [CrossRef]
- Wu, J.; Lin, H.; Meng, C.; Jiang, P.; Fu, W. Effects of intercropping grasses on soil organic carbon and microbial community functional diversity under Chinese hickory (Carya cathayensis Sarg.) stands. Soil Res. 2014, 52, 575–583. [Google Scholar] [CrossRef]
- Available online: http://www.linan.gov.cn/ (accessed on 15 March 2022).
- Zêzere, J.; Pereira, S.; Melo, R.; Oliveira, S.; Garcia, R. Mapping landslide susceptibility using data-driven methods. Sci. Total Environ. 2017, 589, 250–267. [Google Scholar] [CrossRef] [PubMed]
- Bui, D.T.; Pradhan, B.; Lofman, O.; Revhaug, I.; Dick, O.B. Landslide susceptibility mapping at Hoa Binh province (Vietnam) using an adaptive neuro-fuzzy inference system and GIS. Comput. Geosci. 2012, 45, 199–211. [Google Scholar] [CrossRef]
- Wang, Y.; Wu, X.; Chen, Z.; Ren, F.; Feng, L.; Du, Q. Optimizing the Predictive Ability of Machine Learning Methods for Landslide Susceptibility Mapping Using SMOTE for Lishui City in Zhejiang Province, China. Int. J. Environ. Res. Public Health 2019, 16, 368. [Google Scholar] [CrossRef]
- Hu, X.; Mei, H.; Zhang, H.; Li, Y.; Li, M. Performance evaluation of ensemble learning techniques for landslide susceptibility mapping at the Jinping county, Southwest China. Nat. Hazards 2020, 105, 1663–1689. [Google Scholar] [CrossRef]
- Farr, T.G.; Rosen, P.A.; Caro, E.; Crippen, R.; Duren, R.; Hensley, S.; Kobrick, M.; Paller, M.; Rodriguez, E.; Roth, L.; et al. The Shuttle Radar Topography Mission. Rev. Geophys. 2007, 45, RG2004. [Google Scholar] [CrossRef]
- Google Earth Engine. Available online: https://earthengine.google.com/ (accessed on 19 November 2019).
- GeoCloud. Available online: https://geocloud.cgs.gov.cn/ (accessed on 7 May 2022).
- Hjerdt, K.N.; McDonnell, J.J.; Seibert, J.; Rodhe, A. A new topographic index to quantify downslope controls on local drainage. Water Resour. Res. 2004, 40, W05602. [Google Scholar] [CrossRef]
- Application Platform for Sharing Results of Land Surveys. Available online: https://gtdc.mnr.gov.cn/ (accessed on 15 March 2022).
- Available online: http://nynct.zj.gov.cn/ (accessed on 3 March 2022).
- Available online: http://lyj.zj.gov.cn/ (accessed on 15 March 2022).
- Available online: http://zj.cma.gov.cn/dsqx/hzsqxj/ (accessed on 22 March 2022).
- Kuhn, M. Building Predictive Models in R Using the caret Package. J. Stat. Softw. 2008, 28, 1–26. [Google Scholar] [CrossRef]
- Fan, C.; Xiao, F.; Wang, S. Development of prediction models for next-day building energy consumption and peak power demand using data mining techniques. Appl. Energy 2014, 127, 1–10. [Google Scholar] [CrossRef]
- Pal, M.; Foody, G.M. Feature Selection for Classification of Hyperspectral Data by SVM. IEEE Trans. Geosci. Remote Sens. 2010, 48, 2297–2307. [Google Scholar] [CrossRef]
- Raileanu, L.E.; Stoffel, K. Theoretical Comparison between the Gini Index and Information Gain Criteria. Ann. Math. Artif. Intell. 2004, 41, 77–93. [Google Scholar] [CrossRef]
- Lee, S.; Pradhan, B. Landslide hazard mapping at Selangor, Malaysia using frequency ratio and logistic regression models. Landslides 2006, 4, 33–41. [Google Scholar] [CrossRef]
- Ozdemir, A.; Altural, T. A comparative study of frequency ratio, weights of evidence and logistic regression methods for landslide susceptibility mapping: Sultan Mountains, SW Turkey. J. Asian Earth Sci. 2013, 64, 180–197. [Google Scholar] [CrossRef]
- Choubin, B.; Moradi, E.; Golshan, M.; Adamowski, J.; Sajedi-Hosseini, F.; Mosavi, A. An ensemble prediction of flood susceptibility using multivariate discriminant analysis, classification and regression trees, and support vector machines. Sci. Total Environ. 2018, 651, 2087–2096. [Google Scholar] [CrossRef] [PubMed]
- Dou, J.; Yunus, A.P.; Bui, D.T.; Merghadi, A.; Sahana, M.; Zhu, Z.; Chen, C.-W.; Han, Z.; Pham, B.T. Improved landslide assessment using support vector machine with bagging, boosting, and stacking ensemble machine learning framework in a mountainous watershed, Japan. Landslides 2019, 17, 641–658. [Google Scholar] [CrossRef]
- Fang, Z.; Wang, Y.; Peng, L.; Hong, H. A comparative study of heterogeneous ensemble-learning techniques for landslide susceptibility mapping. Int. J. Geogr. Inf. Sci. 2020, 35, 321–347. [Google Scholar] [CrossRef]
- Chen, L.; Guo, Z.; Yin, K.; Shrestha, D.P.; Jin, S. The influence of land use and land cover change on landslide susceptibility: A case study in Zhushan Town, Xuan’en County (Hubei, China). Nat. Hazards Earth Syst. Sci. 2019, 19, 2207–2228. [Google Scholar] [CrossRef]
- Grima, N.; Edwards, D.; Edwards, F.; Petley, D.; Fisher, B. Landslides in the Andes: Forests can provide cost-effective landslide regulation services. Sci. Total Environ. 2020, 745, 141128. [Google Scholar] [CrossRef]
- Hao, L.; van Westen, C.; Rajaneesh, A.; Sajinkumar, K.; Martha, T.R.; Jaiswal, P. Evaluating the relation between land use changes and the 2018 landslide disaster in Kerala, India. Catena 2022, 216, 106363. [Google Scholar] [CrossRef]
- Nsengiyumva, J.B.; Luo, G.; Amanambu, A.C.; Mind’Je, R.; Habiyaremye, G.; Karamage, F.; Ochege, F.U.; Mupenzi, C. Comparing probabilistic and statistical methods in landslide susceptibility modeling in Rwanda/Centre-Eastern Africa. Sci. Total Environ. 2018, 659, 1457–1472. [Google Scholar] [CrossRef] [PubMed]
- Ayalew, L.; Yamagishi, H. The application of GIS-based logistic regression for landslide susceptibility mapping in the Kakuda-Yahiko Mountains, Central Japan. Geomorphology 2005, 65, 15–31. [Google Scholar] [CrossRef]
- Fattet, M.; Fu, Y.; Ghestem, M.; Ma, W.; Foulonneau, M.; Nespoulous, J.; Le Bissonnais, Y.; Stokes, A. Effects of vegetation type on soil resistance to erosion: Relationship between aggregate stability and shear strength. Catena 2011, 87, 60–69. [Google Scholar] [CrossRef]
- Li, Q.; Wong, F.K.K.; Fung, T. Mapping multi-layered mangroves from multispectral, hyperspectral, and LiDAR data. Remote Sens. Environ. 2021, 258, 112403. [Google Scholar] [CrossRef]
- Neumann, M.; Ferro-Famil, L.; Reigber, A. Estimation of Forest Structure, Ground, and Canopy Layer Characteristics from Multibaseline Polarimetric Interferometric SAR Data. IEEE Trans. Geosci. Remote Sens. 2009, 48, 1086–1104. [Google Scholar] [CrossRef]
- Kornejady, A.; Ownegh, M.; Bahremand, A. Landslide susceptibility assessment using maximum entropy model with two different data sampling methods. Catena 2017, 152, 144–162. [Google Scholar] [CrossRef]
- Shirzadi, A.; Solaimani, K.; Roshan, M.H.; Kavian, A.; Chapi, K.; Shahabi, H.; Keesstra, S.; Ahmad, B.B.; Bui, D.T. Uncertainties of prediction accuracy in shallow landslide modeling: Sample size and raster resolution. Catena 2019, 178, 172–188. [Google Scholar] [CrossRef]
- Conoscenti, C.; Rotigliano, E.; Cama, M.; Caraballo-Arias, N.A.; Lombardo, L.; Agnesi, V. Exploring the effect of absence selection on landslide susceptibility models: A case study in Sicily, Italy. Geomorphology 2016, 261, 222–235. [Google Scholar] [CrossRef]
- Li, C.; Wang, M.; Liu, K.; Xie, J. Topographic changes and their driving factors after 2008 Wenchuan earthquake. Geomorphology 2018, 311, 27–36. [Google Scholar] [CrossRef]
| Factors | DF | Wald Chi-Squared | Pr > ChiSq |
|---|---|---|---|
| Elevation | 1 | 7.0745 | 0.0078 |
| Aspect | 7 | 17.6894 | 0.0135 |
| DTF | 1 | 9.9524 | 0.0016 |
| FT | 5 | 76.8426 | <0.0001 |
| DTRD | 1 | 37.0597 | <0.0001 |
| NDVIs | 1 | 42.5864 | <0.0001 |
| MDR | 1 | 22.8069 | <0.0001 |
| Factors | OR | Lower Limit | Upper Limit | |
|---|---|---|---|---|
| Forest type | Conifer vs. hickory | 0.040 | 0.013 | 0.117 |
| Hardwood vs. hickory | 0.019 | 0.006 | 0.061 | |
| Shrub vs. hickory | 0.325 | 0.040 | 2.653 | |
| Bamboo vs. hickory | 0.066 | 0.026 | 0.165 | |
| Moso bamboo vs. hickory | 0.208 | 0.090 | 0.480 | |
| NDVI in summer | <0.001 | <0.001 | <0.001 | |
| Distance to roads | 0.992 | 0.989 | 0.995 | |
| Maximum daily rainfall | 1.077 | 1.045 | 1.110 | |
| Aspect | Northeast vs. North | 1.327 | 0.446 | 3.948 |
| East vs. North | 1.934 | 0.675 | 5.539 | |
| Southeast vs. North | 2.000 | 0.662 | 6.041 | |
| South vs. North | 0.331 | 0.104 | 1.051 | |
| Southwest vs. North | 0.736 | 0.221 | 2.452 | |
| West vs. North | 0.640 | 0.210 | 1.949 | |
| Northwest vs. North | 0.540 | 0.157 | 1.855 | |
| Distance to faults | ~1.000 | ~1.000 | ~1.000 | |
| Elevation | 0.997 | 0.995 | 0.999 | |
| Model | ACC | TPR | AUC | Kappa | ||||
|---|---|---|---|---|---|---|---|---|
| Mean | Std | Mean | Std | Mean | Std | Mean | Std | |
| LR | 0.866 | 0.034 | 0.764 | 0.095 | 0.918 | 0.028 | 0.700 | 0.043 |
| DT | 0.876 | 0.038 | 0.821 | 0.093 | 0.905 | 0.047 | 0.792 | 0.039 |
| RF | 0.880 | 0.037 | 0.803 | 0.095 | 0.938 | 0.031 | 0.782 | 0.029 |
| Model | Class | Grid Cells | Ratio of Class (%) | Landslides | Class-Specific Accuracy (%) |
|---|---|---|---|---|---|
| LR | Very low | 1,520,764 | 47.10 | 33 | 0.31 |
| Low | 866,549 | 26.84 | 29 | 0.47 | |
| Moderate | 366,571 | 11.35 | 26 | 1.00 | |
| High | 267,445 | 8.28 | 40 | 2.12 | |
| Very high | 207,664 | 6.43 | 100 | 6.82 | |
| DT | Very low | 2,321,912 | 71.91 | 17 | 0.10 |
| Low | 252,847 | 7.83 | 7 | 0.39 | |
| Moderate | 250,744 | 7.77 | 7 | 0.40 | |
| High | 121,021 | 3.75 | 51 | 5.97 | |
| Very high | 282,469 | 8.75 | 146 | 7.32 | |
| RF | Very low | 1,948,686 | 60.35 | 18 | 0.13 |
| Low | 581,266 | 18.00 | 10 | 0.24 | |
| Moderate | 346,651 | 10.74 | 7 | 0.29 | |
| High | 189,968 | 5.88 | 56 | 4.17 | |
| Very high | 162,422 | 5.03 | 137 | 11.95 |
Disclaimer/Publisher’s Note: The statements, opinions and data contained in all publications are solely those of the individual author(s) and contributor(s) and not of MDPI and/or the editor(s). MDPI and/or the editor(s) disclaim responsibility for any injury to people or property resulting from any ideas, methods, instructions or products referred to in the content. |
© 2023 by the authors. Licensee MDPI, Basel, Switzerland. This article is an open access article distributed under the terms and conditions of the Creative Commons Attribution (CC BY) license (https://creativecommons.org/licenses/by/4.0/).
Share and Cite
Chen, C.; Shen, Z.; Weng, Y.; You, S.; Lin, J.; Li, S.; Wang, K. Modeling Landslide Susceptibility in Forest-Covered Areas in Lin’an, China, Using Logistical Regression, a Decision Tree, and Random Forests. Remote Sens. 2023, 15, 4378. https://doi.org/10.3390/rs15184378
Chen C, Shen Z, Weng Y, You S, Lin J, Li S, Wang K. Modeling Landslide Susceptibility in Forest-Covered Areas in Lin’an, China, Using Logistical Regression, a Decision Tree, and Random Forests. Remote Sensing. 2023; 15(18):4378. https://doi.org/10.3390/rs15184378
Chicago/Turabian StyleChen, Chongzhi, Zhangquan Shen, Yuhui Weng, Shixue You, Jingya Lin, Sinan Li, and Ke Wang. 2023. "Modeling Landslide Susceptibility in Forest-Covered Areas in Lin’an, China, Using Logistical Regression, a Decision Tree, and Random Forests" Remote Sensing 15, no. 18: 4378. https://doi.org/10.3390/rs15184378
APA StyleChen, C., Shen, Z., Weng, Y., You, S., Lin, J., Li, S., & Wang, K. (2023). Modeling Landslide Susceptibility in Forest-Covered Areas in Lin’an, China, Using Logistical Regression, a Decision Tree, and Random Forests. Remote Sensing, 15(18), 4378. https://doi.org/10.3390/rs15184378