Abstract
Subsurface salt layer dissolution along the western shores of the Dead Sea is considered to be the primary cause for extensive large sinkhole formation in the past 40 years. Many of these sinkholes are arranged in clusters and are filled with water from nearby springs. The Mineral Beach resort was built in an area with a thermal spring with water emerging at around 40 °C at the Shalem sinkhole cluster. Unfortunately, the same spring was responsible for the destruction of the resort as it supplied water undersaturated with respect to halite, which promoted dissolution and sinkhole formation. The sinkholes in the Shalem cluster drain out in sudden catastrophic events and then slowly fill again. The drainage mechanisms of this phenomenon are studied in the Shalem-2 sinkhole cluster using leveling data collectors and ground-based LiDAR surveys over a period of 5 years, including thirty-five drainage events. Drainage volume and fluxes calculated using water level and topographic data obtained by LiDAR scans suggest that the formation of additional sinkholes beneath the pond’s bottom triggers drainage events. The subsequent flux shows that the evolution of the newly formed sinkholes either improves the hydraulic connection or temporarily seals the connection between the surface pond and deeper caverns/aquifers. The drainage event ends when either the hydraulic connection is sealed or when the level of water in the pond drops to the level of the newly formed sinkhole. The large volumes of drained water and drainage fluxes imply the existence of a well-developed active underground draining system.
1. Introduction
The formation of sinkholes as a result of the dissolution of a soluble rock layer and the generation of cavities, which collapse when their support fails, is a widely studied natural phenomenon [1,2,3,4]. Sinkholes began to appear along the western and eastern Dead Sea coasts in the early 1980s. The resulting total of more than 6000 sinkholes cause large-scale environmental damages and focus major concern on infrastructure, development, and safety in the area [5,6,7,8,9,10,11,12,13,14]. The formation of sinkholes and the acceleration in their occurrence are linked to the ~1.2 m/yr recession of the Dead Sea water level primarily as a result of the interception of freshwater supply from the Jordan River and the maintenance of large evaporation ponds for the mineral industries [15]. Borehole measurement data and seismic profiles collected near major sinkhole clusters revealed the presence of a buried salt layer with variable thicknesses of 2 to 26 m [16]. The top of this layer ranges between 20 and 50 m below the surface. Cavities of 5 to 6 m were also encountered in some of the drilled boreholes [16]. Large caverns could develop over very short periods of time in rock salt, even in extremely arid places, by the intrusion of freshwater streams that can transport large volumes of dissolved salt [17]. To the best of our knowledge, no direct measurements of the rate of dissolution were measured.
The recession of the hypersaline (340 g/kg) Dead Sea Lake level results in the decline of the fresh/saline water interface, allowing fresh groundwater to intrude into this salt layer. This results in extensive dissolution and the formation of subsurface cavities that propagate upwards in a finger-like pattern, and when they reach the near-surface clay sediments, collapse and form collapse sinkholes [18,19]. The western margin of the Dead Sea basin is governed by an orthorhombic pattern of normal faults with a bimodal distribution of fault strikes. The two east-dipping sets form a zigzagging rift fault boundary that separates the basin fill from pre-basinal rocks [20]. Based on the orientations of sinkhole patterns and on analyses of seismic reflection lines, it was suggested that the sinkholes cluster along relatively narrow lineaments that resemble the regional tectonic extension fault pattern [5]. Considering the extremely low permeability of the clayey lake sediments, it was suggested that the freshwater flow and the dissolution might be controlled by upward flow along concealed faults and open mode fractures [5,16,21].
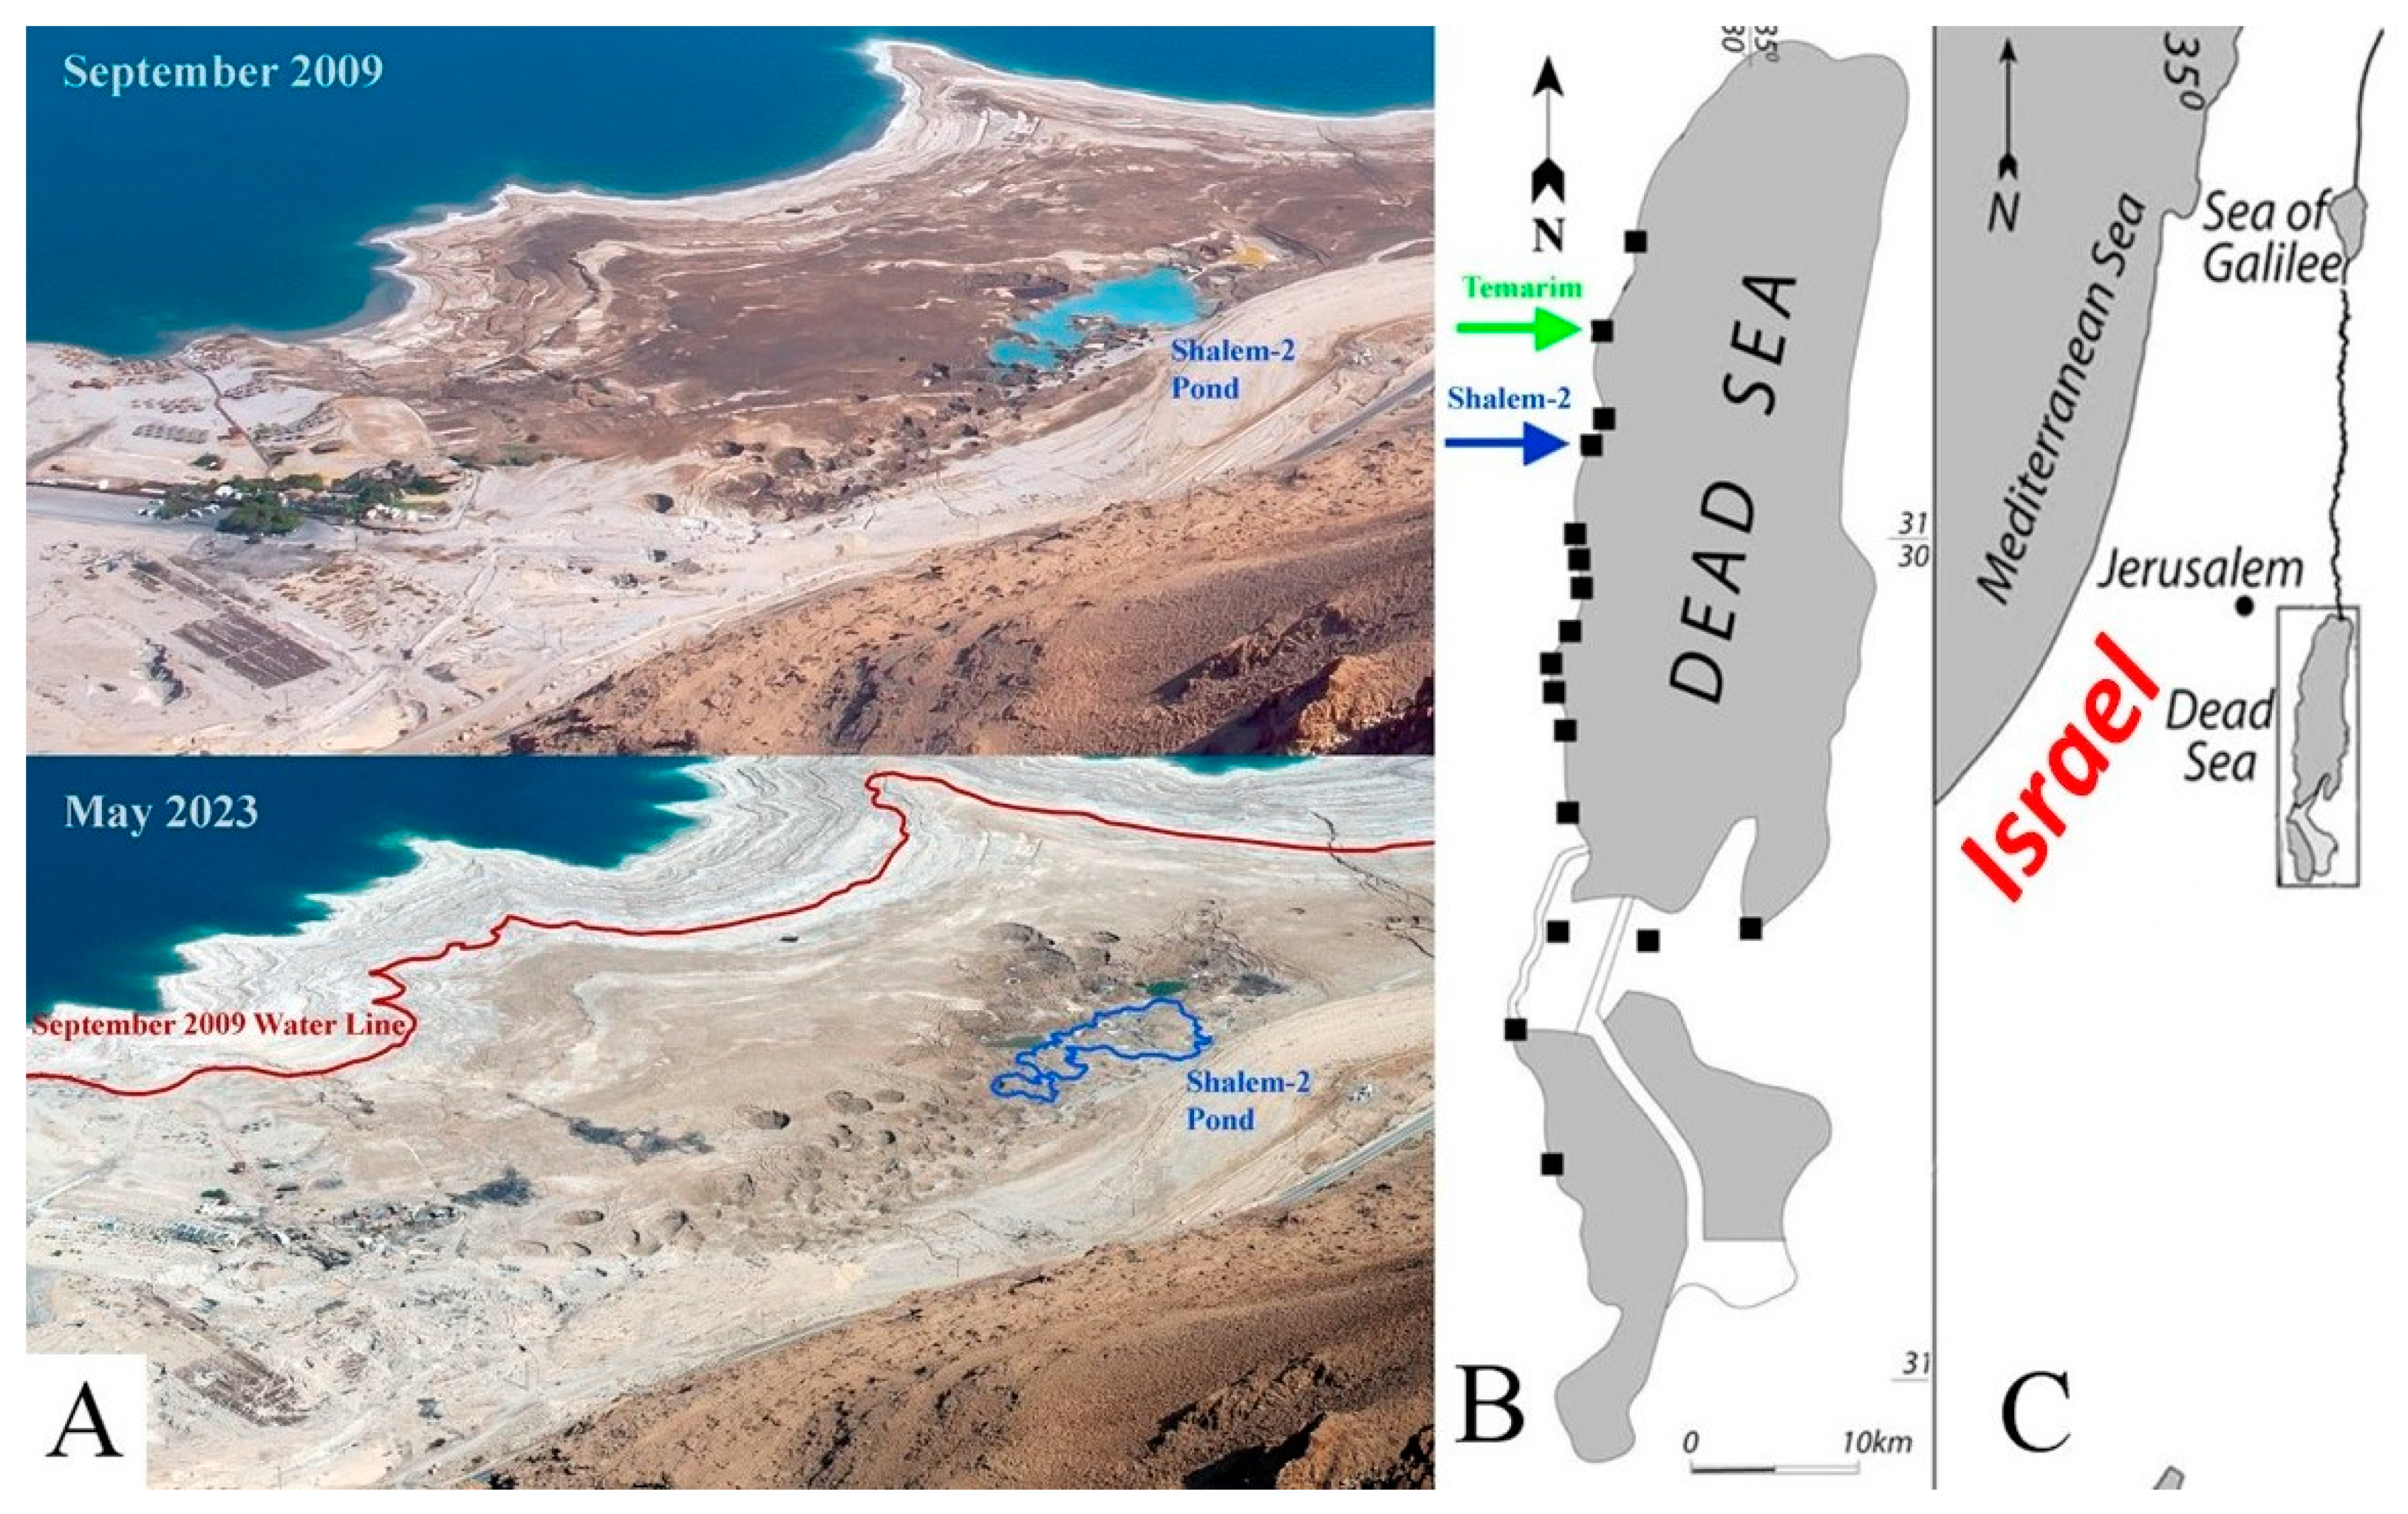
The specific interplay between hydrological and mechanical processes in the formation of sinkholes is essential for understanding the sinkhole phenomenon, but it probably integrates complex interactions [22]. So far, to the best of our knowledge, documented water fluxes through sinkholes have only been indirectly calculated by using chemical tracers [22,23]. However, in some locations along the Dead Sea coastal aquifer, the hydrological groundwater system is seeping into submersed springs that fill the sinkholes, as occurs in the Shalem-2 sinkhole cluster site near the ruined Mineral Beach resort (Figure 1). Therefore, measuring hydrological parameters in specific sinkholes there can be the key to delineating the system dynamics.

Figure 1.
(A) An aerial picture of Mineral Beach resort, Shalem-2 sinkholes cluster, and the sinkhole’s pond (marked in blue) discussed in this paper, as photographed on September 2009 and on May 2023. The resort was abandoned in 2015 and entirely devastated by sinkholes. (B) The location of this sinkhole cluster (blue arrow) and Temarim sinkhole (green arrow) in the context of other sinkhole sites (black squares) in the Dead Sea region. (C) The Dead Sea regional setting (framed).
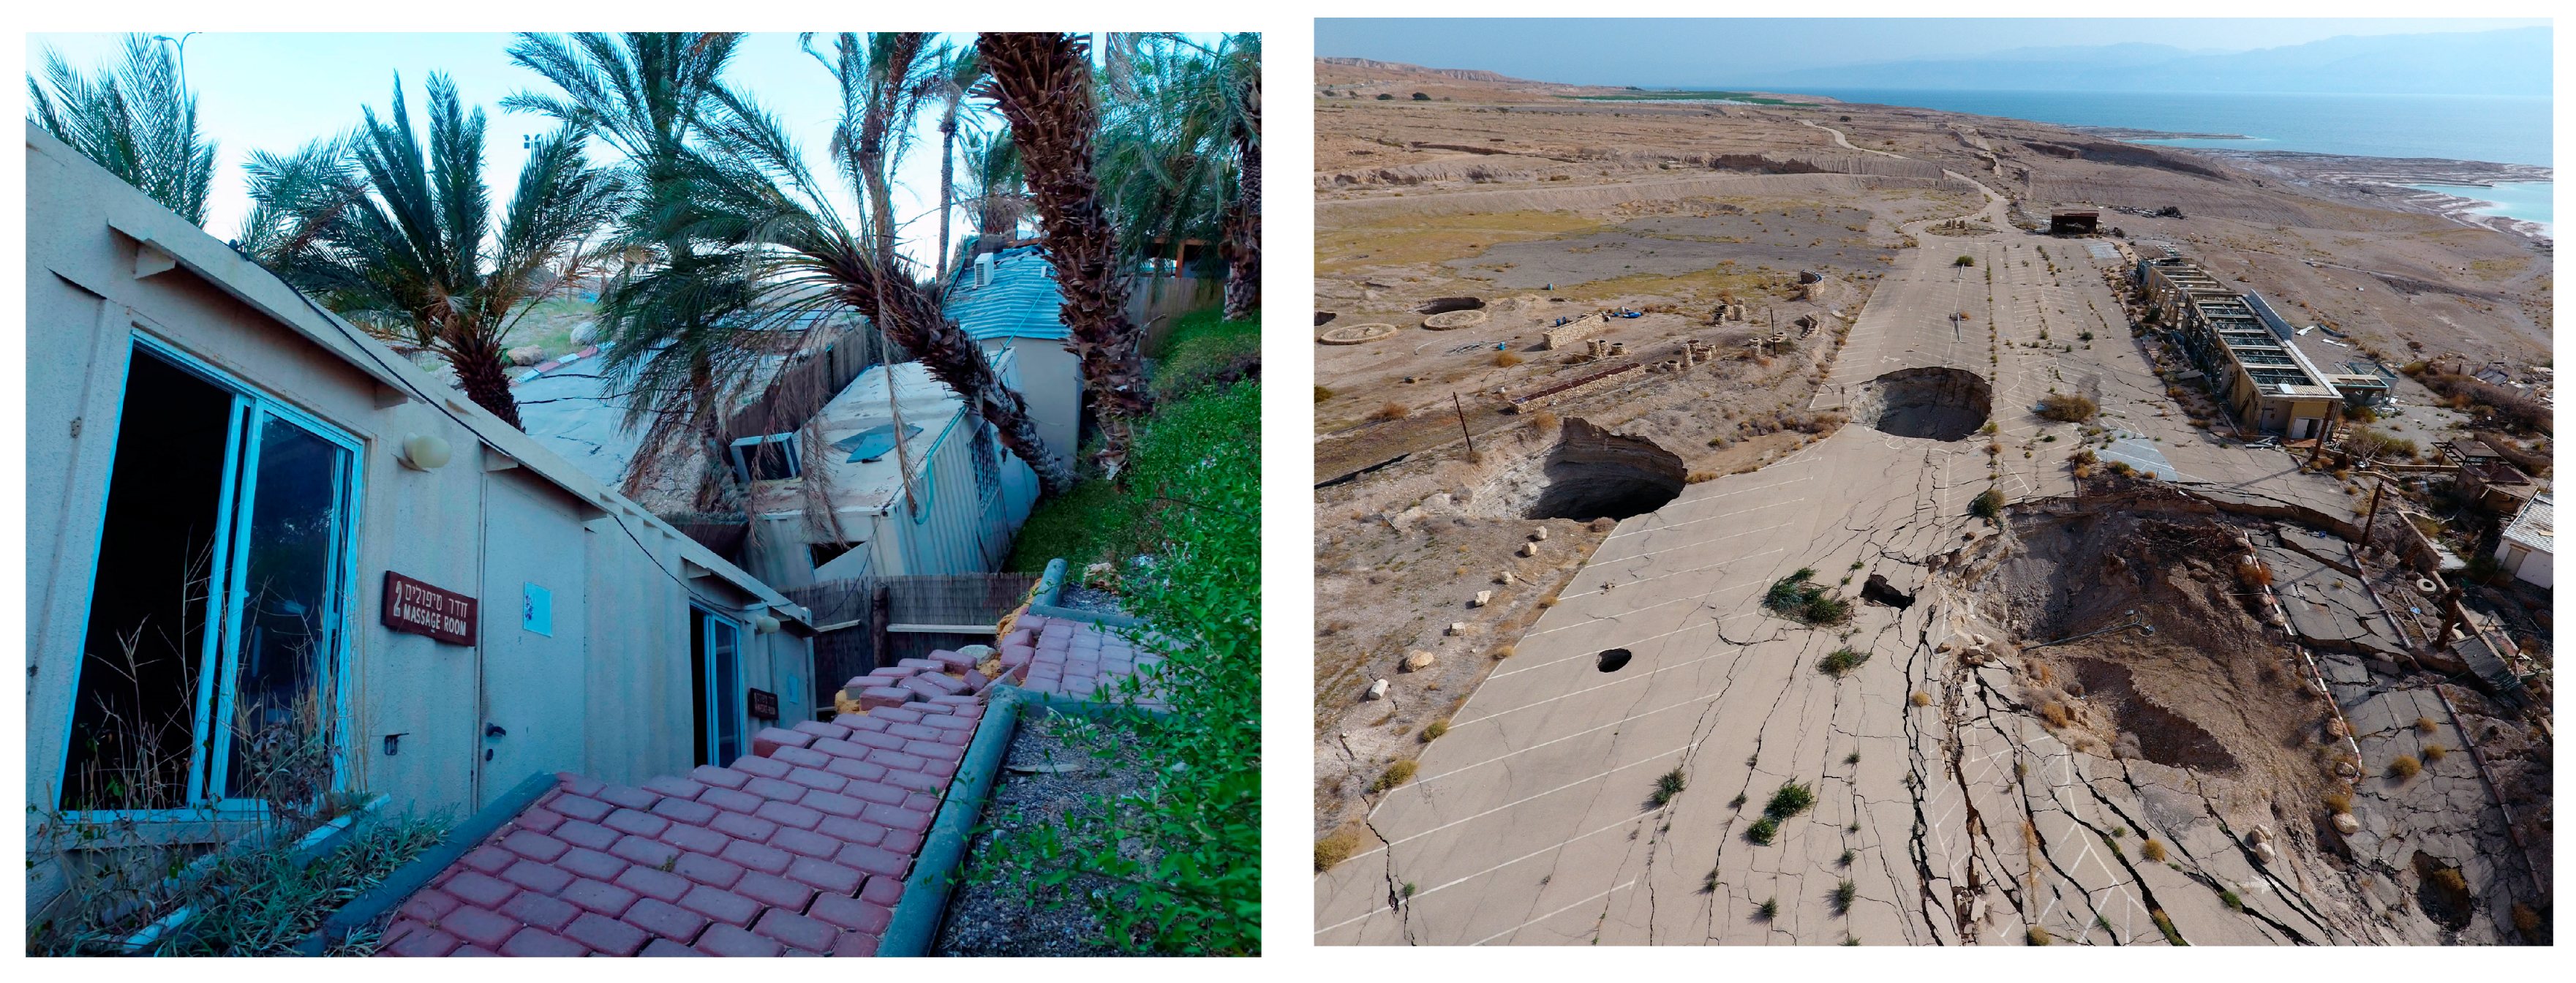
The Mineral Beach resort was built in the early 1990s in an area with a thermal spring with water emerging at around 40 °C. Unfortunately, the same spring was responsible for the destruction of the resort, as it supplied water undersaturated with halite that promoted dissolution and sinkhole formation (Figure 1). The damage and danger caused by the sinkholes forced the abandonment of the resort in 2015 (Figure 2).

Figure 2.
Sinkhole damage at Mineral Beach resort.
The Shalem-2 site is a cluster of tens of sinkholes located south of the Mineral Beach resort (Figure 1). A pond of water, filled by seeping from submersed springs, is situated in the southern part of the cluster. Resort employees noticed that the pond filled up over long periods of time and then emptied out in abrupt drainage events.
The goal of this study is to identify the unique deformation mechanism that controls the system and leads to its unique hydrologic behavior. These, in turn, are associated with the damage and abandonment of the resort. We analyze the hydrological–mechanical interplay that takes place at this site by combining direct measurements of water levels in the sinkhole cluster with surveys of surface displacement and deformation. These data enable the calculation of water fluxes through the sinkholes and the evaluation of the local hydrodynamics.
2. Shalem Sinkhole Site
A sinkhole is a topographic depression formed as the underlying bedrock is dissolved by groundwater. There are two main varieties, one caused by the collapse of the roof of a cavern, the other by the gradual dissolving of rock under soil [24]. The sinkhole cluster in Shalem-2 is about one kilometer in length and about 250 m wide, and is continuously growing in size. The evolution of this cluster generated extensive damage to the nearby infrastructure, natural reserves and coastal sites. The pond is about 80 m wide, 150 m long and about 6 m deep at the deepest place (Figure 1A). The volume of water accumulating in the pond is estimated to reach over 35,000 m3 when the water reaches its highest levels. The surface water, when seeping from the ground into the pond, has a temperature of 40 °C and a salinity of Cl = 120 gr/L, which is about half of the salinity of the Dead Sea (Cl = 200 gr/L) [16]. The lithology of the site was described based on three boreholes that were drilled in it [16]. The deepest borehole (49 m) included an alternating sequence of lacustrine muds and alluvial gravels, underlaid at a depth of 20 m below the surface by a 15 m thick halite unit. This borehole penetrated a cavity > 1.5 m wide within the salt unit. Towards the west, the lacustrine mud grades laterally through an interfingering contact into the alluvial fan gravels. These lateral facies change bound deposits with markedly different permeability and rheology—porous and brittle gravels versus low-permeability and ductile muds [5].
3. Measurements of Water Level and Topographic Evolution
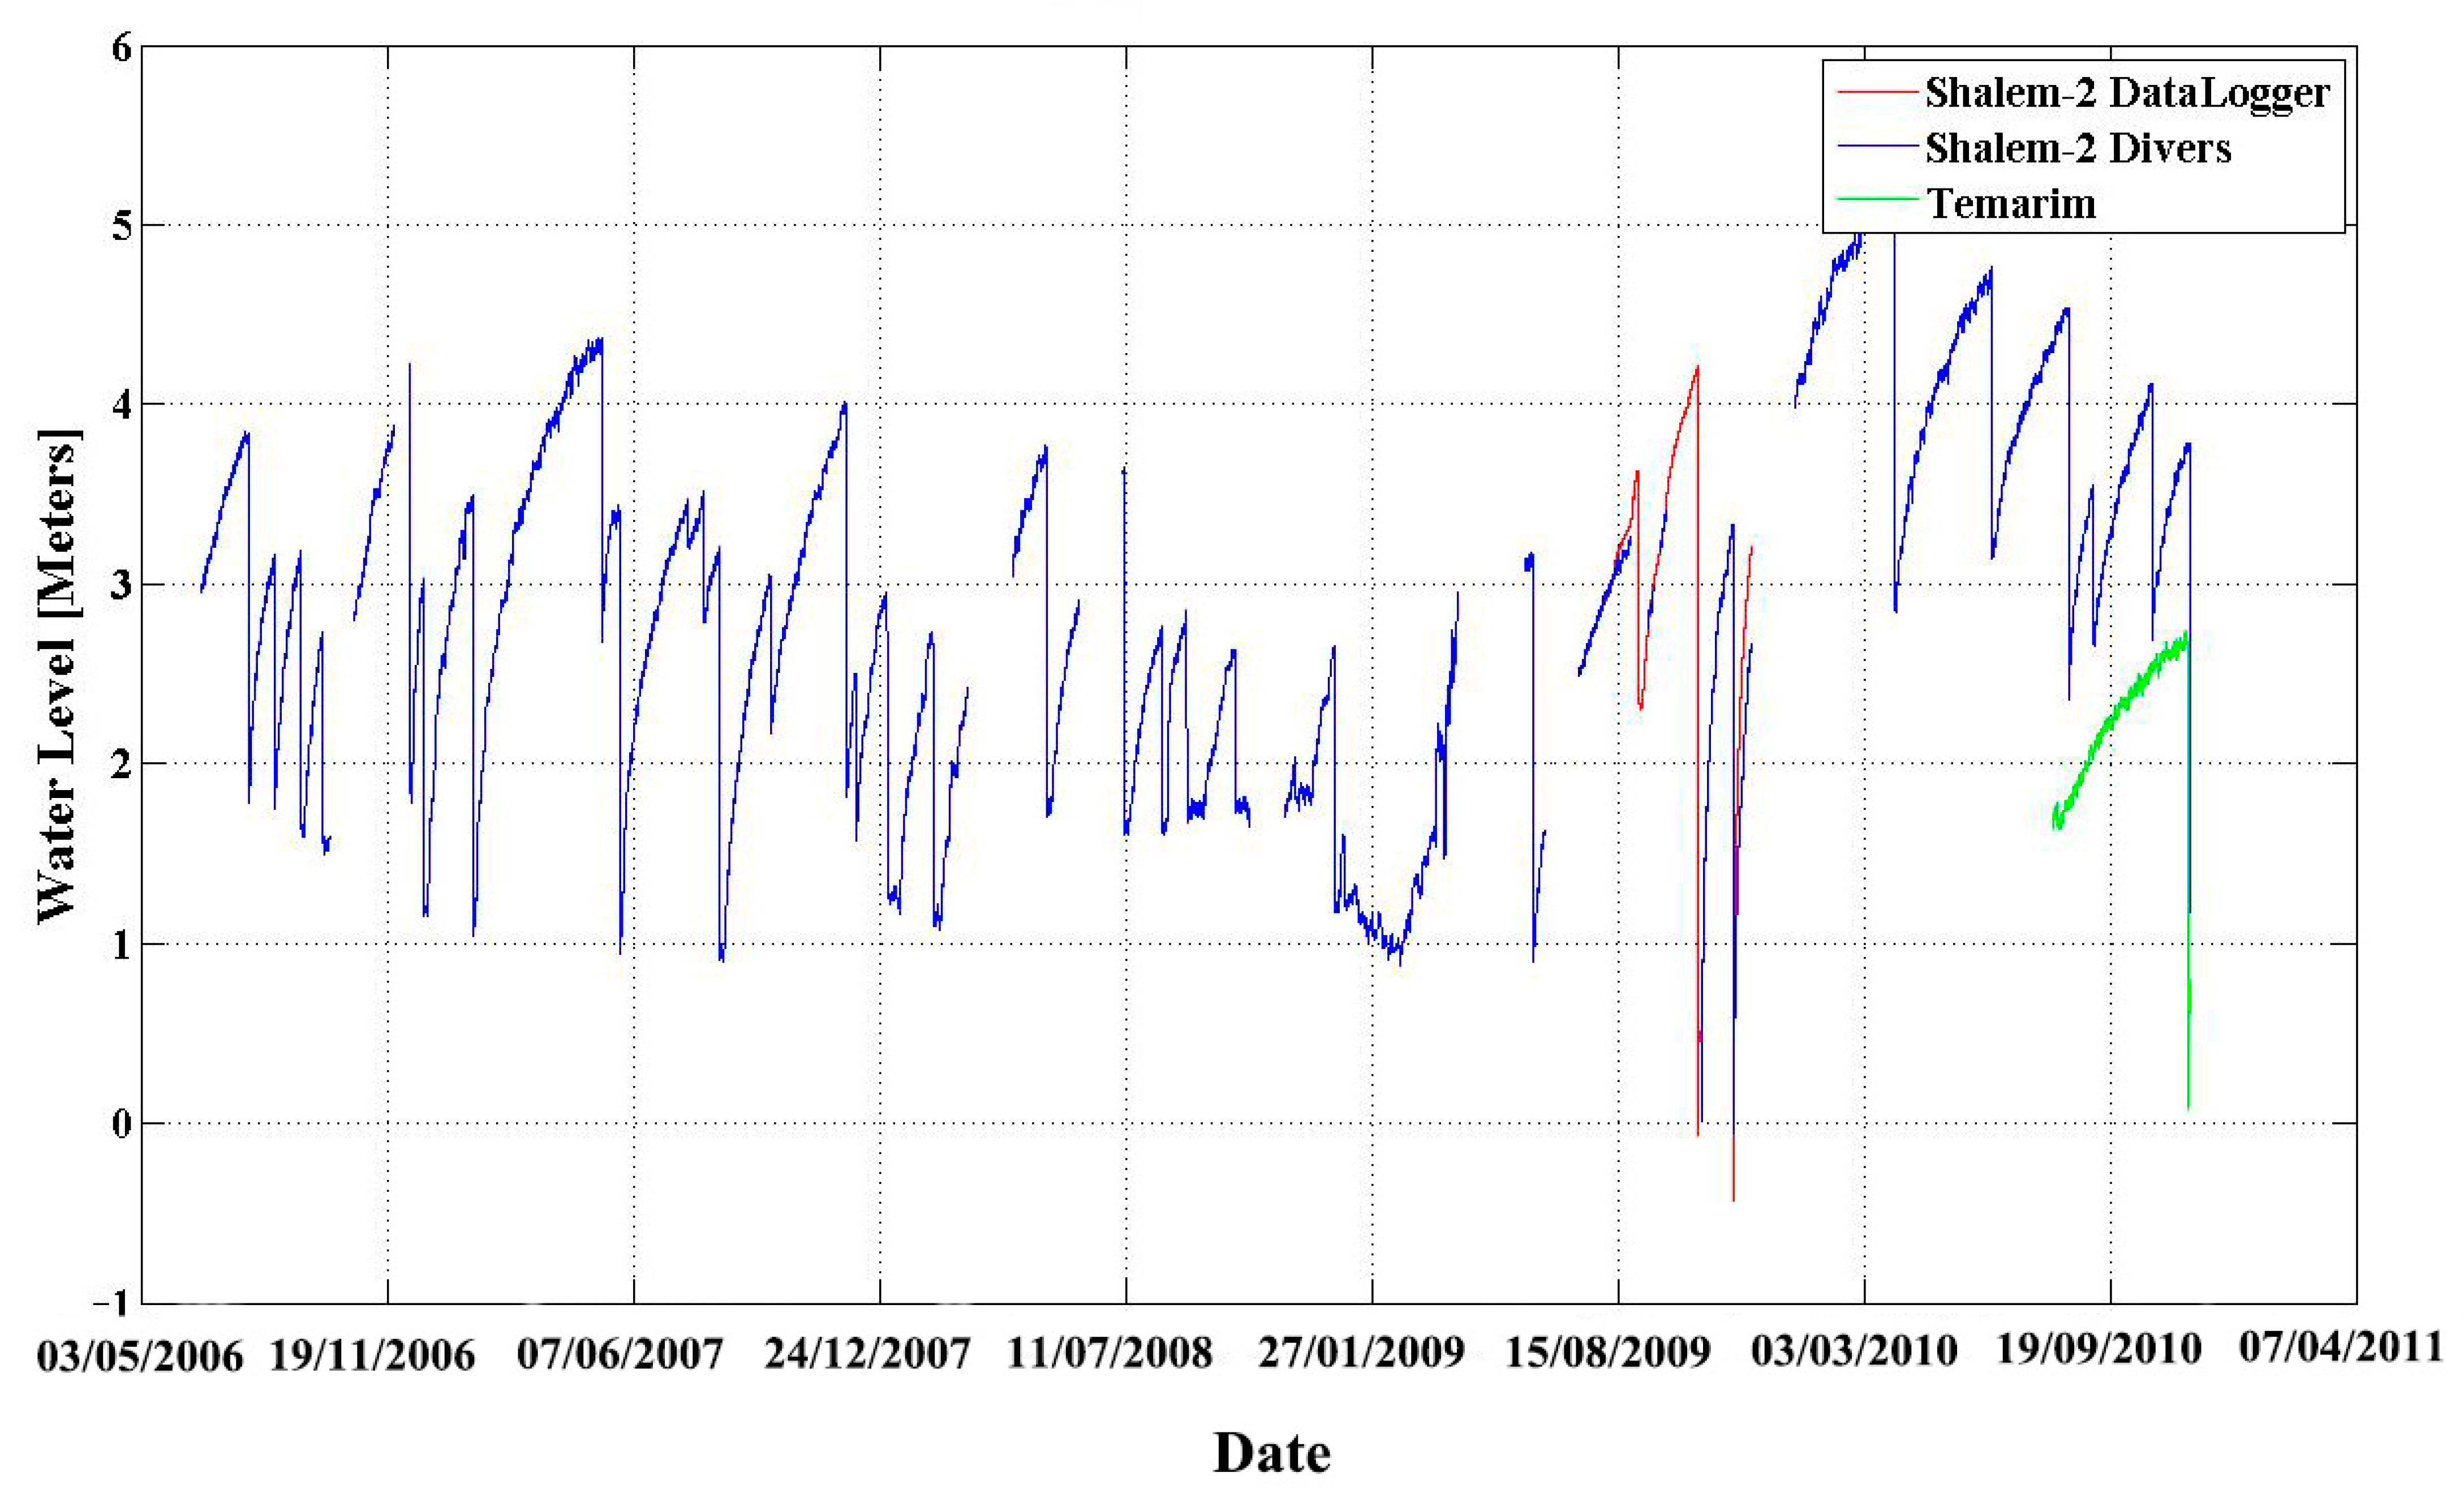
The water level in the Salem-2 sinkhole was monitored over a period of 5 years (Figure 3). From 6 July 2006 to 8 August 2009, the water level in the sinkhole was measured every 5–15 min using either a Solinst Levelogger or Diver pressure and temperature sensors. These sensors were tied to a pole and submerged in the pond’s water. After observing the complexity and the speed of drainage events, the level measurements sampling rate was increased. From 8 August 2009 to 1 December 2009, in addition to the other sensors, the water level was measured every 5 s using a high-resolution data recorder (Campbell CR1000) with an OTT-PS1 pressure and temperature sensor. This sensor was attached to an anchor and submerged in the pond. Water level recordings ended on 23 November 2010. To examine whether similar dynamics of the hydrological system occur in additional sinkholes, the water level was also monitored in the Temarim sinkhole pond, located about 10 km to the north of the Shelem-2 sinkhole (Figure 1). These measurements were taken every 15 min starting 3 August 2010 through to 23 November 2010. Notably, surface water in both sites is recharged by nearby springs.
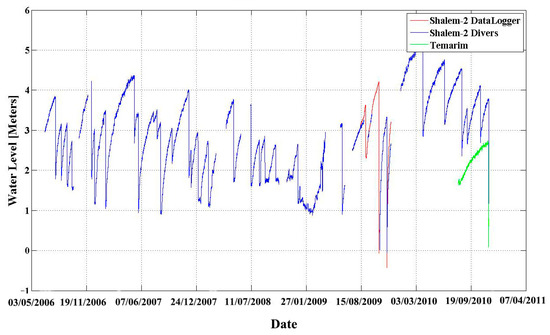
Figure 3.
Continuous measurement of water level and the abrupt drainage events as recorded in Shalem-2 and Temarim sinkholes. The water level in Shalem-2 (blue and red) monitored between 6 July 2006 and 23 November 2010. The records are color-coded by the different instruments that were used during that period. Data cutoffs are due to malfunctions. One similar dynamic event was also recorded in Temarim sinkhole site (presented by the green line, at its true scale, but is not referenced to the water level in Shalem-2 sinkhole) and suggesting that similar dynamics are typical to more than one sinkhole.
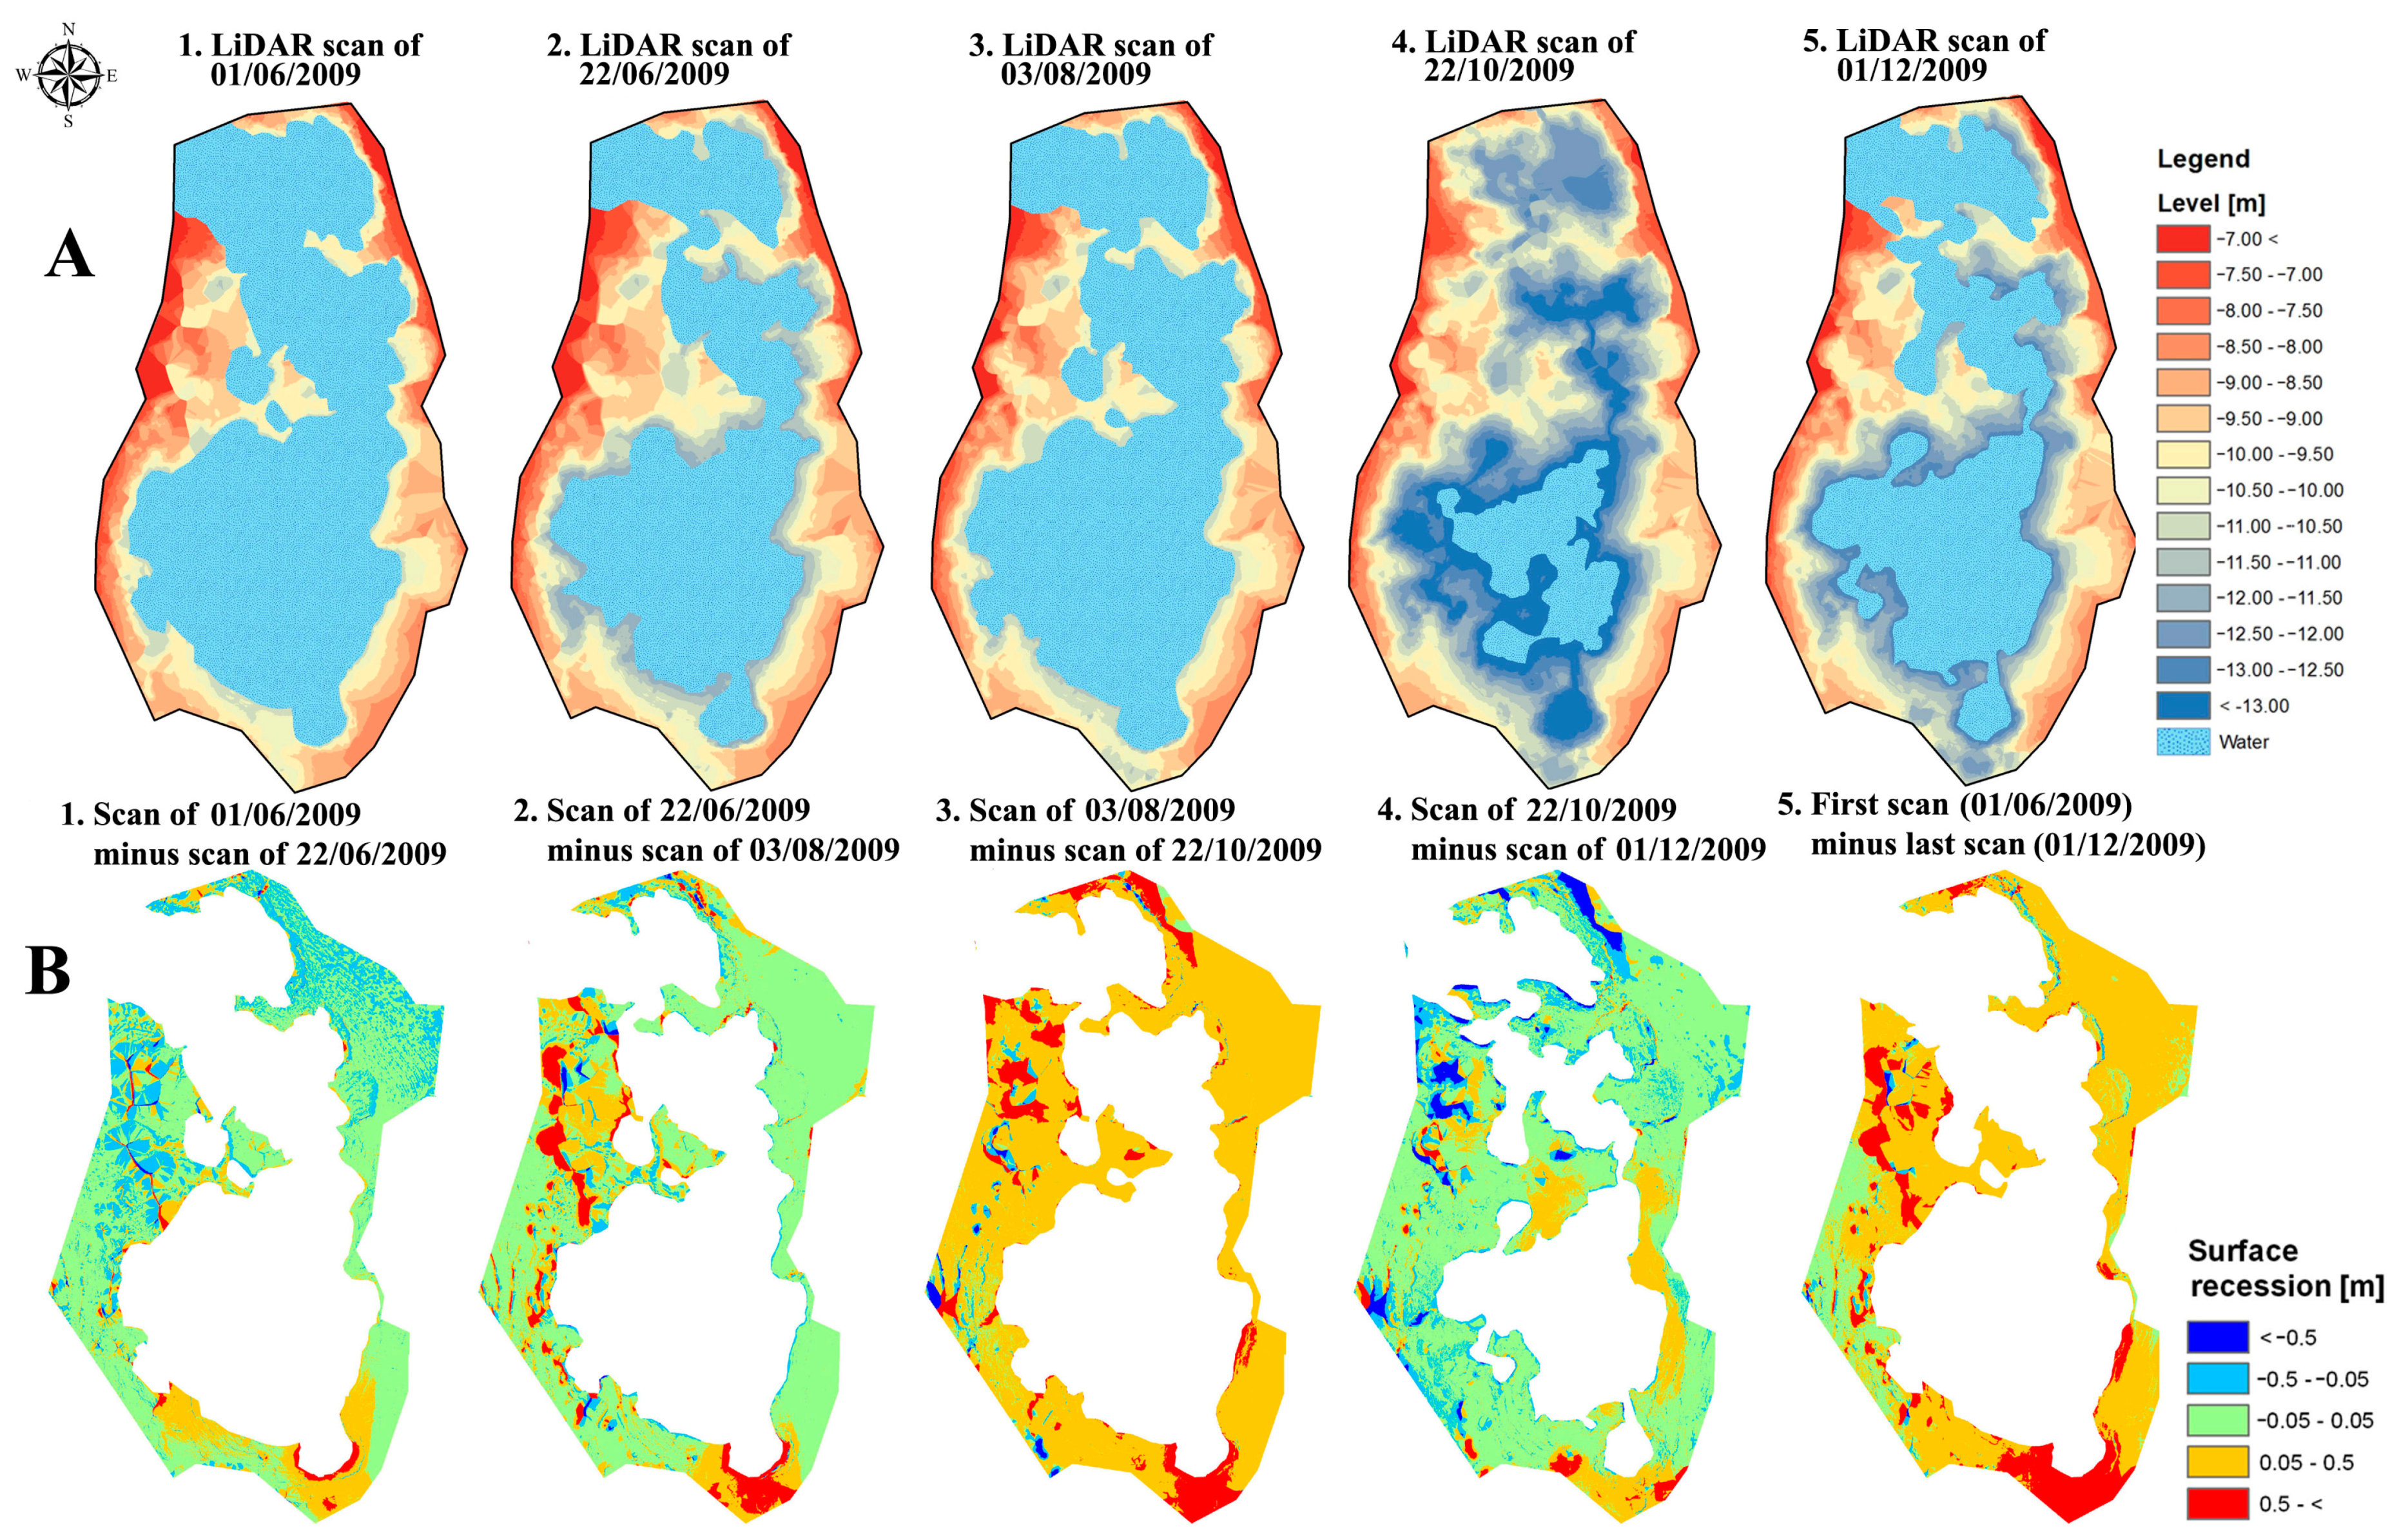
Light Detection and Ranging (LiDAR) data have been increasingly used for classification of areas in recent decades [25,26,27]. In order to measure the evolution of the volume of the sinkhole and track local and regional deformations, five LiDAR scanning campaigns of the sinkhole and its vicinity were performed between June 2009 and December 2009 (Figure 4). Scans were performed using a Leica HDS3000 ground base laser scanner, which has a maximum range of 300 m, spatial accuracy of 6 mm at 50 m, and a single-distance measurement accuracy of 4 mm at 50 m. A full survey of the desired area was obtained by combining scans taken from two to three stations around the sinkhole. Control points made of 12 cm (in diameter) foam balls were used to co-register scans from the different stations of each campaign. Four control points at higher stable ground were used as constant control points of origin for the co-registration of all survey campaigns.
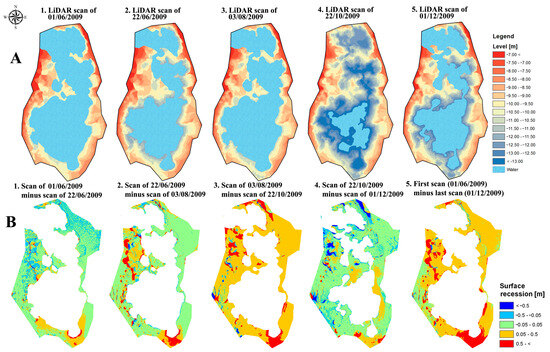
Figure 4.
Topography of the sinkhole and its nearby area as surveyed by ground-based LiDAR. (A) Five topographical maps of the surface around the sinkhole and the water level. (B) Five subtraction maps calculated from two different LiDAR scans: four of these maps were calculated from consecutive surveys and one map (right) from the first and last surveys (left and right maps in Figure 4A).
Because the Shalem-2 sinkhole was filled with water most of the time, a significant part of the submerged topography of its floor was not visible. However, on October 22 (Figure 4(A4)), a scan was performed three days after a major drainage event that completely drained the sinkhole. During these three days, the water level, already rising slowly, was at one of the lowest topographic records to be measured in the sinkhole. This allowed the generation of a surface model of the majority of the sinkhole’s floor. Only an area of 1830 m2 out of more than 14,000 m2 was flooded at that time (−13.828 m, local height surveyed by LiDAR). We therefore considered this water level as a zero reference plane for all maps, measured water levels and following calculations. LiDAR scans were taken on 1 June 2009 and 3 August 2009 when the sinkhole was at a relatively high water level. Other scans were taken after drainage events.
Point clouds originating from the campaigns were interpolated to 5 × 5 cm raster digital elevation models using the ESRI ArcMap 9.03 software and the tool “Topo to Raster”. Detailed topography maps of the sinkhole and its nearby region were generated for any given campaign. Any single map documents the local topography in a given time, while the relative deformation was estimated by subtracting one map from the other. All maps and heights were defined only to a local height and grid system. In total, five surface models of the sinkhole area were calculated from the campaigns (Figure 4A). These models were used for calculating the volumes of the water in the sinkhole and for tracking its morphological developments (Figure 4B). The volumes of surface water in the sinkhole were calculated for each measured water level and based on the topographic surface model of 22 October. The area of every pixel from the model (0.025 m2), with a topographic height equal to or lower than the given water level, was multiplied by the difference between the water level and the pixel’s height. Summing all obtained results produced the volume of surface water in the given water level.
To better characterize the drainage events, their discharge fluxes were calculated by subtracting each volume value from the following value and dividing the result by the time step between them. The morphological changes were evaluated by calculated subtraction maps of the area, using each consecutive model, the first scan and the last scan (Figure 4B).
4. Results
The calculation of the drainage volumes and flux histories from the measured water level records allows for a direct examination of the drainage mechanisms and controls.
4.1. Water Levels
The water level data (Figure 3) reveal periods of slow rise in the sinkhole surface water level that are followed by episodes of rapid release. Neither the time intervals between drainages nor the amplitudes of the water-level drops portray any distinct repeating patterns (Table 1). No correlation was found between any of the maximal (colored red) or minimal (colored yellow) values with other attributes, such as duration or time from previous event. The duration of water level rise between drainage events ranges between a few days and up to three months. Independently, the durations of the drainage events range between 1.5 and 28 h. The water level decreased in some of the events by centimeters while in other events by meters. One drainage event (19 October 2009) completely drained the entire sinkhole.

Table 1.
A comparison of all monitored drainage events parameters.
A total of 35 drainage events were recorded. One additional event that occurred between 21 March and 24 March 2009 was only observed in the field and was not recorded due to sensor malfunction; the water level was significantly lower on 24 March than the level on the previous visit to the sinkhole on 21 March (see Figure 3). With time, the location of the sensor was replaced when the water level of the sinkhole dropped below the sensor and it was then relocated to a deeper place. On several occasions, the ground where the sensor was located subsided abruptly, and the data had to be manually corrected. On seven occasions, a malfunction of the sensors resulted in a data gap, and the relative offsets of continued level records were estimated from the shape of the graph and based on field observations (Figure 3). However, since the level of the sensor was not correlated to a fixed benchmark, it was impossible to track possible small long-term changes in its vertical position because the water level sensor was attached to a pole grounded in the mud inside the pond. Slow sinking of the pole holding the sensor into the mud, or slow sinking of the whole ground where the pole was positioned, may have been recorded as a false rise in the water level. Based on our field observations, we estimate this bias not to exceed 30 cm. However, in most cases, the pole was observed to be steady.
4.2. Sinkhole Shape and Volume
LiDAR scan interpolations (Figure 4) reveal significant and complex variations in surface morphology in and around the sinkhole system. The majority of the area around the sinkhole subsided over the entire study duration by 0.05–0.5 m. In all subtraction maps, the southern flank of the pond is marked by high surface recession, and thus seems to be constantly active (Figure 4B). The total subsidence in the southern area over the entire measurement’s duration exceeds 0.5 m (Figure 4(B5)). Large subsidence is also observed on the eastern side of the pond (Figure 4(B3),(B5)). The major changes seen in the middle of the western flank of the sinkhole represent poor interpolation caused by a lack of data.
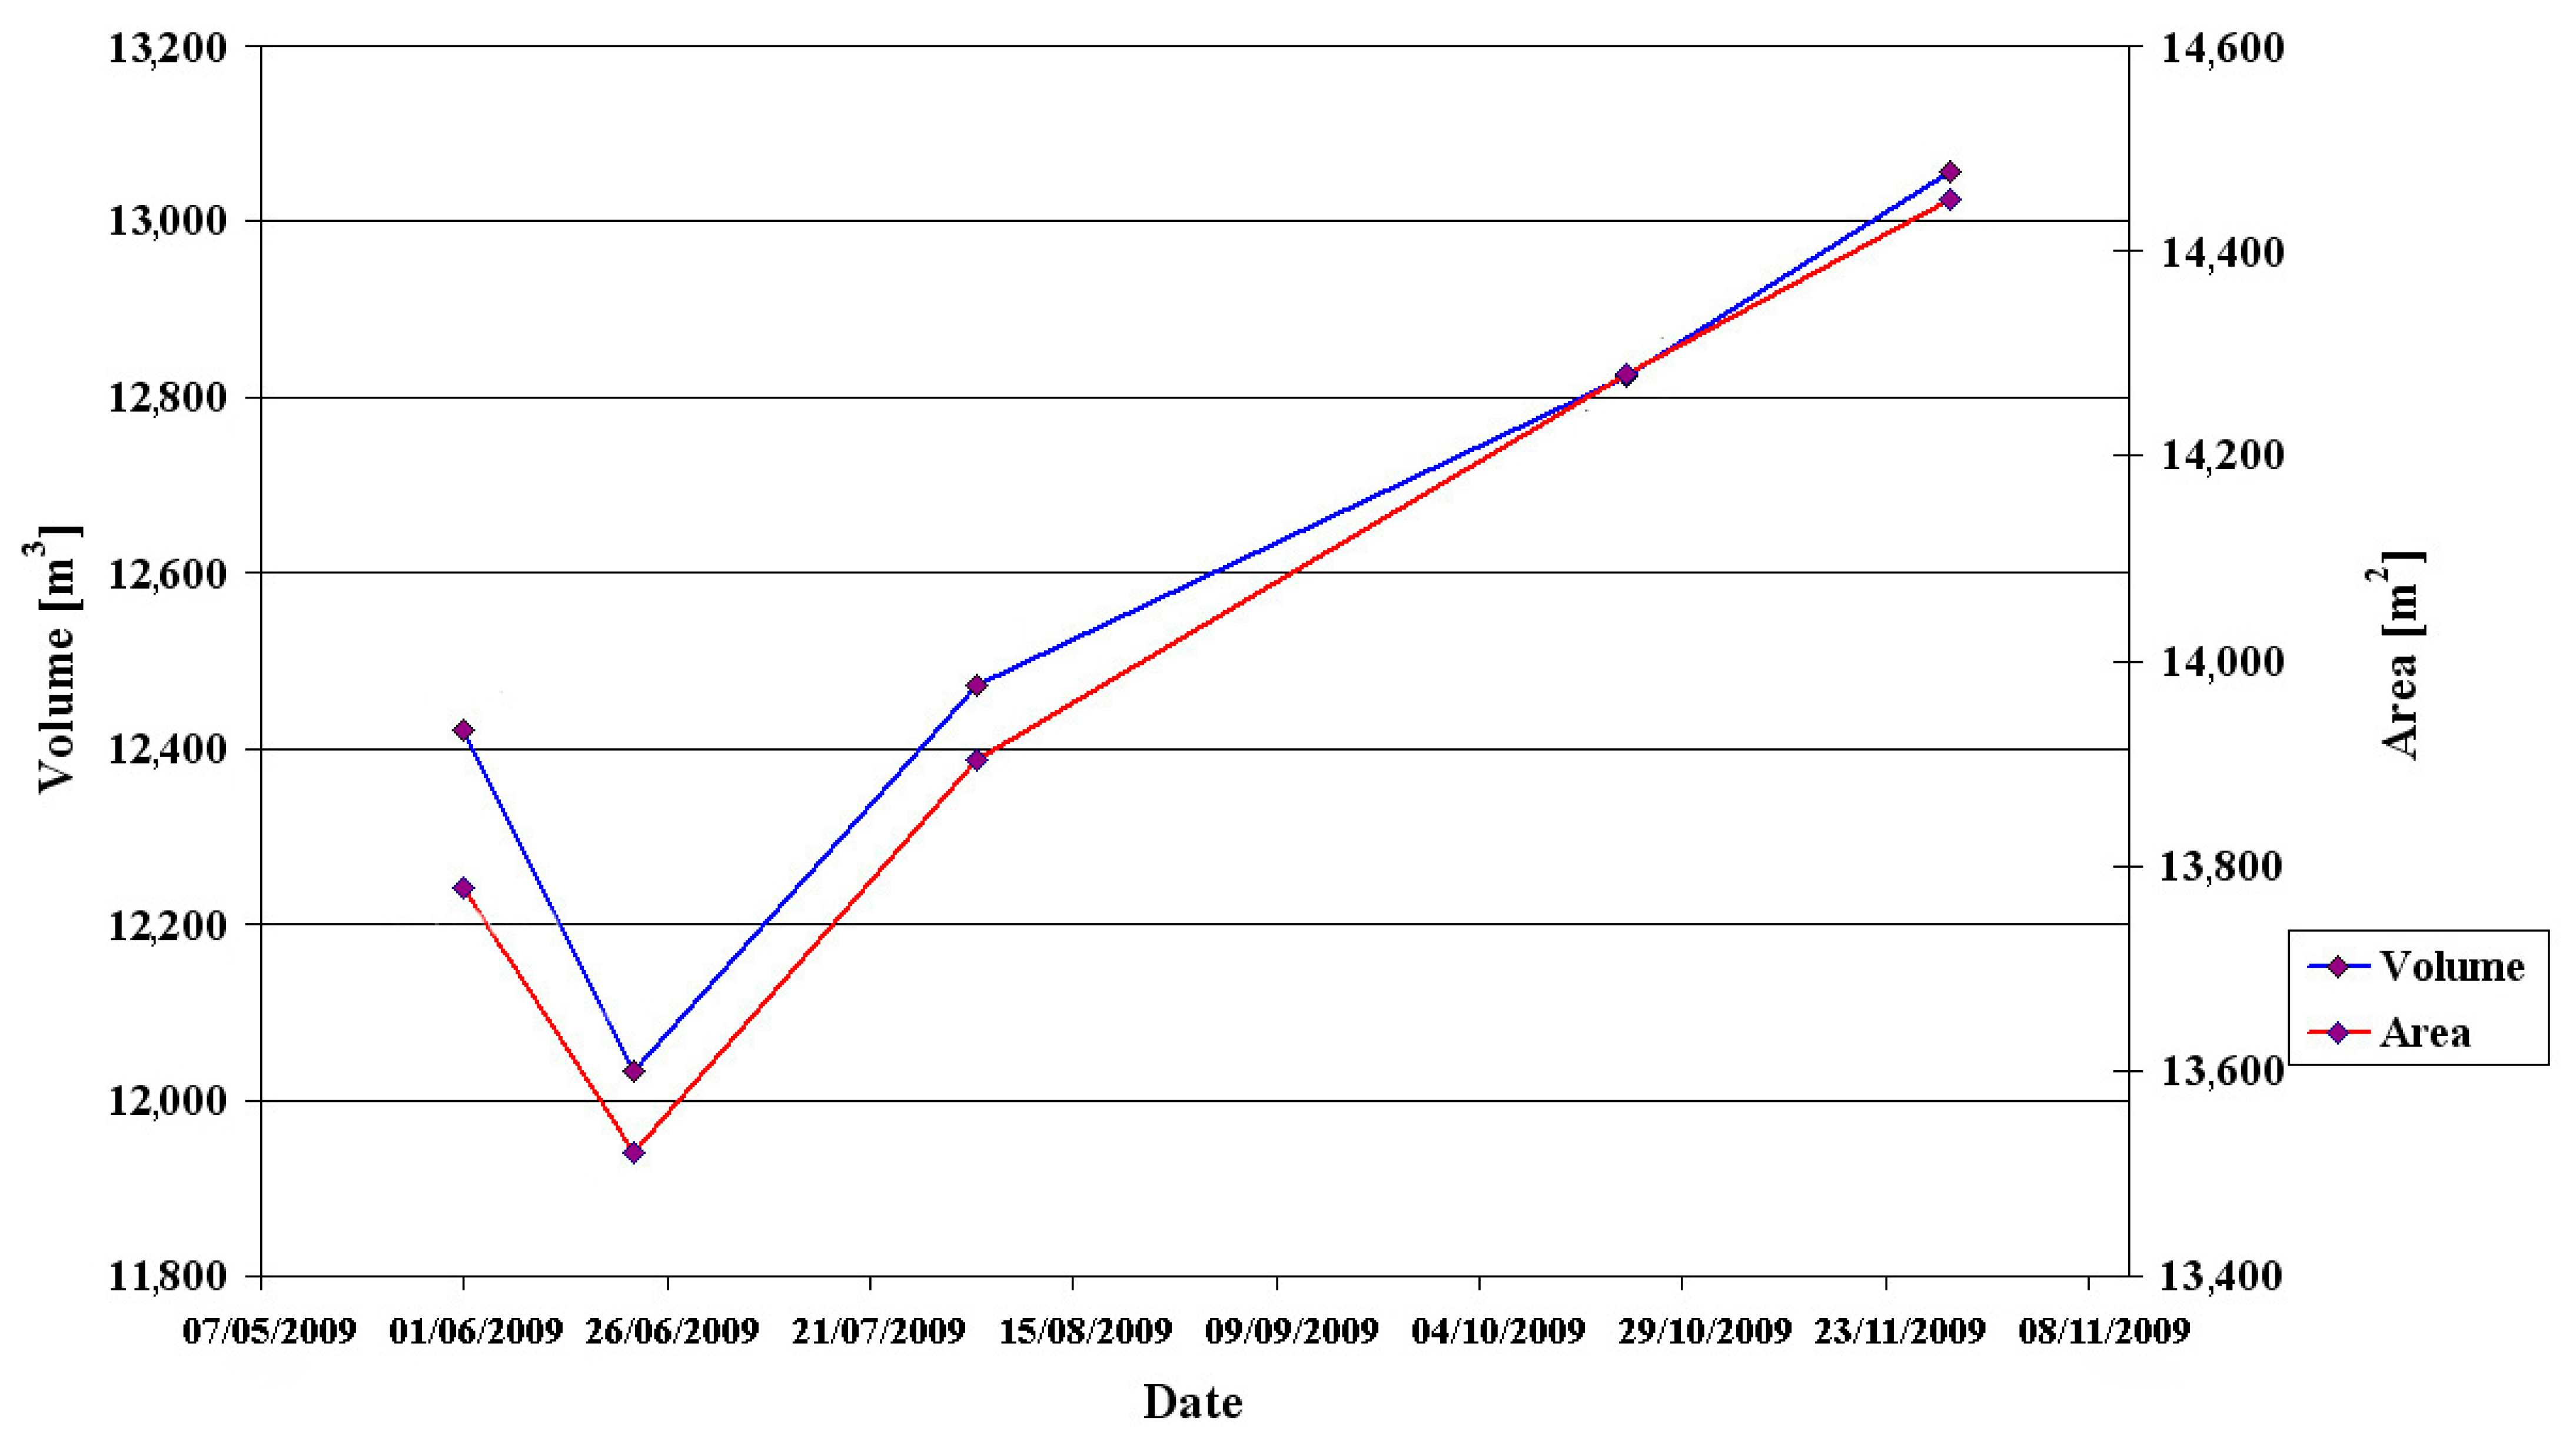
A comparison between the LiDAR topographic models (Figure 4A) indicates that the general shape of the sinkhole remained the same over the period of six months when the scans were taken. The differentiated scans show that the continuous deformation only slightly modifies the size of the sinkhole site over this duration. The area of the sinkhole at the level of 4.33 m (local height) grew by 5% (672 m2) and the volume of a slice between 3.33 m and 4.33 m grew by 5% (635 m3; Figure 5).

Figure 5.
Temporal evolution of the area of the sinkhole at the level of 4.33 m (local height) and the volume of a slice between levels of 3.33 m and 4.33 m (this slice appears above the water level and thus measured in all scans, but it is entirely enclosed inside the bounds of the sinkhole). In general, the sinkhole dimensions are growing with time.
4.3. Flux Calculations
The calculation of the drainage volumes is based on the approximation that the general geometry of the sinkhole does not change over time, although the LiDAR scans show ongoing deformations of the sinkhole and a growth of its volume and area over a period of six months (Figure 6). Resulting errors in the calculated volumes and fluxes grow approximately with the time from the reference LiDAR survey of 22 October 2009. However, the changes (5% over 6 months) are small with respect to the area and volume of the entire sinkhole’s pond. Furthermore, the similarity in the volumetric and spatial growth of the sinkhole suggests that the walls of the sinkhole’s system maintained their upright position and that the general “U-shape” of the deforming sinkhole site is maintained during its growth. We therefore postulate that despite the imprecision in estimated drainage volumes and fluxes, their temporal profiles adequately represent the mechanisms of the discharges (Figure 6 and Table 1).

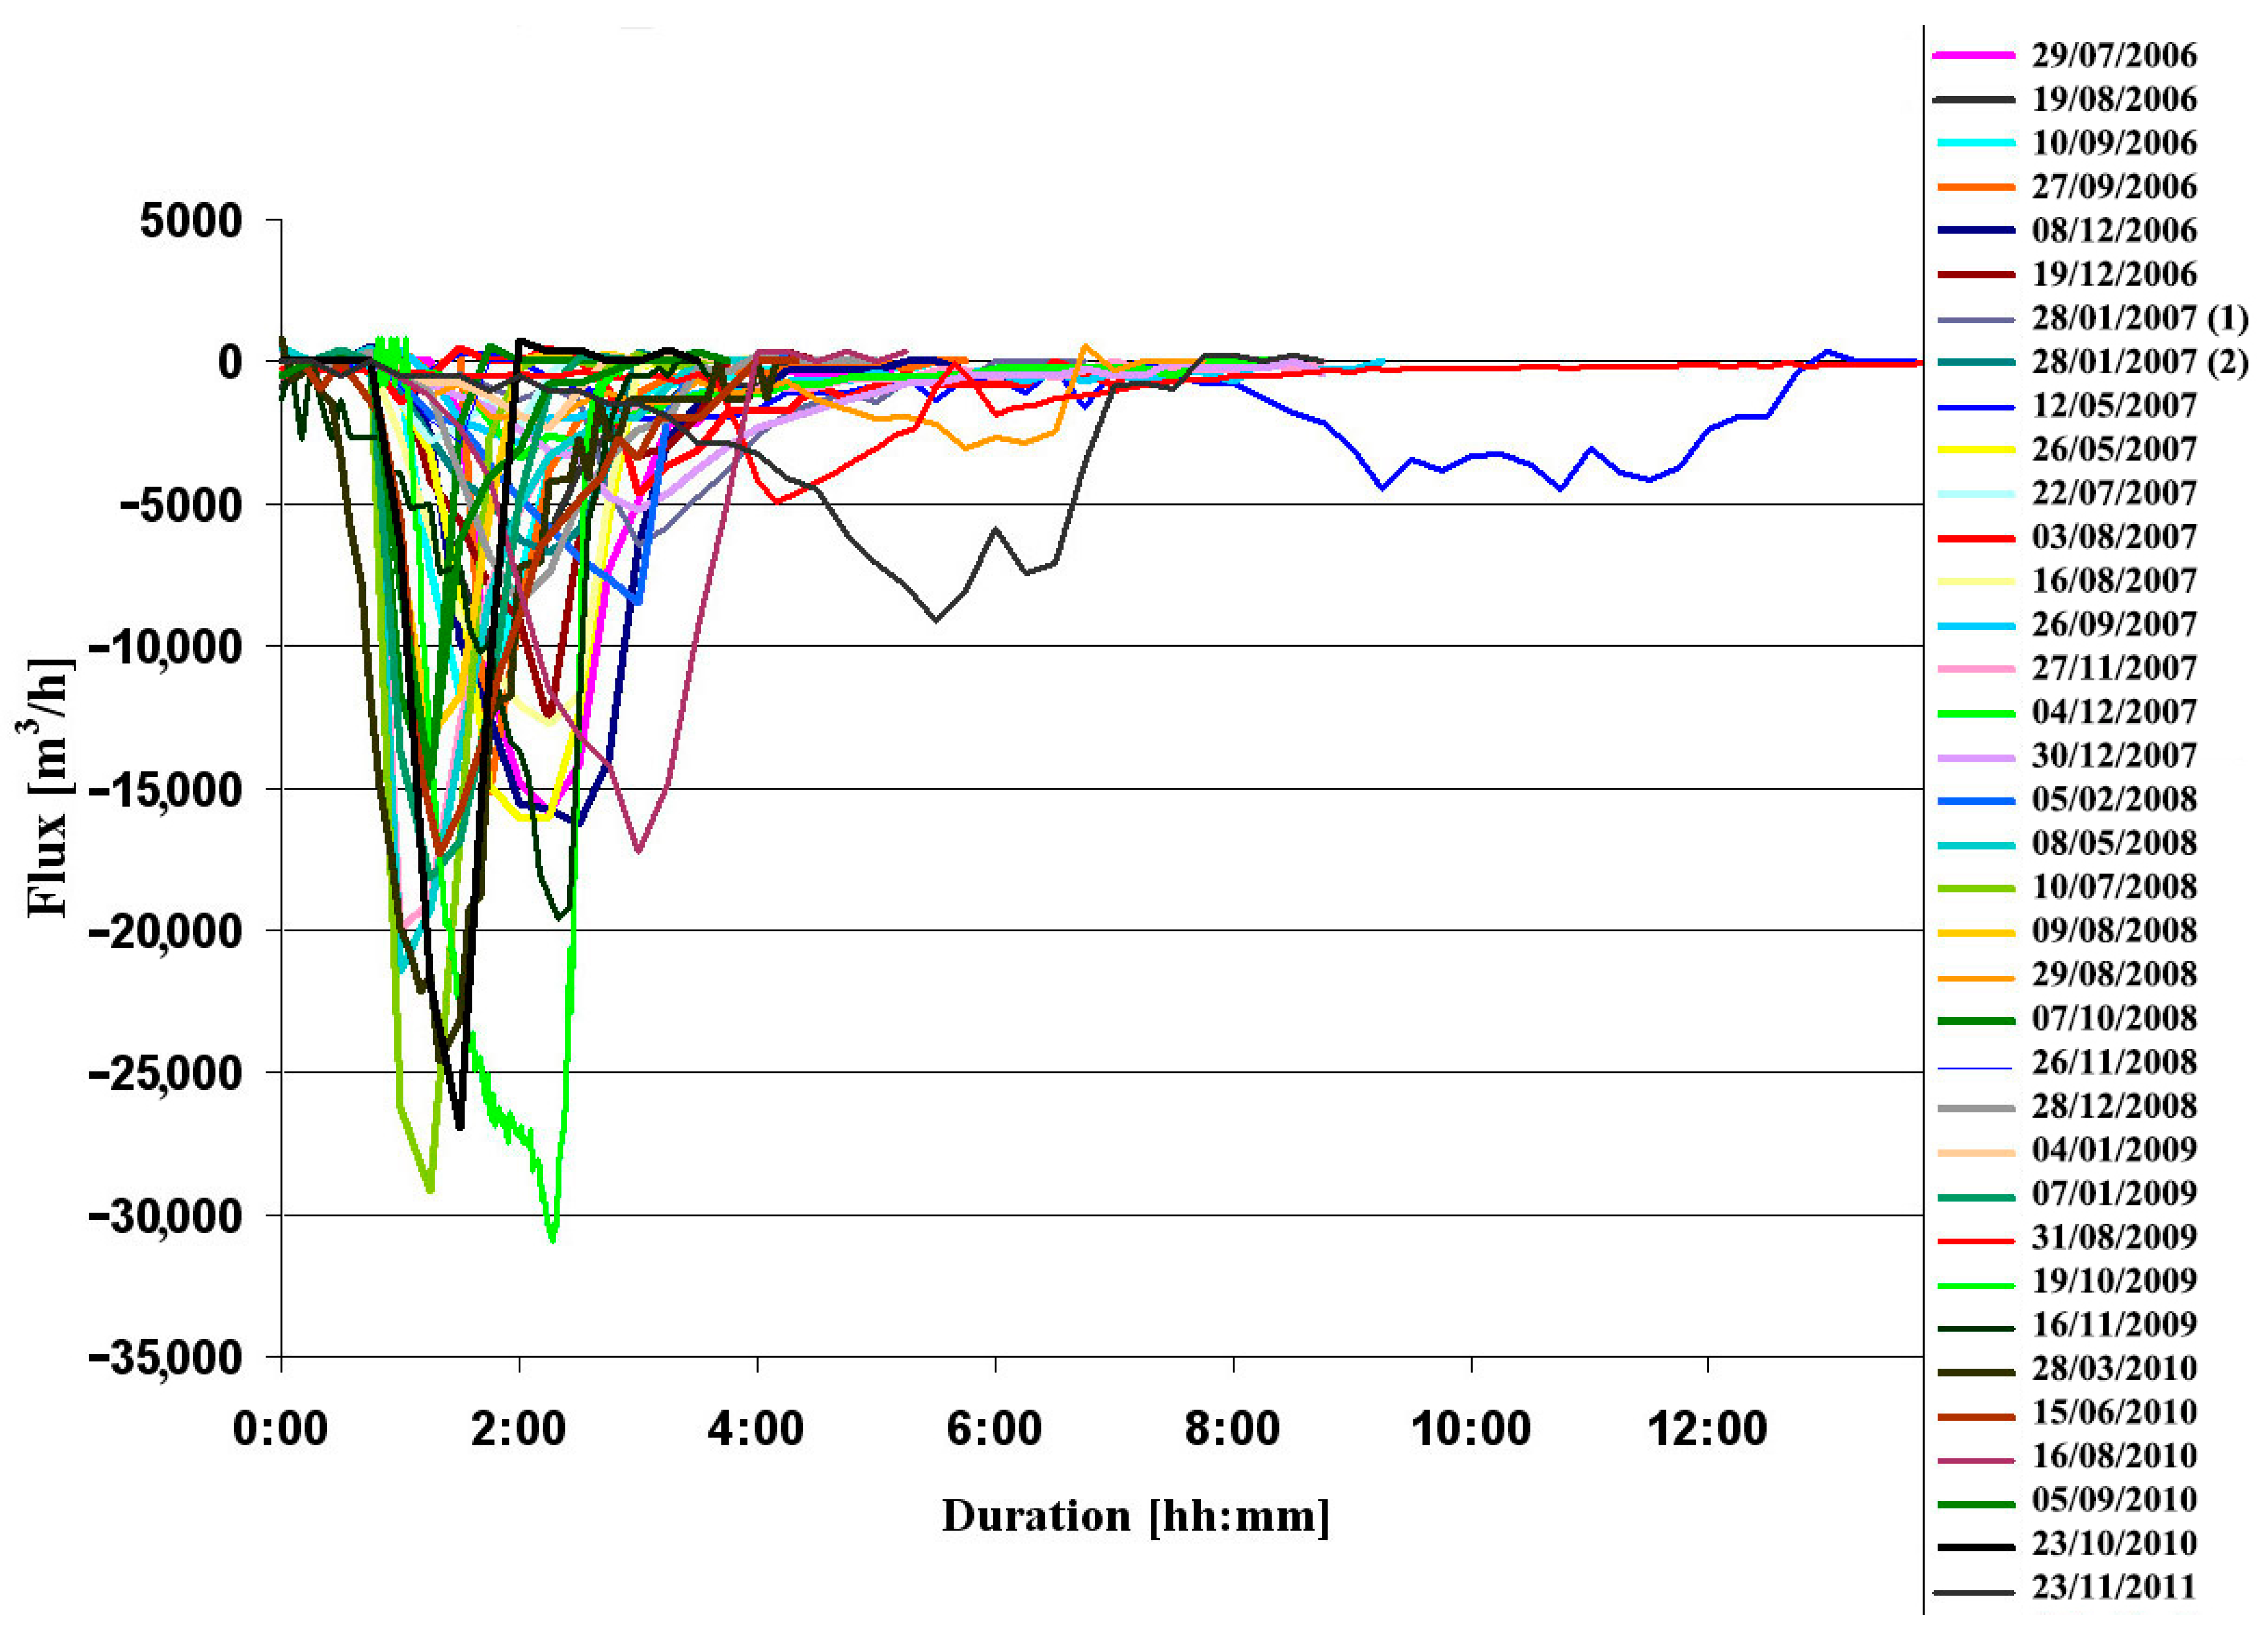
Figure 6.
The calculated flux of all drainage events displayed as a function of the events’ duration from their beginning to end.
5. Discussion
The discharge process of the drainage events was divided into two stages (Figure 7): 1. the buildup stage, from the beginning of discharge until the outflow flux reaches its peak; and 2. the declining stage, starting when the flux reduces from its peak value until the water level is re-stabilized with no discharge. The event was considered terminated when the flux values returned to being positive and the pond was returned to filling up from its water source.
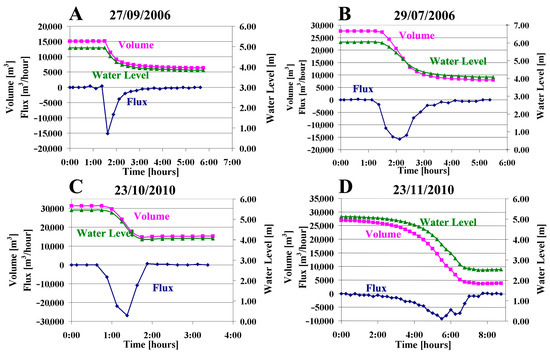
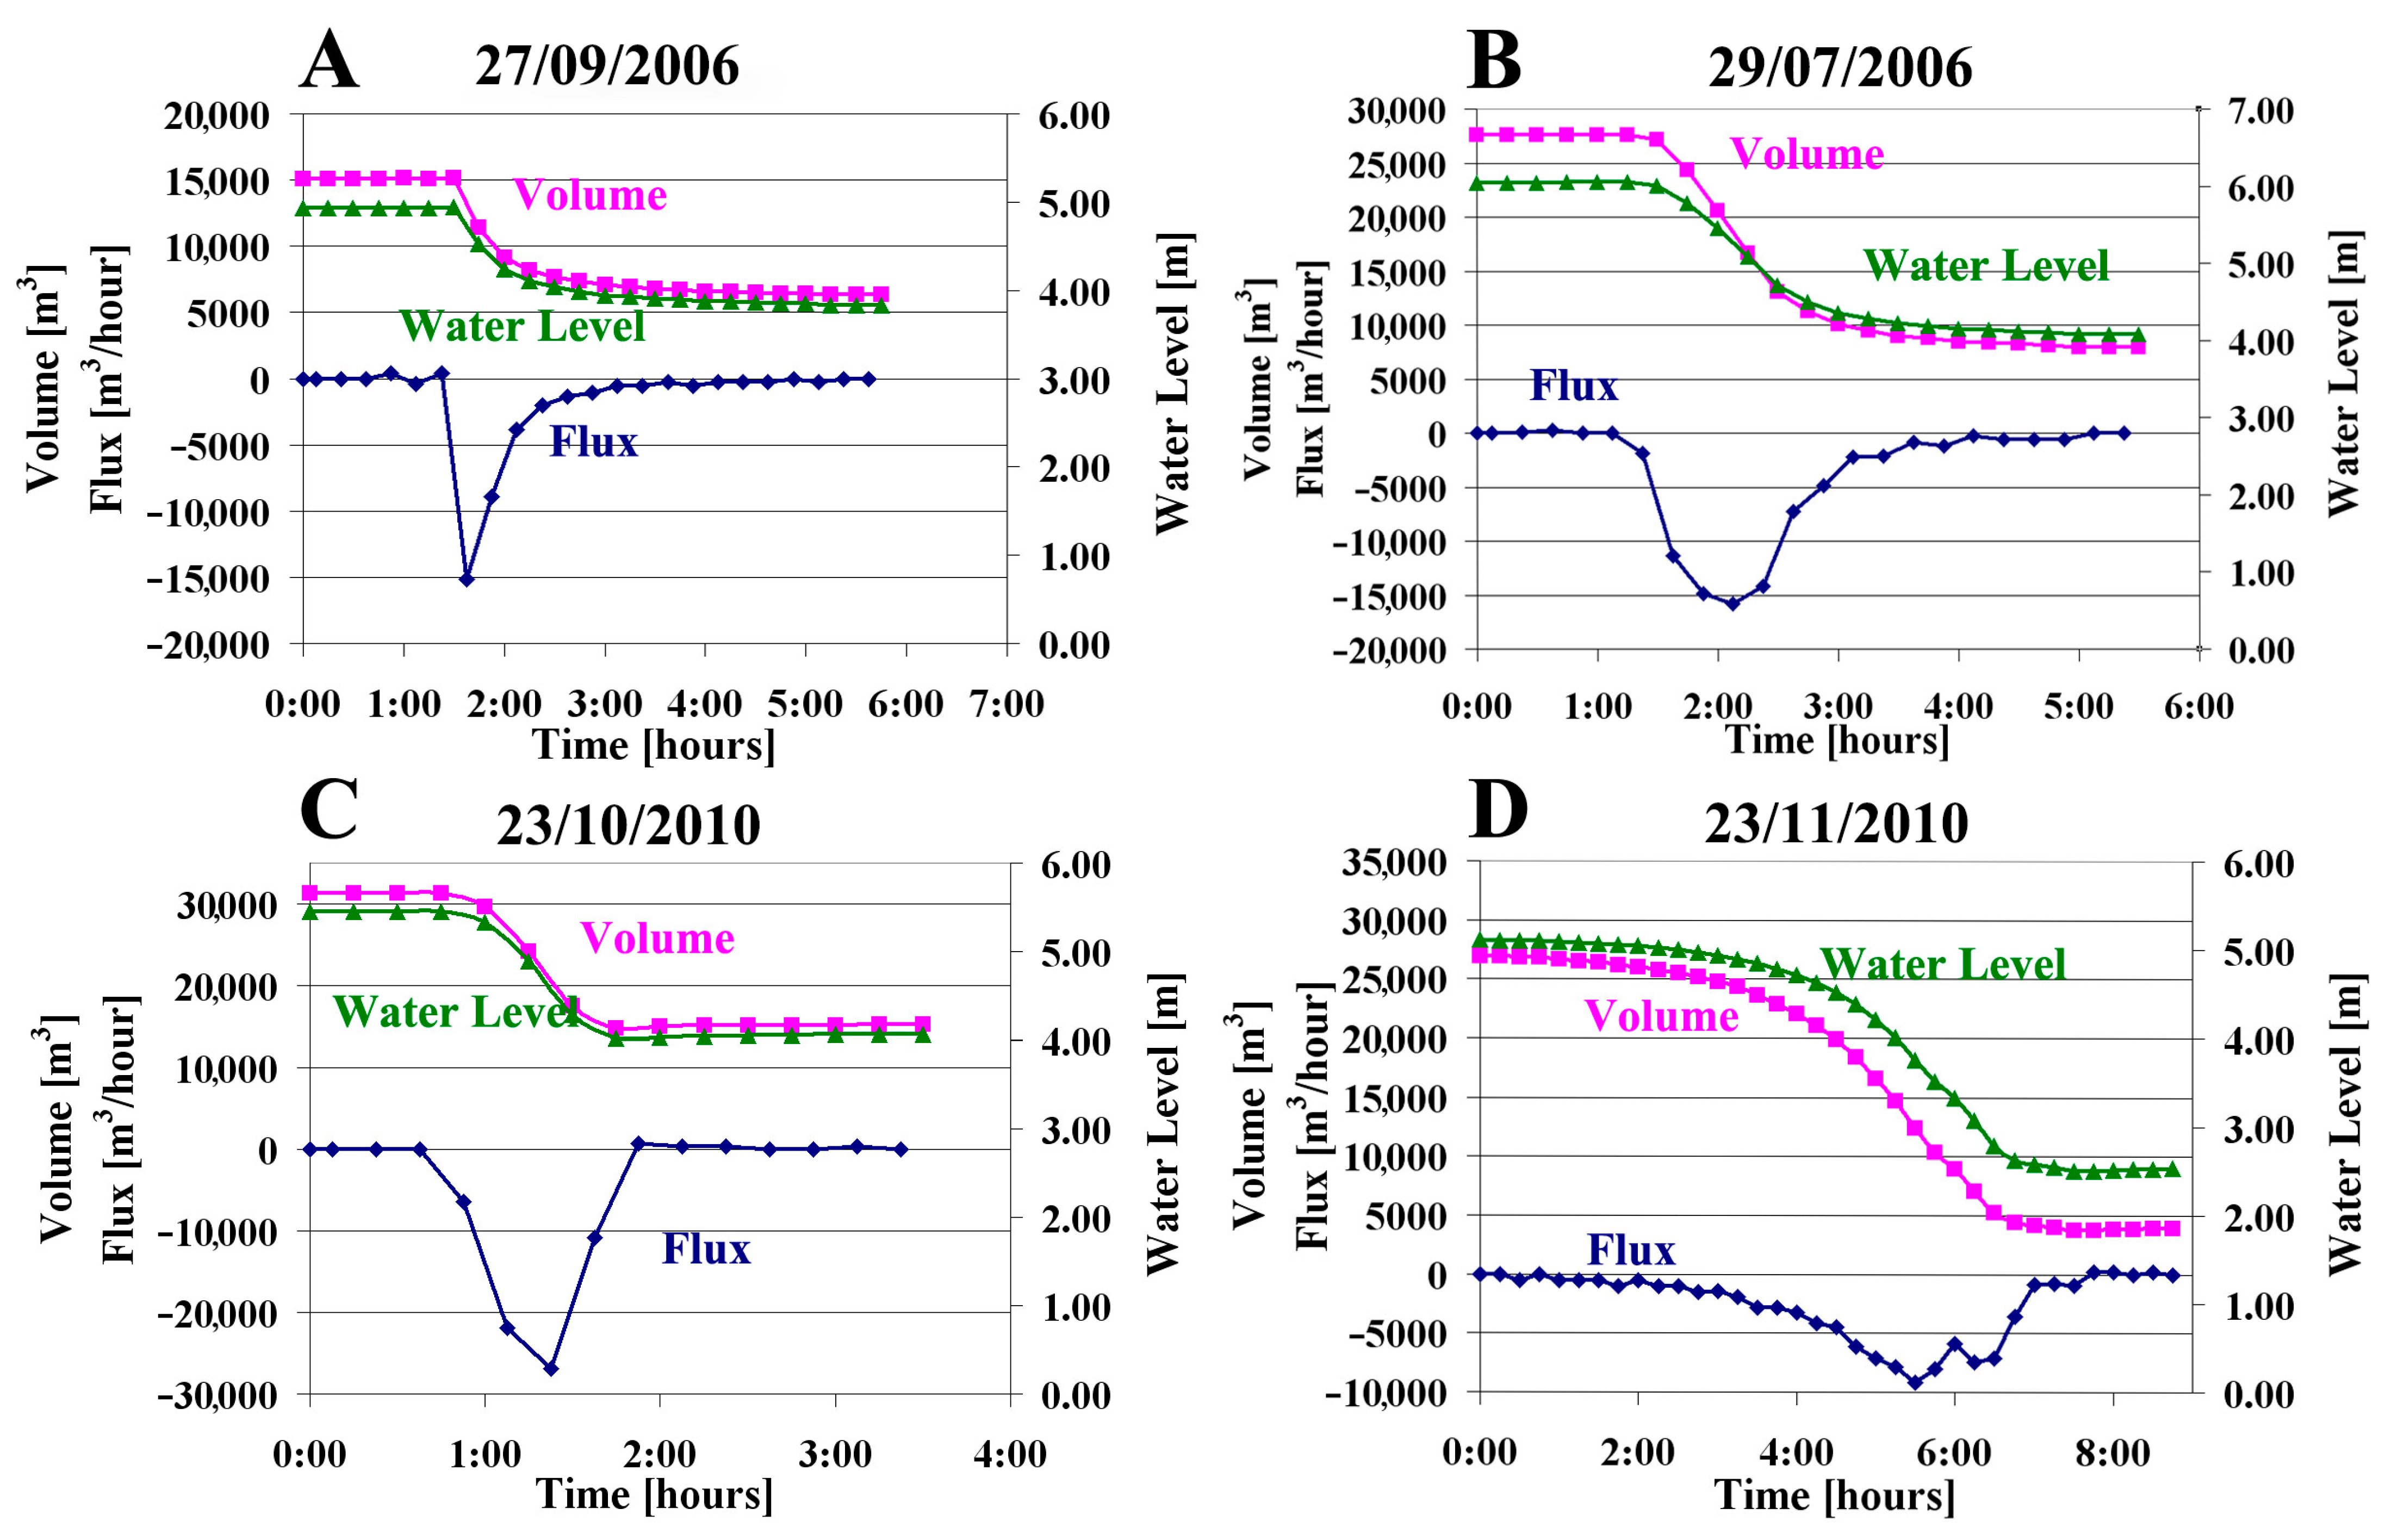
Figure 7.
Plots of the measured water levels, and calculated volumes and drainage fluxes as a function of time for four events, representing the main drainage constituents of most of the observed events. The negative values of the flux signify water discharge. (A) An abrupt onset of the event reaching the peak outflow flux in the first record. The event stops once the water level declines to the elevation of the newly formed sinkhole. (B) A curved gradual increase in the outflow flux, suggesting an improving hydraulic connection to the aquifer. (C) A sudden termination of the drainage event, possibly caused by mechanical plugging. (D) A complex event combining multiple sub-events.
Two types of the buildup stage were observed:
1. The peak of the flux reaches its maximum at the beginning of the event, as was observed in three out of thirty-five events (Figure 7A), suggesting that a structural failure opened the hydraulic connection between the surface water and the underground system. The first reading of the discharge is also the peak of the outflow of the event. The interval between this reading and the previous one is regarded as one stage, as dictated by the data sampling. However, this stage may have been a series of sub-events, through which the hydraulic connection has improved, but which cannot be deciphered.
2. The outflow flux increases with the progression of the event until reaching the peak, suggesting that the hydraulic connection between the surface water and the underground system improves during the drainage event (Figure 7B,C). A sharp change in the discharge flux when the drainage event reached its maximum, as observed in eleven events (Figure 7A,C), is attributed mainly to mechanical failures during the opening (Figure 7A,C). In contrast, a gradual increase in the flux, as observed in seven events, suggests a gradual erosion of the opening by the water stream (Figure 7B).
Two patterns also characterize the declining stage:
1. The draining stopped suddenly (Figure 7C), as observed in fourteen events, suggesting a mechanical collapse that sealed the opening.
2. A decay of the outflow flux (Figure 7A,B) that can be well fitted by a logarithmic curve observed in nine events, suggesting that the hydraulic connection was maintained until the end of the event and the flux was controlled by the pressure of the water column. The discharge finally stopped once the water level reached the elevation of the newly formed sinkhole.
Four events out of the thirty-five are considered complex and are combined of several sub-events. An example is the event that occurred on 23 November 2010 (Figure 7D). The discharge rose gradually then dropped, and then rose and dropped again. These changes suggest that a partial mechanical plugging occurred, followed by a mechanical failure that re-improved the hydraulic connection. The event finally stopped after a series of such mechanical plugging events.
The observed flow histories and specifically the fast drainage events lead us to suggest that the local hydrodynamics are primarily controlled by the formation, growth and/or plugging of a hydraulic pathway, and by the storage capacity of a finite sink. Visual observations and LiDAR scans reflect the sporadic evolution of new sinkholes in the system (Figure 4), and presumably also beneath the pond. We further suggest that the drainage events are controlled by the formation of such new sinkholes, or by the ongoing evolution of older sinkholes, temporarily connecting the pond with an, at least partly, void cavern system lying underneath it (Figure 8). The low permeability clayey sediment layer forming the sinkhole’s pond floor is presumably generally sealed [16], and the surface pond water is inhibited from flowing to the underground cavern system below. The filling of the pond is primarily controlled by the discharge flux of the observed water springs, in its floor and vicinity. Sporadically new sinkholes form below the pond and its vicinity in a finger-like pattern that grows upwards from the dissolved salt layer below [19]. Occasional collapses of new or older, but still active sinkhole roofs, rupture the confining clay layer at the bottom of the pond in different locations. The drainage flux during an event is controlled by the evolution of the hydraulic connection and of the hydraulic pressure difference between the pond and caverns. The drainage flux may grow, plug, or get intermittently constrained, leading to an increase, drop, or variability in the drainage flux, respectively. The level at the end of the event is determined by either plugging the hydraulic system at the opening or downstream of the caverns, when the water level reaches the level of the opening, or when the caverns fill up with water. In cases where drainage is ended but the opening remains open, it is later sealed back either by mechanical failures or by plastic flow of the clay, sealing it again and allowing the pond to refill.
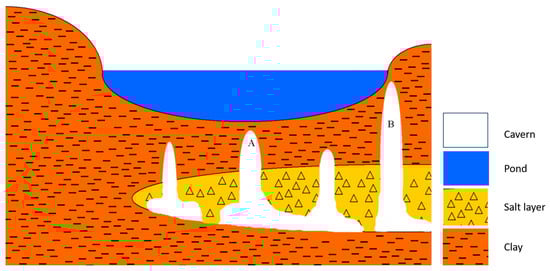
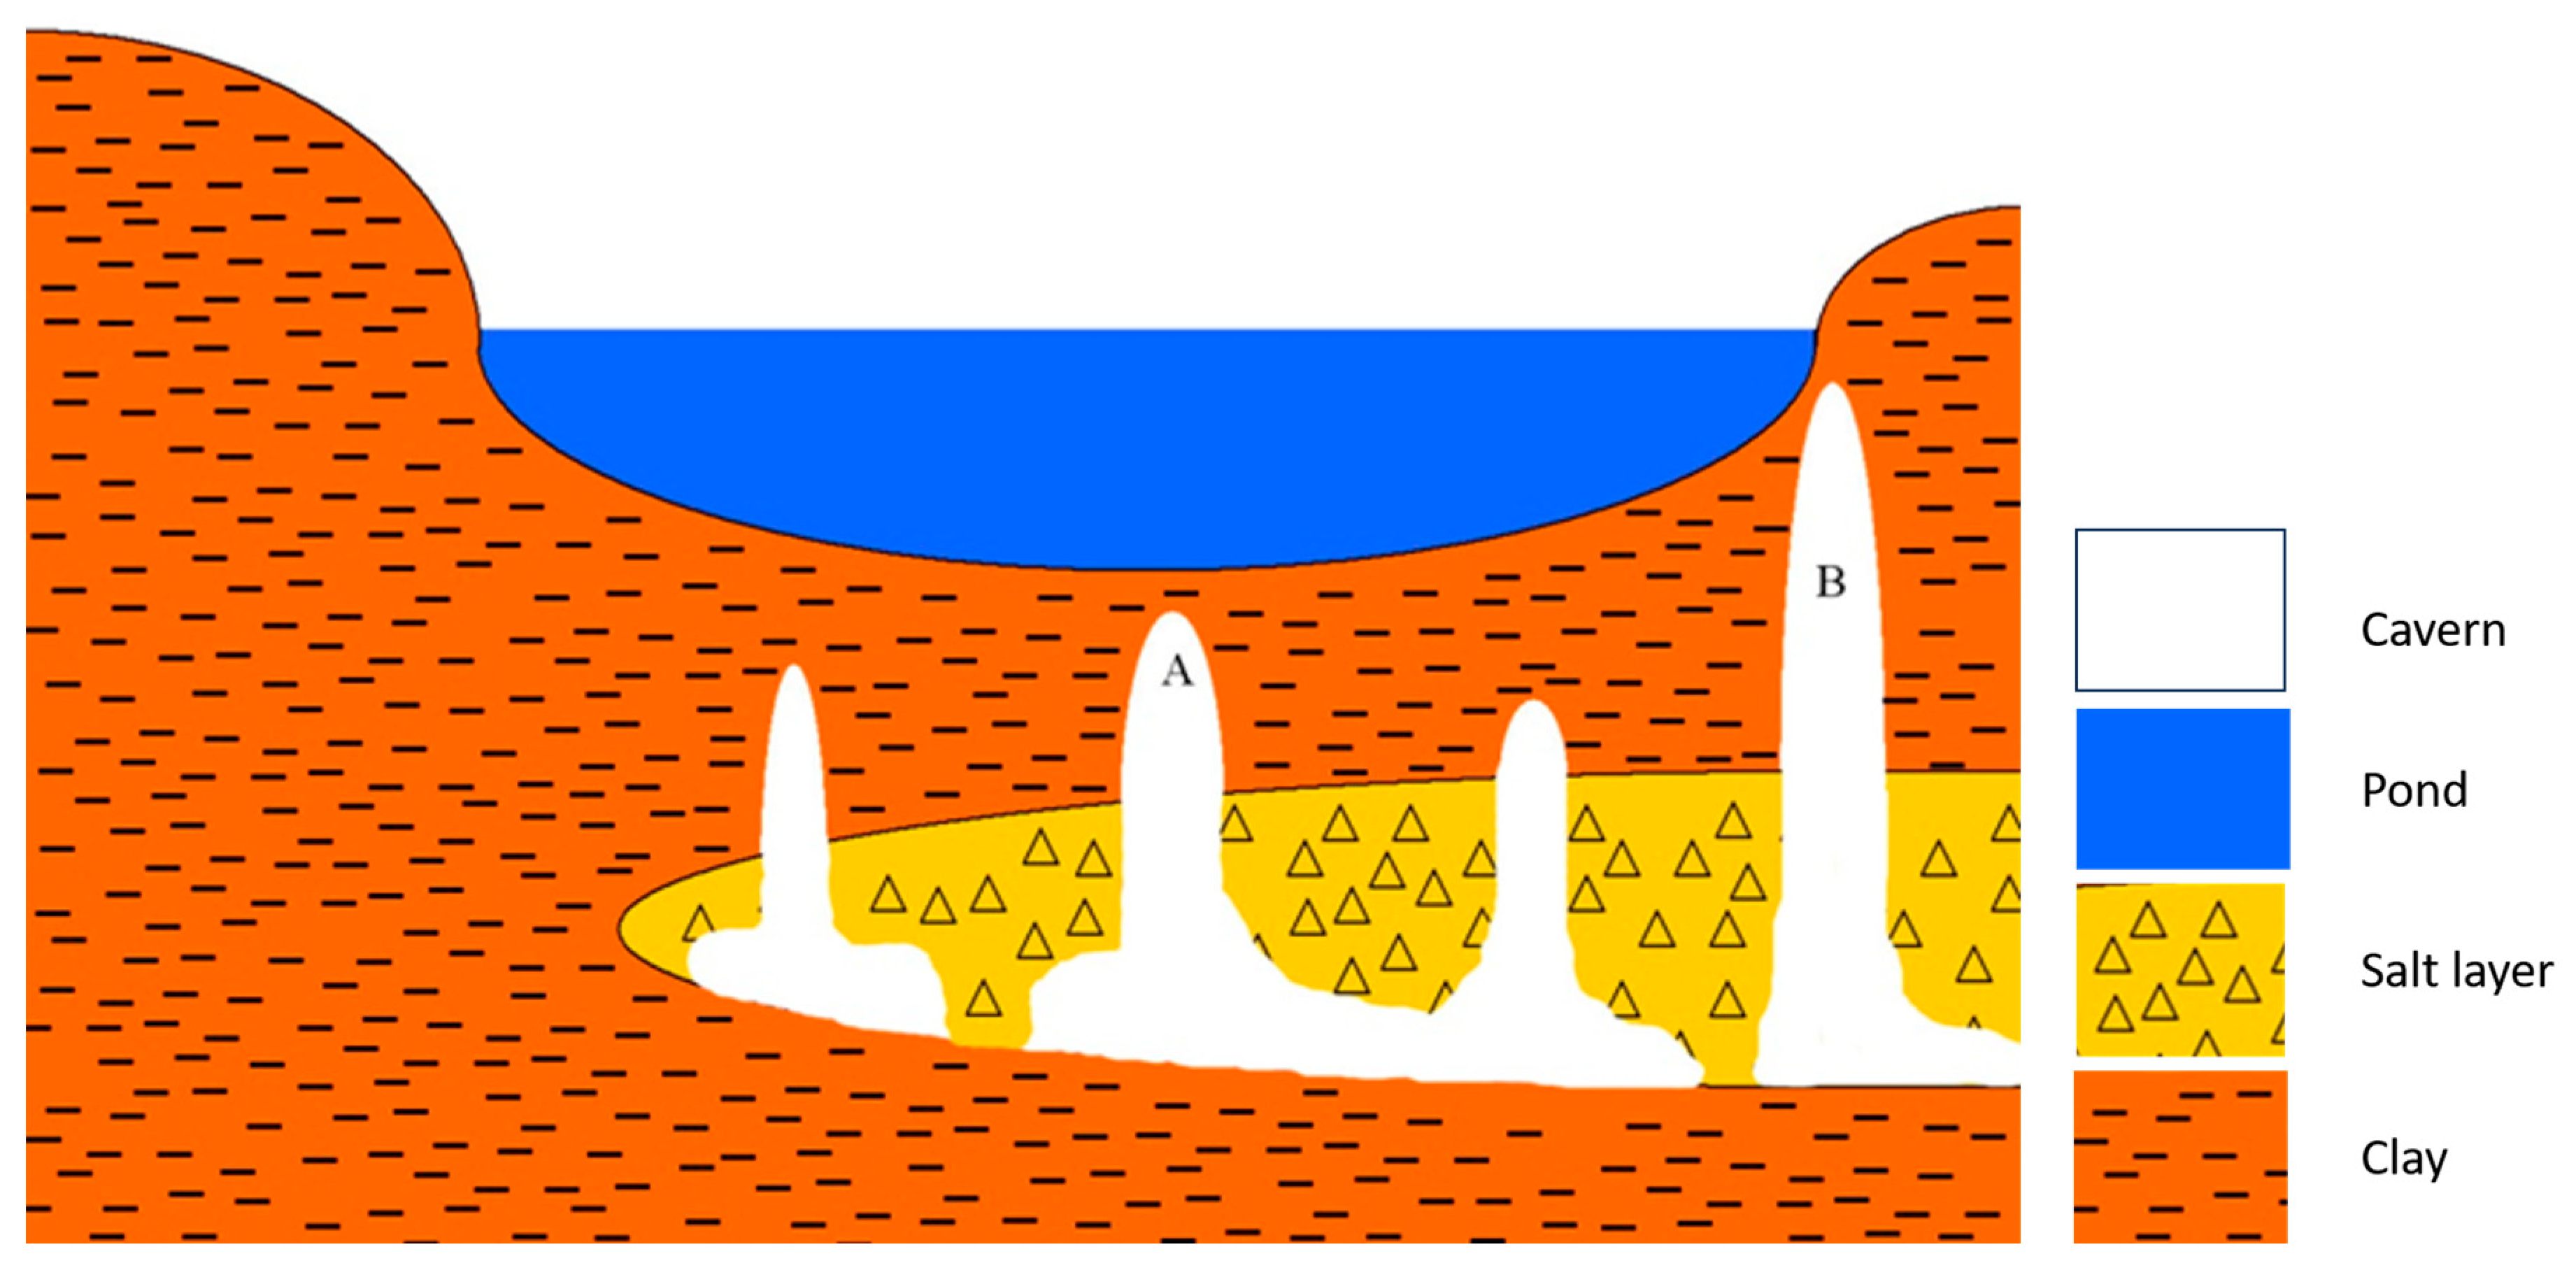
Figure 8.
A suggested cross-section from west (left) to east (right) of the sinkhole cluster and pond. Finger-like cavities grow randomly upwards from the dissolving salt layer below the pond, and when reaching critical conditions, a collapse sinkhole is formed by rupturing the pond’s floor. The location and size of the new sinkhole determine the pattern of drainage. A rupture at the bottom of the pond’s floor (A) increases the chances for a major drainage down to lower levels. Alternatively, a rupture on the side (B) will result in a minor drainage event and a higher final water level in the pond.
The volume of drained water can reach over 30,000 m3 (>14,000 m3 on average), and the outflow flux can reach above 30,000 m3/h (>12,000 m3/h on average) (Figure 8 and Table 1). These large amounts of water are absorbed in the caverns below the sinkhole with no nearby evidence of their outflow. Therefore, the void space inside the caverns below the pond must be at least as large as the volume drained out of the sinkhole’s pond, or the draining system must be able to effectively drain the water far and away from the pond. We, therefore, suggest that the maximal volumes of water drained from the pond provide an order of magnitude estimate for the volume of the caverns below this sinkhole system.
As already discussed, the deformations observed in the vicinity of the pond show that the Shalem-2 sinkhole system is still actively developing. The LiDAR scans show consistent major structural deformations in the southern edge of the pond, suggesting the expansion of the sinkhole system in this direction (Figure 4B). The receding of the area east of the system (Figure 5) may be related to the expansion of the main submerged sinkhole crater or the ongoing collapsing of the pond’s walls. The largest drainage event of 22 October 2009, had to drain through the deepest place in the sinkhole system, which is located in the center of the pond (Figure 4(A4)). This indicates that the main central sinkhole is still active and prone to potential further collapses (Figure 8). The minor subsidence of the area surrounding the sinkhole between August and October 2009 is suggested to have been the result of compaction of the clayey sediment caused by dehydration during the summer (Figure 4(B3)).
6. Conclusions
A long-term record of water level in the Shalem-2 sinkhole cluster pond and repetitive LiDAR surveys, and the calculation of the drainage volumes and fluxes histories from the measured levels, constrain the drainage mechanisms and controls in this sinkhole cluster. We suggest that the drainage events are controlled by the development of sinkholes beneath the pond, and the mechanical failure of an impervious clay layer at its base. The failure hydraulically connects the surface pond water with underground caverns or aquifers. During an event, the hydraulic connection with the underground system may improve or seal. The underground system below the sinkhole absorbs large volumes of water over very short durations, which indicates the existence of large, still active and developing, caverns and draining systems. A similar phenomenon was recorded in the Temarim sinkhole site, located 10 km north of the Shalem-2 site, and was observed in other sites as well. We, therefore, suggest that the mechanisms observed in the Shalem-2 sinkhole reveal the basic mechanisms of sinkhole evolutions at large.
Author Contributions
Conceptualization, A.T., E.S. and Y.M.; methodology, A.S.; software, A.T.; supervision and validation, Y.M.; formal analysis, A.T.; writing—original draft preparation, A.T.; All authors participated in the review and editing of this paper. All authors have read and agreed to the published version of the manuscript.
Funding
This research was sponsored by The Israel Ministry of Tourism, Geological Survey of Israel, and the Strauss Department of Marine Geosciences, Charney School of Marine Sciences, University of Haifa.
Acknowledgments
We thank S. Shalev, Y. Mart, M. Lazar, A. Frumkin, A. Mushkin, D. Tezcan and M. Yarkoni for their advice. Mabat 3D technologies for their guiding. A great gratitude to S. Liper, I. Elhanaty, D. Harari, I. Swaed, R. Gabay, H. Lutzky, O. Piatibratov.
Conflicts of Interest
The authors declare no conflict of interest. The funders had no role in the design of the study; in the collection, analyses, or interpretation of data; in the writing of the manuscript; or in the decision to publish the results.
References
- Martinez, J.D.; Johnson, K.S.; Neal, J.T. Sinkholes in Evaporite Rocks: Surface Subsidence Can Develop within a Matter of Days When Highly Soluble Rocks Dissolve Because of Either Natural or Human Causes. Am. Sci. 1998, 86, 38–51. [Google Scholar] [CrossRef]
- Gutiérrez, F.; Cooper, A.H. Evaporite Dissolution Subsidence in the Historical City of Calatayud, Spain: Damage Appraisal and Prevention. Nat. Hazards 2002, 25, 259–288. [Google Scholar] [CrossRef]
- Waltham, T.; Bell, F.G.; Culshaw, M.G.; Knez, M.; Slabe, T. Sinkholes and Subsidence: Karst and Cavernous Rocks in Engineering and Construction; Springer: Berlin/Heidelberg, Germany, 2005; Volume 382. [Google Scholar]
- Shalev, E.; Lyakhovsky, V. Viscoelastic Damage Modeling of Sinkhole Formation. J. Struct. Geol. 2012, 42, 163–170. [Google Scholar] [CrossRef]
- Abelson, M.; Yechieli, Y.; Crouvi, O.; Baer, G.; Wachs, D.; Bein, A.; Shtivelman, V. Evolution of the Dead Sea Sinkholes. In New Frontiers in Dead Sea Paleoenvironmental Research; Enzel, Y., Agnon, A., Stein, M., Eds.; Geological Society of America: Boulder, CO, USA, 2006; Volume 401, ISBN 9780813724010. [Google Scholar]
- Abou Karaki, N.; Fiaschi, S.; Paenen, K.; Al-Awabdeh, M.; Closson, D. Exposure of Tourism Development to Salt Karst Hazards along the Jordanian Dead Sea Shore. Hydrol. Earth Syst. Sci. 2019, 23, 2111–2127. [Google Scholar] [CrossRef]
- Sevil, J.; Gutiérrez, F. Morphometry and Evolution of Sinkholes on the Western Shore of the Dead Sea. Implications for Susceptibility Assessment. Geomorphology 2023, 434, 108732. [Google Scholar] [CrossRef]
- Baer, G.; Schattner, U.; Wachs, D.; Sandwell, D.; Wdowinski, S.; Frydman, S. The Lowest Place on Earth Is Subsiding—An InSAR (Interferometric Synthetic Aperture Radar) Perspective. GSA Bull. 2002, 114, 12–23. [Google Scholar] [CrossRef]
- Closson, D.; Abou Karaki, N. Human-Induced Geological Hazards along the Dead Sea Coast. Environ. Geol. 2009, 58, 371–380. [Google Scholar] [CrossRef]
- Yechieli, Y.; Abelson, M.; Baer, G. Sinkhole Formation and Subsidence along the Dead Sea Coast, Israel. Hydrogeol. J. 2016, 24, 601–612. [Google Scholar] [CrossRef]
- Nof, R.N.; Abelson, M.; Raz, E.; Magen, Y.; Atzori, S.; Salvi, S.; Baer, G. SAR Interferometry for Sinkhole Early Warning and Susceptibility Assessment along the Dead Sea, Israel. Remote Sens. 2019, 11, 89. [Google Scholar] [CrossRef]
- Al-Halbouni, D.; Watson, R.A.; Holohan, E.P.; Meyer, R.; Polom, U.; Dos Santos, F.M.; Comas, X.; Alrshdan, H.; Krawczyk, C.M.; Dahm, T. Dynamics of Hydrological and Geomorphological Processes in Evaporite Karst at the Eastern Dead Sea—A Multidisciplinary Study. Hydrol. Earth Syst. Sci. 2021, 25, 3351–3395. [Google Scholar] [CrossRef]
- Al-Halbouni, D.; Holohan, E.P.; Saberi, L.; Alrshdan, H.; Sawarieh, A.; Closson, D.; Walter, T.R.; Dahm, T. Sinkholes, Subsidence and Subrosion on the Eastern Shore of the Dead Sea as Revealed by a Close-Range Photogrammetric Survey. Geomorphology 2017, 285, 305–324. [Google Scholar] [CrossRef]
- Baer, G.; Magen, Y.; Nof, R.N.; Raz, E.; Lyakhovsky, V.; Shalev, E. InSAR Measurements and Viscoelastic Modeling of Sinkhole Precursory Subsidence: Implications for Sinkhole Formation, Early Warning, and Sediment Properties. J. Geophys. Res. Earth Surf. 2018, 123, 678–693. [Google Scholar] [CrossRef]
- Gertman, I.; Hecht, A. The Dead Sea Hydrography from 1992 to 2000. J. Mar. Syst. 2002, 35, 169–181. [Google Scholar] [CrossRef]
- Yechieli, Y.; Abelson, M.; Bein, A.; Crouvi, O.; Shtivelman, V. Sinkhole “Swarms” along the Dead Sea Coast: Reflection of Disturbance of Lake and Adjacent Groundwater Systems. GSA Bull. 2006, 118, 1075–1087. [Google Scholar] [CrossRef]
- Frumkin, A.; Ezersky, M.; Al-Zoubi, A.; Akkawi, E.; Abueladas, A.-R. The Dead Sea Sinkhole Hazard: Geophysical Assessment of Salt Dissolution and Collapse. Geomorphology 2011, 134, 102–117. [Google Scholar] [CrossRef]
- Gutiérrez, F.; Guerrero, J.; Lucha, P. A Genetic Classification of Sinkholes Illustrated from Evaporite Paleokarst Exposures in Spain. Environ. Geol. 2008, 53, 993–1006. [Google Scholar] [CrossRef]
- Shalev, E.; Lyakhovsky, V.; Yechieli, Y. Salt Dissolution and Sinkhole Formation along the Dead Sea Shore. J. Geophys. Res. Solid Earth 2006, 111. [Google Scholar] [CrossRef]
- Sagy, A.; Reches, Z.; Agnon, A. Hierarchic Three-Dimensional Structure and Slip Partitioning in the Western Dead Sea Pull-Apart. Tectonics 2003, 22. [Google Scholar] [CrossRef]
- Watson, R.A.; Holohan, E.P.; Al-Halbouni, D.; Saberi, L.; Sawarieh, A.; Closson, D.; Alrshdan, H.; Abou Karaki, N.; Siebert, C.; Walter, T.R.; et al. Sinkholes and Uvalas in Evaporite Karst: Spatio-Temporal Development with Links to Base-Level Fall on the Eastern Shore of the Dead Sea. Solid Earth 2019, 10, 1451–1468. [Google Scholar] [CrossRef]
- Salvati, R.; Sasowsky, I.D. Development of Collapse Sinkholes in Areas of Groundwater Discharge. J. Hydrol. 2002, 264, 1–11. [Google Scholar] [CrossRef]
- Tuccimei, P.; Salvati, R.; Capelli, G.; Delitala, M.C.; Primavera, P. Groundwater Fluxes into a Submerged Sinkhole Area, Central Italy, Using Radon and Water Chemistry. Appl. Geochem. 2005, 20, 1831–1847. [Google Scholar] [CrossRef]
- Yakar, M. Using close range photogrammetry to measure the position of inaccessible geological features. Exp. Tech. 2011, 35, 54–59. [Google Scholar] [CrossRef]
- Canaz Sevgen, S. Airborne Lidar Data Classification in Complex Urban Area Using Random Forest: A Case Study of Bergama, Turkey. Int. J. Eng. Geosci. 2019, 4, 45–51. [Google Scholar] [CrossRef]
- Sanchez Diaz, B.; Mata-Zayas, E.E.; Gama-Campillo, L.M.; Rincon-Ramirez, J.A.; Vidal-Garcia, F.; Rullan-Silva, C.D.; Sanchez-Gutierrez, F. LiDAR Modeling to Determine the Height of Shade Canopy Tree in Cocoa Agrosystems as Available Habitat for Wildlife. Int. J. Eng. Geosci. 2022, 7, 283–293. [Google Scholar] [CrossRef]
- Cetin, Z.; Yastikli, N. Automatic Detection of Single Street Trees from Airborne LiDAR Data Based on Point Segmentation Methods. Int. J. Eng. Geosci. 2022, 8, 129–137. [Google Scholar] [CrossRef]
Disclaimer/Publisher’s Note: The statements, opinions and data contained in all publications are solely those of the individual author(s) and contributor(s) and not of MDPI and/or the editor(s). MDPI and/or the editor(s) disclaim responsibility for any injury to people or property resulting from any ideas, methods, instructions or products referred to in the content. |
© 2023 by the authors. Licensee MDPI, Basel, Switzerland. This article is an open access article distributed under the terms and conditions of the Creative Commons Attribution (CC BY) license (https://creativecommons.org/licenses/by/4.0/).