Article

Geomorphological Response of Alluvial Streams to Flood Events during Base-Level Lowering: Insights from Drone-Based Photogrammetric Surveys in Dead Sea Tributaries

by
Liran Ben Moshe
1,* and
Nadav G. Lensky
1,2
1
Geological Survey of Israel, Yesha’yahu Leibowitz 32, Jerusalem 9692100, Israel
2
The Fredy and Nadine Herrmann Institute of Earth Sciences, Edmond J. Safra Campus, The Hebrew University of Jerusalem, Givat Ram, Jerusalem 9190401, Israel
*
Author to whom correspondence should be addressed.
Remote Sens. 2024, 16(8), 1346; https://doi.org/10.3390/rs16081346
Submission received: 12 February 2024 / Revised: 21 March 2024 / Accepted: 29 March 2024 / Published: 11 April 2024
(This article belongs to the Special Issue Remote Sensing of the Dead Sea Region)

Abstract

:
The geomorphological impact of base-level lowering on ephemeral alluvial streams has been extensively investigated through fieldwork, experimentation, and modeling. Yet, the understanding of hydrological parameters governing the dynamics of the stream’s geometry during discrete flood events is lacking due to limited direct measurements of flood-scale erosion/deposition. The emergence of novel remote sensing methods allows for quantifying morphological modifications caused by floods in alluvial streams. This study utilizes drone surveys and hydrological data to quantitatively investigate the relation between channel evolution in alluvial tributaries draining to the receding Dead Sea and the hydrological characteristics of flash floods. Drone-based photogrammetric surveys were conducted before and after 25 floods, over a period of four years, to generate centimeter-scale Digital Elevation Models (DEM) and orthophoto maps of two major streams. The outcomes of these DEMs are maps of ground elevation changes (erosion/deposition), thalweg longitudinal profiles, and channel cross sections, revealing the incision/aggradation along and across the streams. Statistical comparison of results with flow hydrographs identified potential relations linking the hydrological characteristics of each flood and the corresponding geomorphological modifications. Peak discharge emerged as the primary factor influencing sediment removal, leading to more efficient sediment evacuation and a negative sediment budget with increased discharge. Water volumes of floods also exhibited a secondary effect on the sediment budget. The chronological order of floods, whether first or later in the season, was identified as the primary factor determining incision magnitude. Knickpoints formed at the streams’ outlets during the dry period, when lake-level drops, amplifying the impact of the first flood. These findings have potential implications for infrastructure planning and environmental management in the context of climate change and altered water runoff. The research highlights the efficiency of drone-based photogrammetry for cost-effective and timely data collection, providing invaluable flexibility for field research.

Graphical Abstract

1. Introduction

Over the past few decades, a significant proportion of the world’s largest lakes have experienced alarming volume loss which is an expression of reducing inflows compared to evaporation [1]. This trend is a major concern due to the potential for negative impacts on the environment, infrastructure and human populations. The water volume decrease is associated with: (i) increased water consumption in the lakes’ drainage basins [2,3,4,5]; (ii) climate-related changes, including elevated evapotranspiration rates and reduced water run-off [6,7,8,9,10], and (iii) combinations of the abovementioned factors [11,12,13,14].
The reduction in lake volumes results in a drop in the elevation of their water surfaces, which serve as the base level for the surrounding tributaries. Concurrently, shore regression leads to the exposure of former lake floor to various sub-aerial geomorphological processes such as erosion and sediment deposition [15]. These modifications can potentially activate fluvial mechanisms that propagate upstream through the drainage basin, originating from the outflows of the tributaries [16,17,18,19]. Notably, incision and deposition can be extremely fast near the outlets of alluvial streams, due to the easily entrained nature of their banks and bed [20]. This presents novel challenges to infrastructure planning, as previously relatively stable fluvial systems now confront rapid morphological alterations such as channel deepening and widening, and planform modifications.
The geomorphological impacts of lake or sea level lowering on alluvial tributaries flowing into these water bodies have been extensively investigated through a combination of fieldwork, experimentation, and modeling frameworks, employing a diverse array of empirical and physical methodologies [18,19,21,22,23,24,25,26,27,28,29,30,31]. Nonetheless, it is noteworthy that the temporal scope of the field-based studies spans from decades to millennia. Furthermore, the applicability of flume-based studies in comprehending the responses of natural river systems to discrete events is constrained due to the inherent scaling down and simplification involved in such experiments [32,33]. Consequently, our understanding of the pace of erosion and deposition, associated with base-level lowering along with the hydrological governing parameters, remains deficient, particularly in the context of annual or discrete flood-event timeframes. Although hydrological data for discrete flood events are routinely obtained through various hydrometric disciplines, direct measurements of bedload inflow and outflow in ephemeral alluvial streams are limited and challenging to obtain [34]. The emergence of novel and cost-effective remote sensing methods provides opportunities for measuring sediment budgets and consistently quantify morphological modifications in alluvial streams caused by floods. As a result, approaching the issue of discrete flood events no longer requires down-scaling and can be accomplished at the actual field scale, as demonstrated in the research presented here.
This study addresses the identified knowledge gap through the utilization of drone surveys and hydrological data. Its objective is to quantitatively investigate the relationship between discrete flash flood events and sediment budgets, as well as rates of erosion/deposition in ephemeral alluvial tributaries undergoing base-level lowering. The research employed frequent drone-based photogrammetric surveys, resulting in a highly detailed database with exceptional resolution. This dataset facilitated statistical analyses to establish connections between peak flood discharge, total water volume, timing of the event, and resulting geomorphological modifications in the streams. While the primary focus was on tributaries draining into the receding Dead Sea, the findings presented here hold relevance for various coastal environments, both in scenarios of decreasing base level and climatically induced modifications.

1.1. Steady Equilibrium of an Alluvial Stream

The morphology of alluvial streams, commonly known as transport-limited streams, is predominantly shaped by the energy of the flowing water, given that the available sediment exceeds the stream’s capacity for efficient transport. In scenarios where the drainage basin of such a stream experience tectonic and climatic stability over a considerable period, the stream can reach a state of equilibrium. Within such streams, the volume of bedload supplied by the upstream reaches matches the volume delivered downstream to the base level (Figure 1A), resulting in a lack of net sediment deposition or incision, except for lateral sediment displacement [35]. Commonly, the complexity of natural drainage systems prevents achieving static equilibrium [36,37], and alluvial streams attain steady equilibrium that enable the geomorphological system to overcome temporal deviations through a mechanism of negative or positive feedbacks [36]. This behavior is particularly pronounced in ephemeral streams, where significant variations exist among discrete flood events in the hydrological parameters outlined below.
The capability of a stream to transport bedload arises from conversion of the water’s potential energy into kinetic energy [38]. This conversion is manifested by the stream power exerting on the bottom and sides of the stream channel [39]; the stream power is dependent on hydrological parameters such as the mass density of water, water discharge, and the energy gradient of the water [40]. Furthermore, the rate of bed load transportation, coupled with the stream’s capacity to detach pebbles from the channel boundaries, relies on other sedimentological and geomorphological parameters [41]. These parameters include factors such as grain size and mass density, the cohesive properties and roughness of the channel bed and banks, and channel width [22,39,42,43,44]. The relation between the stream ability to transport bedload at various points along the channel bed and the above-mentioned parameters is expressed in Equation (1) (assuming that the quantity of available bedload is not constraining) [45]:
qs = KS
where qs is sediment flux (sediment discharge per unit width of the channel) at a given point along the channel, K is a coefficient dependent on the hydrological, sedimentological and geomorphological attributes except of the energy gradient of the water, and S is that gradient in the downstream direction.
In a state of steady equilibrium, an alluvial stream exhibits a distinct sediment discharge arriving from the drainage basin upstream, along with typical values for channel width and the K coefficient. Consequently, it establishes a characteristic energy gradient that mirrors the prolonged behavior of the stream, rather than transient values associated with individual flood events [37]. The energy gradient closely approximates the channel bed gradient [43]. Hence, any modification imposed to this slope, while keeping the other variables in Equation (1) unchanged, will inevitably deviate the stream away from equilibrium, prompting a geomorphological response to restore the original slope [22,29,46].

1.2. Lake Level Lowering and Its Geomorphological Implication for Alluvial Tributaries
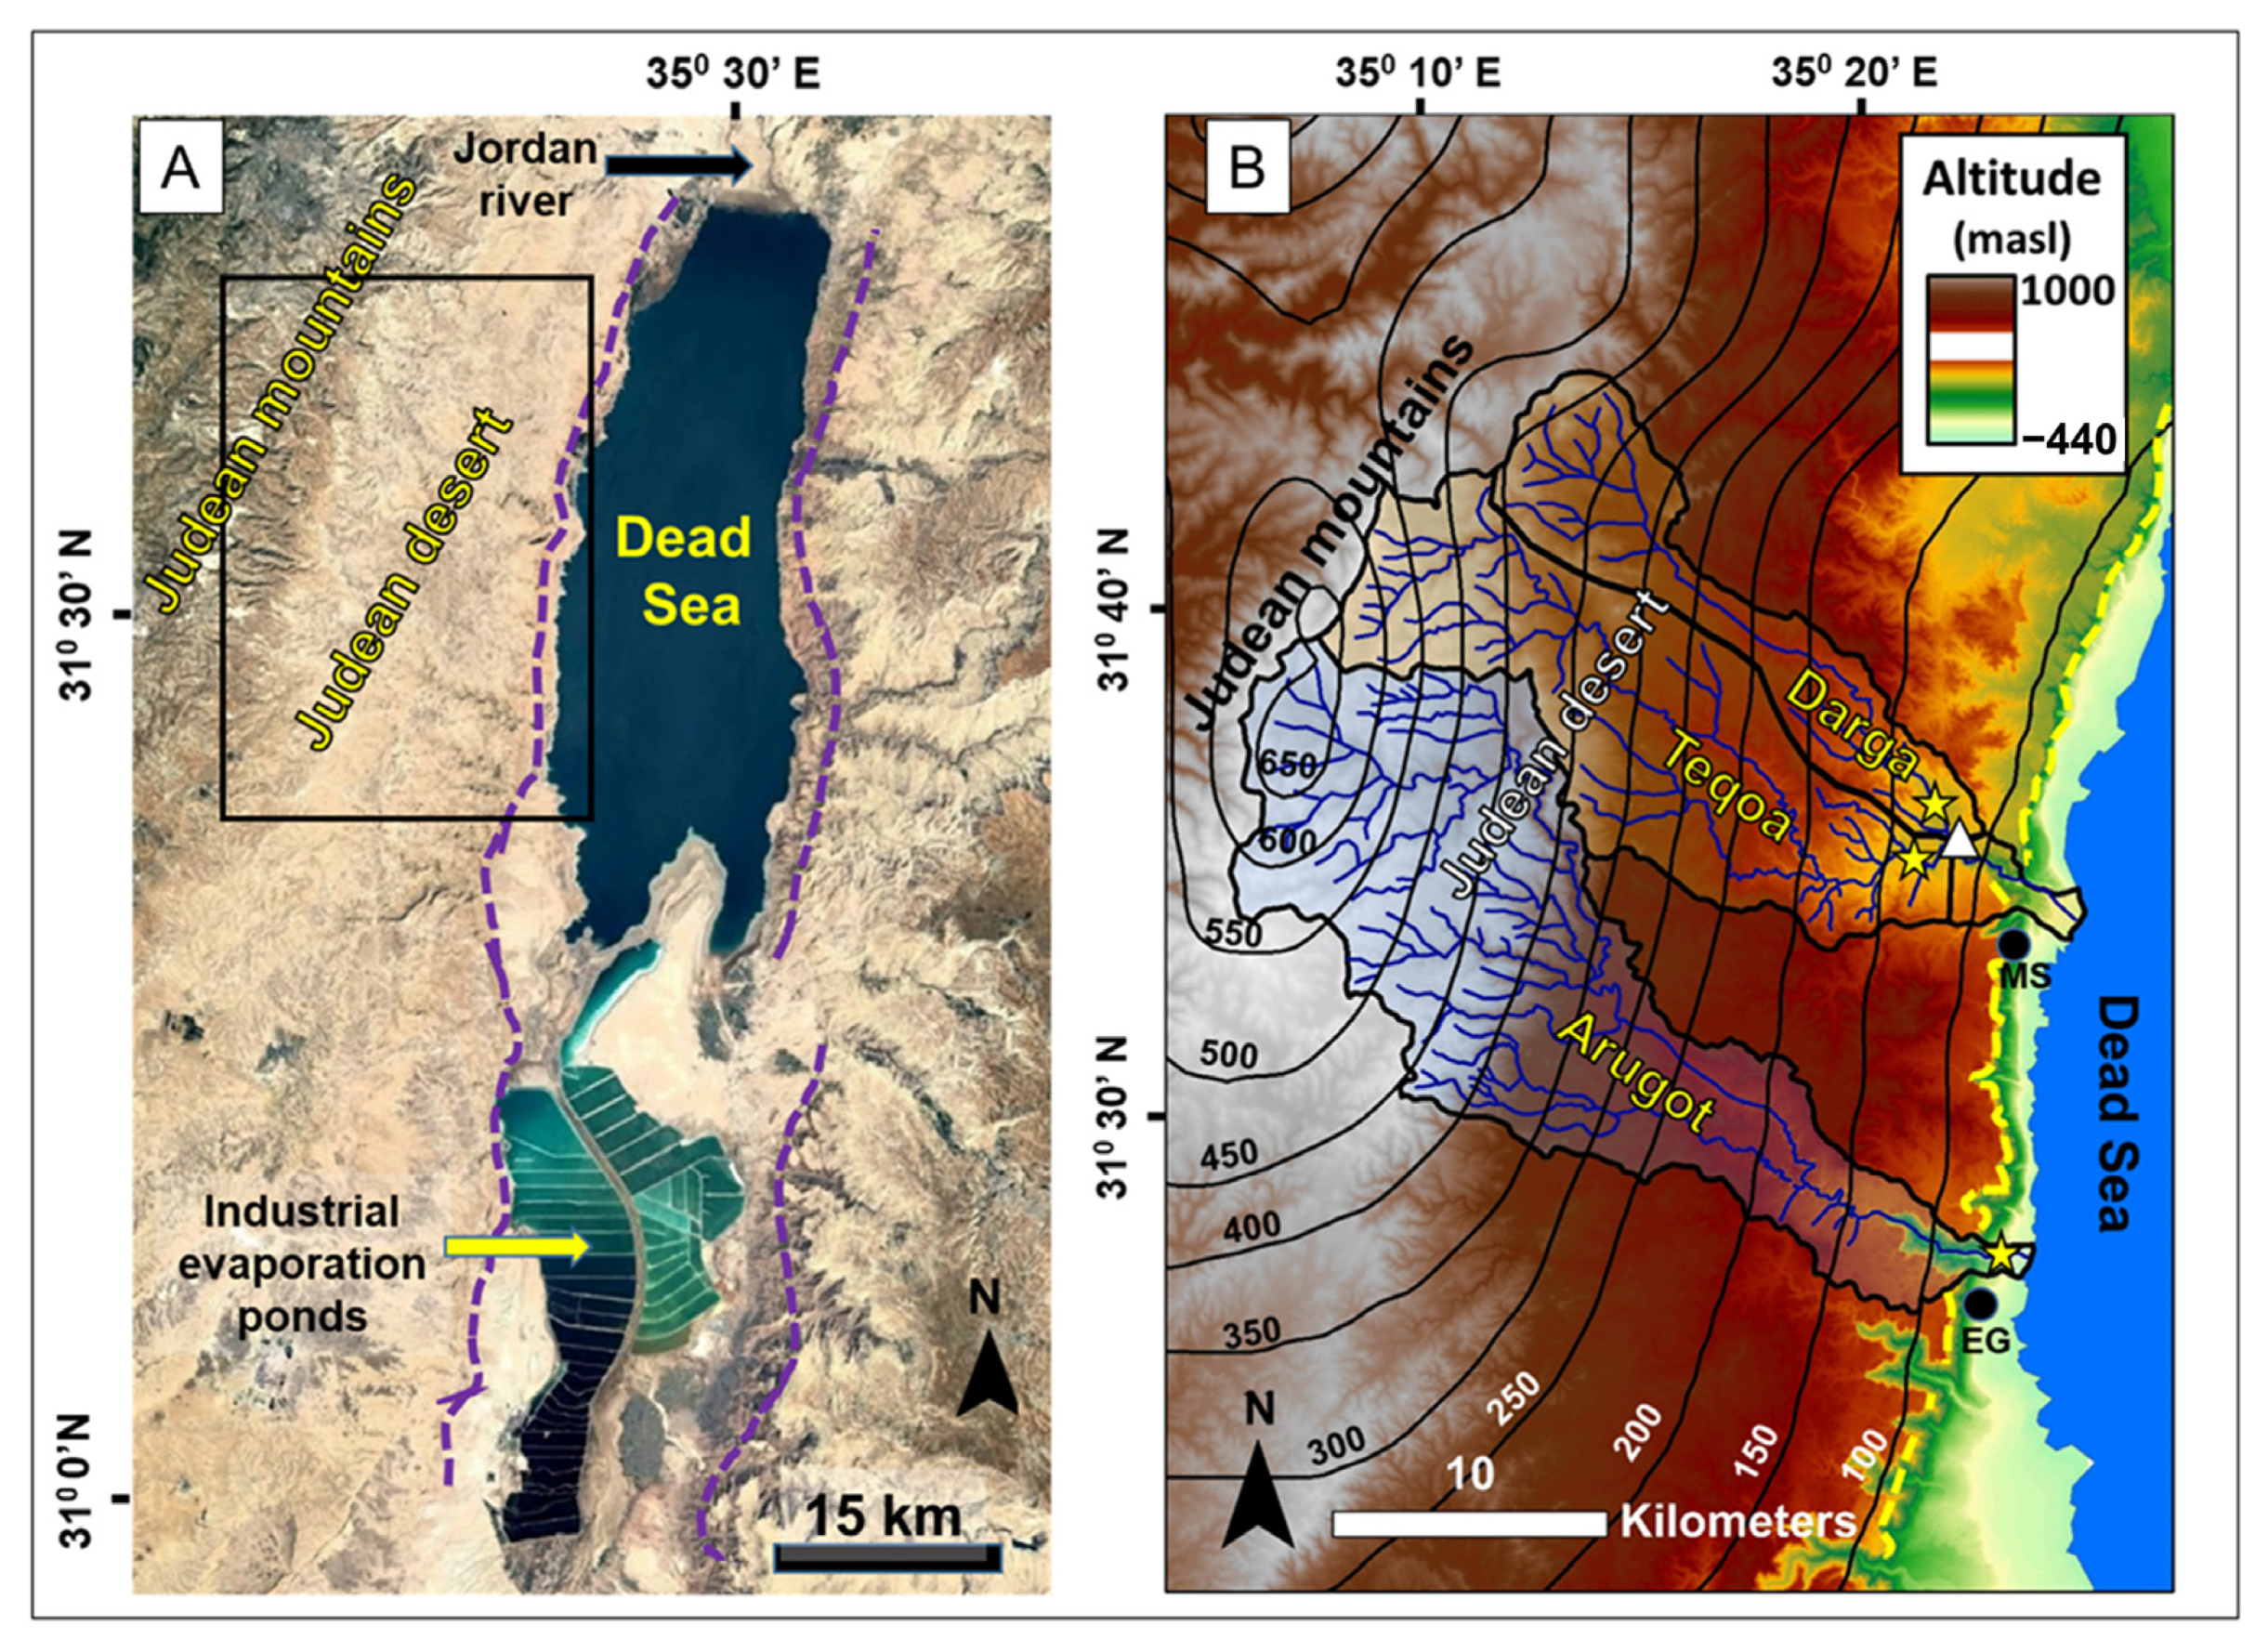
As a stream emerges from the confined walls of a canyon to a coastal expanse near a lake, it often forms a fan-shaped delta upon entering the water body, referred to as a fan delta [47]. Within this fan delta, a portion of the sediment carried by the stream is deposited in the subaerial domain, while the remaining sediment is transported to the lake, contributing to the progradation of the fan delta toward the basin [48]. This progradation involves the accumulation of steep foresets in the distal part of the fan delta (Figure 1B). The gradient of the channel bed atop the subaerial fan delta is influenced by the steady-state slope of this braided alluvial stream [49,50]. However, the gradient of the submerged fan delta front is determined by a steeper angle of repose of the unconsolidated alluvial material [51]. In scenarios of lake level lowering, if the rate of shoreline regression exceeds the progradation of the fan delta, the steep front becomes exposed subaerially basinward of the former stream outlet. This process leads to the formation of a convex longitudinal profile in the stream, marked by a knickpoint at the inflection point (Figure 1C).
In instances of forced regression, modifications are limited to increase in the stream bed gradient exclusively, without affecting other hydro-geomorphological parameters. Within these scenarios, the increased shear stress at the knickpoint can trigger incision, coupled with the upstream migration of the knickpoint and the rotation of the face below it (Figure 1D) [22,25,36,52]. Occasionally, this process may result in bank collapse and widening the channel [20], as well as an increase in sinuosity [17,31]. These changes, when combined with the incision process, contribute to a negative sediment budget within the modified segment of the stream. The rotation of the knickpoint results in a reduction of the channel bed gradient, leading to a decrease in local sediment transport capacity. Both incision and knickpoint retreat rates exhibit exponential decay with respect to time and distance from the lowered base level [43]. Therefore, incision rate in the downstream domain of the stream will be higher than upstream. Potentially, incision terminates when, at any specific point along the channel, the sediment transport capacity no longer exceeds the influx of sediment from upstream. Conversely, when base-level lowering continues and coincides with the addition of downstream steep segments (Figure 1E), the gradient and convexity of the longitudinal profile may increase over time, resulting in further deviation of the longitudinal profile from steady equilibrium, continuous incision and overall negative sediment budget (Figure 1F).
Figure 1. Incision of alluvial stream resulting from continuous forced regression. (A) The stream flows atop a fan delta in a state of steady equilibrium, where sediment flux (qs) from upstream equals sediment flux transported downstream. (B) Deposition and fan delta progradation occur during slow forced regression. (C) Knickpoint formation occurs due to subaerial exposure of the steep fan delta front during rapid forced regression. Sediment flux downstream of the knickpoint exceeds sediment flux arriving at it. Red and yellow dashed lines represent the current longitudinal profile and the new steady equilibrium profile, respectively. (D) Incision occurs, accompanied by upstream migration of the knickpoint and a reduction in gradient below it. (E) Additional rapid regression leads to the formation of a new knickpoint at the stream outlet, coupled by ongoing incision upstream. The stream profile increasingly deviates from a state of steady equilibrium as a new equilibrium profile emerges (depicted by the white dashed line), while the stream has not yet attained the equilibrium profile that formed after the previous regression (indicated by the yellow dashed line). (F) Over time, the stream further deviates from steady equilibrium, with the longitudinal profile gradually becoming more convex. This encourages incision and bank collapse throughout the entirety of the streambed, typically leading to an overall negative sediment balance.
Remotesensing 16 01346 g001

1.3. The Study Area

The Dead Sea, situated in the lowest part of the Dead Sea basin, is an elongated terminal lake. Its current shoreline (2024), at an elevation of approximately 438 m below sea level (mbsl), stands as the Earth’s lowest contemporary terrestrial elevation [53]. Enclosed by tectonic escarpments from the west and east, the lake is primarily nourished by the Jordan River from the north (Figure 2A) and numerous smaller tributaries that carve canyons through the escarpments. The drainage basins on of the tributaries west of the lake, where this study took place, exhibit diversity both in terms of their spatial extent (from several km2 to 290 km2) and the climate zones that they occupy (Mediterranean to arid, Figure 2B). A wide alluvial expanse, stretching up to several kilometers in width, extends between the western escarpment and the lakeshore, featuring fan deltas at the outlets of the tributaries [54,55].
Since the mid-20th century, extensive water diversion from the Dead Sea drainage basin has led to a decline in the lake level of over 35 m (Figure 3) [3]. While natural fluctuations in lake levels have occurred throughout the Holocene due to climatic shifts [56,57], the contemporary rate of decline (currently 1.2 m/y) is notably unprecedented. Consequently, the fast shore regression exposed the steep fronts of many fan deltas sub-aerially [19,58]. The exposed steep topography, combined with wave abrasion that created wave-cut steps and sub-vertical faces [53], has led to the formation of knickpoints at the outlets of streams. These streams have incised canyon-like channels into the alluvial surface [29]. This incision, accompanied by subsequent widening of the channels, occurs during flash floods, primarily between October and May. Since the base-level decline is continuous, the streams do not reach a new steady equilibrium, but rather deviate from it over time. Consequently, the streams are presently characterized by the incision of the stream bed and the widening of channels, which lead to downstream sediment evacuation and an overall negative sediment budget.
Given that the current decline in the lake level is not associated with hydroclimatic changes in the Dead Sea watershed [4], the recently formed canyons provide a unique opportunity to explore the hydrological factors affecting the rates of geomorphological modification in alluvial channels experiencing continuous base-level lowering. The incision process itself stems solely from the decrease in lake level [20,29], which has remained relatively consistent over the past decade (Figure 3). However, the rates at which these modifications occur are distinct for each stream and vary with discrete flood events. This study focuses on two ephemeral streams, Nahal Darga and Nahal Arugot (referred to as ‘Darga’ and ‘Arugot’ streams, respectively). These streams were selected due to the presence of hydrometric gauging stations, which provided access to detailed hydrographs; their deep incised channels within the alluvial domain of their course and their tendency to experience more frequent flood events compared to most other tributaries of the Dead Sea. Both streams originate in the Judean Mountains and desert, draining into the Dead Sea (Figure 2B). With lengths of 43 km and 46 km, respectively, Darga and Arugot streams each drain an area of 230 km2. However, differences in precipitation levels within their drainage basins result in distinct average annual rainfall volumes. Specifically, the average precipitation in the Darga basin is 320 mm/y, while in the Arugot basin it is 435 mm/y. The streams have been incising close to their outlets since the 1970s, with both channels reaching now a maximum incision depth of approximately 30 m. The widths of the new channels are 120 m and 90 m for Darga and Arugot streams, respectively; the active channels are narrower, given the presence of remnant terraces along the channel banks (Figure 4, Figure 5, Figure 6 and Figure 7). In the past decade, the average gradients of the incising channels have been approximately 5% for Darga and 2.3% for Arugot. The Dead Sea highway crosses the streams several hundred meters upstream of their outlets, and concrete ramps have been constructed in both channels downstream of the highway to protect it from incision (Figure 4, Figure 5, Figure 6 and Figure 7). These ramps serve as a stable, local base level for the channel upstream. Consequently, the channel segments downstream of the ramps undergo incision and widening due to the lake level drop, while the segments upstream of the ramps remain unaffected by changes in the lake level. Therefore, the study area constitute solely of the natural channel segments downstream from the artificial ramps in both channels (Figure 5 and Figure 7).

2. Materials and Methods

The methodology employed in this study incorporated drone-based surveying, photogrammetric analysis, the extraction and quantification of geomorphological modifications between surveys, and the amalgamation of these results with flood hydrological data to conduct a comprehensive statistical analysis. A visual representation of this workflow is presented in Figure 8.

2.1. Surveying

The study specifically concentrated on the incising sections of the alluvial stream channels of Darga and Arugot, extending from the artificial ramps described above to the Dead Sea shoreline. These segments measure approximately 450 m and 250 m for Darga and Arugot, respectively. Over a four-year period from 2019 to 2023, drone-based photogrammetric surveys were systematically conducted following most flood events. Additionally, a baseline photogrammetric survey was conducted at the commencement of the research in October 2019.
Two types of drones were employed throughout the study period: the DJI Phantom 4 from October 2019 to March 2021, and later, the DJI Phantom 4 RTK. During the surveys, nadir photos with a 75% overlap were captured, maintaining a flight altitude of 40 m above ground at the take-off spot. To ensure accurate geo-referencing for the non-RTK Phantom 4 surveys, 15 ground control points (GCP) were established, and their locations were determined through ground RTK GPS measurements. However, due to time constraints, GCPs were not placed in all surveys. Instead, the post-processing workflow described by Cook and Dietze [59] was employed for geo-referencing, demonstrating exceptional accuracy, comparable to the precision achieved through direct GCP referencing. During the Phantom 4 RTK surveys, a base station connected to a custom network RTK server was utilized.
Construction of DEMs and orthophotos from the acquired photos was carried out using Agisoft Photoscan Professional software v.1.6.4. Photo alignment involved key and tie point limits set at 40,000 and 4000, respectively. Tie points with a reconstruction uncertainty exceeding the value of 30 were removed, and the alignment was optimized using the nine fit parameters calibrated through the Agisoft lens calibration procedure. Employing medium quality and moderate depth filtering, dense point clouds were generated. The resulting DEMs had a resolution of 5–8 cm, while the orthophotos had a resolution of 1.5–2 cm per pixel. Accuracies of 2–5 cm for locations and 2.5–5 cm for altitudes were achieved. In instances of a constant vertical discrepancy between two subsequent DEMs, the altitude difference was determined in areas where no altitude differences were expected between the surveys, and this value was effectively used to correct the discrepancy.

2.2. Calculation of the Geomorphological Responses

To quantify the geomorphological impact of flood events, two parameters were utilized: the sediment budget between the banks, representing the amount of sediment deposited or evacuated between the banks, and the average elevation change along the thalweg, indicating the magnitude of incision or aggradation. The calculations were executed using ArcMap software v.10.8.2. For the sediment budget, elevations in two consecutive Digital Elevation Models (DEMs) were subtracted on a pixel-by-pixel basis to determine the elevation change. This change was then multiplied by the pixel area, and the results were summed across the entire studied channel segment to obtain the overall volume change, constituting the sediment budget. Thalweg locations were mapped using the ArcMap software v.10.8.2 hydrology toolset. Longitudinal profiles were extracted and projected onto a common line to minimize the influence of sinuosity changes (refer to the location of the projection lines in Figure 5 and Figure 7). Altitudes of points, spaced at 1 m intervals along the projected profile, were then calculated. The elevation change at each point between consecutive surveys was determined, and the results were averaged to quantify the magnitude of incision or aggradation.

2.3. Hydrological Record

The study assessed the impact of three hydrological and temporal parameters on geomorphological responses: (1) peak water discharge during the flood, (2) total water volume transported during the event, and (3) the relative timing of the event in the flood season (first flood or later). In instances where multiple floods occurred between successive surveys, these floods were treated as a single event with multiple waves. Specifically, the highest discharge value within these floods and the cumulative water volume across the events were used to represent the overall flood characteristics between the surveys.
The flood hydrographs utilized for the study were recorded by the Hydrological Survey of Israel. The data utilized for the Darga stream were collected from two gauging stations located along its primary tributaries (referred to as Darga tributary and Teqoa tributary), which converge 6 km upstream from the study area to form the main Darga stream (see Figure 2B). The first gauging station, located on the Darga tributary, is situated 1.5 km upstream from the convergence point and covers a drainage area of 75 km2 (Figure 2B). The second station, positioned on the Teqoa tributary, is located 2.5 km upstream from the convergence point and encompasses a drainage area of 139 km2 (Figure 2B). A HEC-RAS v.6.3 model, incorporating data from both gauging stations, was used to calculate the flow hydrograph in the main Darga stream (downstream of the tributaries’ convergence). It is crucial to note that there is an area of 23 km2 downstream from the gauging stations, draining into the main Darga stream, which is not monitored. This additional region represents the most arid part of the drainage basin, characterized by an annual rainfall of 70 mm. Despite its aridity, this area can experience intense rainfall events. Therefore, the calculated peak discharge and total water volume for specific flood events may be underestimated due to the exclusion of flows originating downstream of the gauging stations. For the Arugot stream, the gauging station is located a mere 900 m upstream of the studied channel segment (see Figure 2B). Notably, the flow hydrograph observed at this station reflects the flow within the studied segment.

2.4. Statistical Analysis

The data was statistically analyzed using SPSS v.14.0 (SPSS, IBM, Chicago, IL, USA). Multicollinearity among the predictors, namely peak discharge, total water volume, and the relative timing of the flood, was assessed using variance inflation factor. The goal of the test was to determine whether there is a significant correlation between peak discharge and total water volume. In this context, a statistical connection between variables exhibiting interdependence is referred to as “correlation”. If only one variable is dependent on the other but not vice versa, the term used is “relation”. Upon finding no multicollinearity, a generalized linearized mixed model (GLMM) with a gamma probability and log link function was employed. Dependent variables were either sediment budget or thalweg elevation change, with stream identity as the subject. This approach allowed us not only to verify the presence of a statistically significant relation but also to establish a hierarchy, distinguishing primary, secondary, and minor factors governing the geomorphological response of the streams to flash floods.

3. Results

3.1. Flood Record

During the study period, Darga stream experienced 15 discrete flash flood events, while Arugot stream encountered 20 such events. Throughout this timeframe, we conducted 16 and 15 photogrammetric surveys in Darga and Arugot streams, respectively. Notably, there were two instances in Darga and five in Arugot streams, where multiple floods occurred between two successive surveys. Values of flood dates and their respective peak discharges and total water volume are presented in Table 1 and Table 2.
The floods displayed a wide range of magnitudes, with peak discharge values spanning from 0.1 to 43.6 m3/s in the Darga stream and 0.1 to 76 m3/s in the Arugot stream. The median, lower interquartile and upper interquartile values for peak discharge in the Darga and Arugot streams were 3.4, 2.2, 6.9 m3/s and 21.5, 4.7, 37.0 m3/s, respectively. The total water volumes transported between surveys varied between 2000 and 118,000 m3 in the Darga stream, and 3000 and 419,000 m3 in the Arugot stream. The median, lower interquartile and upper interquartile of the water volumes in Darga were 68,000, 10,000 and 100,000 m3, respectively; in the Arugot stream, the volumes were 132,000, 62,000 and 243,000 m3, respectively.

3.2. Seasonal Dynamics of Lake Level Change and Stream Outlet Morphology

The research spanned four flood seasons and the three intervening dry seasons. The most substantial reduction in lake level occurred during the dry seasons, averaging 0.94 m, in contrast to the 0.28 m observed during the flood season (Figure 9A). Furthermore, the dry season exhibited the highest daily drop rate, averaging 0.41 cm/day, compared to the 0.19 cm/day recorded during the flood season (Figure 9A). Notably, wave abrasion during the dry seasons led to the formation of sub-vertical knickpoints at the outlets of the streams, reaching heights of up to 1 m (Figure 9B). These knickpoints persisted until the occurrence of the first flood of the floods/winter/wetter season.

3.3. Geomorphological Modifications during the Floods

Four erosion mechanisms were identified, encompassing (1) channel bed incision, (2) bank collapses, (3) erosion of remnant terraces, and (4) bar erosion. These processes, combined with sediment deposition, collectively influenced the modifications in the channels resulting from the floods. The first floods of each flood seasons are primarily associated to major channel incision, often accompanied by bank collapses along the channel sections where the bed was incised (for example Figure 10A,E,F,I and Figure 11A,E,G,K). Later floods in the season are characterized by both erosion and aggradation, involving bar migration with the removal and deposition of sediment (such as in Figure 10C,D and Figure 11M). Additionally, sediment accumulated at the feet of collapsed banks or eroded terrace remnants (for example, see Figure 10D and Figure 11D,L). If the later floods featured high peak discharge, they were linked to major and extensive bank collapses with minor or no deposition (e.g., Figure 10G,K and Figure 11F). A few weaker floods, characterized by low peak discharge and small water volumes, resulted in no discernible morphological alterations (for example, Figure 10B and Figure 11C,I), or even net sediment aggradation (Figure 10H).
Throughout the four-year study period, the Darga stream experienced an overall negative sediment budget of 56,900 m3, significant lateral modifications, formation of remnant terraces, and an average thalweg lowering of 2.34 m from the lake to the ramp (Figure 12). The average thalweg gradient for Darga ranged between 5.0 and 5.3%, and the longitudinal profile exhibited convexity (Figure 12). In the case of the Arugot stream, there was a net sediment loss of 15,700 m3, a widening of the lower section from 35 m to 55 m, and an average thalweg elevation lowering of 3.17 m (Figure 13). The average thalweg gradient for Arugot varied from 1.6 to 2.4%, and its longitudinal profile displayed concavity (Figure 13).
Figure 10. Ground elevation change maps between successive surveys (AL). Dates of the surveys presented at the top of each frame. The abbreviations used are: In = Incision; BC = Bank Collapse; RTE = Remnant Terrace Erosion; BE = Bar Erosion; Dep = Deposition. The color scale, presented in map 11A, indicates that reddish colors signify a decrease in altitude, reflecting incision, bank collapse, remnant terrace erosion, and bar erosion, while bluish tones represent an elevation increase denoting deposition. The orthophoto maps in the background correspond to the latest of the two surveys compared. The map location is marked in Figure 4. The terms “First flood” and “Later floods” distinguish whether a flood is the first in the flood season or a later flood in the season.
Remotesensing 16 01346 g010aRemotesensing 16 01346 g010b
Figure 11. Ground elevation change maps between successive surveys (AM). Dates of the surveys presented at the top of each frame. The conventions used are the same as in Figure 10. The maps location is marked in Figure 6.
Remotesensing 16 01346 g011aRemotesensing 16 01346 g011b
Figure 12. Cross-sections (AC) and longitudinal profiles (D) of the Darga stream, surveyed at the beginning of the study (blue line) and following each flood season. The locations of the sections are marked in Figure 5. The y-axis values are evenly spaced in the three cross-section plots, and all maintain a consistent vertical exaggeration of 2.5. The inset rectangles highlight the middle portions of the sections with higher vertical exaggeration, providing a clearer view of cross-sectional modifications.
Remotesensing 16 01346 g012
Figure 13. Cross-sections (AC) and longitudinal profiles (D) of the Arugot stream, surveyed at the beginning of the study (blue line) and following each flood season. The locations of the sections are marked in Figure 7. The y-axis values are evenly spaced in the three cross-section plots, and all maintain a consistent vertical exaggeration of 2.2.
Remotesensing 16 01346 g013
Between consecutive surveys, sediment evacuation volumes ranged from zero to 19,900 m3 in Darga stream and zero to 4180 m3 in Arugot stream. Table 1 and Table 2 outline the sediment evacuation volumes and the magnitude of average thalweg elevation changes between consecutive surveys. Generally, the Darga stream had a higher volume of evacuated sediment. The median, lower interquartile and upper interquartile of evacuated volume in the Darga stream was 1900, 300 and 6300 m3, respectively; in the Arugot stream these values were 470, 100 and 2360 m3, respectively. Interestingly, one flood event in Darga on 19 February 2022 resulted in a net deposition of 100 m3, contrary to evacuation.
The average thalweg lowering between discrete surveys in the Darga stream ranged from 0.02 to 0.53 m, while in the Arugot stream, it varied from zero to 0.74 m. The median, lower interquartile and upper interquartile lowering values for the Darga stream were 0.15, 0.02 and 0.39 m, respectively; for the Arugot stream the values were 0.17, 0.08 and 0.26 m, respectively. Again, the flood on 19 February 2022 in the Darga stream stands out—it culminated in an average thalweg rise of 0.1 m.

3.4. Statistical Analysis

In the statistical analysis, it was determined that the variance inflation factor for peak discharge and total water volume is 1.684. This low value indicated the absence of significant multicollinearity between the variables in the model, implying that peak discharge and total water volume are not significantly correlated. As a result, the generalized linearized mixed model (GLMM) could be applied to both predictors.
The analysis revealed a robust positive impact of peak discharge on the volume of evacuated sediment (GLMM, F(1,16) = 18.767, p = 0.001), indicating a relation between higher peak discharges and a negative sediment balance. Total water volume also played a role in sediment evacuation, with larger volumes corresponding to increased evacuation, although this effect was relatively marginal compared to peak discharge (GLMM, F(1,16) = 4.416, p = 0.052). The evident relation between peak discharge and water volume with evacuated sediment is visually apparent in Figure 14A,B. The timing of the floods affected the streams differently (GLMM, F(1,16) = 0.635, p = 0.437). While in the Darga stream later floods in the season were associated with increased sediment evacuation (Figure 14A,B), there was no statistically significant difference in evacuation rates between the first and later floods in the Arugot stream (interaction between stream and timing, GLMM, F(1,16) = 18.732, p < 0.001).
The timing of the flood had the most notable effect on incision magnitude (GLMM, F(1,17) = 4.928, p = 0.040). First floods exhibited significantly higher incision rates, with a median, lower interquartile and upper interquartile of 0.45, 0.22 and 0.55 m between consecutive surveys, respectively, compared to later floods (0.08, 0.02 and 0.18 m/flood) for both streams. No interaction between the timing and the stream identity was found (GLMM, F(1,17) = 1.928, p = 0.183), indicating that both streams exhibited the same trend of higher incision rates during the first floods of the season. While a relation between peak discharge and water volume to incision is visible in Figure 14C,D, this effect lacks statistical significance (peak discharge (GLMM, F(1,17) = 0.238, p = 0.632); water volume (GLMM, F(1,17) = 1.614, p = 0.221)). Therefore, these factors only play a minor role in governing incision compared to the timing of the flood within the wet season.

4. Discussion

This study investigated the geomorphological response of two ephemeral alluvial streams, Darga and Arugot, to a continuous base-level lowering induced by the rapid decline of the Dead Sea level. The study showcased the efficiency of drone-based photogrammetry, underscoring its advantages in terms of both time and cost. The ability to swiftly generate high-resolution orthophotos and DEMs shortly after a flood event, without the need for external professional assistance, provided the flexibility required for field research of this nature. The overall affordability of drones and photogrammetric software marks a revolutionary breakthrough, enabling tasks that previously demanded significantly greater resources to be accomplished more efficiently.
The Darga and Arugot streams exhibit common characteristics. They both undergo similar changes in their lower boundary conditions as they drain to the same decreasing base level (during the four years of the study, the lake level declined by 4.5 m), and the exposed bathymetry at their outlets has a gradient of 15–20% [60,61]. Moreover, the equilibrium gradients of the channel beds fall within the range of 2–2.5%, and the composition of their bed and banks consists of alluvial sediment with similar cohesion, grain size, and lithological composition [60,61]. Despite these similarities, the two streams differ in their upper boundary conditions, particularly concerning the hydrological attributes of their flash floods and their frequency. Variations in channel width and human-induced adjustments contribute to their differences. Consequently, the data collected from both streams provide insights into the common factors influencing their response to base-level lowering while also highlighting the distinctive characteristics of each channel that effect the response.

4.1. Parameters Governing Sediment Budget during a Flood

4.1.1. Peak Discharge

Peak discharge emerged as the primary factor influencing sediment removal in the examined streams. An increase in discharge is associated with higher stream power [62], resulting in stronger shear stress applied to the channel bed and banks [63]. This increased shear stress significantly improves the efficiency of sediment removal and transportation [64]. Erosion occurs when the shear stress exceeds the critical value required to detach a pebble from the bed and banks. Once a pebble is detached, a lower stream power is required to continue transporting it as bedload. Consequently, sediment may not necessarily deposit when discharge subsides after reaching its peak; instead, it continues downstream. Hassan et al. [65] found a positive connection between peak discharges of flood events and the transportation distance of pebbles in stream segments spanning a few hundred meters. In the case of the alluvial stream segments of Darga and Arugot, a mere few hundred meters suffice to carry the pebbles all the way to the Dead Sea, resulting in their evacuation to the lake and a negative sediment budget.
In a transport-limited stream, the sediment budget turns negative when the bedload volume arriving from upstream is less than the water’s transport capacity. In such instances, the water downstream transports a greater volume of sediment than the volume being deposited within it; this occurs through bed and bank erosion. Two primary explanations account for the observation that 24 out of 25 flood events concluded with a negative budget, a trend that intensified with increasing discharge:
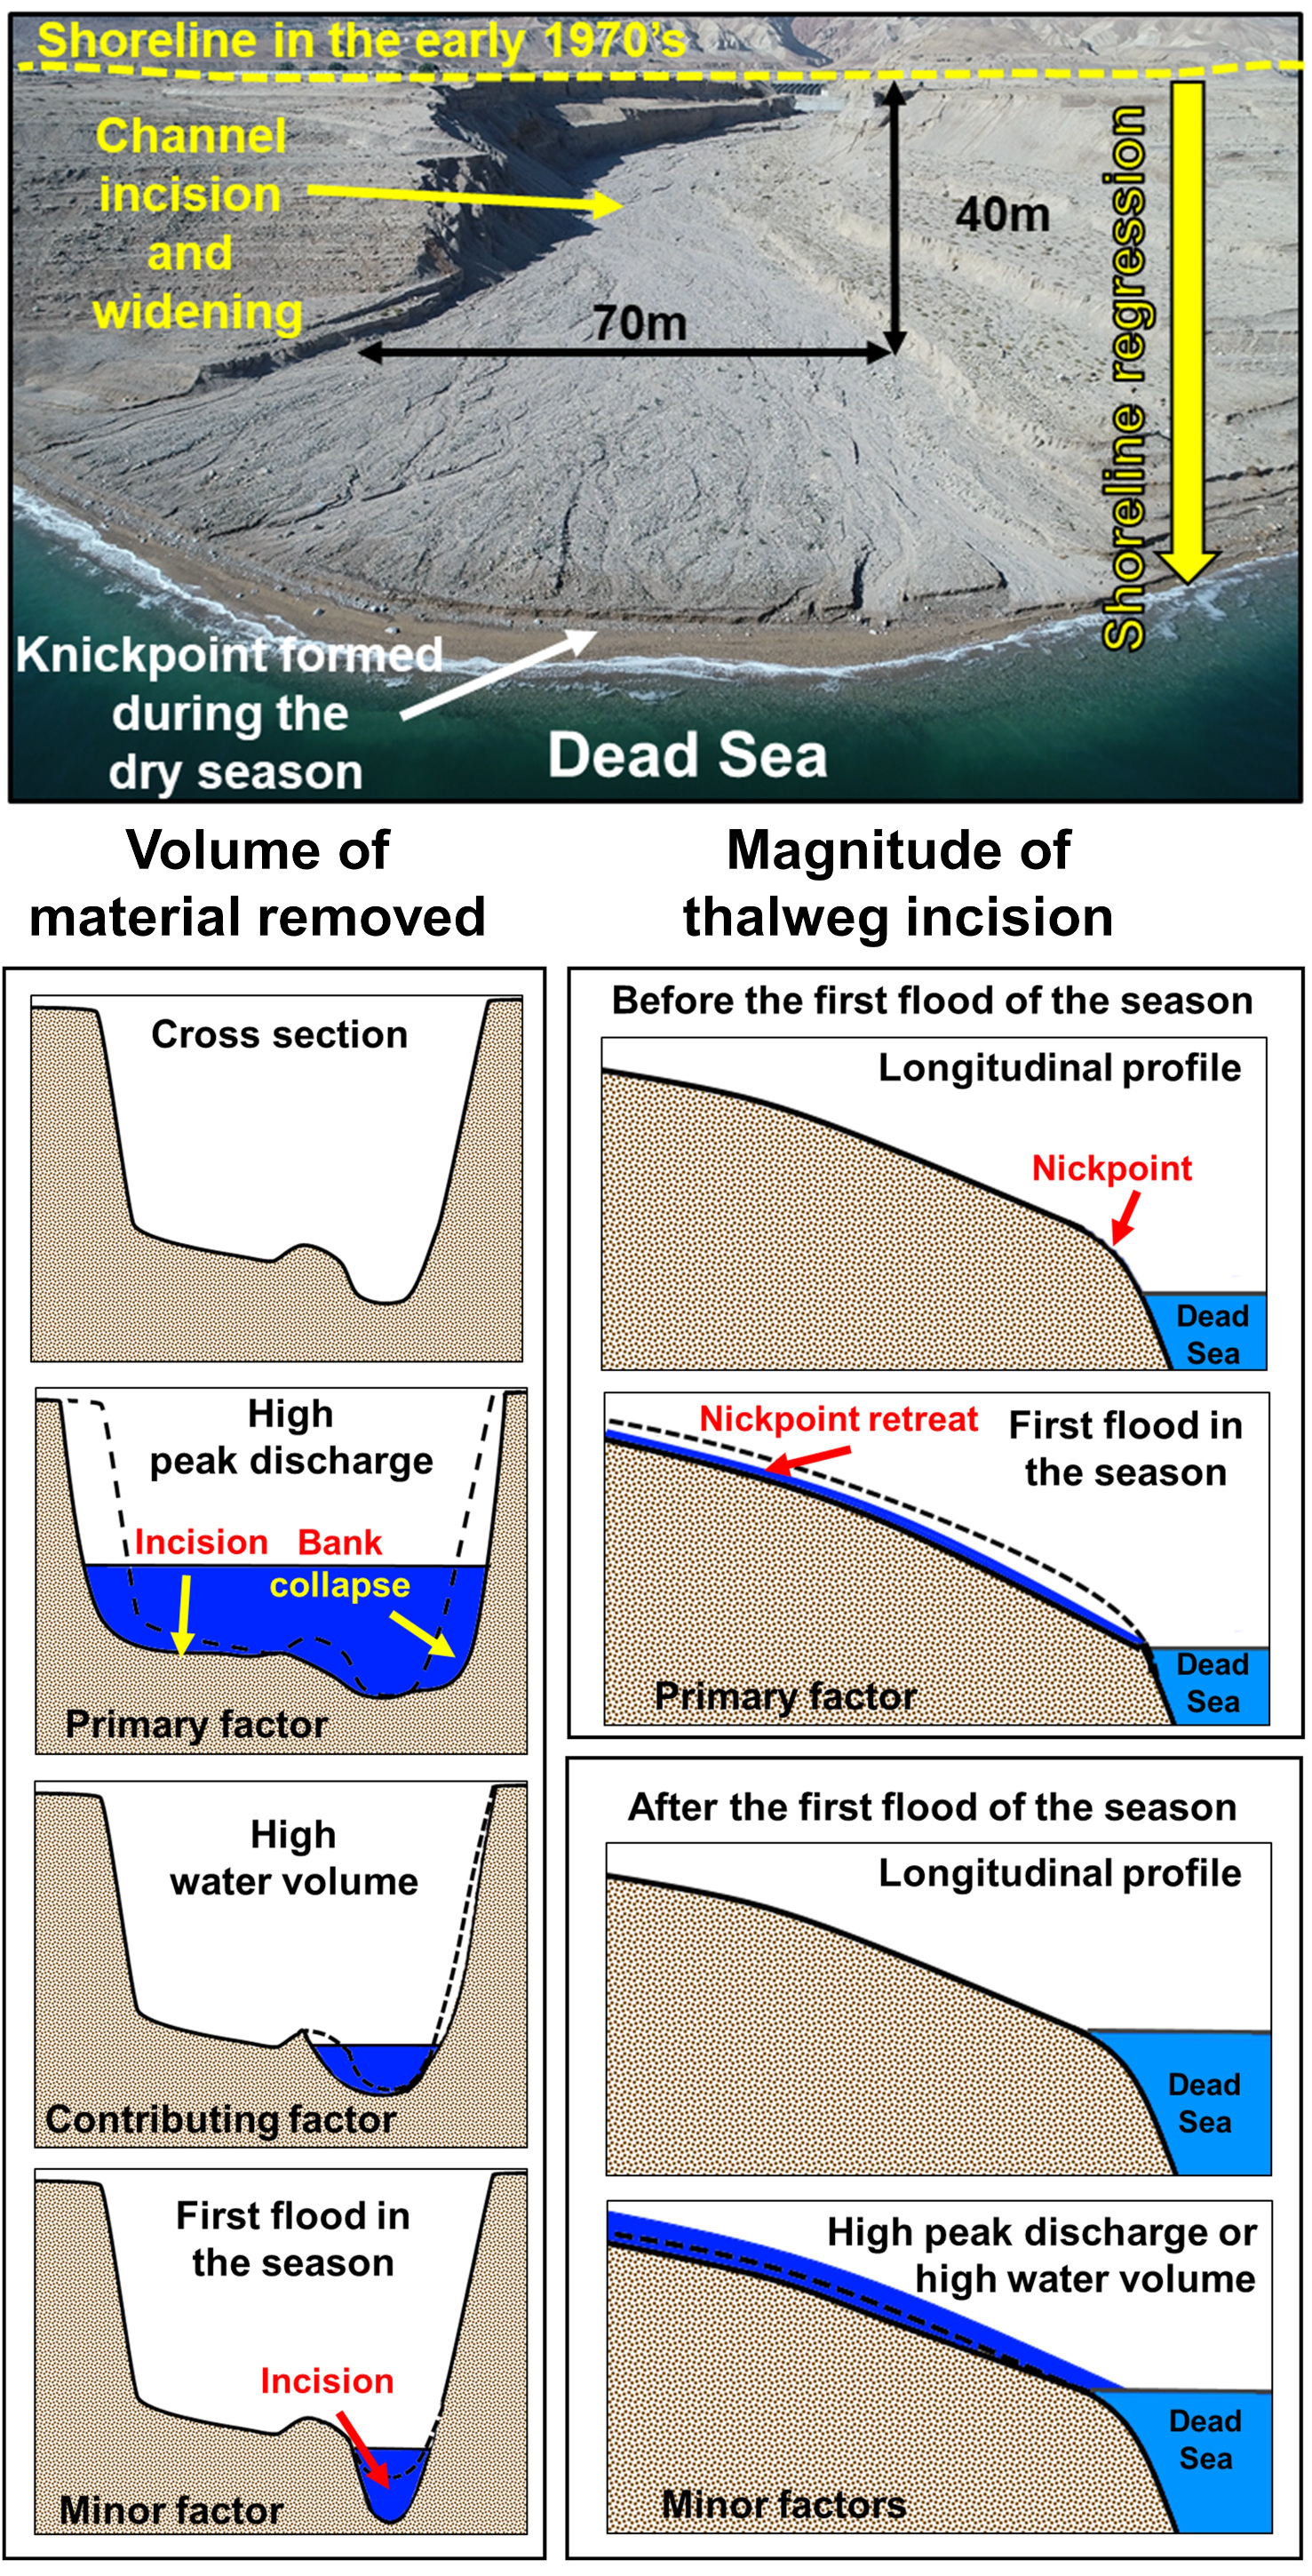
  • The channel bed gradient is steeper downstream of the ramps than upstream, due to the steep bathymetry exposed at the outlet [60]. This increased gradient leads to a higher transport capacity, resulting in the removal and evacuation of sediment. As per Equation (1), transport capacity is directly related to channel gradient and a coefficient dependent, among other factors, on discharge. Therefore, any increase in discharge (acting as a proxy for the coefficient) raises the transport capacity in proportion to the slope, leading to higher rates of erosion; the steeper the gradient, the more significant the increase in transport capacity and its surplus from the sediment volume arriving from upstream.
  • Channelization of the streams due to incision into the fan deltas. While the studied channel segments are considered transport-limited, most of their upstream sections pass through bedrock canyons. Streams that flow over bedrock are classified as “detachment-limited”, since their morphology is dependent mainly on the characteristics of the rock forming their bed and banks, rather than their transport capacity. In these streams, the volume of sediment transported depends on the availability of alluvium, rather than the water’s transport capacity of the water, as observed in transport-limited streams. Consequently, the water might be ‘starved’ of bedload [66]. In typical natural environments, streams would abruptly widen at the canyon outlets, leading to a reduction in stream power and the deposition of alluvial fans. These sedimentary bodies are topped by unconfined, braided channels. Along the Dead Sea shore, the channelization initiated by the lowering of the base level and subsequent incision [60], confines flows to the same width as their detachment-limited sections upstream (50–150 m), but without limitations on the available alluvium for erosion. An increase in discharge will not necessarily increase the bedload volume arriving from the sediment-starved segments upstream, thereby increasing the deficit in sediment and creating potential for higher rates of erosion.
In alluvial streams, the sediment contributing to the bedload is sourced not only from downward incision but also from wall collapses, involving banks along the sides of the channels, bars and remnant terraces within the channel (Figure 15). When an alluvial wall collapses directly into the flood flow, the required shear stress for downstream transport is lower than the critical stress for detaching pebbles from their initial position, increasing the likelihood of transport to the Dead Sea. Hooke [67] identified two primary processes responsible for bank collapses in alluvial streams: direct erosion by flowing water and sediment, and failure due to gravitational collapse. According to Hooke [67], direct erosion is predominantly controlled by the hydrological properties of floods, with peak discharge as the primary influencing factor. The main variable influencing gravitational failure is the moisture content of the banks, where higher humidity is associated with more collapses. The floods’ water level, dependent on peak discharge, determines the wetted section area. Higher discharges increase this area, elevating the probability of a collapse. This mechanism aligns with the relations found in this study between peak discharge and sediment budget (Figure 14A) and observations of large-scale bank collapses during or after floods with high peak discharges (Figure 10 and Figure 11).

4.1.2. Water Volume

The relation between the total water volume during a flood and its sediment budget indicates that higher water volumes are associated with more sediment evacuation and a negative sediment budget (Figure 14B). However, this connection is relatively minor when compared to the impact of peak discharge. The absence of a significant correlation between water volume and peak discharge implies that the primary factor influencing water volume is likely the duration of the flood event. Due to continuous base-level lowering at stream outlets, there is a diversion from geomorphological equilibrium, and a longer flood event provides the stream more time to incise and approach a new equilibrium. In addition, an extended duration of floodwater contact with alluvial walls provides time for the water to permeate the pores between pebbles, increasing moisture content within the walls and initiating gravitational collapse. Nonetheless, a prolonged duration alone cannot generate a stronger shear stress that surpasses the critical stress, nor can it wet walls and banks beyond the flow’s reach (Figure 15). Consequently, it is reasonable to assert that peak discharge plays a more prominent role in governing sediment budget.
Figure 15. Illustration highlighting the hierarchy among peak discharge, water volume, and flood timing in influencing the geomorphological response to floods. On the left, the influence on sediment budget is presented (represented by changes in channel cross section). On the right, thalweg incision is shown, with the first flood of the season at the top and subsequent floods below. Dashed lines indicate the pre-flood cross section and longitudinal profiles.
Remotesensing 16 01346 g015

4.1.3. Season and Timing of the Flood

In the Dead Sea basin, floods resulting from active Red Sea troughs (ARSTs) and active subtropical jets (STJs) typically exhibit high peak discharges, whereas floods originating from Mediterranean cyclones (MCs) tend to be longer but with lower peak discharges [68,69]. Both ARSTs and STJs primarily occur during transitional seasons, while MCs characterize the winter [70]. Consequently, based on the aforementioned findings, it can be inferred that flood events with the most pronounced net erosion are likely to occur during the transitional seasons. The results of this study align with this trend. In the Darga stream, the two floods with the highest peak discharge took place during transitional seasons—March 2020 and November 2022. These floods also featured the first and third highest rates of sediment evacuation (most negative sediment budgets). Similarly, the four floods with the highest peak discharge in Nahal Arugot occurred during transitional seasons—March 2020, December 2020, November 2021 and November 2022. These events also coincided with the highest rate of sediment evacuation. These observations, while insightful, are based on a limited period of four years and in drainage basins experiencing significant annual variability. Therefore, they should be approached with a degree of caution. Given that ARSTs and STJs occur at both ends of the flood season, there is no relation between their occurrences and whether they were the first floods of the season or later (i.e., fall or spring storms). Thus, this study did not establish a consistent relationship between the sediment budget and the chronological order of flood events (Figure 15).

4.2. Parameters Governing Incision during a Flood

The chronological order of the floods, whether a specific flood is the first event in the season or later, stands out as the primary factor determining incision magnitude. The reason for that is the shape of the longitudinal profile at the onset of the flood season, as the majority of the Dead Sea level drop transpires during the dry and warm period between flood seasons (Figure 9) [4,53]. During this interval, subaerial exposure of a steep bathymetry, coupled with wave abrasion, results in the formation of sub-vertical knickpoints at the stream outlet. Figure 9B illustrates this knickpoint at the Darga stream a few weeks before the initial flood of winter 2023–2024. During the first flood, the sub-vertical wall beneath the knickpoints undergoes rotation, causing a decrease in its gradient. Moreover, both incision and knickpoint retreat rates decline with distance from the original outlet location [43]. Consequently, the incision rate and magnitude during the first flood surpasses that of later floods in the season, even if the stream power during the latter was significantly higher, as they lack the incision-driving force (Figure 15).
While an apparent positive relationship exists between peak discharge, floodwater volumes, and incision rate (Figure 14), this association lacks statistical significance. This is attributed to the more pronounced influence of the chronological order of floods (Figure 15). Additionally, stochastic events, such as bar migration and bank collapse, exert a substantial impact on the two-dimensional longitudinal profile of the thalweg. This is in contrast to the sediment balance, a three-dimensional parameter, which is not impacted by lateral sediment movements.

4.3. Impacts of Changes in Surface Runoff on Alluvial Stream Morphology

In a climate change scenario characterized by reduced precipitation but increased rain intensities, as evidenced in studies such as Armon et al. [70], there is a probability of increased peak discharges. This likelihood is further accentuated by the ongoing trend of augmented human-induced surface runoff resulting from impervious land cover, like roofs, concrete, and asphalt. Importantly, this phenomenon applies even to streams not draining to a lowering base level. The resulting geomorphological responses carry substantial implications for the planning of infrastructure interfacing with alluvial streams.
With higher peak discharge, the channel bed and banks will experience an increased shear stress, resulting in incision and bank collapses. Initially, this process will drive channelization of the stream. For braided streams, it will involve the hydrological abandonment of the previous flow surface. In shallow channels, incision may lead to a decrease in the occurrence of full bank discharge and the hydrological abandonment of the floodplain. The occurrence of bank collapses could set off a feedback mechanism, potentially modifying sinuosity or accumulating sediment as bars, thereby contributing to additional bank collapses [71,72,73]. The processes of incision and widening will eventually cease, with the stream reaching a new steady equilibrium characterized by reduced shear stresses, likely due to a gentler gradient and/or a wider channel where water depth is shallower.
Increased discharge has the potential to modify the water-bedload ratio, initiating complex geomorphological responses. As previously explained, in detachment-limited streams the supply of sediment might limit the bedload discharge, irrespective of an upsurge in water discharge. This stands in contrast to transport-limited streams, where increased water discharge typically corresponds to an increase in bedload discharge. Therefore, in scenarios where an upstream stream segment, which is detachment-limited, experiences an increase in water discharge, a downstream transport-limited segment is likely to undergo erosion. Conversely, in streams with upper reaches confined by steep canyon banks, intensified rainfall can lead to a substantial rise in sediment supply to the channel, driven by increased magnitude and frequency of slope failure events [74]. This phenomenon can encourage aggradation and bring about a shift in the flow pattern towards a braided configuration [75].

5. Conclusions

This study explored the geomorphological responses of two ephemeral alluvial streams, Darga and Arugot, to discrete flood events over a four-year period. Both streams are subject to continuous base-level lowering due to the rapid decline of the Dead Sea. While these streams share similar lower boundary conditions (slope of the stream mouth, and rate of base-level change), variations in the upper boundary conditions, particularly regarding the hydrological attributes of floods events, render them an excellent case study for a comparative hydrological-geomorphological investigation. The research highlights the efficiency of drone-based photogrammetry for cost-effective and timely data collection, providing invaluable flexibility for field research.
The study revealed relations between peak discharge and water volume in a flood, the relative timing of the flood event in the flood season, and subsequent sediment budget and thalweg incision, all of which are shared by both streams. Peak discharge emerged as the primary factor influencing sediment removal, where increased discharge led to more efficient sediment evacuation and a negative sediment budget. While a link between higher water volumes and negative sediment budgets exists, it is overshadowed by the impact of peak discharge. The duration of flood events probably plays a role, providing the stream more time to erode, approach a new equilibrium, and influence sediment budget. Flood events during transitional seasons, often characterized by high peak discharges, are likely to result in the highest negative sediment balance. The chronological order of floods, whether an event was the first or later in the season, was identified as the primary factor determining incision magnitude. Knickpoints formed during the dry period drive incision, making the first flood more impactful.
In scenarios where climate change is accompanied by increased peak discharges due to intensified rain intensities, augmented by human-induced surface runoff, these processes will modify stream morphology and flow patterns. This can increase or reduce sinuosity, initiate incision or sediment accumulation, and might lead to bank collapses and channelization. These findings carry significant implications for infrastructure planning and environmental management. Potential future research could focus on stream power distribution along and across the stream channels. Such investigations can incorporate the advantages of high-resolution drone-based photogrammetry, coupled with detailed hydrographs to accurately delineate the spatio-temporal modifications of the stream bed and banks during discrete floods. Additionally, a future study could involve developing dynamic geomorphological models to simulate the evolution of ephemeral alluvial streams under varying climate change scenarios, including climatically induced base-level lowering, while the present study focused on a scenario of forced regression.

Author Contributions

Conceptualization, L.B.M. and N.G.L.; investigation, L.B.M.; writing—original draft preparation, L.B.M. and N.G.L.; supervision: L.B.M. All authors have read and agreed to the published version of the manuscript.

Funding

This research was funded by the Israel Science Foundation PI-NGL (grant #ISF-1471/18), by the US–Israel Binational Science Foundation PI-NGL (grant #BSF-2019/637) and by the Israeli Government under GSI DS project 40839 PIs-LBM and NGL.

Data Availability Statement

Research data used in the current study are publicly available in the Geological Survey of Israel website https://www.gov.il/en/Departments/General/publications-g.

Acknowledgments

We thank the Israel Hydrological Service, and especially Rita Chudinov, for sharing the hydrological data used in this study. We express our gratitude to Daphna Gottlieb for her invaluable contribution to the statistical analysis.

Conflicts of Interest

The authors declare no conflicts of interest. The funders had no role in the design of the study; in the collection, analyses, or interpretation of data; in the writing of the manuscript; or in the decision to publish the results.

References

  1. Yao, F.; Livneh, B.; Rajagopalan, B.; Wang, J.; Crétaux, J.F.; Wada, Y.; Berge-Nguyen, M. Satellites reveal widespread decline in global lake water storage. Science 2023, 380, 743–749. [Google Scholar] [CrossRef] [PubMed]
  2. Cretaux, J.F.; Letolle, R.; Bergé-Nguyen, M. History of Aral Sea level variability and current scientific debates. Glob. Planet. Chang. 2013, 110, 99–113. [Google Scholar] [CrossRef]
  3. Lensky, N.G.; Dvorkin, Y.; Lyakhovsky, V.; Gertman, I.; Gavrieli, I. Water, salt, and energy balances of the Dead Sea. Water Resour. Res. 2005, 41, 1–13. [Google Scholar] [CrossRef]
  4. Lensky, N.; Dente, E. The Hydrological Processes Driving the Accelerated Dead Sea Level Decline in the Past Decades; Geological Survey of Israel Report GSI/16/2015; Geological Survey of Israel: Jerusalem, Israel, 2015; 24p. (In Hebrew) [Google Scholar]
  5. Moore, J.N. Recent desiccation of western Great Basin saline lakes: Lessons from Lake Abert, Oregon, USA. Sci. Total Environ. 2016, 554, 142–154. [Google Scholar] [CrossRef] [PubMed]
  6. Kezer, K.; Matsuyama, H. Decrease of river runoff in the Lake Balkhash basin in Central Asia. Hydrol. Process. 2006, 20, 1407–1423. [Google Scholar] [CrossRef]
  7. Fassieh, K.M.; Zaki, M.A. A water management model for Toshka depression. J. Appl. Math. 2014, 2014, 731846. [Google Scholar] [CrossRef]
  8. Xiao, K.; Griffis, T.J.; Baker, J.M.; Bolstad, P.V.; Erickson, M.D.; Lee, X.; Wood, J.D.; Hu, C.; Nieber, J.L. Evaporation from a temperate closed-basin lake and its impact on present, past, and future water level. J. Hydrol. 2018, 561, 59–75. [Google Scholar] [CrossRef]
  9. Fu, C.; Wu, H.; Zhu, Z.; Song, C.; Xue, B.; Wu, H.; Ji, Z.; Dong, L. Exploring the potential factors on the striking water level variation of the two largest semi-arid-region lakes in northeastern Asia. Catena 2021, 198, 105037. [Google Scholar] [CrossRef]
  10. Huang, Y.; Yao, B.; Li, Y.; Zhang, H.; Wang, S. Deciphering Hulun lake level dynamics and periodical response to climate change during 1961–2020. J. Hydrol. Reg. Stud. 2023, 46, 101352. [Google Scholar] [CrossRef]
  11. Barnett, T.P.; Pierce, D.W. When will Lake Mead go dry? Water Resour. Res. 2008, 44, W03201. [Google Scholar] [CrossRef]
  12. Wang, J.; Song, C.; Reager, J.T.; Yao, F.; Famiglietti, J.S.; Sheng, Y.; MacDonald, G.M.; Brun, F.; Schmied, H.M.; Marston, R.A.; et al. Recent global decline in endorheic basin water storages. Nat. Geosci. 2018, 11, 926–932. [Google Scholar] [CrossRef]
  13. Khazaei, B.; Khatami, S.; Alemohammad, S.H.; Rashidi, L.; Wu, C.; Madani, K.; Kalantari, Z.; Destouni, G.; Aghakouchak, A. Climatic or regionally induced by humans? Tracing hydro-climatic and land-use changes to better understand the Lake Urmia tragedy. J. Hydrol. 2019, 569, 203–217. [Google Scholar] [CrossRef]
  14. Schulz, S.; Darehshouri, S.; Hassanzadeh, E.; Tajrishy, M.; Schüth, C. Climate change or irrigated agriculture–what drives the water level decline of Lake Urmia. Sci. Rep. 2020, 10, 236. [Google Scholar] [CrossRef] [PubMed]
  15. Posamentier, H.W.; Allen, G.P.; James, D.P.; Tesson, M. Forced regressions in a sequence stratigraphic framework: Concepts, examples, and exploration significance. AAPG Bull. 1992, 76, 1687–1709. [Google Scholar]
  16. Adams, K.D. Response of the Truckee River to lowering base level at Pyramid Lake, Nevada, based on historical air photos and LiDAR data. Geosphere 2012, 8, 607–627. [Google Scholar] [CrossRef]
  17. Dente, E.; Lensky, N.G.; Morin, E.; Enzel, Y. From straight to deeply incised meandering channels: Slope impact on sinuosity of confined streams. Earth Surf. Process Landf. 2021, 46, 1041–1054. [Google Scholar] [CrossRef]
  18. Dente, E.; Lensky, N.G.; Morin, E.; Grodek, T.; Sheffer, N.A.; Enzel, Y. Geomorphic response of a low-gradient channel to modern, progressive base-level lowering: Nahal HaArava, the Dead Sea. J. Geophys. Res. Earth Surf. 2017, 122, 2468–2487. [Google Scholar] [CrossRef]
  19. Eyal, H.; Dente, E.; Haviv, I.; Enzel, Y.; Dunne, T.; Lensky, N.G. Fluvial incision and coarse gravel redistribution across the modern Dead Sea shelf as a result of base-level fall. Earth Surf. Process Landf. 2019, 44, 2170–2185. [Google Scholar] [CrossRef]
  20. Bowman, D.; Svoray, T.; Devora, S.; Shapira, I.; Laronne, J.B. Extreme rates of channel incision and shape evolution in response to a continuous, rapid base-level fall, the Dead Sea, Israel. Geomorphology 2010, 114, 227–237. [Google Scholar] [CrossRef]
  21. Born, S.M.; Ritter, D.F. Modern terrace development near Pyramid Lake, Nevada, and its geological implication. Geol. Soc. Am. Bull. 1970, 81, 1233–1242. [Google Scholar] [CrossRef]
  22. Gardner, T.W. Experimental study of knickpoint and longitudinal profile evolution in cohesive, homogeneous material. Geol. Soc. Am. Bull. 1983, 94, 664–672. [Google Scholar] [CrossRef]
  23. Schumm, S.A.; Mosley, M.P.; Weaver, W.E. Experimental Fluvial Geomorphology; Wiley: New York, NY, USA, 1987; 413p. [Google Scholar]
  24. Bonneau, P.R.; Snow, R.S. Character of headwaters adjustment to base level drop investigated by digital modeling. Geomorphology 1992, 5, 475–487. [Google Scholar] [CrossRef]
  25. Schumm, S.A. River response to base level change: Implication for sequence stratigraphy. J. Geol. 1993, 101, 279–294. [Google Scholar] [CrossRef]
  26. Posamentier, H.W.; Allen, G.P. Siliciclastic Sequence Stratigraphy: Concepts and Applications; Society for Sedimentary Geology Concepts in Sedimentology and Paleontology: Claremore, OK, USA, 2000; Volume 7, 210p. [Google Scholar]
  27. Autin, W.J.; Aslan, A. Alluvial pedogenesis in Pleistocene and Holocene Mississippi River deposits: Effects of relative sea-level change. Geol. Soc. Am. Bull. 2001, 113, 1456–1466. [Google Scholar] [CrossRef]
  28. Muto, T.; Steel, R.J. Autogenic response of fluvial deltas to steady sea level fall: Implications from flume-tank experiments. Geology 2004, 32, 401–404. [Google Scholar] [CrossRef]
  29. Ben Moshe, L.; Haviv, I.; Enzel, Y.; Zilberman, E.; Matmon, A. Incision of alluvial channels in response to a continuous base level fall: Field characterization, modeling, and validation along the Dead Sea. Geomorphology 2008, 93, 524–536. [Google Scholar] [CrossRef]
  30. Salomon, R. Evolution of Longitudinal Profiles of Gravel-Bed Channels in Response to Non-Steady Flow Regime. Master’s Thesis, The Hebrew University of Jerusalem, Jerusalem, Israel, 2016. [Google Scholar]
  31. Dente, E.; Lensky, N.G.; Morin, E.; Dunne, T.; Enzel, Y. Sinuosity evolution along an incising channel: New insights from the Jordan River response to the Dead Sea level fall. Earth Surf. Process Landf. 2019, 44, 781–795. [Google Scholar] [CrossRef]
  32. Postma, G.; Kleinhans, M.G.; Meijer, P.T.; Eggenhuisen, J.T. Sediment transport in analogue flume models compared with real-world sedimentary systems: A new look at scaling evolution of sedimentary systems in a flume. Sedimentology 2008, 55, 1541–1557. [Google Scholar] [CrossRef]
  33. Javernick, L.; Redolfi, M.; Bertoldi, W. Evaluation of a numerical model’s ability to predict bed load transport observed in braided river experiments. Adv. Water Resour. 2018, 115, 207–218. [Google Scholar] [CrossRef]
  34. Stark, K.; Cadol, D.; Varyu, D.; Laronne, J.B. Direct, continuous measurements of ultra-high sediment fluxes in a sandy gravel-bed ephemeral river. Geomorphology 2021, 382, 107682. [Google Scholar] [CrossRef]
  35. Leopold, L.B.; Bull, W.B. Base level, aggradation, and grade. Proc. Am. Philos. Soc. 1979, 123, 168–202. [Google Scholar]
  36. Schumm, S.A. The Fluvial System; John Wiley and Sons: New York, NY, USA, 1977; 338p. [Google Scholar]
  37. Whipple, K.X.; Parker, G.; Paola, C.; Mohrig, D. Channel dynamics, sediment transport, and the slope of alluvial fans: Experimental study. J. Geol. 1998, 106, 677–694. [Google Scholar] [CrossRef]
  38. Gomez, B. The efficiency of the river machine. Geomorphology 2022, 410, 108271. [Google Scholar] [CrossRef]
  39. Bagnold, R.A. Bed load transport by natural rivers. Water Resour. Res. 1977, 13, 303–312. [Google Scholar] [CrossRef]
  40. Bagnold, R.A. An Approach to the Sediment Transport Problem from General Physics; U.S. Geological Survey Professional Paper 422-I; US Government Printing Office: Washington, DC, USA, 1966; 37p. [Google Scholar]
  41. Gomez, B.; Church, M. An assessment of bed load sediment transport formulae for gravel bed rivers. Water Resour. Res. 1989, 25, 1161–1186. [Google Scholar] [CrossRef]
  42. Bagnold, R.A. The nature of saltation and of ‘bed-load’ transport in water. Proc. R. Soc. A Math. Phys. Eng. Sci. 1973, 332, 473–504. [Google Scholar]
  43. Begin, Z.B.; Meyer, D.F.; Schumm, S.A. Development of longitudinal profiles of alluvial channels in response to base-level lowering. Earth Surf. Process Landf. 1981, 6, 49–68. [Google Scholar] [CrossRef]
  44. Montgomery, D.R.; Buffington, J.M. Channel-reach morphology in mountain drainage basins. Geol. Soc. Am. Bull. 1997, 109, 596–611. [Google Scholar] [CrossRef]
  45. Begin, Z.B. Application of a diffusion-erosion model to alluvial channels which degrade due to base-level lowering. Earth Surf. Process Landf. 1988, 13, 487–500. [Google Scholar] [CrossRef]
  46. Bowman, D. Base-Level Impact: A Geomorphic Approach; Springer International Publishing: Berlin/Heidelberg, Germany, 2023; 154p. [Google Scholar] [CrossRef]
  47. Nemec, W.; Steel, R.J. What is a fan delta and how do we recognize it. In Fan Deltas: Sedimentology and Tectonic Settings; Blackie: Glasgow, UK, 1988; Volume 3, pp. 231–248. [Google Scholar]
  48. McPherson, J.G.; Shanmugam, G.; Moiola, R.J. Fan-deltas and braid deltas: Varieties of coarse-grained deltas. Geol. Soc. Am. Bull. 1987, 99, 331–340. [Google Scholar] [CrossRef]
  49. Bowman, D. The declining but non-rejuvenating base level—The Lisan lake, the Dead Sea area, Israel. Earth Surf. Process Landf. 1988, 13, 239–249. [Google Scholar] [CrossRef]
  50. Harvey, A.M. The role of base-level change in the dissection of alluvial fans: Case studies from southeast Spain and Nevada. Geomorphology 2002, 5, 67–87. [Google Scholar] [CrossRef]
  51. Kleinhans, M.G. Autogenic cyclicity of foreset sorting in experimental Gilbert-type deltas. Sediment. Geol. 2005, 181, 215–224. [Google Scholar] [CrossRef]
  52. Bull, W.B. Geomorphic Responses to Climatic Change; Oxford University Press: New York, NY, USA, 1991; 326p. [Google Scholar]
  53. Enzel, Y.; Mushkin, A.; Groisman, M.; Calvo, R.; Eyal, H.; Lensky, N. The modern wave-induced coastal staircase morphology along the western shores of the Dead Sea. Geomorphology 2022, 408, 108237. [Google Scholar] [CrossRef]
  54. Frostick, L.E.; Reid, I.A.N. Climatic versus tectonic controls of fan sequences: Lessons from the Dead Sea, Israel. J. Geol. Soc. 1989, 146, 527–538. [Google Scholar] [CrossRef]
  55. Moran, M.G.; Holbrook, J.; Lensky, N.G.; Ben Moshe, L.; Mor, Z.; Eyal, H.; Enzel, Y. Century-scale sequences and density-flow deltas of the late Holocene and modern Dead Sea coast, Israel. Sedimentology 2023, 70, 1945–1980. [Google Scholar] [CrossRef]
  56. Bookman, R.; Enzel, Y.; Agnon, A.; Stein, M. Late Holocene lake levels of the Dead Sea. Geol. Soc. Am. Bull. 2004, 116, 555–571. [Google Scholar] [CrossRef]
  57. Goldsmith, Y.; Cohen, O.; Stein, M.; Torfstein, A.; Kiro, Y.; Kushnir, Y.; Bartov, Y.; Ben Moshe, L.; Frumkin, A.; Lensky, N.; et al. Holocene humid periods of the Levant–evidence from Dead Sea lake-levels. Quat. Sci. Rev. 2023, 318, 108312. [Google Scholar] [CrossRef]
  58. Eyal, H.; Enzel, Y.; Meiburg, E.; Vowinckel, B.; Lensky, N.G. How does coastal gravel get sorted under stormy longshore transport? Geophys. Res. Lett. 2021, 48, e2021GL095082. [Google Scholar] [CrossRef]
  59. Cook, K.L.; Dietze, M. Short Communication: A simple workflow for robust low-cost UAV-derived change detection without ground control points. Earth Surf. Dyn. 2019, 7, 1009–1017. [Google Scholar] [CrossRef]
  60. Ben Moshe, L.; Lensky, N.G. Increased Deviation of Dead Sea Tributaries from Steady State and Recommendations for Infrastructure Planning in Changing Conditions; Geological Survey of Israel Report GSI-27-2020; Geological Survey of Israel: Jerusalem, Israel, 2020; 30p. (In Hebrew) [Google Scholar]
  61. Ben Moshe, L.; Lensky, N.G. Geomorphological Principles for Artificial Adjustments to Alluvial Channels Slope: Examples from Dead Sea tributaries; Geological Survey of Israel Report GSI-12-2022; Geological Survey of Israel: Jerusalem, Israel, 2022; 21p. (In Hebrew) [Google Scholar]
  62. Phillips, J.D.; Slattery, M.C. Downstream trends in discharge, slope, and stream power in a lower coastal plain river. J. Hydrol. 2007, 334, 290–303. [Google Scholar] [CrossRef]
  63. Dubinski, I.M.; Wohl, E. Relationships between block quarrying, bed shear stress, and stream power: A physical model of block quarrying of a jointed bedrock channel. Geomorphology 2013, 180, 66–81. [Google Scholar] [CrossRef]
  64. Talling, P.J.; Sowter, M.J. Erosion, deposition and basin-wide variations in stream power and bed shear stress. Basin Res. 1998, 10, 87–108. [Google Scholar] [CrossRef]
  65. Hassan, M.A.; Church, M.; Schick, A.P. Distance of movement of coarse particles in gravel bed streams. Water Resour. Res. 1991, 27, 503–511. [Google Scholar] [CrossRef]
  66. Johnson, J.P.; Whipple, K.X. Feedbacks between erosion and sediment transport in experimental bedrock channels. Earth Surf. Process Landf. 2007, 32, 1048–1062. [Google Scholar] [CrossRef]
  67. Hooke, J.M. An analysis of the processes of river bank erosion. J. Hydrol. 1979, 42, 39–62. [Google Scholar] [CrossRef]
  68. Dayan, U.; Morin, E. Flash flood-producing rainstorms over the Dead Sea: A review. Geol. Soc. Am. Spec. 2006, 401, 53–62. [Google Scholar]
  69. Armon, M.; Morin, E.; Enzel, Y. Overview of modern atmospheric patterns controlling rainfall and floods into the Dead Sea: Implications for the lake’s sedimentology and paleohydrology. Quat. Sci. Rev. 2019, 216, 58–73. [Google Scholar] [CrossRef]
  70. Armon, M.; Marra, F.; Enzel, Y.; Rostkier-Edelstein, D.; Garfinkel, C.I.; Adam, O.; Dayan, U.; Morin, E. Reduced rainfall in future heavy precipitation events related to contracted rain area despite increased rain rate. Earth’s Future 2022, 10, e2021EF002397. [Google Scholar] [CrossRef]
  71. Klösch, M.; Blamauer, B.; Habersack, H. Intra-event scale bar–bank interactions and their role in channel widening. Earth Surf. Process Landf. 2015, 40, 1506–1523. [Google Scholar] [CrossRef]
  72. Zhao, K.; Lanzoni, S.; Gong, Z.; Coco, G. A numerical model of bank collapse and river meandering. Geophys. Res. Lett. 2021, 48, e2021GL093516. [Google Scholar] [CrossRef]
  73. Zhao, K.; Coco, G.; Gong, Z.; Darby, S.E.; Lanzoni, S.; Xu, F.; Zhang, K.; Townend, I. A review on bank retreat: Mechanisms, observations, and modeling. Rev. Geophys. 2022, 60, e2021RG000761. [Google Scholar] [CrossRef]
  74. DeLisle, C.; Yanites, B.J. Rethinking Variability in Bedrock Rivers: Sensitivity of Hillslope Sediment Supply to Precipitation Events Modulates Bedrock Incision During Floods. J. Geophys. Res. Earth Surf. 2023, 128, e2023JF007148. [Google Scholar] [CrossRef]
  75. Gaeuman, D.; Schmidt, J.C.; Wilcock, P.R. Complex channel responses to changes in stream flow and sediment supply on the lower Duchesne River, Utah. Geomorphology 2005, 64, 185–206. [Google Scholar] [CrossRef]
Figure 2. (A) A satellite image of the Dead Sea rift, the Dead Sea, and the Judean Mountains and desert. The location of the escarpment bordering the rift is indicated by the purple dashed line. The black rectangle denotes the position of the map presented in (B). (B) An altitude map of the Judean desert, focusing on the Darga and Arugot drainage basins. Contour lines indicate average annual precipitation values in mm. Black dots labeled as EG and MS denote the two communities of Ein Gedi and Mizpe Shalem, respectively. Blue lines indicating the main tributaries. The drainage basin of the Darga stream is shaded in semi-transparent orange and divided into three sub-basins: Darga tributary, Teqoa tributary, and the combined Darga stream downstream of the former two. The confluence of the Darga and Teqoa tributaries is marked by a white triangle. The drainage basin of the Arugot stream is highlighted in semi-transparent white. Yellow stars indicate the hydrometric stations whose data was utilized in this study.
Remotesensing 16 01346 g002
Figure 3. Dead Sea lake level curve during the last century.
Remotesensing 16 01346 g003
Figure 4. An orthophoto map of Darga stream between the Dead Sea highway and the Dead Sea shore. The upper edge of the channel banks is denoted by the blue dashed line. The channel is incised into the hydrologically abandoned surface of the fan delta. Downstream of the highway, a visually apparent artificially modified segment is observable, featuring a ramp at its lower section. The white rectangle marks the study area in Darga stream.
Remotesensing 16 01346 g004
Figure 5. (A) An elevation map of the alluvial segment in Darga stream, derived from a photogrammetric survey conducted in July 2023. The blue lines indicate the positions of the cross sections presented in the results section. The yellow dashed line denotes the location of the projection line for the longitudinal profiles. Red arrows indicate the viewpoint direction of the photographs in (B,C). (B) An oblique aerial photograph capturing the studied channel in the upstream direction. (C) An additional oblique aerial photograph focusing on the ramp situated at the upstream boundary of the studied channel.
Remotesensing 16 01346 g005
Figure 6. An orthophoto map of Arugot stream between the old Dead Sea highway and the Dead Sea shore. The upper edge of the channel banks is denoted by the blue dashed lines. The channel is incised into the hydrologically abandoned surface of the fan delta. Downstream of the highway, a visually apparent artificially modified segment is observable, featuring a ramp at its lower section. The white rectangle marks the study area in Arugot stream.
Remotesensing 16 01346 g006
Figure 7. (A) An elevation map of the alluvial segment in Arugot stream, derived from a photogrammetric survey conducted in June 2023. The blue lines indicate the positions of the cross sections presented in the results section. The yellow dashed line denotes the location of the projection line for the longitudinal profiles. Red arrows indicate the viewpoint direction of the photographs in (B,C). (B) An oblique aerial photograph capturing the studied channel in the upstream direction, during a flood in February 2022. (C) An additional oblique aerial photograph focusing on the ramp situated at the upstream boundary of the studied channel.
Remotesensing 16 01346 g007
Figure 8. Workflow progression, with drone-based photogrammetric survey in the top left corner, followed by the generation of Digital Elevation Models (DEMs) and orthophoto construction through photogrammetric analysis. Subsequent DEMs are compared through subtraction to create maps indicating elevation changes (red and blue colors represent decrease and increase in elevations, respectively). These maps are utilized to calculate a numerical value (represented by the symbol #) indicating the sediment budget between successive surveys. Longitudinal profiles are derived through DEM analysis, and an average thalweg elevation change between surveys is quantified (also represented by the symbol #). The workflow culminates in the amalgamation of sediment budget and thalweg elevation change data, along with flood hydrological information, into a comprehensive statistical analysis (bottom right).
Remotesensing 16 01346 g008
Figure 9. (A) Dead Sea lake level curve throughout the study period (solid line), where red and blue signify the dry and flood seasons, respectively. The dashed line indicates the average daily lake level change. (B) Illustration of a sub-vertical step observed at the outlet of the Darga stream, occurring just before the onset of the flood season. Photograph captured on 8 January 2024.
Remotesensing 16 01346 g009
Figure 14. The relations between flood hydrology and the corresponding geomorphological responses in the Darga (left column) and Arugot (right column) streams. The graphs are organized in two columns and four rows, labeled (AD). Rows (A,B) present the relation between peak discharge or total water volume and the volume of evacuated sediment (negative sediment budget). Rows (C,D) illustrate the relation between peak discharge or total water volume and the average thalweg incision (elevation lowering). Dots denote discrete flood events, while dashed lines represent trend lines. Colors represent the relative timing of the events.
Remotesensing 16 01346 g014
Table 1. Dates of floods in the Darga stream, along with their associated peak discharges and total water volumes, are presented with a blue background. The dates of drone surveys, the calculated volume of evacuated sediment, and the average thalweg incision between consecutive surveys are denoted with a white background. In cases where multiple floods occurred between consecutive surveys, the peak discharge used in the statistical analysis was the highest among them, marked with an asterisk.
Flood SeasonDatePeak Discharge (m3/s)Total Water Volume (103 m3)Evacuated Sediment Volume (103 m3)Average Thalweg Incision (m)
2019–20201 October 2019New flood season survey
9 December 20190.44
23 December 2019 0.30.11
27 December 20190.98
1 January 2020 00.02
9 January 20207.2109
16 January 2020 4.60.02
6 March 202026.397
12 March 2020 19.90.18
2020–20211 December 2020New flood season survey
18 February 20216.394
1 March 2021 1.80.37
2021–202225 January 2022New flood season survey
27 January 20221.855
31 January 2022 1.10.18
5 February 20222.92
8 February 2022 1.90.45
19 February 20222.711
22 February 2022 −0.1−0.1
2022–202326 October 2022New flood season survey
1 November 202243.6 *118
16 November 20220.12
21 November 2022 11.20.53
26 December 20223.880
3 January 2023 0.30.04
7 February 20237.7116
9 February 2023 11.80.52
14 March 20230.49
20 March 20230.46
29 May 20232.3 *17
20 July 2023 3.90.02
Table 2. Dates of floods in the Arugot stream, along with their associated peak discharges and total water volumes, are presented with a blue background. The dates of drone surveys, the calculated volume of evacuated sediment, and the average thalweg incision between consecutive surveys are denoted with a white background. In cases where multiple floods occurred between consecutive surveys, the peak discharge used in the statistical analysis was the highest among them, marked with an asterisk.
Flood
Season
DatePeak
Discharge (m3/s)
Total Water
Volume
(103 m3)
Evacuated Sediment
Volume (103 m3)
Average Thalweg
Incision
(m)
2019–202028 October 2019New flood season survey
9 December 20191.38
18 December 2019 0.470.23
5 January 20201.214
9 January 20204.9 *118
12 January 2020 0.10.08
18 January 20200.14
24 January 20201.8 *16
5 February 2020 00.02
25 February 20209.9 76
6 March 202064.8 *228
13 March 20203.7137
17 March 2020 4.180.11
2020–20215 December 202044.3145
13 December 2020 3.350.74
17 December 20200.23
4 February 20214.956
18 February 202127.8 *419
1 March 2021 1.020.26
2021–202221 November 202137.0171
23 December 2021 2.360.58
27 January 20224.762
31 January 2022 00.06
5 February 20220.45
8 February 2022 00
19 February 202221.5122
22 February 2022 0.110.17
2022–202326 October 2022New flood season survey
2 November 202275.9243
16 November 2022 3.450.52
7 February 20237.7122
9 February 2023 0.140.21
14 March 20231.519
12 April 20233.162
28 May 202324.8 *205
26 June 2023 0.490.17
Disclaimer/Publisher’s Note: The statements, opinions and data contained in all publications are solely those of the individual author(s) and contributor(s) and not of MDPI and/or the editor(s). MDPI and/or the editor(s) disclaim responsibility for any injury to people or property resulting from any ideas, methods, instructions or products referred to in the content.

