Article

Registration of Large Optical and SAR Images with Non-Flat Terrain by Investigating Reliable Sparse Correspondences

1
College of Electronic Science and Technology, National University of Defense Technology, Changsha 410073, China
2
Northwest Institute of Nuclear Technology, Xi’an 710024, China
*
Author to whom correspondence should be addressed.
Remote Sens. 2023, 15(18), 4458; https://doi.org/10.3390/rs15184458
Submission received: 23 July 2023 / Revised: 29 August 2023 / Accepted: 1 September 2023 / Published: 10 September 2023

Abstract

:
Optical and SAR image registration is the primary procedure to exploit the complementary information from the two different image modal types. Although extensive research has been conducted to narrow down the vast radiometric and geometric gaps so as to extract homogeneous characters for feature point matching, few works have considered the registration issue for non-flat terrains, which will bring in more difficulties for not only sparse feature point matching but also outlier removal and geometric relationship estimation. This article addresses these issues with a novel and effective optical-SAR image registration framework. Firstly, sparse feature points are detected based on the phase congruency moment map of the textureless SAR image (SAR-PC-Moment), which helps to identify salient local regions. Then a template matching process using very large local image patches is conducted, which increases the matching accuracy by a significant margin. Secondly, a mutual verification-based initial outlier removal method is proposed, which takes advantage of the different mechanisms of sparse and dense matching and requires no geometric consistency assumption within the inliers. These two procedures will produce a putative correspondence feature point (CP) set with a low outlier ratio and high reliability. In the third step, the putative CPs are used to segment the large input image of non-flat terrain into dozens of locally flat areas using a recursive random sample consensus (RANSAC) method, with each locally flat area co-registered using an affine transformation. As for the mountainous areas with sharp elevation variations, anchor CPs are first identified, and then optical flow-based pixelwise dense matching is conducted. In the experimental section, ablation studies using four precisely co-registered optical-SAR image pairs of flat terrain quantitatively verify the effectiveness of the proposed SAR-PC-Moment-based feature point detector, big template matching strategy, and mutual verification-based outlier removal method. Registration results on four 1 m-resolution non-flat image pairs prove that the proposed framework is able to produce robust and quite accurate registration results.

Graphical Abstract

1. Introduction

Although the latest imaging sensors have been equipped with advanced positioning systems, the latitude and longitude information of the geocoded remote sensing images still contains inevitable errors [1,2,3]. Remote sensing image registration is the procedure to spatially align different images of the same region, which is unavoidable for any multi-time or multi-sensor remote sensing applications, such as change detection and image fusion. The optical and synthetic aperture radar (SAR) sensors are the two most important ways to obtain high-spatial-resolution imageries of the earth’s surface from a long distance, such as from a satellite. Also, they reveal distinct and complementary ground characteristics. Therefore, the combined use of them has aroused many concerns in academic circles [4,5,6], for which optical and SAR image registration is still a nontrivial issue that needs to be better resolved.
Current studies on optical-SAR registration, no matter the handcrafted methods [7,8,9,10,11,12,13,14,15,16,17,18,19] or the deep learning-based ones [20,21,22,23,24,25,26,27,28,29,30], mainly focus on dealing with the vast radiometric and geometric disparity problem, which makes it quite difficult to obtain sufficient reliable CPs that are sparsely distributed across the input image pairs. After the putative CPs are obtained, outlier removal and image warping are mostly conducted under the assumption that the geometric relationship between the input optical-SAR image pairs can be depicted by a linear equation, such as the affine or projective transformation. This linear assumption only holds for image pairs of flatlands. However, only a quite small percentage of the global landmass can be considered strictly flat. When the imaging area contains noticeable topographic fluctuations, two images acquired from different viewpoints will present unavoidable local geometric distortions. This distortion can be more serious for high-resolution optical-SAR image pairs due to the range-imaging nature of SAR sensors, which produces foreshortening and layover effects [31]. Also, the DEM (digital elevation modal) images used for the geometric calibration are usually of low spatial and elevation resolution. Several pixelwise dense registration approaches based on the optical flow technique have been proposed to deal with the local geometric distortion problem [32,33,34]. However, the pixelwise registration would have a high memory demand. It also fails either when the ground relief changes or when the initial displacement is too large, say more than 50 pixels.
In this article, we investigate the registration problem of large optical-SAR image pairs with non-flat terrains and high spatial resolution, for which the unified linear geometric relationship no longer holds, leading to great difficulty for not only the sparse feature point matching but also for the outlier removal and image warping processes. These are the two obstacles that make the current optical-SAR image registration frameworks unable to properly deal with images with non-flat terrains.
As for the sparse feature point matching issue, when the images to be co-registered are of flatlands, a small amount of sparse CPs is sufficient to acquire a good estimation of the affine or projective transformation. On the other hand, for non-flat terrains, much denser and sparser landmarks are required so that the geometric formula with a higher dimension or for each local area can be calculated. Many advantageous algorithms that generate homogeneous features from heterogeneous optical and SAR image pairs have been proposed for higher matching accuracy. Generally, they can be classified into two types, as shown in Figure 1.
The first type is the SIFT-like detection-then-description approach, as shown in Figure 1a, which tries to identify repeatable feature points from across the whole input image pairs and then putative correspondences are obtained based on the feature descriptor similarity measurement. In order to cope with the vast modal differences between the optical and SAR images, delicately designed feature point detectors and feature descriptors are proposed. For example, the ALGH method [7] uses the Harris–Laplace Sobel operator for feature point detection from the optical image and the Harris–Laplace ROEWA operator for the SAR image. Then, the GLOH-like descriptor is constructed using the amplitudes of multi-scale and multi-orientation log-Gabor responses. The OS-SIFT method [8] adopts a similar strategy by using two distinct Harris scale spaces to obtain consistent gradients from optical and SAR images for repeatable feature point detection. The RIFT method [9] makes use of the fact that the phase congruency (PC) maps of multiple image models share more structure information when compared with the intensity image. Therefore, both feature point detection and feature description are conducted based on the PC maps. In LNIFT [10], a local normalization filter in the spatial domain is proposed to initially narrow down the radiometric differences between the multi-modal images. Then, an improved ORB keypoint detector and a HOG-like descriptor are applied to the filtered images. Although the previous studies have made noticeable progress for the registration of optical and SAR images with flat terrain, they are likely to be inapplicable to the registration of non-flat terrains. Because the detection-then-description paradigm usually cannot produce sufficient amounts of repeatable sparse CPs from highly heterogeneous optical and SAR images. In addition, their outlier removal process relies heavily on the geometric constraints within the inlier CPs.
The second scheme to obtain sparse correspondences is the template matching technique, as shown in Figure 1b, which first applies the blockwise Harris (or Fast, ORB, et al.) corner detectors to the reference image to obtain an evenly distributed point set. Then, the correspondences on the sensed image are identified based on the template feature similarity measurement using the local searching strategy, assuming that the image pairs have been coarsely registered by the geo-information. For the research following this paradigm, the main effort is put into the template feature descriptor design or learning process so as to more reliably measure the feature similarity between the optical and SAR image templates. The representative handcrafted methods include MIND [11], HOPC [12], CFOG [13], SFOC [14], OS-PC [15,16], AWOG [17], HOPES [18], et al. For example, the MIND method uses the self-similarity theory to extract image structures that preserve across modalities. The HOPC and CFOG methods both use the pixelwise HOG-like descriptor to collect similar features from multi-modal images. The AWOG method uses the feature orientation index table to build the pixelwise descriptor. The SFOC combines first- and second-order gradient information by using steerable filters to obtain more discriminative structure features. The HOPES method extracts the primary edge structure using the Gabor filters and conducts an edge fusion algorithm to obtain shared features from optical and SAR images. In recent years, many deep learning-based methods have come out [20,21,22,23,24,25,26,27,28,29,30], where diverse kinds of Siamese or pseudo-Siamese convolutional neural network architectures are designed to learn shared features from optical and SAR images. In [27], the CNN feature extractor produces pixelwise deep features, which mimic the handcrafted method. The authors of [28] claim that both shallow and deep features should be incorporated into the feature matching process so as to not only get better feature discriminative ability but also finer feature location precision. Also, a self-adaptively weighted loss function is introduced to obtain better training result. In [29], three different CNNs are designed and trained for feature point detection, feature matching and outlier removal, respectively. In [30], a residual denoising network is incorporated into the pseudo-Siamese CNN to alleviate the influence of speckle noise on SAR images.
Since this template matching paradigm usually adopts the blockwise feature point detection strategy, we are able to obtain putatively sparse CPs as dense as we like. However, the high heterogeneity of optical and SAR images would definitely lead to a large number of outliers within the putative matches. The outlier ratio varies drastically for different landcover types, depending on the texture similarity and discernibility between the optical and SAR images to be co-registered. This leads to the second obstacle, outlier removal.
The outlier removal issue has been extensively researched in the fields of photogrammetry and computer vision. It is a critical pipeline for many applications, such as structure-from-motion (SfM) [35], simultaneous localization and mapping (SLAM) [36], multi-view stereo [37], visual odometry [38], and image registration [39]. Many different techniques and routes have been proposed. The RANSAC technique [40] randomly and repeatedly selects a small initial point set and enlarges this set by finding the inlier ones that are geometrically consistent with the set. Until now, RANSAC has been the most robust and widely applied method in remote sensing image registration research and applications. Numerous modified approaches have been proposed to increase the time efficiency and accuracy of the classical RANSAC, such as the maximum likelihood estimation sample consensus (MLESAC) [41] method, the least median of squares (LMEDS) method [42], and the fast sample consensus (FSC) method [43]. Note that the previous RANSAC-like approaches can only identify outliers under the assumption that all the inliers obey a unified linear spatial relationship (affine or projective transform), which can be depicted by a 3 × 3 matrix. In order to distinguish outliers when the linear geometric relationship does not hold, non-parametric and graph-based methods have been widely exploited.
The non-parametric methods define deformation functions in a high-dimensional form. For example, the coherent point drift (CPD) method [44] formulates the matching problem as the estimation of a mixture of densities utilizing Gaussian mixture models. The vector field consensus (VFC) method [45] models the movement consensus in the vector field, which operates in a vector-valued reproducing kernel Hilbert space. The graph-based methods are based on the assumption of geometric consensus among neighborhood inliers. For example, the grid-based motion statistics (GMS) method [46] identifies the inliers by checking if the adjacent ones are close to each other in both images. The locality-preserving matching (LPM)-based methods [47,48] assume that the inliers should preserve the spatial neighborhood relationship and structure. Although non-parametric and graph-based approaches can deal with non-linear situations and have been prevailingly applied in the computer vision field, they are rarely applied in the remote sensing image registration task. It is because they all require very dense, sparse correspondences and usually fail when inliers are distributed dispersedly [49].
Note that the majority of the earth’s surface is non-flat. Especially for the high-resolution optical and SAR image pairs, even slight elevation variations would produce noticeable local geometric distortion. However, the problem of large optical-SAR image registration of rough terrains has rarely been addressed in the current studies due to the low matching accuracy issue caused by the extreme radiometric and geometric disparity and also the difficulty of outlier removal caused by the spatially varying geometric relationships. This work tries to deal with these problems, with the main contributions as follows:
  • Under the template matching paradigm, we propose to use the phase congruency map of the textureless and noisy SAR image to obtain an evenly distributed point set, which guarantees that each feature point is surrounded by salient local structures that help to increase the matchability. The putative sparse correspondences on the optical image are acquired using the learned deep features drawn from a very large local image patch (641 × 641 pixels), which significantly increases the matching accuracy. Meanwhile, an adaptive search range is used under the local searching pipeline. In this way, we are able to get a collection of very densely distributed sparse CPs with a quite low outlier ratio.
  • An effective outlier removal and transformation estimation procedure is proposed for putative CPs that do not obey a unified geometric constraint. Firstly, taking advantage of the different mechanisms of sparse matching and optical flow-based dense matching, we propose a mutual verification-based outlier removal method. In this way, unreliable CPs are initially filtered out without any assumption of the geometric constraint. Secondly, we assume that, except for the mountainous area with extremely sharp elevation variations, most of the ground surface can be considered locally flat. A recursive RANSAC method is proposed to automatically cluster the CPs into different point sets, with each set located in a locally flat image area, which can then be co-registered using the linear geometric transformation. As for the mountainous areas, small subsets of inlier CPs are identified, which are used as anchor points, so as to preparatively remove the large positioning error of the mountainous areas for the subsequent optical flow-based image warping.
  • Extensive experiments are conducted to evaluate the effectiveness of the proposed sparse matching, outlier removal, and transformation estimation methods. The results show that the proposed sparse matching method produces a significant increase in matching accuracy, from about 30% to 100%. The subsequent mutual verification-based outlier removal strategy further filters out about 30% of the outliers. Also, compared with the other well-established methods, the proposed non-flat image warping process is able to produce both robust and accurate registration results for diverse landcover and landscape types.
The overall framework of the proposed optical-SAR image registration method is shown in Figure 2.

2. Methodology

2.1. Reliable Sparse Correspondence Identification

Since the image registration of non-flat terrains requires estimating multiple geometric relationships that are spatially varying, the registration accuracy relies heavily on the density of the sparse correspondences. Herein, we adopt the template matching paradigm to get the putative sparse correspondences, so as to let the user determine the density of CPs as desired.

2.1.1. Salient Sparse Feature Point Detection

It is considered that local image templates containing salient structures would be likely to produce higher matching accuracy. That is why current studies usually apply the Harris, FAST, or ORB feature point detectors to the optical image for sparse feature point detection. However, we think that the high response locations obtained by these Harris-like operators can only be considered ‘salient’ in a very limited local neighborhood, about 10 × 10 pixels for the normally applied parameter setting. It does not guarantee the saliency of the local image template, which is usually 100 × 100 to 200 × 200 pixels [11,12,13,14,15,16,17,18,19,20,21,22,23,24,25,26,27,28,29,30]. To this end, a deep learning-based feature point detector is proposed in [29], which uses a convolutional network to assess the ‘goodness’ of the local image patches for template matching. However, the experiment results present quite low matching accuracy—only 67% on a favorable dataset.
Inspired by the works in [9,50], which conduct feature point detection in the frequency domain, we find that the phase congruency information would reflect the local saliency of a much bigger receptive field, with hundreds of pixels of extent. Herein, we propose to use the phase congruency model for sparse feature point detection. As presented in [50], each local complex-valued Fourier component at the location  p = x , y  of the input 2D image would have an amplitude  A s p  and a phase angle  ϕ s p , where  s  stands for the index of the scale of the 2D log-Gabor filters. The phase congruency for each orientation  o  is defined as:
P C o p = s W o p A s o p cos ϕ s o p ϕ ¯ o p sin ϕ s o p ϕ ¯ o p T o s A s o p + ε
where  ϕ ¯ p  is the mean phase angle over all the scales,  W p  is a weighting function that penalizes frequency distributions that are particularly narrow, and  ε  is a small value to avoid division by zero.  T  is a threshold, with which an energy smaller than  T  would be considered noise. All the previous parameters are dependent on the rotation value, which is usually set as  i π / 6 ,   with   i = 0 ,   1 ,   2 ,   3 ,   4 ,   5 .
Hereafter, the phase congruency sequence of different orientations can be obtained as  P C o , then the moments of  P C o  can be calculated. As presented in [50], the magnitude of the maximum moment reflects the saliency of the local image features and can be used for salient feature point detection. The maximum moment is calculated as:
M P C = 1 2 c + a + b 2 + a c 2
where:
a = o P C o cos o 2 b = 2 o P C o cos o P C o sin o c = o P C o sin o 2
Note that SAR images are usually texture-less when compared with their optical counterparts. Conducting feature point detection on the optical image would face the risk that the corresponding SAR local image template contains no salient features. Hence, in this study, we conduct the feature point detection process on the SAR image, termed the SAR-PC-Moment detector, and then apply the local searching strategy to locate the correspondences on the optical image.
Specifically, the phase congruency sequences  P C o  and then the maximum moment map  M P C  of the input SAR image are calculated. Hereafter, the blockwise FAST feature point detector is applied on the  M P C  to identify the locations with salient local features. The density of the feature points can be controlled by the block size of the FAST detector. We experimentally found that selecting one salient feature point for each non-overlapped 64 × 64 sized block would be effective for the image registration of non-flat terrains.

2.1.2. Putative Sparse Correspondences Generation

The accuracy of the template matching result relies heavily on the discriminability of the extracted feature descriptors. Herein, we choose to construct the pixelwise dense feature volumes from the local image templates, which have been prevailingly researched in recent years [12,13,14,15,16,17,18,27,28]. As shown in Figure 1b, for a  M × M  sized template  I r e f  drawn from the location of a feature point detected using the SAR-PC-Moment, a  1 × K  sized feature vector is produced for each pixel, leading to a  M × M × K  sized reference feature volume  V r e f . Similarly, for the bigger search patch  I s e n  collected from the same geo-location of the sensed image, the feature volume  V s e n  sized of  N × N × K  can be obtained, where  N > M . Hereafter, the calculation of the sum of squared differences (SSD) between  V r e f  and  V s e n  is conducted, resulting in a similarity score map  S  sized of  ( N M + 1 ) × ( N M + 1 ) , which indicates the location of the corresponding feature point.
As for the pixelwise feature construction, although many advanced handcrafted or deep learning-based methods have been proposed, they hardly pay attention to finding a proper template size for blockwise feature matching. As mentioned previously, the template is always set as 100 × 100 to 200 × 200 pixels, mostly as 128 × 128 pixels. However, we think that the template size is essential here. It is because, unlike SIFT-like descriptors, which collect image features from nearby pixels with a fixed extent, the feature volumes used for template matching can be collected from an arbitrary extent size. A larger extent would bring in more information into the feature volumes, but also more interference.
In order to decide the proper template size, an elaborate experiment is conducted using 4 pairs of large optical and SAR images of flatlands, which are described in our previous research [28] and have been precisely co-registered using the half-manual method [23]. Image templates of different sizes, {97 × 97, 225 × 225, 353 × 353, 481 × 481, 609 × 609, 737 × 737}, are evenly collected from the large input optical-SAR pair with a fixed step size. The matching accuracy is defined as the ratio of the image templates that present a matching displacement error smaller than a fixed threshold  t . The widely applied handcrafted method CFOG [13] and the learning-based network OSMNet [28] are, respectively, used to conduct the template matching process.
From the experiment results shown in Figure 3, a surprising conclusion can be drawn: a bigger template size helps to increase the matching accuracy by a remarkable margin; the increases range from 30% to 100%. We assume that a larger template size brings in more homogenous features, which overrides the increased amount of interference, such as possible ground relief changes. In addition, increased template size is favorable not only for matching accuracy but also for matching precision, since the correct matching rate increases for both  t 2  and  t 1 . Although the matching of a larger template requires more computational cost, it is quite appealing to the registration problem of non-flat terrains, considering the requirement for denser, sparser correspondences as well as the difficulty of outlier removal when the inliers do not follow a unified geometric relationship.
Herein, we propose to use a large template size for block-wise dense feature matching. Specifically, the template size  N  is set as 641 × 641 pixels. Although the experiment results shown in Figure 3 indicate that a bigger template would further increase the matching accuracy, we think that the increase in margin is modest, but it brings in more computational cost. Furthermore, the experiment results shown in Figure 3 are obtained using image pairs of flatland, where the local geometric distortion between optical and SAR images is not significant. While it is not the case for images of non-flat terrains, for which the matching performance is likely to decline when the template size is too large.
As can be seen from Figure 3, the OSMNet outperforms the handcrafted CFOG method by a significant margin, although the network is trained only on a small dataset, the OSDataset, which is publicly available [51]. Therefore, in this study, we use the OSMNet, which was proposed in our previous work [28], for spare feature point matching. Here is a brief review of this network. Specifically, the OSMNet consists of two branches of fully convolutional networks with identical structures but distinct network parameters, which separately extract pixelwise deep-dense feature volumes  V r e f  and  V s e n  from the SAR and optical template images. The similarity score map  S  is estimated based on the SSD index:
S u , v = x , y V r e f x , y V s e n x u , y v T u , v 2
where  T  is the template window that has the same size with  V r e f . The SSD calculation can be conducted in the Fourier domain for acceleration:
S = F 1 F * V r e f F V r e f T 2 F 1 F * V r e f F V s e n T
By incorporating an effective multi-level feature fusion method, a novel multi-frequency channel attention module, and a self-adaptive weighting loss function, the OSMNet outperforms several representative handcrafted or deep learning-based optical-SAR image matching methods. The detailed information can be seen in [28].
Another important parameter for the template matching process is the search range. In our subsequent experiment, the 1 m-resolution GaoFen-3 SAR images and the Google Earth optical images are used. As presented in [16], the relative positioning error of the GaoFen-3 SAR ranges from 20 pixels to 200 pixels. However, setting the search range at 200 pixels is not sufficient for non-flat terrains, especially in mountainous areas. It is because when the elevation varies drastically, the local geometric distortion caused by different view angles and the foreshortening effect of SAR sensors would lead to additional positioning errors of hundreds of pixels.
Instead of directly taking a very large search range value, which would lead to a large amount of computational cost, we propose to determine the search range based on local elevation variation. Based on the SAR imaging geometry, the relative positioning error  E h  caused by elevation error  h  can be estimated as:
E h = h tan π θ
where  θ  is the incident angle.
Herein, we define the elevation adaptive search range as:
s r a = s r min + α 1 h mean h h std tan π θ
where  h mean  and  h std  are the mean and standard deviation of the 30 m-resolution DEM map, which can be downloaded freely from the internet.  s r min  is the user-defined minimum search range,  α  is a coefficient set at 2.5 in this study.

2.2. Outlier Removal and Transformation Estimation

By adopting the previous strategy that used very large template images for sparse feature point matching, the matching accuracy has been remarkably increased. However, there are still plenty of outliers hidden in the putative sparse correspondences, ranging from 7% to 30% for the specific datasets shown in Figure 3, when the mismatch threshold  t  is set to 2 pixels. The outlier ratio would further increase for images of non-flat terrains due to severe local geometric distortion. Furthermore, since the geometric relationship is spatially varying, both the outlier removal and the transformation estimation processes would be quite tricky. In this article, we propose an initial outlier removal method based on mutual verification so as to further reduce the outlier ratio. Then a recursive RANSAC strategy is proposed. It automatically segments the input image into dozens of locally flat areas, which can be co-registered using the linear geometric transformation. For mountainous areas with sharp elevation variations that cannot be considered locally flat, small subsets of CPs are identified based on local RANSAC, which are then used as anchors for the optical flow-based pixelwise image matching.

2.2.1. Initial Outlier Removal Based on Mutual Verification

For the template-matching-based method, the similarity between each CP is determined by the cumulated feature distance of the whole local optical and SAR image template. On the other hand, the dense matching method, which is usually performed using the optical flow technique, can also estimate the displacement value between the corresponding feature points. Different from the cumulated feature similarity of the whole image template, the dense matching process relies on the pixelwise feature similarity as well as the smooth assumption of the displacement maps. Therefore, it is better at preserving the intrinsic uncertainties to obtain a robust but less precise result. Since the two approaches accomplish the image matching task from distinct perspectives and use different image characteristics, we propose to initially remove the outliers based on the consistency of the matching results produced by the two different approaches.
Specifically, for each feature point  p  on the SAR image, its correspondence feature point on the optical image is first obtained by the template matching approach using the OSMNet, termed as  q s . Then, two local small patches surrounding  p  and  q s  are cut from the SAR and optical images, respectively, termed as  J S  and  J O . The dense matching is conducted on  J S , J O  using the OSFlowNet, which is a learning-based optical-SAR flow framework proposed in our previous research [34], resulting in the pixelwise displacement map  F . The 2D displacement vector of the central pixel  p  can be obtained from  F , termed as  f x p , f y p . If the template-based sparse matching is successful, the dense matching result would also be valid with a high probability, considering that the probable large initial displacement has been removed by the sparse matching process. In this case,  f x p , f y p  should ideally equal to  0 ,   0 . Herein, we consider  p ,   q s  as outliers if:
f x p 2 + f y p 2 > t sd
In the subsequent experiments, we set  T sd = 7  pixels. Note that a large value of  t sd  is necessary so as to identify the obvious outliers and, at the same time, protect the inliers from being mistakenly treated as outliers. The proposed mutual verification-based outlier removal method requires no geometric assumption within the inlier CPs and is therefore especially appropriate for the non-flat image registration problem.
Furthermore, we experimentally find that a multiple mutual verification process is able to produce a very reliable CP set, which can be taken as the pseudo-ground truth (P-Gt) CPs for quantitative evaluation of the registration result. Specifically, the template matching process is conducted not only with a very large template size, which is 641 × 641 pixels in this study, but also with two smaller template sizes, say 513 × 513, and 385 × 385 pixels. In this way, 3 template matching results are obtained using different image scales. By conducting a multiple mutual verification process within the 3 sparse matching results and 1 dense matching result, the P-Gt set is obtained. Specifically, a CP is considered pseudo-ground truth only when the sparse matching results of the 3 scales are exactly identical with each other, also  f x p 2 + f y p 2 1  pixel.
Here is a brief introduction to the deep learning-based OSFlowNet proposed in our previous work [34]. It uses a two-branched pseudo-Siamese network for optical and SAR pixelwise feature extraction and then produces a 4D correlation volume for feature similarity measurement. The optical flow field is estimated based on the GRU (gated recurrent unit). Compared with the handcrafted approaches, OSFlowNet shows a significant performance increase. The detailed information can be seen in [34].

2.2.2. Locally Flat Area Identification and Image Warping

Although the images to be co-registered are of rough terrains, many areas can still be considered locally flat, to a small or large extent, depending on the local elevation variations. Herein, we propose a CP clustering process based on a recursive RANSAC strategy. This process clusters the putative CPs into dozens of subsets. If the CPs from one subset obey a unified linear geometric relationship, they are considered to form a locally flat area. Specifically, after the initial outlier removal procedure, the resulting putative CP set, termed as  C P 0 , is considered the input of the recursive RANSAC algorithm, as shown in Algorithm 1:
Algorithm 1: Recursive RANSAC
Input: the putative CP set  C P 0
Output: the CP subsets  C P k k = 1 , 2 , K  of  K  locally flat areas, and the remaining CP set termed as  C P rem .
(1)
k = 1 C P rem =
(2)
while 1
(3)
Use the RANSAC algorithm to find the largest geometric consensus CP set from  C P 0 , termed as  C P h , with the RANSAC threshold set as 3 pixels.
(4)
Segment the point set  C P h  into  L  subsets using the point clustering algorithm based on the Euclidean distance. The subsets are termed as  C P l l = 1 , 2 , L
(5)
for  l = 1 : L
(6)
if  cardinal C P l 8
(7)
C P k = C P l k = k + 1
(8)
else  C P rem = C P rem + C P l
(9)
end if
(10)
end for
(11)
C P 0 = C P 0 C P h
(12)
if  cardinal C P 0 5  do
(13)
C P rem = C P rem + C P 0
(14)
break
(15)
end if
(16)
end while
Except for the first RANSAC iteration, whose input is the whole putative CPs  C P 0 , the input of each RANSAC iteration is obtained after subtracting the output of the previous RANSAC iteration  C P h  from  C P 0 , as shown in Line 11 of Algorithm 1. We can see that each RANSAC iteration would identify a geometric consensus set  C P h . However, the CPs in  C P h  would probably be located in separate parts of the input image, as shown in the upper row of Figure 4. It is because the RANSAC algorithm is conducted on CPs that are collected from the whole large input image with complex terrain. The inlier CPs that are located at the same elevation level, although they may be separated by hills, will always gather together in one RANSAC iteration. In this case, we propose to cluster the CPs into separate subsets based on the Euclidean distance, with the distance threshold set at 500 pixels, as shown in the lower row of Figure 4. In each subset, if the number of CPs is smaller than 8, the local geometric consistency assumption is not reliable, therefore they are reserved in the  C P rem  set.
For each CP subset  C P k , which is composed of more than 8 CPs that follow a unified geometric relationship and are also located nearby, the continuous area within the bounding polygon of the CPs are considered a locally flat area. In this way, a sequence of locally flat areas with different extent values is identified, termed as  A k k = 1 , 2 , K . In addition, an image dilation operation can be conducted on each area to enlarge it by a proper margin. Hereafter, each locally flat area  A k  can be co-registered by calculating the pixelwise displacement using the linear affine transformation, which is estimated using  C P k . Note that the previous recursive RANSAC process used a relatively large threshold of 3 pixels. In this transformation estimation step, an additional RANSAC process is conducted on  C P k  with the threshold set at 2 pixels.

2.2.3. Non-Flat but Matchable Area Identification and Image Warping

Note that Algorithm 1 does not conduct any outlier removal operation but just clusters the input CP set into a sequence of inlier subsets  C P k k = 1 , 2 , K  that are considered to be located in locally flat areas, as well as the remaining CPs, termed as  C P rem . Firstly, as for each CP in  C P rem , if it is located in any flat area of  A k k = 1 , 2 , K , it is considered an outlier and then removed from  C P rem . Hereafter, the  C P rem  would be composed of the outliers as well as potential inliers that are located in mountainous areas that exhibit sharp elevation variations, which makes it nontrivial to distinguish the inliers from the outliers. The optical flow-based dense matching approach is effective for the registration of non-flat images, but only when the initial displacement is small, say less than 50 pixels, as presented in [34]. However, this constraint is particularly difficult to meet for rough terrains since bigger elevation variations would produce larger positioning errors, as presented in Equation (6).
In order to make sure that the non-flat area can be co-registered reliably using the optical flow technique, it would be necessary to obtain the anchor CPs beforehand, which are used to reduce the initial displacement value to a limited range. To this end, we assume that the inliers that are located in the mountainous area should still contain a subset that follows a relaxed geometric consensus. Herein, we do not try to identify all the inliers from  C P rem , but only small inlier subsets that can be used to roughly estimate the initial displacement value before conducting the optical flow-based image warping process. Specifically, the input image is divided into 512 × 512 sized blocks with an overlap of 50%. The CPs from  C P rem  located in each block are gathered together, termed as  C P i b i = 1 , 2 , N , where  N  is the total number of blocks that contain more than 8 CPs. Hereafter, the RANSAC algorithm is conducted on each  C P i b  with a very loose threshold as 4 pixels. Then the largest geometric consensus subset  C P i c  can be identified, with  C P i c C P i b . If the consensus subset contains more than 6 CPs, that is  cardinal C P i c 6 , the  C P i c  is considered the anchors of this local area, which are used to estimate the initial displacement value. Specifically, assume  C P i c = ( p l , q l ) l = 1 , 2 , L , then the initial displacement value is calculated as:
D = l = 1 L ( q l p l )
where  p l = x l , y l  denoted as the feature point on the reference image block, and  q l = u l , v l  denoted as the corresponding feature point on the sensed block,  L  is the number of anchor CPs.
Although the anchor CP sets are identified by small image blocks sized at 512 × 512 pixels, the matchable area should be determined by the elevation variation in the local region surrounding each anchor point. Herein, for each anchor CP set  C P i c , its matchable region mask is obtained by:
Mask l = H H p l H T Mask = l = 1 L Mask l
where  H  is the elevation map of the local area,  H T  is a predefined threshold of elevation variation. Hereafter, the deep optical-SAR flow network OSFlowNet, is used to estimate the pixelwise displacement of the local matchable area.
By combining the displacement map of the non-flat but matchable areas with that of the locally flat areas, the final registration result is obtained. At this point, there are probably still some image areas that have not been co-registered. It is because no reliable anchor CPs are identified at these locations. This situation happens mostly in mountainous terrains that are composed of pure natural landcover, such as forest, grass, or bare rocks, which exhibit repeatable texture or texturelessness. Directly applying the OSFlowNet to these areas would face a high risk of producing the wrong registration result. Nevertheless, registration of mountainous areas with pure natural landcover is unnecessary for most of the high-resolution remote sensing image applications.

3. Experiments and Evaluations

Extensive experiments are conducted to evaluate the performance of the proposed optical and SAR image registration frameworks for non-flat terrains. The datasets and the evaluation metrics are first introduced, followed by an ablation study that quantitatively evaluates the effectiveness of the proposed SAR-PC-Moment-based sparse feature point detector, the big template-based sparse matching strategy, as well as the mutual verification-based outlier removal method. Finally, based on four large optical and SAR image pairs with non-flat terrain, the registration results after CP clustering, further outlier removal, and image warping are presented and evaluated qualitatively and quantitatively.

3.1. Dataset Description and Evaluation Metrics

Four pairs of large optical and SAR imageries with 1 m spatial resolution are used to evaluate the proposed method, where the optical images are collected from the Google Earth platform and the SAR images are obtained by the GaoFen-3 satellite. The corresponding DEM images are also obtained from the Google Earth platform, with a 30 m spatial resolution. The detailed information is shown in Figure 5 and Table 1. The four image pairs, termed 1-Yanliang, 2-Beijing, 3-Zhengzhou, and 4-Chengdu, exhibit increasing elevation variations, considering the growing standard deviation (STD) values as shown in Table 1. The incident angles presented in the last column are used to estimate the elevation adaptive search ranges based on Equation (7), where the influence of the geo-location error between the 30 m-resolution DEM and the 1 m-resolution SAR images is negligible.
Other than the previous datasets with highly variable terrain, we also introduce four optical-SAR pairs with flat terrain. They are used to quantitatively evaluate the proposed method, considering that it is difficult to obtain the ground truth registration results of the non-flat datasets shown in Figure 5 and Table 1. Actually, the flat terrain datasets have already been used to produce the experiment results shown in Figure 3. They are the first four image pairs introduced in our previous research [28], termed 1-SH, 2-ZZ, 3-BJ, 4-XS. More detailed information can be found in [28].
In order to quantitatively evaluate the proposed method, we use the matching ratio (MR) in terms of the ratio of inlier CPs under a predefined displacement threshold  t , the number of inliers (NI), and the root mean square error (RMSE) as the metrics.

3.2. Ablation Study

In this subsection, the four image pairs of flat terrain are used to quantitatively evaluate the performance of the proposed feature point detection, matching, and initial outlier removal methods.

3.2.1. Evaluation of the Sparse Feature Point Detector

We first compare the SAR-PC-Moment detector with the widely applied Harris detector as well as the naive method by taking the points with a fixed interval space as the feature points. Specifically, for each non-overlapped image block sized at 64 × 64 pixels, the point location that presents the biggest SAR-PC-Moment or Harris response is considered the feature point. Note that the proposed SAR-PC-Moment detector is applied to the SAR image, while the Harris detector is applied to the optical image. Furthermore, the center point of each 64 × 64 sized SAR block is also collected to compose the naive feature point set. For each feature point, the correspondence is obtained using the OSMNet, with the template size set at 225 × 225 pixels. The matching results in terms of MR with the displacement error (termed as  t ) smaller than 1 pixel are shown in Table 2.
We can see that, compared with the Harris detector, the SAR-PC-Moment detector helps to increase the MR by a noticeable margin, especially for the 2-ZZ and 3-BJ datasets, where the optical-SAR pairs exhibit a larger discrepancy, leading to lower MR results. It is worth noting that the Harris set does not always outperform the naive feature point set due to the fact that a high response within a very limited local neighborhood would not guarantee a higher matching accuracy for template matching.

3.2.2. Evaluation of the Sparse Matching Method

As for the evaluation of the sparse matching results, an extensive comparative experiment has been presented in Figure 3, where we can see that the matching accuracy continues to increase as the template size increases, no matter if the handcrafted or learning-based method is used, which proves the effectiveness of the proposed big template matching strategy. Figure 3 also reveals that the learning-based OSMNet outperforms the handcrafted CFOG method by a significant margin. In the subsequent experiments, the OSMNet is used for sparse feature point matching.
Herein, the big template matching results using the OSMNet are compared with two representative detection-then-description methods, the RIFT and the LNIFT. The matching ratio and the number of inliers are presented in Table 3. We can see that the LNIFT method is able to produce more inlier CPs when compared with the RIFT method, although with a lower matching ratio. This performance increase is brought about by a simple local normalization filtering process conducted on the optical and SAR images, respectively, before the feature point detection and feature matching processes. On the other hand, the proposed big template matching result using OSMNet significantly outperforms the RIFT and LNIFT methods in terms of both the matching ratio and the number of inliers.
Note that for the RIFT and the LNIFT methods, if the whole image pair of large size is directly used as the input of the feature point detection-then-description paradigm, it will produce very poor matching results. Therefore, for the experiment shown in Table 3, we divide the input large image pair into 512 × 512 sized small patches with an overlap of 128 pixels. We also conducted an additional experiment by dividing the input into 1024 × 1024 patches, resulting in a significant performance decline. Specifically for the 1-SH image pair, the inlier number of the RIFT method decreases from 3745 to 648. For the 2-ZZ image pairs, it decreases from 489 to 70. In addition, a smaller local patch, such as 256 × 256 pixels, would not further improve the performance. Especially for real image registration applications, the initial displacement error could be more than 200 pixels. In this way, a small patch size would lead to a very low ratio of overlapped area between the corresponding patch pairs, which further damages the sparse matching results. Also, the matching ratio results for RIFT and LNIFT shown in Table 3 were obtained after conducting the RANSAC outlier removal process on each local patch. The matching ratio would be extremely low if RANSAC were not used. On the other hand, for the proposed method, the experiment results shown in Table 3 are before the RANSAC process.

3.2.3. Evaluation of the Mutual Verification-Based Outlier Removal Method

In Section 2.2.1, a novel initial outlier removal method is proposed by examining the consistency between the sparse matching and the dense matching results. Table 4 presents the experiment results for the four co-registered flat image pairs. We can see that the initial outlier removal process was able to filter out about 30% of the outliers for the four datasets. At the same time, only a very small percentage of the inliers are mistakenly identified as outliers, which is less than 1% for the first three datasets and 3.85% for the fourth dataset. Note that the proposed outlier removal process does not require any geometric consistency assumption; therefore, it is very effective for images of non-flat terrains, acting as a preparatory step to reduce the outlier ratio.
Furthermore, by applying a stricter restriction on consistency within three multi-scale sparse matching results and one dense matching result, we are able to obtain a pseudo-ground truth (P-Gt) CP set that can be used to quantitatively evaluate the final image registration result. For the four image pairs of flat terrain, the CP number of the P-Gt set and matching accuracy in terms of MR under different threshold  t  are presented in Table 5. For each dataset, the CPs in the P-Gt set all exhibit a matching error smaller than 5 pixels, with a majority of them smaller than 1 pixel and more than 93% smaller than 3 pixels. Furthermore, these CPs are distributed quite evenly across the whole image, as shown in Figure 6. This experiment result proves the effectiveness of the proposed P-Gt generation method, which is fully automatic and requires no human assistance. Therefore, it is very meaningful for the quality supervision of the registration results when a huge number of remote sensing images are involved.

3.3. Registration Results Evaluation

In this subsection, the four non-flat optical-SAR pairs shown in Figure 5 and Table 1 are used to evaluate the effectiveness of the proposed registration framework. The initial sparse matches are first obtained using the SAR-PC-Moment-based feature point detector and the big template matching method using OSMNet. Then the initial outlier removal and pseudo-ground truth generation based on sparse and dense mutual verification are performed. Herein, for each optical-SAR image pair to be co-registered, we obtain a putative CP set as well as a P-Gt set. The detailed information is shown in Figure 7, where the yellow dots are the putative CPs and the red dots are the P-Gt CPs. We can see that the CP density of the mountainous area is noticeably lower than that of the flat area, caused by fewer salient features and more local geometric distortions. Hereafter, we first try to conduct the registration using the classical procedure. Then the registration results using the proposed framework are presented.

3.3.1. Registration Using the Classical One-Pass Procedure

First of all, the classical and still widely applied [7,8,9,10,11,12,13,14,15,16,17,18,19,20,21,22,23,24,25,26,27,28,29,30] remote sensing image registration procedure is used to co-register the four non-flat datasets. It is a one-pass procedure that first removes the outliers using the RANSAC method and then warps the sensed image using the single linear transformation. Herein, the RANSAC threshold is set to 2 pixels, and the affine transformation is used. The registration result is measured using the P-Gt CPs in terms of the RMSE and MR index, as shown in Table 6, where the ‘RMSE before’ is the matching error before registration. We can see that the classical one-pass registration procedure is able to eliminate the majority of the RMSE. However, the residual RMSE is still very large, and a large percentage of P-Gt CPs present a displacement error of more than 5 pixels. We assume that the classical procedure can be used as a coarse registration procedure, but the registration accuracy cannot meet the requirements of the subsequent applications.
Herein, we check the inlier CPs after the RANSAC process, as shown in Figure 8, where the red dots are inliers and the yellow dots are outliers. Apparently, only a small subset of inliers are reserved after the RANSAC outlier removal process, caused by the fact that the putative CPs across the whole input image pair do not follow a unified geometric constraint. This observation inspires us to conduct a recursive RANSAC process. Instead of trying to remove the outliers, the main purpose of the proposed recursive RANSAC is to cluster the putative CPs and therefore automatically segment the large non-flat input images into dozens of locally flat areas.

3.3.2. Registration Using the Proposed Method

The proposed registration procedure consists of two steps: using the linear affine transformation for the registration of locally flat areas and the optical flow method for mountainous areas. The registration results for locally flat areas are shown in Table 7. We can see that the majority of the input optical-SAR pairs have been identified as locally flat, especially for the 1-YanLiang, and 2-Beijing datasets. When compared with the registration results of the classical one-pass method shown in Table 6, the matching ratio of the proposed framework is quite high, with about 50% of the P-Gt CPs presenting a displacement error smaller than 1 pixel, more than 90% smaller than 3 pixels, and more than 97% smaller than 5 pixels. The RMSE error after the registration is reduced to the range of 1.16 to 1.65 pixels, which is acceptable for most of the subsequent optical-SAR fusion applications.
Since the four experimental image pairs are all geocoded with the same spatial resolution, the scale and rotation distortions between the corresponding locally flat areas would be quite slight. Herein, we only examine the distribution of the shift values of each affine transformation, as shown in Figure 9. The affine transforms are 40, 67, 176, and 101, respectively, for the four non-flat datasets. We can see that, even for the most ‘flat’ 1-Yanliang dataset, whose maximum elevation variation is merely 40 m, the shift values in the x-direction still vary from −150 m to −48 m, and in the y-direction vary from −17 m to 48 m. As for the other three datasets, the shift variation could be more than 300 m. This result further verifies the fact that a single linear transformation is not capable of depicting the geometric relationship for image pairs of non-flat terrain.
Following the detailed procedures presented in Section 2.2.3, several anchor CP sets are obtained to identify the matchable mountainous areas and calculate the corresponding initial displacement value. Then the OSFlowNet is used to obtain the pixelwise displacement maps of these matchable areas. After combining the displacement maps of the locally flat areas, the final registration result is obtained. The mosaic images are shown in Figure 10, where the areas within the yellow boundaries are co-registered by OSFlowNet while the others are co-registered by locally affine transformations. Since only one or two P-Gt CPs can be found in the mountainous areas, their registration quality is evaluated only by visual inspection, as shown in the last subimages of Figure 11, Figure 12, Figure 13 and Figure 14.
Note that there are still many “black” regions that are not co-registered, especially for the 3-Zhengzhou and 4-Chengdu datasets, which are 17.1% and 28.7% of the whole image, as shown in the last column of Table 7. After checking the DEM images, we can see that these un-co-registered areas are all mountainous and textureless, where no reliable CP is identified to reduce the initial displacement value for the optical flow-based registration.
Figure 11, Figure 12, Figure 13 and Figure 14 present the enlarged subimages of the registration results, where the first five are in the locally flat areas. We deliberately select the locations on the boundary sides of the input large image, where a bigger matching error usually occurs when compared with the central area. We can see that diverse land cover types are aligned with fine precision, such as roads, highway overpasses, buildings, and farmlands. Specifically, some of the foothill areas, such as Figure 11d, Figure 12e, Figure 13b,c and Figure 14c, also present good registration accuracy. As for the last subimages of Figure 11, Figure 12, Figure 13 and Figure 14, which show the registration results of rough terrains based on the optical flow method, some noticeable registration errors can be observed. For example, the bridge shown in Figure 11f presents a matching error of about 3 pixels, although the roads on both sides of the river are precisely co-registered. Also, some roads shown in Figure 13f present a matching error of about 2 pixels. These mismatches are mainly caused by the abrupt elevation variation, which makes the optical flow map not conform to the prior smoothness. As for Figure 12f and Figure 14f, which are both typical textureless landcover, even visual inspection cannot tell the registration performance.

3.3.3. Comparison with Other Registration Methods for Images with Non-Linear Transformation

As mentioned previously, almost all the current studies, from references [7,8,9,10,11,12,13,14,15,16,17,18,19,20,21,22,23,24,25,26,27,28,29,30], use the one-pass procedure presented in Section 3.3.1 for the optical-SAR image registration. Some non-linear transformation estimation methods are occasionally used for the registration of single-modal optical–optical or SAR–SAR images. The most well-established ones include the local affine method based on the triangulated irregular network (TIN) structure [52,53,54,55], as well as the non-rigid registration method using the coherent point drift (CPD) algorithm [44,56,57]. The reason that they are usually not applied to the optical-SAR image registration is that, when compared with optical–optical image pairs, the sparse feature point matching accuracy of optical-SAR images is too low for a robust non-linear registration. On the other hand, this article is able to obtain a CP set with a low outlier ratio. Herein, we use the TIN local affine and non-rigid CPD methods as comparisons with our proposed method. The registration results in terms of RMSE are shown in Table 8, where the P-Gt CPs are used for the quantitative evaluation. Note that for these two comparative methods, the input CPs are the ones after the mutual verification-based initial outlier removal process is performed. The essential step for the TIN local affine method is to further identify and remove the outliers, while the CPD method is based on probability theory and is tolerant of a low outlier ratio. Furthermore, we use the OSFlowNet for the registration of not only the mountainous area but also the locally flat regions, and we present the RMSE result in Table 8.
We can see that the TIN local affine method obtains good registration accuracy for the 1-Yanliang and 2-Beijing datasets. However, it fails to register the 3-Zhengzhou and 4-Chengdu datasets, which present more severe elevation variations, leading to incorrect outlier removal results. On the other hand, the non-rigid CPD method, although it does not include any outlier removal steps, produces surprisingly good registration results, especially for the first two datasets. Still, the proposed method is more accurate for the last two image pairs. The OSFlowNet method is also able to produce acceptable registration results for all four datasets, but with lower registration precision. Note that the successful registration of the non-rigid CPD and the OSFlowNet methods both highly rely on the low outlier ratio of the putative sparse matches, which is achieved by our proposed sparse matching method.
Finally, the computation time of different registration methods is presented in Table 9. We can see that the one-pass method is the most time efficient, but the registration accuracy is not satisfying. As for the three methods that produce good registration results, the proposed method is averagely 45% faster than the non-rigid CPD method and 30% faster than OSFlowNet. In addition, as shown in column 3 of Table 9, the sparse matching process is also quite time consuming, since we use a very large template size to produce highly reliable and densely distributed sparse matches. Specifically, for a large input optical-SAR pair sized at 10,000 × 10,000 pixels, the sparse matching process takes about 30 min.

4. Discussion

For the registration of remote sensing images with complex terrain, the essential problem is to obtain a set of reliable, sparse corresponding feature points that distribute evenly and densely across the input image and also present a low outlier ratio. Owing to the proposed SAR-PC-Moment-based feature point detector and especially the big template matching strategy, the outlier ratio of the putative sparse matches is reduced from more than 50% to less than 30%. The proposed mutual verification-based outlier removal method further filters out about 30% of the outliers, therefore reducing the outlier ratio to less than 20% in general. This result is very meaningful for the subsequent geometric relationship estimation procedure. Based on the proposed recursive RANSAC method, the input large image is automatically segmented into locally flat and non-flat areas, and different registration strategies are applied to the two different landscape types. In this way, a very robust registration result can be obtained, with higher matching precision for flat regions and a relatively bigger matching error when local topographic fluctuation exists.
The proposed registration framework can be applied not only for optical-SAR images but also for any image types that exhibit spatially varying geometric relationships, such as high-resolution optical–optical, SAR–SAR, optical–LIDAR image pairs. Therefore, it is able to act as a reliable technique for supporting information fusion applications using multi-time and multi-modal remote sensing images of various landscape types.
Still, there are shortcomings and unsolved problems. Firstly, the time consumption of sparse matching is quite high since very large image templates, sized at 641  ×  641 pixels, are used for sparse matching. This time consumption can be reduced by decreasing the intensity of the sparse feature points, but it would probably result in a higher registration error. Secondly, as shown in 
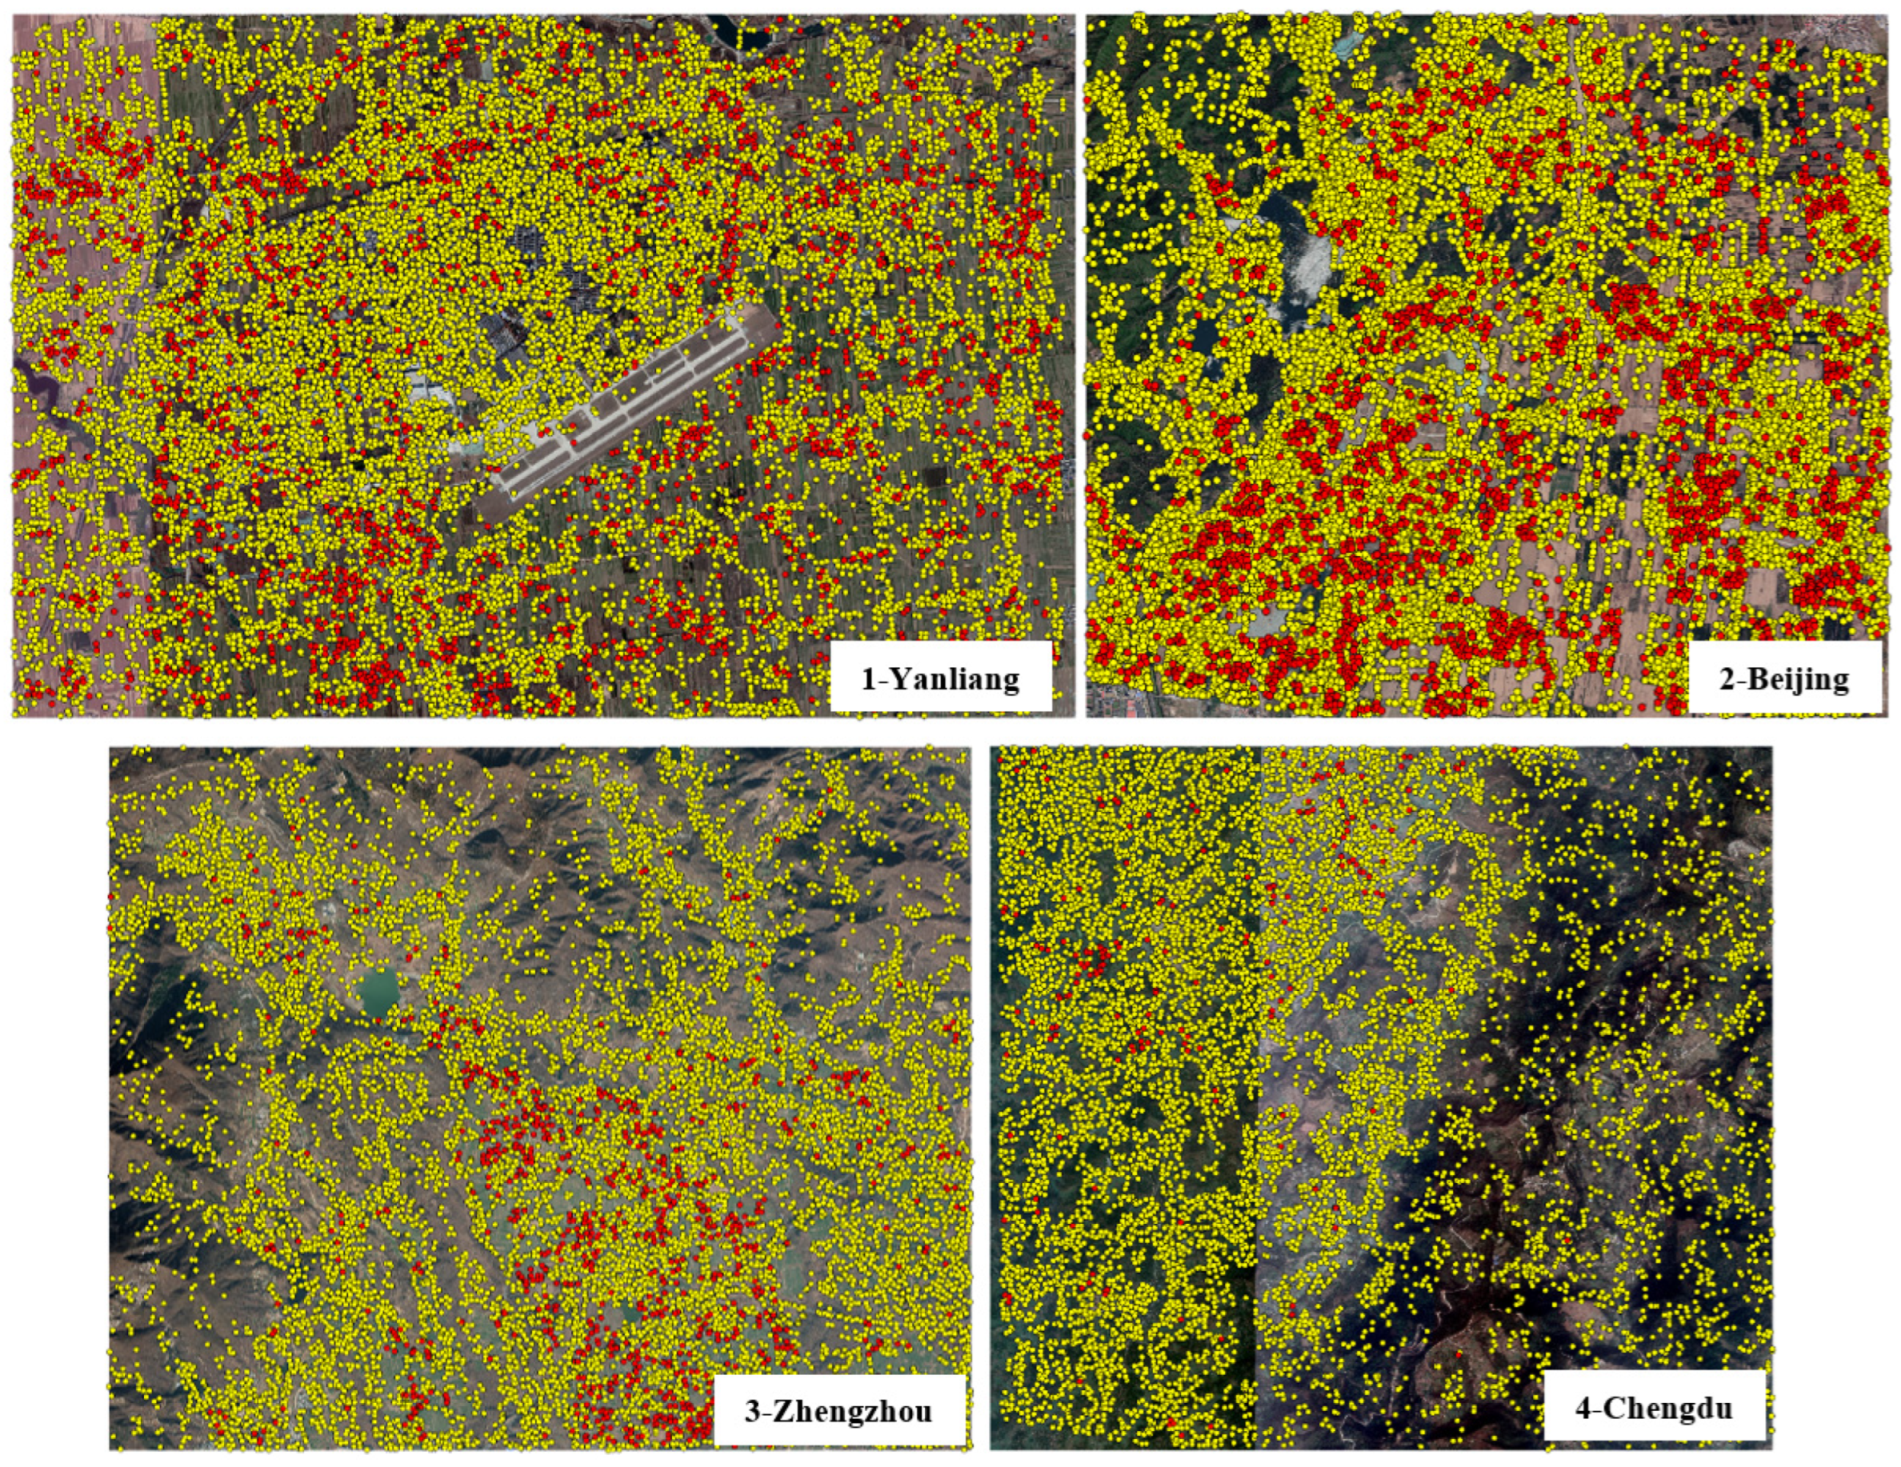
Table 8, the non-rigid CPD method is able to produce better registration accuracy for the first two datasets, which are composed of more flat terrains, as shown in Figure 5. This result indicates the potential to further improve registration accuracy by combining the conception of probabilistic non-rigid registration with the proposed method, as long as densely distributed sparse matches with a low outlier ratio are obtained beforehand. The third problem is that there are still many image areas of mountainous terrain unregistered, due to the lack of reliable sparse matches caused by the extreme local geometric distortions. In [58], a geometric registration approach using the DEM or DSM is proposed, which remaps the central perspective projection of the optical sensor into the side-looking mechanism of the SAR sensor. However, this method requires high geo-location accuracy for both the optical and SAR imaging systems as well as precise DEM or DSM information, which are all hard to get. The registration of optical and SAR images of mountainous areas is still an open question.

5. Conclusions

This article is, as far as we know, the first to deal with the registration problem of large, high-resolution optical and SAR images with non-flat terrains. By taking full advantage of the previous studies, we proposed a SAR-PC-Moment-based feature point detection method, a template matching strategy with very large local patches, and a novel mutual verification-based initial outlier removal method. These methods help to produce a very reliable putative CP set with a low outlier ratio. Hereafter, the proposed recursive RANSAC method automatically segments the input large image into locally flat areas, and dozens of independent linear geometric relationships are estimated for image warping. As for image areas with very sharp elevation variation that therefore cannot be considered locally flat, the anchor CPs are identified for the optical flow-based pixelwise image warping. Extensive experiments have been conducted to verify the effectiveness and robustness of the proposed framework for the registration of optical and SAR images with highly variable terrains.

Author Contributions

Conceptualization, H.Z. and G.K.; methodology, H.Z., L.L. and W.N; software, H.Z.; validation, K.C. and T.T.; formal analysis, H.Z.; investigation, H.Z.; resources, T.T.; data curation, P.W.; writing—original draft preparation, H.Z.; writing—review and editing, K.C.; visualization, P.W.; supervision, W.N. and G.K. All authors have read and agreed to the published version of the manuscript.

Funding

This research received no external funding.

Data Availability Statement

The source code of the OSMNet and OSFlowNet used in this article are available online at https://github.com/zhanghan9718 (accessed on 14 December 2021).

Conflicts of Interest

The authors declare no conflict of interest.

Abbreviations

ARArea RatioP-GtPseudo Ground Truth
CNNConvolutional Neural NetworkRANSACRANdom SAmple Consensus
CPCorrespondence feature PointRMSERoot Mean Square Error
CPDCoherent Point DriftSARSynthetic Aperture Radar
DEMDigital Elevation ModalSAR-PC-MomentSAR image Phase Congruency Moment map
FNFalse NegativeSSDSum of Squared Differences
GRUGated Recurrent UnitTARTotal Area Ratio
MRMatching RatioTINTriangulated Irregular Network
NINumber of InliersTNTrue Negative
PCPhase Congruency

References

  1. De Lussy, F.; Greslou, D.; Dechoz, C.; Amberg, V.; Delvit, J.M.; Lebegue, L.; Blanchet, G.; Fourest, S. Pléiades HR in flight geometrical calibration: Location and mapping of the focal plane. ISPRS Int. Arch. Photogramm. Remote Sens. Spat. Inf. Sci. 2012, 39, 519–523. [Google Scholar] [CrossRef]
  2. Eineder, M.; Minet, C.; Steigenberger, P.; Cong, X.; Fritz, T. Imaging geodesy—Towards centimeter level ranging accuracy with TerraSAR-X. IEEE Trans. Geosci. Remote Sens. 2010, 49, 661–671. [Google Scholar] [CrossRef]
  3. Deng, M.; Zhang, G.; Zhao, R.; Li, S.; Li, J. Improvement of Gaofen-3 absolute positioning accuracy based on cross-calibration. Sensors 2017, 17, 2903. [Google Scholar] [CrossRef] [PubMed]
  4. Reinartz, P.; Müller, R.; Schwind, P.; Suri, S.; Bamler, R. Orthorectification of VHR optical satellite data exploiting the geometric accuracy of TerraSAR-X data. ISPRS J. Photogramm. Remote Sens. 2011, 66, 124–132. [Google Scholar] [CrossRef]
  5. Liu, S.; Qi, Z.; Li, X.; Yeh, A.G.-O. Integration of convolutional neural networks and object-based post-classification refinement for land use and land cover mapping with optical and SAR data. Remote Sens. 2019, 11, 690. [Google Scholar] [CrossRef]
  6. Li, X.; Lei, L.; Sun, Y.; Li, M.; Kuang, G. Collaborative attention-based heterogeneous gated fusion network for land cover classification. IEEE Trans. Geosci. Remote Sens. 2021, 59, 3829–3845. [Google Scholar] [CrossRef]
  7. Yu, Q.; Ni, D.; Jiang, Y.; Yan, Y.; An, J.; Sun, T. Universal SAR and optical image registration via a novel SIFT framework based on nonlinear diffusion and a polar spatial-frequency descriptor. ISPRS J. Photogramm. Remote Sens. 2021, 171, 1–17. [Google Scholar] [CrossRef]
  8. Xiang, Y.; Wang, F.; You, H. OS-SIFT: A robust SIFT-Like algorithm for high-resolution optical-to-SAR image registration in suburban areas. IEEE Trans. Geosci. Remote Sens. 2018, 56, 3078–3090. [Google Scholar] [CrossRef]
  9. Li, J.; Hu, Q.; Ai, M. RIFT: Multimodal image matching based on radiation-variation insensitive feature transform. IEEE Trans. Image Process. 2019, 29, 3296–3310. [Google Scholar] [CrossRef] [PubMed]
  10. Li, J.; Xu, W.; Shi, P.; Zhang, Y.; Hu, Q. LNIFT: Locally normalized image for rotation invariant multimodal feature matching. IEEE Trans. Geosci. Remote Sens. 2022, 60, 5621314. [Google Scholar] [CrossRef]
  11. Heinrich, M. MIND: Modality independent neighbourhood descriptor for multi-modal deformable registration. Med. Image Anal. 2012, 16, 1423–1435. [Google Scholar] [CrossRef] [PubMed]
  12. Ye, Y.; Shan, J.; Bruzzone, L.; Shen, L. Robust registration of multimodal remote sensing images based on structural similarity. IEEE Trans. Geosci. Remote Sens. 2017, 55, 2941–2958. [Google Scholar] [CrossRef]
  13. Ye, Y.; Bruzzone, L.; Shan, J.; Bovolo, F.; Zhu, Q. Fast and robust matching for multimodal remote sensing image registration. IEEE Trans. Geosci. Remote Sens. 2019, 57, 9059–9070. [Google Scholar] [CrossRef]
  14. Ye, Y.; Zhu, B.; Tang, T.; Yang, C.; Xu, Q.; Zhang, G. A robust multimodal remote sensing image registration method and system using steerable filters with first- and second-order gradients. ISPRS J. Photogramm. Remote Sens. 2022, 188, 331–350. [Google Scholar] [CrossRef]
  15. Xiang, Y.; Tao, R.; Wan, L.; Wang, F.; You, H. OS-PC: Combining feature representation and 3-D phase correlation for subpixel optical and SAR image registration. IEEE Trans. Geosci. Remote Sens. 2020, 58, 6451–6466. [Google Scholar] [CrossRef]
  16. Xiang, Y.; Jiao, N.; Wang, F.; You, H. A robust two-stage registration algorithm for large optical and SAR images. IEEE Trans. Geosci. Remote Sens. 2022, 60, 5218615. [Google Scholar] [CrossRef]
  17. Fan, Z.; Zhang, L.; Liu, Y.; Wang, Q.; Zlatanova, S. Exploiting high geopositioning accuracy of SAR data to obtain accurate geometric orientation of optical satellite images. Remote Sens. 2021, 13, 3535. [Google Scholar] [CrossRef]
  18. Li, S.; Lv, X.; Ren, J.; Li, J. A robust 3D density descriptor based on histogram of oriented primary edge structure for SAR and optical image co-registration. Remote Sens. 2022, 14, 630. [Google Scholar] [CrossRef]
  19. Yao, Y.; Zhang, Y.; Wan, Y.; Liu, X.; Yan, X.; Li, J. Multi-modal remote sensing image matching considering co-occurrence filter. IEEE Trans. Geosci. Image Process. 2022, 31, 2584–2597. [Google Scholar] [CrossRef] [PubMed]
  20. Merkle, N.; Luo, W.; Auer, S.; Müller, R.; Urtasun, R. Exploiting deep matching and SAR data for the geo-localization accuracy improvement of optical satellite images. Remote Sens. 2017, 9, 586. [Google Scholar] [CrossRef]
  21. Bürgmann, T.; Koppe, W.; Schmitt, M. Matching of TerraSAR-X derived ground control points to optical image patches using deep learning. ISPRS J. Photogramm. Remote Sens. 2019, 158, 241–248. [Google Scholar] [CrossRef]
  22. Maggiolo, L.; Solarna, D.; Moser, G.; Serpico, S.B. Registration of multisensor images through a conditional generative adversarial network and a correlation-type similarity measure. Remote Sens. 2022, 14, 2811. [Google Scholar] [CrossRef]
  23. Zhang, H.; Ni, W. Registration of multimodal remote sensing image based on deep fully convolutional neural network. IEEE J. Sel. Top. Appl. Earth Obs. Remote Sens. 2019, 12, 3018–3042. [Google Scholar] [CrossRef]
  24. Merkle, N.; Auer, S.; Müller, R.; Reinartz, P. Exploring the potential of conditional adversarial networks for optical and SAR image matching. IEEE J. Sel. Top. Appl. Earth Obs. Remote Sens. 2018, 11, 1811–1820. [Google Scholar] [CrossRef]
  25. Hoffmann, S.; Brust, C.; Shadaydeh, M.; Denzler, J. Registration of high resolution SAR and optical satellite imagery using fully convolutional networks. In Proceedings of the IGARSS 2019—2019 IEEE International Geoscience and Remote Sensing Symposium, Yokohama, Japan, 28 July–2 August 2019; pp. 5152–5155. [Google Scholar]
  26. Pinel-Puysségur, B.; Maggiolo, L.; Roux, M.; Gasnier, N.; Solarna, D.; Moser, G.; Serpico, S.B.; Tupin, F. Experimental comparison of registration methods for multisensor sar-optical data. In Proceedings of the 2021 IEEE International Geoscience and Remote Sensing Symposium IGARSS, Brussels, Belgium, 11–16 July 2021; pp. 3022–3025. [Google Scholar]
  27. Zhang, H.; Lei, L.; Ni, W.; Tang, T.; Wu, J.; Xiang, D.; Kuang, G. Optical and SAR image matching using pixelwise deep dense features. IEEE Geosci. Remote Sens. Lett. 2020, 9, 6000705. [Google Scholar] [CrossRef]
  28. Zhang, H.; Lei, L.; Ni, W.; Tang, T.; Wu, J.; Xiang, D.; Kuang, G. Explore better network framework for high-resolution optical and SAR image matching. IEEE Trans. Geosci. Remote Sens. 2021, 60, 4704418. [Google Scholar] [CrossRef]
  29. Hughes, L.; Hughes, D.; Marcos, S.; Lobry, D.; Schmitt, M. A deep learning framework for matching of SAR and optical imagery. ISPRS J. Photogramm. Remote Sens. 2020, 169, 166–179. [Google Scholar] [CrossRef]
  30. Xiang, D.; Xie, Y.; Cheng, J.; Xu, Y.; Zhang, H.; Zheng, Y. Optical and SAR image registration based on feature decoupling network. IEEE Trans. Geosci. Remote Sens. 2022, 60, 5235913. [Google Scholar] [CrossRef]
  31. Curlander, J. Geometric and radiometric distortion in spaceborne SAR imagery. In Proceedings of the NASA Workshop on Registration and Rectification, Leesburg, VA, USA, 1 July 1982; pp. 163–197. [Google Scholar]
  32. Brigot, G.; Colin-Koeniguer, E.; Plyer, A.; Janez, F. Adaptation and evaluation of an optical flow method applied to coregistration of forest remote sensing images. IEEE J. Sel. Top. Appl. Earth Obs. Remote Sens. 2016, 9, 2923–2939. [Google Scholar] [CrossRef]
  33. Xiang, Y.; Wang, F.; Wan, L.; Jiao, N.; You, H. OS-Flow: A robust algorithm for dense optical and SAR image registration. IEEE Trans. Geosci. Remote Sens. 2019, 57, 6335–6354. [Google Scholar] [CrossRef]
  34. Zhang, H.; Lei, L.; Ni, W.; Yang, X.; Tang, T.; Cheng, K.; Xiang, D.; Kuang, G. Optical and SAR image dense registration using a robust deep optical flow framework. IEEE J. Sel. Top. Appl. Earth Obs. Remote Sens. 2023, 16, 1269–1294. [Google Scholar] [CrossRef]
  35. Ramalingam, S.; Lodha, S.; Sturm, P. A generic structure-from-motion framework. Comp. Vis. Image Underst. 2002, 103, 218–228. [Google Scholar] [CrossRef]
  36. Fan, Y.; Zhang, Q.; Tang, Y.; Liu, S. Blitz-SLAM: A semantic SLAM in dynamic environments. Patt. Recog. 2021, 121, 108225. [Google Scholar] [CrossRef]
  37. Zhang, Y.; Zou, S.; Liu, X.; Huang, X.; Wan, Y.; Yao, Y. Lidarguided stereo matching with a spatial consistency constraint. ISPRS J. Photogramm. Remote Sens. 2022, 183, 164–177. [Google Scholar] [CrossRef]
  38. Wu, M.; Lam, S.; Srikanthan, T. A framework for fast and robust visual odometry. IEEE Trans. Geosci. Remote Sens. 2017, 18, 3433–3448. [Google Scholar] [CrossRef]
  39. Zhang, L.; Rupnik, E.; Pierrot-Deseilligny, M. Feature matching for multi-epoch historical aerial images. ISPRS J. Photogramm. Remote Sens. 2021, 182, 176–189. [Google Scholar] [CrossRef]
  40. Fischler, M.; Bolles, R. Random sample consensus: A paradigm for model fitting with applications to image analysis and automated cartography. Commun. ACM 1981, 24, 381–395. [Google Scholar] [CrossRef]
  41. Torr, P.; Zisserman, A. Mlesac: A new robust estimator with application to estimating image geometry. Comp. Vis. Image Underst. 2000, 78, 138–156. [Google Scholar] [CrossRef]
  42. Rousseeuw, P.; Leroy, A. Robust Regression and Outlier Detection; John Wiley & Sons: Hoboken, NJ, USA, 2005; p. 589. [Google Scholar]
  43. Wu, Y.; Ma, W.; Gong, M.; Su, L.; Jiao, L. A novel point-matching algorithm based on fast sample consensus for image registration. IEEE Geosci. Remote Sens. Lett. 2015, 12, 43–47. [Google Scholar] [CrossRef]
  44. Myronenko, A.; Song, X. Point set registration: Coherent point drift. IEEE Trans. Pattern Anal. Mach. Intell. 2010, 32, 2262–2275. [Google Scholar] [CrossRef]
  45. Ma, J.; Zhao, J.; Tian, J.; Yuille, A.; Tu, Z. Robust point matching via vector field consensus. IEEE Trans. Image Process. 2014, 23, 1706–1721. [Google Scholar] [CrossRef] [PubMed]
  46. Bian, J.; Lin, W.; Matsushita, Y.; Yeung, S.; Nguyen, T.; Cheng, M. Gms: Grid-based motion statistics for fast, ultra-robust feature correspondence. In Proceedings of the IEEE Conference on Computer Vision and Pattern Recognition (CVPR), Honolulu, HI, USA, 21–26 July 2017; pp. 4181–4190. [Google Scholar]
  47. Ma, J.; Zhao, J.; Jiang, J.; Zhou, H.; Guo, X. Locality preserving matching. Inter. J. Comp. Vis. 2019, 127, 512–531. [Google Scholar] [CrossRef]
  48. Ma, J.; Zhou, H.; Zhao, J.; Gao, Y.; Jiang, J.; Tian, J. Robust feature matching for remote sensing image registration via locally linear transforming. IEEE Trans. Geosci. Remote Sens. 2015, 53, 6469–6481. [Google Scholar] [CrossRef]
  49. Jiang, X.; Wang, Y.; Fan, A.; Ma, J. Learning for mismatch removal via graph attention networks. ISPRS J. Photogramm. Remote Sens. 2022, 190, 181–195. [Google Scholar] [CrossRef]
  50. Kovesi, P. Phase congruency detects corners and edges. In Proceedings of the VIIth International Conference on Digital Image Computing: Techniques and Applications, Sydney, Australia, 10–12 December 2003; pp. 309–318. [Google Scholar]
  51. Xiang, Y.; Tao, R.; Wang, F.; You, H.; Han, B. Automatic registration of optical and SAR images via improved phase congruency model. IEEE J. Sel. Top. Appl. Earth Obs. Remote Sens. 2020, 13, 5847–5861. [Google Scholar] [CrossRef]
  52. Moghimi, A.; Sarmadian, A.; Mohammadzadeh, A.; Celik, T. Distortion robust relative radiometric normalization of multitemporal and multisensor remote sensing images using image features. IEEE Trans. Geosci. Remote Sens. 2020, 60, 5400820. [Google Scholar] [CrossRef]
  53. Guo, H.; Xu, H.; Wei, Y.; Shen, Y.; Rui, X. Outlier removal and feature point pairs optimization for piecewise linear transformation in the co-registration of very high-resolution optical remote sensing imagery. ISPRS J. Photogramm. Remote Sens. 2022, 193, 299–313. [Google Scholar] [CrossRef]
  54. Arevalo, V.; Gonzalez, J. An experimental evaluation of non-rigid registration techniques on Quickbird satellite imagery. Int. J. Remote Sens. 2008, 29, 513–527. [Google Scholar] [CrossRef]
  55. Han, Y.; Kim, T.; Yeom, J. Improved piecewise linear transformation for precise warping of very-high-resolution remote sensing images. Remote Sens. 2019, 11, 2235. [Google Scholar] [CrossRef]
  56. Yu, Q.; Wu, P.; Ni, D.; Hu, H.; Lei, Z.; An, J.; Chen, W. SAR pixelwise registration via multiscale coherent point drift with iterative residual map minimization. IEEE Trans. Geosci. Remote Sens. 2022, 60, 5200919. [Google Scholar] [CrossRef]
  57. Zhang, H.; Ni, W.; Yan, W.; Wu, J.; Li, S. Robust SAR image registration based on edge matching and refined coherent point drift. IEEE Geosci. Remote Sens. Lett. 2015, 12, 2115–2119. [Google Scholar] [CrossRef]
  58. Villamil-Lopez, C.; Petersen, L.; Speck, R.; Frommholz, D. Registration of very high resolution SAR and optical images. In Proceedings of the EUSAR 2016: 11th European Conference on Synthetic Aperture Radar, Hamburg, Germany, 6–9 June 2016; pp. 691–696. [Google Scholar]
Figure 1. Two different sparse matching schemes: (a) detection-then-description; (b) template matching, where the yellow ‘+’ on the Template Image is the location of the feature point, the yellow ‘+’ on the Search Image is the initial matching position and the red ‘+’ is the correct matching position.
Remotesensing 15 04458 g001
Figure 2. Overall framework of the proposed optical-SAR registration method for large images with non-flat terrains.
Remotesensing 15 04458 g002
Figure 3. The matching accuracy variance with different template sizes using two methods, the handcrafted CFOG and the learning-based OSMNet. The experiment is conducted on four large optical-SAR pairs from [28]: (a) 1-SH; (b) 2-ZZ; (c) 3-BJ; (d) 4-XS.
Remotesensing 15 04458 g003
Figure 4. The Output of the Recursive RANSAC method: (a) iteration 1, (b) iteration 2, (c) iteration 3. Each column presents one geometric consensus set, where the lower subfigure is the CP sets after point clustering using the CPs shown in the upper subfigure, with each color standing for one CP subset of a locally flat area.
Remotesensing 15 04458 g004
Figure 5. DEM images corresponding to the 4 optical-SAR image pairs used for the experiments, with 30 m spatial resolution and detailed information shown in Table 1: (a) 1-Yanliang; (b) 2-Beijing; (c) 3-Zhengzhou; (d) 4-Chengdu.
Remotesensing 15 04458 g005
Figure 6. The distribution of the pseudo-ground truth CP set of the four datasets with flat terrains. The corresponding SAR images are not presented here considering the similar distribution.
Remotesensing 15 04458 g006
Figure 7. The distribution of the putative CPs (yellow dots) and pseudo-ground truth CPs (red dots). For the 1-Yanliang dataset, the number of putative CPs is 16,020, and the P-Gt is 2536; For 2-Beijing, the numbers are 16,533 and 2801; For 3-Zhengzhou, the numbers are 11,754 and 965; For 4-Chengdu, they are 9361 and 201. The distributions on the corresponding SAR images are similar; they are not presented here.
Remotesensing 15 04458 g007
Figure 8. The inlier (red dots) and outlier (yellow dots) CPs after the one-pass RANSAC process on: (a) 1-Yanliang, (b) 2-Beijing, (c) 3-Zhengzhou, and (d) 4-Chengdu. The distributions on the corresponding SAR images are similar; they are not presented here.
Remotesensing 15 04458 g008
Figure 9. Distribution of the shift values of each locally flat area for: (a) 1-Yanliang, (b) 2-Beijing, (c) 3-Zhengzhou, and (d) 4-Chengdu datasets, where the number of identified flat areas is 40, 67, 176, and 101, respectively.
Remotesensing 15 04458 g009
Figure 10. Mosaic images of the registration result, where the areas within the yellow boundaries are mountainous with sharp elevation variations and co-registered using the optical flow-based method OSFlowNet: (a) 1-Yanliang, (b) 2-Beijing, (c) 3-Zhengzhou, (d) 4-Chengdu.
Remotesensing 15 04458 g010
Figure 11. Enlarged subimages of the registration result of 1-Yanliang dataset. The first five subimages (ae) are from the red rectangles of locally flat area, and the last subimage (f) is from the yellow rectangle of non-flat area.
Remotesensing 15 04458 g011
Figure 12. Enlarged subimages of the registration result of 2-Beijing dataset. The first five subimages (ae) are from the red rectangles of locally flat area, and the last subimage (f) is from the yellow rectangle of non-flat area.
Remotesensing 15 04458 g012
Figure 13. Enlarged subimages of the registration result of 3-Zhengzhou dataset. The first five subimages (ae) are from the red rectangles of locally flat area, and the last subimage (f) is from the yellow rectangle of non-flat area.
Remotesensing 15 04458 g013
Figure 14. Enlarged subimages of the registration result of 4-Chengdu dataset. The first five subimages (ae) are from the red rectangles of locally flat area, and the last subimage (f) is from the yellow rectangle of non-flat area.
Remotesensing 15 04458 g014
Table 1. Detailed information about the four optical and SAR image pairs used for the experiment.
Image NameSizeElevation RangeElevation STDIncident Angle of the SAR Image
1-Yanliang12,617 × 8354367–411827°
2-Beijing11,802 × 10,35817–4424847°
3-Zhengzhou11,235 × 9163333–102611850°
4-Chengdu10,001 × 9001455–98512244°
Table 2. Comparison of different feature point detectors in terms of MR with  t 1  pixel (%). The matching is conducted with the template size set at 225 × 225 pixels.
Image NameNaiveHarrisSAR-PC-Moment
1-SH43.0442.7443.76
2-ZZ17.3217.4918.88
3-BJ21.1321.0123.15
4-XS27.9629.1029.50
Table 3. Comparison of different sparse matching methods in terms of MR and NI with  t 1  pixel. For the proposed method, the matching is conducted with the template size set at 641 × 641 pixels.
Image NameMatching Ratio (MR, %)Number of Inliers (NI)
RIFTLNIFTProposedRIFTLNIFTProposed
1-SH27.8713.1770.70374548928498
2-ZZ9.8310.3736.4548915243178
3-BJ12.0711.8243.6688019633267
4-XS23.7513.1752.955194489215,717
Table 4. Mutual verification-based initial outlier removal results in terms of detected true negative (TN) numbers and ratios, false negative (FN) numbers and ratios.
Image NameTN NumberTN Ratio (%)FN NumberFN Ratio (%)
1-SH6323.77560.47
2-ZZ57525.62530.61
3-BJ49533.74390.49
4-XS48230.8211503.85
Table 5. The CP number and matching accuracy of the P-Gt set in terms of MR with different threshold  t .
Image NameP-Gt Numbert ≤ 1 (%)t ≤ 3 (%)t ≤ 5 (%)
1-SH87392.67100100
2-ZZ21956.6293.15100
3-BJ18454.8996.74100
4-XS140469.0998.36100
Table 6. Quantitative results of the classical one-pass registration procedure in terms of RMSE (pixels) and MR (%).
Image NameRMSE beforeRMSE afterMR (t ≤ 1)MR (t ≤ 5)
1-Yanliang129.17.717.549.2
2-Beijing35.73.441.686.3
3-Zhengzhou60.86.826.975.3
4-Chengdu143.310.117.940.8
Table 7. Quantitative results of the proposed registration method after the locally flat areas are co-registered in terms of RMSE (pixels) and MR (%). The AR (area ratio, %) stands for the area percentage of the co-registered locally flat regions, and the TAR (total area ratio, %) stands for the area percentage of the co-registered regions after including the matchable non-flat areas.
Image NameRMSE afterMR (t ≤ 1)MR (t ≤ 3)MR (t ≤ 5)ARTAR
1-Yanliang1.2353.194.499.599.599.8
2-Beijing1.1650.597.699.894.695.6
3-Zhengzhou1.3944.293.597.178.182.9
4-Chengdu1.6542.789.597.062.171.3
Table 8. RMSE (pixels) of different registration methods for the four non-flat datasets.
Image NameProposedTIN Local AffineNon-Rigid CPDOSFlowNetOne-Pass
1-Yanliang1.232.20.71.77.7
2-Beijing1.160.81.01.53.4
3-Zhengzhou1.396.41.71.46.8
4-Chengdu1.6515.62.21.810.1
Table 9. Computation Time of different registration methods (minutes).
Image NameSizeSparse MatchingProposedTIN Local AffineNon-Rigid CPDOSFlowNetOne-Pass
1-Yanliang12,617 × 835432.917.920.924.125.00.5
2-Beijing11,802 × 10,35835.317.623.019.131.50.8
3-Zhengzhou11,235 × 916333.29.811.315.810.60.5
4-Chengdu10,001 × 900131.19.27.416.48.70.5
Disclaimer/Publisher’s Note: The statements, opinions and data contained in all publications are solely those of the individual author(s) and contributor(s) and not of MDPI and/or the editor(s). MDPI and/or the editor(s) disclaim responsibility for any injury to people or property resulting from any ideas, methods, instructions or products referred to in the content.

