Article

Deciphering China’s Socio-Economic Disparities: A Comprehensive Study Using Nighttime Light Data

1
School of Advanced Technology, Xi’an Jiaotong-Liverpool University, Suzhou 215123, China
2
Key Laboratory of Ecosystem Network Observation and Modeling, Institute of Geographic and Nature Resources Research, Chinese Academy of Sciences, Beijing 100101, China
3
School of Resource Engineering, Longyan University, Longyan 364012, China
4
College of Software, Taiyuan University of Technology, Taiyuan 030024, China
5
Institute of Geographic Sciences and Natural Resources Research, Chinese Academy of Sciences, Beijing 100101, China
6
University of Chinese Academy of Sciences, Beijing 100049, China
*
Author to whom correspondence should be addressed.
These authors contributed equally to this work.
Remote Sens. 2023, 15(18), 4581; https://doi.org/10.3390/rs15184581
Submission received: 24 July 2023 / Revised: 7 September 2023 / Accepted: 13 September 2023 / Published: 18 September 2023
(This article belongs to the Special Issue Remote Sensing of Night-Time Light II)

Abstract

:
Achieving equitable and harmonized socio-economic development is a vital gauge of national progress, particularly in geographically extensive nations such as China. This study, employing nighttime lights as a socio-economic development indicator and remote sensing vegetation indices, investigates spatial variations in wealth distribution across China’s eastern and western regions, delineated by the Hu Huanyong Line. It uncovers the balance between economic growth and green space preservation and discrepancies in development and green space allocation. A thorough county-level analysis using this nighttime light (NTL) and vegetation index exposes the dynamic shifts in socio-economic focal points. The Gini coefficient, assessing inequality and spatial autocorrelation within the index ratio, enriches our regional development understanding. The findings depict a heterogeneous yet rapid economic expansion, primarily within a 30 km coastal buffer zone. Despite a decrease in Gini coefficients in both eastern and western regions, the potential for inland development escalates as coastal illumination approaches saturation. This study unveils enduring, yet lessening, economic disparities between eastern and western China, underscoring the necessity for green preservation in eastern development plans. Moreover, inland regions emerge as potential areas for accelerated development. This study offers crucial insights for formulating balanced, sustainable regional development strategies in China.

1. Introduction

In the panorama of global urbanization, China’s socio-economic transformation over the last three decades presents an impressive case of rapid development coupled with significant urban expansion [1,2]. However, such meteoric progress has not been without challenges, primarily manifested in the wide regional development disparities and the drastic diminution of ecological spaces [3]. As a result, achieving spatial equilibrium and maintaining development quality have emerged as paramount concerns in contemporary China, necessitating an alignment of efficiency and fairness, while placing the sustainable practices of ecological civilization at the forefront of development [4,5].
One of the challenges in analyzing these issues lies in the data sources. Traditional statistical data, encompassing critical indicators such as census records, Gross Domestic Product (GDP) metrics, and employment statistics, although informative in nature, frequently grapple with inherent shortcomings such as data scarcity, temporal discrepancies, and constraints in spatial coverage [6]. These limitations necessitate an alternative source of data, one that is timely, extensive in its spatial coverage, and rich in its informational depth. In this regard, Nighttime Light (NTL) remote sensing technology has emerged as a potent tool for socio-economic studies, providing a valuable data resource that could reveal the spatial disparities in economic development and their ecological implications [7,8,9,10].
Existing studies on spatial disparities in economic development in China have offered multifaceted insights into the intricate dynamics shaping regional imbalances. Through the lens of development geography, Deng et al. (2022) [11] comprehensively reviewed the historical course and characteristics of regional development, while emphasizing the pursuit of balanced growth and sustainable outcomes. Xiao et al. (2021) [12] employed a comparative approach, using nighttime light and GDP data, to uncover variations in regional economic convergence, shedding light on the potential complementary role of alternative indicators. Zhang et al., (2021) [13] delved into carbon emission performance and regional inequalities, employing data envelopment analysis and regression models to dissect the complexities of environmental sustainability. Building on this foundation, Zhang et al., (2023) [14] extended the discourse to the digital economy, showcasing its significance in propelling green economic growth, alongside regional differentials. Together, these studies contribute to a holistic understanding of the evolving landscape of spatial economic disparities in China, touching upon historical, environmental, and technological dimensions.
The analysis of regional disparities in China’s socio-economic development becomes particularly interesting when considering the Hu Huanyong Line (from Heihe to Tengchong, also known as the Hu Line), a significant demographic and natural resource boundary [15,16]. Remarkably, this geographical demarcation unveils an evident socio-economic asymmetry on its two sides, with disparities arising from variations in geographical location, resource endowment, policy orientation, and openness of consciousness [17]. On one side of the Hu Line lies the economically advanced and highly urbanized eastern coastal region of China. This area has been a driving force behind China’s rapid economic growth, characterized by bustling cities, thriving industries, and a concentration of economic activities. On the other side of the line, in the western and inland regions, lies a landscape marked by economic challenges, lower levels of urbanization, and a greater need for infrastructure development. The prominence of this line and its implications on balanced development was highlighted by the then-serving Premier of China, Li Keqiang, in November 2014, thereby reflecting the attention this special issue has been given at the highest level of the Chinese government [18].
The majority of studies on the Hu Line’s impact on urbanization, population distribution, and economic development have been primarily based on traditional statistical data [16,17,18]. These studies often focus on broad indicators such as GDP and urban area size, failing to provide a comprehensive analysis of the socio-economic disparities across the Hu Line [19,20]. Further, the limited availability and delayed nature of such statistical data often prevent timely and accurate acquisition of spatial disparity information.
Recognizing the limitations of traditional statistical data, a potent solution arises in the form of nighttime light data, an asset procured from satellite remote sensing. This rich resource effectively portrays the distribution and intensity of terrestrial human activities [21,22,23]. A discernible correlation exists between long-term nightlight data and critical socio-economic parameters like GDP and population across various administrative scales [24,25,26]. Consequently, this forms a credible alternative to statistical data, accurately depicting economic development [27,28]. Further refining this approach, the progression in big data mining technology allows the fusion of nightlight data with internet-based data, such as Points of Interest (POI), leading to a more sophisticated evaluation of spatial economic development patterns [29,30]. This amalgamation has proven invaluable in tasks like detailed poverty detection [31], contributing significantly to the cause of precision poverty alleviation in China. This innovation in data handling presents an opportunity to scrutinize the socio-economic disparities across the Hu Line using comprehensive indicators, as opposed to just GDP and urban area size. The rampant urbanization experienced in the eastern region of the Hu Line has an inevitable toll on green spaces, which embodies a fascinating study of spatial interactions between urban and natural regions [32,33,34]. Using vegetation indices, studies have traced the temporal and spatial evolution of urban green spaces, shedding light on their ecological impact and confirming the pivotal role of green spaces in mitigating heat island effects and safeguarding ecosystem stability.
The coastal regions of China have been extensively studied in existing literature, particularly in relation to urbanization, foreign direct investment (FDI), economic development, and other relevant factors [35,36,37]. It is worth noting that nearly 40% of the global population resides within a 100 km radius of coastlines [38], which simultaneously account for a significant fraction of socio-economic activities [39]. Despite this, the dearth of timely and precise statistical data has been a roadblock, impeding an exhaustive quantitative analysis of the economic disparities between the coastal and the western regions of the Hu Line. But the dawn of the nightlight data era provides a beacon of hope, creating a pathway to bridge this research gap. With a renewed focus on these coastal regions, a more holistic and nuanced understanding of the regional disparities in China’s socio-economic development could be achieved, providing further substance to the discourse on balanced and sustainable development.
This study, therefore, seeks to harness the potential of nighttime light data to scrutinize the socio-economic disparities across the Hu Line, focusing on both coastal and inland regions. The study addresses the following refined research questions:
  • What does nighttime light data reveal about the spatial and temporal patterns of socio-economic development disparities across the Hu Line?
  • How have these socio-economic development disparities evolved over time, considering factors like urbanization, ecological changes, and resource endowment?
  • Can the use of nighttime light data offer a detailed understanding of socio-economic development dynamics in China’s coastal regions as compared to the western areas along the Hu Line?
How does the analysis of nighttime light data for socio-economic disparities compare with established baselines, shedding light on the novel insights our approach brings to the forefront. By examining these questions, this study seeks to add to the academic discourse by providing a comprehensive, data-driven perspective on the spatial-temporal disparities in China’s socio-economic development founded on the use of nighttime light data. It presents a viable approach to complement traditional socio-economic indicators, providing a detailed, accurate, and timely analysis of spatial disparities in socio-economic development. The ultimate goal of this study is to broaden our understanding of China’s regional socio-economic disparities and to inform policy strategies that encourage balanced and sustainable development.
In conclusion, this study investigates the dynamic shifts and spatial patterns of socio-economic development disparities across the Hu Line by leveraging the strong correlation between nighttime light data and socio-economic indicators such as urbanization, GDP, and population. The methodological approach incorporates various aspects, including the total quantity and trends of light and greenness, spatial patterns, and imbalances, employing quantitative methods like the Gini coefficient.

2. Materials and Methods
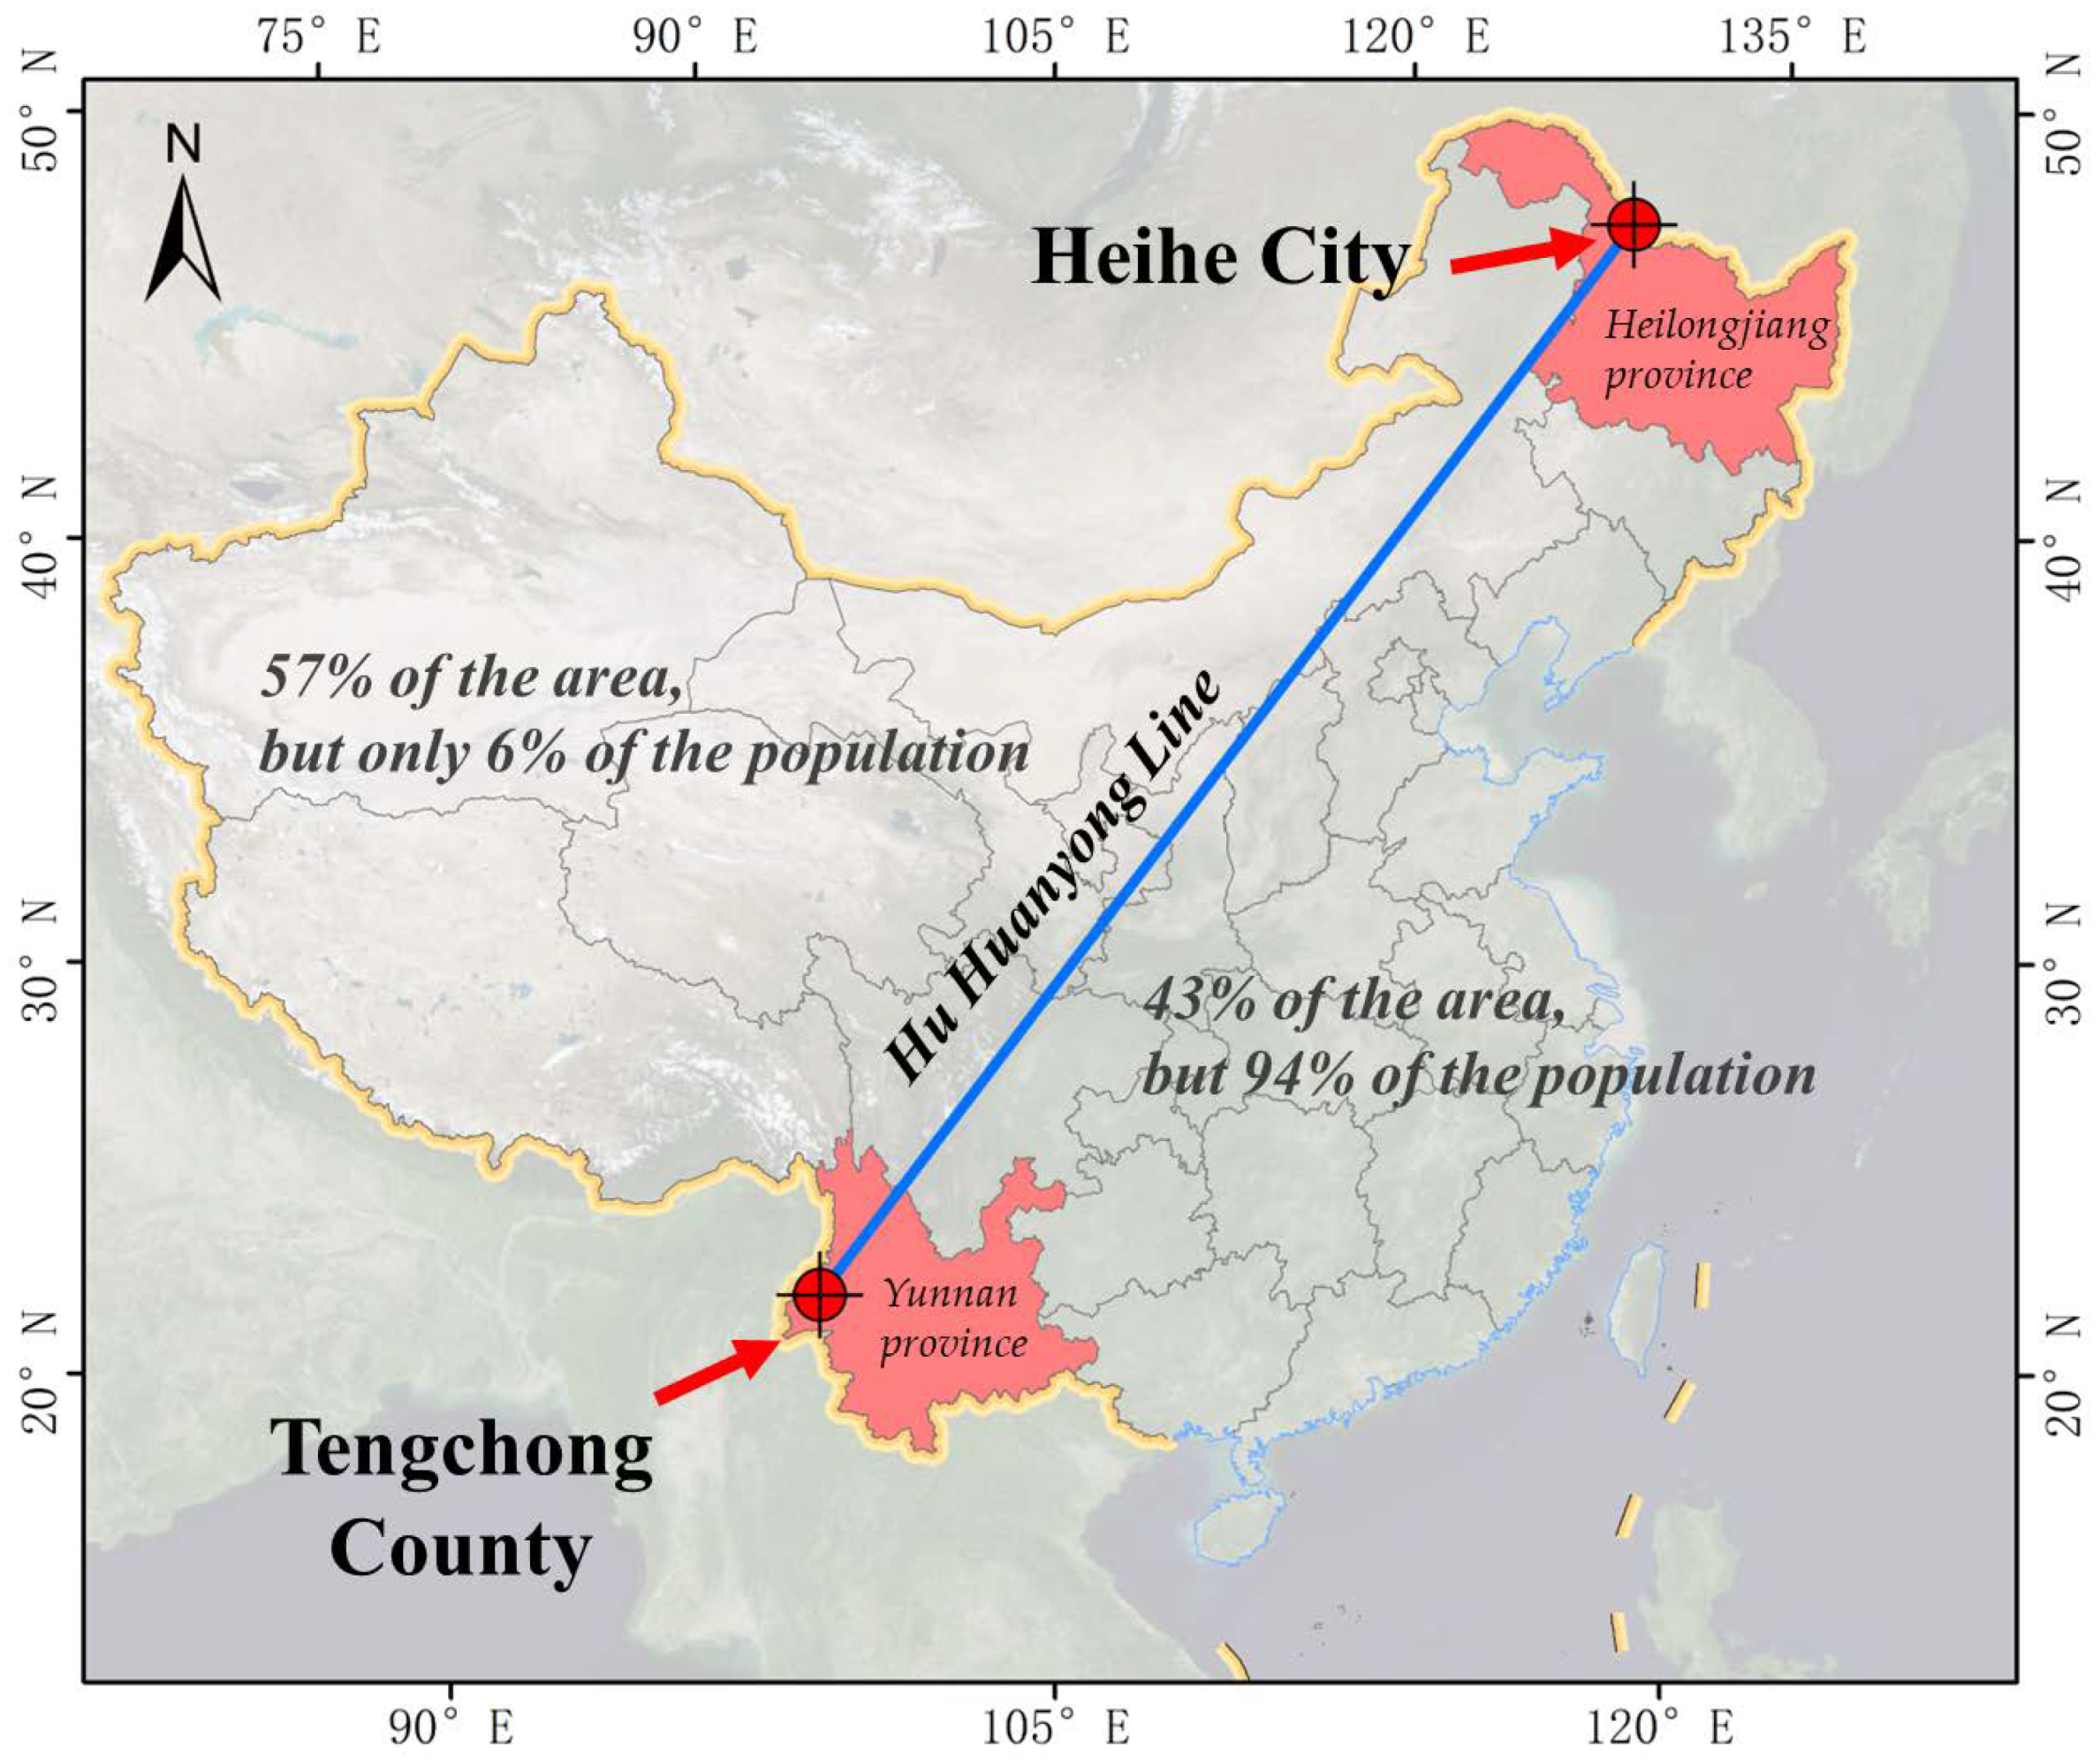
2.1. Study Area

This research focuses on mainland China, a geographically vast and economically diverse region. The geographical distinction within the country is fundamentally demarcated by the Hu Huanyong Line (also known as the Heihe-Tengchong Line), which distinguishes the region into two highly contrasting areas regarding population density and socio-economic development [40].
The Hu Huanyong Line stretches from Heihe in Heilongjiang province, the northeast of China, to Tengchong in Yunnan province, the southwest of the country. Despite not being an administrative boundary, this imaginary line remarkably delineates the stark contrasts in China’s socio-economic landscape. Notably, about 94% of the country’s population resides east of this line, while only 43% of the land area is in this region. In contrast, the area west of the line, while accounting for 57% of China’s territory, is inhabited by only 6% of the country’s population [18]. In order to clearly illustrate the geographical division and the distribution of the Hu Huanyong Line, Figure 1 presents a detailed map of the study area.

2.2. Data Acquisition and Preprocessing

2.2.1. Nighttime Light Data

Understanding urbanization and economic development often relies on indicators that capture the dynamics of human settlement. A commonly utilized proxy for these factors is the illumination of nighttime areas. The notion is that regions bathed in greater or brighter nocturnal light indicate higher levels of urbanization and economic advancement [14,27]. The research employed a fusion of datasets derived from two advanced satellite sensors, the Defense Meteorological Satellites Program-Operational Linescan System (DMSP-OLS) and the Visible Infrared Imaging Radiometer Suit (VIIRS) [41]. These datasets provided a rich resource of nighttime light data that served as the backbone of our study.
The Initial nighttime light remote sensing data was procured from the US Defense Meteorological Satellites Program’s DMSP-OLS sensor. This data, extending from 1992 to 2013, boasted a spatial resolution of 1000 m. Subsequently, the next generation of earth observing satellite, Suomi NPP, launched in 2011, was equipped with the VIIRS sensor. This sensor facilitated the capture of advanced nighttime light remote sensing imagery (Day/Night Band, DNB band), effectively minimizing the impacts of scattered light sources and background noise. This technological leap resulted in an enhanced spatial resolution of 500 m.
In this study, we employed a synthesized dataset of DMSP and VIIRS time series spanning the years 1992 to 2018. This dataset was generated through the compilation of publicly available data from both sensors using stable data sampling techniques. Subsequently, a sigmoid function relationship was applied to harmonize the dataset. To ascertain the robustness of this fused dataset, a validation process was conducted, focusing on two key aspects: spatial patterns as indicated by histogram analysis, and temporal trends. This validation procedure was essential in confirming the consistency and reliability between the observational NTL data and the synthesized dataset [41,42]. This annual dataset upheld a spatial resolution of 1000 m, with pixel values (DN values) representing the brightness of terrestrial nighttime light radiation.
For the geographical categorization of counties bisected by the Hu Huanyong Line, we adopted an approach based on the spatial distribution of nighttime lights. If more than 50% of a county’s light was distributed on either side of the line, the county was assigned to that particular region—east or west.

2.2.2. Vegetation Index Data

To offer a comprehensive perspective of the spatial distribution of green land, we employed the Normalized Difference Vegetation Index (NDVI), a widely used indicator for green vegetation extent and condition. For this, the GIMMS NDVI3g V1.0 dataset from NASA [43] served as our primary data source. This dataset, covering a temporal span from 1982 to 2015, presents a rich vegetation record with a fine temporal resolution of 15 days and a spatial resolution of 8 km.
Considering the temporal consistency of our research, we specifically selected NDVI data within the period of 1992 to 2015 to align with our nighttime light data. In our analysis, the annual NDVI data was represented by its yearly mean, which provides a reliable and intuitive depiction of the yearly vegetation condition. This yearly mean was further utilized in our study to calculate the interannual correlation with light data, offering insights into the relationship between socio-economic development and environmental changes. It is worth mentioning that due to the requirements of the spatial autocorrelation index, which necessitates spatial continuity of the study area, our research scope was strictly confined to mainland China.

2.3. Exploratory Data Analysis

2.3.1. Analyzing Developmental Trends

The initial stage of our analysis involved a rigorous examination of developmental trends at the county level. This was achieved by calculating the aggregate annual light values within each county jurisdiction, thereby enabling an evaluation of the changing patterns of socio-economic development over the course of our study period from 1992 to 2015. We applied linear regression methods to the data to illuminate these temporal trends, considering the slope of the regression as an indicator of the pace and direction of socio-economic changes. This analytical approach offers a valuable means of quantifying the year-to-year alterations in county-level development, with the S l o p e calculated via the least squares method:
S l o p e = n t = 1 n t X t t = 1 n t t = 1 n X t n t = 1 n t 2 ( t = 1 n t ) 2
Here, n stands for the span of the research years (1992–2015), while X t designates the nighttime light value for the respective year. The S l o p e ’s polarity was treated as a diagnostic feature, with positive values indicative of county-level light growth and negative values denoting decline.

2.3.2. Spatial-Temporal Economic Center

The spatial-temporal economic center of gravity is computed through a weighted method, integrating the distribution and intensity of nighttime lights over successive years. The center of gravity (CG) is determined based on the weighted average of the geographical coordinates of illuminated areas, reflecting the magnitude of economic activities. The formula for calculating the spatial-temporal economic center is as follows:
X ˉ = i = 1 n x i n ,   Y ˉ = i = 1 n y i n
where x i and y i are the coordinates of the features i and n is equal to the total number of features. The weighted mean center is expanded to:
X ˉ w = i = 1 n w i x i i = 1 n w i ,   Y ˉ w = i = 1 n w i y i i = 1 n w i
where w i is the weight at the feature.

2.3.3. Spatial Autocorrelation Analysis

The methodology of spatial autocorrelation, specifically Local Moran’s I, a measure of clustering and outlier analysis, was employed in this study [44]. The aim was to unearth the underlying interdependencies of county-level light distribution within the same region and to identify clusters of hot spots and anomalous areas in space. One of the vital applications of this method is to determine the clearest boundary positions between affluent and impoverished areas within a region [45], making it highly suitable for exploring the spatial patterns of socioeconomic development in our study.
In calculating the Moran’s I index for the county-level variables in our study, the inverse distance method and Euclidean distance were used for spatial relationships, with a distance threshold of 100 km. The formula for calculating the spatial autocorrelation coefficient I is as follows:
I i = x i X ˉ S i 2 j = 1 , j i n w i , j ( x j X ˉ )
where x i is the attribute of element i (nightlight in this study); X ˉ is the mean of the attribute; w i , j is the spatial weight between elements i and j ; n is the total number of elements. Also, the following formula applies:
S 2 = j = 1 , i j n ( x j X ˉ 2 ) 2 n 1

2.3.4. Nightlight-Vegetation Ratio Index

The quantification of urban development against the preservation of green areas within a region has been a subject of increasing interest in studies of urbanization [46,47,48]. One of the critical metrics applied in this context is the nightlight-vegetation ratio index, a measure calculated at the county level, which indicates the delicate balance between urban development and the conservation of green zones within a given region.
To derive this index, we use the ratioI) of the total light value, denoted as N T L s u m (Nighttime Light sum), and the total vegetation index value, represented as N D V I s u m (Normalized Difference Vegetation Index sum). These two parameters provide an overview of the extent of urbanized (lit) and vegetated areas within a county.
R = N T L s u m N D V I s u m
The light-vegetation ratio index offers a lens to explore the dynamic interactions between urbanization (as inferred from the extent of built-up and lit areas) and the preservation of green or vegetation-covered areas. The index acts as a pulse-check on the pressures of urban expansion on green spaces and offers an understanding of how these forces interact over time.

2.3.5. Gini Coefficient

In order to provide a quantitative assessment of inequality in the spatial distribution of nighttime light across the counties, the study employs the Gini coefficient, a measure traditionally used in economics to gauge income disparity among the population. In this research context, the Gini coefficient is applied at a geographical level to quantify differences in urban scale.
The application of the Gini coefficient has expanded from its original Iole in socio-economic analyses into geographical research [49]. Adapted for this purpose, it is often referred to as the urban Gini coefficient, providing a metric for understanding the variations in the extent of urban development across different regions.
The Gini coefficient is calculated for three different scopes: (1) across all counties in China, (2) among counties to the east of the Hu Huanyong Line, and (3) among counties to the west of the Hu Huanyong Line. This granular analysis allows for a comprehensive comparison of the spatial heterogeneity in nighttime light intensity within and between these regions.
The Gini coefficient calculation is as follows:
G = D 2 T ( n 1 )
Here, D represents the aggregate sum of absolute differences in the scale of nighttime light among various counties within each respective region, n denotes the number of counties in each region, T signifies the total nighttime light value for each respective region and G indicates the urban Gini coefficient, which falls within the range of 0 and 1.
Interpreting the Gini coefficient, a value approaching 1 signals more significant socioeconomic scale disparities among the counties, which is indicative of uneven development with a tendency for growth to concentrate towards the central region. In contrast, a Gini coefficient closer to 0 suggests smaller socioeconomic scale disparities, which is indicative of a more uniform distribution of development across the counties. By examining the Gini coefficients of the different regions, the study aims to identify patterns of development concentration and disparities, with implications for socioeconomic and urban planning policies.

3. Results

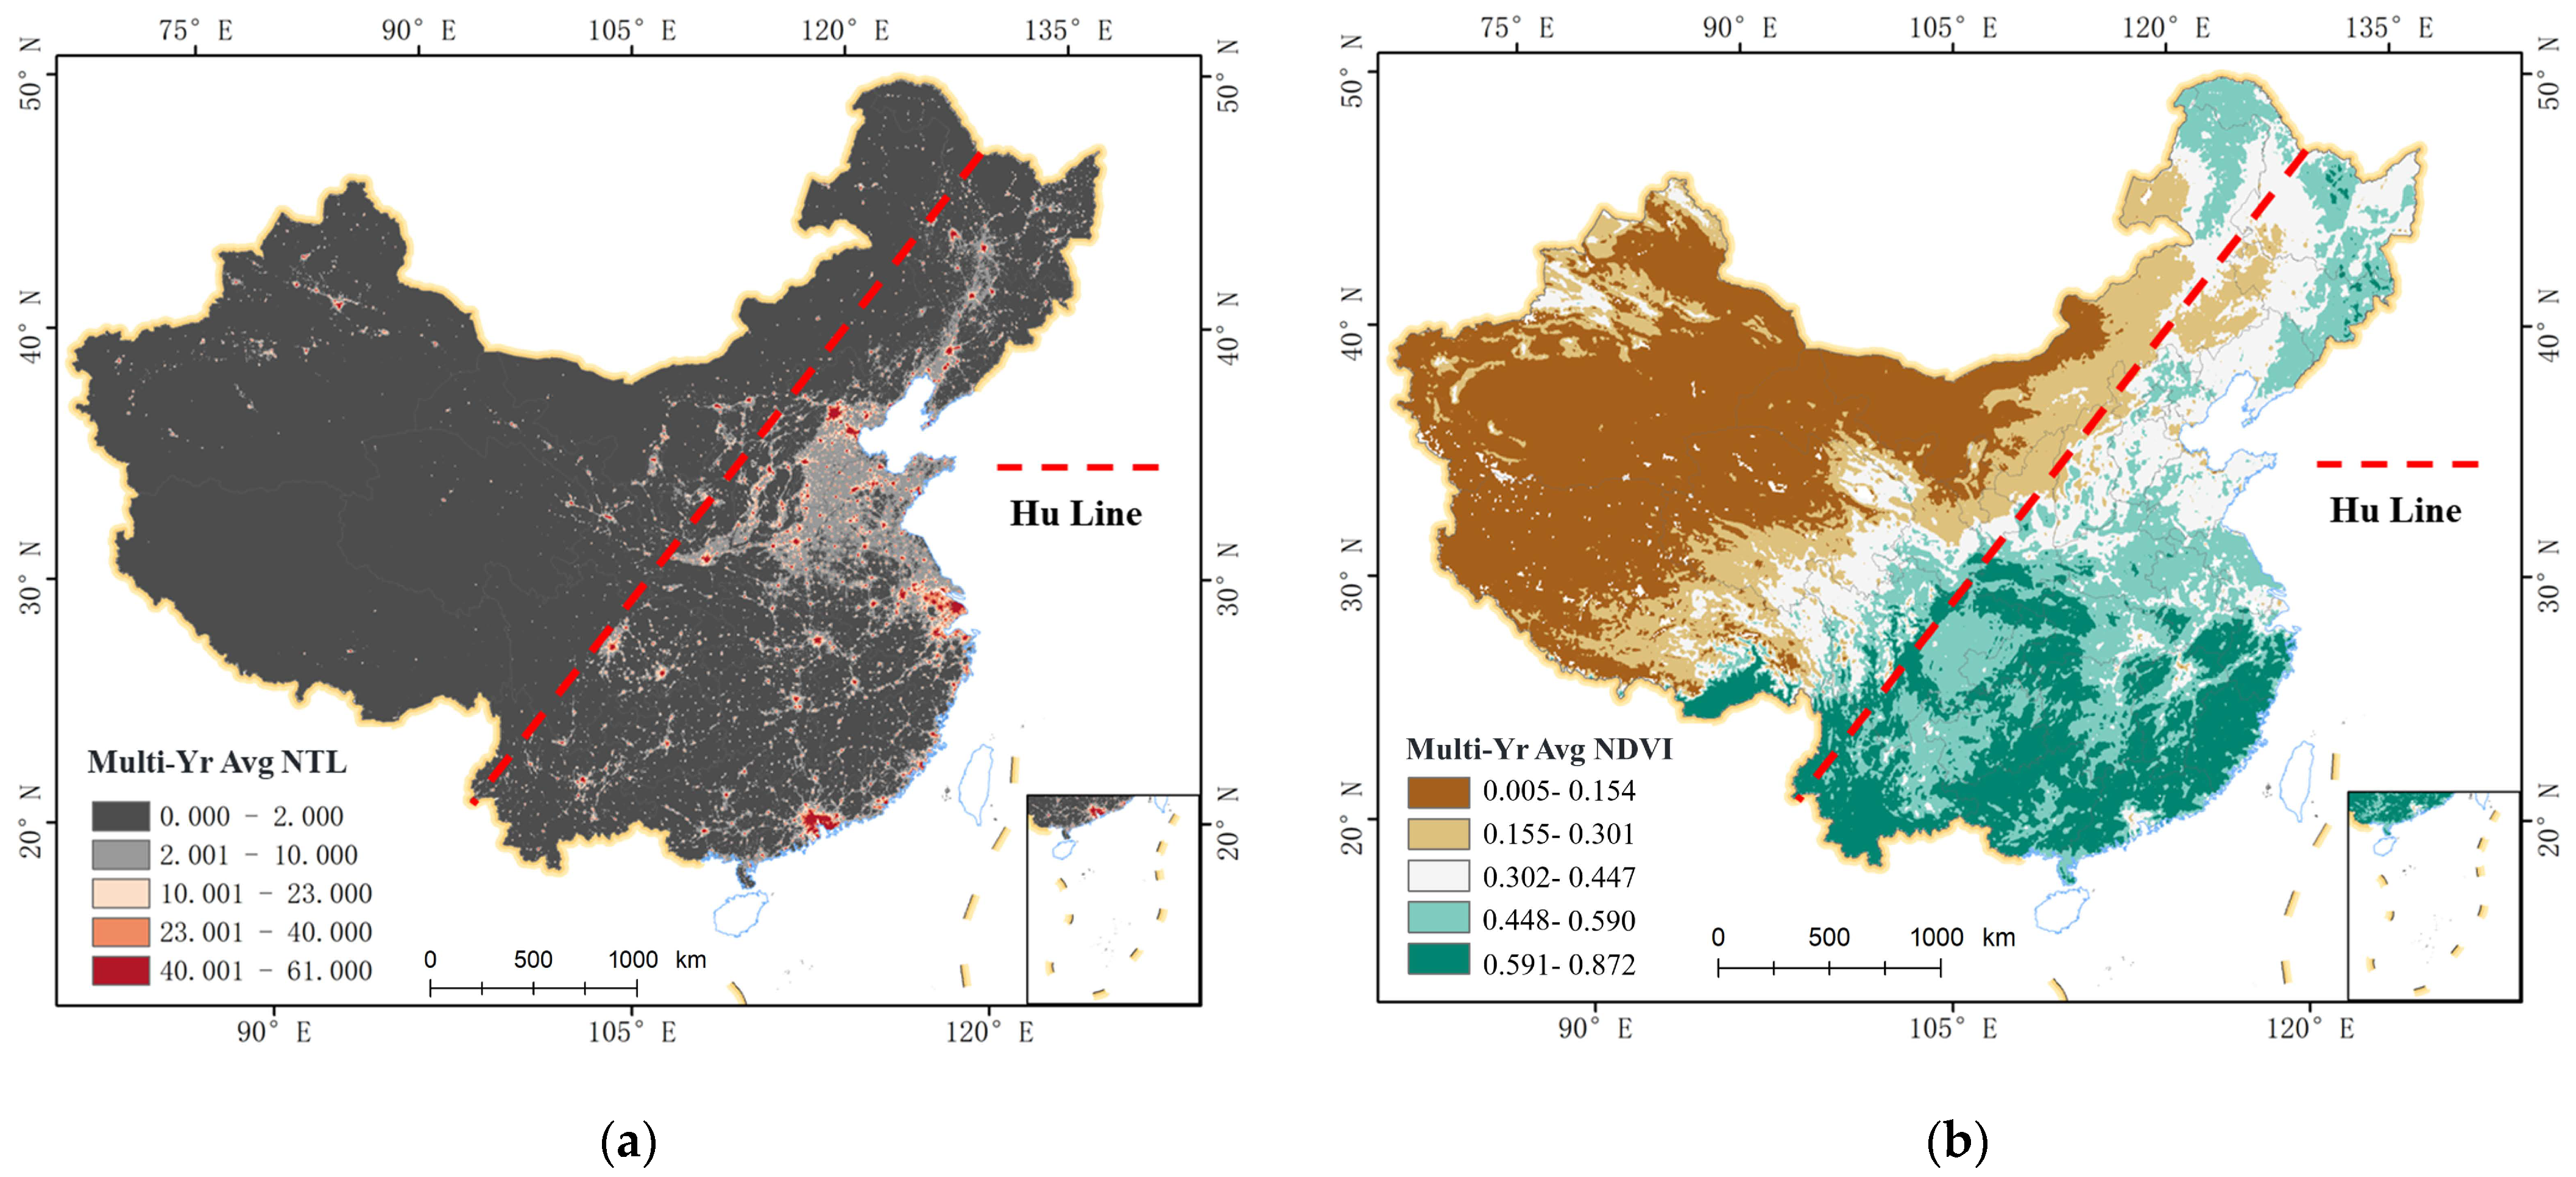
3.1. Spatial-Temporal Patterns of Nighttime Lights and Green Spaces

Within the scope of mainland China from 1992 to 2015, the temporal and spatial patterns of nighttime lights and green spaces present a fascinating narrative. The average total nighttime light emission was 2.29 × 10⁷ Digital Number (DN) units, with the eastern and western regions contributing 1.8 × 10⁷ and 4.5 × 10⁶ DN units, respectively. Regarding the Normalized Difference Vegetation Index (NDVI), the eastern and western regions presented multi-year averages of 25,408 and 15,800, respectively.
Nighttime illumination is concentrated in metropolitan regions such as the Beijing-Tianjin-Hebei area, Yangtze River Delta, Pearl River Delta, and Chengdu-Chongqing metropolitan area (Figure 2a). This reflects the heightened urbanization and commercial activity in these regions. Major cities in the northeast, such as Shenyang, Changchun, and Harbin, are also brightly lit. By contrast, the Northwestern region displays a lower light distribution, with significant contributions coming from cities like Urumqi and Shihezi in the northwest of Xinjiang. Central China’s luminosity is primarily associated with urban centers like Xi’an and Luoyang.
In parallel, the spatial distribution of green spaces, primarily characterized by vegetation, corresponds significantly with the Hu Line pattern (Figure 2b). Lush natural vegetation growth is apparent in South and Southwest China, illustrating robust greenness. Following closely is the Central China region, where favorable thermal and hydrological conditions facilitate the growth of natural vegetation and crops. North China, Beijing-Tianjin-Hebei, and the Northeast crop-growing areas display seasonal crop growth resulting in less greenness, although the forested areas of Changbai Mountain and the Greater Khingan Range in the Northeast region present good vegetation vitality.
By comparing the national distribution of lights and NDVI, we find that regions with advanced agricultural and commercial activities are densely lit, while areas with good natural vegetation coverage, plateaus, and deserts are almost devoid of light. This reflects the spatial relationship between human activity and green spaces.

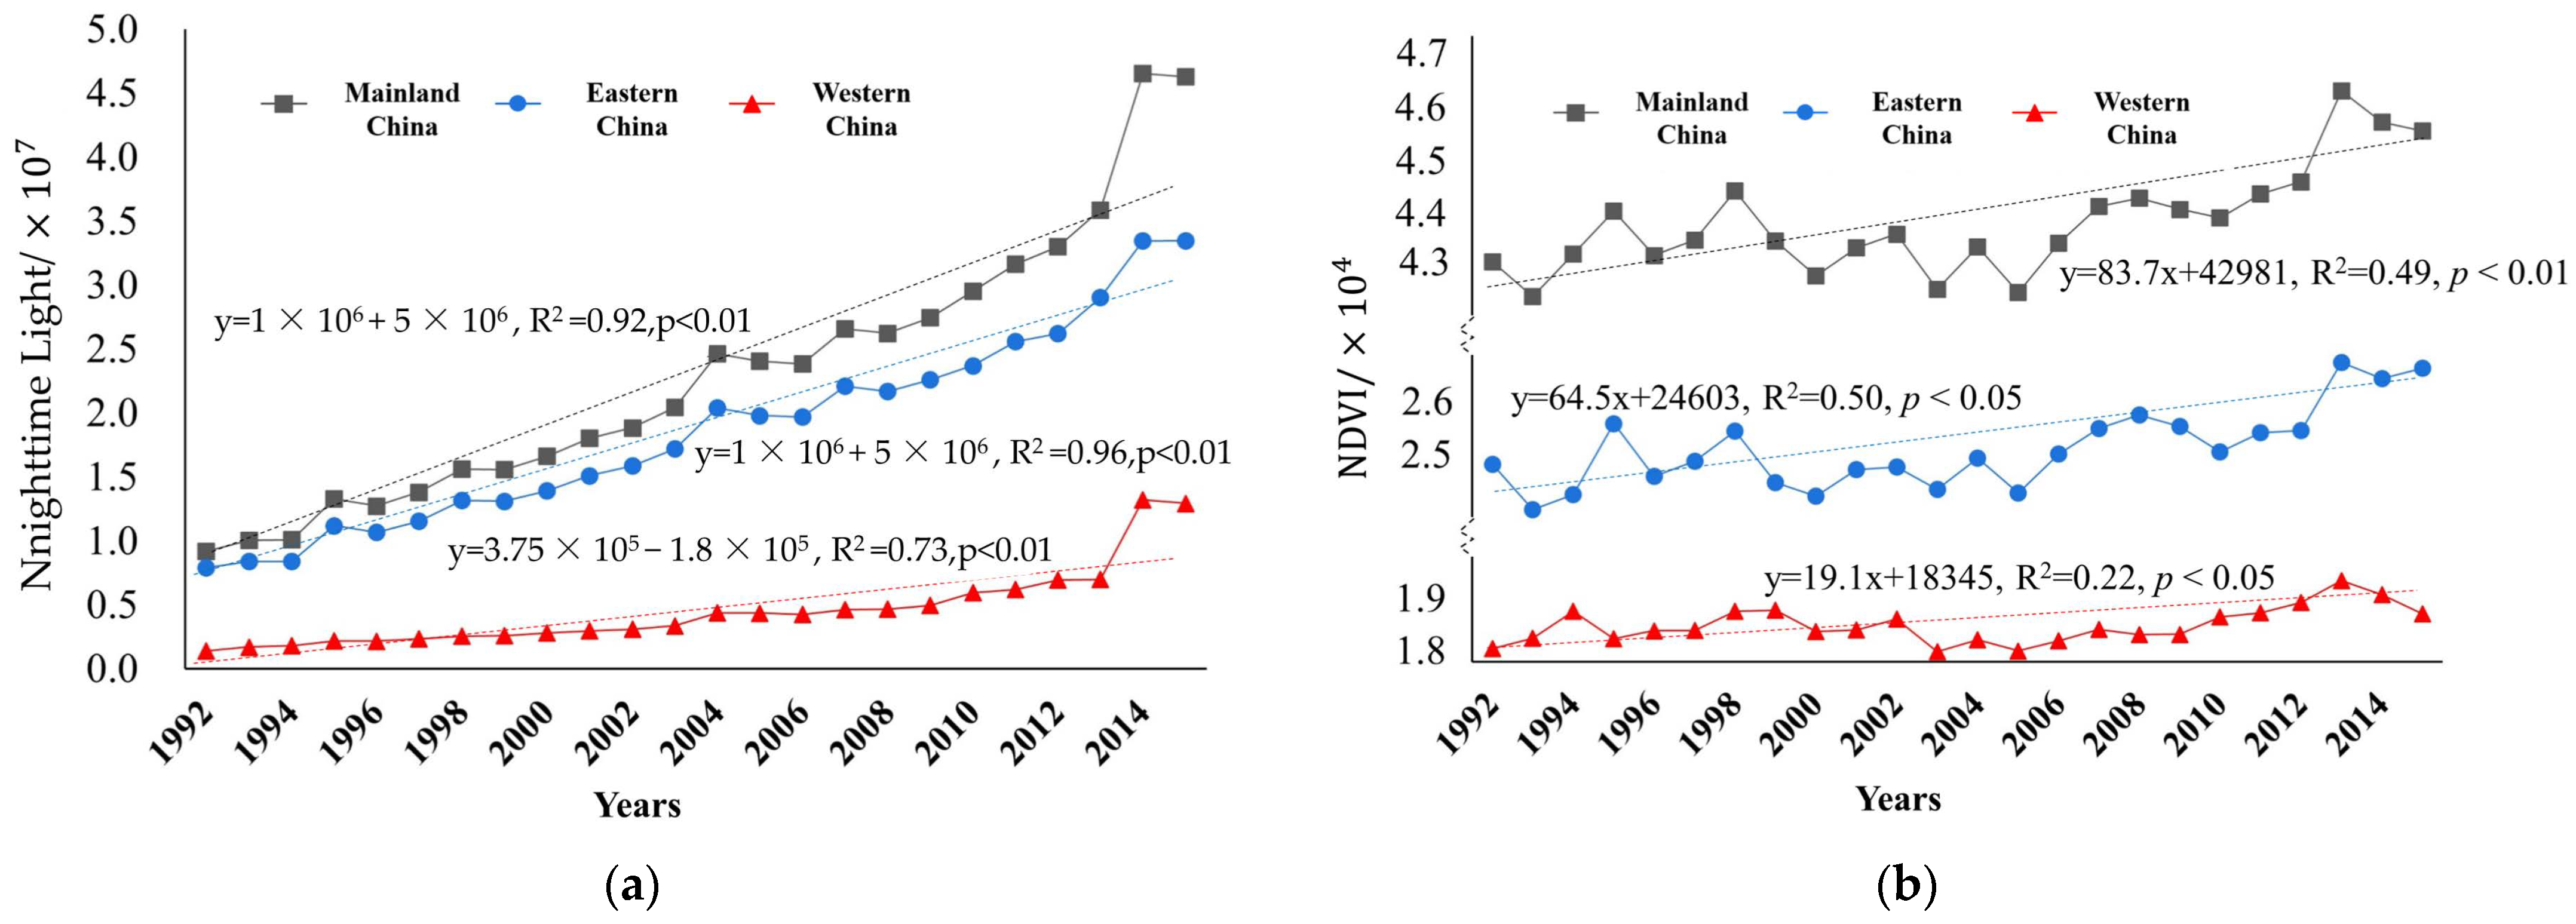
3.2. Long-Term Trends in Nighttime Lights and Green Spaces

Using a linear regression model, we analyzed the long-term trends in NTL and NDVI data (Figure 3). The results indicated a nationwide annual rate of light increase was 1 × 10⁶/year (R2 = 0.92, p < 0.01). The eastern and western regions showed annual growth rates of 1 × 10⁶/year (R2 = 0.96, p < 0.01) and 3.75 × 10⁵/year (R2 = 0.96, p < 0.01), respectively. Similarly, the nationwide annual NDVI increase rate was 83.7/year (R2 = 0.49, p < 0.05), with the eastern and western regions showing annual growth rates of 64.5/year (R2 = 0.50, p < 0.05) and 19.1/year (R2 = 0.22, p < 0.05), respectively.
This upward trend demonstrates that both lights and NDVI are in a state of growth over China, as well as east and west of the Hu Line. However, the growth in both indicators is most significant in the eastern region, which dominates the nationwide growth. The synchronous growth of lights and NDVI in the eastern region indirectly signifies not only a growth in socio-economic activities but also a focus on ecological quality in its developmental model. The western region shows a smaller NDVI growth amplitude and weaker time correlation, suggesting a limited green space and comparatively harsh natural environment.
NDVI exhibited a stable fluctuating development trend nationwide and in the eastern region before 2006, followed by a continuous growth trend. Despite the low total NDVI in the western region, it also showed a recovery growth trend after 2006. This overall improvement in vegetation in the later period could also be related to the recovery from the global vegetation growth stagnation period [50].
The long-term trends in NTL and NDVI reveal interesting insights into China’s changing landscape of socio-economic development and green spaces. However, to truly appreciate the nuances of these trends, it is crucial to consider them at a finer geographical scale. Table A1 in Appendix A provides a detailed view of these trends for specific provinces, allowing us to discern provincial-level patterns that may be overshadowed in a nationwide analysis. The significance of such an examination lies in its capacity to guide province-specific interventions and policies that account for unique local contexts.

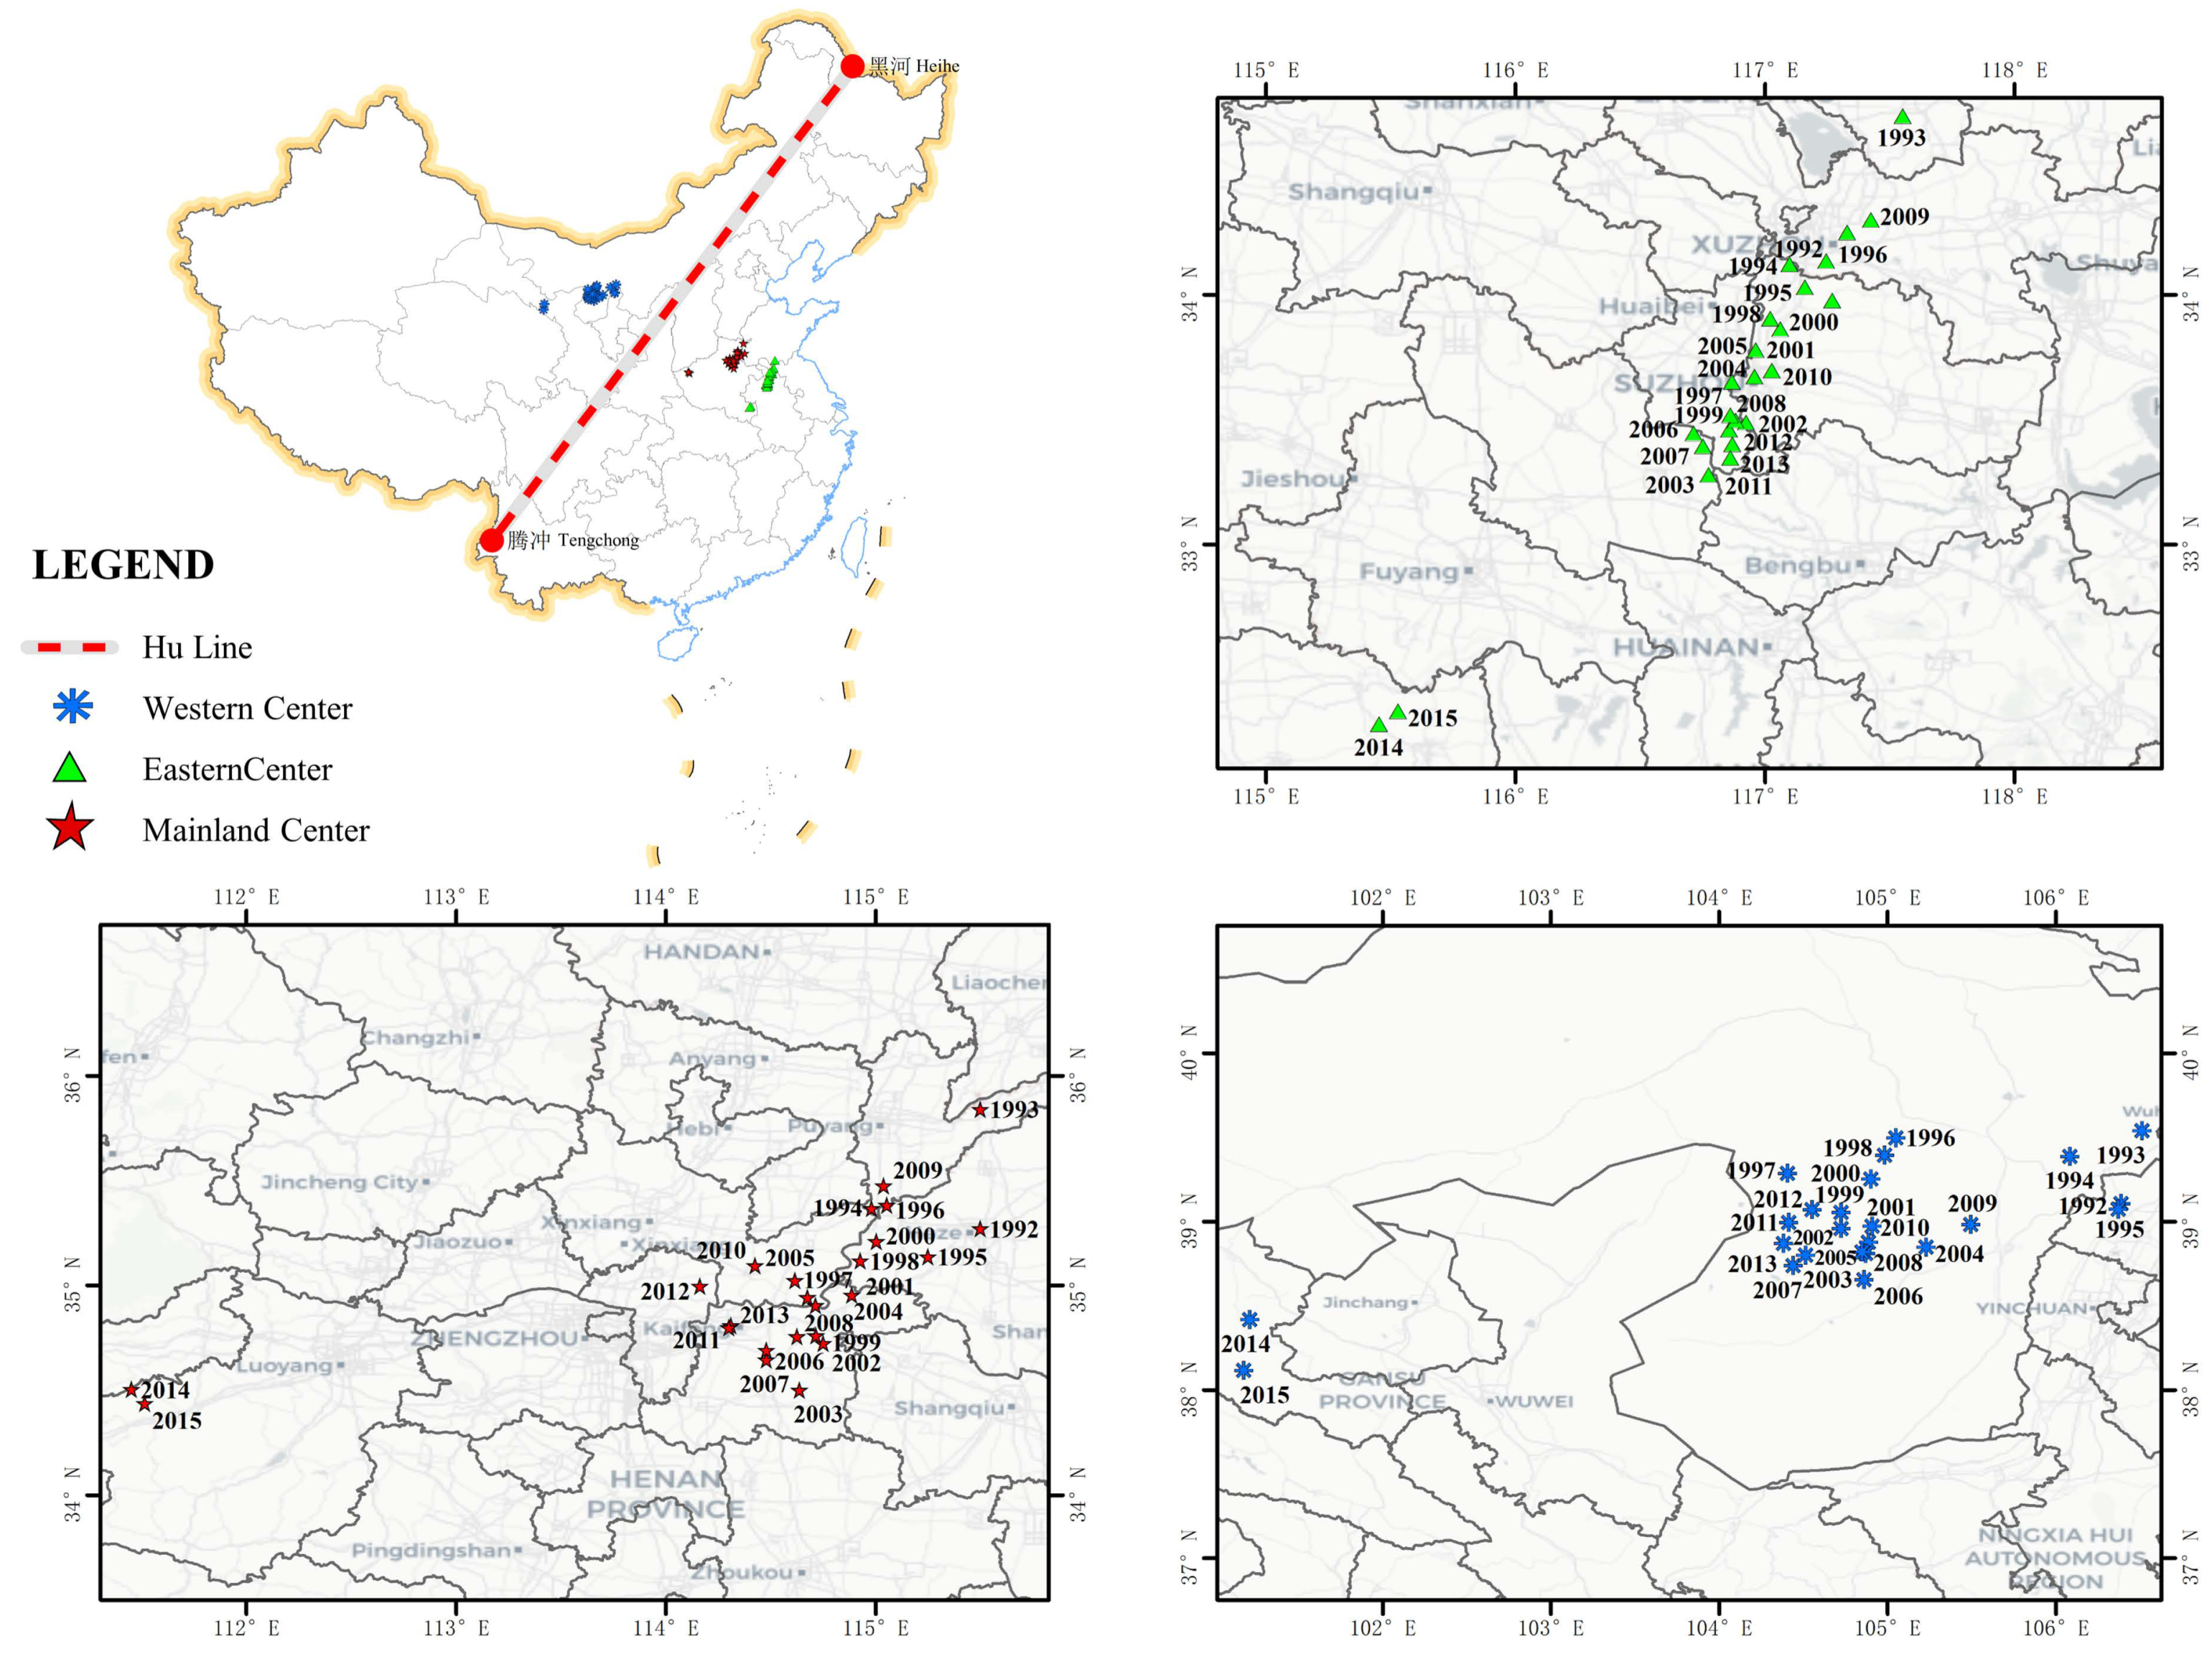
3.3. Spatial-Temporal Economic Center of Gravity

The concept of a center of gravity, stemming from physics, represents a point in a region’s space where forces from all directions maintain relative equilibrium. In this study, nighttime lights serve as an emblem of economic conditions, and their spatial-temporal center of gravity over the years has been computed utilizing a weighted method (Figure 4).
China’s economic center of gravity is predominantly clustered around Kaifeng and its northern regions. The northernmost point of this center reached Puyang City in 1993. In subsequent years, the center’s trajectory has exhibited a fluctuating trend, generally drifting southwards, as exemplified by the shift towards Luoyang City in 2014 and 2015. It is worth noting that the transition in remote-sensing sensors, particularly the shift from DMSP-OLS to VIIRS data, could account for the variations in nighttime light observations over the temporal sequence. This change may lead to alterations in brightness values and spatial patterns, potentially influencing the interpretation of trends.
For the western region, the lights’ center of gravity primarily resides in the southern part of the Alxa League. The early years saw this center in northern Ningxia, but it tilted towards Zhangye City in 2014 and 2015. In the eastern regions, the center of nighttime lights converges around the junction of Suzhou City (Anhui Province) and Huaibei City, with the overall trajectory demonstrating a southern drift.
Assessing the distribution trajectory of the lights’ center of gravity across these three scales, we find the center in the western region hugging the Hu Line closely. Meanwhile, the national and eastern centers tend to move away from this line. This implies that the intensity and total volume of socio-economic activities in the eastern regions, particularly the coastal areas, hold substantial weight. Consequently, we have introduced a quantitative analysis of coastal lights and a comparison with western lights.

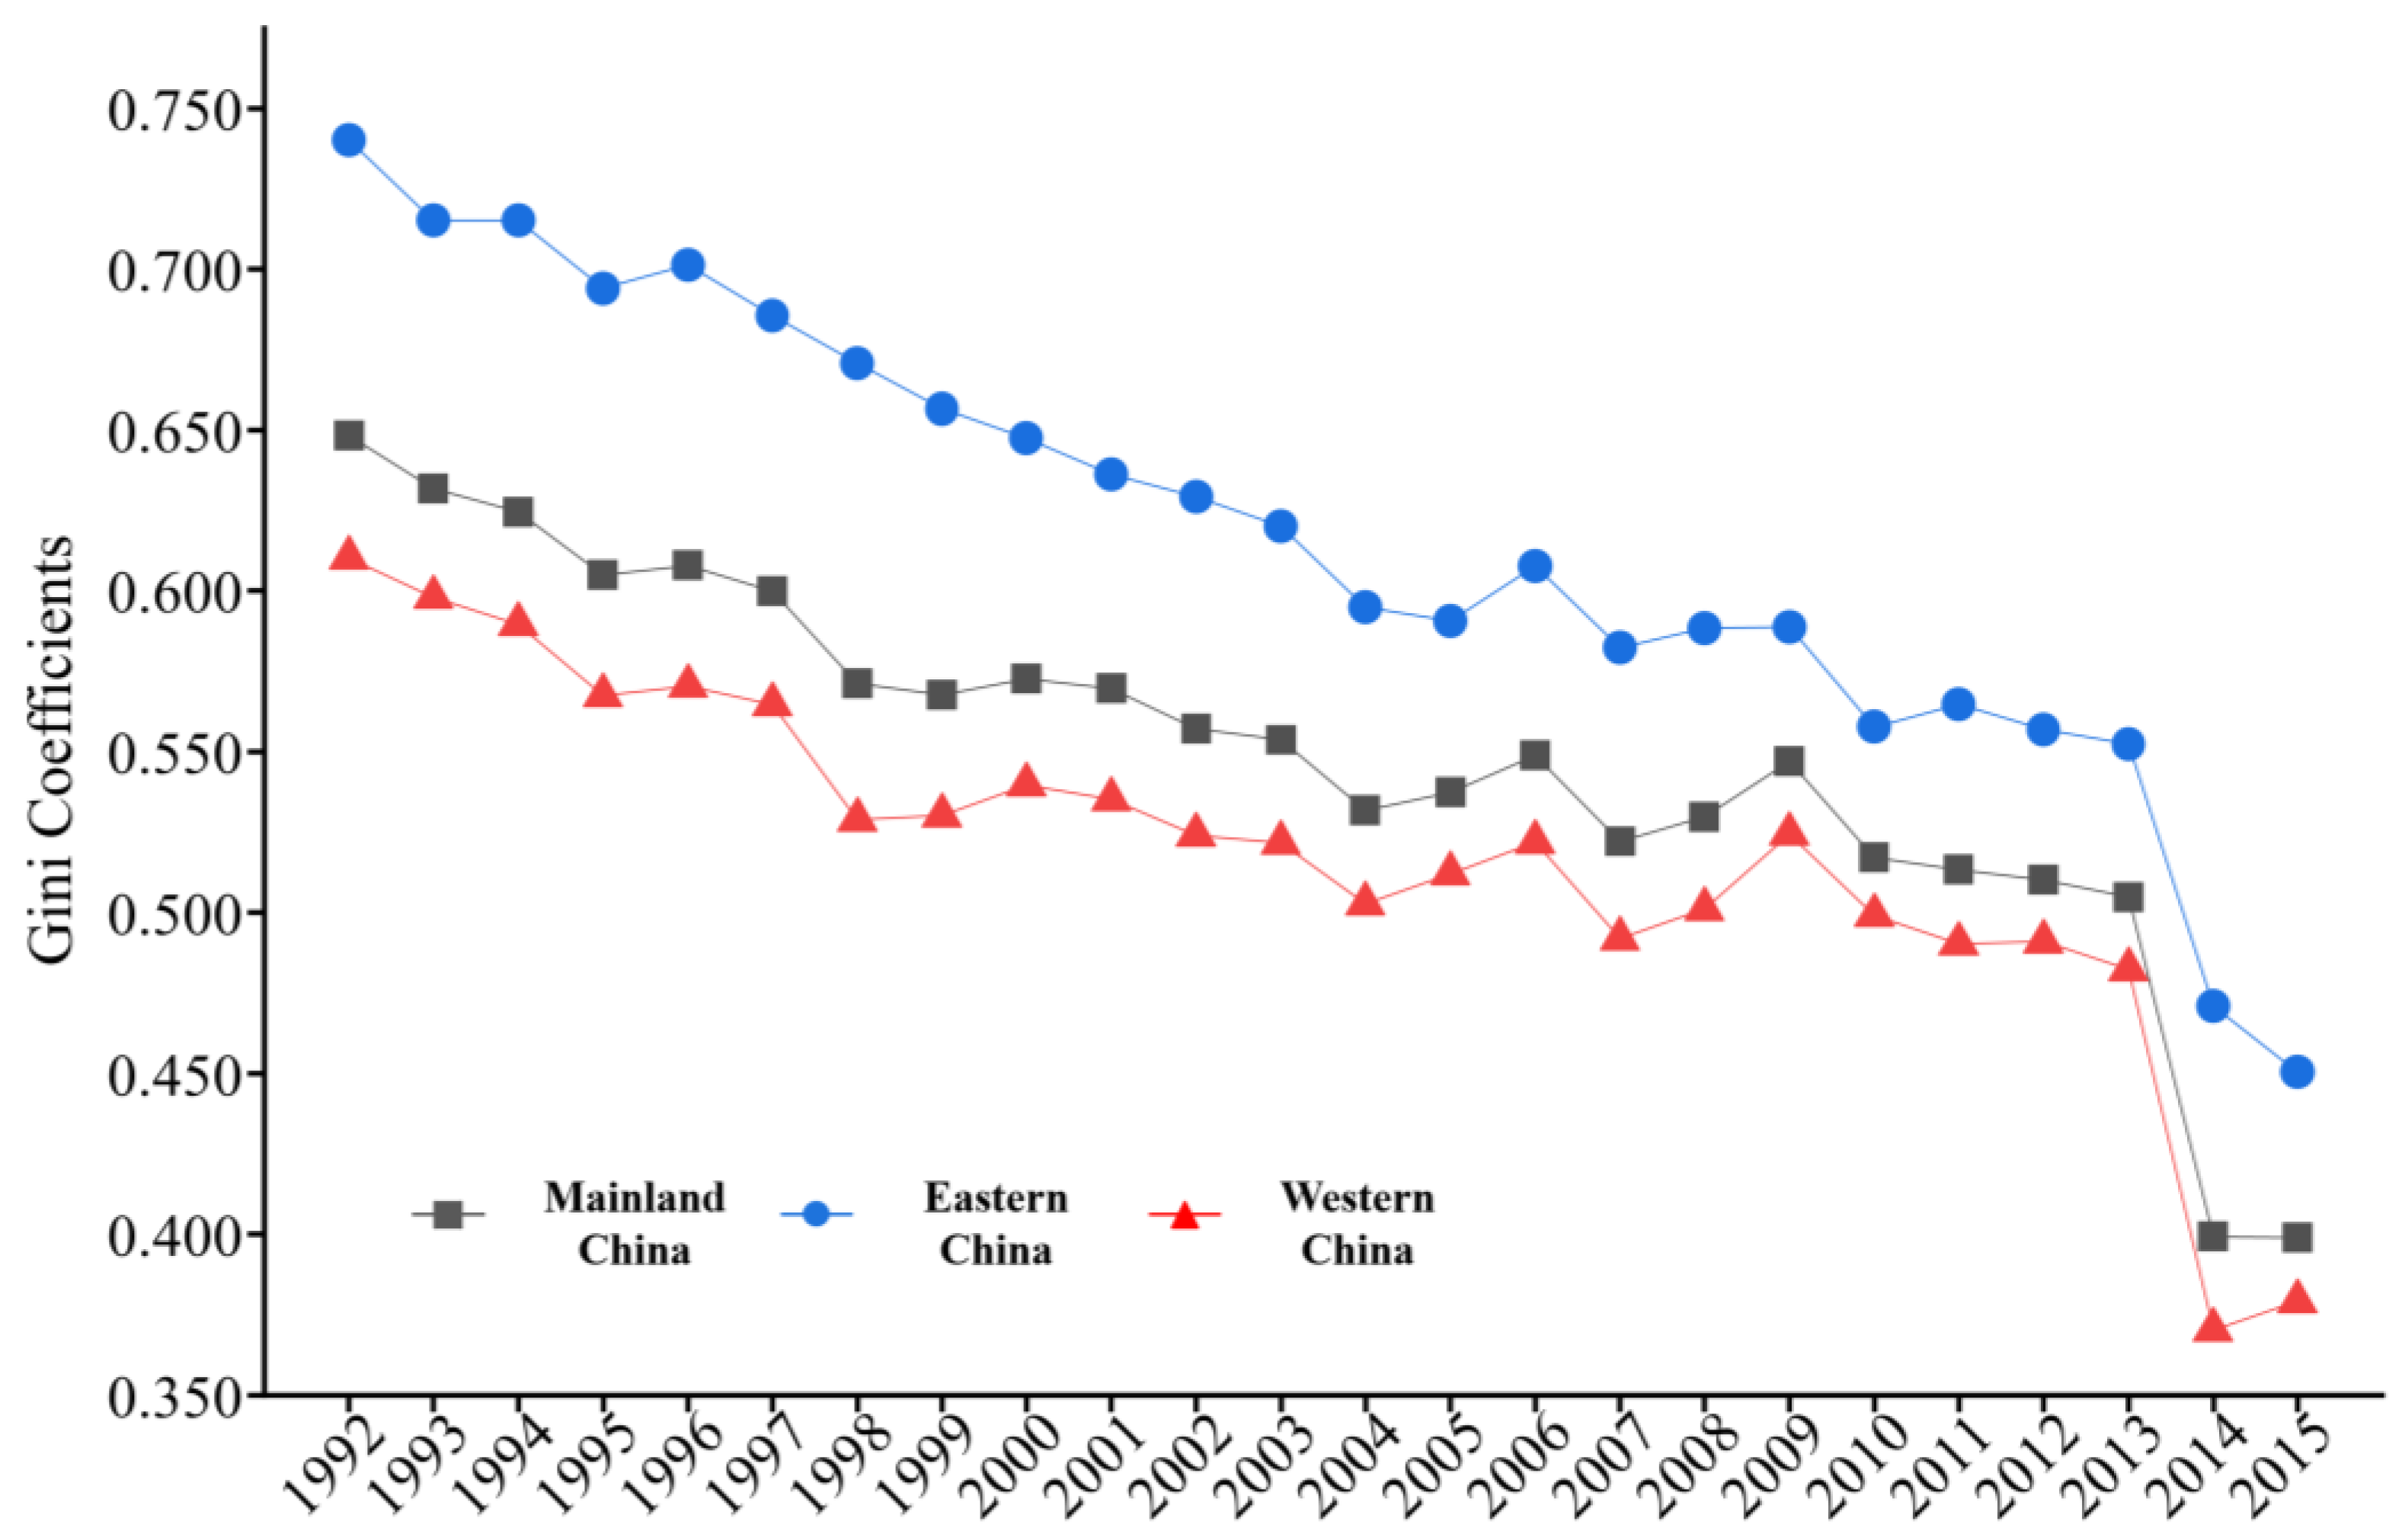
3.4. Gini Coefficient Tracking Inequalities

Understanding the differences in economic growth can provide valuable insights into the socio-economic landscape of a country. To measure such differences, we use a widely recognized tool called the Gini coefficient. Think of it as a mathematical measure that ranges from 0 (indicating everyone has the same income) to 1 (showing extreme inequality). In our study, we applied the Gini coefficient at the county level across China, both in the East and West, over several years to create a time series. The results, shown in Figure 5, vividly reveal significant variations in county-level economic development during different periods of the study, with Gini index values surpassing 0.5 (Figure 5).
Interestingly, we observed a downward trend in the Gini coefficient over time at the national and regional levels, which implies that socio-economic policies have played a significant role in modulating the disparities and insufficiencies in regional development. This downward trend is quantified by a rate of decline in the mainland China county-level Gini coefficient of 0.01/year (R2 = 0.93, p < 0.01), with eastern and western regions recording a reduction rate of 0.008/year (R2 = 0.84, p < 0.01), and 0.007/year (R2 = 0.77, p < 0.01), respectively.
This gradual reduction in the Gini coefficient is testament to major national initiatives such as the Western Development Strategy, Northeast Revitalization, Central China Rising, Precision Poverty Alleviation, and the Rural Revitalization Strategy. These policy interventions have not only elevated the overall economic output but also fostered coordinated regional development.

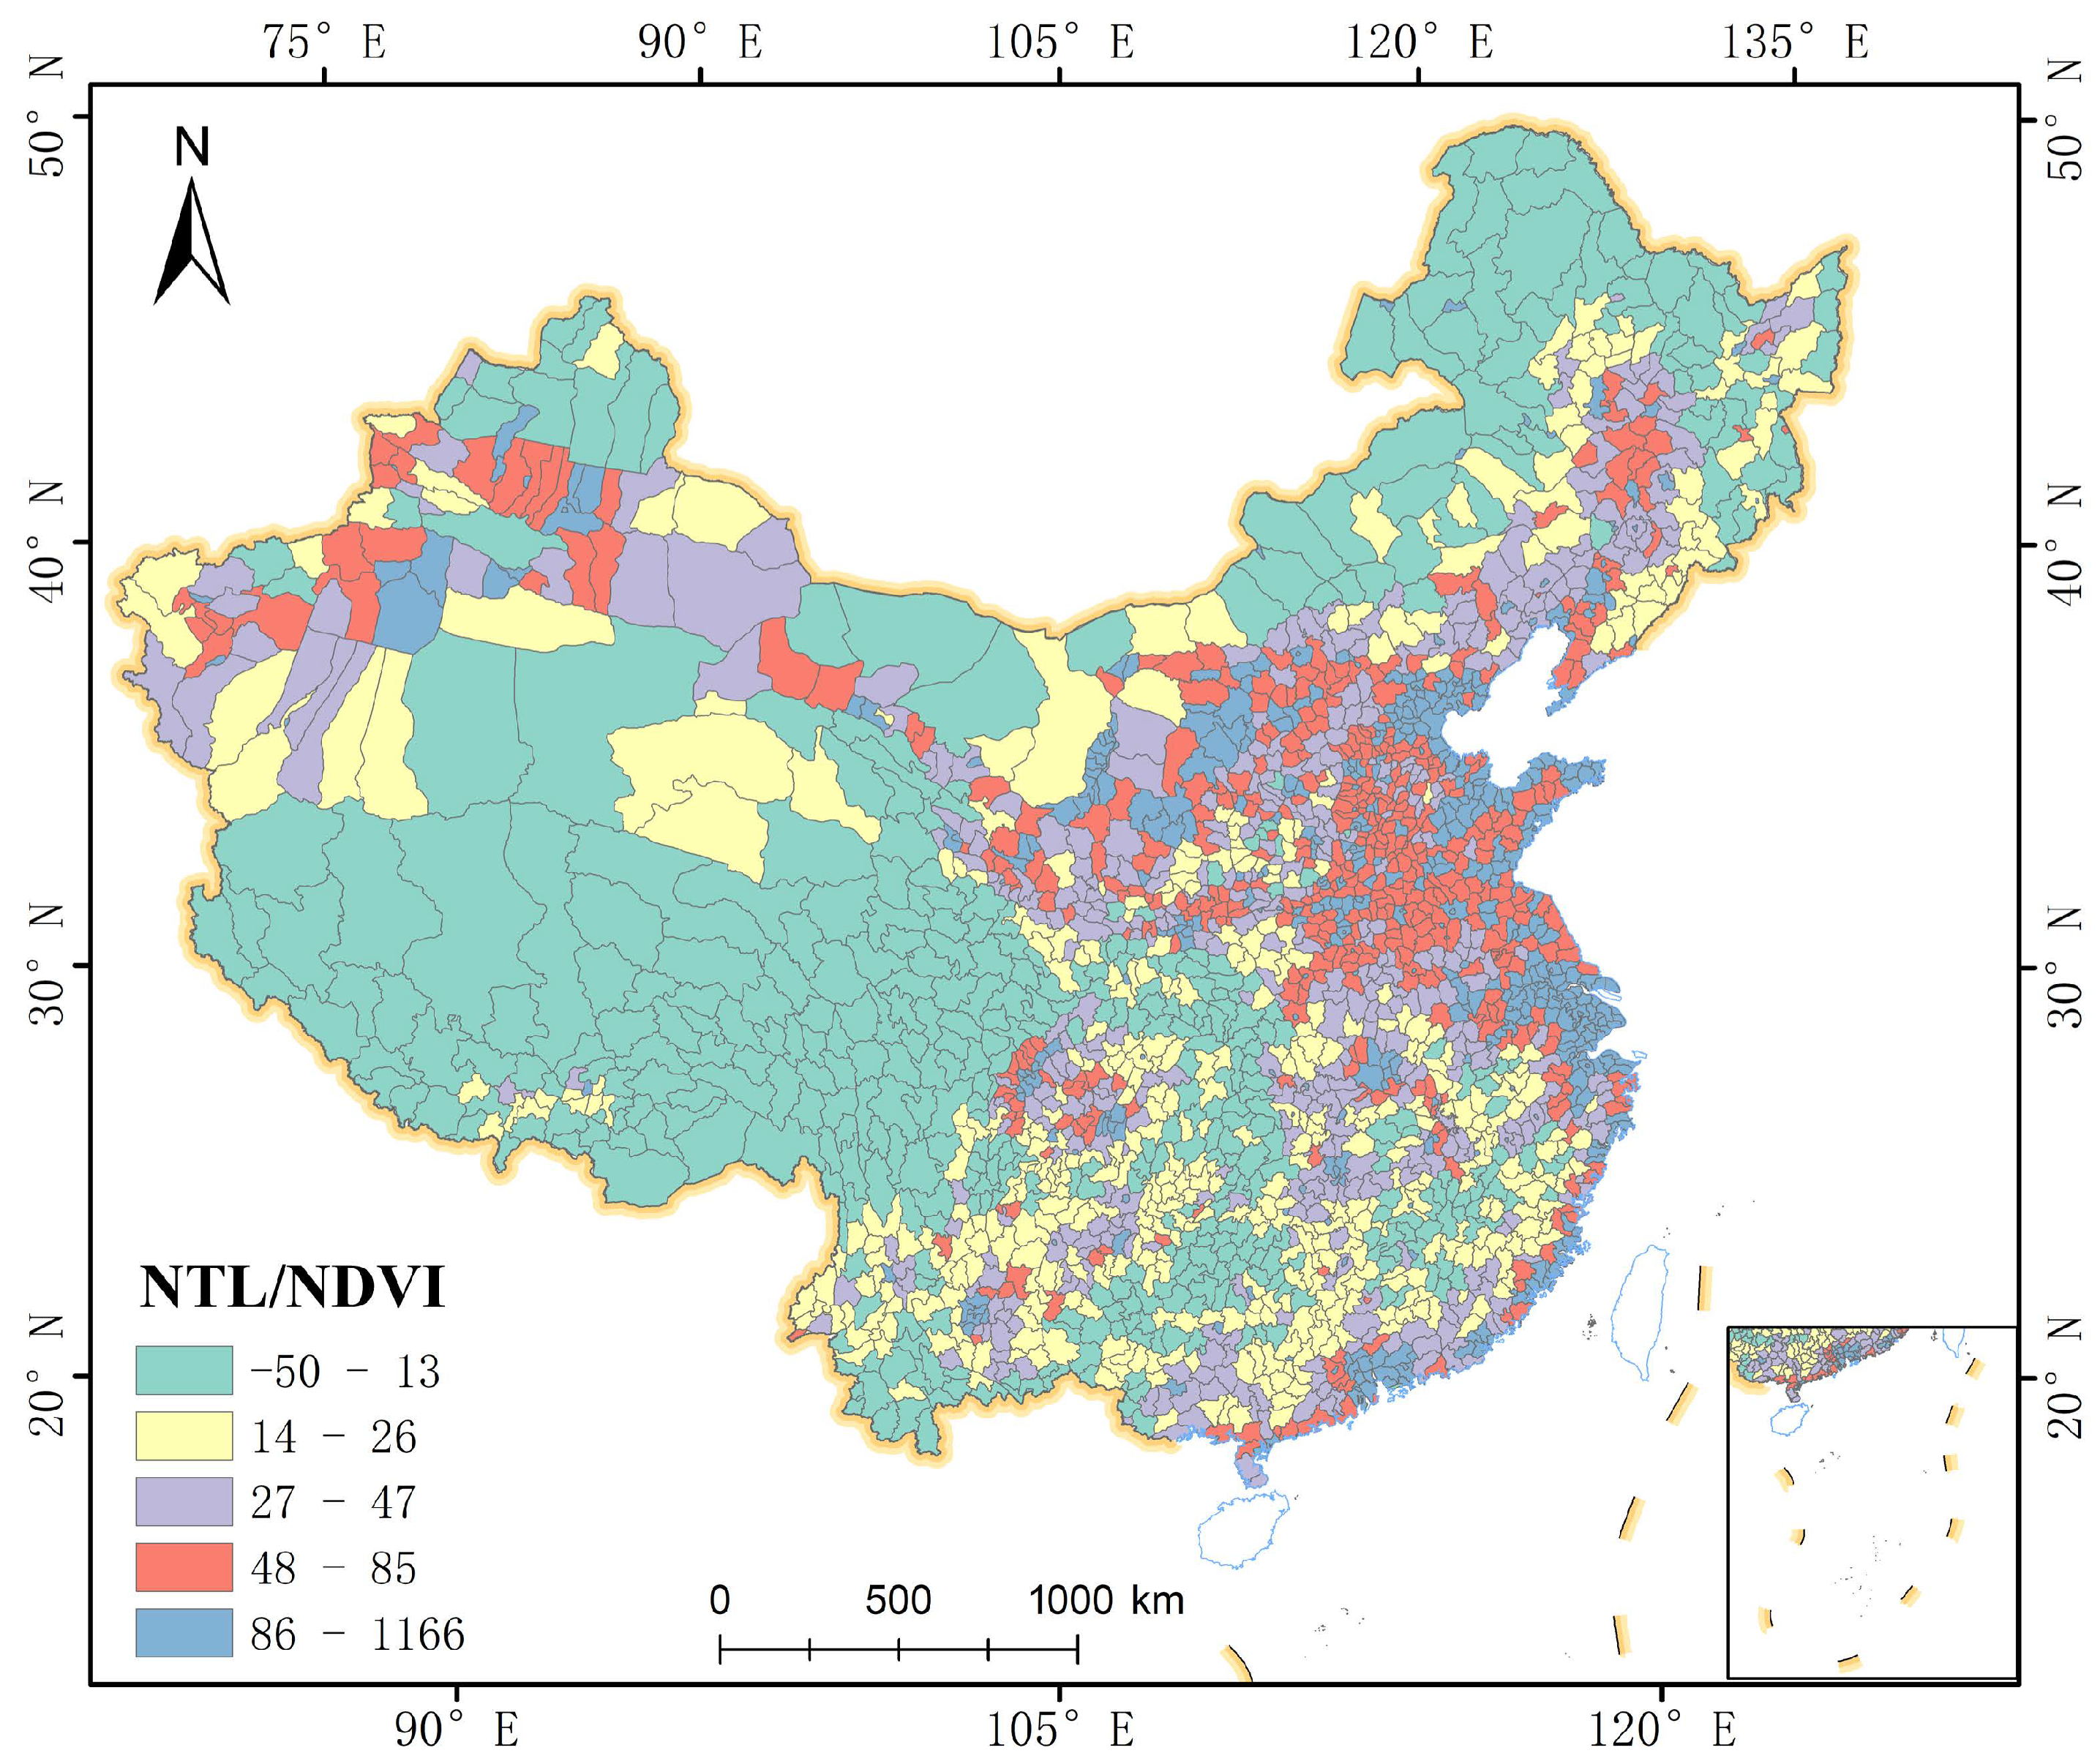
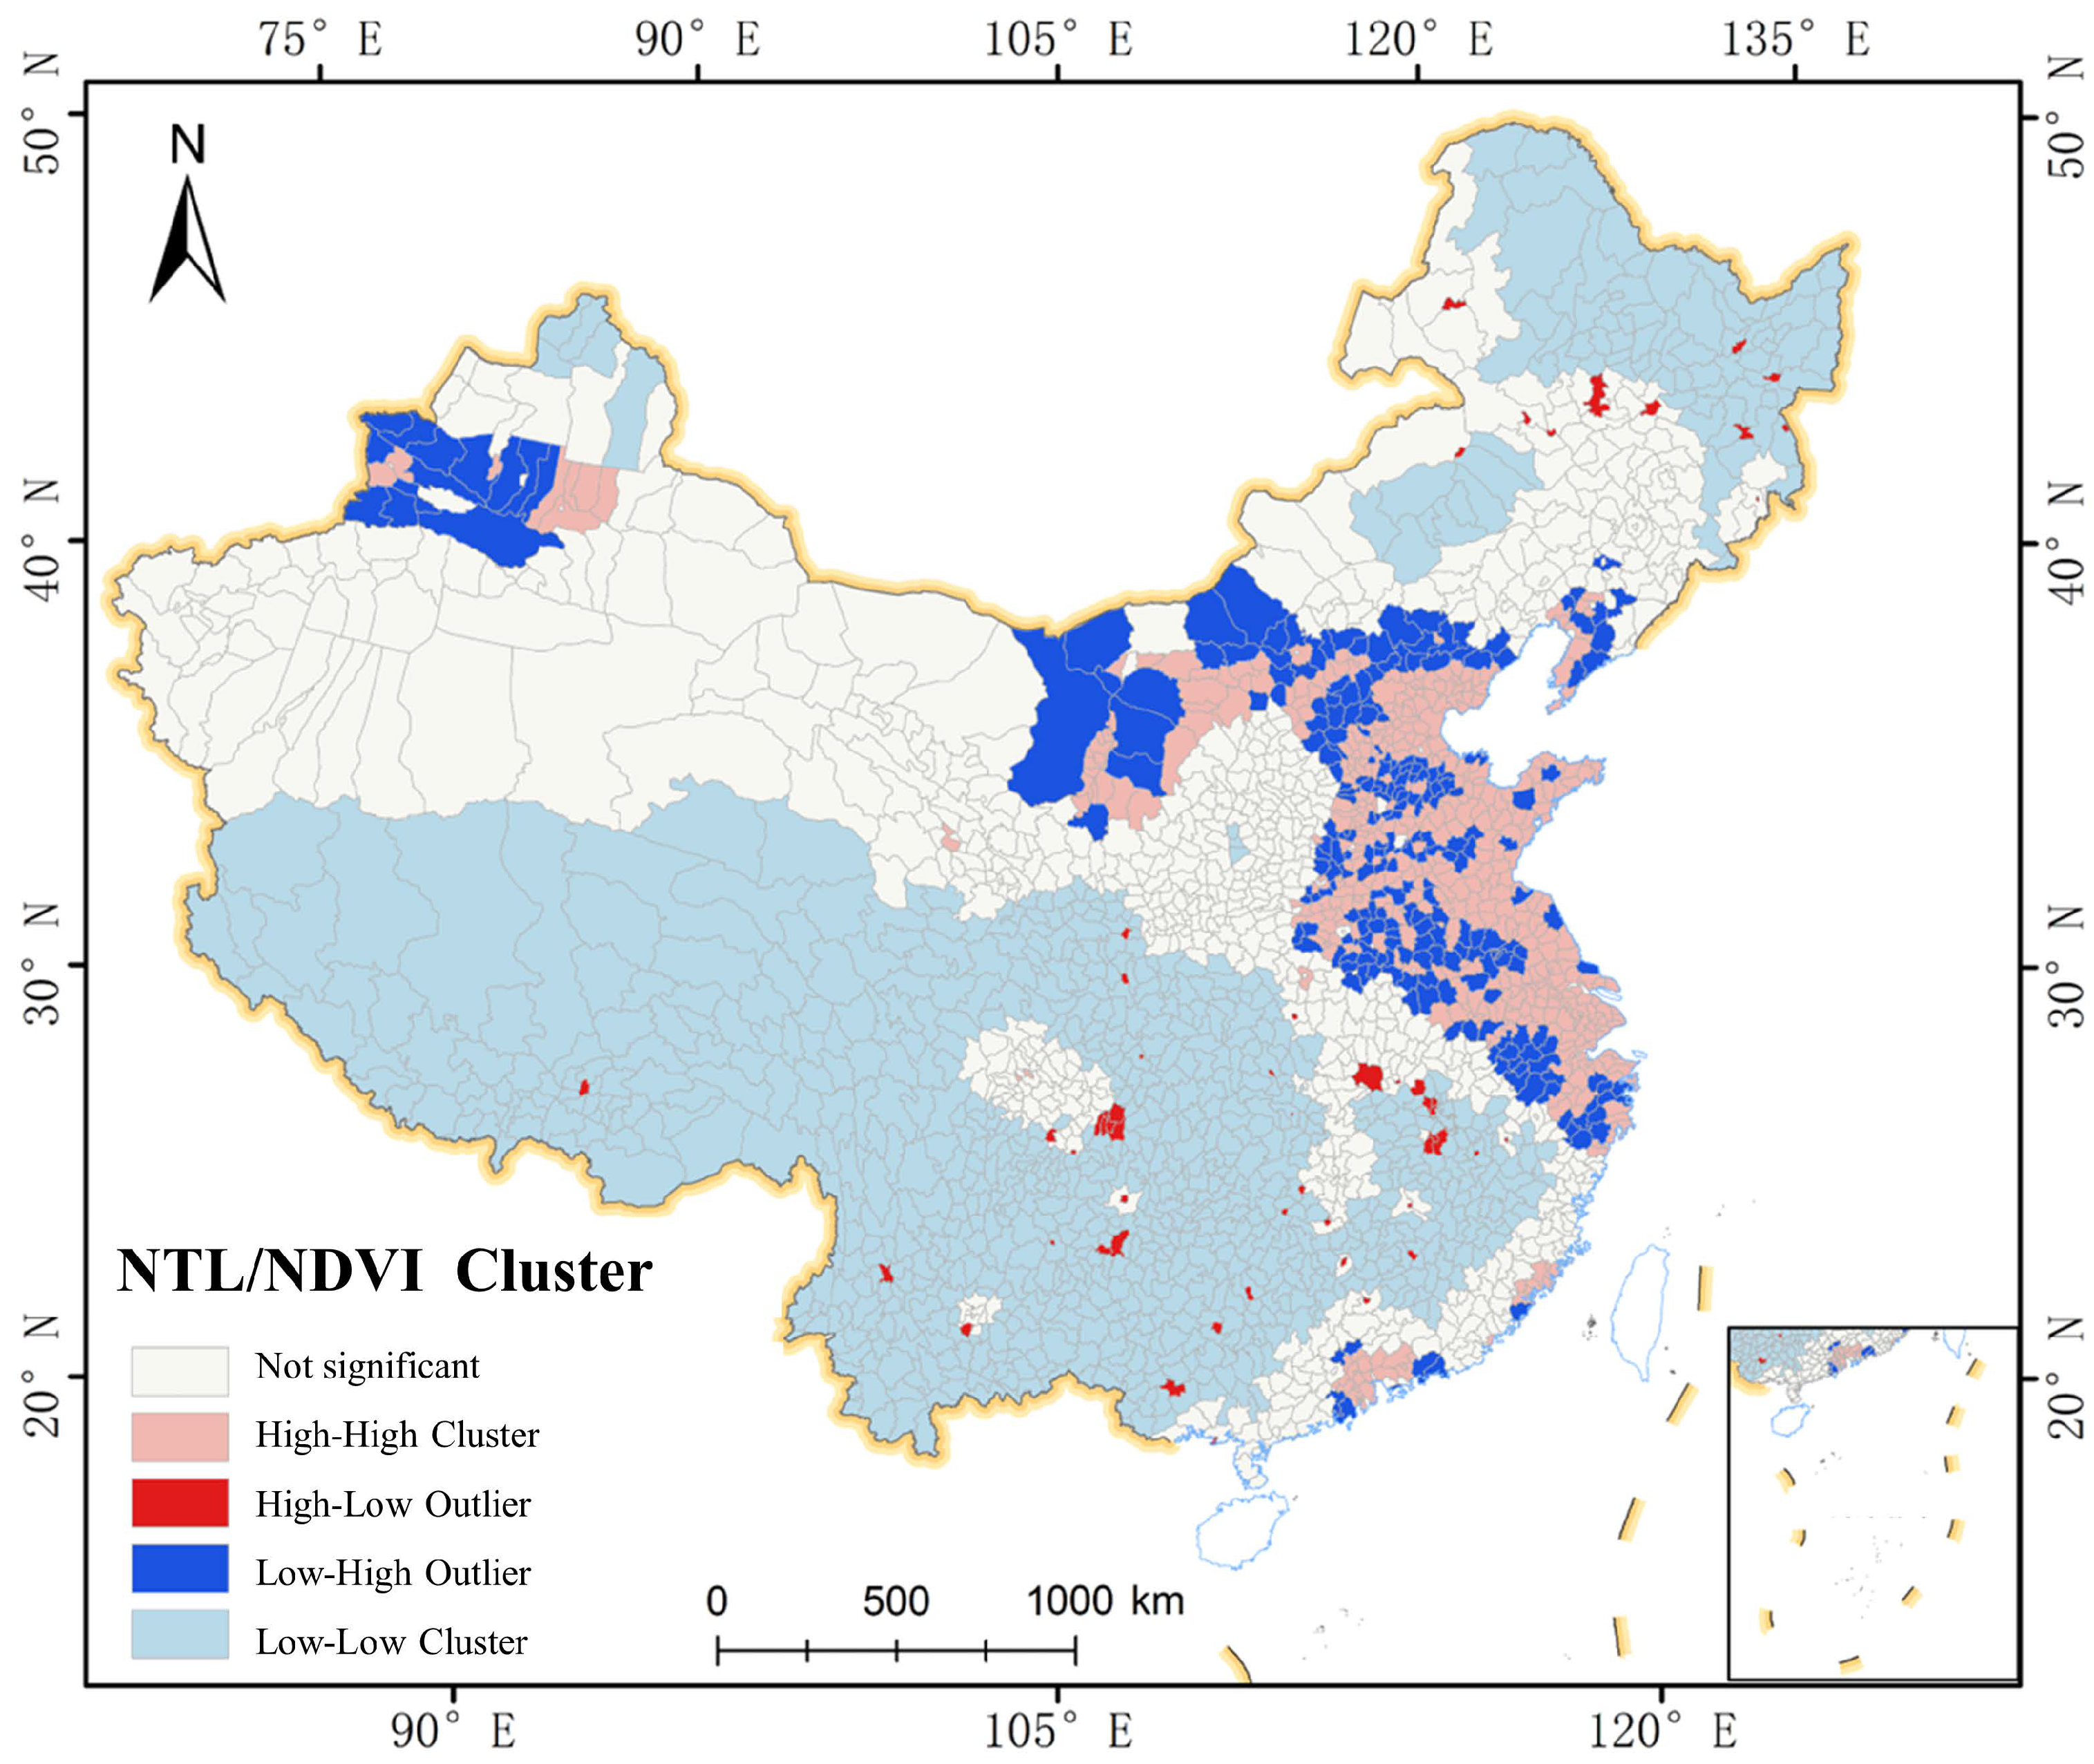
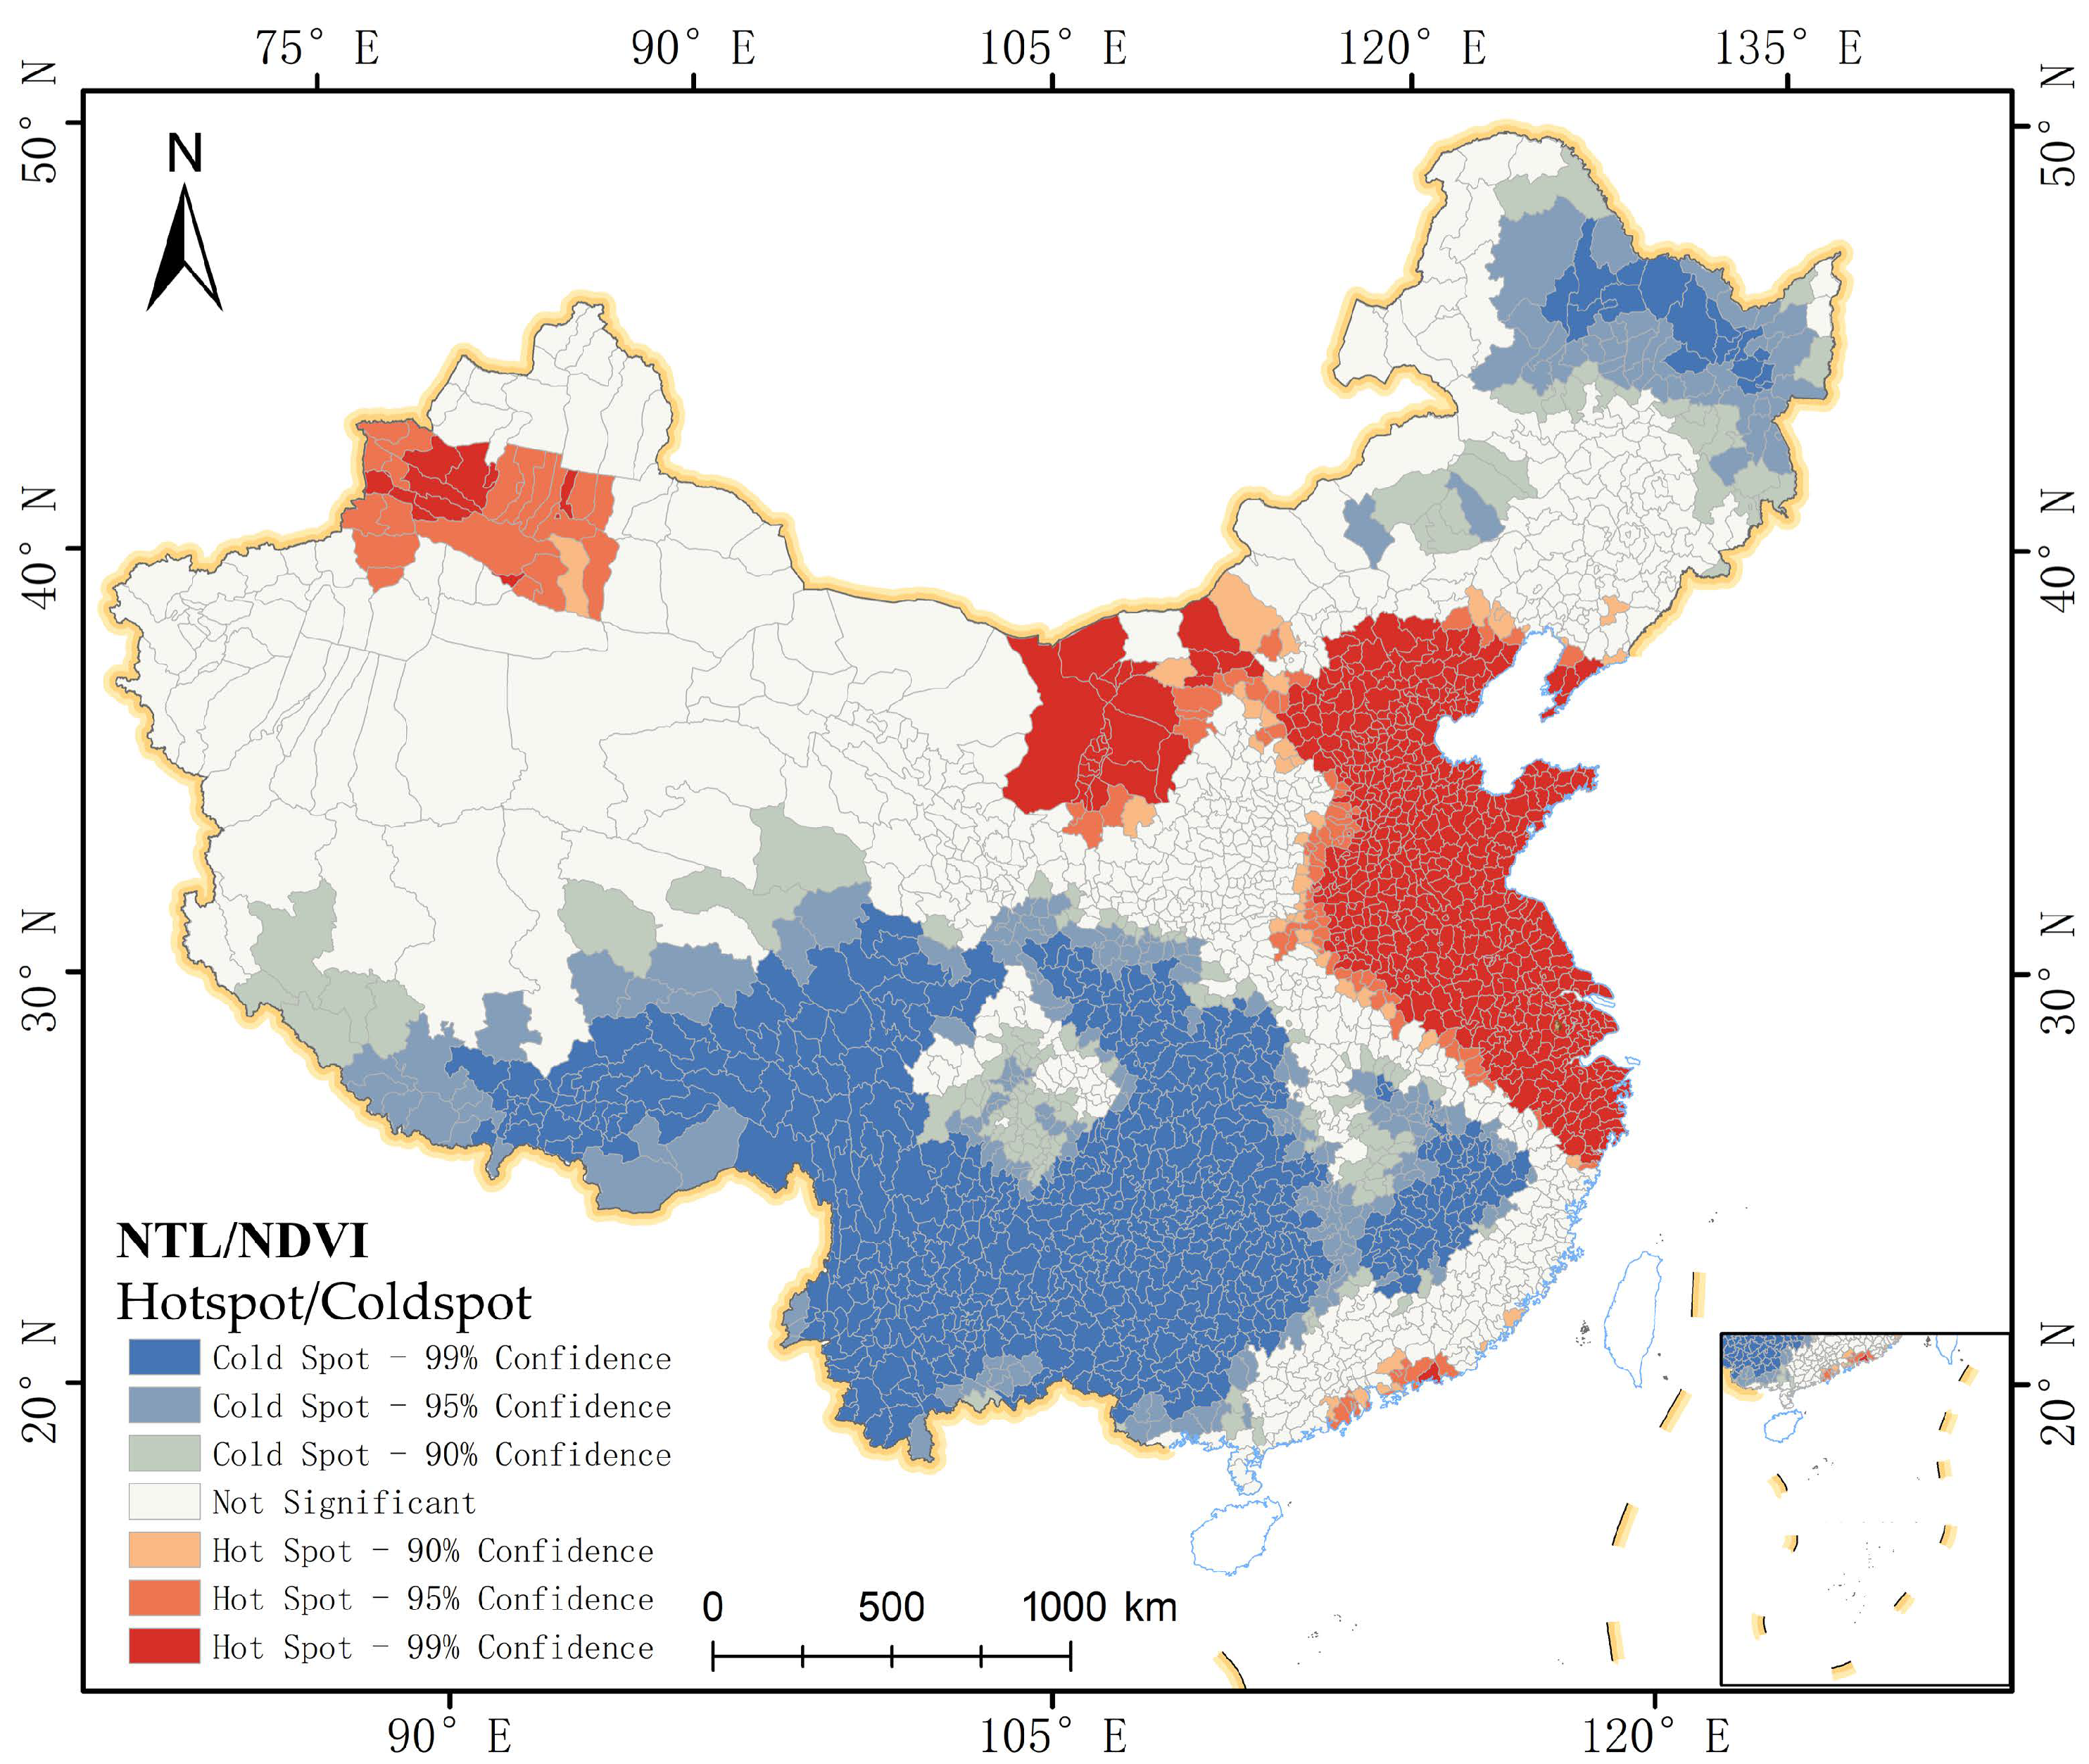
3.5. Interactions between Development and Green Spaces the NTL/NDVI Index

The dynamics of human activity and environmental sustainability can be revealed through examining the temporal and spatial changes in the Nighttime Light (NTL) to Normalized Difference Vegetation Index (NDVI) ratio. If this ratio declines over time, it signifies that the growth of green spaces outpaces the encroachment of human activity, whereas a rising ratio implies ongoing human intrusion into green spaces.
The rate of change in the NTL/NDVI index at the county level displays distinct geographic characteristics (Figure 6). Natural classification results highlight the regions around the Bohai Sea, Sunan, and the Yangtze River Estuary as areas with the most rapid increase in the NTL/NDVI index. The Pearl River Delta, central Shanxi, and the Northern Xinjiang region exhibit minor clustering of this index. Secondary growth areas are found in coastal hinterlands, such as the North China Plain, East China region, and the Northeast urban agglomeration of Shenyang-Jilin-Harbin, characterized by a discernible but comparatively smaller rise in the NTL/NDVI index.
Conversely, regions with slow or negative growth in this index are primarily located in the Qinghai-Tibet Plateau, Inner Mongolia, northern parts of Northeast China, and inner areas of Hunan, Hubei, and Jiangxi provinces. These regions have fewer human activities and a superior natural environment.
The future highly intensive development zone could likely emerge in the yellow areas, as seen in Figure 6. This is in line with China’s current situation of saturation in developed urban construction, with resources overflowing. Yellow areas are distributed in the inland regions of South China, Southwest China, Southeast China, and are sparsely located in Northeast and Northwest China.
Local Moran’s Index was employed to analyze the spatial cluster degree of the multi-year average NTL/NDVI index (Figure 7). Significant “high-high” cluster regions include Beijing-Tianjin-Hebei region, Shandong Peninsula, Jiangsu, and the Yangtze River Delta, indicating that these areas have highly intensive development zones with significant correlations.
“Low-high” outlier regions lie on the western edge of these “high-high” areas, suggesting that these regions, despite being adjacent to high-intensity areas, have not reached high development intensity themselves. Due to their close spatial proximity, these “low-high” outlier regions have high potential for development and are potential future urbanization areas.
“Low-low” cluster regions are mainly located in the Qinghai-Tibet Plateau, Southwest China, and the inland areas of Southeast China, corresponding to regions with good vegetation coverage and fewer human activities. There is no significant spatial correlation in regions like northern Xinjiang, Ningxia, Shanxi, and southern Hebei.
Lastly, we explored the spatial distribution of hot spots and cold spots of the NTL/NDVI index using the Getis-Ord Gi* method (Figure 8). The spatial pattern closely aligns with the cluster degree but more prominently highlights the high-intensity development and green space pressure in North and East China. The Central Inner Mongolia and Urumqi Economic Belt in Xinjiang are also outstanding hot spots, while the cold spots are mainly located in the southwestern and northeastern regions with high vegetation coverage.

4. Discussion

4.1. Disparities in Development: A Closer Look at Coastal and Western Nighttime Lights

Using the mainland’s coastline as the base, we created buffer zones extending landward (10, 20, 30, 40, 50, and 100 km). We used ArcGIS’s regional statistical method to obtain the total amount of lights within each zone.
The annual light values of the counties west of the Hu Line were sorted using the rank-size method. For each year’s data, we calculated the number (n) of western counties equivalent to the total coastal lights, dividing n by the total number of western counties to obtain the results presented in Figure 9. This illustrates how the coastal lights equate to the lights of numerous western counties.
The results suggest that the proportion of coastal lights rapidly escalates as the buffer distance increases. By the 30 km buffer distance, the eastern coastal lights have already approximated the total amount of lights in all the western counties. Within the 10–30 km buffer zones, the proportion of coastal lights relative to the western regions has decreased over time. This suggests a significant increase in the total amount of western lights and implies that coastal development is nearing saturation. Within the 100 km coastal buffer zone, except for 2014 and 2015, the lights have already entirely surpassed the western provinces.
The intense light agglomeration effect along China’s coastline mirrors the global disparity between coastal and inland regions. The fact that the Baltic Dry Index can serve as a barometer for the global economy is linked to the advantageous shipping conditions along coastlines. Similarly, China’s early reform and opening-up zones were mainly concentrated in the southeastern coast, which is conducive to attracting foreign investment.
The stark contrast between coastal and western nighttime lights is a powerful testament to the spatial disparities in China’s development. To further elaborate on this point, we provide in Appendix A Table A2 the original experimental data depicting the sum of lights in the buffer zone equating to the total number of county-level units in the area west of the Hu Huanyong Line. This figure quantitatively illustrates the magnitude of developmental disparity between the coastal and western regions, highlighting the need for targeted strategies to foster balanced development across China.

4.2. Comparison with Established Baselines

To provide a comprehensive context for our findings, we compare our study with established benchmarks, shedding light on both convergence and divergence about existing research. We begin by contrasting our experimental results with a traditional data study, which investigated China’s economic inequality from 1978 to 2018 using conventional statistical data [51]. Guo et al., (2023) research on GDP revealed a multi-stage economic growth trajectory and reduced inequality. In tandem, our study, utilizing nighttime light (NTL) data, uncovered a corresponding trend of diminishing inequality over time, particularly evident in the context of the Gini coefficient. Both studies highlight the intricate dynamics of regional disparities, emphasizing the complex interplay among economic growth, spatial distribution, and policy implementations.
Our study offers a novel perspective by leveraging NTL data as a proxy for economic development and spatial distribution. This approach provides an alternative lens to evaluate economic inequalities and developmental trends. While traditional study data focuses on GDP and regional nuances, our research integrates NTL data to capture urbanization and commercial activity’s intensity and distribution. This nuanced insight enriches our understanding of the relationship between economic advancement and spatial patterns, enhancing discussions on China’s regional variations. In synthesis, these perspectives deepen our insight into China’s socio-economic landscape. While Guo’s study offers a panoramic view of China’s economic evolution, our research delves into the intricate interplay of urbanization, economic growth, and spatial disparities, enriched by the innovative lens of NTL data.
Furthermore, compared with the findings from Smith et al.’s poverty mapping study [52], our analysis of the Gini coefficient, derived from NTL data, reveals similar distribution trends. Notably, our Gini coefficient and those from the poverty map study indicate lower poverty rates in China’s coastal areas than in its interior regions. A distinct pattern of reduced Gini inequality indices in western China in contrast to eastern China emerges (Figure 5). However, it is essential to acknowledge that these inequality indices measure wealth distribution. As a result, regions with low wealth may exhibit low inequality values, while regions with high wealth may manifest high inequality values. This distinction diverges from the poverty index used in the mentioned poverty map study. For example, our nighttime light data and nighttime light-vegetation index both reflect Xinjiang, a province depicted as economically disadvantaged on the poverty map and in other inequality studies. However, the internal inequality values are relatively low. Our Gini coefficient and vegetation index also illustrate this point. Inequality is manifested not only in terms of economic development but also in terms of green spaces.
Additionally, building on our earlier study where we explored the temporal evolution of inequality using original GDP, population, and Defense Meteorological Satellite Program—Operational Linescan System (DMSP-OLS) NTL data for 226 Chinese cities spanning 1994 to 2011 [53], our present investigation reinforces these observations. The inequality indices from similar data mirror the escalating inequality trend between China’s western and eastern cities over this timeframe [54,55]. Notably, our study’s use of remotely sensed NTL data enables extensive analyses and mitigates susceptibility to inflation-related influences compared to statistical data used in previous investigations.

5. Conclusions

In this comprehensive investigation of socio-economic development and green space distribution in China from 1992 to 2015, we have harnessed the power of nighttime light data and the Normalized Difference Vegetation Index (NDVI) to reveal the spatial-temporal dynamics. The results provide a rich tapestry of insight into how urbanization, commercial activity, and environmental sustainability intersect, ultimately shaping the landscapes of human activity and nature.
Using nighttime light emissions as a surrogate for socio-economic development has proven a potent tool, with our analysis uncovering stark regional disparities. The eastern metropolitan regions of China, rich in urbanization and commercial activity, are ablaze with light, while their western counterparts offer a contrasting tableau of lower light distribution. The distribution of green spaces across the mainland further emphasizes this stark dichotomy in socio-economic development. In alignment with the Hu Line, we found that robust vegetation growth is predominant in South and Southwest China, casting a sharp relief against the less green northern regions.
In tracing the longitudinal trends of both nightlights and NDVI, we discovered that China is in a state of nationwide growth. However, this growth is not uniform. The eastern region, in particular, stands out as a powerhouse, dominating the nationwide growth in both lights and NDVI. This dual growth signals not only a burgeoning of socio-economic activities but also a burgeoning interest in maintaining ecological quality. The western region, in contrast, is marked by a smaller NDVI growth amplitude, suggestive limited green space and a harsher natural environment.
Turning our gaze towards the coastal areas, we found an intense light agglomeration effect that mirrors the global disparity between coastal and inland regions. As the buffer distance from the coastline increases, the proportion of coastal lights rapidly escalates, with the eastern coastal lights approximating the total amount of lights in all the western counties by the 30 km buffer distance. However, the time trend reveals a narrowing of the light gap between the east and west, suggesting a gradual catch-up in western development and implying that coastal development is nearing saturation.
Inequality is a critical issue in socio-economic growth. By employing the Gini coefficient to evaluate inequality, we discovered a significant disparity in county-level economic development during the initial and middle phases of our study period. This trend, however, is not static. Over time, the Gini coefficient for national and regional levels has shown a downward trend, indicating that socio-economic policies have been instrumental in alleviating disparities in regional development.
Our examination of the NTL/NDVI ratio illuminates the dynamics between human activity and environmental sustainability. The ratio’s rate of change revealed distinct geographic characteristics, with regions around the Bohai Sea, Sunan, and the Yangtze River Estuary showing the most rapid increase in the NTL/NDVI index. This indicates that human intrusion into green spaces is outpacing the growth of these spaces. Conversely, regions with slow or negative growth in this index are primarily located in the Qinghai-Tibet Plateau, Southwest China, and the inland areas of Southeast China, where fewer human activities and superior natural environments exist.
Moreover, our study offers a comprehensive perspective through a comparative analysis of our results against well-established benchmarks, unveiling a multitude of trends in contrast to existing research. Our analysis of the Gini coefficient brings to light significant patterns, particularly the disparities between coastal and inland regions that stand out prominently. It is essential to recognize that the distribution of wealth and inequality can take on distinctive manifestations, as evidenced by our meticulous exploration of the situation in Xinjiang. This endeavor builds upon our previous findings, strengthening the observations of shifts in inequality between the western and eastern cities of China. Notably, our reliance on remote sensing data enhances the robustness of our analysis and mitigates the potential inflation-driven influences often observed in conventional statistics.
While our findings provide valuable insights, it is important to acknowledge certain limitations inherent to the study. The choice to focus solely on mainland China was influenced by the specific context of the investigation, particularly in relation to the buffer zone along the coastline. This focus excluded regions such as Taiwan, Hong Kong, Macao, Hainan Island, and the South China Sea Islands. However, recognizing the potential applicability of spatial autocorrelation analysis beyond geographical boundaries, we will make a note of this consideration in the limitations section of our conclusions. Additionally, for mainland China, we note that the accuracy of satellite-derived data for urban areas was not cross-verified with official government sources. Moreover, the sensitivity of threshold selection in nighttime satellite data classification for urban–rural delineation introduces an element of uncertainty. Future research could address these limitations by integrating multiple data sources and validation techniques, which would enhance the precision of our findings and contribute to a more comprehensive understanding of the complex relationship between socio-economic dynamics and the environment in China.
In conclusion, this study offers a rich and intricate portrait of the dynamics of socio-economic development and green space distribution in China. The stark disparities between coastal and western regions underscore the challenges of achieving balanced development. However, the downward trend in the Gini coefficient and the narrowing light gap between east and west over time offer hope, demonstrating the potential of socio-economic policies in modulating regional disparities. Our findings offer a vital resource for future policymaking aimed at fostering sustainable and balanced development, and set the stage for further research into the impacts of specific socio-economic policies and strategies for promoting sustainability in regions with limited green spaces and harsh natural environments.

Author Contributions

Conceptualization, T.C. and Y.Z.; methodology, T.C., J.W. (Jingtao Wu) and D.Z.; software, D.Z.; validation, T.C., Y.Z. and Y.C.; formal analysis, T.C. and Y.C.; investigation, T.C. and D.Z.; resources, Y.Z. and J.W. (Jiapei Wu); data curation, T.C. and J.W. (Jiapei Wu); writing—original draft preparation, T.C.; writing—review and editing, J.W. (Jingtao Wu) and Y.Z.; visualization, T.C.; supervision, J.W. (Jingtao Wu), J.W. (Jia Wang) and Y.Z.; project administration, Y.Z.; funding acquisition, Y.Z. All authors have read and agreed to the published version of the manuscript.

Funding

This research was funded by the National Key Research and Development Program, grant number 2021xjkk0303 and Hainan Province Science and Technology Special Fund, grant number ZDYF2022GXJS228.

Data Availability Statement

The datasets generated and/or analyzed during the current study are not publicly available due to their sensitive nature but are available from the corresponding author upon reasonable request. Interested researchers can contact the corresponding author directly via email to request access to the data.

Conflicts of Interest

The authors declare no conflict of interest.

Appendix A

Table A1. Provincial Trends in Nighttime Lights and Green Spaces. This illustrates the long-term trends in nighttime lights (NTL) and Normalized Difference Vegetation Index (NDVI) for specific provinces across mainland China from 1992 to 2015. It provides a granular view of the spatial-temporal patterns of socio-economic development (represented by NTL) and green spaces (represented by NDVI Trend) at a provincial level.
ProvinceNighttime LightNDVI Trend
Jiangsu101,5330.95
Shandong92,6663.22
Xinjiang87,761−1.60
Inner Mongolia79,5581.32
Guangdong78,6605.15
Zhejiang73,1232.22
Hebei72,0632.82
Henan71,2394.18
Sichuan65,4116.29
Shaanxi58,8467.10
Yunnan58,1864.59
Anhui54,9033.89
Heilongjiang53,611−4.06
Liaoning51,8540.67
Guangxi42,9209.01
Fujian42,8163.29
Gansu42,3715.79
Shanxi42,1315.98
Hubei41,0084.50
Jilin40,549−2.32
Hunan39,4344.89
Guizhou33,4465.48
Jiangxi31,1344.35
Chongqing22,2433.23
Qinghai15,8802.52
Ningxia15,7671.10
Tianjin14,0010.15
Shanghai12,8410.07
Beijing11,9410.30
Tibet10,715−1.32
Table A2. Coastal vs. Western Nighttime Lights—A Quantitative Comparison. This presents the original experimental data demonstrating the sum of nighttime lights in coastal buffer zones equating to the total number of county-level units in the area west of the Hu Huanyong Line. It serves to quantitatively illustrate the stark disparity in development between coastal and western regions of China, thereby underscoring the need for policies and initiatives aimed at fostering balanced development across the country. The table also provides a compelling visual testament to the agglomeration effect of lights along China’s coastline, reflecting the global disparity between coastal and inland regions.
Year/Buffer (km)1020304050100
1992604643647647647647
1993582633647647647647
1994581631646647647647
1995586638647647647647
1996585636647647647647
1997584637647647647647
1998573632647647647647
1999571634647647647647
2000564630647647647647
2001567635647647647647
2002566634647647647647
2003566636647647647647
2004527606640647647647
2005526606639647647647
2006543620644647647647
2007533614643647647647
2008536615642647647647
2009524604636647647647
2010492580620640647647
2011505592628645647647
2012487574615636647647
2013501586625644647647
2014333424479519549515
2015329424481521552619

References

  1. Jiang, H.; Sun, Z.; Guo, H.; Weng, Q.; Du, W.; Xing, Q.; Cai, G. An assessment of urbanization sustainability in China between 1990 and 2015 using land use efficiency indicators. NPJ Urban Sustain. 2021, 1, 34. [Google Scholar] [CrossRef]
  2. Shi, T.; Hu, Y.; Liu, M.; Li, C.; Zhang, C.; Liu, C. How Do Economic Growth, Urbanization, and Industrialization Affect Fine Particulate Matter Concentrations? An Assessment in Liaoning Province, China. Int. J. Environ. Res. Public Health 2020, 17, 5441. [Google Scholar] [CrossRef]
  3. Zhao, D.; Xiao, M.; Huang, C.; Liang, Y.; Yang, Z. Land Use Scenario Simulation and Ecosystem Service Management for Different Regional Development Models of the Beibu Gulf Area, China. Remote Sens. 2021, 13, 3161. [Google Scholar] [CrossRef]
  4. Zhang, F.; Sarker, M.N.; Lv, Y. Coupling Coordination of the Regional Economy, Tourism Industry, and the Ecological Environment: Evidence from Western China. Sustainability 2022, 14, 1654. [Google Scholar] [CrossRef]
  5. Zhang, H.; Sun, Y.; Fan, Z.; Long, Z.; Wan, S.; Zhang, Z.; Chen, X. Analysis of County-Scale Eco-Efficiency and Spatiotemporal Characteristics in China. Land 2023, 12, 438. [Google Scholar] [CrossRef]
  6. Tiago, P.; Ceia-Hasse, A.; Marques, T.A.; Capinha, C.; Pereira, H.M. Spatial distribution of citizen science casuistic observations for different taxonomic groups. Sci. Rep. 2017, 7, 12832. [Google Scholar] [CrossRef]
  7. Zhang, Q.; Li, B.; Thau, D.; Moore, R. Building a Better Urban Picture: Combining Day and Night Remote Sensing Imagery. Remote Sens. 2015, 7, 11887–11913. [Google Scholar] [CrossRef]
  8. Zhou, Y.; Ma, T.; Zhou, C.; Xu, T. Nighttime Light Derived Assessment of Regional Inequality of Socioeconomic Development in China. Remote Sens. 2015, 7, 1242–1262. [Google Scholar] [CrossRef]
  9. Hu, K.; Qi, K.; Guan, Q.; Wu, C.; Yu, J.; Qing, Y.; Zheng, J.; Wu, H.; Li, X. A Scientometric Visualization Analysis for Night-Time Light Remote Sensing Research from 1991 to 2016. Remote Sens. 2017, 9, 802. [Google Scholar] [CrossRef]
  10. Ma, T.; Zhou, Y.; Zhou, C.; Haynie, S.; Pei, T.; Xu, T. Night-time light derived estimation of spatio-temporal characteristics of urbanization dynamics using DMSP/OLS satellite data. Remote Sens. Environ. 2015, 158, 453–464. [Google Scholar] [CrossRef]
  11. Deng, X.; Liang, L.; Wu, F.; Wang, Z.; He, S. A review of the balance of regional development in China from the perspective of development geography. J. Geogr. Sci. 2022, 32, 3–22. [Google Scholar] [CrossRef]
  12. Xiao, Q.-L.; Wang, Y.; Zhou, W.-X. Regional Economic Convergence in China: A Comparative Study of Nighttime Light and GDP. Front. Phys. 2021, 9, 525162. [Google Scholar] [CrossRef]
  13. Zhang, W.; Zhang, S.; Bo, L.; Haque, M.; Liu, E. Does China’s Regional Digital Economy Promote the Development of a Green Economy? Sustainability 2023, 15, 1564. [Google Scholar] [CrossRef]
  14. Fu, H.; Shao, Z.; Fu, P.; Cheng, Q. The Dynamic Analysis between Urban Nighttime Economy and Urbanization Using the DMSP/OLS Nighttime Light Data in China from 1992 to 2012. Remote Sens. 2017, 9, 416. [Google Scholar] [CrossRef]
  15. Pan, Y.; Chen, J.; Yan, X.; Lin, J.; Ye, S.; Xu, Y.; Qi, X. Identifying the Spatial–Temporal Patterns of Vulnerability to Re-Poverty and its Determinants in Rural China. Appl. Spat. Anal. Policy 2022, 15, 483–505. [Google Scholar] [CrossRef]
  16. Wang, F.; Liu, C.; Xu, Y. Analyzing Population Density Disparity in China with GIS-automated Regionalization: The Hu Line Revisited. Chin. Geogr. Sci. 2019, 29, 541–552. [Google Scholar] [CrossRef]
  17. Li, M.; He, B.; Guo, R.; Li, Y.; Chen, Y.; Fan, Y. Study on Population Distribution Pattern at the County Level of China. Sustainability 2018, 10, 3598. [Google Scholar] [CrossRef]
  18. Chen, M.; Gong, Y.; Li, Y.; Lu, D.; Zhang, H. Population distribution and urbanization on both sides of the Hu Huanyong Line: Answering the Premier’s question. J. Geogr. Sci. 2016, 26, 1593–1610. [Google Scholar] [CrossRef]
  19. Xie, B.; Wei, W.; Li, Y.; Liu, C.; Ju, S. Research on Spatial Distribution Characteristics and Correlation Degree of the Historical and Cultural Towns (Villages) in China. Sustainability 2023, 15, 1680. [Google Scholar] [CrossRef]
  20. Qi, W.; Liu, S.; Zhao, M.; Liu, Z. China’s different spatial patterns of population growth based on the “Hu Line”. J. Geogr. Sci. 2016, 26, 1611–1625. [Google Scholar] [CrossRef]
  21. Ma, T.; Zhou, C.; Pei, T.; Haynie, S.; Fan, J. Quantitative estimation of urbanization dynamics using time series of DMSP/OLS nighttime light data: A comparative case study from China’s cities. Remote Sens. Environ. 2012, 124, 99–107. [Google Scholar] [CrossRef]
  22. Dou, Y.; Liu, Z.; He, C.; Yue, H. Urban Land Extraction Using VIIRS Nighttime Light Data: An Evaluation of Three Popular Methods. Remote Sens. 2017, 9, 175. [Google Scholar] [CrossRef]
  23. Liu, Y.; Wang, Y.; Peng, J.; Du, Y.; Liu, X.; Li, S.; Zhang, D. Correlations between Urbanization and Vegetation Degradation across the World’s Metropolises Using DMSP/OLS Nighttime Light Data. Remote Sens. 2015, 7, 2067–2088. [Google Scholar] [CrossRef]
  24. Wu, J.; Wang, Z.; Li, W.; Peng, J. Exploring factors affecting the relationship between light consumption and GDP based on DMSP/OLS nighttime satellite imagery. Remote Sens. Environ. 2013, 134, 111–119. [Google Scholar] [CrossRef]
  25. Ji, X.; Li, X.; He, Y.; Liu, X. A Simple Method to Improve Estimates of County-Level Economics in China Using Nighttime Light Data and GDP Growth Rate. ISPRS Int. J. Geo-Inf. 2019, 8, 419. [Google Scholar] [CrossRef]
  26. Dai, Z.; Hu, Y.; Zhao, G. The Suitability of Different Nighttime Light Data for GDP Estimation at Different Spatial Scales and Regional Levels. Sustainability 2017, 9, 305. [Google Scholar] [CrossRef]
  27. Mellander, C.; Lobo, J.; Stolarick, K.; Matheson, Z. Night-Time Light Data: A Good Proxy Measure for Economic Activity? PLoS ONE 2015, 10, e0139779. [Google Scholar] [CrossRef]
  28. Guo, B.; Bian, Y.; Zhang, D.; Su, Y.; Wang, X.; Zhang, B.; Wang, Y.; Chen, Q.; Wu, Y.; Luo, P. Estimating Socio-Economic Parameters via Machine Learning Methods Using Luojia1-01 Nighttime Light Remotely Sensed Images at Multiple Scales of China in 2018. IEEE Access 2021, 9, 34352–34365. [Google Scholar] [CrossRef]
  29. He, X.; Zhou, C.; Zhang, J.; Yuan, X. Using Wavelet Transforms to Fuse Nighttime Light Data and POI Big Data to Extract Urban Built-Up Areas. Remote Sens. 2020, 12, 3887. [Google Scholar] [CrossRef]
  30. Liu, J.; Deng, Y.; Wang, Y.; Huang, H.; Du, Q.; Ren, F. Urban Nighttime Leisure Space Mapping with Nighttime Light Images and POI Data. Remote Sens. 2020, 12, 541. [Google Scholar] [CrossRef]
  31. Shi, K.; Chang, Z.; Chen, Z.; Wu, J.; Yu, B. Identifying and evaluating poverty using multisource remote sensing and point of interest (POI) data: A case study of Chongqing, China. J. Clean. Prod. 2020, 255, 120245. [Google Scholar] [CrossRef]
  32. Zhu, Z.; Li, J.; Chen, Z. Green space equity: Spatial distribution of urban green spaces and correlation with urbanization in Xiamen, China. Environ. Dev. Sustain. 2023, 25, 423–443. [Google Scholar] [CrossRef]
  33. Wang, Y.; Miao, Z. Towards the analysis of urban livability in China: Spatial–temporal changes, regional types, and influencing factors. Environ. Sci. Pollut. Res. 2022, 29, 60153–60172. [Google Scholar] [CrossRef]
  34. Rahaman, S.; Jahangir, S.; Haque, M.S.; Chen, R.; Kumar, P. Spatio-temporal changes of green spaces and their impact on urban environment of Mumbai, India. Environ. Dev. Sustain. 2021, 23, 6481–6501. [Google Scholar] [CrossRef]
  35. Shang, Y.; Liu, S. Spatial-Temporal Coupling Coordination Relationship between Urbanization and Green Development in the Coastal Cities of China. Sustainability 2021, 13, 5339. [Google Scholar] [CrossRef]
  36. Wu, W.; Zhao, K. Dynamic interaction between foreign direct investment and the new urbanization in China. J. Hous. Built Environ. 2019, 34, 1107–1124. [Google Scholar] [CrossRef]
  37. Hong, H.; Fu, L. Evaluation of Urbanization Efficiency for Coastal Port Cities in China. J. Coast. Res. 2019, 98, 335–338. [Google Scholar] [CrossRef]
  38. Finlayson, M.; Everard, M.; Irvine, K.; McInnes, R.; Middleton, B.; van Dam, A.; Davidson, N. The Wetland Book: I: Structure and Function, Management, and Methods; Springer: Berlin/Heidelberg, Germany, 2018; pp. 355–359. [Google Scholar]
  39. Mulkey, D.; Hackett, W.B.; Gordon, J.R. Assessing economic activity in coastal areas: A shift-share approach. Coast. Zone Manag. J. 1982, 10, 79–96. [Google Scholar] [CrossRef]
  40. Wu, J.; Mohamed, R.; Wang, Z. Agent-based simulation of the spatial evolution of the historical population in China. J. Hist. Geogr. 2011, 37, 12–21. [Google Scholar] [CrossRef]
  41. Li, X.; Zhou, Y.; Zhao, M.; Zhao, X. A harmonized global nighttime light dataset 1992–2018. Sci. Data 2020, 7, 168. [Google Scholar] [CrossRef]
  42. Zhao, M.; Cheng, W.; Zhou, C.; Li, M.; Huang, K.; Wang, N. Assessing Spatiotemporal Characteristics of Urbanization Dynamics in Southeast Asia Using Time Series of DMSP/OLS Nighttime Light Data. Remote Sens. 2018, 10, 47. [Google Scholar] [CrossRef]
  43. GIMMS 3g NDVI Set and Global NDVI Trends. Available online: https://www.geobotany.org/library/talks/PinzonJE2010_yamal_tal100308.pdf (accessed on 5 May 2023).
  44. Anselin, L. Local Indicators of Spatial Association—LISA. Geogr. Anal. 1995, 27, 93–115. [Google Scholar] [CrossRef]
  45. Zhang, C.; Luo, L.; Xu, W.; Ledwith, V. Use of local Moran’s I and GIS to identify pollution hotspots of Pb in urban soils of Galway, Ireland. Sci. Total Environ. 2008, 398, 212–221. [Google Scholar] [CrossRef] [PubMed]
  46. Seidl, M.; Saifane, M. A green intensity index to better assess the multiple functions of urban vegetation with an application to Paris metropolitan area. Environ. Dev. Sustain. 2021, 23, 15204–15224. [Google Scholar] [CrossRef]
  47. Susaki, J.; Kubota, S. Automatic Assessment of Green Space Ratio in Urban Areas from Mobile Scanning Data. Remote Sens. 2017, 9, 215. [Google Scholar] [CrossRef]
  48. Kumakoshi, Y.; Chan, S.Y.; Koizumi, H.; Li, X.; Yoshimura, Y. Standardized Green View Index and Quantification of Different Metrics of Urban Green Vegetation. Sustainability 2020, 12, 7434. [Google Scholar] [CrossRef]
  49. Gastwirth, J. The Estimation of the Lorenz Curve and Gini Index. Rev. Econ. Stat. 1972, 54, 306–316. [Google Scholar] [CrossRef]
  50. Wang, X.; Xiao, J.; Li, X.; Cheng, G.; Ma, M.; Zhu, G.; Altaf Arain, M.; Andrew Black, T.; Jassal, R.S. No trends in spring and autumn phenology during the global warming hiatus. Nat. Commun. 2019, 10, 2389. [Google Scholar] [CrossRef]
  51. Guo, Y. Evolution and stages of China’s economic inequality from 1978 to 2018. PLoS ONE 2023, 18, e0288873. [Google Scholar] [CrossRef]
  52. Elvidge, C.D.; Sutton, P.C.; Ghosh, T.; Tuttle, B.T.; Baugh, K.E.; Bhaduri, B.; Bright, E. A global poverty map derived from satellite data. Comput. Geosci. 2009, 35, 1652–1660. [Google Scholar] [CrossRef]
  53. Fan, J.; Ma, T.; Zhou, C.; Zhou, Y.; Xu, T. Comparative Estimation of Urban Development in China’s Cities Using Socioeconomic and DMSP/OLS Night Light Data. Remote Sens. 2014, 6, 7840–7856. [Google Scholar] [CrossRef]
  54. Song, S.; Chu, G.S.F.; Chao, R. Intercity regional disparity in China. China Econ. Rev. 2000, 11, 246–261. [Google Scholar] [CrossRef]
  55. Fleisher, B.; Li, H.; Zhao, M.Q. Human capital, economic growth, and regional inequality in China. J. Dev. Econ. 2010, 92, 215–231. [Google Scholar] [CrossRef]
Figure 1. Map of mainland China highlighting the Hu Huanyong Line.
Remotesensing 15 04581 g001
Figure 2. Spatial representation of multi-year average (1992–2015) nighttime light emissions and vegetation cover across mainland China. (a) portrays the intensity of nighttime lights over mainland China, with distinct light clustering in major metropolitan regions, providing a proxy for urbanization and commercial activity. (b) showcases the distribution of the Normalized Difference Vegetation Index (NDVI), a satellite-derived index that provides a measure of live green vegetation coverage. The figure illuminates the robust greenness in South and Southwest China and a significant correspondence with the Hu Line pattern.
Remotesensing 15 04581 g002
Figure 3. Long-term trend of nighttime light emissions and vegetation growth across different regions of mainland China (1992–2015). (a) illustrates the temporal trends in nighttime light intensity for the entire nation, and for areas located east and west of the Hu Line. (b) displays the evolution of NDVI for the same regions and timeframe, with a particular surge post-2006.
Remotesensing 15 04581 g003
Figure 4. Illustration of the shifting economic center of gravity, represented by the distribution of nighttime lights, in the national, eastern, and western regions of China over the years. The plot shows temporal transitions and spatial movements in the locations of these centers, thereby elucidating the disparities in regional development. This figure includes basemap data from CARTO (https://carto.com/basemaps/, accessed on 10 May 2023).
Remotesensing 15 04581 g004
Figure 5. Temporal Trends in Gini Coefficients across Chinese Counties. This figure illustrates the temporal evolution of Gini coefficients calculated at the county level across China as a whole, as well as East and West China. The time series reflects economic disparities over multiple years. The graph effectively captures the overall trend of declining Gini coefficients, illustrating the impact of various socio-economic interventions.
Remotesensing 15 04581 g005
Figure 6. Geographic Distribution and Trend of the NTL/NDVI Ratio. This figure depicts the spatial variability and development rate of the NTL/NDVI ratio across Chinese counties. It provides a visual representation of regions with rapid increase in NTL/NDVI index, secondary growth areas, as well as areas experiencing slow or negative growth. The map includes a color-coded gradient scale to assist in identifying the intensity of human activity versus the expansion of green spaces in different geographical regions.
Remotesensing 15 04581 g006
Figure 7. Spatial Cluster of the NTL/NDVI Index. Displays the spatial cluster degree of the NTL/NDVI index utilizing Local Moran’s Index, revealing the distribution of “high-high”, “low-high”, “low-low”, and “high-low” regions. This panel helps identify regions of significant clustering of similar values and outlier areas.
Remotesensing 15 04581 g007
Figure 8. Hotspot/Coldspot Distribution of the NTL/NDVI Index. The Getis-Ord Gi* method was utilized to present the spatial distribution of hot spots and cold spots of the NTL/NDVI index. This panel offers an insight into the regions under high developmental pressure versus those with superior natural environments.
Remotesensing 15 04581 g008
Figure 9. A comprehensive comparison of nighttime light intensities between coastal areas and counties west of the Hu Line. The table quantitatively demonstrates the number of western counties equivalent to the total coastal lights for each year, providing a nuanced perspective on the relative pace of development in these contrasting regions. The numerical values in the range of 0.00 to 1.00 represent percentages *.
Remotesensing 15 04581 g009
Disclaimer/Publisher’s Note: The statements, opinions and data contained in all publications are solely those of the individual author(s) and contributor(s) and not of MDPI and/or the editor(s). MDPI and/or the editor(s) disclaim responsibility for any injury to people or property resulting from any ideas, methods, instructions or products referred to in the content.

