
Remote Sensing-Based Classification of Winter Irrigation Fields Using the Random Forest Algorithm and GF-1 Data: A Case Study of Jinzhong Basin, North China

Abstract
:
1. Introduction
2. Study Area and Data
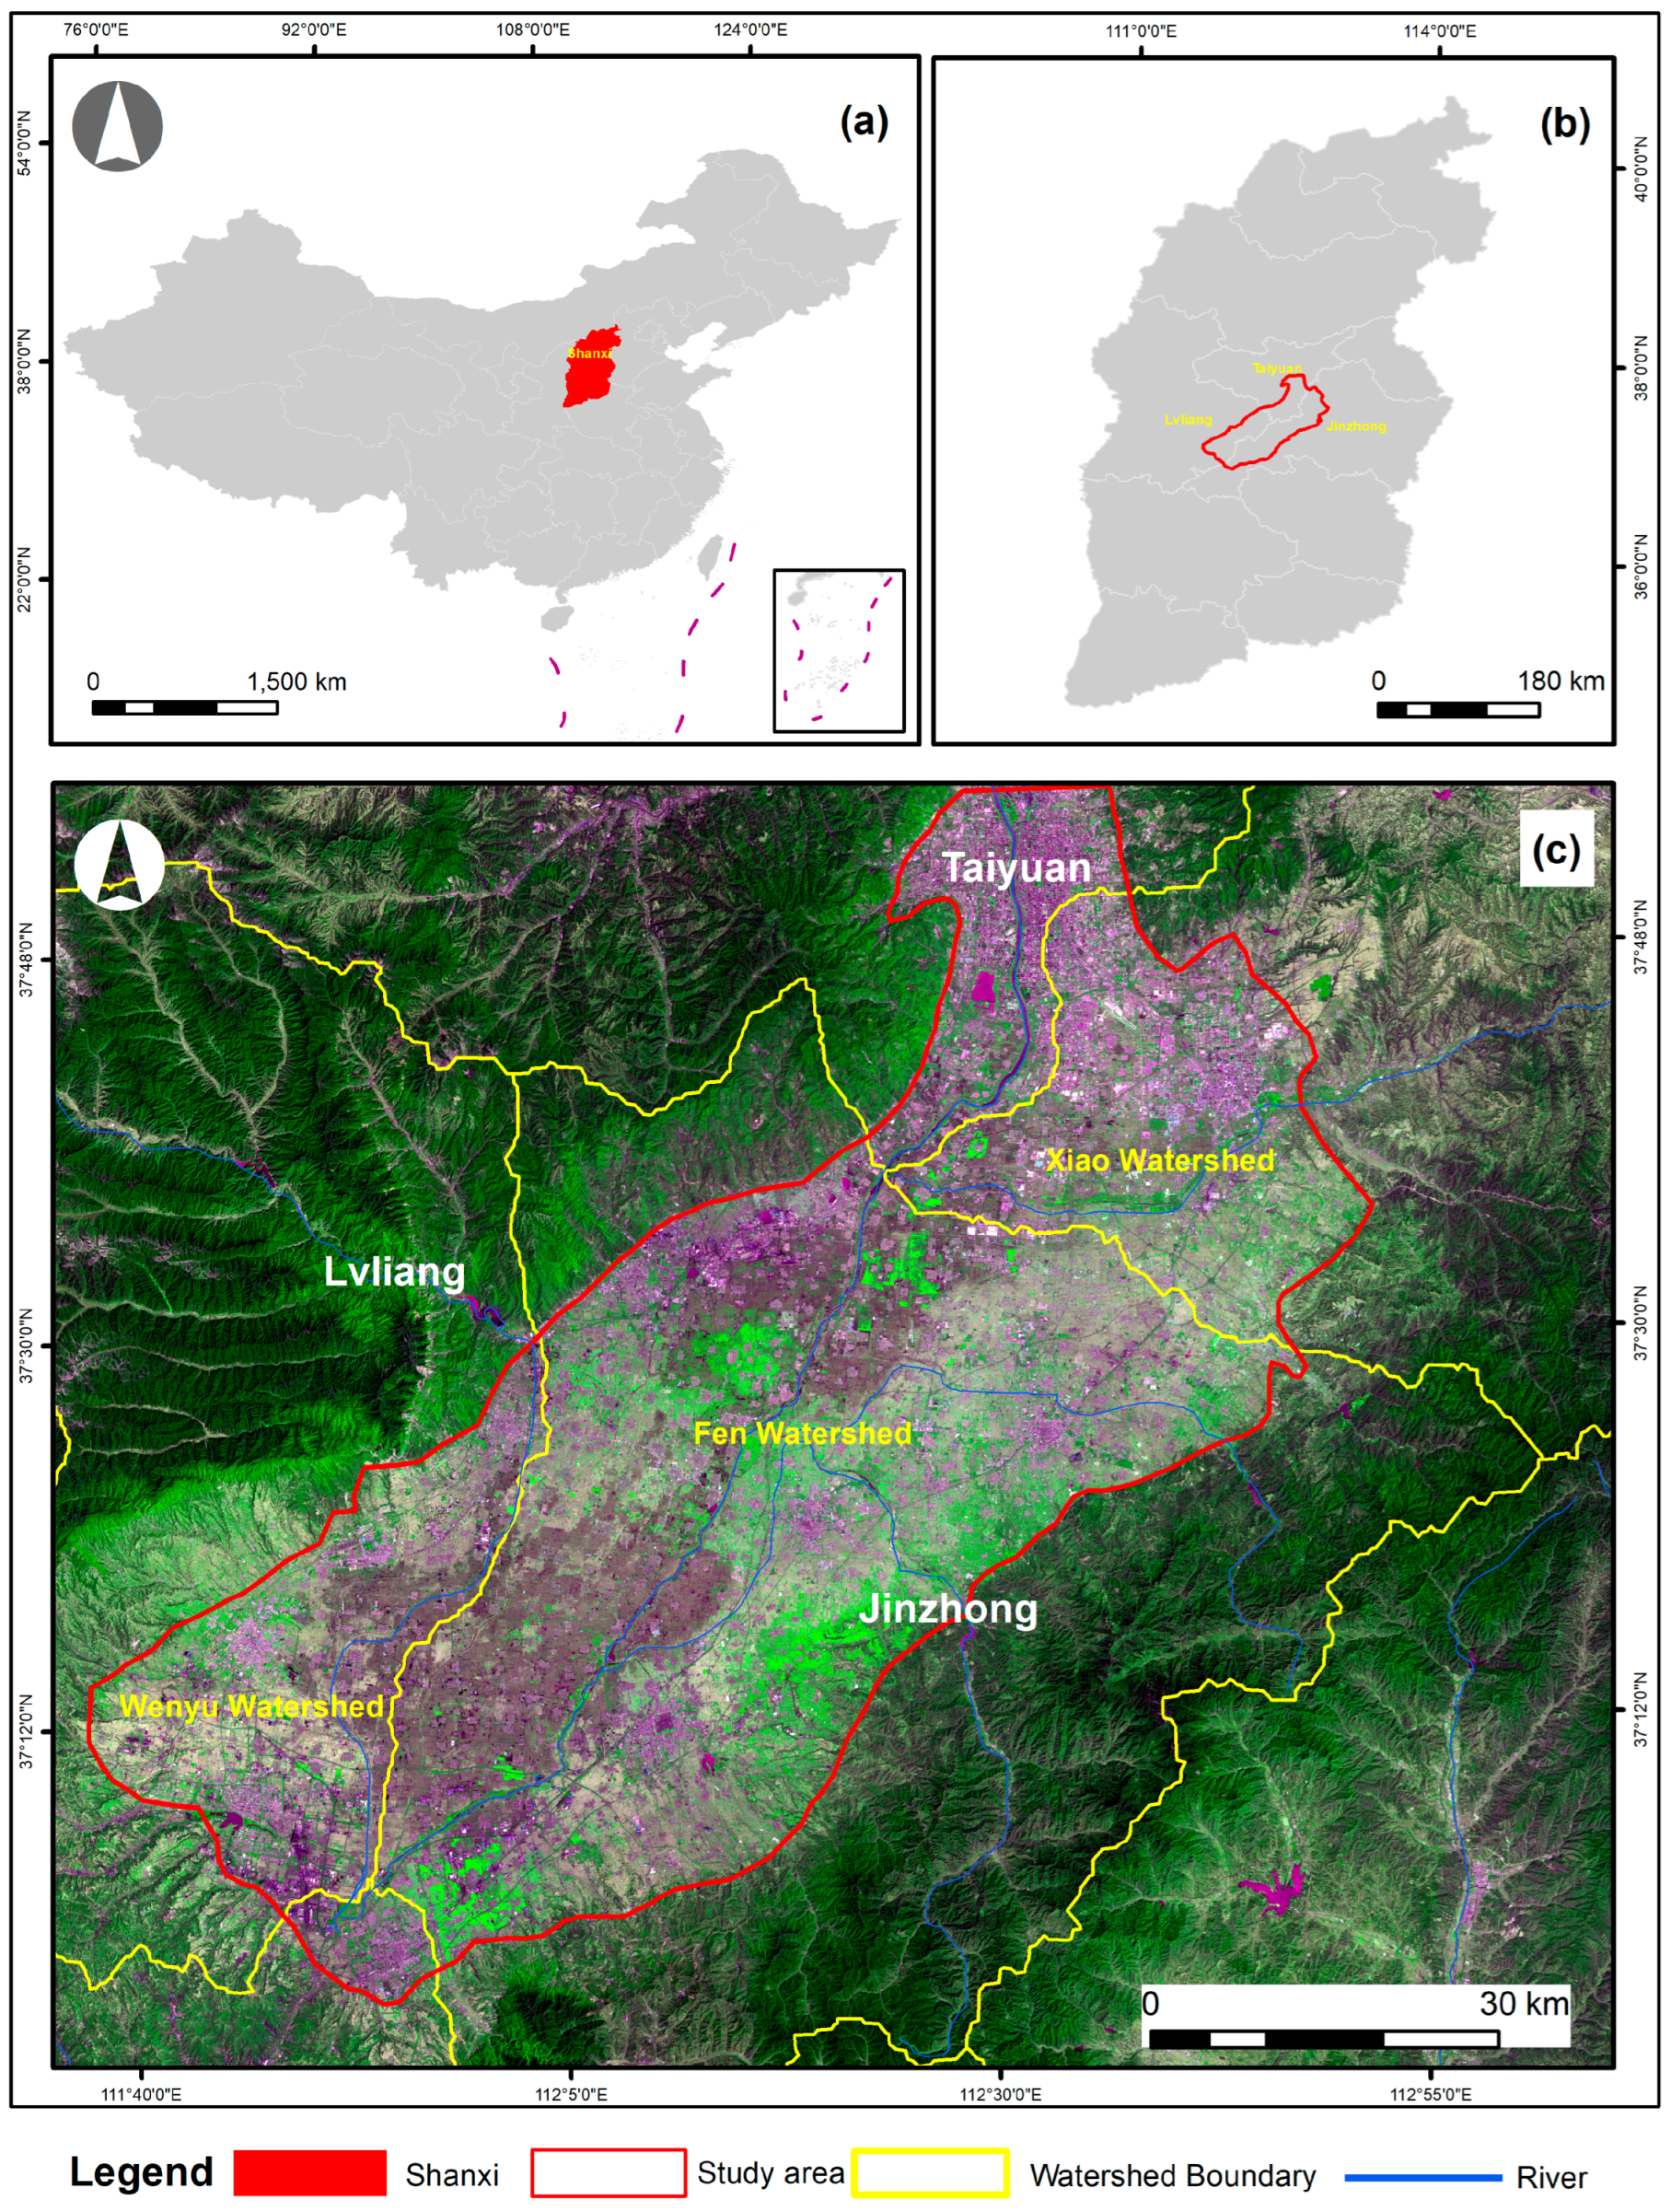
2.1. Study Area
2.2. Satellite Data and Processing
2.3. Field Data and Training Samples
3. Methodology
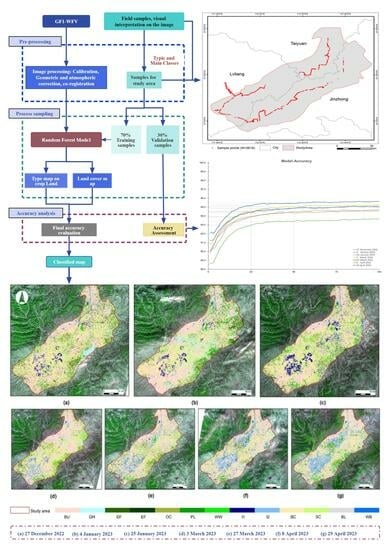
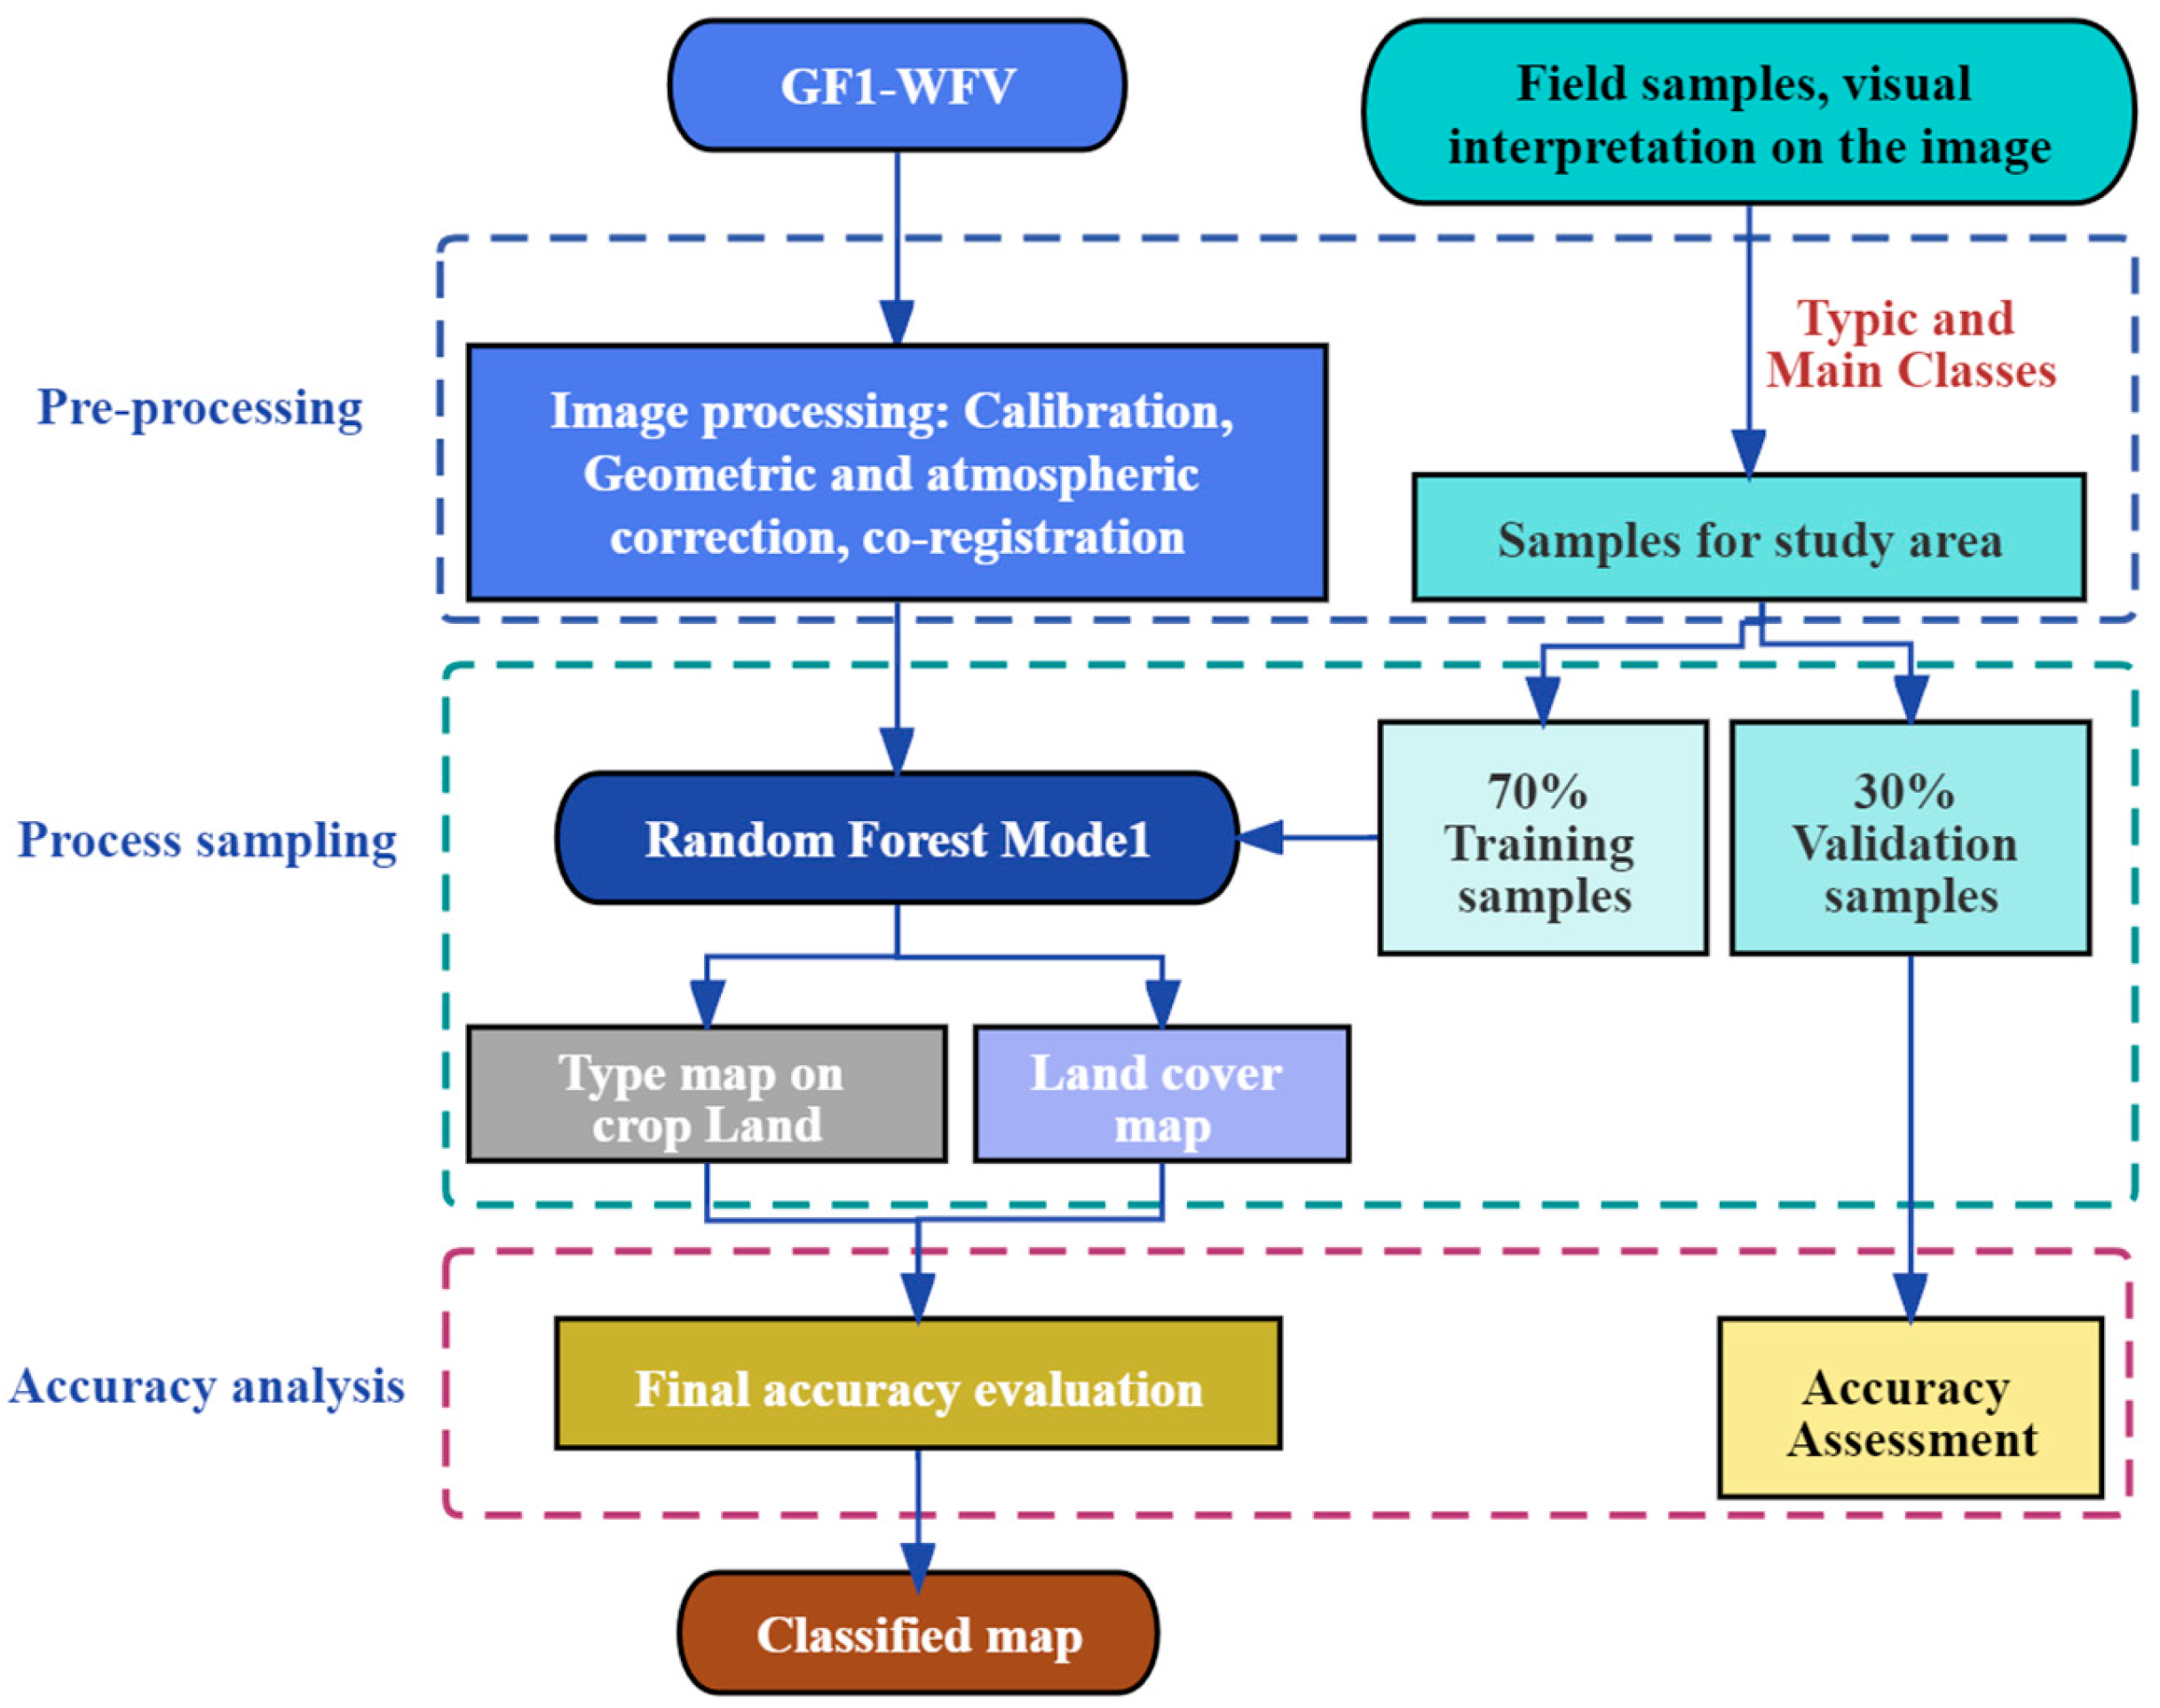
3.1. Classification Flowchart
3.2. Classifier Algorithm
3.3. Validation Methods
4. Results and Analysis
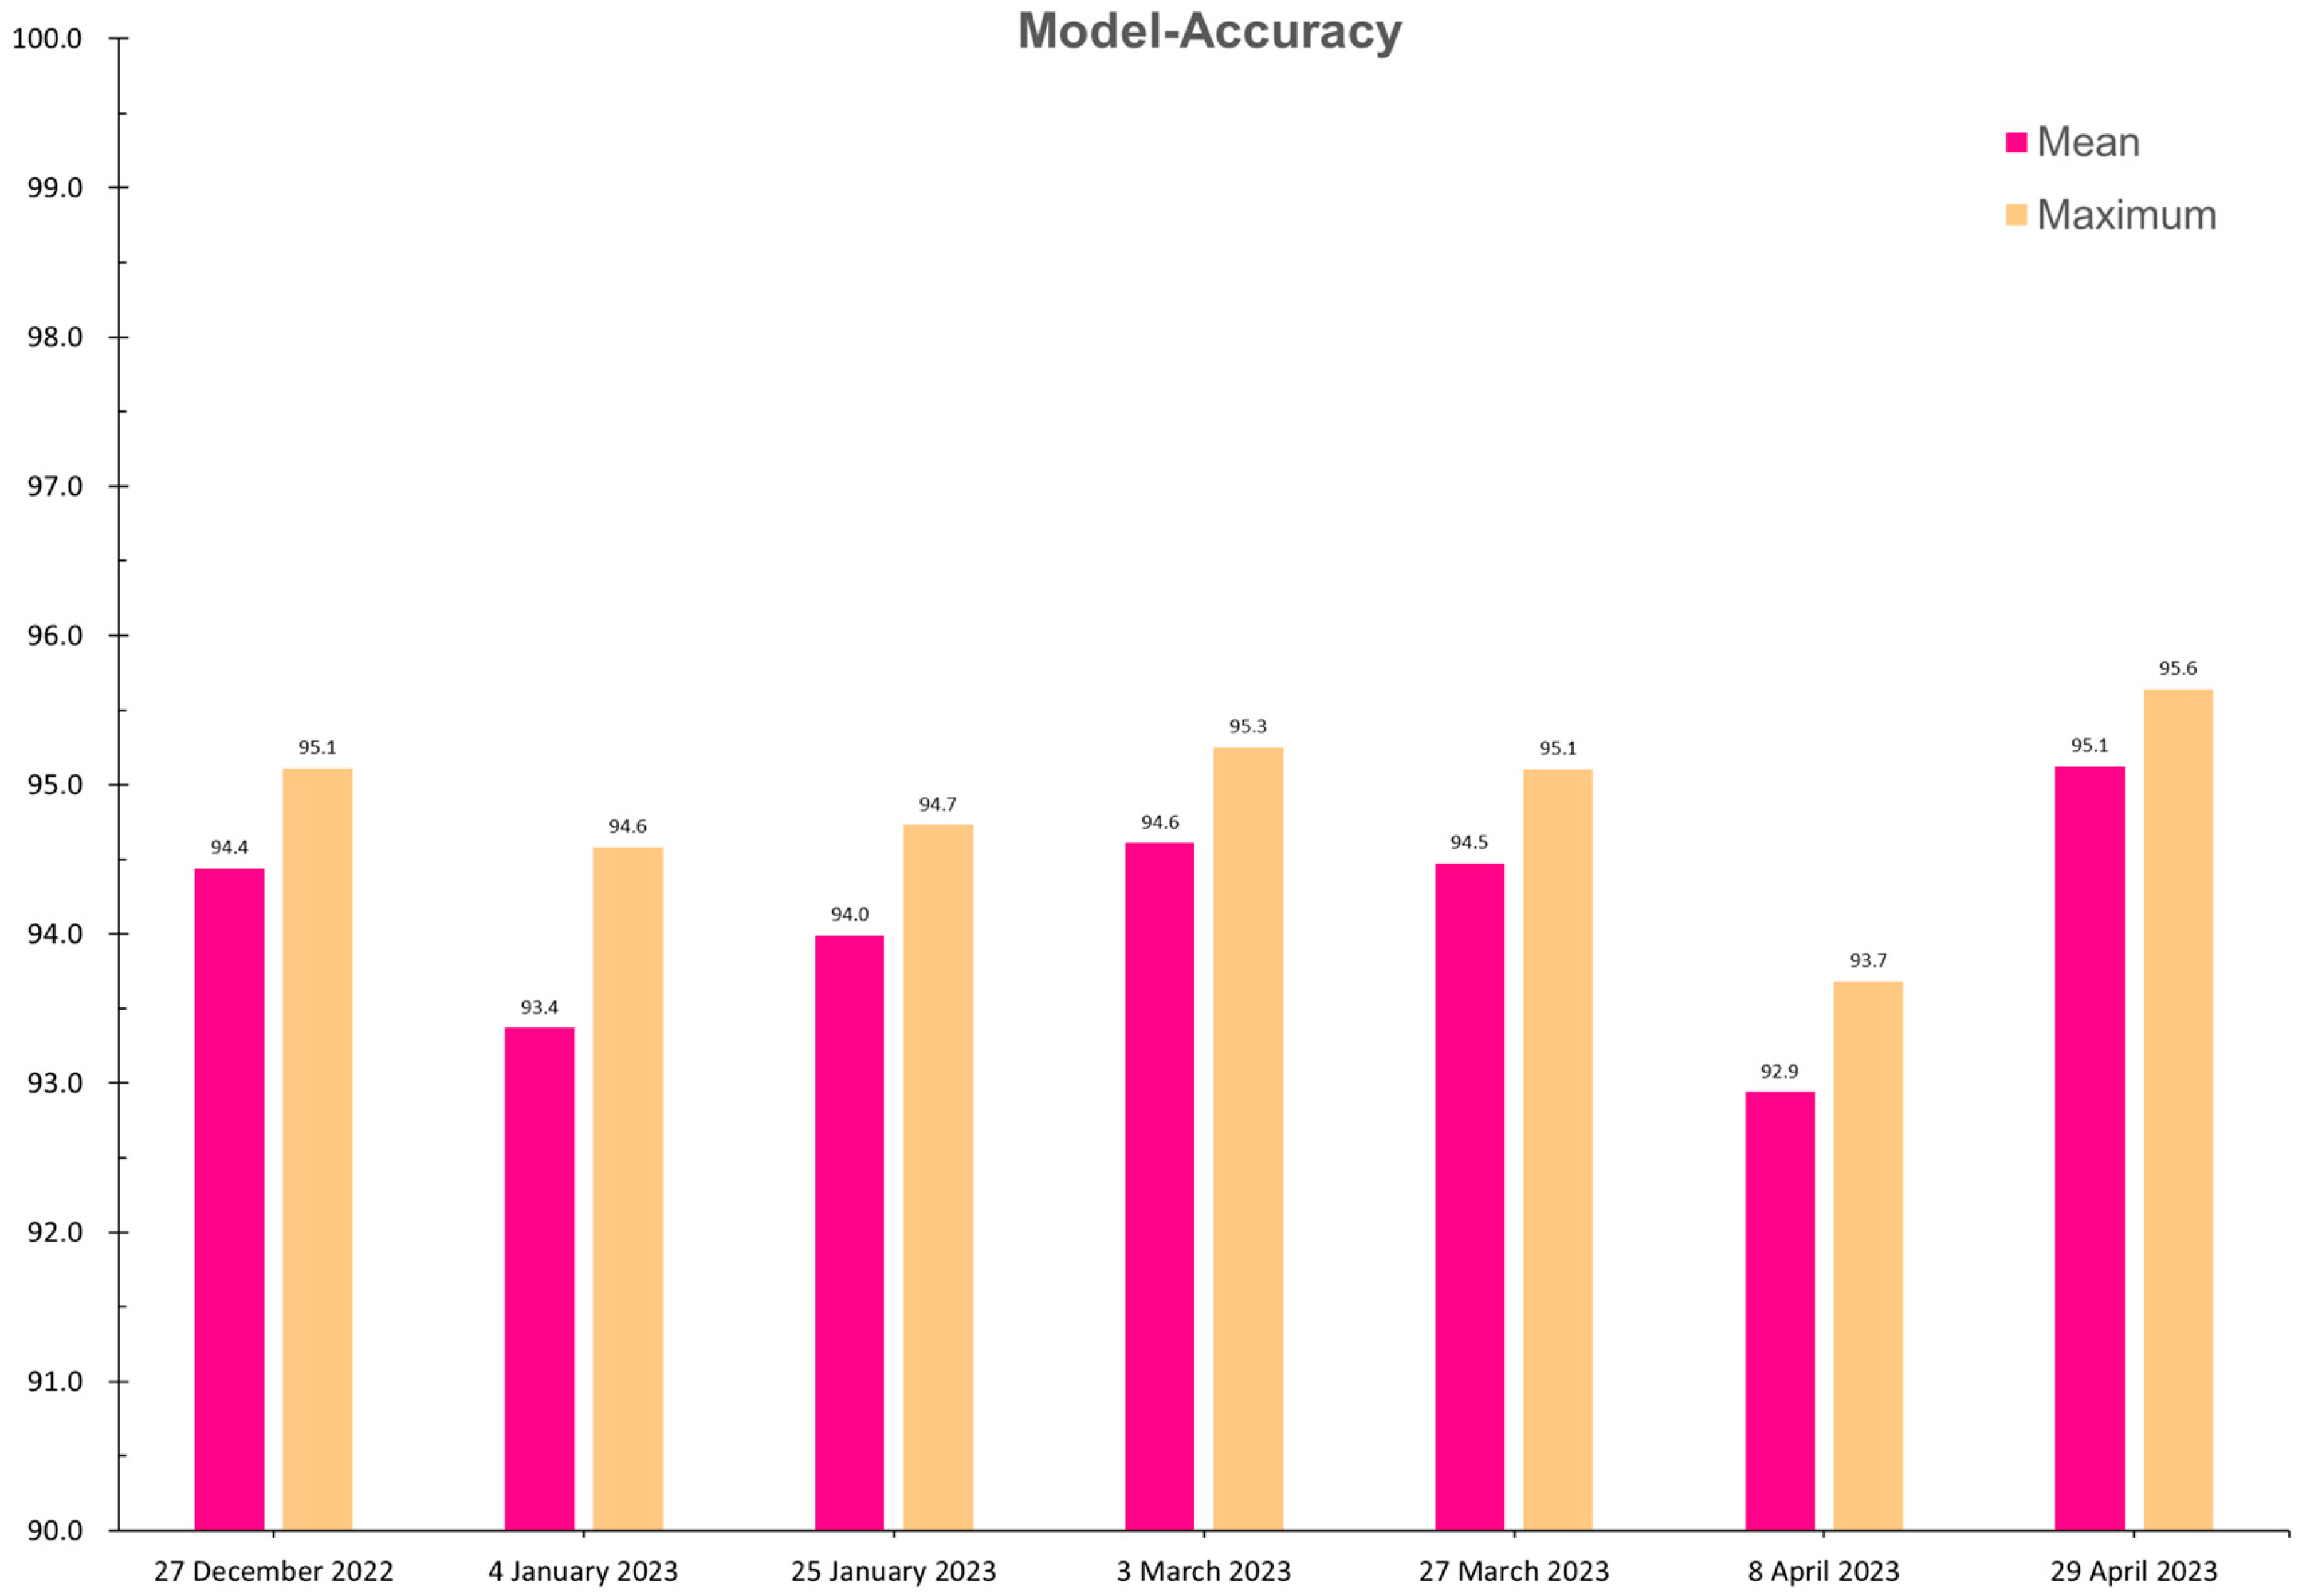
4.1. The Classification Model Accuracy Analysis
4.2. The Classified Images and Accuracies
4.3. The Irrigated Area Analysis in Watersheds
5. Discussion
5.1. The Challenges of Identifying Irrigation Outside the Growing Season
5.2. The Consideration in This Irrigation Mapping
5.3. The Winter Irrigation Impact on Ecosystem
6. Conclusions
Author Contributions
Funding
Data Availability Statement
Acknowledgments
Conflicts of Interest
References
- Mancosu, N.; Snyder, R.L.; Kyriakakis, G.; Spano, D. Water Scarcity and Future Challenges for Food Production. Water 2015, 7, 975–992. [Google Scholar] [CrossRef]
- Debnath, S.; Adamala, S.; Palakuru, M. An overview of Indian traditional irrigation systems for sustainable agricultural practices. Int. J. Mod. Agric. 2020, 9, 12–22. [Google Scholar]
- Deng, X.P.; Shan, L.; Zhang, H.; Turner, N.C. Improving agricultural water use efficiency in arid and semiarid areas of China. Agric. Water Manag. 2006, 80, 23–40. [Google Scholar] [CrossRef]
- Mabhaudhi, T.; Mpandeli, S.; Nhamo, L.; Chimonyo, V.G.P.; Nhemachena, C.; Senzanje, A.; Naidoo, D.; Modi, A.T. Prospects for improving irrigated agriculture in southern Africa: Linking water, energy and food. Water 2018, 10, 1881. [Google Scholar] [CrossRef]
- Mpanga, I.K.; Idowu, O.J. A decade of irrigation water use trends in Southwestern USA: The role of irrigation technology, best management practices, and outreach education programs. Agric. Water Manag. 2021, 243, 106438. [Google Scholar] [CrossRef]
- Nkwasa, A.; Chawanda, C.J.; Jägermeyr, J.; van Griensven, A. Improved representation of agricultural land use and crop management for large-scale hydrological impact simulation in Africa using SWAT+. Hydrol. Earth Syst. Sci. 2022, 26, 71–89. [Google Scholar] [CrossRef]
- Ji, L.; Senay, G.B.; Friedrichs, M.K.; Schauer, M.; Boiko, O. Characterization of water use and water balance for the croplands of Kansas using satellite, climate, and irrigation data. Agric. Water Manag. 2021, 256, 107106. [Google Scholar] [CrossRef]
- Brauman, K.A.; Siebert, S.; Foley, J.A. Improvements in crop water productivity increase water sustainability and food security—A global analysis. Environ. Res. Lett. 2013, 8, 024030. [Google Scholar] [CrossRef]
- Siebert, S.; Döll, P.; Hoogeveen, J.; Faures, J.-M.; Frenken, K.; Feick, S. Development and validation of the global map of irrigation areas. Hydrol. Earth Syst. Sci. 2005, 9, 535–547. [Google Scholar] [CrossRef]
- Bégué, A.; Arvor, D.; Bellon, B.; Betbeder, J.; De Abelleyra, D.; Ferraz, P.D.R.; Lebourgeois, V.; Lelong, C.; Simões, M.; Verón, R.S. Remote Sensing and Cropping Practices: A Review. Remote Sens. 2018, 10, 99. [Google Scholar] [CrossRef]
- Thenkabail, P.S.; Biradar, C.M.; Noojipady, P.; Dheeravath, V.; Li, Y.; Velpuri, M.; Gumma, M.; Gangalakunta, O.R.P.; Turral, H.; Cai, X.; et al. Global irrigated area map (GIAM), derived from remote sensing, for the end of the last millennium. Int. J. Remote Sens. 2009, 30, 3679–3733. [Google Scholar] [CrossRef]
- Wu, B.; Tian, F.; Nabil, M.; Bofana, J.; Lu, Y.; Elnashar, A.; Beyene, A.N.; Zhang, M.; Zeng, H.; Zhu, W. Mapping global maximum irrigation extent at 30 m resolution using the irrigation performances under drought stress. Glob. Environ. Change 2023, 79, 102652. [Google Scholar] [CrossRef]
- Zajac, Z.; Gomez, O.; Gelati, E.; van der Velde, M.; Bassu, S.; Ceglar, A.; Chukaliev, O.; Panarello, L.; Koeble, R.; van den Berg, M.; et al. Estimation of spatial distribution of irrigated crop areas in Europe for large-scale modelling applications. Agric. Water Manag. 2022, 266, 107527. [Google Scholar] [CrossRef]
- Siddiqui, S.; Cai, X.; Chandrasekharan, K. Irrigated Area Map Asia and Africa; International Water Management Institute: Battaramulla, Sri Lanka, 2016; Available online: http://waterdata.iwmi.org/applications/irri_area/ (accessed on 6 August 2023).
- Zhang, C.; Dong, J.; Ge, Q. Mapping 20 years of irrigated croplands in China using MODIS and statistics and existing irrigation products. Sci. Data 2022, 9, 407. [Google Scholar] [CrossRef]
- Zhao, G.; Siebert, S. Season-wise irrigated and rainfed crop areas for India around year 2005. MyGeoHUB 2015. [Google Scholar] [CrossRef]
- Ambika, A.; Wardlow, B.; Mishra, V. Remotely sensed high resolution irrigated area mapping in India for 2000 to 2015. Sci. Data 2016, 3, 160118. [Google Scholar] [CrossRef]
- Gumma, M.K.; Thenkabail, P.S.; Hideto, F.; Nelson, A.; Dheeravath, V.; Busia, D.; Rala, A. Mapping Irrigated Areas of Ghana Using Fusion of 30 m and 250 m Resolution Remote-Sensing Data. Remote Sens. 2011, 3, 816–835. [Google Scholar] [CrossRef]
- Xie, Y.; Lark, T. Mapping annual irrigation from Landsat imagery and environmental variables across the conterminous United States Remote. Sens. Environ. 2021, 260, 112445. [Google Scholar] [CrossRef]
- Wriedt, G.; Velde, M.; Aloe, A.; Bouraoui, F. A European irrigation map for spatially distributed agricultural modelling. Agric. Water Manag. 2009, 96, 771–789. [Google Scholar] [CrossRef]
- Salmon, J.M.; Friedl, M.A.; Frolking, S.; Wisser, D.; Douglas, E.M. Global rain-fed, irrigated, and paddy croplands: A new high resolution map derived from remote sensing, crop inventories and climate data. Int. J. Appl. Earth Obs. Geoinf. 2015, 38, 321–334. [Google Scholar] [CrossRef]
- Lu, Y.; Song, W.; Su, Z.; Lü, J.; Liu, Y.; Li, M. Mapping irrigated areas using random forest based on gf-1 multi-spectral data. ISPRS J. Photogramm. Remote Sens. 2020, XLIII-B2-2020, 697–702. [Google Scholar] [CrossRef]
- Magidi, J.; Nhamo, L.; Mpandeli, S.; Mabhaudhi, T. Application of the Random Forest Classifier to Map Irrigated Areas Using Google Earth Engine. Remote Sens. 2021, 13, 876. [Google Scholar] [CrossRef]
- Chaves, E.D.M.; Picoli, C.A.M.; Sanches, D.I. Recent Applications of Landsat 8/OLI and Sentinel-2/MSI for Land Use and Land Cover Mapping: A Systematic Review. Remote Sens. 2020, 12, 3062. [Google Scholar] [CrossRef]
- Bauer, M.E.; Cipra, J.E.; Anuta, P.E.; Etheridge, J.B. Identification and Area Estimation of Agricultural Crops by Computer Classification of LANDSAT MSS Data. Remote Sens. Environ. 1979, 8, 77–92. [Google Scholar] [CrossRef]
- Badhwar, G.B. Automatic corn-soybean classification using Landsat MSS data. II. Early season crop proportion estimation. Remote Sens. Environ. 1984, 14, 31–37. [Google Scholar] [CrossRef]
- Fan, X.S.; Xu, W.B.; Fan, J.L. Mapping winter wheat growing areas in the North China Plain with FY-3250 m resolution data. J. Remote Sens. 2015, 19, 586–593. [Google Scholar] [CrossRef]
- Claverie, M.; Ju, J.; Masek, J.G.; Dungan, J.L.; Vermote, E.F.; Roger, J.-C.; Skakun, S.V.; Justice, C. The Harmonized Landsat and Sentinel-2 surface reflectance data set. Remote Sens. Environ. 2018, 219, 145–161. [Google Scholar]
- Lunetta, R.S.; Johnson, D.M.; Lyon, J.G.; Crotwell, J. Impacts of imagery temporal frequency on land-cover change detection monitoring. Remote Sens. Environ. 2004, 89, 444–454. [Google Scholar]
- Carrão, H.; Gonçalves, P.; Caetano, M. Contribution of multispectral and mul-titemporal information from MODIS images to land cover classification. Remote Sens. Environ. 2008, 112, 986–997. [Google Scholar] [CrossRef]
- Griffiths, P.; Nendel, C.; Hostert, P. Intra-annual reflectance composites from sentinel-2 and landsat for national-scale crop and land cover mapping. Remote Sens. Environ. 2019, 220, 135–151. [Google Scholar] [CrossRef]
- Xiong, J.; Thenkabail, P.S.; Gumma, M.K.; Teluguntla, P.; Poehnelt, J.; Congalton, R.G.; Yadav, K.; Thau, D. Automated cropland mapping of continental Africa using Google Earth Engine cloud computing. ISPRS J. Photogramm. Remote Sens. 2017, 126, 225–244. [Google Scholar] [CrossRef]
- Defourny, P.; Bontemps, S.; Bellemans, N.; Cara, C.; Dedieu, G.; Guzzonato, E.; Hagolle, O.; Inglada, J.; Nicola, L.; Rabaute, T.; et al. Near real-time agriculture monitoring at national scale at parcel resolution: Performance assessment of the Sen2-Agri automated system in various cropping systems around the world. Remote Sens. Environ. 2018, 221, 551–568. [Google Scholar] [CrossRef]
- Bazzi, H.; Baghdadi, N.; Fayad, I.; Charron, F.; Zribi, M.; Belhouchette, H. Irrigation Events Detection over Intensively Irrigated Grassland Plots Using Sentinel-1 Data. Remote Sens. 2020, 12, 4058. [Google Scholar] [CrossRef]
- Bazzi, H.; Baghdadi, N.; Fayad, I.; Zribi, M.; Demarez, V.; Pageot, Y.; Belhouchette, H. Detecting irrigation events using Sentinel-1 data. In Proceedings of the 2021 IEEE International Geoscience and Remote Sensing Symposium IGARSS, Brussels, Belgium, 11–16 July 2021; pp. 6355–6358. [Google Scholar] [CrossRef]
- Balenzano, A.; Satalino, G.; Lovergine, F.P.; D’Addabbo, A.; Palmisano, D.; Grassi, R.; Ozalp, O.; Mattia, F.; Nafría García, D.; Paredes Gómez, V. Sentinel-1 and Sentinel-2 Data to Detect Irrigation Events: Riaza Irrigation District (Spain) Case Study. Water 2022, 14, 3046. [Google Scholar] [CrossRef]
- Blaes, X.; Vanhalle, L.; Defourny, P. Efficiency of crop identification based on optical and SAR image time series. Remote Sens. Environ. 2005, 96, 352–365. [Google Scholar] [CrossRef]
- Zhao, W.; Qu, Y.; Chen, J.; Yuan, Z. Deeply synergistic optical and SAR time series for crop dynamic monitoring. Remote Sens. Environ. 2020, 247, 111952. [Google Scholar] [CrossRef]
- Orynbaikyzy, A.; Gessner, U.; Mack, B.; Conrad, C. Crop Type Classification Using Fusion of Sentinel-1 and Sentinel-2 Data: Assessing the Impact of Feature Selection, Optical Data Availability, and Parcel Sizes on the Accuracies. Remote Sens. 2020, 12, 2779. [Google Scholar] [CrossRef]
- Zappa, L.; Schlaffer, S.; Brocca, L.; Vreugdenhil, M.; Nendel, C.; Dorigo, W. How accurately can we retrieve irrigation timing and water amounts from (satellite) soil moisture? Int. J. Appl. Earth Obs. Geoinf. 2022, 113, 102979. [Google Scholar] [CrossRef]
- Liu, C.; Guo, T. The Questions and Countermeasures in Fen River Irrigation Area. Shanxi Water Resour. 2017, 6, 2. [Google Scholar]
- Lei, J. The Current Condition and Development Plan on the Engineering Construction in Wenyu River Irrigation Area. Shanxi Water Resour. 2019, 6, 3. [Google Scholar]
- Huo, X. Review on the design of the Trapezoidal Channel of attached Engineering in Xiao River Irrigation Area. Shanxi Water Resour. 2014, 30, 10. [Google Scholar]
- Zhao, S.H.; Wang, Q.; Yang, Y.P.; Zhu, L.; Wang, Z.T.; Jiang, D. The demonstration research of GF-1 satellite data monitoring environment application. Satell. Appl. 2015, 3, 37–40. [Google Scholar]
- Jiang, W.; He, G.; Liu, H.; Long, T.; Wang, W.; Zheng, S.; Ma, X. Research on China’s land image mosaicking and mapping technology based on GF-1 satellite WFV data. Remote Sens. Land Resour. 2017, 29, 190–196. [Google Scholar] [CrossRef]
- Liu, J.; Wang, L.; Yang, L.; Teng, F.; Shao, J.; Yang, F.; Fu, C. GF-1 satellite image atmospheric correction based on 6S model and its effect. Trans. Chin. Soc. Agric. Eng. 2015, 31, 159–168. [Google Scholar]
- Fan, J.; Defourny, P.; Dong, Q.; Zhang, X.; De Vroey, M.; Belleman, N.; Xu, Q.; Li, Q.; Zhang, L.; Gao, H. Sent2Agri System Based Crop Type Mapping in Yellow River Irrigation Area. J. Geod. Geoinf. Sci. 2020, 3, 110–117. [Google Scholar]
- Fan, J.; Defourny, P.; Zhang, X.; Dong, Q.; Wang, L.; Qin, Z.; De Vroey, M.; Zhao, C. Crop Mapping with Combined Use of European and Chinese Satellite Data. Remote Sens. 2021, 13, 4641. [Google Scholar] [CrossRef]
- Fan, J.; Zhang, X.; Zhao, C.; Qin, Z.; De Vroey, M.; Defourny, P. Evaluation of Crop Type Classification with Different High Resolution Satellite Data Sources. Remote Sens. 2021, 13, 911. [Google Scholar] [CrossRef]
- Calibration Coefficients for Domestic Satellite Data (2008–2022). Available online: https://www.cresda.com/zgzywxyyzx/zlxz/article/20230410112855288395031.html (accessed on 24 May 2023).
- Gómez, C.; White, J.C.; Wulder, M.A. Optical remotely sensed time series data for land cover classification: A review. ISPRS J. Photogramm. Remote Sens. 2016, 116, 55–72. [Google Scholar] [CrossRef]
- Durgun, Y.Ö.; Gobin, A.; Van De Kerchove, R.; Tychon, B. Crop Area Mapping Using 100-m Proba-V Time Series. Remote Sens. 2016, 8, 585. [Google Scholar] [CrossRef]
- Pelletiera, C.; Valeroa, S.; Ingladaa, J.; Championb, N.; Dedieua, G. Assessing the robustness of Random Forests to map land cover with high resolution satellite image time series over large areas. Remote Sens. Environ. 2016, 187, 156–168. [Google Scholar] [CrossRef]
- Breiman, L. Random Forests. Mach. Learn. 2001, 45, 5–32. [Google Scholar] [CrossRef]
- Gislason, P.O.; Benediktsson, J.A.; Sveinsson, J.R. Random Forests for land cover classification. Pattern Recognit. Lett. 2006, 27, 294–300. [Google Scholar] [CrossRef]
- Pal, M. Random Forests for Land Cover Classification. In Proceedings of the IEEE International Symposium on Geoscience and Remote Sensing (IGARSS), Toulouse, France, 21–25 July 2003; pp. 3510–3512. [Google Scholar]
- Polikar, R. Ensemble based systems in decision making. IEEE Circuits Syst. Mag. 2006, 6, 21–45. [Google Scholar] [CrossRef]


| Band Number | Central Wavelength (nm) | Bandwidth (nm) | Resolution (m) |
|---|---|---|---|
| 1 | 485 | 70 | 16 |
| 2 | 555 | 70 | 16 |
| 3 | 660 | 60 | 16 |
| 4 | 830 | 120 | 16 |
| No. | 1 | 2 | 3 | 4 | 5 | 6 | 7 |
|---|---|---|---|---|---|---|---|
| Date | 27 December 2022 | 4 January 2023 | 25 January 2023 | 3 March 2023 | 27 March 2023 | 8 April 2023 | 29 April 2023 |
| Class | Acronym | Description | |
|---|---|---|---|
| Cropland | Irrigation 1 | I1 | Waterlogged or Frozen field after irrigation |
| Irrigation 2 | I2 | Field with high soil moisture after irrigation | |
| Winter Wheat | WW | Winter wheat field | |
| Straw Covered Cropland | SC | Cropland covered by the straw or other residues out of season | |
| Bare Cropland | BC | Bare and no covered cropland out of season | |
| Greenhouse | GH | Greenhouse for vegetable or other cash crops | |
| Orchards | OC | Fruit trees plantation | |
| Plantation | PL | Cropland planted with wood or shrub trees | |
| Non Cropland | Built-up | BU | Artificial area including building, road, and factory |
| Barren Land | BL | No vegetation covered area in rock mountain | |
| Deciduous Forest | DF | Deciduous tree and shrub | |
| Evergreen Forest | EF | Coniferous tree and shrub | |
| Water Body | WB | Lake, River, Dam, and other Water body |
| DATE\Class | 27 December 2022 | 4 January 2023 | 25 January 2023 | 3 March 2023 | 27 March 2023 | 8 April 2023 | 29 April 2023 | |||||||
|---|---|---|---|---|---|---|---|---|---|---|---|---|---|---|
| No. (Pixel Counts) | Proportion (%) | No. (Pixel Counts) | Proportion (%) | No. (Pixel Counts) | Proportion (%) | No. (Pixel Counts) | Proportion (%) | No. (Pixel Counts) | Proportion (%) | No. (Pixel Counts) | Proportion (%) | No. (Pixel Counts) | Proportion (%) | |
| BC | 1898 | 9.2 | 1705 | 7.9 | 1604 | 7.8 | 1466 | 7.1 | 1602 | 8.3 | 1569 | 7.8 | 1485 | 7.7 |
| BL | 1071 | 5.2 | 1015 | 4.7 | 1045 | 5.1 | 1085 | 5.2 | 1052 | 5.5 | 957 | 4.8 | 1014 | 5.3 |
| BU | 7349 | 35.6 | 6836 | 31.8 | 7662 | 37.3 | 7502 | 36.1 | 6873 | 35.6 | 7403 | 36.8 | 7077 | 36.8 |
| DF | 1466 | 7.1 | 1214 | 5.6 | 1339 | 6.5 | 1402 | 6.7 | 1319 | 6.8 | 1347 | 6.7 | 1259 | 6.5 |
| EF | 2067 | 10 | 2016 | 9.4 | 2067 | 10.1 | 2089 | 10 | 2139 | 11.1 | 1801 | 8.9 | 2060 | 10.7 |
| GH | 704 | 3.4 | 2561 | 11.9 | 695 | 3.4 | 745 | 3.6 | 687 | 3.6 | 514 | 2.6 | 700 | 3.6 |
| I1 | 1588 | 7.7 | 1523 | 7.1 | 1562 | 7.6 | 879 | 4.2 | 812 | 4.2 | 459 | 2.3 | 371 | 1.9 |
| I2 | 0 | 0 | 0 | 0 | 0 | 0 | 1327 | 6.4 | 1408 | 7.3 | 2587 | 12.8 | 1461 | 7.6 |
| OC | 342 | 1.7 | 436 | 2.1 | 402 | 2 | 347 | 1.7 | 374 | 1.9 | 399 | 2 | 531 | 2.8 |
| PL | 121 | 0.6 | 204 | 0.9 | 108 | 0.5 | 167 | 0.8 | 158 | 0.8 | 112 | 0.6 | 118 | 0.6 |
| SC | 1111 | 5.4 | 1051 | 4.9 | 829 | 4 | 770 | 3.7 | 391 | 2 | 164 | 0.8 | 155 | 0.8 |
| WB | 2278 | 11 | 2407 | 11.2 | 2114 | 10.3 | 2412 | 11.6 | 1806 | 9.4 | 1968 | 9.7 | 2140 | 11.2 |
| WW | 622 | 3.1 | 546 | 2.5 | 623 | 3 | 602 | 2.9 | 674 | 3.5 | 858 | 4.2 | 879 | 4.5 |
| Total | 20,617 | 100 | 21,514 | 100 | 20,544 | 100 | 20,793 | 100 | 19,295 | 100 | 20,138 | 100 | 19,250 | 100 |
| 27 December 2022 | 4 January 2023 | 25 January 2023 | 3 March 2023 | 27 March 2023 | 8 April 2023 | 29 April 2023 | |
|---|---|---|---|---|---|---|---|
| OA | 92.5 | 90.3 | 89.8 | 88.8 | 91.1 | 86.8 | 90.9 |
| Kappa | 91.0 | 88.0 | 88.0 | 87.0 | 89.0 | 84.0 | 89.0 |
| F1-Score | 90.1 | 85.9 | 84.2 | 83.7 | 86.7 | 82.1 | 86.5 |
| I1 | 97.2 | 97.1 | 92.2 | 88.1 | 87.2 | 91.7 | 86.0 |
| I2 | - | - | - | 72.7 | 75.6 | 80.3 | 95.8 |
| WW | 93.4 | 75.9 | 73.0 | 82.9 | 97.6 | 83.5 | 95.1 |
| SC | 85.7 | 79.3 | 81.4 | 59.1 | 61.6 | 55.4 | 63.3 |
| BC | 83.4 | 75.4 | 73.2 | 60.5 | 74.0 | 82.4 | 86.3 |
| GH | 91.9 | 87.5 | 81.6 | 96.1 | 96.7 | 81.0 | 87.2 |
| OC | 86.8 | 93.7 | 73.4 | 87.2 | 82.2 | 83.2 | 96.1 |
| PT | 77.1 | 63.0 | 63.7 | 77.5 | 71.7 | 39.2 | 68.2 |
| BU | 94.1 | 92.0 | 93.4 | 92.4 | 93.6 | 90.3 | 93.7 |
| BL | 89.7 | 91.5 | 95.5 | 86.4 | 95.3 | 59.3 | 86.3 |
| DF | 85.8 | 82.0 | 95.4 | 89.6 | 94.3 | 88.7 | 82.4 |
| EF | 98.1 | 98.3 | 99.2 | 98.4 | 99.4 | 95.1 | 91.9 |
| WB | 97.5 | 95.0 | 95.5 | 97.0 | 97.3 | 93.8 | 93.3 |
| Fen River | Wenyu River | Xiao River | |||||
|---|---|---|---|---|---|---|---|
| Sum | I1 | I2 | I1 | I2 | I1 | I2 | |
| 27 December 2022 | 98.6 | 65.8 | - | 22.9 | - | 9.9 | - |
| 4 January 2023 | 166.9 | 115.1 | - | 33.9 | - | 17.9 | - |
| 25 January 2023 | 208.0 | 143.1 | - | 37.6 | - | 27.3 | - |
| 3 March 2023 | 292.8 | 10.2 | 166.1 | 3.4 | 98.5 | 1.1 | 13.5 |
| 27 March 2023 | 538.0 | 6.2 | 306.4 | 1.3 | 166.0 | 0.3 | 57.8 |
| 8 April 2023 | 623.1 | 9.4 | 436.2 | 0.7 | 107.2 | 0.3 | 69.3 |
| 29 April 2023 | 653.8 | 5.8 | 453.1 | 1.1 | 120.5 | 0.9 | 72.4 |
Disclaimer/Publisher’s Note: The statements, opinions and data contained in all publications are solely those of the individual author(s) and contributor(s) and not of MDPI and/or the editor(s). MDPI and/or the editor(s) disclaim responsibility for any injury to people or property resulting from any ideas, methods, instructions or products referred to in the content. |
© 2023 by the authors. Licensee MDPI, Basel, Switzerland. This article is an open access article distributed under the terms and conditions of the Creative Commons Attribution (CC BY) license (https://creativecommons.org/licenses/by/4.0/).
Share and Cite
Su, Q.; Lv, J.; Fan, J.; Zeng, W.; Pan, R.; Liao, Y.; Song, Y.; Zhao, C.; Qin, Z.; Defourny, P. Remote Sensing-Based Classification of Winter Irrigation Fields Using the Random Forest Algorithm and GF-1 Data: A Case Study of Jinzhong Basin, North China. Remote Sens. 2023, 15, 4599. https://doi.org/10.3390/rs15184599
Su Q, Lv J, Fan J, Zeng W, Pan R, Liao Y, Song Y, Zhao C, Qin Z, Defourny P. Remote Sensing-Based Classification of Winter Irrigation Fields Using the Random Forest Algorithm and GF-1 Data: A Case Study of Jinzhong Basin, North China. Remote Sensing. 2023; 15(18):4599. https://doi.org/10.3390/rs15184599
Chicago/Turabian StyleSu, Qiaomei, Jin Lv, Jinlong Fan, Weili Zeng, Rong Pan, Yuejiao Liao, Ying Song, Chunliang Zhao, Zhihao Qin, and Pierre Defourny. 2023. "Remote Sensing-Based Classification of Winter Irrigation Fields Using the Random Forest Algorithm and GF-1 Data: A Case Study of Jinzhong Basin, North China" Remote Sensing 15, no. 18: 4599. https://doi.org/10.3390/rs15184599
APA StyleSu, Q., Lv, J., Fan, J., Zeng, W., Pan, R., Liao, Y., Song, Y., Zhao, C., Qin, Z., & Defourny, P. (2023). Remote Sensing-Based Classification of Winter Irrigation Fields Using the Random Forest Algorithm and GF-1 Data: A Case Study of Jinzhong Basin, North China. Remote Sensing, 15(18), 4599. https://doi.org/10.3390/rs15184599