1. Introduction
Loose engineering deposits (LEDs) are typical unfavorable geological bodies that can easily undergo collapse, excessive deformation, and uneven settlement during engineering construction and even result in serious engineering disasters. Therefore, it is crucial to prevent engineering disasters during construction on loose deposits. The morphological study and volume calculation of LEDs has been a hot topic in engineering research, and its application area is wide. In large construction projects such as highways, railroads, tunnels, and ports, earthwork accounts for a large part of the total cost and requires a large amount of planning and continuous productivity assessment. The calculation of the volume of LEDs should be as accurate and efficient as possible, which is beneficial to cost control [
1]. The volume of material transportation, use, and consumption can also be used as an indicator to predict the progress of the project [
2]. In open pit mining and stripping projects, the stripping as well as mining works are large, and site managers need to know the approximate mineral reserves, as well as production and efficiency. The volume determination results are directly linked to economic interests and directly affect the arrangement of staff and equipment [
3], which helps mines achieve their goals, while determining the amount of storage space required to provide a basis for pit backfill and land reclamation plans [
4]. Land resources development and consolidation are effective measures to achieve the dynamic balance between the amount of arable land and the population, and the investment in earth movement for land leveling accounts for about 40% to 80% of the total investment. The accurate and efficient calculation of loose earth deposits is related to the investment in and effect of land resources development and consolidation to improve the quality of land use [
5]. For natural geological hazards such as landslides, the accurate calculation of the volume size of the loose deposits of landslides that have already occurred helps in analyzing the extent of their causation and carrying out rescue work; the identification of potential landslide forms and the estimation of volumes help in early warning forecasting and the placement of engineering management measures [
6,
7]. Scheidegger (1977) argued that if the potential landslide volume can be estimated, the correlation between it and the friction coefficient can be used to predict the expected extent of sliding, and this correlation in the equation denotes the landslide volume and the friction coefficient [
8]. Zhou et al. (2017) identified and analyzed the morphology of 12 typical landslides in the Martian Sailor Valley and studied the calculation scheme of the volume to derive the statistical laws between the volume of landslides and the area of the accumulation [
9], and between the equivalent friction coefficient of landslides and the volume of landslides. This helped to better explain the mechanism of landslide formation and the interaction between landslides on Mars and the environment, as well as being important for the study of the reference value of landslides on Earth. Therefore, the volume calculation for LEDs, especially intelligent calculation, is of great importance in production.
Due to the different accumulation methods and different morphology of the LEDs, they are irregular geometries in space and there is no standard analytical formula for volume calculation. The commonly used traditional earth determination methods mainly include the square grid method, triangular grid method, section method, contour method, etc. Among them, the contour method measures the coordinates of discrete points on the surface of a LED by using a total station or real-time dynamic positioning (RTK), establishes a digital model of the deposit surface by drawing contour lines, and then calculates the volume of the deposit [
10]. The traditional methods, however, are complicated by the shape of the deposit; uneven discrete determination points and local points cannot be measured, along with other factors [
11,
12], which greatly affect the efficiency and accuracy of volume determination of LED and bring inconvenience to the subsequent research. With the development of remote sensing technology, remote sensing images and a digital elevation model (DEM) are widely used, such as when McEwen used Mars Sailor Valley image data to estimate the volume of landslides in Sailor Valley and determined the calculation formula [
13]. This scheme requires many experimental conditions, such as weather, ground cover, etc., resulting in the relatively low accuracy of the scheme, while remote sensing image classification and target identification still rely on manual work, which is less accurate and not efficient enough. More efficient and reliable data acquisition, as well as volume calculation methods, should be adopted.
Terrestrial laser scanning technology, a kind of remote sensing, has been widely used in many fields such as industry, art, and engineering in recent years as a new means of surveying and mapping [
14]. The terrestrial laser scanner can acquire high-precision point clouds of the LEDs in a short period and accurately represent the surface characteristics of the measured object. Meanwhile, 3D laser scanning technology can collect data remotely without contact and measure locations that are inconvenient for staff to reach when working conditions are limited [
15,
16]. The 3D scanning technology was used for field determinations of architectural heritage to obtain real spatial data models of traditional ancient buildings, which provided reference data for the conservation and restoration of traditional buildings [
17]. Liu et al. (2021) combined 3D laser scanning technology and BIM and reviewed various applications in the building life cycle [
18]. In terms of morphology identification and volume determination of LEDs, Ge et al. (2020) utilized the point clouds of landslide deposits collected by terrestrial laser scanning to further identify and extract particles in the LED [
19]. Yang et al. (2020) extracted and measured volume algorithms from 3D coal deposits by multi-scale directional curvature, which uses multiple grids and triangular prisms to reconstruct peak and slope points and calculate the volume of the deposit [
3]. Lai et al. (2022) patched the 2.5D underwater point cloud acquired with 3D laser scanning and estimated the volume of underwater objects using the alpha shape algorithm [
20]. Huising and Gomes Pereira (1998) estimated the error and accuracy of laser data acquired by various laser scanning systems used for terrain applications, and the results showed that laser scanning can be used for various purposes of terrain information extraction [
21].
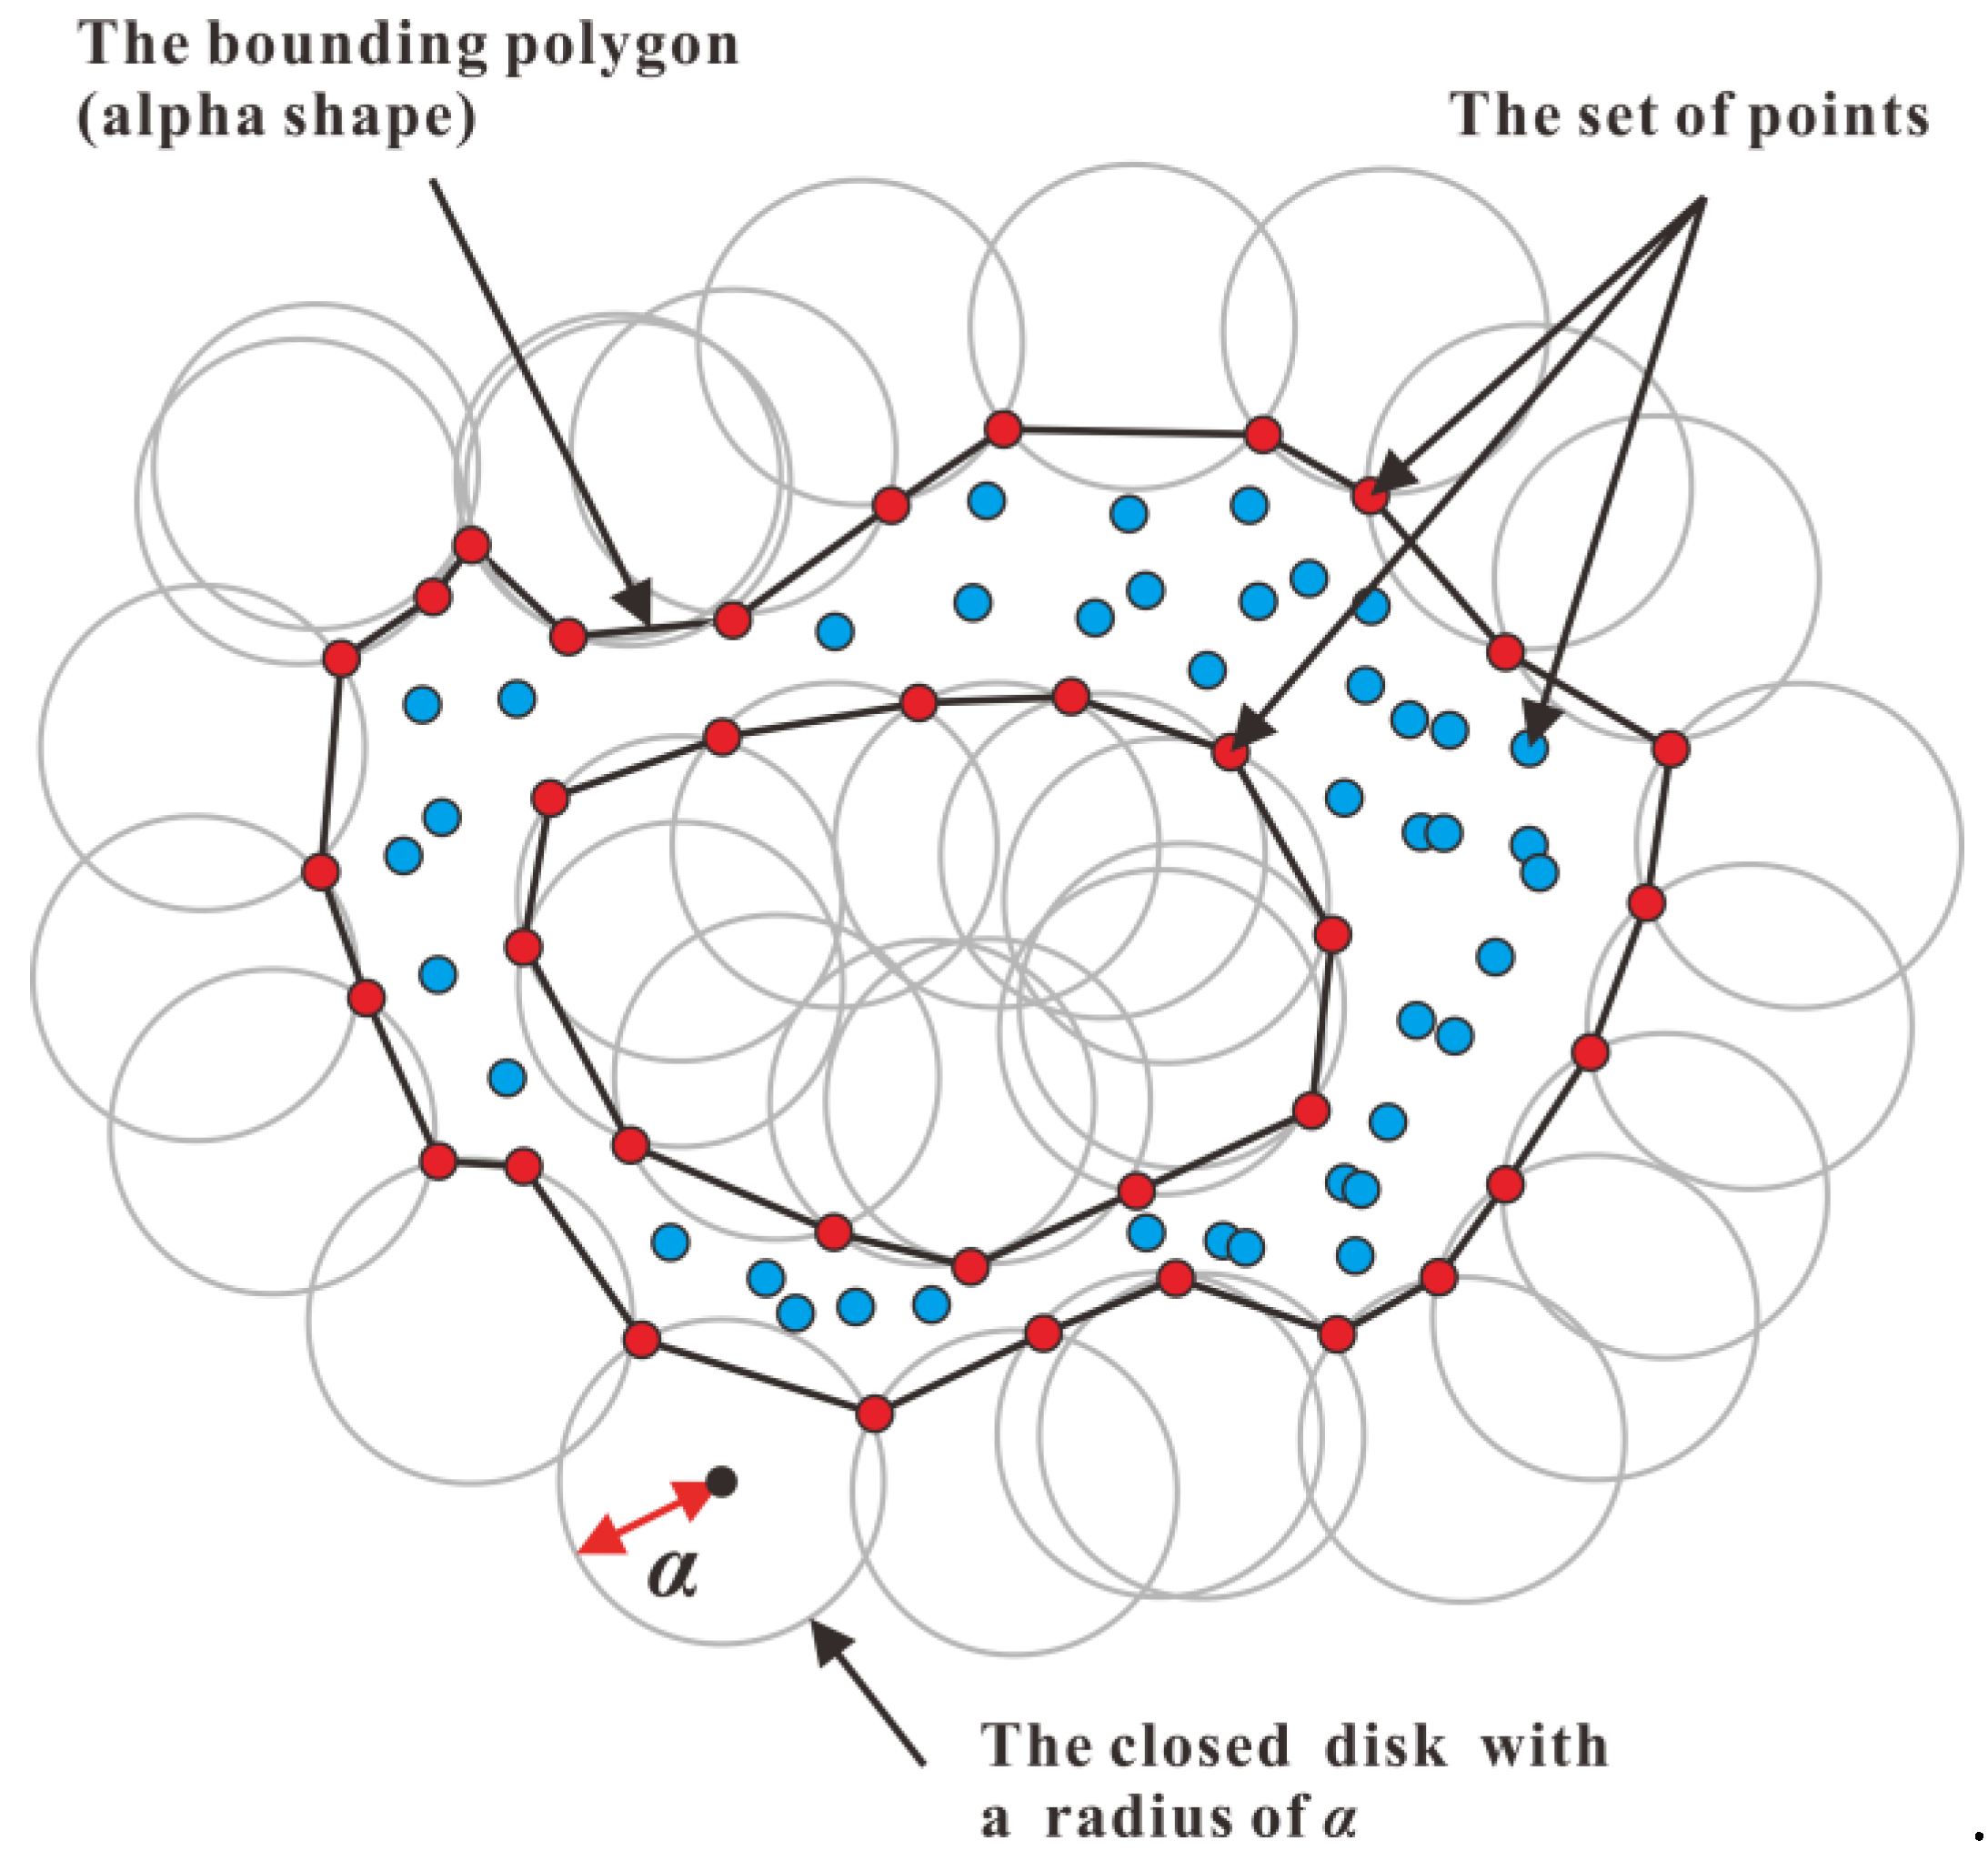
Several algorithms are available to generalize bounding polygons enveloping a set of points (point clouds), which is essential for constructing the 3D surface model of the LED. Among them, the alpha shape algorithm is a potential tool to address the abovementioned problems. Conceptually, the alpha shape is defined as the generalization of the polytope of a finite point set, which is uniquely determined by the point set and an alpha radius. For a given set of points, the alpha radius controls the fit level of the convex hull to the point set. Assume that a generalized disk or sphere with the alpha radius contains the points to produce the alpha shape. If the alpha radius = ∞, a convex hull will be created. If the alpha radius = 0, an empty alpha shape will be produced. If alpha radius = (0, ∞), it is possible to generate a non-convex region through tightening or loosening the fit around the points [
22,
23]. However, due to the inherent technical defects of the impenetrability of the laser scanning, it is impossible to collect the bottom boundary of the LED, resulting in the missing bottom point clouds of the LED. Correspondingly, it is difficult for researchers to determine the boundary conditions of the deposit, which in turn causes uncertainty in its volume calculation using the existing algorithms. Therefore, there is an urgent need for automatic and intelligent calculation methods with simple operation and accurate results in the volume calculation of LEDs.
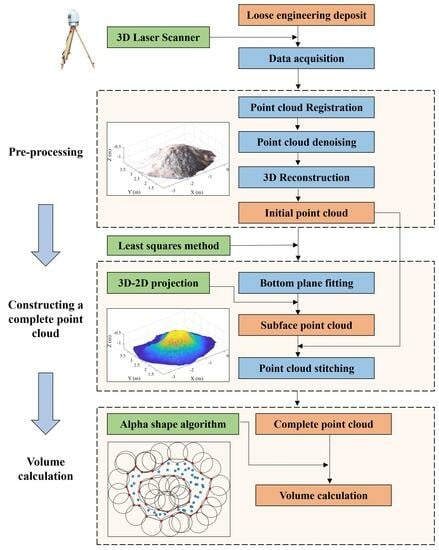
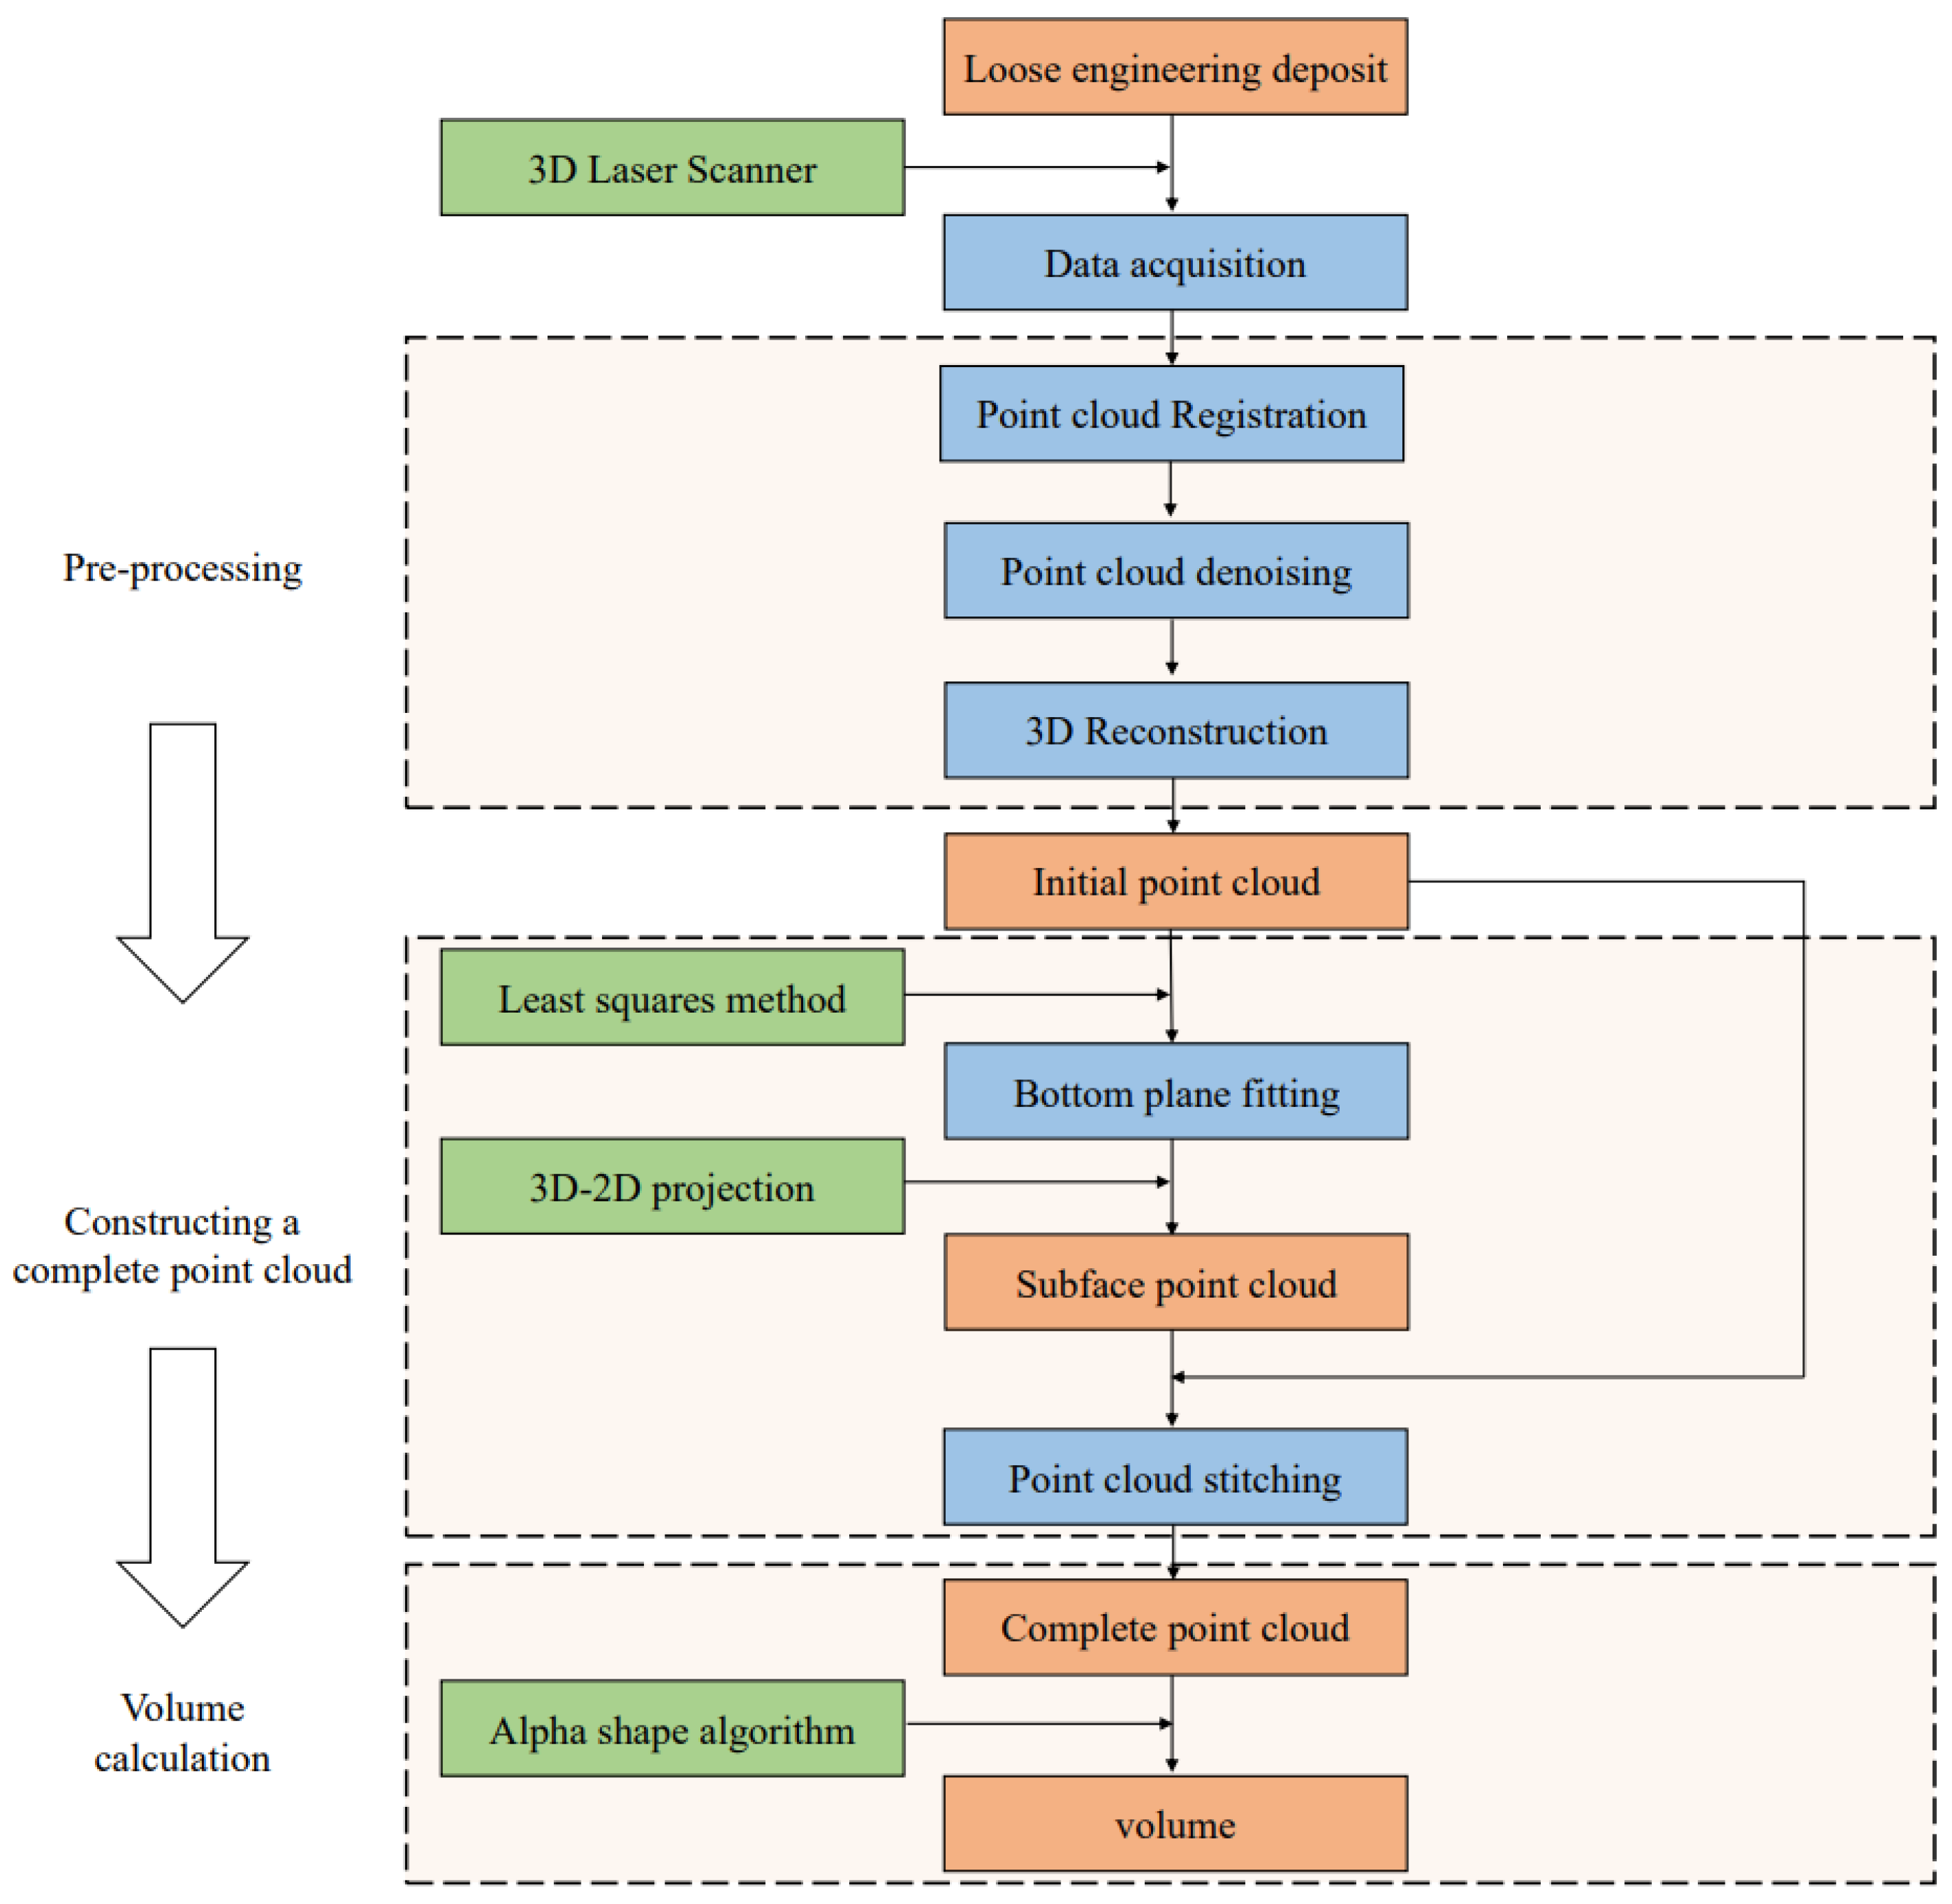
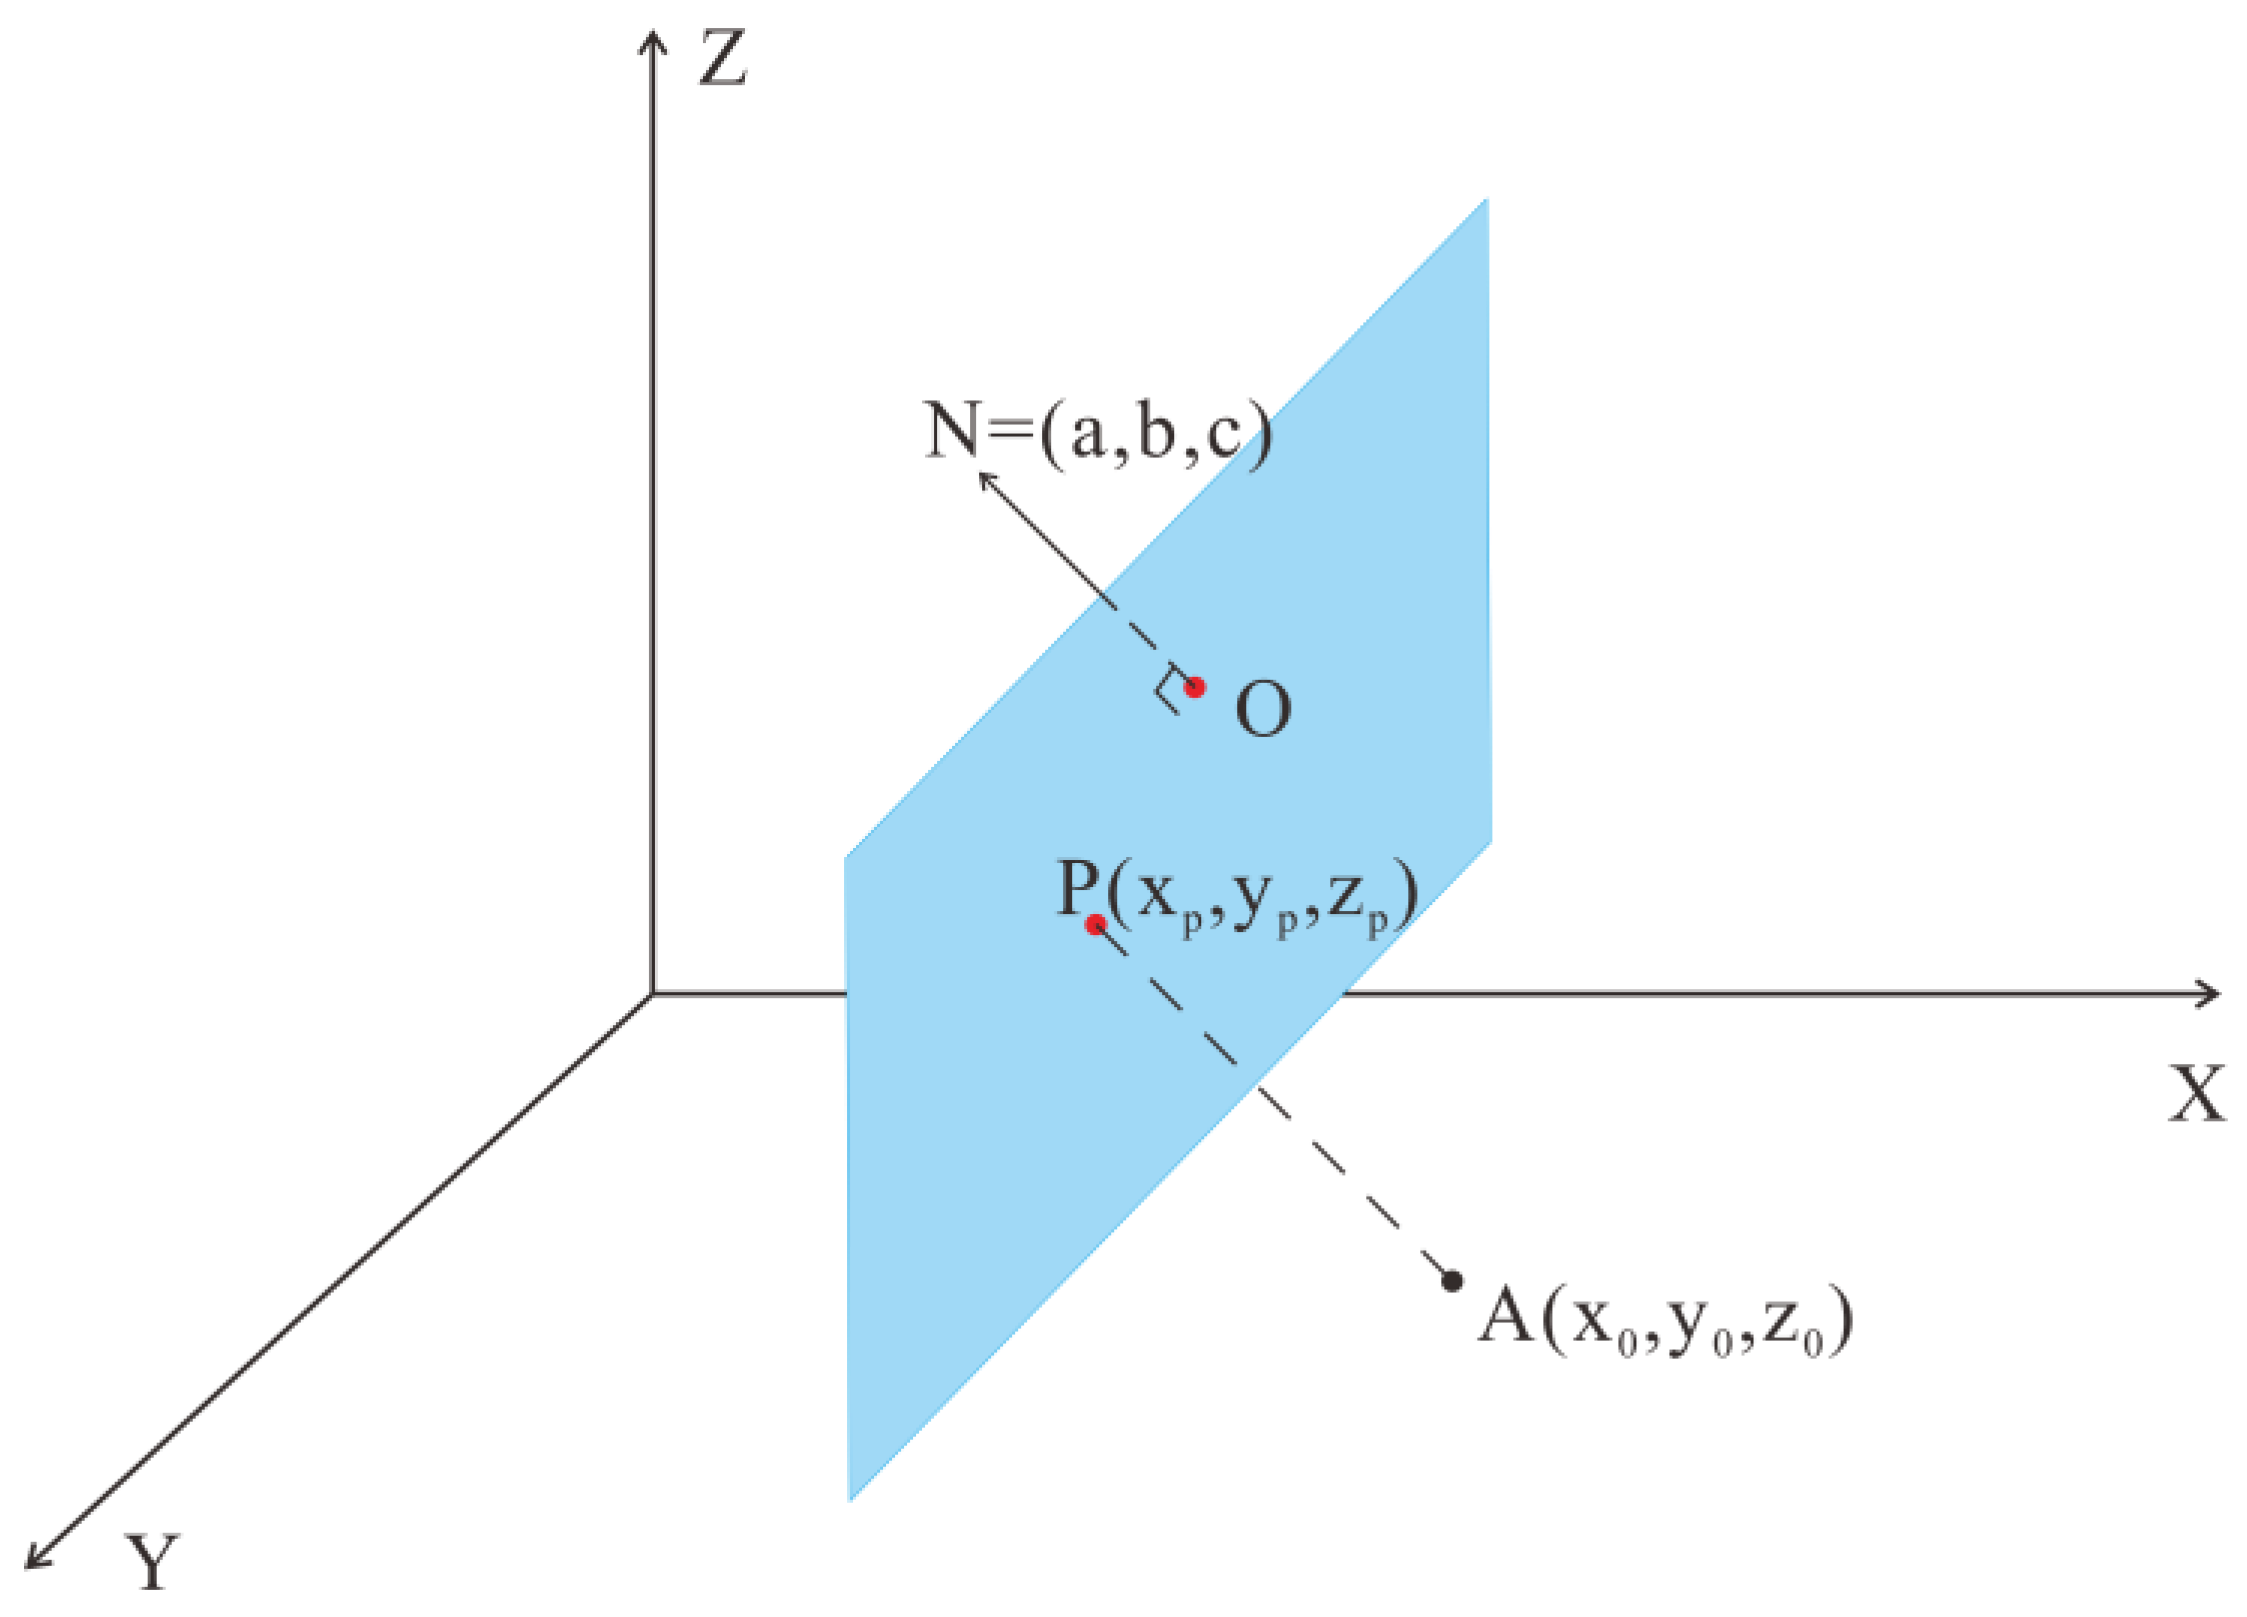
This paper aims to propose a new method to automatically and accurately measure the volume of LEDs using point clouds collected by laser scanning. Using the terrestrial laser scanner, the 3D point clouds of deposits can be directly obtained, and most LEDs are placed on the ground in reality. Assuming that the bottom surface of the LED is flat-based, an algorithm was proposed to fit the bottom surface and construct a complete 3D point cloud with good closure, integrity, and accuracy. Finally, the alpha shape algorithm was introduced to convert the 3D point cloud into a closed geometry for the volume calculation of the LED.
4. Discussions
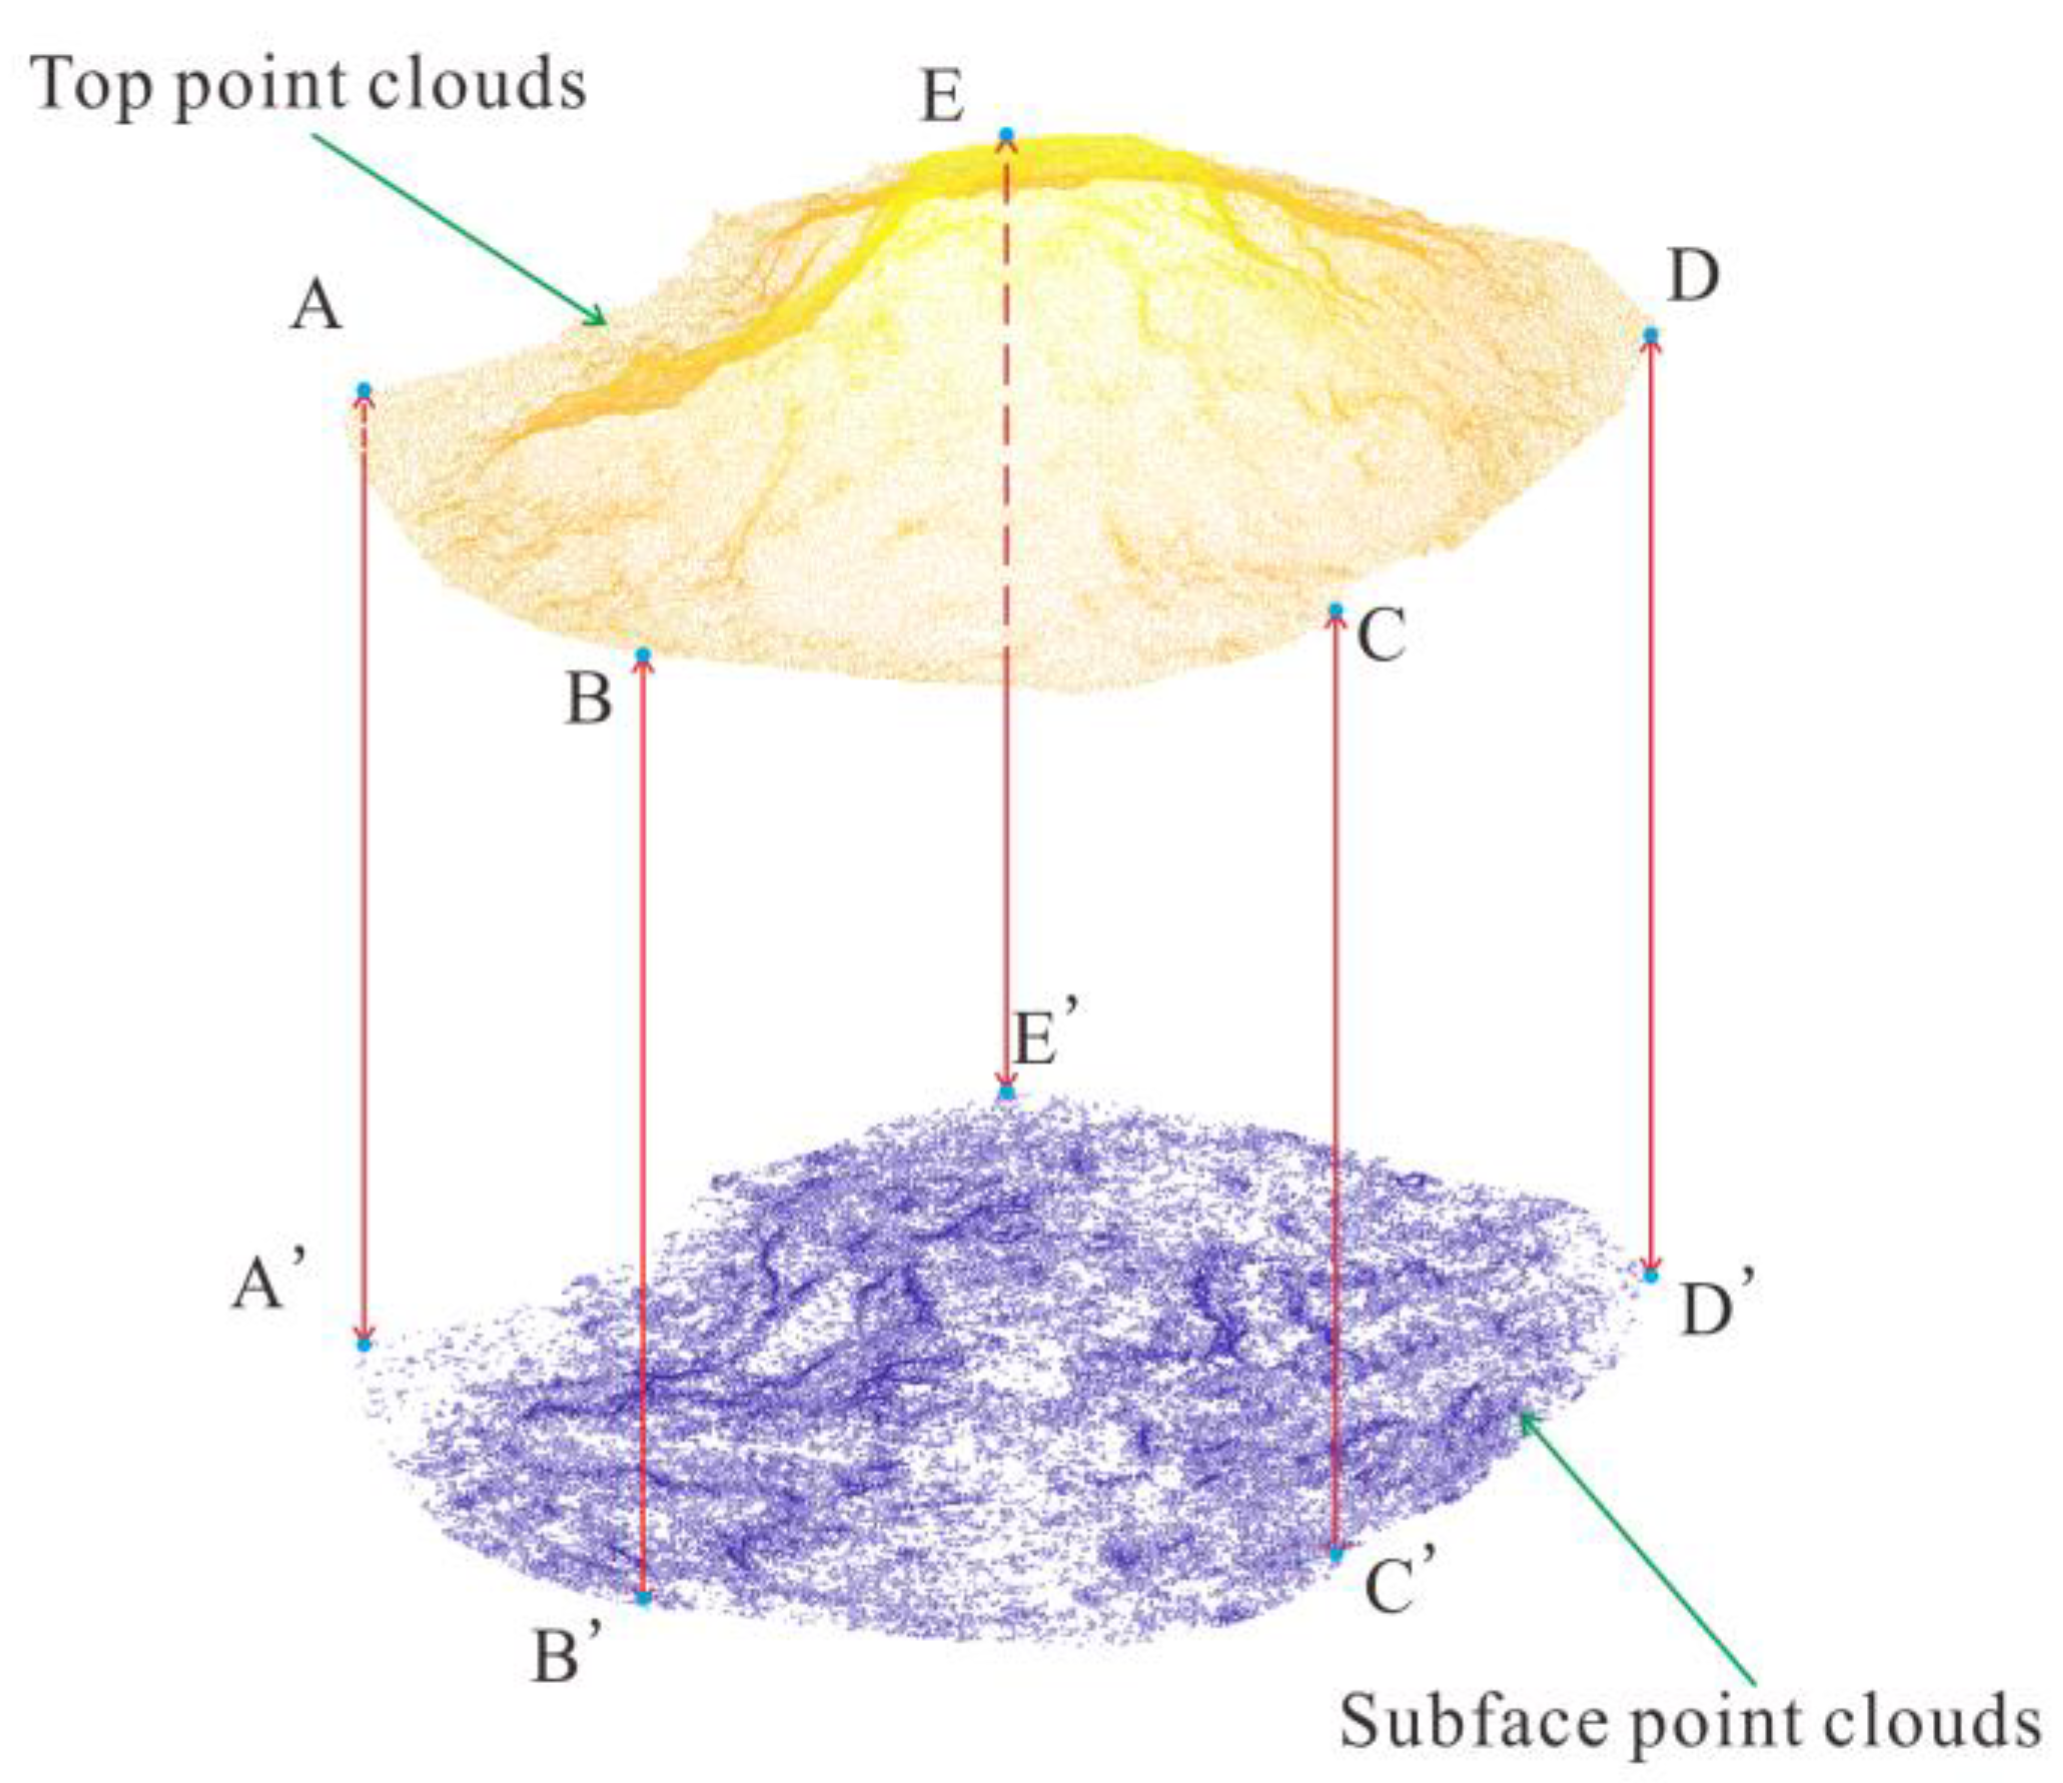
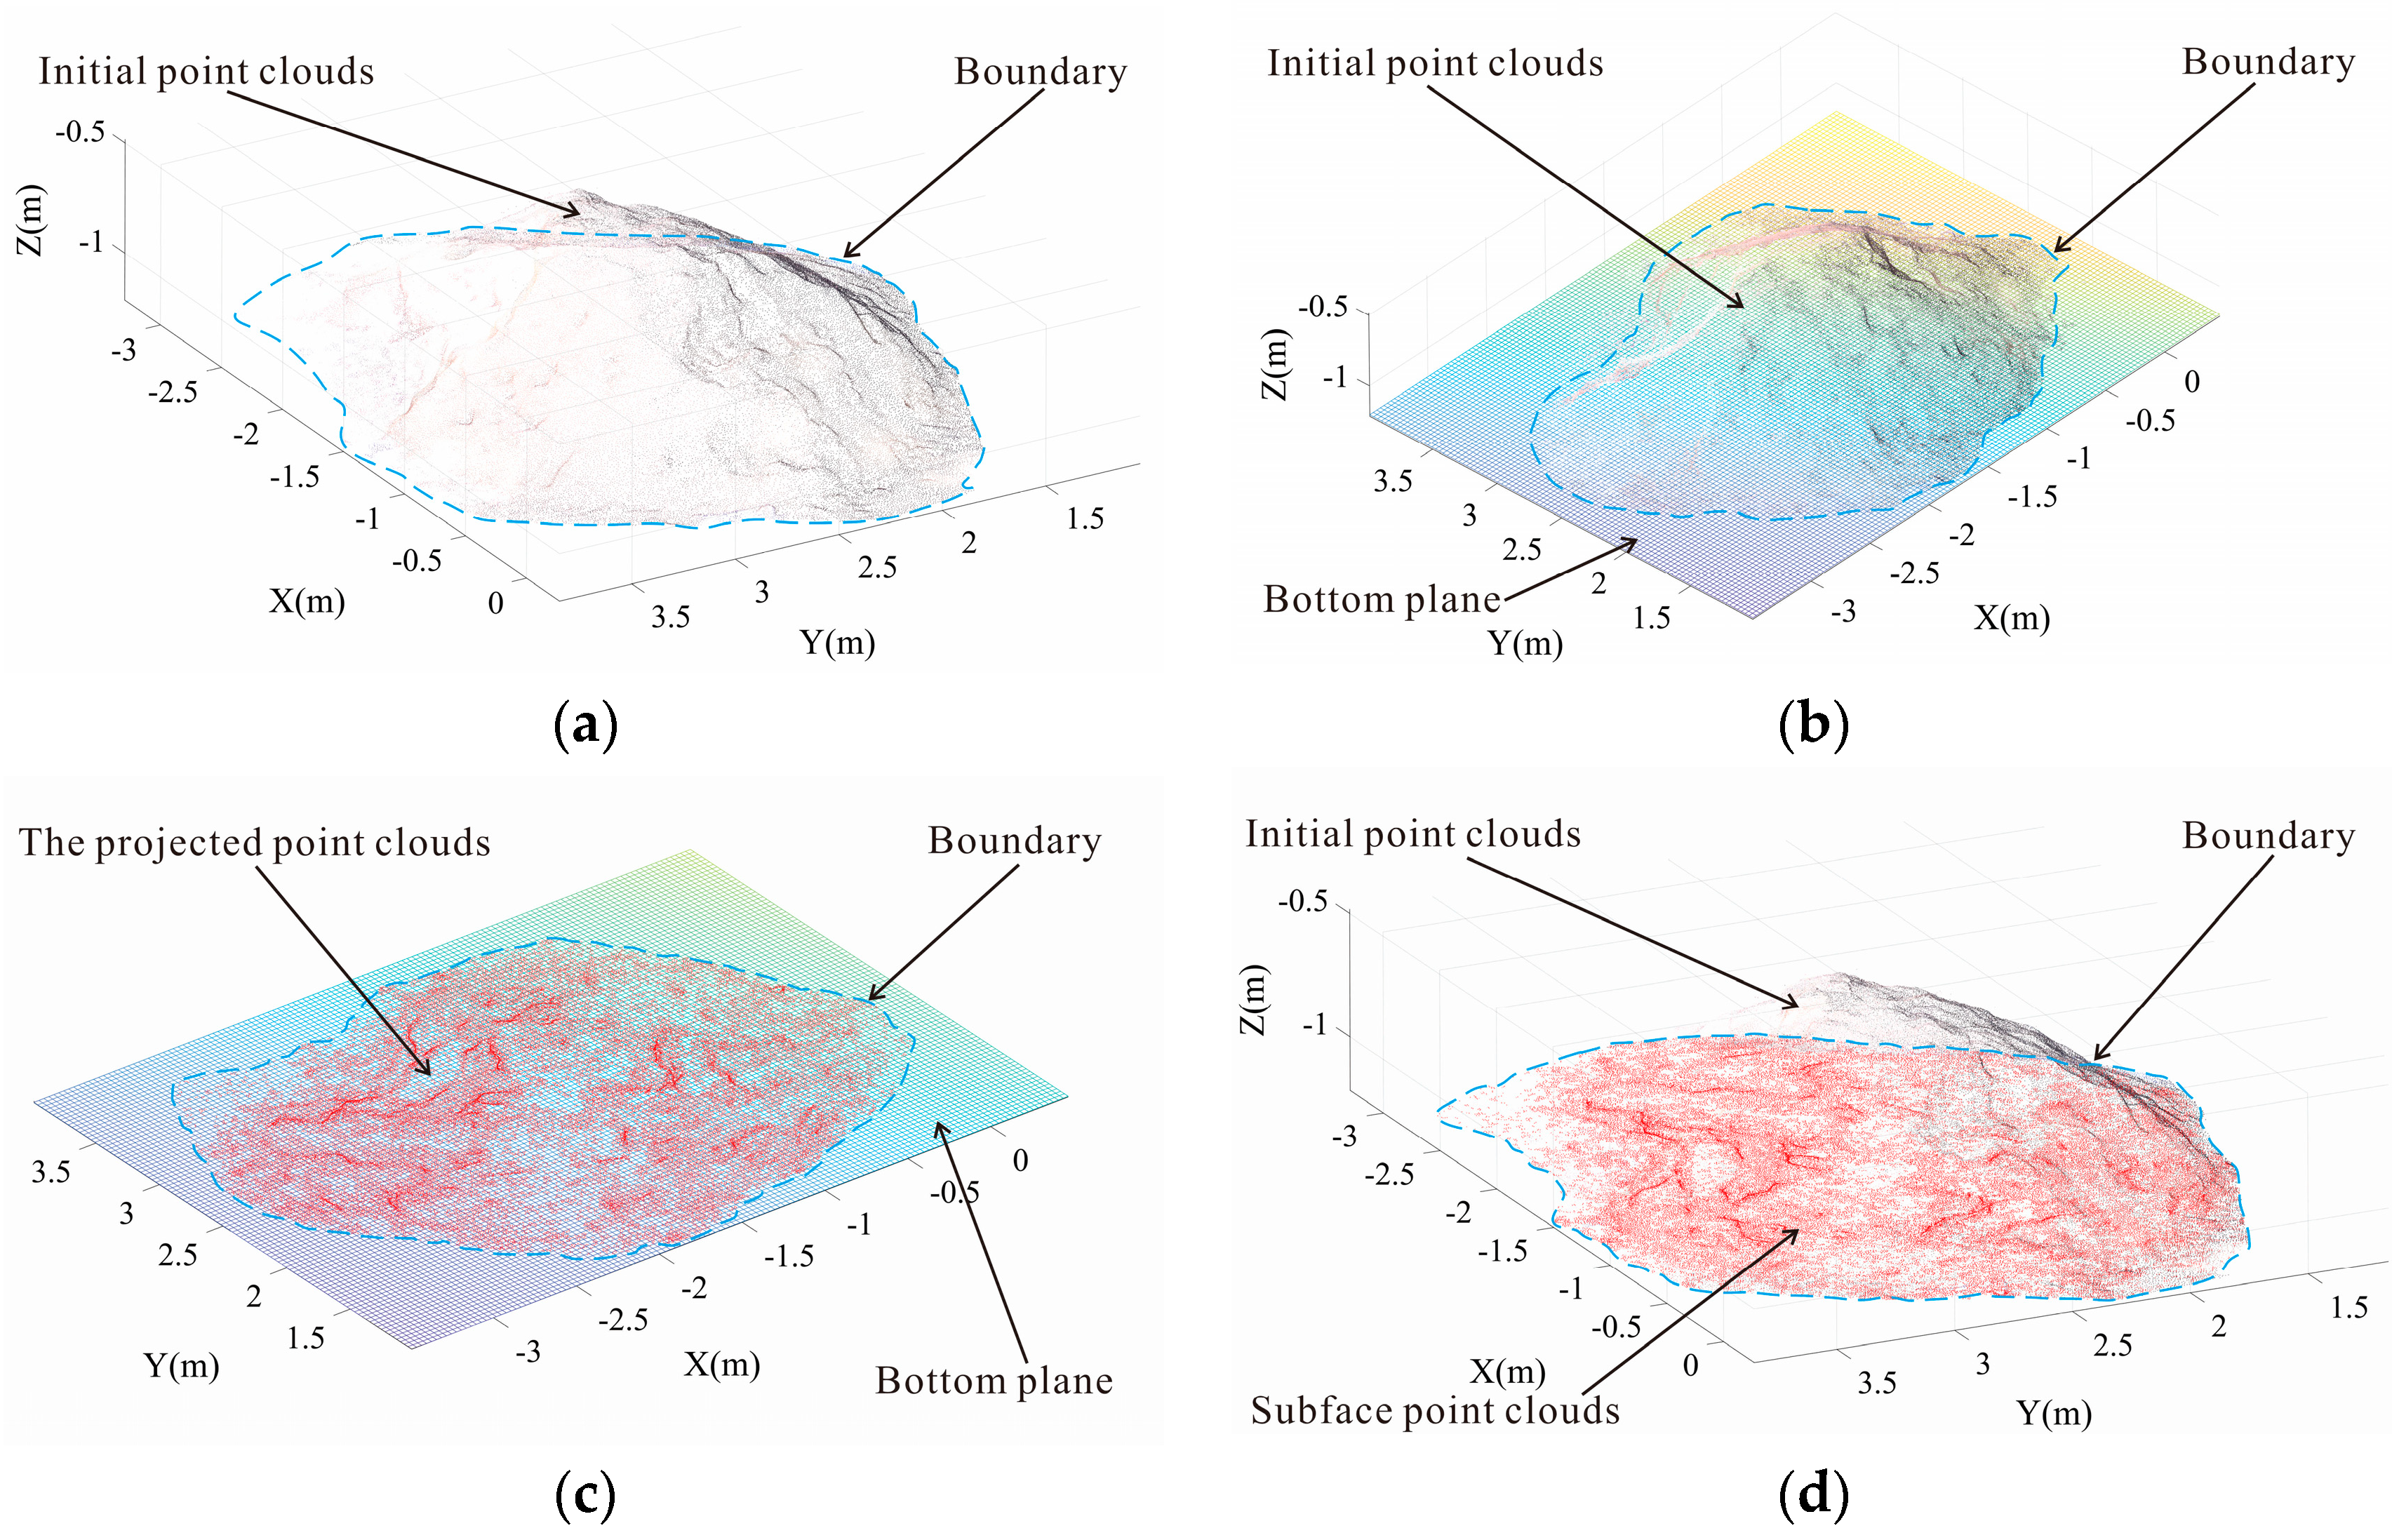
Starting from a point cloud obtained by scanning often lacks bottom surface point cloud data, so in this paper, the 3D point cloud was projected to the 2D plane by bottom plane fitting.
Table 3 and
Figure 11 show that the subface points obtained by this method can well determine the bottom plane boundary of the LED when the bottom surface is nearly flat, and the complete point clouds constructed have good representativeness for the LED. However, this proposed method does not apply to the case where the morphological characteristics of LEDs are large at the top and small at the bottom, because when the bottom surface is not the largest plane, the bottom point cloud data obtained from the point cloud projection onto the bottom plane cannot represent its true subface, and the bottom boundary cannot be determined.
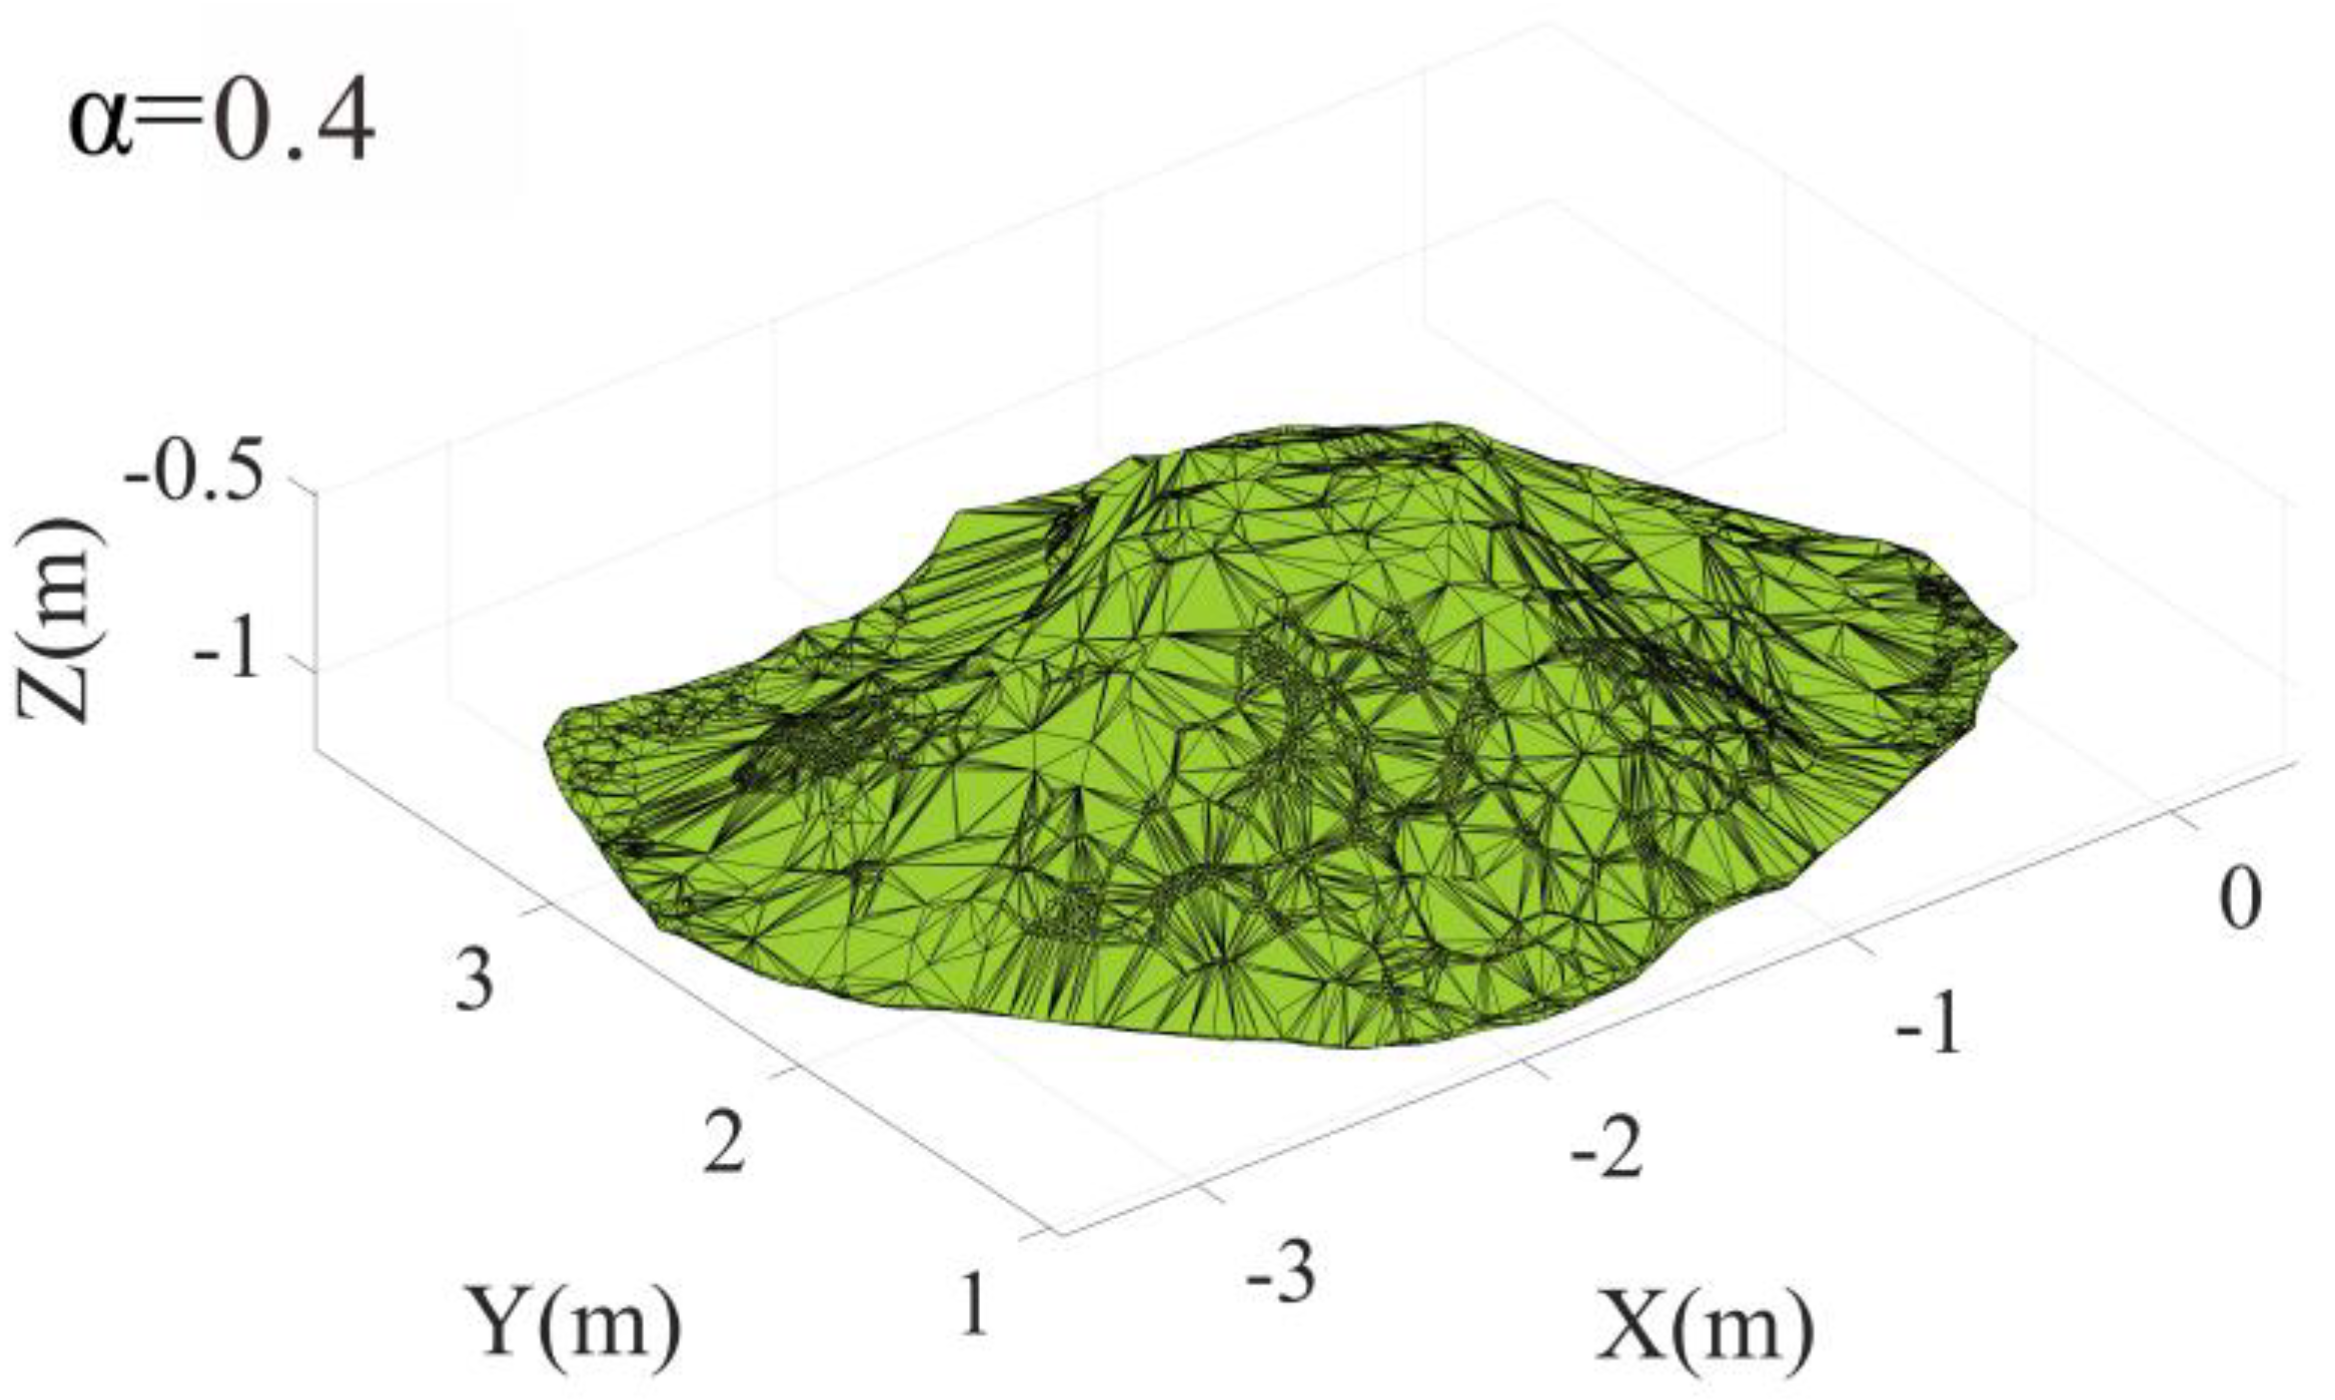
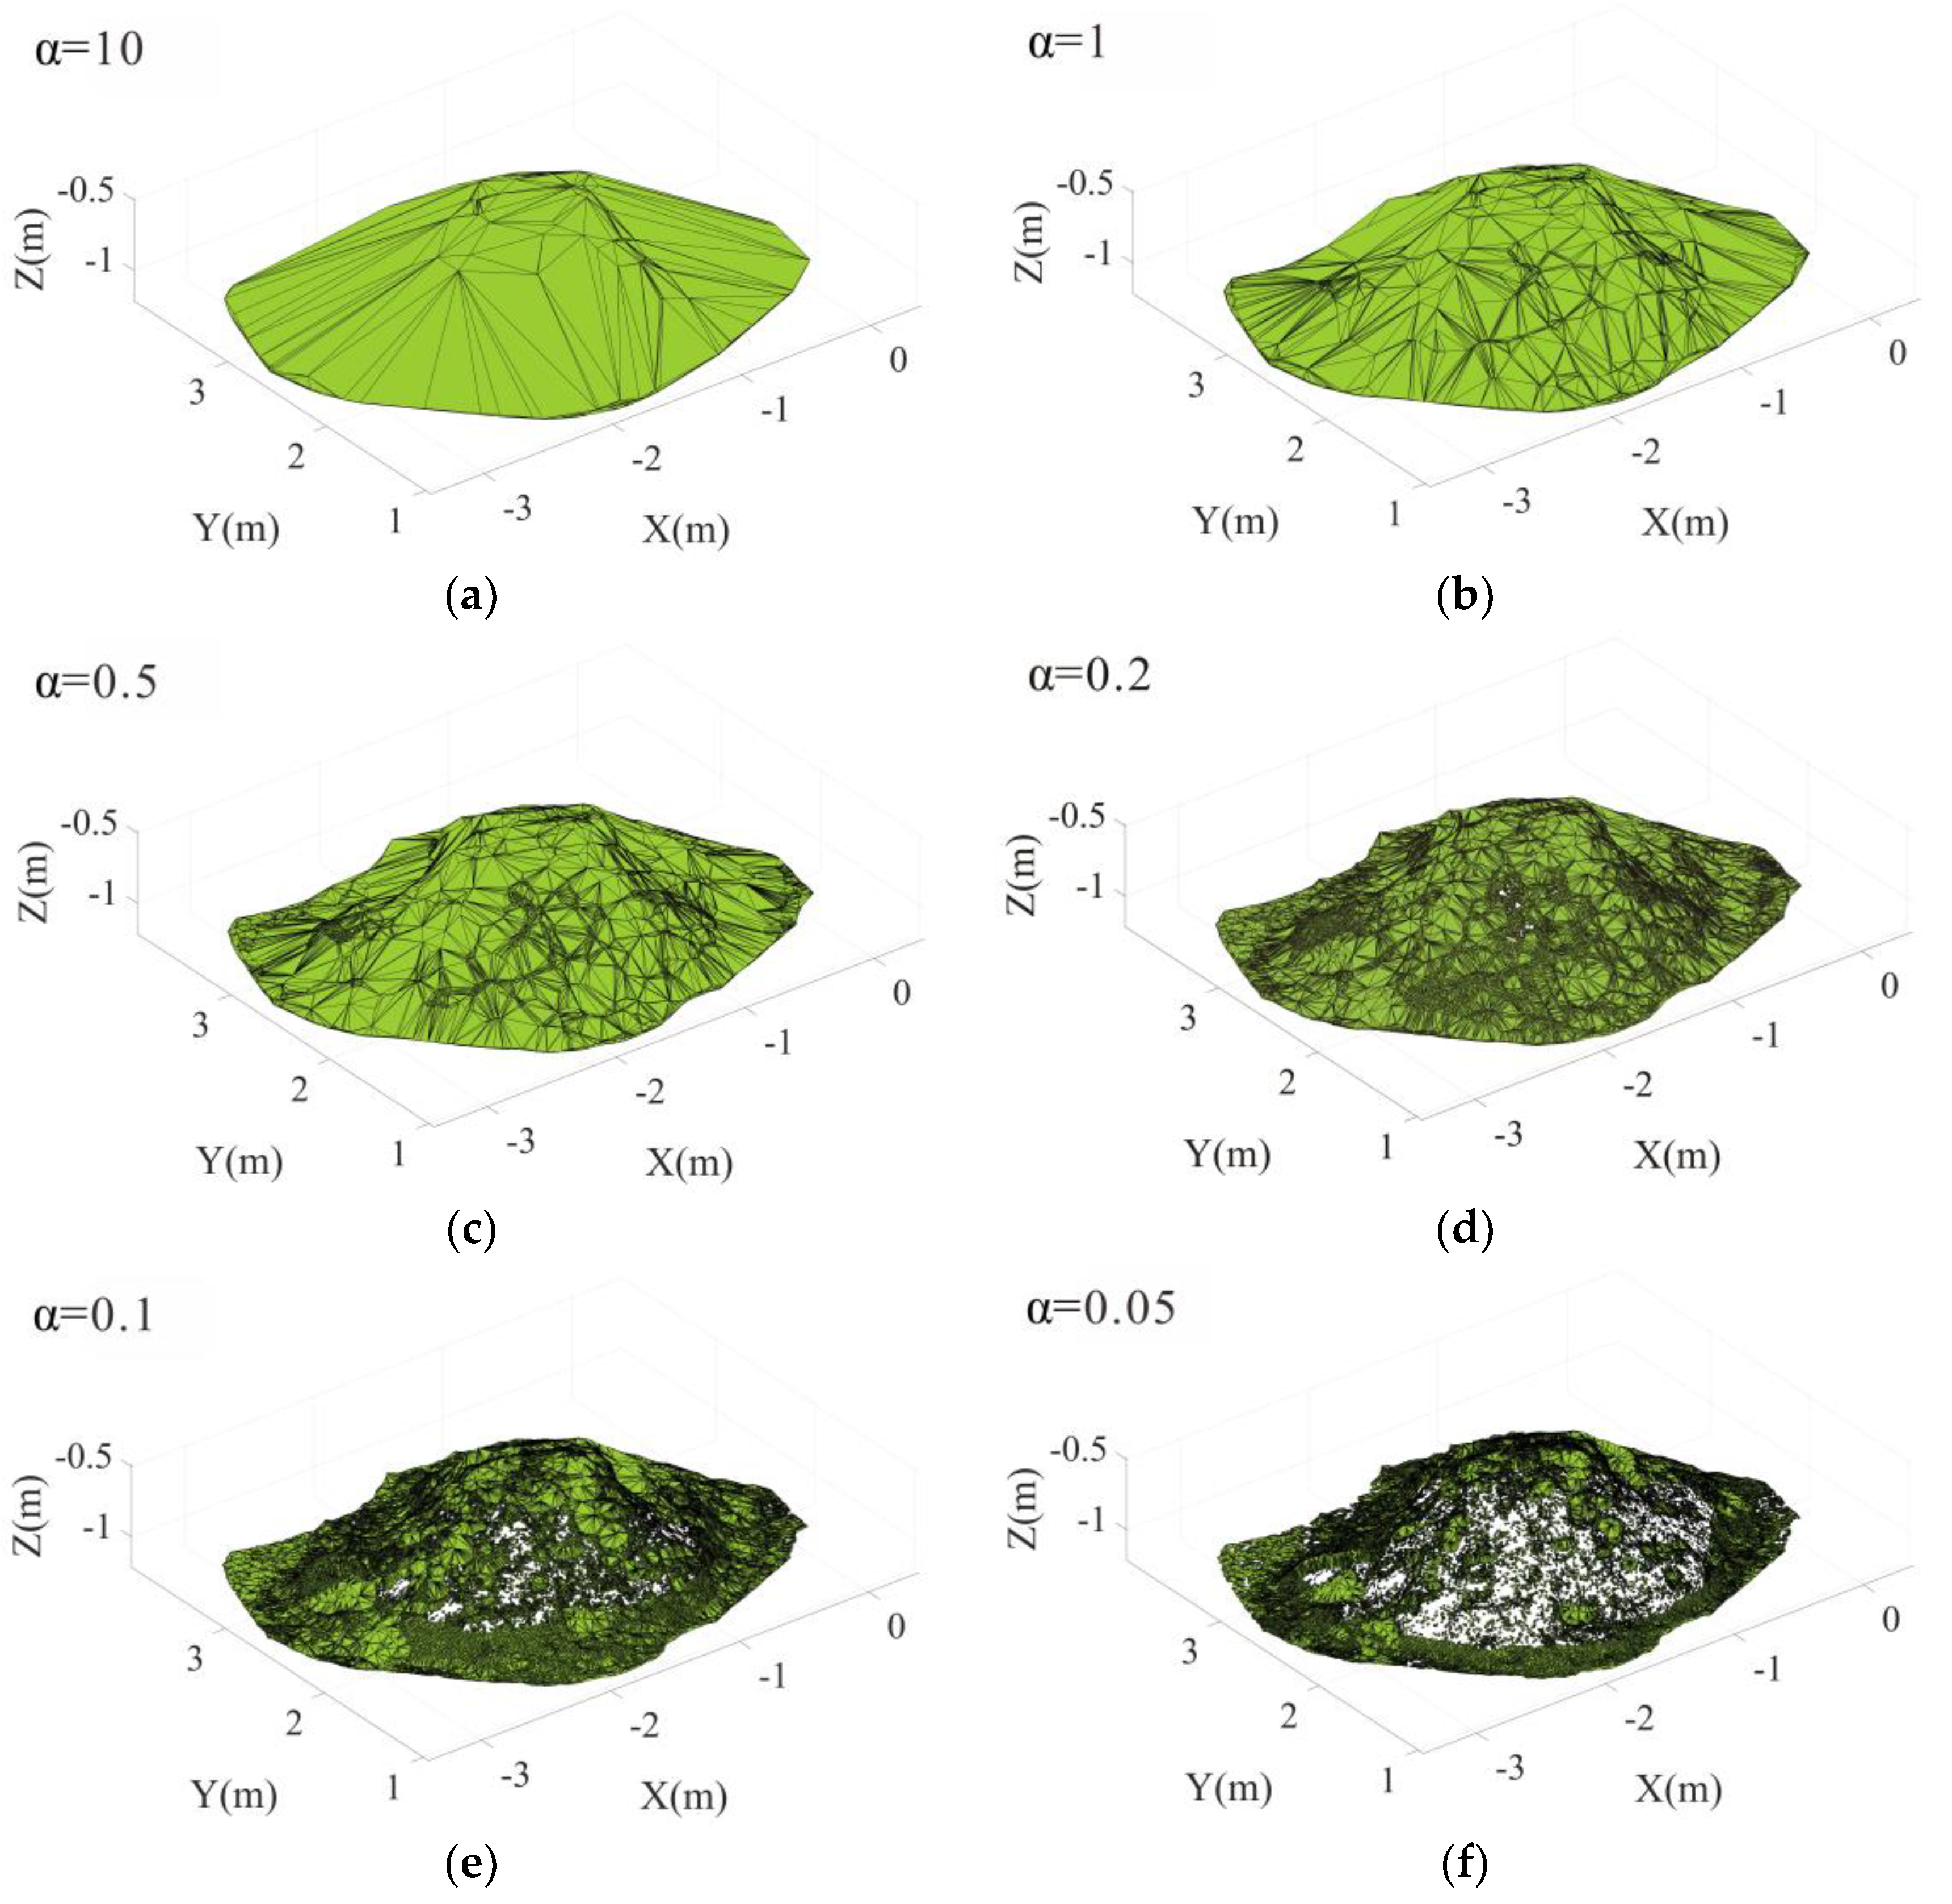
In the process of 3D reconstruction and volume calculation of the LED using the alpha shape algorithm, different parameters
α can construct different spatial morphological features of the LED. As an example,
Figure 13a–f shows the effect of alpha shape on the 3D modeling of the sand deposit when the parameters α are set to 10, 1, 0.5, 0.2, 0.1, and 0.05 m, respectively.
Meanwhile, in this paper, the volume results were calculated using the software Geomagic as the real value for the reference. In the Geomagic software, noise reduction was set as auto, and the small components were deleted during model building. Additionally, the maximum number of edges (holes) was specified as 20, and other options were set to default. To determine the appropriate parameter
α, more
α values (10, 1, 0.9, 0.8, 0.7, 0.6, 0.5, 0.4, 0.3, 0.2, 0.1, and 0.05 m) were considered to reconstruct the 3D models of soil mounds, and the corresponding volume results of the proposed algorithm with different parameters
α are shown in
Table 6.
As shown in
Figure 13, when the parameter
α = 10 m, the radius of the sphere is too large and the structure of the sand deposit is highly integrated, the generated model is a convex packet composed of the outermost point cloud of the data, and this model cannot express the specific details of the sand deposit clearly and the effect is not satisfactory. At the same time, combined with
Table 4, the volume calculation result is large, 2.400 m
3, and the real value of 1.764 m
3 shows a relative error of 36.1% and does not meet the requirements. When the parameter
α = 0.1 m, the radius of the sphere is too small, and it cannot find enough points to establish the boundary 3D body. The reconstruction result is incomplete, and there are more holes and defects. Meanwhile, combined with
Table 6, the volume calculation result is small this time, 0.301 m
3, and the relative error with the real value of 1.764 m
3 is 82.9%, which does not meet the requirements. When the parameter
α = 0.4 m is moderate, the 3D reconstruction model is finer and representative, and the corresponding volume calculation accuracy reaches 95.29%.
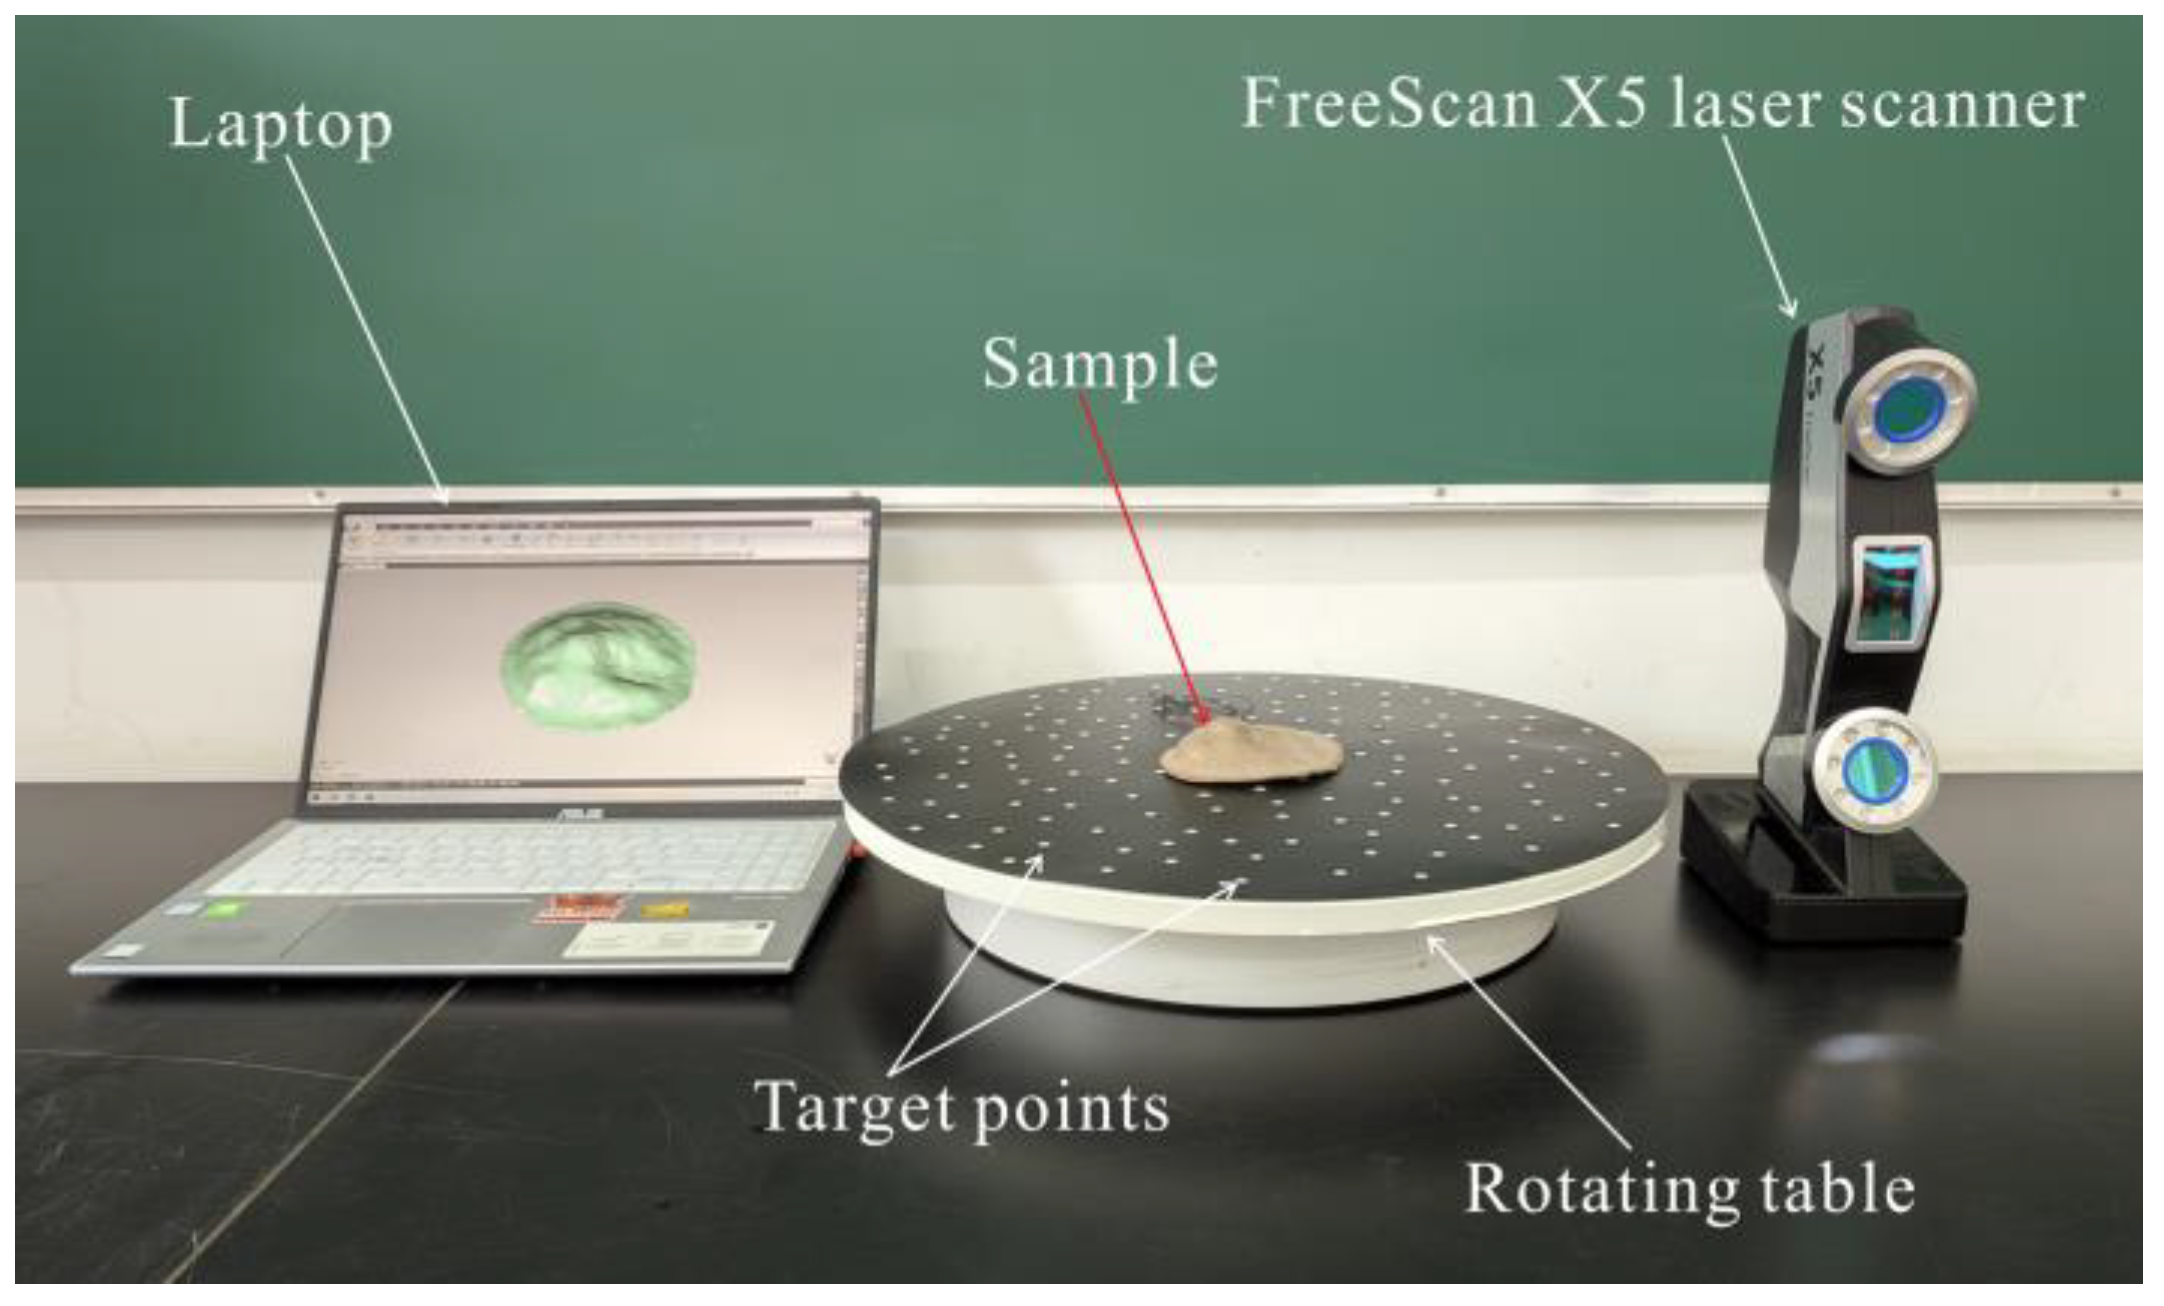
The selection of an appropriate parameter α highly depends on the geometry of the scanned object and measuring resolution. When the objects have complex shapes and surface contours, α is supposed to be set to a smaller value than the simple-shaped objects. In this study, both the soil samples in the laboratory and the sand deposits in the field site were characterized as mound-shaped, and therefore the geometry had a limited influence on the selection of the appropriate α for these two cases. On the other hand, the point interval is closely related to the measuring resolution. If there is a large point interval for the point cloud, correspondingly, a large α is supposed to be chosen for the 3D reconstruction. In this study, the point clouds of three soil mound models were collected using the handheld laser scanner with an approximate resolution of mm (0.13, 0.15, and 0.15 mm point intervals for samples No. 1, No. 2, and No. 3, respectively); while the terrestrial laser scanner was used to collect the point clouds of the sand deposits with a point interval of m (point interval ≈ 12.5 mm). Therefore, this is the major reason why the parameter α in the laboratory experiments (0.04 mm) was far less than the one described for the field experiments (0.4 m). A pre-determined α value may be specified to allow the comparison of the sizes and shape/surface contours of the reconstructed point clouds.
5. Conclusions
This paper proposes a new method to automatically determine the volume of LEDs using point clouds collected by terrestrial laser scanning equipment. Starting from the problem of lacking bottom surface point cloud data when scanning the LED, a plane fitting, point cloud projection method was used to combine the subface point cloud with the initial point cloud to form complete point cloud data with good representativeness for LEDs. The alpha shape algorithm was used to calculate and analyze the volume values of the deposits under different parameters and the fineness of the constructed 3D body, which is a simple and efficient method with applicability to general LEDs.
The reliability and reproducibility of this scheme were confirmed by the experiments conducted using the soil mound models in the laboratory, where the minimum error of volume determination reached 1.69%. The experiments on the field determination of the volume of sand deposit showed that the average accuracy of the method to extract the volume exceeded 95.29%, which verified the practicality of this scheme in practice. Also, the method can be applied to agriculture, such as for the automatic inventory calculation of grain deposits, the facilitation of scientific storage and transportation management, and the rationalization of production schedules, and other aspects of engineering practices.
The proposed method is not applicable to cases where the morphological characteristics of the LED are large at the top and small at the bottom. At the same time, to further deepen the universality of the proposed method, future study needs to solve the problem of how to determine the bottom boundary and improve its accuracy when the LED is located on uneven and undulating ground.


 ,
, 


