
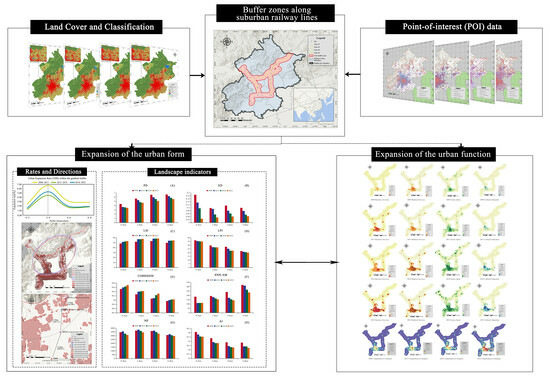
Spatio-Temporal Evolution of Urban Expansion along Suburban Railway Lines in Megacities Based on Multi-Source Data: A Case Study of Beijing, China


Abstract
:
1. Introduction
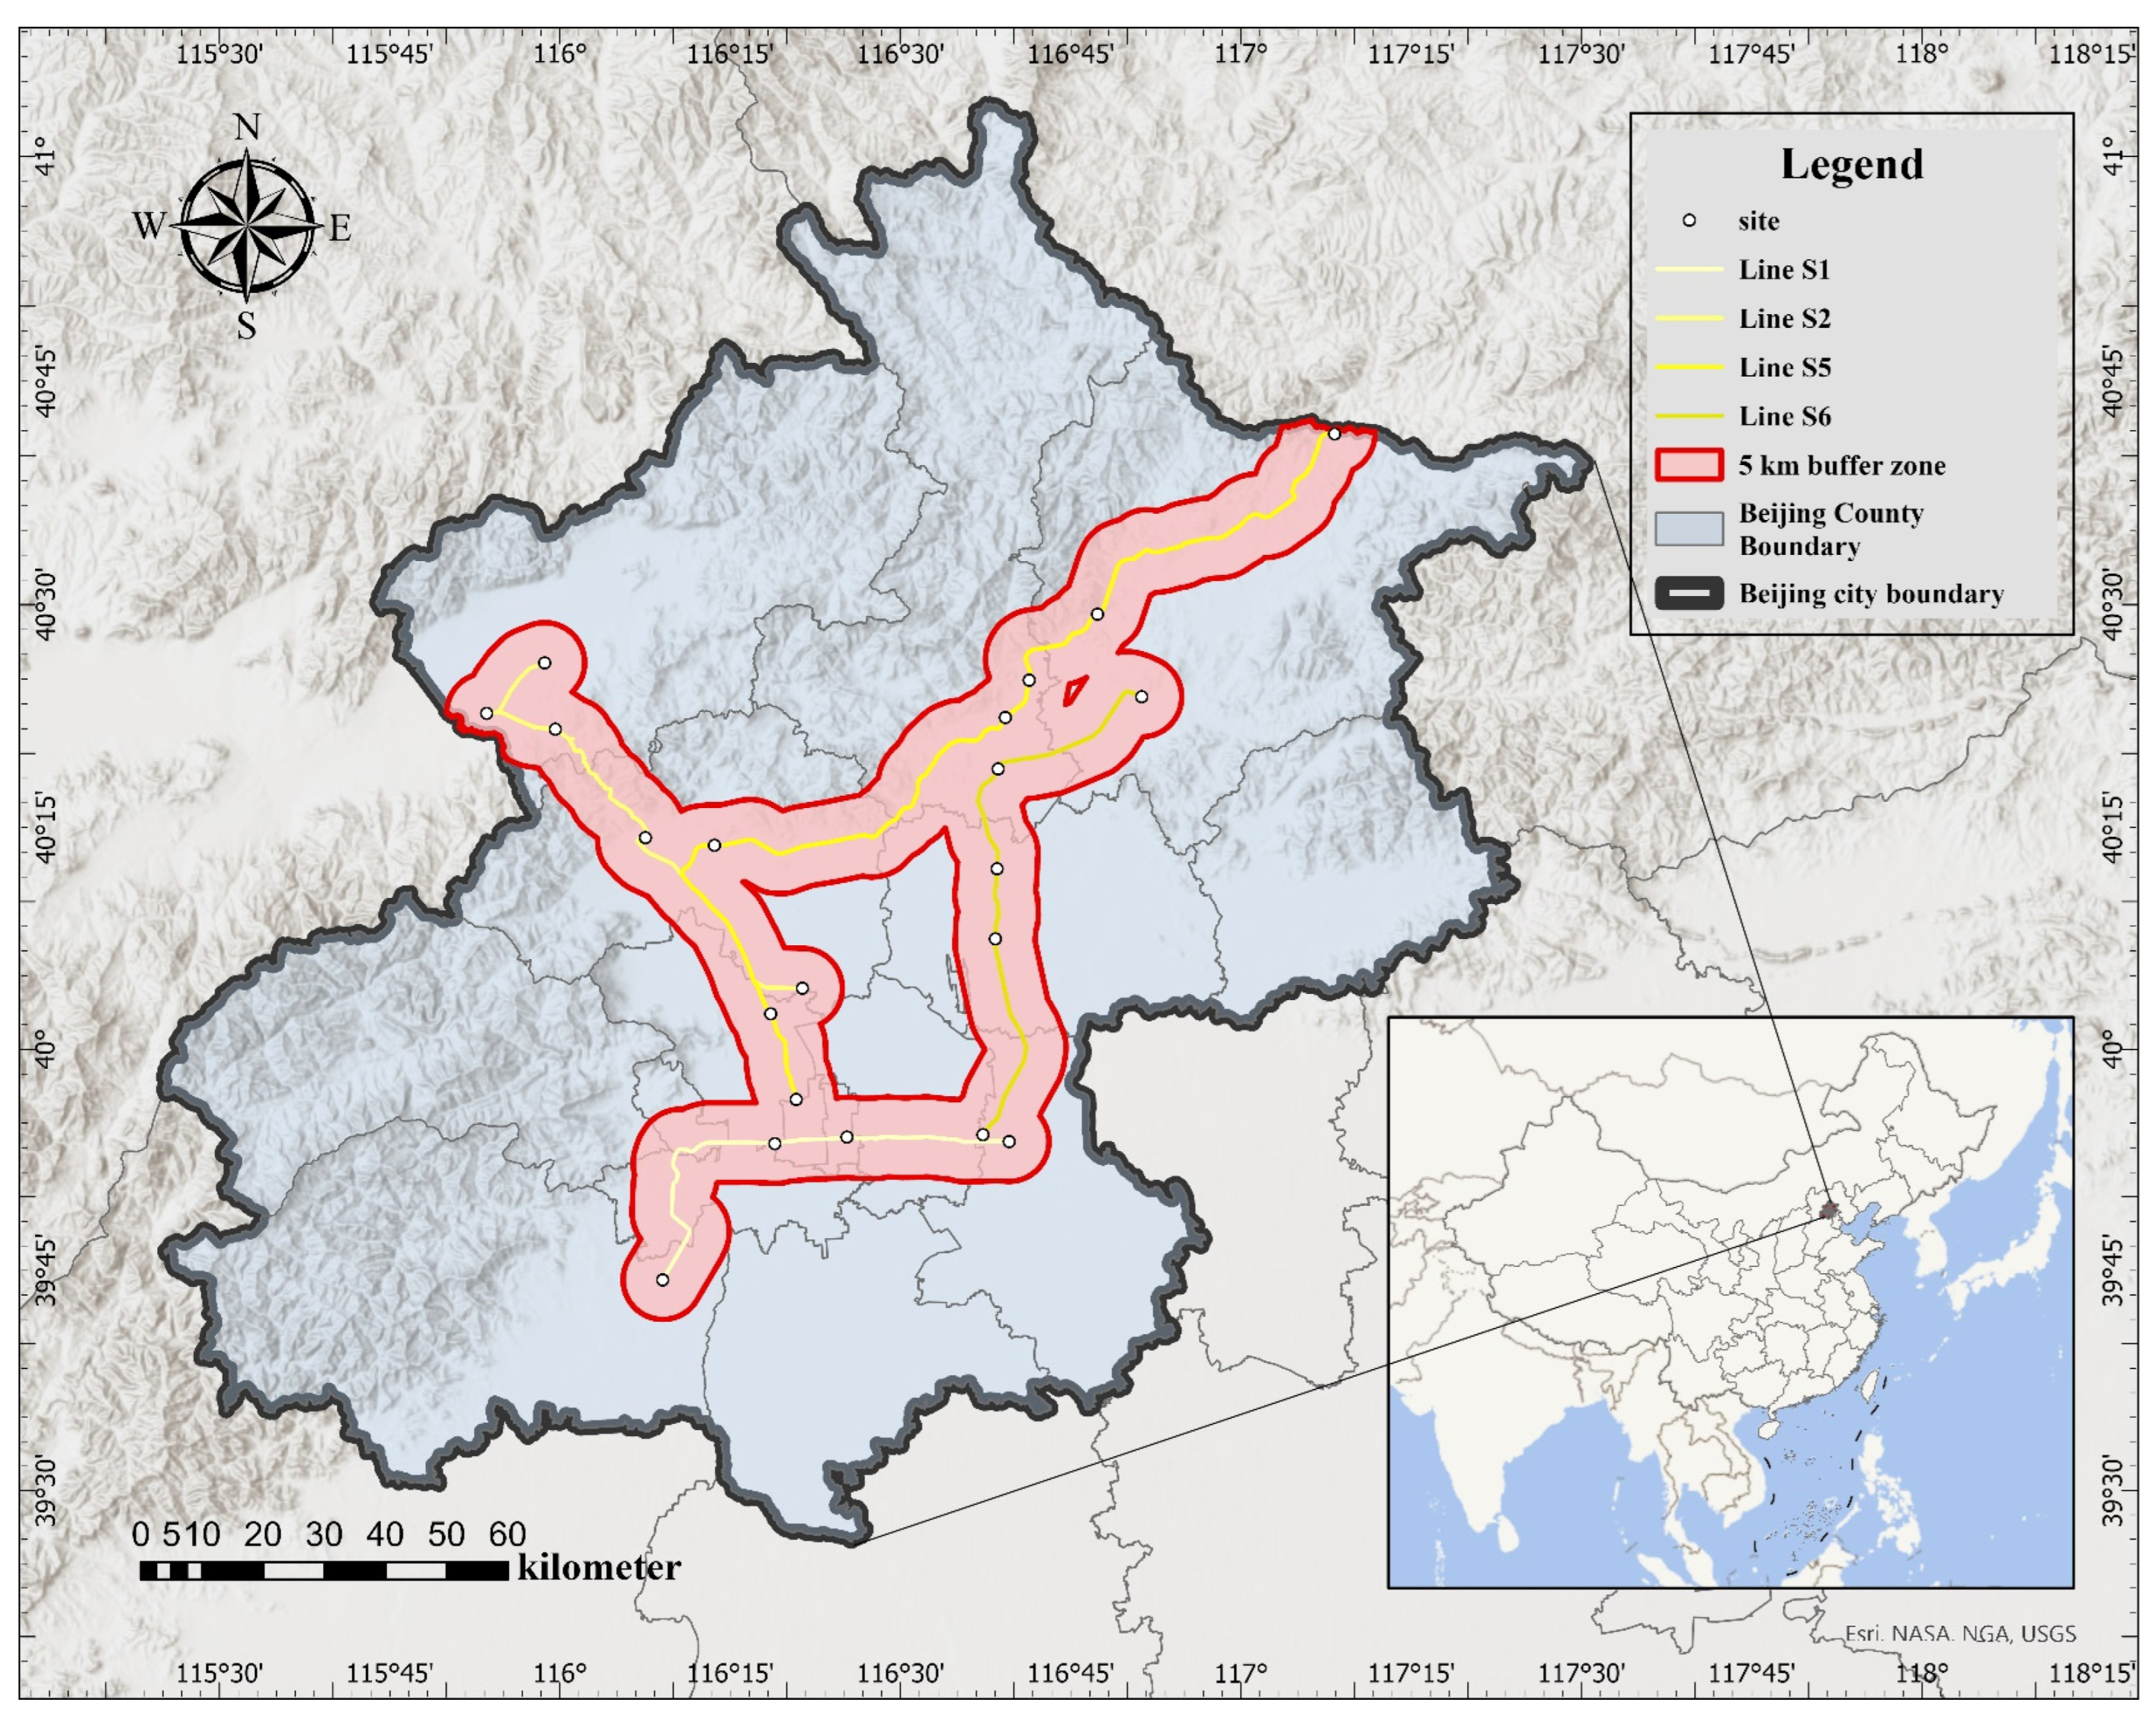
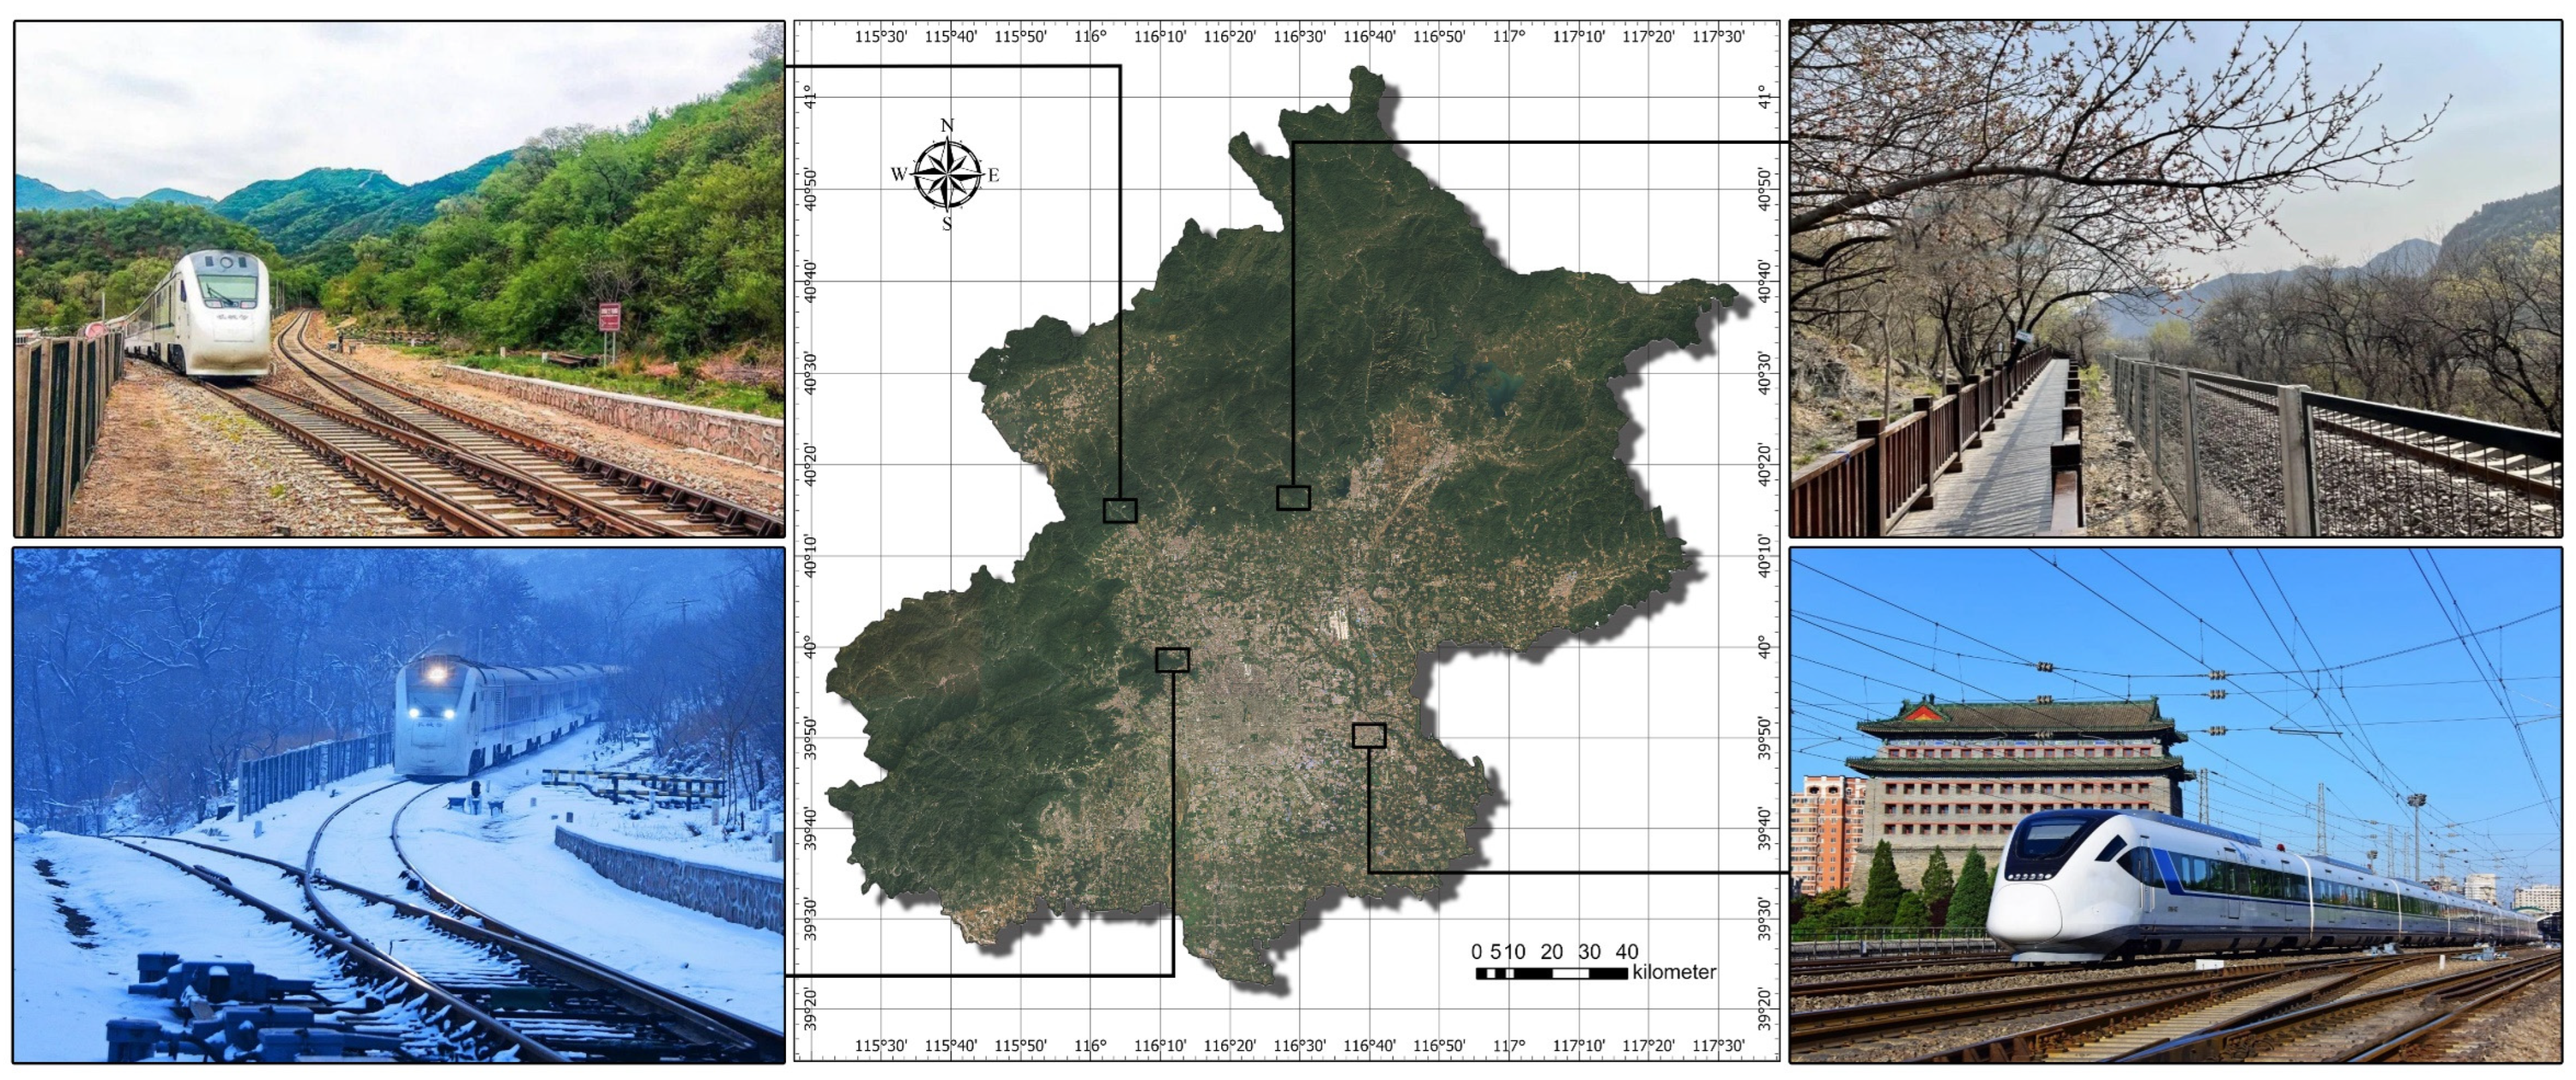
2. Study Area
3. Data and Methodology
3.1. Data
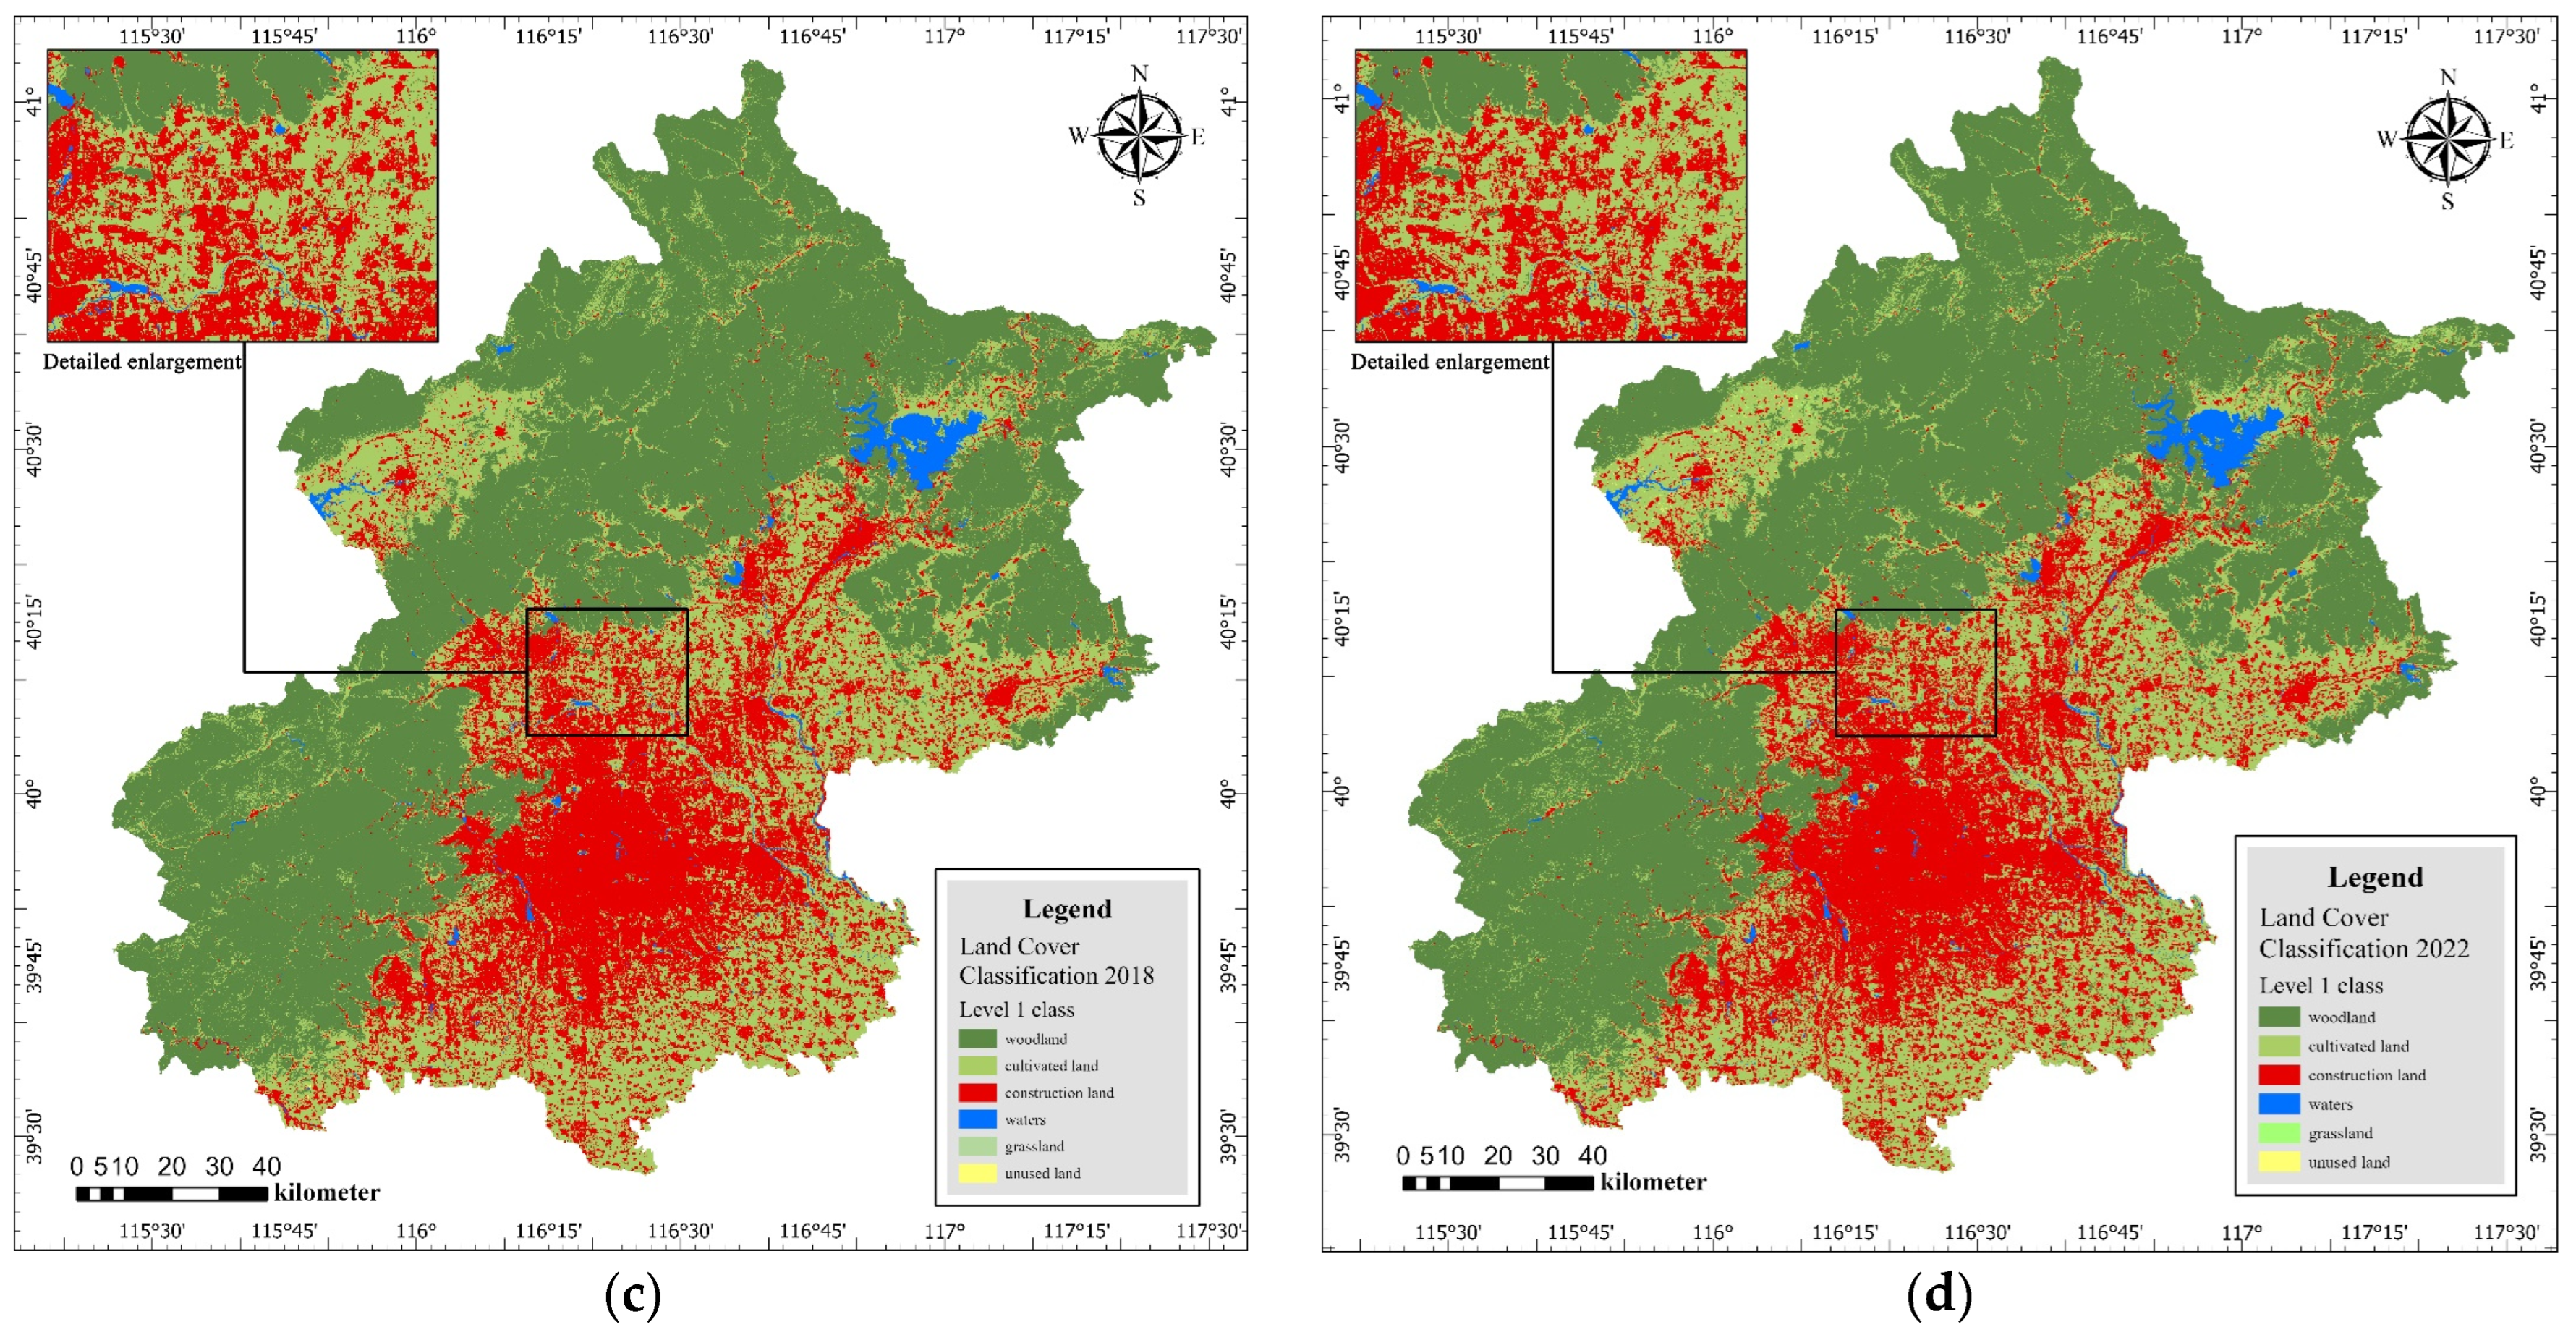
3.1.1. Data on Land Cover and Classification in Beijing
3.1.2. Other Basic Data
3.2. Methods
3.2.1. Division of the Buffer Zone
3.2.2. Analysis of the Spatio-Temporal Patterns of Urban Form Expansion
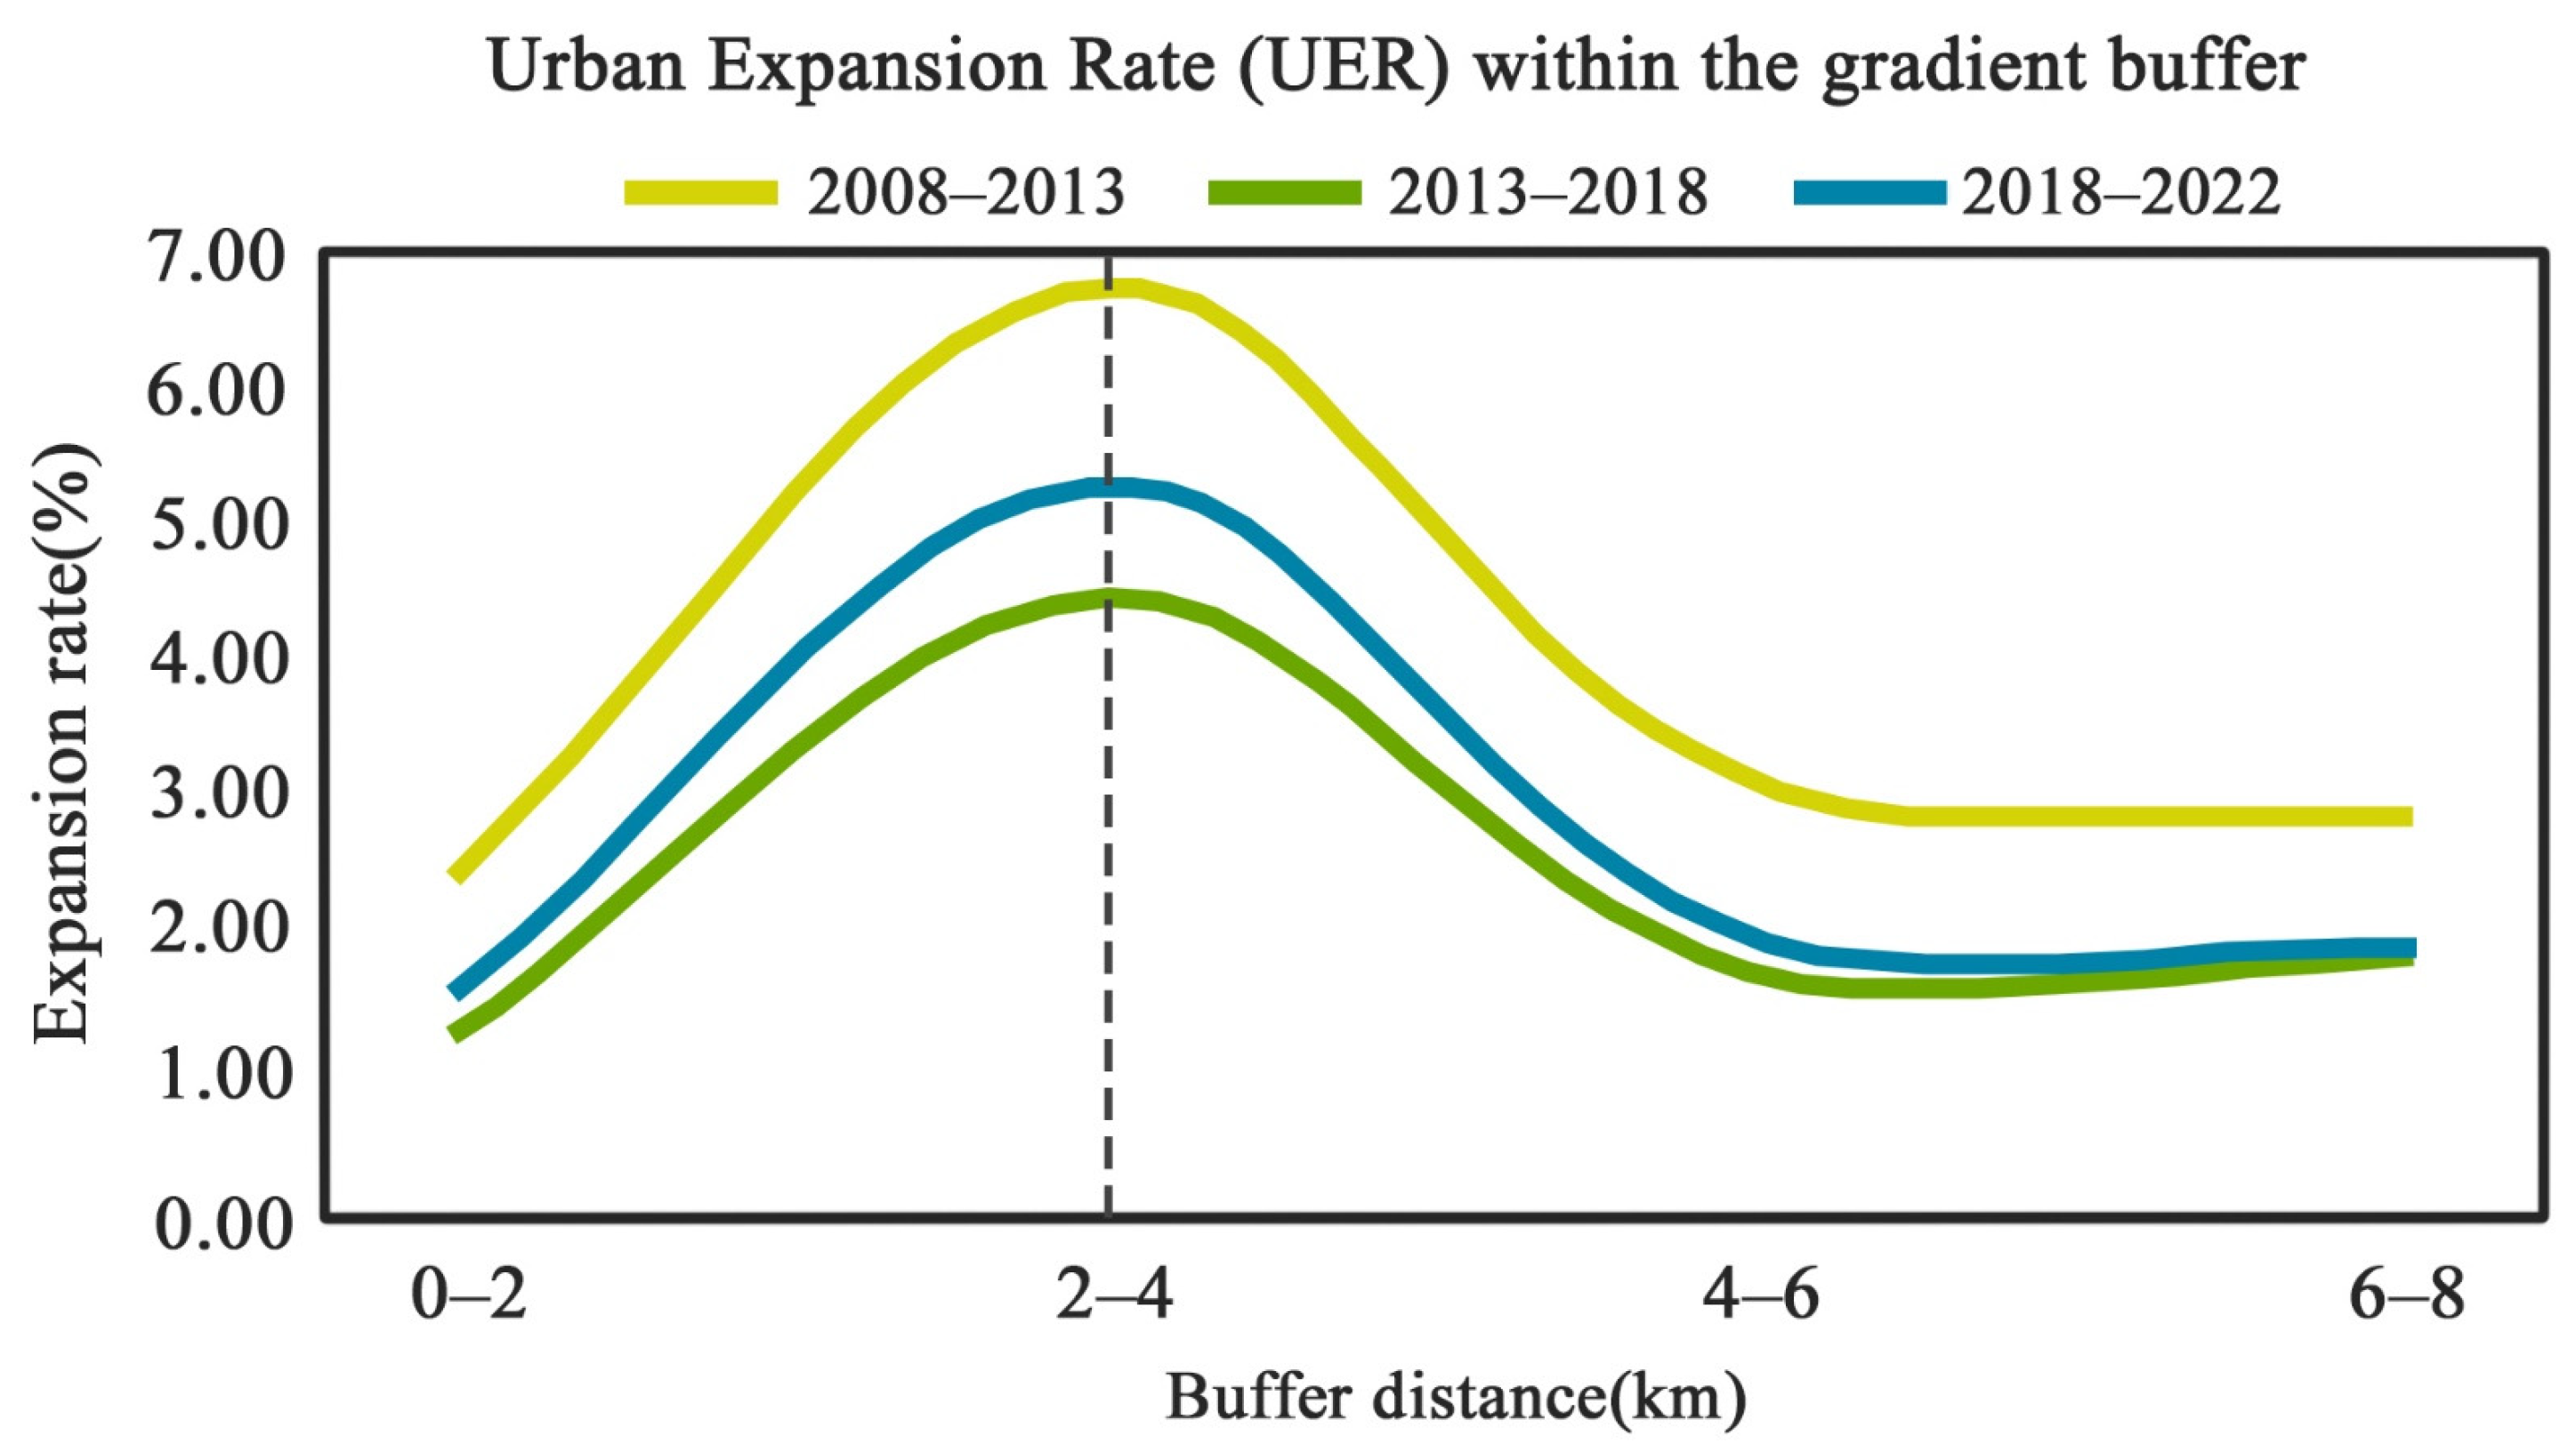
- Urban Expansion Rate (UER)
- Standardized Elliptic Difference
- GIS Center of Gravity Model
- Landscape Metrics
3.2.3. Analysis of Spatio-Temporal Patterns of Urban Functional Expansion
4. Results
4.1. Spatio-Temporal Characteristics of Urban Formation Expansion along the Beijing Suburban Railway
4.1.1. Rate of Urban Expansion in the Buffer Zone
4.1.2. Direction of Urban Expansion within the Buffer Zone
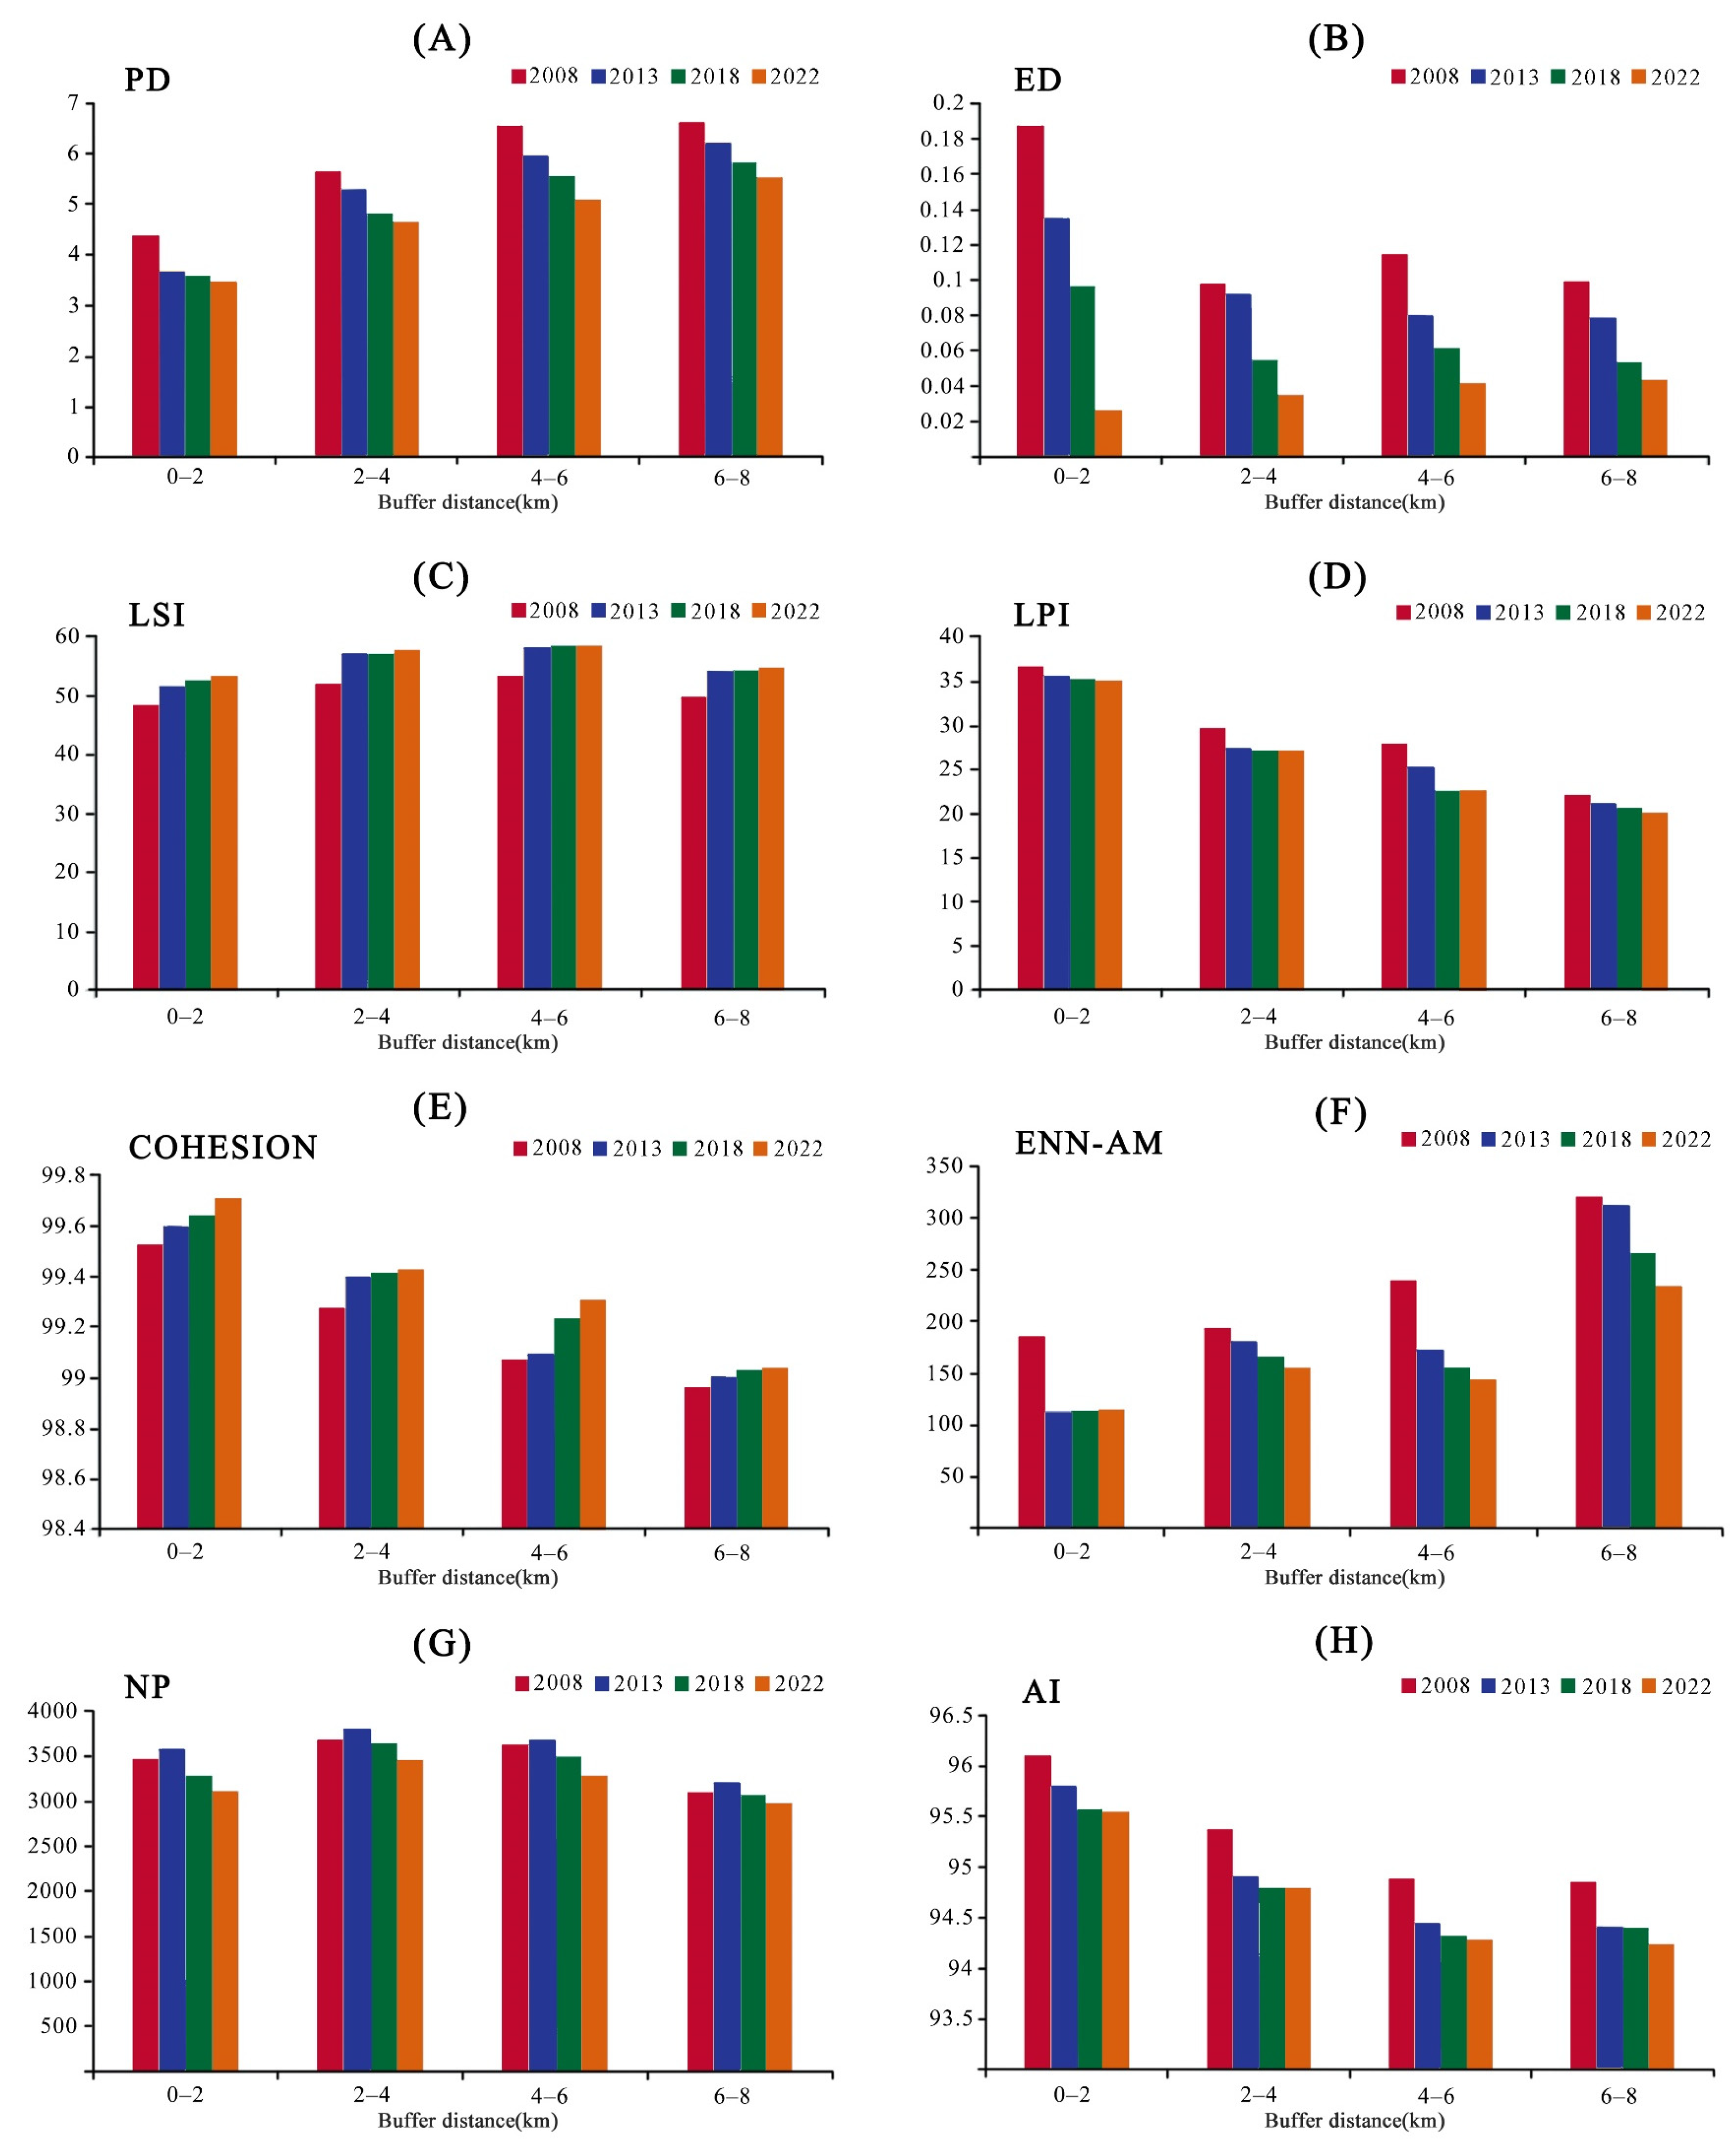
4.1.3. Landscape Gradient Analysis along Beijing Suburban Railway
4.2. Spatio-Temporal Characteristics of Functional Expansion of Cities along Beijing Suburban Railway
4.2.1. Analysis of the Number of Urban Functions in the Buffer Zone in Terms of Percentage
4.2.2. Analysis of the Spatial Distribution of Urban Functions in the Buffer Zone
- (1)
- From the POI total kernel density map within the 8 km buffer zone of Beijing suburban railway in 2008, 2013, 2018, and 2022, the main urban area was centered on the intersection of the Huairou–Miyun Line and the urban sub-center line with a high density of spatial distribution and clear structural hierarchy. The city center radiated east to the West Tongzhou–Miyun Station of the Tongzhou–Miyun Line and north to the Huangtudian Station of the S2 Line. Several other high-density clusters were more randomly located but were also in close proximity to the stations;
- (2)
- Comparing the temporal development of these four urban functions, it can be seen that the numbers of all four urban functions gradually increased from 2008 to 2018. While the number of shopping services was always the highest, the number of medical services increased sharply and suddenly from 2018 to 2022, while the numbers of the other three urban functions decreased to varying degrees;
- (3)
- Comparing the spatial development of these four urban functions, it can be seen that the expansion of the urban function of shopping services was more rapid and the radiation was more obvious, while the function of science and education showed the opposite trend. From the perspective of spatial distribution, the distribution of the three urban functions other than scenic spots was mainly in the main urban areas, with very few clusters distributed near stations and the urban functions of shopping and medical services being the most significant. Densities along the railways were highest in the 2–4 km buffer zone and lowest in the 6–8 km buffer zone.
5. Discussion
5.1. Quantification of Urban Expansion along Suburban Railways
5.2. Urban Expansion along Suburban Railways
5.3. Limitations and Future Research Directions
6. Conclusions
Author Contributions
Funding
Data Availability Statement
Conflicts of Interest
References
- Li, H.; Peng, J.; Liu, W.R.; Huang, Z.W. Stationary Charging Station Design for Sustainable Urban Rail Systems: A Case Study at Zhuzhou Electric Locomotive Co. Sustainability 2015, 7, 465–481. [Google Scholar] [CrossRef]
- Sekar, S.P.; Gangopadhyay, D. Impact of Rail Transit on Land Use and Development: Case Study of Suburban Rail in Chennai. J. Urban Plan. Dev. 2017, 6, 143. [Google Scholar] [CrossRef]
- Dong, H. If You Build Rail Transit in Suburbs, Will Development Come? J. Am. Plan. Assoc. 2016, 82, 316–326. [Google Scholar] [CrossRef]
- Li, S.; Liu, X.; Li, Z.; Wu, Z.; Yan, Z.; Chen, Y.; Gao, F. Spatio-temporal Dynamics of Urban Expansion along the Guangzhou-Foshan Inter-City Railway Transit Corridor, China. Transit Corridor, China. Sustainability 2018, 10, 593. [Google Scholar] [CrossRef]
- Ministry of Housing and Urban-Rural Development of the People’s Republic of China. Statistical Yearbook of Urban and Rural Construction 2021; Ministry of Housing and Urban-Rural Development of the People’s Republic of China: Beijing, China, 2021.
- Bhatta, B.; Saraswati, S.; Bandyopadhyay, D. Urban sprawl measurement from remote sensing data. Appl. Geogr. 2010, 30, 731–740. [Google Scholar] [CrossRef]
- Dai, J.; Gao, X.; Du, S. Expansion of Urban Space and land cover Control in the Process of Urbanization: An Overview. Chin. J. Popul. Resour. Environ. 2010, 8, 73–82. [Google Scholar]
- Buyantuyev, A.; Wu, J.; Gries, C. Multiscale Analysis of the Urbanization Pattern of the Phoenix Metropolitan Landscape of USA: Time, Space and Thematic Resolution. Landsc. Urban Plan. 2015, 94, 206–217. [Google Scholar] [CrossRef]
- Hecht, R.; Behnisch, M.; Herold, H. Innovative Approaches, Tools and Visualization Techniques for Analysing land cover Structures and Dynamics of Cities and Regions (Editorial). J. Geovisualization Spat. Anal. 2020, 4, 19. [Google Scholar] [CrossRef]
- Rusk, D. Cities without Suburbs; Woodrow Wilson Center Press: Washington, DC, USA, 1993. [Google Scholar]
- Taubenbock, M.H.; Wegmann, A.; Roth, H.; Mehl, S. Dech Urbanization in India—Spatiotemporal analysis using remote sensing data. Comput. Environ. Urban Syst. 2009, 33, 179–188. [Google Scholar] [CrossRef]
- Kantakumar, L.N.; Kumar, S.; Schneider, K. Spatiotemporal Urban Expansion in Pune metropolis, India Using Remote Sensing. Habitat Int. 2016, 51, 11–22. [Google Scholar] [CrossRef]
- Frohn, H.; Frohn, R.C.; Hao, Y. Landscape metric performance in analyzing two decades of deforestation in the Amazon Basin of Rondonia, Brazil. Remote Sens. Environ. 2006, 100, 237–251. [Google Scholar] [CrossRef]
- Wang, H.; Zhang, B.; Liu, Y.; Liu, Y.; Xu, S.; Zhao, Y.; Chen, Y.; Hong, S. Urban expansion patterns and their driving forces based on the center of gravity-GTWR model: A case study of the Beijing-Tianjin-Hebei urban agglomeration. J. Geogr. Sci. 2020, 30, 297–318. [Google Scholar] [CrossRef]
- Huang, D.; Chu, E.; Liu, T. Spatial Determinants of Land Conversion for Various Urban Use: A Case Study of Beijing. ISPRS Int. J. Geo-Inf. 2020, 9, 708. [Google Scholar] [CrossRef]
- Mozaffaree Pour, N.; Oja, T. Prediction Power of Logistic Regression (LR) and Multi-Layer Perceptron (MLP) Models in Exploring Driving Forces of Urban Expansion to Be Sustainable in Estonia. Sustainability 2022, 14, 160. [Google Scholar] [CrossRef]
- Chen, X.; Zhang, K. Urban Area Characterization and Structure Analysis: A Combined Data-Driven Approach by Remote Sensing Information and Spatial-Temporal Wireless Data. Remote Sens. 2023, 15, 1041. [Google Scholar] [CrossRef]
- Garcia-Ayllon, S. Rapid development as a factor of imbalance in urban growth of cities in Latin America: A perspective based on territorial indicators. Habitat Int. 2016, 58, 127–142. [Google Scholar] [CrossRef]
- Xu, Q.; Zheng, X.; Zhang, C. Quantitative Analysis of the Determinants Influencing Urban Expansion: A Case Study in Beijing, China. Sustainability 2018, 10, 1630. [Google Scholar] [CrossRef]
- Huang, Q.; Huang, J.; Yang, X.; Ren, L.; Tang, C.; Zhao, L. Evaluating the scale effect of soil erosion using landscape shape metrics and information entropy: A case study in the Danjiangkou reservoir area, China. Sustainability 2017, 9, 1243. [Google Scholar] [CrossRef]
- Fu, Y. Study on the Development of Edge Areas of Megacities under the Influence of Rail Transit Suburban Lines; Tianjin University: Tianjin, China, 2020. [Google Scholar]
- The Relevant Responsible Comrade of the State Railway Administration Answered Reporters’ Questions on the Release of the Design Code for Municipal (Suburban) Railway. Official Website of State Railway Administration of China, 28 December 2020. Available online: https://www.nra.gov.cn/ (accessed on 11 December 2022).
- National Bureau of Statistics of China. Statistical Tables and Charts on Economic and Social Development, National Bureau of Statistics of China: Basic Information on the Population of Very Large and Mega Cities in the Seventh National Census; National Bureau of Statistics of China: Beijing, China, 2020.
- Ji, C. A Study on Countermeasures for Conflicts of Environmental Neighboring Facilities in Mega Cities; East China University of Politics and Law: Shanghai, China, 2020. [Google Scholar]
- Yu, S.; Zhang, Z.; Liu, F.; Wang, X.; Hu, S. Urban expansion in the megacity since 1970s: A case study in Mumbai. Geocarto Int. 2019, 36, 603–621. [Google Scholar] [CrossRef]
- Cai, E.; Bi, Q.; Lu, J.; Hou, H. The Spatiotemporal Characteristics and Rationality of Emerging Megacity Urban Expansion: A Case Study of Zhengzhou in Central China. Environ. Inform. Remote Sens. 2022, 10, 860814. [Google Scholar] [CrossRef]
- Chen, C.; Richard, L.; Fang, C. From coordinated to integrated urban and rural development in China’s megacity regions. J. Urban Aff. 2018, 41, 150–169. [Google Scholar] [CrossRef]
- Aritenang, A.F. The contribution of foreign investment and industrial concentration to firm competitiveness in Jakarta Megacity. Cities 2021, 113, 103152. [Google Scholar] [CrossRef]
- Hu, X.; Yang, H.; Yang, J.; Zhang, Z. Spatial Correlation Network of Format in the Central Districts of a Megacity: The Case of Shanghai. Sustainability 2019, 11, 5191. [Google Scholar] [CrossRef]
- Wang, K.-L.; Xu, R.-Y.; Cheng, Y.-H. Understanding the overall difference, distribution dynamics and convergence trends of green innovation efficiency in China’s eight urban agglomerations. Ecol. Indic. 2023, 148, 110101. [Google Scholar] [CrossRef]
- Zha, Q.; Liu, Z.; Song, Z. A study on dynamic evolution, regional differences and convergence of high-quality economic development in urban agglomerations: A case study of three major urban agglomerations in the Yangtze river economic belt. Front. Environ. Sci. 2022, 10, 1012304. [Google Scholar] [CrossRef]
- Zhao, J. Construction of high-speed passenger railways will cause serious damage to China’s economy. Explor. Railw. Econ. Issues 2009, 157–166. [Google Scholar]
- Zhang, Y. Evaluation and Optimization Method of Part-Time Suburban Railway under the Perspective of Commuting Circle; Beijing Jiaotong University: Beijing, China, 2022. [Google Scholar]
- Aoki, Y.; Osaragi, T.; Ishizaka, K. An interpolating model for land-price data with transportation costs and urban activities Environment and Planning B. Plan. Des. 1994, 21, 53–65. [Google Scholar]
- Batista, R.M.G. O aproveitamento de antigas infraestruturas ferroviárias em meio urbano: As ecopistas como exemplo. Master’s Thesis, University of Porto, Porto, Portugal, 2015. [Google Scholar]
- Sultana, S.; Weber, J. The Nature of Urban Growth and the Commuting Transition: Endless Sprawl or a Growth Wave? Urban Stud. 2014, 51, 544–576. [Google Scholar] [CrossRef]
- Chiara, M.; Travisi Roberto, C.; Peter, N. Impacts of urban sprawl and commuting: A modelling study for Italy. J. Transp. Geogr. 2010, 18, 382–392. [Google Scholar]
- Dubé, J.; Thériault, M.; Rosiers, F.D. Commuter rail accessibility and house values: The case of the Montreal South Shore, Canada, 1992–2009. Transp. Res. Part A 2013, 54, 49–66. [Google Scholar] [CrossRef]
- Xia, X.; Li, H.; Kuang, X.; Strauss, J. Spatial-Temporal Features of Coordination Relationship between Regional Spatial-Temporal Features of Coordination Relationship between Regional Urbanization and Rail Transit-A Case Study of Beijing. J. Environ. Res. Public Health 2022, 19, 212. [Google Scholar] [CrossRef] [PubMed]
- Rode, P.; Floater, G.; Thomopoulos, N.; Docherty, J.; Schwinger, P.; Mahendra, A.; Fang, W. Accessibility in Cities: Transport and Urban Form. In Disrupting Mobility: Impacts of Sharing Economy and Innovative Transportation on Cities; Meyer, G., Shaheen, S., Eds.; Lecture Notes in Mobility; Springer International Publishing: Cham, Switzerland, 2017; pp. 239–273. [Google Scholar]
- Chiang, C.M. History, characteristics and experience of rail transit development in Tokyo metropolitan area. Compr. Transp. 2021, 43, 119–125. [Google Scholar]
- Beijing Municipal Bureau of Statistics. Beijing Statistical Yearbook 2020; Beijing Municipal Bureau of Statistics: Beijing, China, 2020.
- Reply of the State Council of the Central Committee of the Communist Party of China to the Approval of the Beijing Urban Master Plan (2016–2035). Official Website of the Central People’s Government of the People’s Republic of China. 27 September 2017. Available online: http://www.beijing.gov.cn/ (accessed on 11 December 2022).
- Wang, D. Reflections on the Construction of Beijing Suburban Railway. J. Beijing City Coll. 2021, 166, 6–10+26. [Google Scholar]
- Yue, L. A Study on Job-Life Relationship and Commuting Performance in Megacities; East China Normal University: Shanghai, China, 2023; p. 22. [Google Scholar]
- Chai, Y.; Zhang, X.; Sun, D. A study on urban living area planning based on spatio-temporal behaviors—Taking Beijing as an example. J. Urban Plan. 2015, 3, 61–69. [Google Scholar]
- Zhang, Q. Spatial coupling of station influence domain and community living circle—Taking the example of Chongqing, a mountainous urban environment as an example. J. Chongqing Univ. Technol. (Nat. Sci.) 2020, 34, 202–210. [Google Scholar]
- Xiong, W.; Xu, Y. Study on Urban Habitat Environment Based on the Perspective of Public Facilities—Taking Nanjing as an Example. Mod. Urban Res. 2010, 25, 35–42. [Google Scholar]
- Zhang, Y. Traffic Factors and Optimization Strategies of 15-Minute Living Circle Travel Influence—An Empirical Analysis of Six Typical 15-Minute Living Circles in Wuhan City. China Society of Urban Planning, Chongqing Municipal People’s Government. Vibrant Urban and Rural Areas and Beautiful Habitat. In Proceedings of the 2019 China Urban Planning Annual Conference (20 Housing and Community Planning), Chongqing, China, 19–21 October 2019; China Architecture Industry Press: Beijing, China, 2019; pp. 803–816. [Google Scholar]
- Dai, F.; Diao, M.; Sing, T. A two-dimensional propensity score matching approach to estimating the treatment effect of urban rail transit lines on vehicle travel. Transportation 2022. [Google Scholar] [CrossRef]
- Liu, Q. Influential elements of TOD area planning circle structure division. Int. Urban Plan. 2017, 32, 72–79. [Google Scholar] [CrossRef]
- Zhan, Z.; Li, L.; Wu, H. Experience and inspiration of pedestrian space planning in TOD areas of Korean rail stations. Planner 2022, 38, 38–146. [Google Scholar]
- Cao, X. Review and outlook of research on community built environment and traffic behavior: A lesson from the United States. Int. Urban Plan. 2015, 30, 46–52. [Google Scholar]
- Ta, N.; Zeng, Y.; Zhu, Q.; Wu, J. Analysis of the relationship between built environment and urban vitality in central Shanghai based on big data. Geoscience 2020, 40, 60–68. [Google Scholar]
- Ren, J. Research on the Impact of Job and Residence Separation on the Travel of Shared Bicycle Users; Beijing Jiaotong University: Beijing, China, 2022. [Google Scholar]
- Cao, Y.; Zhang, X.; Li, F.; Shu, K. Analysis of the coupling relationship between land cover and bike sharing around rail transit stations—Taking Xi’an as an example. China Transp. Rev. 2022, 44, 163–170. [Google Scholar]
- Cao, Y. A Study on the Accessibility Analysis of Rail Transit Stations and the Layout of Interchange Facilities Considering the Connection of Shared Bicycles; Southeast University: Nanjing, China, 2020. [Google Scholar]
- Zhou, Q.; Chen, D.; Chen, Q. A study on land cover center of gravity migration in the mountainous metropolitan area of Chongqing from 1985 to 2010. Res. Soil Water Conserv. 2013, 20, 189–193. [Google Scholar]
- Yang, Y.; Liu, Y.; Li, Y.; Du, G. Quantifying spatio-temporal patterns of urban expansion in Beijing during 1985–2013 with rural-urban development transformation. Land Use Policy 2018, 74, 220–230. [Google Scholar] [CrossRef]
- Chen, Y.M.; Li, X.; Liu, X.P.; Ai, B. Modeling urban land-use dynamics in a fast developing city using the modified logistic cellular automaton with a patch-based simulation strategy. Int. J. Geogr. Inf. Sci. 2014, 28, 234–255. [Google Scholar] [CrossRef]
- Tong, L. A Study on Generalized Urban Expansion Metric and Its Application; China University of Geosciences: Wuhan, China, 2018. [Google Scholar]
- Xu, X.L.; Min, X.B. Quantifying spatiotemporal patterns of urban expansion in China using remote sensing data. Cities 2013, 25, 104–113. [Google Scholar] [CrossRef]
- Tu, Y.; Chen, B.; Yu, L. How does urban expansion interact with cropland loss? A comparison of 14 Chinese cities from 1980 to 2015. Landsc. Ecol. 2021, 36, 243–263. [Google Scholar] [CrossRef]
- Liu, L.; Xiang, Y. Spatio-temporal analysis of commercial space pattern and industry distribution in urban Nanjing based on POI data. Nat. Resour. Informatiz. 2023, 2, 71–77. [Google Scholar]
- Zhou, N. Research on urban spatial structure based on the dual constraints of geographic environment and POI big data. J. King Saud Univ. Sci. 2022, 34, 101887. [Google Scholar] [CrossRef]
- Dietzel, C.; Herold, M.; Hemphill, J.J.; Clark, K.C. Spatio-temporal dynamics in California’s Central Valley: Empirical links to urban theory. Int. J. Geogr. Inf. Sci. 2005, 19, 175–195. [Google Scholar] [CrossRef]
- Araya, Y.H.; Cabral, P. Analysis and modeling of urban land cover change in Setúbal and Sesimbra, Portugal. Remote Sens. 2010, 2, 1549–1563. [Google Scholar] [CrossRef]
- Nassar, A.K.; Blackburn, G.A.; Whyatt, D. Developing the desert: The pace and process of urban growth in Dubai. Comput. Environ. Urban Syst. 2014, 45, 50–62. [Google Scholar] [CrossRef]
- Taubenböck, H.; Wiesner, M.; Felbier, A.; Marconcini, M.; Esch, T.; Dech, S. New dimensions of urban landscapes: The spatio-temporal evolution from a poly nuclei area to a mega-region based on remote sensing data. Appl. Geogr. 2014, 47, 137–153. [Google Scholar] [CrossRef]
- Luck, M.; Wu, J. A gradient analysis of urban landscape shape: A case study from the Phoenix metropolitan region, Arizona, USA. Landsc. Ecol. 2002, 17, 327–339. [Google Scholar] [CrossRef]
- Zhu, M.; Xu, J.G.; Jiang, N.; Li, J.L.; Fan, Y. Impacts of road corridors on urban landscape shape: A gradient analysis with changing grain size in Shanghai, China. Landsc. Ecol. 2006, 21, 723–734. [Google Scholar] [CrossRef]
- Tan, K.C.; Lim, H.S.; MatJafri, M.Z.; Abdullah, K. Landsat Data to Evaluate Urban Expansion and Determine land cover/land Cover Changes in Penang Island, Malaysia. Environ. Earth Sci. 2010, 60, 1509–1521. [Google Scholar] [CrossRef]
- Wang, X.; Shi, R.; Zhou, Y. Dynamics of urban sprawl and sustainable development in China. Socio-Econ. Plan. Sci. 2020, 70, 100736. [Google Scholar] [CrossRef]
- Shi, Y.; Zhou, L.; Guo, X.; Li, J. The Multidimensional Measurement Method of Urban Sprawl and Its Empirical Analysis in Shanghai Metropolitan Area. Sustainability 2023, 15, 1020. [Google Scholar] [CrossRef]
- Zhao, P. Sustainable urban expansion and transportation in a growing megacity: Consequences of urban sprawl for mobility on the urban fringe of Beijing. Habitat Int. 2010, 34, 236–243. [Google Scholar] [CrossRef]
- Liu, Y. Utilization of Existing Railways in the Development of Rail Transportation in Large Cities; Beijing Jiaotong University: Beijing, China, 2015. [Google Scholar]
- Pradhan, B. Spatial Modeling and Assessment of Urban Form: Analysis of Urban Growth: From Sprawl to Compact Using Geospatial Data; Springer International Publishing: New York, NY, USA, 2017. [Google Scholar]
- Frenkel, A.; Ashkenazi, M. Measuring Urban Sprawl: How Can We Deal with It? Environ. Plan. B Plan. Des. 2008, 35, 56–79. [Google Scholar] [CrossRef]
- Vwlvavn, T.P.; Meyer, C.G. The COVID-19 epidemic. Trop. Med. Int. Health 2020, 25, 278–280. [Google Scholar]
- Zheng, R. Spatial transmission of COVID-19 via public and private transportation in China. Travel Med. Infect. Dis. 2020, 34, 101626. [Google Scholar] [CrossRef] [PubMed]
- Deng, S. A Study on Public Service Provision of Compulsory Education in Y County under the Background of “Double Reduction” Policy; Jilin University of Finance and Economics: Changchun, China, 2022. [Google Scholar]
- Liang, S. A study on the Enhancement Strategy of Rural Road Spatial Planning in Xi’an under Ecological Orientation; Chang’an University: Xi’an, China, 2019. [Google Scholar]
- Tang, W.; Cui, Q.; Zhang, F.; Yan, H. Evaluation of the land value-added benefit brought by urban rail transit: The case in Changsha, China. J. Transp. Land Cover 2021, 14, 563–582. [Google Scholar] [CrossRef]
- Liu, J.; Feng, A.; Wang, J.; He, P.; Deng, J. Development strategy of suburban rail transit in Beijing. Urban Transp. China 2014, 12, 28–36. [Google Scholar]
- Wang, S.Y.; Liu, Y.; Chen, Z.D. Representing multiple urban places’ footprints from Dianping.com data. Acta Geod. Cartogr. Sin. 2018, 47, 1105–1113. [Google Scholar]
- Vasenev, I.; Dovletyarova, E.; Chen, Z.; Valentini, R. Megacities 2050: Environmental consequences of urbanization. In Proceedings of the Conference on Landscape Architecture to Support City Sustainable Development, Moscow, Russia, 12–14 September 2016; RUDN-People’s Friendship University of Russia: Moscow, Russia; pp. 12–24. [Google Scholar]
- Kraas, F. Megacities and global change: Key priorities. Geogr. J. 2007, 173, 79–82. [Google Scholar] [CrossRef]


| Type of Data | Year | Spatial Resolution | Data Sources | Remote Sensing Satellite | Format | Data Description |
|---|---|---|---|---|---|---|
| Remote sensing image data | 2008 | 15 m | NASA (https://www.nasa.gov, accessed on 20 December 2022) | Landsat-7 | Grid | Obtaining Beijing land use data for calculating urban form expansion |
| 2013 | 10 m | Landsat-8 | Grid | |||
| 2018 | 10 m | ESA (https://scihub.copernicus.eu, accessed on 7 January 2023) | Sentinel-2 | Grid | ||
| 2022 | 10 m | Sentinel-2 | Grid | |||
| Beijing Municipal Vector Boundary Data | 2020 | 30 m | National Center for Basic Geographic Information (https://www.webmap.cn, accessed on 11 December 2022) | Vector | Including delineation of administrative areas and cropping of remotely sensed data | |
| POI Classification | Data Specificities | Data Sources |
|---|---|---|
| Medical services | Emergency Centers | A map (https://lbs.amap.com, accessed on 6 March 2023) |
| Disease Prevention Agencies | ||
| Healthcare Service Sites | ||
| Pharmacies | ||
| Medical Clinics | ||
| Specialized Hospitals | ||
| General Hospitals | ||
| Science and education | Museums | |
| Science and Technology Museums | ||
| Art Museums | ||
| Libraries | ||
| Exhibition Halls | ||
| Schools | ||
| Training Organizations | ||
| Scenic spots | Parks | |
| Zoos | ||
| Botanical Gardens | ||
| Memorials | ||
| City Squares | ||
| Temples and Churches | ||
| Provincial Tourist Attractions | ||
| Shopping services | Convenience Stores | |
| Comprehensive Markets | ||
| Specialty Stores | ||
| Shopping Malls | ||
| Home Appliance and electronics Stores | ||
| Home Building Materials Markets | ||
| Specialty Shopping Streets |
| Land Cover Type | Year | Longitude of Center of Gravity (°) | Latitude of Center of Gravity (°) | Long Axis (km) | Short Axis (km) | Area (km²) | Azimuthal Angle |
|---|---|---|---|---|---|---|---|
| Built-up land | 2008 | 116.4683785° | 40.2179009° | 54.097 | 37.296 | 6338.313251 | 50.546086 |
| 2013 | 116.4729132° | 40.2283607° | 54.825 | 37.228 | 6411.968484 | 51.166139 | |
| 2018 | 116.4734047° | 40.2372073° | 54.944 | 37.658 | 6500.087356 | 52.967368 | |
| 2022 | 116.4756533° | 40.2417699° | 54.971 | 37.636 | 6564.198011 | 53.791791 |
| Land Cover Type | Year | Clockwise and Eastward Angle | Offset Distance (km) | Offset Speed (m/year) |
|---|---|---|---|---|
| Built-up land | 2008–2013 | 108.43° | 1.61 | 322 |
| 2013–2018 | 92.54° | 1.29 | 258 | |
| 2018–2022 | 110.44° | 0.71 | 178 |
Disclaimer/Publisher’s Note: The statements, opinions and data contained in all publications are solely those of the individual author(s) and contributor(s) and not of MDPI and/or the editor(s). MDPI and/or the editor(s) disclaim responsibility for any injury to people or property resulting from any ideas, methods, instructions or products referred to in the content. |
© 2023 by the authors. Licensee MDPI, Basel, Switzerland. This article is an open access article distributed under the terms and conditions of the Creative Commons Attribution (CC BY) license (https://creativecommons.org/licenses/by/4.0/).
Share and Cite
Tang, H.; Yan, X.; Liu, T.; Zheng, J. Spatio-Temporal Evolution of Urban Expansion along Suburban Railway Lines in Megacities Based on Multi-Source Data: A Case Study of Beijing, China. Remote Sens. 2023, 15, 4684. https://doi.org/10.3390/rs15194684
Tang H, Yan X, Liu T, Zheng J. Spatio-Temporal Evolution of Urban Expansion along Suburban Railway Lines in Megacities Based on Multi-Source Data: A Case Study of Beijing, China. Remote Sensing. 2023; 15(19):4684. https://doi.org/10.3390/rs15194684
Chicago/Turabian StyleTang, Hongya, Xin Yan, Tianshu Liu, and Jie Zheng. 2023. "Spatio-Temporal Evolution of Urban Expansion along Suburban Railway Lines in Megacities Based on Multi-Source Data: A Case Study of Beijing, China" Remote Sensing 15, no. 19: 4684. https://doi.org/10.3390/rs15194684