Article

Assessing the Potential Impacts of Climate Change on Current Coastal Ecosystems—A Canadian Case Study

1
Canadian Centre for Climate Change and Adaptation, University of Prince Edward Island, St. Peter’s Bay, PE C0A 2A0, Canada
2
School of Climate Change and Adaptation, University of Prince Edward Island, Charlottetown, PE C1A 4P3, Canada
*
Author to whom correspondence should be addressed.
Remote Sens. 2023, 15(19), 4742; https://doi.org/10.3390/rs15194742
Submission received: 20 July 2023 / Revised: 9 September 2023 / Accepted: 25 September 2023 / Published: 28 September 2023
(This article belongs to the Special Issue Remote Sensing for Climate Change II)

Abstract

:
Understanding how climate change affects coastal ecosystems is one of the most important elements in determining vulnerability and resilience for long-term ecosystem management in the face of the increasing risk of coastal hazards (e.g., sea level rise, coastal flooding, and storm surge). This research attempts to undertake a study on the ecosystem–climate nexus in the Canadian province of Prince Edward Island (PEI). Cloud-based remote sensing techniques with Google Earth Engine (GGE) are utilized to identify ecosystem changes over time. In addition, the effects of coastal flooding and storm surge ecosystems under different climate scenarios are examined. The results suggest a reduction in the forest (3%), open water or marsh component (9%), salt water (5%), no open water or marsh component (3%), and salt or brackish marsh (17%) ecosystems from 2013 to 2022. Dune and beach exhibit a non-uniform distribution across the period because of variations in natural processes, with an upward trend ranging from 0% to 11%. Approximately 257 km2 (9.4%) of PEI’s ecosystems would be affected by extreme coastal flooding (scenario 4), compared to 142 km2 (5.2%), 155 km2 (5.7%), and 191 km2 (7%) in scenarios 1, 2, and 3, respectively. Under a 4 m storm surge scenario, around 223 km2 (8.2%) of PEI’s ecosystems would be flooded, compared to 61 km2 (2.2%), 113 km2 (4.1%), and 168 km2 (6.1%) under 1 m, 2 m, and 3 m scenarios, respectively. The findings from this research would enable policymakers to take necessary actions to sustain ecosystem services in PEI while confronting the impacts of climate change.

Graphical Abstract

1. Introduction

The impacts of climate change on natural ecosystems are well evident worldwide [1,2]. Climate-change-induced temperature and precipitation variability, together with other associated changes such as increased flooding, cyclones, sea level rise, ocean acidification, and atmospheric carbon dioxide concentrations, can pose significant threats to ecosystem services and the biodiversity that depends on those services [3,4,5]. Many coastal ecosystems, such as mangroves and salt marshes, have suffered severe damage due to storm surges and cyclones [6,7,8], including reduced tree covering [9], altered marshland bathymetry [10], and affected water quality [11]. Physical and hydrological changes in coastal environments, moreover, have significant effects on food availability, nesting sites, and biological niches for endangered species [12]. Their impacts could further escalate plant and animal extinctions through habitat loss and intensifying disease rates and threaten many species around the globe [13]. A recent study found significant changes in vegetation activity in terrestrial ecosystems due to long-term temperature and precipitation variability [14]. Large-scale changes in land use or ecosystems, like changes in forest cover, on the other hand, may have an impact on local and regional climate and the hydrological cycle [15]. In addition, large-scale climate mitigation and adaptation initiatives, such as REDD+ programs, coastal afforestation, and large renewable energy power plants, will also have the potential to alter land use in climate-vulnerable regions and impact ecosystems as a whole [16]. Therefore, a clear understanding of the climate change–land use–ecosystems-biodiversity nexus is essential for implementing appropriate and balanced adaptation and mitigation strategies for the sustainable development of our community and ecosystem.
While positive changes toward ecosystem restoration or creation through climate adaptation and mitigation measures would be welcomed in the face of continued ecosystem degradation globally, there are still limitations in detecting climate-vulnerable ecosystems due to inadequate research and methodological constraints, particularly in coastal areas where multiple climatic and hydrological stressors interact with complex ecological systems [17,18]. Although many international governments and organizations have declared a climate emergency in recent years, there is still a rareness of concrete climate action due to a lack of understanding of the effects of future climatic changes on coastal ecosystems and how to mitigate and adapt to those changes in the long term [19]. This is why understanding how climate change affects ecosystems has always been critical for identifying hotspots of vulnerability and resilience for the sustainable management of ecosystems.
There are several approaches for assessing the impact of climate change on the overall extent of ecosystems. Environmental systems models are often used for comprehending the dynamics and underlying mechanisms of diverse environmental issues, including air pollution, water pollution, floods, droughts, and climate change [20,21]. However, selecting the appropriate scale of analysis is a critical challenge, especially when dealing with ecosystems that operate in large extents [22]. Among other techniques, remote sensing is a geospatial technology widely used to quantify and map ecosystem properties and functions and infer ecosystem processes through a combination of current equipment and data [23,24]. The most significant advantage of remote sensing is its ability to provide synoptic, spatially continuous, and frequent observations at various spatial resolutions that can be easily aggregated at intermediate scales [25,26].
As high-performance computers have grown more accessible, machine learning (ML) has been exploited in a variety of fields, from meteorology and ecology to forestry and other forms of complicated modeling. ML can be used to classify remotely sensed images efficiently and precisely because its capabilities include the ability to handle high-dimensional data and map classes with very complicated characteristics [27]. The application of ML in environmental studies has been explored widely in the past, including in studies of land use and land cover change [28,29], climate change [30,31,32], and drone-based applications for change detection [33,34]. Various ML algorithms that are popularly used to deal with complex problems in ecosystem research include the random forest (RF) algorithm, the support vector machine (SVM) algorithm, artificial neural networks (ANNs), decision trees (DTs), the K-nearest neighbors (KNN) algorithm, principal component analysis (PCA), and clustering algorithms (CAs), as well as other approaches as reviewed by Bansal et al. [35] and Ray [36]. These methods each have benefits and drawbacks, and their usefulness and relevance vary depending on the context of the research.
This study takes advantage of processing remotely sensed data using ML to identify vulnerability hotspots of ecosystems under historical, present, and future climate conditions in the Canadian province of Prince Edward Island (PEI). PEI is considered vulnerable to climate-change-related hazards such as post-tropical cyclones, storm surges, flooding, and coastal erosion, all of which have a shared impact on ecosystems such as forests, wetlands, and dunes [37]. The island has a higher frequency of 100-year storm tides, which are predicted to exceed 5 m above the chart datum and penetrate up to 500 m inland [38], potentially causing environmental harm. While recent studies have solely focused on climate change and socioeconomic aspects [39,40,41], there is a paucity of awareness of how PEI’s ecosystems have changed in recent years and how climate change will affect them. Therefore, investigating the climate vulnerability and resilience of the island’s ecosystems is essential for developing effective climate adaptation measures for conserving the ecosystems.
The SVM algorithm is utilized in this study through the Google Earth Engine (GGE), a cloud-based platform for geospatial data analysis, to determine vulnerable ecosystems in PEI. The SVM algorithm is preferred as it is often used in ecosystem modeling to predict the impacts of habitat fragmentation and identify hotspot areas. The method has been demonstrated as having a better classification accuracy than other traditional classification techniques, such as the maximum likelihood classifier [42]. Landsat images, which provide a wealth of information about the Earth’s surface, including land cover, vegetation, water resources, and urban development, are utilized to capture ecosystem changes in the past decade. Coastal flooding and storm surge scenarios are also developed to explain how climate change affects ecosystems in the long term, with a particular emphasis on the exposure of forests, sand dunes and beaches, and wetland areas. The main purpose of this research is to investigate the historical changes in land use and land cover (LULC) of the ecosystem on PEI using remote sensing images and identify the current coastal ecosystem areas that could be affected by potential climate-change-induced coastal flooding and storm surges. This study will contribute to a better understanding of the application of remote sensing technology in the field of ecosystem studies. The insights derived from this work will be immensely valuable for policymakers in managing ecosystems in local communities and providing a fundamental basis for responding to the future impacts of climate change.
The rest of the manuscript is organized as follows: The study area is presented next. This is followed by the section describing the methodology and data and the sections containing the results and discussion. The conclusions and recommendations are then presented in the last section.

2. Study Area

Prince Edward Island (PEI) province is located on the east coast of Canada in the Gulf of St. Lawrence, between latitudes 45°57′ and 47°04′ N and longitudes 61°55′ and 64°25′ W (Figure 1). PEI is Canada’s smallest and least populous province, with an area of 5620 km2 and 158,000 people [39]. The island’s topography varies from 0 m to 143 m above mean sea level (based on a 3 m resolution digital elevation model) and is distinguished by its red soil, beaches, sand dunes, and vast agricultural land. The climate in PEI is cool and humid, with long and mild winters (−3 °C to −11 °C) and moderately warm summers (20 °C to 34 °C). Annual precipitation is estimated at around 1100 mm, with rainfall accounting for 80% and snowfall accounting for the remainder [39].
Based on the land use inventory report prepared by the Government of PEI [43], forestry and agriculture occupy the vast majority of land uses in PEI, with about 45% and 39% of the total land area, respectively. The remainder of the land includes wetlands (6%), transportation (2%), residential (2%), urban (1%), industrial (1%), and others (4%). Most of the forested land is privately owned, with 16,000 individual property owners accounting for 88% of occupancy, and the remaining 12% is managed by the government [44]. Potatoes are well known as PEI’s most abundant agricultural crop, with a yield of about 1.3 million tons in 2021, or 23% of the total production in Canada. Meanwhile, aquaculture also contributes significantly to the province’s economy, with an estimated 24,300 tons of shellfish and 18,600 tons of lobster production in 2021 [45].
Figure 1. Land use map of PEI in 2000 [46].
Remotesensing 15 04742 g001
In recent years, climate-change-related natural hazards, such as temperature and precipitation variability, floods, storm surge, coastal erosion, sea level rise, and salinity intrusion, have significantly impacted PEI’s natural ecosystems, economy, and society. For example, post-tropical cyclones Dorian in 2019 and Fiona in 2022 have destroyed large extents of forest areas, coastal wetlands, and sand dunes. Yet, the effects of climate change could also put the province’s ecological system of native plants, wildlife, and fish species under stress. In addition, human interventions such as land use change, excessive tourism, and increased commercial harvesting of forest and fishery products will indirectly and directly impact the island’s natural ecosystems. Therefore, it is very important to understand the impacts of climate change on the ecosystems to develop effective adaptation strategies for managing the island’s habitat and beyond.

3. Data and Methods

3.1. Data Sources

Historical satellite imagery between 2013 to 2022 was obtained from the United States Geological Survey (USGS) database, using the Landsat 8 Operational Land Imager (OLI)–Thermal Infrared Sensor (TIRS) Collection 2 Tier 1 in 30 m resolution. This dataset contains atmospherically corrected surface reflectance and land surface temperature, which comprise 5 visible and near-infrared (VNIR) bands and 2 shortwave infrared (SWIR) bands processed to orthorectified surface reflectance and one thermal infrared (TIR) band processed to orthorectified surface temperature [34]. Landsat 8 images are derived with the Land Surface Reflectance Code (LaSRC) algorithm, which utilizes the coastal aerosol band to perform aerosol inversion tests, employs auxiliary climate data from the Moderate Resolution Imaging Spectroradiometer (MODIS), and features a unique radiative transfer model [35]. Due to limited coverage information for PEI, these images were collected mainly from the spring to fall months (April to October) for each year between 2013 and 2022, available from the Earth Engine Data Catalog [47]. The Landsat 8 satellite images were used in this study because of their availability from 2013 to 2022, which is longer than the availability for other types of satellite images, e.g., Sentinel 1 and 2.
A digital elevation model (DEM) with a 3 m resolution was obtained from the Department of Agriculture and Forestry (DAF) [46], and the design flood elevation (DFE) maps, which present the potential maximum flood level used for designing roads and other infrastructures, were obtained from the Coastal Hazards Information Platform (CHIP) prepared by the Department of Environment, Energy and Climate Action for PEI [48]. The DEM and DFE maps are used to assess the potential future impacts of coastal flooding and storm surges on PEI ecosystems. Other datasets obtained from the DAF, including forestry outline, wetland inventory, and sand dunes available for 2000, were also used for the classification of ecosystems in PEI.

3.2. Satellite Data Processing

Landsat 8 satellite imagery was accessed within the Google Earth Engine (GEE) through the snippet of ee.ImageCollection(“LANDSAT/LC08/C02/T1_L2”). The GEE is an internet-based data processing cloud computing platform that provides various types of free satellite image data, which can help to run geospatial analysis on Google’s infrastructure. Due to missing auxiliary input data and/or necessary thermal data for certain periods [49], satellite images may not cover the entirety of PEI. To ensure the availability of images, this study employed temporal aggregation approaches [28] for the data-containing periods. The compilation may cover various days, depending on the availability of data. Another challenge in satellite images is cloud cover; for example, the pixel value might not represent the object’s value; instead, it represents the value of a cloud, leading to an unideal situation in classification. Therefore, Landsat images were filtered with a 5% cloud cover filter to remove invalid observations and to produce cloud-free optical images. Before using the data, surface reflectance was scaled with a scale factor of 0.0000275 and an additional offset of −0.2 per pixel for optical bands, while the surface temperature was scaled with a scale factor of 0.00341802 and an additional offset of 149.0 per pixel for thenal bands to convert data to reflectance, which is unitless, expressed in floating-point values.

3.3. Classification Procedures

For training sample data, eight reference ecosystem samples were specified in the GEE: sand dune and beach, salt or brackish marsh, no open water or marsh component, salt water, open water or marsh component, forest, grassland, and urban. Grassland and urban areas were grouped as others, bringing the total to seven classes of ecosystems. These wetland classes were defined based on the wetland inventory information provided by the DAF in 2000 [50], either in pointwise or polygon units. To improve the categorization accuracy, reference samples were meticulously compared with historical data in 2000. These are the up-to-date geospatial data for PEI available at the Open Data Portal powered by the Government of PEI (https://data.princeedwardisland.ca, accessed on 14 April 2023). Six surface reflectance bands with a spatial resolution of 30 m were used in the training procedure, namely Band 2 (blue), Band 3 (green), Band 4 (red), Band 5 (near infrared), Band 6 (shortwave infrared 1), and Band 7 (shortwave infrared 2).
The support vector machine (SVM) classifier was used to train the sample data, with 80% of the features being used for a training set and 20% for a validation set. The SVM classifier is based on statistical learning theory, which is able to determine the location of decision boundaries that produce the optimal separation of classes [51,52]. The decision boundary is the one that leaves the most margin between the two classes, measuring by summing up the distances from the closest points of each class to the hyperplane [52]. The data points that are closest to the hyperplane are called support vectors. The main idea behind the SVM classifier is to use a kernel function to transform the input data into a higher-dimensional space and then construct an optimal separating hyperplane between two classes in the new space [53]. Accordingly, the radial basis function (RBF) kernel method was applied in SVM to map the input data into a higher-dimensional space using a non-linear function. The RBF kernel method is expressed as shown in Equation (1).
K R B F x i , x j = exp γ x i x j 2 ,    γ > 0
where K R B F is RBF kernel, x i   and x j are inputs data points, x i x j 2 is the Euclidean distance between two points, and γ is a hyperparameter that controls the width of the kernel. A lower value of γ will result in a wider kernel and a smoother decision boundary, while a larger value of γ will yield a narrower kernel and a more complex decision boundary. In this research, γ = 0.5 was specified in the GEE.

3.4. Validation Criteria

The classification’s overall accuracy was calculated based on a confusion matrix. A confusion matrix is an array of two similar axes, one representing a set of known values and the other representing a set of predicted values. The overall accuracy of a confusion matrix is the proportion of correctly classified instances among all instances. It is determined by combining the confusion matrix’s diagonal elements, which represent correct predictions, and dividing this value by the total number of instances. In other words, it is the proportion of correctly classified instances (true positives and true negatives) among all instances in the dataset, as given in Equation (2).
O v e r a l   A c c u r a c y = ( T P + T N ) ( T P + T N + F P + F N )
where TP is the number of true positives, TN is the number of true negatives, FP is the number of false positives, and FN is the number of false negatives in the confusion matrix.
In addition, the Kappa-like classification statistic coefficient was also used to measure the degree of agreement between the observed data and the predicted values (see Equation (3)). The Kappa coefficient ranges from −1 to 1, where a value of 1 indicates perfect agreement, a value of 0 indicates agreement no better than chance, and a negative value represents disagreement. According to Landis and Koch [54], a Kappa of 0.21–0.40 is considered fair agreement, 0.41–0.60 is considered moderate agreement, 0.61–0.80 is considered substantial agreement, and greater than 0.81 is considered almost perfect agreement.
K a p p a = P 0 P c P p P c
where P 0   is the observed proportion correct, P c is the expected proportion correct due to chance, P p is the proportion correct when classification is perfect for both location and quantity ( P p = 1).

3.5. Flooding and Storm Surge Scenario

Instead of employing physical models to simulate flood extents, the CHIP platform’s coastal flood scenarios and storm surge scenarios based on previous events on the island were used. The CHIP platform provides maps of flood-affected areas for four flood scenarios. Flood scenario 1 is characterized by flood events with a 1% yearly chance of coastal flooding (1-in-100-year flood event). Flood scenario 2 is defined as “less likely” coastal flooding due to storm events currently, but the probability of flooding will increase over time. In flood scenario 3, the area is “unlikely” to experience coastal flooding due to storm events, but the probability of flooding will increase in likelihood with time. Lastly, flood scenario 4 (worst-case) is characterized by flood events with a 0.1% chance of occurring annually (or 1-in-1000-year flood event) considering extreme storm events and an additional 0.65 m of sea level rise due to the accelerated melting of West Antarctic sea ice. The ArcGIS application version 10.7.1 was then utilized in this study to accomplish spatial mapping analyses of flood-affected ecosystems. In the case of coastal flooding, DFE shapefiles derived from the CHIP platform were superimposed on ecosystem maps to estimate flood-affected areas associated with four flood scenarios.
For storm surge scenarios, surge levels of 1 m, 2 m, 3 m, and 4 m generated from a DEM with a 3 m resolution were also developed and overlaid on the ecosystem area to determine how the storm surge affected the ecosystems. These levels were set based on recent historical storm surge events that have threatened PEI (e.g., Storm Dorian and Hurricane Fiona).

4. Results

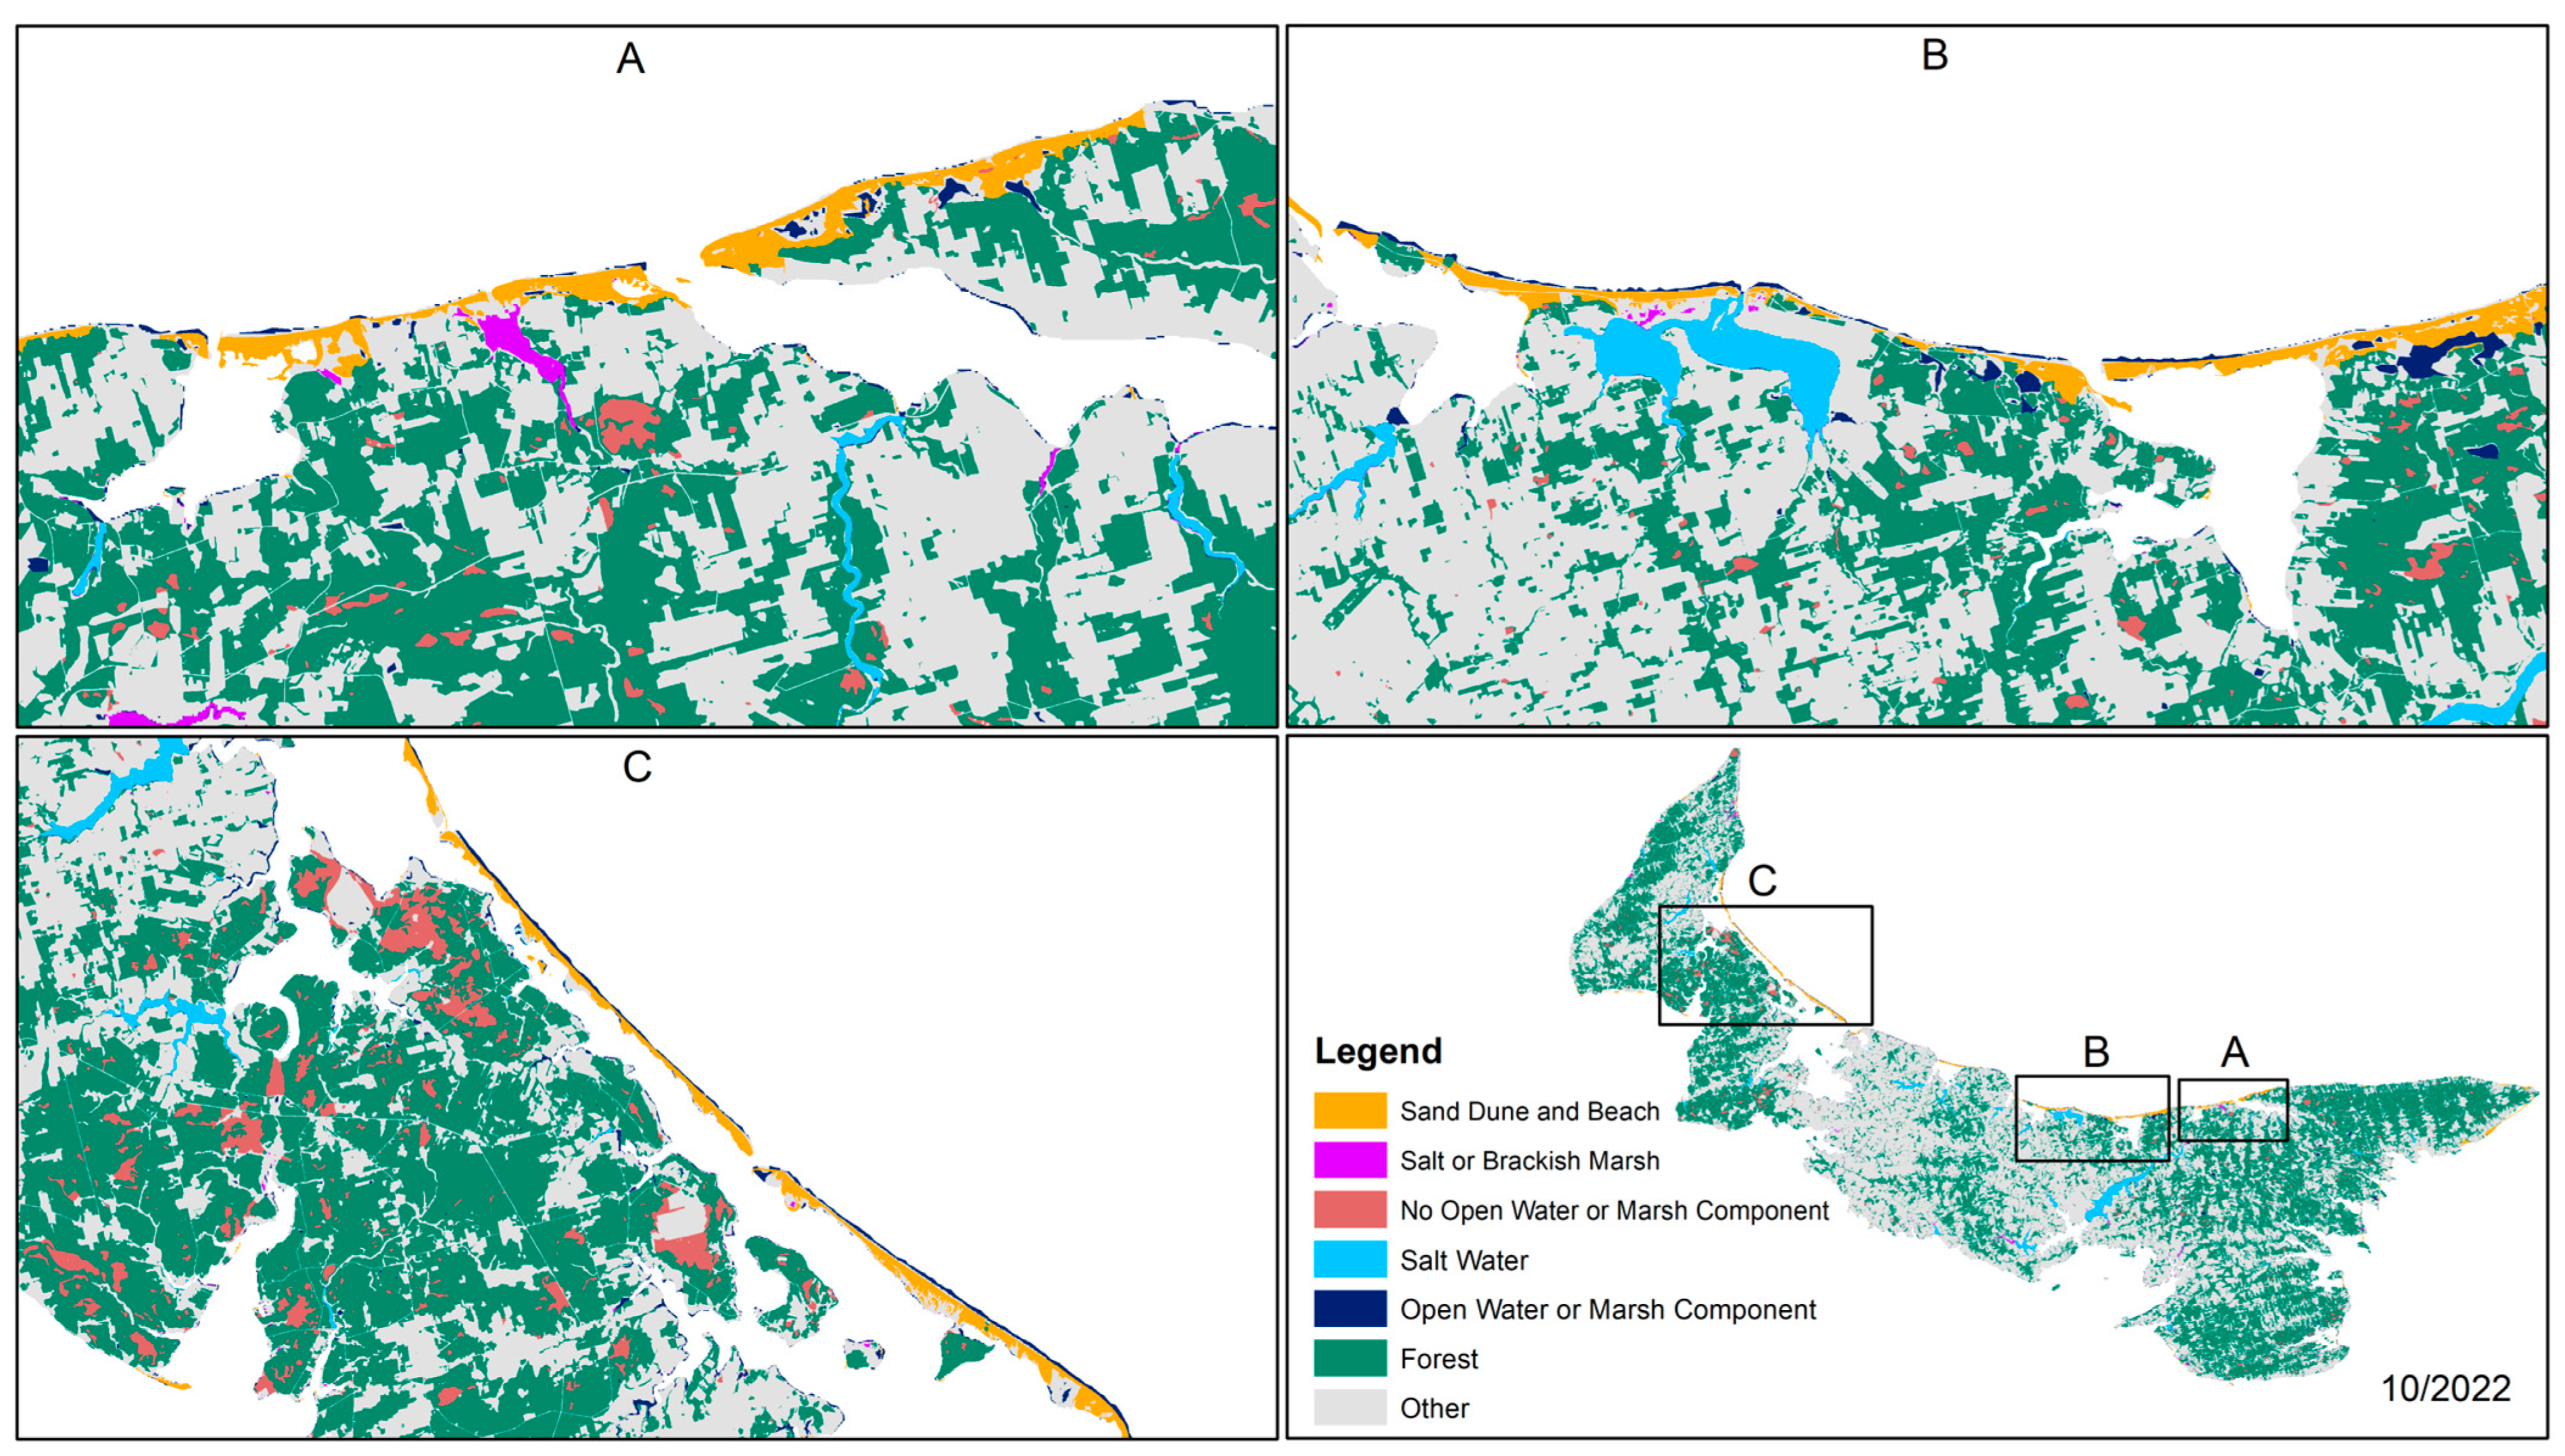
4.1. Changes in PEI Ecosystems

Figure 2 and Figure 3 depict the changes in PEI ecosystems from 2013 to 2022 using Landsat 8 satellite imagery. Following the statistical values in Table 1 and the confusion matrix in Figure 4, the classification indicates a good model performance with overall accuracy and Kappa coefficient values significantly more than 93% and 87%, respectively. Based on the findings, the most extensive ecosystem land use in PEI is forests, primarily found in the island’s eastern and southwestern regions. The total forest area shows a decrease from 2462 km2 to 2392 km2 in the past ten years (2013 to 2022), accounting for a total loss of about 3%. Given the limitation of obtaining accurate information from satellite images for precisely capturing the ecosystems at finer scales in this study, it is important to note that large portions of the forests have been damaged, including fallen trees, by recent post-tropical cyclones in 2019 (Storm Dorian) and 2022 (Hurricane Fiona). Falling trees will decrease the forest canopy, but this will not significantly impact its extent.
Wetlands in PEI were categorized by “salt or brackish marsh”, “no open water or marsh component”, “salt water”, and “open water or marsh component”. As presented in Table 1, marsh components can be found in both open and closed water. In general, some marshlands could be present in forests, rivers, lakes, ponds, etc. Unfortunately, due to limited information from satellite images for detecting the classes at finer scales, distinguishing how broad portions of these marshes existed in the above ecosystems is challenging. This is why marshlands were divided into two categories: no open water or marsh and open water or marsh components. The result shows a reduction in marshlands by about 3% (no open water) and 9% (open water) between 2013 and 2022. Other wetlands, such as salt water and salt or brackish marsh, show a 5% and 17% reduction over the decade, respectively.
Sand dunes and beaches, which can be found parallel to the beach and may or may not be covered with plants, are also essential components of PEI coastal ecosystems. There are two major types of sand dunes in PEI: primary sand dunes are located immediately inland of the coast and may be vegetated with marram grass, and secondary sand dunes are located adjacent to and inland of a primary sand dune and support other vegetation, e.g., marram grass, lichen, and bayberry. Most of the sand dune and beach areas are distributed along the island’s northern coastal areas, covering approximately 35 km2 to 39 km2 during the past decade (see Figure 5 and Table 1). These values are roughly equivalent to the survey results in 2000, estimated at around 35 km2 (0.62% compared to the entire island) [38]. Although the geographical area of sand dunes and beaches has not changed significantly over the past decade, their local landscape may have changed due to natural processes induced by intense storms. Severe storms would alter the sand dune composition by stripping and depositing sediment from one place to another, causing changes in its structure and stability. Hence, it is important to take into account that the total areas of the sand dune, particularly in the post-tropical cyclone years of 2019 and 2022, included both sand dune and beach areas.

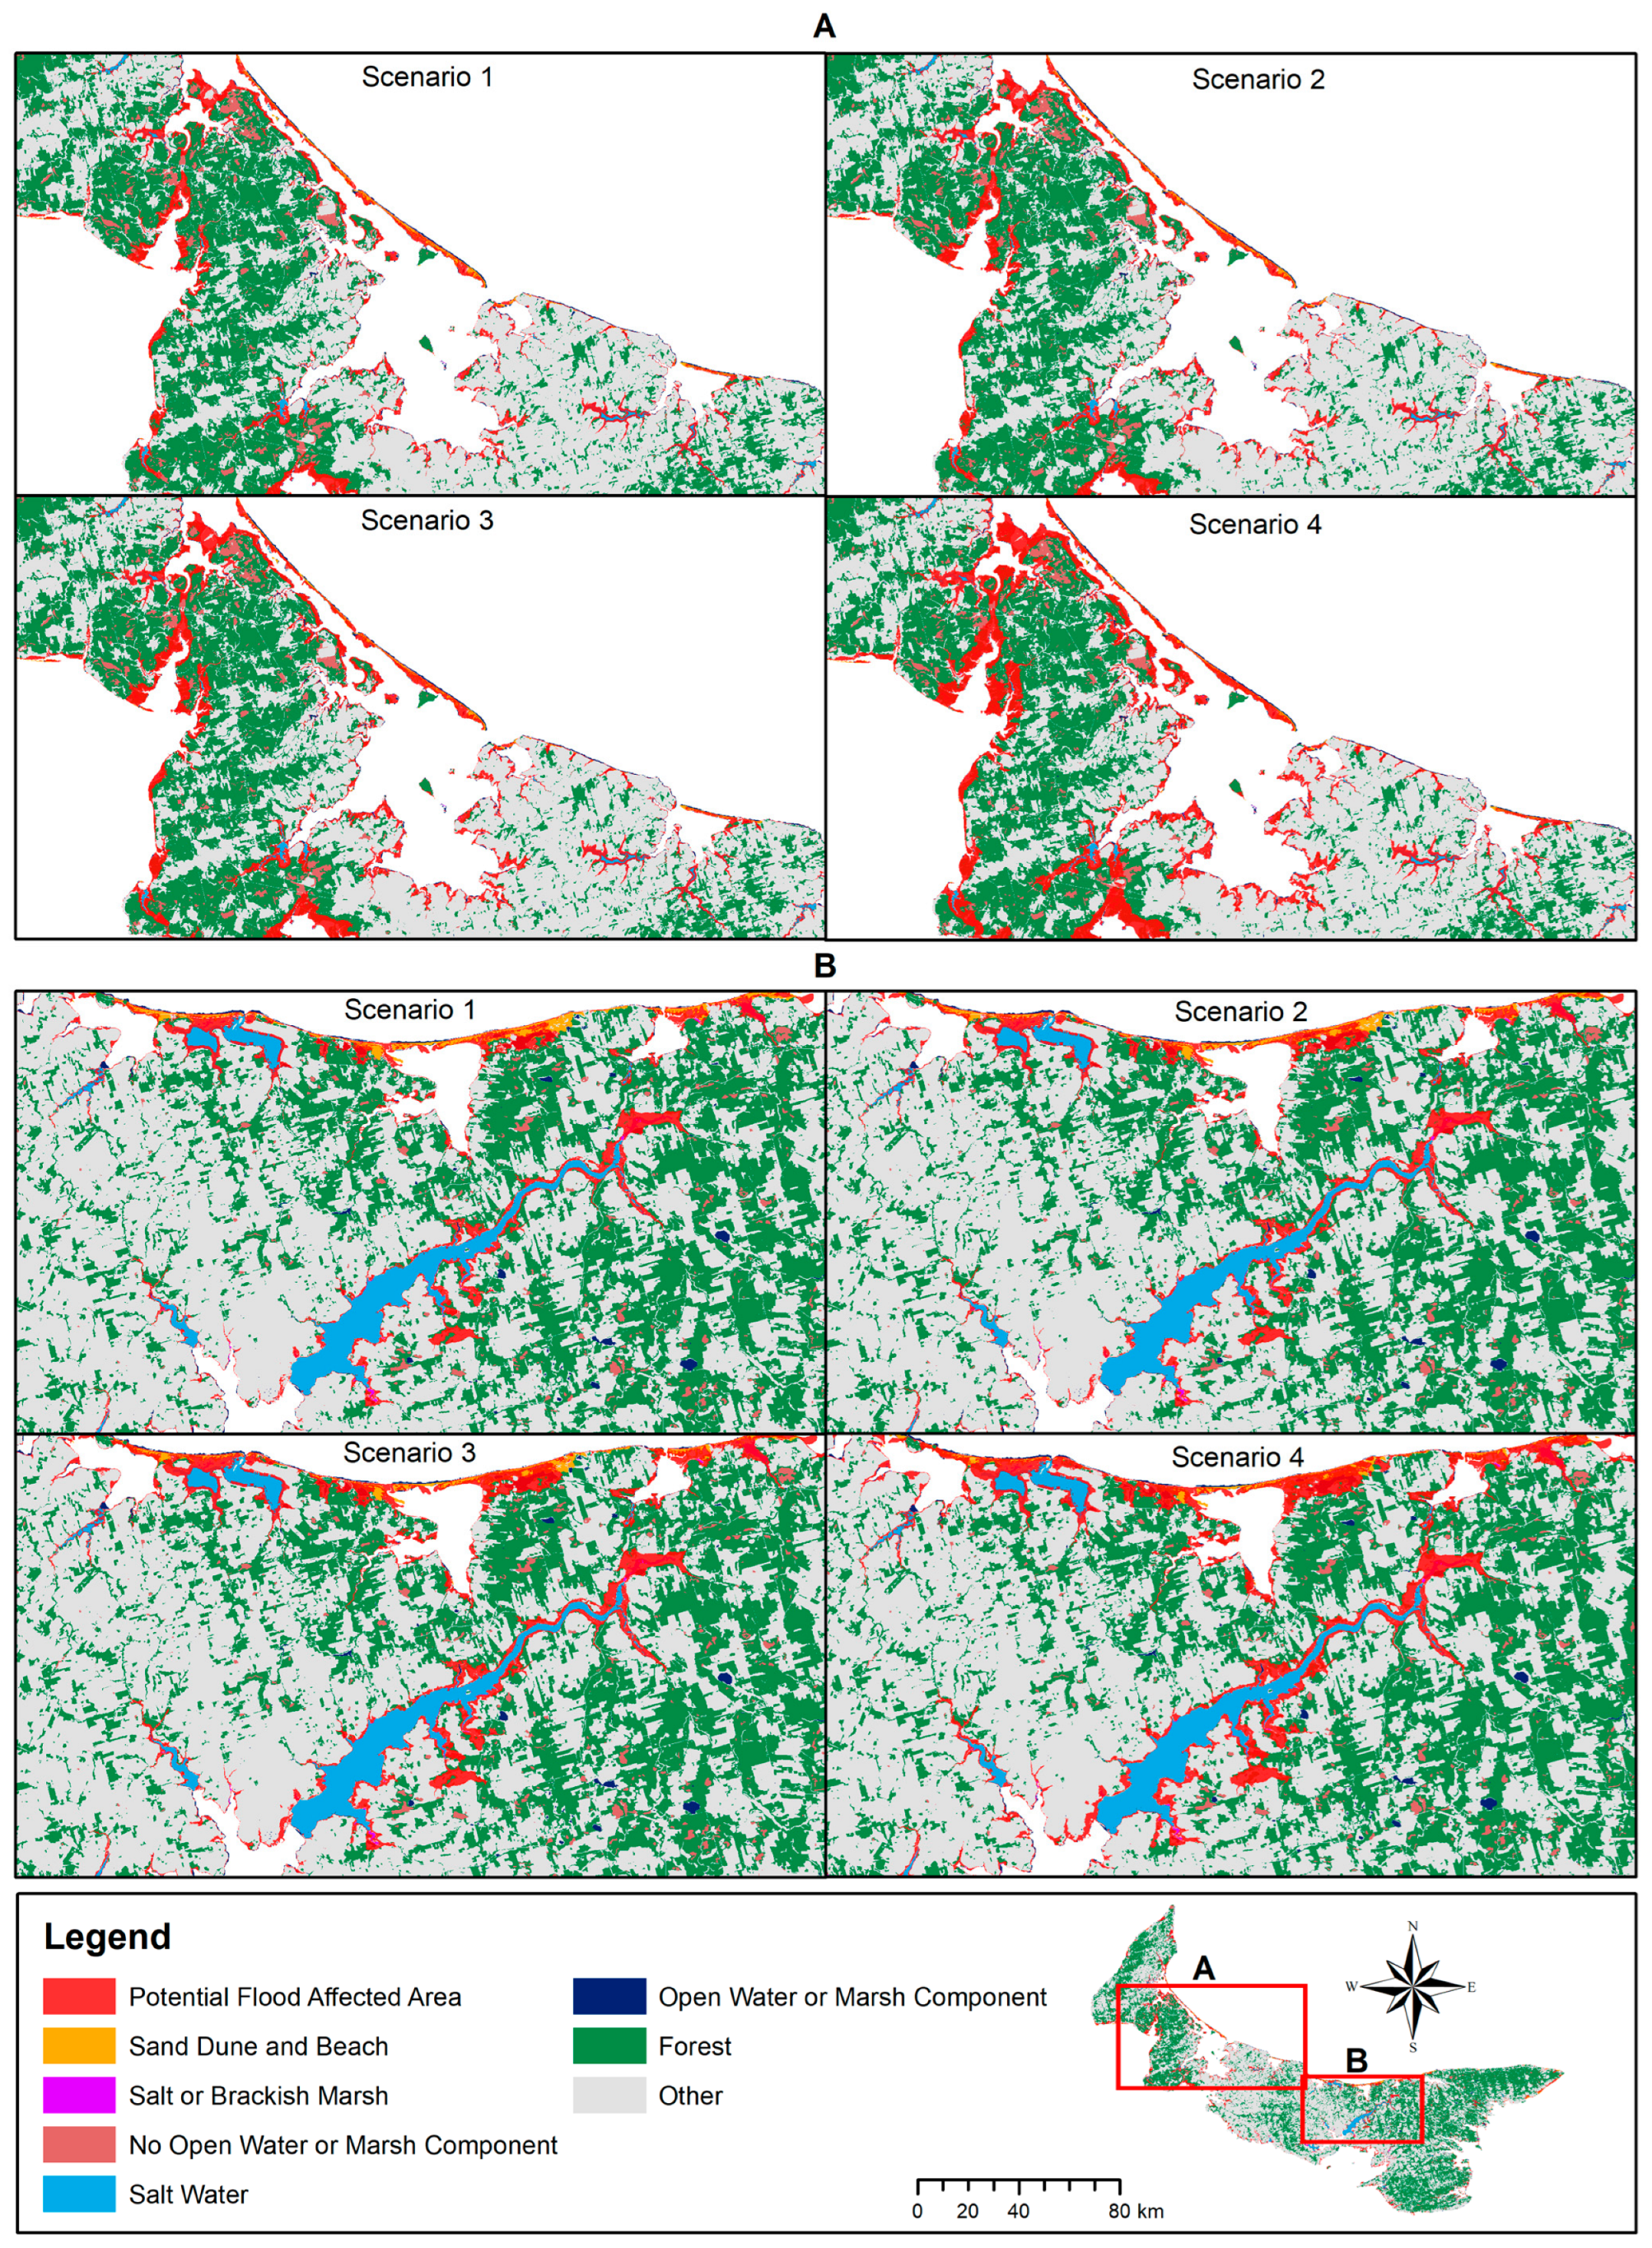
4.2. Impacts of Coastal Flooding on Ecosystems

Understanding the effects of coastal flooding on PEI ecosystems has recently become a critical research question. Figure 6 exhibits the impacts of coastal flooding on PEI ecosystems under various flooding scenarios. As an illustration of the most recent year, satellite images from 2022 were used to estimate the impact of flooding on ecosystems. Under the extreme scenario (scenario 4), approximately 257 km2 of PEI ecosystems (9.4% compared to the total area of all the ecosystems) would fall within the flood-affected zone, of which large areas are found to be forest (153 km2 or 6% of total forests) (see Table 2). The affected areas in scenarios 1, 2, and 3 are also estimated to be around 142 km2 (5.2%), 155 km2 (5.7%), and 191 km2 (7%), respectively, of all the ecosystems. Most of the flood-prone ecosystems are in the northern and northwestern regions. Although high wetland water levels may not affect the ecosystem, the large-scale sedimentation process during coastal flooding may alter the wetland morphology and habitat quality.

4.3. Impacts of Storm Surge on PEI Ecosystems

Figure 7 reveals the possibility that severe storm surges during post-tropical cyclones may impact the coastal ecosystems in PEI. This study suggests that storm surge impacts on PEI ecosystems are likely more considerable than coastal flooding. As given in Table 3, approximately 223 km2 of the ecosystems (8.2% compared to the total area of all the ecosystems) would be inundated under the 4 m storm surge scenario. Meanwhile, about 61 km2 (2.2%), 113 km2 (4.1%), and 168 km2 (6.1%) areas would also be flooded under the 1 m, 2 m, and 3 m scenarios, respectively, of all the ecosystems. A significant impact can be seen around the island’s north, northeast, and southwest coasts, including the Lennox Island, Summerside, and Greenwich regions.

5. Discussion

Historical analysis of the spatial extents of main ecosystems in PEI examined in this study demonstrates that the coverage of the ecosystems has changed over the last decade. The variation could be linked to both climatic change and anthropological interventions. The forest ecosystem has revealed a slight shift, with around 3% coverage (around 70 km2) lost since 2013. These losses could result from the conversion of privately owned forest land to agriculture, residential, or other uses, as reported in previous studies in Canada [55] and other places [56]. Another factor could be the effects of severe post-tropical storms or storm surges causing damage or erosion of forest areas [57,58]. For instance, Park Canada stated that 80% of the trees in the Cavendish area of PEI National Park were lost after suffering damage from Storm Dorian [59], whereas hundreds of trees were destroyed in Victoria Park, Charlottetown, due to Hurricane Fiona. Yet, storm-damaged trees do not signify that the forest ecosystem has been completely destroyed. This is because when a tree falls in a forest, it becomes a part of the ecosystem and provides environmental benefits such as providing habitat and nutrients for wildlife, promoting soil health, and allowing new growth to emerge [60,61]. Additionally, many government-supported programs, such as the Forestry Enhancement Program, Greening Space Program, and Carbon Capture Tree Planting Program, have developed new forest areas and green spaces in recent years [62]. As a result, the change in forest coverage revealed in this study reflects a net change after accounting for all of the aforementioned reasons.
As mentioned previously, estimates based on remote sensing image classification may not precisely capture the changes in sand dunes due to their placement along the coast, and tidal water levels could influence the representation of their spatial extent in the satellite images [63]. In addition, sand dunes are a dynamic landform that is frequently influenced by wind and wave activity, as well as severe storm surges [64], and are built up through a continuous accretion process. For that reason, sand dunes and beaches were grouped together in the classification analysis. In PEI, sand dunes are protected under the Environmental Protection Act from disturbance by new developments, motorized vehicle traffic, or alteration of any kind [65]. Based on the results, no major changes in the sand dune and beach coverage have been detected in the recent decade. It is worth emphasizing that because the tidal water level was already taken into account in the reference sample data (2000) and the CHIP platform, this study did not exclude or include areas affected by high or low tides while classifying the images between 2013 and 2022.
This study also assessed the possible ecosystem areas that could be impacted by coastal flooding and storm surge under various climate scenarios. Although PEI does not have large mangrove forests or rocky shorelines, which act as natural defenses of coastlines [66,67], the sand dunes, salt marshes, and forests on this island are very important for the protection of the coastal lands, communities, fisheries, tourism, and, obviously, other ecologically important areas further inland. However, damage to the coastal ecosystems due to flooding and storm surge will increase the risk to both ecosystems and communities’ livelihoods. As a first study, we have only identified the potential affected areas of different coastal ecosystems along the coast of PEI. This study did not investigate the other effects of coastal flooding or storm surge on ecosystems, such as the plant and animal species composition, habitat, and life cycle that might be influenced by ecosystem change [68,69]. Other climate-related hazards were also overlooked, such as precipitation and temperature variability, heavy rainfall, coastal erosion, salinity, and drought, which could impact PEI’s forests, wetlands, and other ecosystems. Although these ecosystems will change over time due to socioeconomic and climate changes, predicting changes in LULC is beyond the scope of this study. Hence, future research is needed to investigate the long-term response of ecosystems to multiple climatic hazards and the effects of climate change on biodiversity and ecosystem health, including LULC change prediction.
This research could be improved upon in terms of methodology. Regarding data availability, the resolution of 30 m in Landsat imagery is too coarse to depict PEI’s intricate ecosystem setting accurately. High-resolution imagery (e.g., IKONOS and QuickBird ≤ 5 m resolution) is commonly used to map regional-to-local environments and to enrich land cover classifications obtained from coarser imagery [70], which can be considered in future studies for PEI’s ecosystems. Along with the out-of-date reference sample data available in 2000, this will undoubtedly alter the hotspot classification around the island. Other elements configured in the SVM classifier, such as kernel types (linear, RBF, or sigmoid), gamma value, and splitting data for training and testing sets, were trial-and-error, which may also reflect the detection of land cover in the GEE. Therefore, all of the foregoing restrictions should be addressed in future studies, for example, through undertaking a ground truth survey for reference data, using high-resolution satellite images, or applying other classifiers, to eliminate uncertainty problems while increasing study reliability.

6. Conclusions

The effects of climate change on PEI ecosystems have been investigated based on remote sensing techniques. Landsat 8 OLI–TIRS Collection 2 Tier 1 in 30 m resolution, accessed via GEE, was used for the classification analysis. The results showed a decline in forest areas from 2462 km2 to 2392 km2 between 2013 and 2022, accounting for a total loss of 3%. The geographical areas of sand dunes and beaches showed a non-uniform change over time, ranging from 35 km2 to 39 km2, mainly in northern coastal areas. Extreme coastal flooding (scenario 4) would affect about 257 km2 of PEI’s ecosystems, while approximately 223 km2 would be flooded by a 4 m storm surge scenario. These significant impacts can be seen on the north, northeast, and southwest coast of the island, including the Lennox Island, Summerside, and Greenwich regions.
The study demonstrates the value of using satellite images in estimating the historical changes in PEI ecosystems and the effects of climate change on PEI ecosystems. The results obtained from this work will be very important as scientific evidence for future studies in ecology, environmental science, forestry, and coastal erosion, with an emphasis on the ecosystem–climate nexus. Finally, the findings are expected to help policymakers take location-specific appropriate actions to protect the coastal ecosystems and their services (e.g., biodiversity, flood production, and irrigation regulation) in PEI while addressing the effects of climate change and helping to achieve the United Nations (UN) Sustainable Development Goals at the local scale (SDG 11—sustainable cities and communities, SDG 13—climate action, SDG 14—life below water, and SDG 15—life on land) [71]. Particularly, Parks Canada and the PEI Department of Fisheries can use the results to locate sand dunes, forests, salt marshes, and other wetlands that may be impacted by coastal flooding and storm surge, as well as to devise and implement short- and long-term mitigation and adaptation measures.

Author Contributions

Conceptualization, Q.V.D. and X.W.; methodology, Q.V.D. and X.W.; software, Q.V.D.; validation, Q.V.D., X.W. and M.A.R.S.; formal analysis, Q.V.D.; investigation, Q.V.D.; resources, Q.V.D.; data curation, Q.V.D.; writing—original draft preparation, Q.V.D.; writing—review and editing, Q.V.D., X.W., M.A.R.S., P.K. and S.B.; visualization, Q.V.D.; supervision, X.W.; project administration, X.W.; funding acquisition, X.W. All authors have read and agreed to the published version of the manuscript.

Funding

This research was supported by the Natural Science and Engineering Research Council of Canada, the New Frontiers in Research Fund, and the Government of Prince Edward Island.

Data Availability Statement

Data are available on request from the authors.

Conflicts of Interest

The authors declare no conflict of interest.

References

  1. Dau, Q.V.; Momblanch, A.; Adeloye, A.J. Adaptation in a Himalayan water resources system under a sustainable socio-economic pathway in a high-emission context. J. Hydrol. Eng. 2021, 26, 04021003. [Google Scholar] [CrossRef]
  2. Pecl, G.T.; Araújo, M.B.; Bell, J.D.; Blanchard, J.; Bonebrake, T.C.; Chen, I.-C.; Clark, T.D.; Colwell, R.K.; Danielsen, F.; Evengård, B.; et al. Biodiversity redistribution under climate change: Impacts on ecosystems and human well-being. Science 2017, 355, eaai9214. [Google Scholar] [CrossRef] [PubMed]
  3. Dau, Q.V.; Kittiwet, K. Identifying adaptive reservoir operation for future climate change scenarios: A case study in Central Vietnam. Water Resour. 2020, 47, 189–199. [Google Scholar] [CrossRef]
  4. Malhi, Y.; Franklin, J.; Seddon, N.; Solan, M.; Turner, M.G.; Field, C.B.; Knowlton, N. Climate change and ecosystems: Threats, opportunities and solutions. Phil. Trans. R. Soc. B 2020, 375, 20190104. [Google Scholar] [CrossRef]
  5. Wang, X.; Huang, G.; Lin, Q.; Nie, X.; Cheng, G.; Fan, Y.; Li, Z.; Yao, Y.; Suo, M. A stepwise cluster analysis approach for downscaled climate projection—A Canadian case study. Environ. Model. Softw. 2013, 49, 141–151. [Google Scholar] [CrossRef]
  6. Taillie, P.J.; Roman-Cuesta, R.; Lagomasino, D.; Cifuentes-Jara, M.; Fatoyinbo, T.; Ott, L.E.; Poulter, B. Widespread mangrove damage resulting from the 2017 Atlantic mega hurricane season. Environ. Res. Lett. 2020, 15, 064010. [Google Scholar] [CrossRef]
  7. Walcker, R.; Laplanche, C.; Herteman, M.; Lambs, L.; Fromard, F. Damages caused by hurricane Irma in the human-degraded mangroves of Saint Martin (Caribbean). Sci. Rep. 2019, 9, 18971. [Google Scholar] [CrossRef]
  8. Wang, H.; Chen, Q.; Hu, K.; Snedden, G.A.; Hartig, E.K.; Couvillion, B.R.; Johnson, C.L.; Orton, P.M. Numerical Modeling of the Effects of Hurricane Sandy and Potential Future Hurricanes on Spatial Patterns of Salt Marsh Morphology in Jamaica Bay, New York City; Open-File Report 2017–1016; U.S. Geological Survey (USGS): Reston, VA, USA, 2017; p. 56. [Google Scholar]
  9. Asbridge, E.; Lucas, R.; Rogers, K.; Accad, A. The extent of mangrove change and potential for recovery following severe Tropical Cyclone Yasi, Hinchinbrook Island, Queensland, Australia. Ecol. Evol. 2018, 8, 10416–10434. [Google Scholar] [CrossRef]
  10. Hodge, J.; Williams, H. Deriving spatial and temporal patterns of coastal marsh aggradation from hurricane storm surge marker beds. Geomorphology 2016, 274, 50–63. [Google Scholar] [CrossRef]
  11. Xiao, H.; Wang, D.; Medeiros, S.C.; Bilskie, M.V.; Hagen, S.C.; Hall, C.R. Exploration of the effects of storm surge on the extent of saltwater intrusion into the surficial aquifer in coastal east-central Florida (USA). Sci. Total Environ. 2019, 648, 1002–1017. [Google Scholar] [CrossRef]
  12. Roy, P.; Pal, S.C.; Chakrabortty, R.; Chowdhuri, I.; Saha, A.; Shit, M. Effects of climate change and sea-level rise on coastal habitat: Vulnerability assessment, adaptation strategies and policy recommendations. J. Environ. Manag. 2023, 330, 117187. [Google Scholar] [CrossRef] [PubMed]
  13. Wilson, E.O. Biodiversity and Climate Change Transforming the Biosphere; Yale University Press: New Haven, CT, USA, 2019. [Google Scholar]
  14. Higgins, S.I.; Conradi, T.; Muhoko, E. Shifts in vegetation activity of terrestrial ecosystems attributable to climate trends. Nat. Geosci. 2023, 16, 147–153. [Google Scholar] [CrossRef]
  15. Froese, R.; Schilling, J. The nexus of climate change, land use, and conflicts. Curr. Clim. Change Rep. 2019, 5, 24–35. [Google Scholar] [CrossRef]
  16. Sunderlin, W.D.; de Sassi, C.; Sills, E.O.; Duchelle, A.E.; Larson, A.M.; Resosudarmo, I.A.P.; Awono, A.; Kweka, D.L.; Huynh, T.B. Creating an appropriate tenure foundation for REDD+: The record to date and prospects for the future. World Dev. 2018, 106, 376–392. [Google Scholar] [CrossRef]
  17. Lu, Y.; Wang, P.; Wang, C.; Zhang, M.; Cao, X.; Chen, C.; Wang, C.; Xiu, C.; Du, D.; Cui, H.; et al. Multiple pollutants stress the coastal ecosystem with climate and anthropogenic drivers. J. Hazard. Mater. 2022, 424, 127570. [Google Scholar] [CrossRef]
  18. Skoulikaris, C.; Makris, C.; Katirtzidou, M.; Baltikas, V.; Krestenitis, Y. Assessing the Vulnerability of a Deltaic Environment due to Climate Change Impact on Surface and Coastal Waters: The Case of Nestos River (Greece). Environ. Model. Assess. 2021, 26, 459–486. [Google Scholar] [CrossRef]
  19. Wang, X.; Guo, J.; Fenech, A.; Farooque, A.A. Future climate projections for Eastern Canada. Clim. Dyn. 2022, 59, 2735–2750. [Google Scholar] [CrossRef]
  20. Wang, X.; Yang, A.; Fenech, A.; Cheng, H. Environmental systems modelling and analysis under changing conditions. Math. Probl. Eng. 2021, 2021, 9780860. [Google Scholar] [CrossRef]
  21. Lewis, B.M.; Battye, W.H.; Aneja, V.P.; Kim, H.; Bell, M.L. Modeling and Analysis of Air Pollution and Environmental Justice: The Case for North Carolina’s Hog Concentrated Animal Feeding Operations. Environ. Heal. Perspect. 2023, 131, 087018. [Google Scholar] [CrossRef]
  22. Druckenbrod, D.L.; Martin-Benito, D.; Orwig, D.A.; Pederson, N.; Poulter, B.; Renwick, K.M.; Shugart, H.H. Redefining temperate forest responses to climate and disturbance in the eastern United States: New insights at the mesoscale. Glob. Ecol. Biogeogr. 2019, 28, 557–575. [Google Scholar] [CrossRef]
  23. Palacios-Orueta, A.; Huesca, M.; Whiting, M.L.; Litago, J.; Khanna, S.; Garcia, M.; Ustin, S.L. Derivation of phenological metrics by function fitting to time-series of Spectral Shape Indexes AS1 and AS2: Mapping cotton phenological stages using MODIS time series. Remote Sens. Environ. 2012, 126, 148–159. [Google Scholar] [CrossRef]
  24. Muraoka, H.; Koizumi, H. Satellite Ecology (SATECO)—Linking ecology, remote sensing and micrometeorology, from plot to regional scale, for the study of ecosystem structure and function. J. Plant Res. 2009, 122, 3–20. [Google Scholar] [CrossRef] [PubMed]
  25. Marceau, D.J.; Hay, G.J. Remote sensing contributions to the scale Issue. Can. J. Remote Sens. 1999, 25, 357–366. [Google Scholar] [CrossRef]
  26. Lewis, D.; Phinn, S.; Arroyo, L. Cost-effectiveness of seven approaches to map vegetation vommunities—A case study from Northern Australia’s tropical Savannas. Remote Sens. 2013, 5, 377–414. [Google Scholar] [CrossRef]
  27. Maxwell, A.E.; Warner, T.A.; Fang, F. Implementation of machine-learning classification in remote sensing: An applied review. Int. J. Remote Sens. 2018, 39, 2784–2817. [Google Scholar] [CrossRef]
  28. Basheer, S.; Wang, X.; Farooque, A.A.; Nawaz, R.A.; Liu, K.; Adekanmbi, T.; Liu, S. Comparison of land use land cover classifiers using different satellite imagery and machine learning techniques. Remote. Sens. 2022, 14, 4978. [Google Scholar] [CrossRef]
  29. Dau, Q.V.; Adeloye, A.J. Water security implications of climate and socio-economic stressors for river basin management. Hydrol. Sci. J. 2021, 66, 1097–1112. [Google Scholar] [CrossRef]
  30. Rolnick, D.; Donti, P.L.; Kaack, L.H.; Kochanski, K.; Lacoste, A.; Sankaran, K.; Ross, A.S.; Milojevic-Dupont, N.; Jaques, N.; Waldman-Brown, A.; et al. Tackling climate change with machine learning. ACM Comput. Surv. 2022, 55, 1–96. [Google Scholar] [CrossRef]
  31. Huntingford, C.; Jeffers, E.S.; Bonsall, M.B.; Christensen, H.M.; Lees, T.; Yang, H. Machine learning and artificial intelligence to aid climate change research and preparedness. Environ. Res. Lett. 2019, 14, 124007. [Google Scholar] [CrossRef]
  32. Guo, J.; Wang, X.; Fan, Y.; Liang, X.; Jia, H.; Liu, L. How extreme events in China would be affected by global warming—Insights from a bias-borrected CMIP6 ensemble. Earth's Futur. 2023, 11, e2022EF003347. [Google Scholar] [CrossRef]
  33. Santini, M.; Valentini, R. Predicting hot-spots of land use changes in Italy by ensemble forecasting. Reg. Environ. Change 2011, 11, 483–502. [Google Scholar] [CrossRef]
  34. Lacava, G.; Mercaldo, F.; Martinelli, F.; Santone, A.; Pizzi, M. Drone audio recognition based on machine learning techniques. Procedia Comput. Sci. 2022, 207, 848–857. [Google Scholar] [CrossRef]
  35. Bansal, D.; Chhikara, R.; Khanna, K.; Gupta, P. Comparative analysis of various machine learning algorithms for detecting dementia. Procedia Comput. Sci. 2018, 132, 1497–1502. [Google Scholar] [CrossRef]
  36. Ray, S. A quick review of machine learning algorithms. In Proceedings of the 2019 International Conference on Machine Learning, Big Data, Cloud and Parallel Computing (COMITCon), Faridabad, India, 14–16 February 2019; pp. 35–39. [Google Scholar]
  37. Chown, S.; Froneman, P.W. The Prince Edward Islands: Land-Sea Interactions in a Changing Ecosystem; Sun Press: , Stellenbosch, South Africa, 2008. [Google Scholar]
  38. Khirfan, L.; El-Shayeb, H. Urban climate resilience through socio-ecological planning: A case study in Charlottetown, Prince Edward Island. J. Urban. Int. Res. Placemaking Urban Sustain. 2020, 13, 187–212. [Google Scholar] [CrossRef]
  39. Bhatti, A.Z.; Farooque, A.A.; Krouglicof, N.; Peters, W.; Acharya, B.; Li, Q.; Ahsan, M.S. Climate change impacts on precipitation and temperature in Prince Edward Island, Canada. World Water Policy 2021, 7, 9–29. [Google Scholar] [CrossRef]
  40. Fenech, A.; Chen, A.; Clark, A.; Hedley, N. Building an adaptation tool for visualizing the coastal impacts of climate change on Prince Edward Island, Canada. In Climate Change Adaptation in North America: Fostering Resilience and the Regional Capacity to Adapt; Leal Filho, W., Keenan, J.M., Eds.; Springer International Publishing: Cham, Switzerland, 2017; pp. 225–238. [Google Scholar]
  41. Kınay, P.; Wang, X.; Augustine, P.J.; Augustine, M. Reporting evidence on the environmental and health impacts of climate change on Indigenous Peoples of Atlantic Canada: A systematic review. Environ. Res. Clim. 2023, 2, 022003. [Google Scholar] [CrossRef]
  42. Szuster, B.W.; Chen, Q.; Borger, M. A comparison of classification techniques to support land cover and land use analysis in tropical coastal zones. Appl. Geogr. 2011, 31, 525–532. [Google Scholar] [CrossRef]
  43. Government-of-PEI. 2000/02 Prince Edward Isaland Corporate Land Use Inventory—Land Use and Land Cover Summary; Government of PEI: Charlottetown, PE, Canada, 2003. [Google Scholar]
  44. Government-of-PEI. State of the Forest Report 2010; Agriculture and Forestry—Forests, Fish and Wildlife: Charlottetown, PE, Canada, 2013. [Google Scholar]
  45. DFO. Seafisheries Landed Quantity by Province. Available online: https://www.dfo-mpo.gc.ca/stats/commercial/land-debarq/sea-maritimes/s2021pq-eng.htm (accessed on 10 May 2023).
  46. Government-of-PEI. GIS Data Layer—Resource Data. Available online: http://www.gov.pe.ca/gis/index.php3?number=77543&lang=E (accessed on 12 May 2023).
  47. Google. Landsat Collections. Available online: https://developers.google.com/earth-engine/datasets/catalog/landsat (accessed on 2 April 2023).
  48. DEECA. Coastal Hazards Information Platform (CHIP). Available online: https://www.princeedwardisland.ca/en/information/environment-energy-and-climate-action/coastal-hazards-information-platform-chip (accessed on 15 March 2023).
  49. USGS. Landsat 8-9 Operational Land Imager (OLI)—Thermal Infrared Sensor (TIRS) Collection 2 Level 2 (L2) Data Format Control Book (DFCB); United States Geological Survey: Reston, VA, USA, 2020; Volume 78. [Google Scholar]
  50. Dibblee, R. Wetland 2000 Polygon. Available online: www.gov.pe/gis (accessed on 22 June 2023).
  51. Pal, M.; Mather, P.M. Support vector machines for classification in remote sensing. Int. J. Remote Sens. 2005, 26, 1007–1011. [Google Scholar] [CrossRef]
  52. Awad, M. Google Earth Engine (GEE) cloud computing based crop classification using radar, optical images and Support Vector Machine Algorithm (SVM). In Proceedings of the 2021 IEEE 3rd International Multidisciplinary Conference on Engineering Technology (IMCET), Beirut, Lebanon, 8–10 December 2021; pp. 71–76. [Google Scholar]
  53. Begg, R.K.; Palaniswami, M.; Owen, B. Support vector machines for automated gait classification. IEEE Trans. Biomed. Eng. 2005, 52, 828–838. [Google Scholar] [CrossRef]
  54. Landis, J.R.; Koch, G.G. The measurement of observer agreement for categorical data. Biometrics 1977, 33, 159–174. [Google Scholar] [CrossRef]
  55. Masek, J.G.; Cohen, W.B.; Leckie, D.; Wulder, M.A.; Vargas, R.; de Jong, B.; Healey, S.; Law, B.; Birdsey, R.; Houghton, R.A.; et al. Recent rates of forest harvest and conversion in North America. J. Geophys. Res. 2011, 116, G00K03. [Google Scholar] [CrossRef]
  56. Gaveau, D.L.A.; Sheil, D.; Husnayaen; Salim, M. A.; Arjasakusuma, S.; Ancrenaz, M.; Pacheco, P.; Meijaard, E. Rapid conversions and avoided deforestation: Examining four decades of industrial plantation expansion in Borneo. Sci. Rep. 2016, 6, 32017. [Google Scholar] [CrossRef]
  57. Ramenzoni, V.C.; Escuela, D.B.; Rivero, A.R.; González-Díaz, P.; Sánchez, V.V.; López-Castañeda, L.; Méndez, A.F.; Ramos, I.H.; López, N.V.H.; Besonen, M.R.; et al. Vulnerability of Fishery-Based Livelihoods to Extreme Events: Local Perceptions of Damages from Hurricane Irma and Tropical Storm Alberto in Yaguajay, Central Cuba. Coast. Manag. 2020, 48, 354–377. [Google Scholar] [CrossRef]
  58. Wang, X.; Wang, W.; Tong, C. A review on impact of typhoons and hurricanes on coastal wetland ecosystems. Acta Ecol. Sin. 2016, 36, 23–29. [Google Scholar] [CrossRef]
  59. CBC. Dorian Takes out 80% of Trees in Cavendish Area of P.E.I. National Park, Parks Canada Says. Available online: https://www.cbc.ca/news/canada/prince-edward-island/pei-post-tropical-storm-dorian-cavendish-trees-1.5277635 (accessed on 25 March 2023).
  60. Harmon, M.E.; Franklin, J.F.; Swanson, F.J.; Sollins, P.; Gregory, S.V.; Lattin, J.D.; Anderson, N.H.; Cline, S.P.; Aumen, N.G.; Sedell, J.R.; et al. Ecology of Coarse Woody Debris in Temperate Ecosystems. In Advances in Ecological Research; Academic Press: Cambridge, MA, USA, 2004; Volume 34, pp. 59–234. [Google Scholar]
  61. Behnke-Borowczyk, J.; Kwaśna, H.; Kartawik, N.; Sijka, B.; Bełka, M.; Łakomy, P. Effect of management on fungal communities in dead wood of Scots pine. For. Ecol. Manag. 2021, 479, 118528. [Google Scholar] [CrossRef]
  62. Government-of-PEI. PEI Forestry Commission. Available online: https://www.princeedwardisland.ca/en/information/environment-energy-and-climate-action/pei-forestry-commission (accessed on 16 March 2023).
  63. Allen, Y.C.; Couvillion, B.R.; Barras, J.A. Using multitemporal remote sensing imagery and inundation measures to improve land change estimates in coastal wetlands. Estuaries Coasts 2012, 35, 190–200. [Google Scholar] [CrossRef]
  64. Mathew, S.; Davidson-Arnott, R.G.D.; Ollerhead, J. Evolution of a beach–dune system following a catastrophic storm overwash event: Greenwich Dunes, Prince Edward Island, 1936–2005. Can. J. Earth Sci. 2010, 47, 273–290. [Google Scholar] [CrossRef]
  65. Government-of-PEI. Environmental Protection Act; Legislative Counsel Office: Charlottetown, PE, Canada, 2017. [Google Scholar]
  66. Temmerman, S.; Horstman, E.M.; Krauss, K.W.; Mullarney, J.C.; Pelckmans, I.; Schoutens, K. Marshes and Mangroves as Nature-Based Coastal Storm Buffers. Annu. Rev. Mar. Sci. 2023, 15, 95–118. [Google Scholar] [CrossRef]
  67. Loke, L.H.L.; Heery, E.C.; Todd, P.A. Chapter 26—Shoreline Defenses. In World Seas: An Environmental Evaluation, 2nd ed.; Sheppard, C., Ed.; Academic Press: Cambridge, MA, USA, 2019; pp. 491–504. [Google Scholar]
  68. Taylor, A.R.; Boulanger, Y.; Price, D.T.; Cyr, D.; McGarrigle, E.; Rammer, W.; Kershaw, J.A. Rapid 21st century climate change projected to shift composition and growth of Canada’s Acadian Forest Region. For. Ecol. Manag. 2017, 405, 284–294. [Google Scholar] [CrossRef]
  69. Silva, M.; Hartling, L.A.; Field, S.A.; Teather, K. The effects of habitat fragmentation on amphibian species richness of Prince Edward Island. Can. J. Zool. 2003, 81, 563–573. [Google Scholar] [CrossRef]
  70. Xie, Y.; Sha, Z.; Yu, M. Remote sensing imagery in vegetation mapping: A review. J. Plant Ecol. 2008, 1, 9–23. [Google Scholar] [CrossRef]
  71. UN. Transforming Our World: The 2030 Agenda for Sustainable Development: Draft Resolution Referred to the United Nations Summit for the Adoption of the Post-2015 Development Agenda by the General Assembly at Its 69th Session; UN: New York, NY, USA, 2015; p. 35. [Google Scholar]
Figure 2. Maps of the PEI’s ecosystems between 2013 to 2022 based on Landsat 8 imagery.
Remotesensing 15 04742 g002
Figure 3. Ecosystem coverage between 2013 and 2022 (based on the data presented in Table 1).
Remotesensing 15 04742 g003
Figure 4. Confusion matrix for each LULC map compared to the reference year of 2000.
Remotesensing 15 04742 g004
Figure 5. Maps of sand dunes in 2022 based on Landsat 8 imagery. (AC are island-specific locations).
Remotesensing 15 04742 g005
Figure 6. Ecosystem impacts under various coastal flooding scenarios (based on 2022 Landsat 8 imagery). (A,B are island-specific locations).
Remotesensing 15 04742 g006
Figure 7. Ecosystem impacts under various storm surge scenarios (based on 2022 Landsat 8 imagery). (A,B are island-specific locations).
Remotesensing 15 04742 g007
Table 1. Ecosystem changes based on Landsat 8 imagery.
YearEvaluation IndexTotal Area (km2) *
Overall AccuracyKappaSand Dune and BeachSalt or Brackish MarshNo Open Water or Marsh ComponentSalt WaterOpen Water or Marsh ComponentForestOther
20130.950.953512987913424622938
20140.940.8836 (3%)11 (−8%)99 (1%)79 (−8%)132 (−1%)2449 (−1%)2952 (−8%)
20150.960.9339 (11%)9 (−25%)96 (−2%)75 (−5%)121 (−10%)2396 (−3%)3023 (3%)
20160.960.9537 (6%)10 (−17%)97 (−1%)76 (−4%)124 (−7%)2391 (−3%)3025 (3%)
20170.950.9239 (11%)10 (−17%)95 (−3%)76 (−4%)123 (−8%)2345 (−5%)3071 (5%)
20180.930.8739 (11%)10 (−17%)96 (−2%)82 (4%)115 (−14%)2340 (−5%)3075 (5%)
20190.960.9539 (11%)10 (−17%)96 (−2%)80 (1%)123 (−8%)2280 (−7%)3131 (7%)
20200.960.9337 (6%)10 (−17%)93 (−5%)76 (−4%)116 (−14%)2292 (−7%)3135 (7%)
20210.930.8936 (3%)10 (−17%)96 (−2%)75 (−5%)125 (−7%)2306 (−6%)3112 (6%)
20220.960.9539 (11%)10 (−17%)95 (−3%)75 (−5%)122 (−9%)2392 (−3%)3023 (3%)
* Note that the total area is shown in bold and percentage changes are compared to the year 2013.
Table 2. Ecosystem impacts under different coastal flooding scenarios.
ScenariosTotal Affected Area (km2) *
Sand Dune and BeachSalt or Brackish MarshNo Open Water or Marsh ComponentSalt WaterOpen Water or Marsh ComponentForestOther
Without Flooding3910957512223923023
Scenario 119 (49%)6 (60%)4 (4%)23 (31%)34 (28%)56 (2%)235 (8%)
Scenario 220 (51%)6 (60%)5 (5%)23 (31%)34 (28%)67 (3%)257 (9%)
Scenario 324 (62%)6 (60%)8 (8%)23 (31%)34 (28%)96 (4%)322 (11%)
Scenario 428 (72%)6 (60%)12 (13%)23 (31%)35 (29%)153 (6%)445 (15%)
* Note that these results are based on the satellite images from 2022. The total affected areas are shown in bold, and percentage changes are compared to the total area of each ecosystem.
Table 3. Ecosystem impacts under different storm surge scenarios.
Scenarios Total Affected Area (km2) *
Sand Dune and BeachSalt or Brackish MarshNo Open Water or Marsh ComponentSalt WaterOpen Water or Marsh ComponentForestOther
Without Storm Surge3910957512223923023
Storm Surge (1.0 m)10 (26%)3 (30%)3 (3%)4 (5%)13 (11%)28 (1%)140 (5%)
Storm Surge (2.0 m)15 (38%)3 (30%)5 (5%)4 (5%)15 (12%)71 (3%)230 (8%)
Storm Surge (3.0 m)18 (46%)3 (30%)10 (11%)4 (5%)15 (12%)118 (5%)332 (11%)
Storm Surge (4.0 m)20 (51%)3 (30%)13 (14%)4 (5%)16 (13%)167 (7%)438 (14%)
* Note that these results are based on the Landsat 8 satellite images from 2022. The total affected areas are shown in bold, and percentage changes are compared to the total area of each ecosystem.
Disclaimer/Publisher’s Note: The statements, opinions and data contained in all publications are solely those of the individual author(s) and contributor(s) and not of MDPI and/or the editor(s). MDPI and/or the editor(s) disclaim responsibility for any injury to people or property resulting from any ideas, methods, instructions or products referred to in the content.

