
An Overview of Coastline Extraction from Remote Sensing Data


Abstract
:1. Introduction
2. Materials and Methods
3. Available Data Sources for Remote Sensing Coastline Extraction
3.1. Satellite Remote Sensing Data
3.1.1. Optical Data
3.1.2. Radar Data
3.2. Non-Satellite Remote Sensing Data
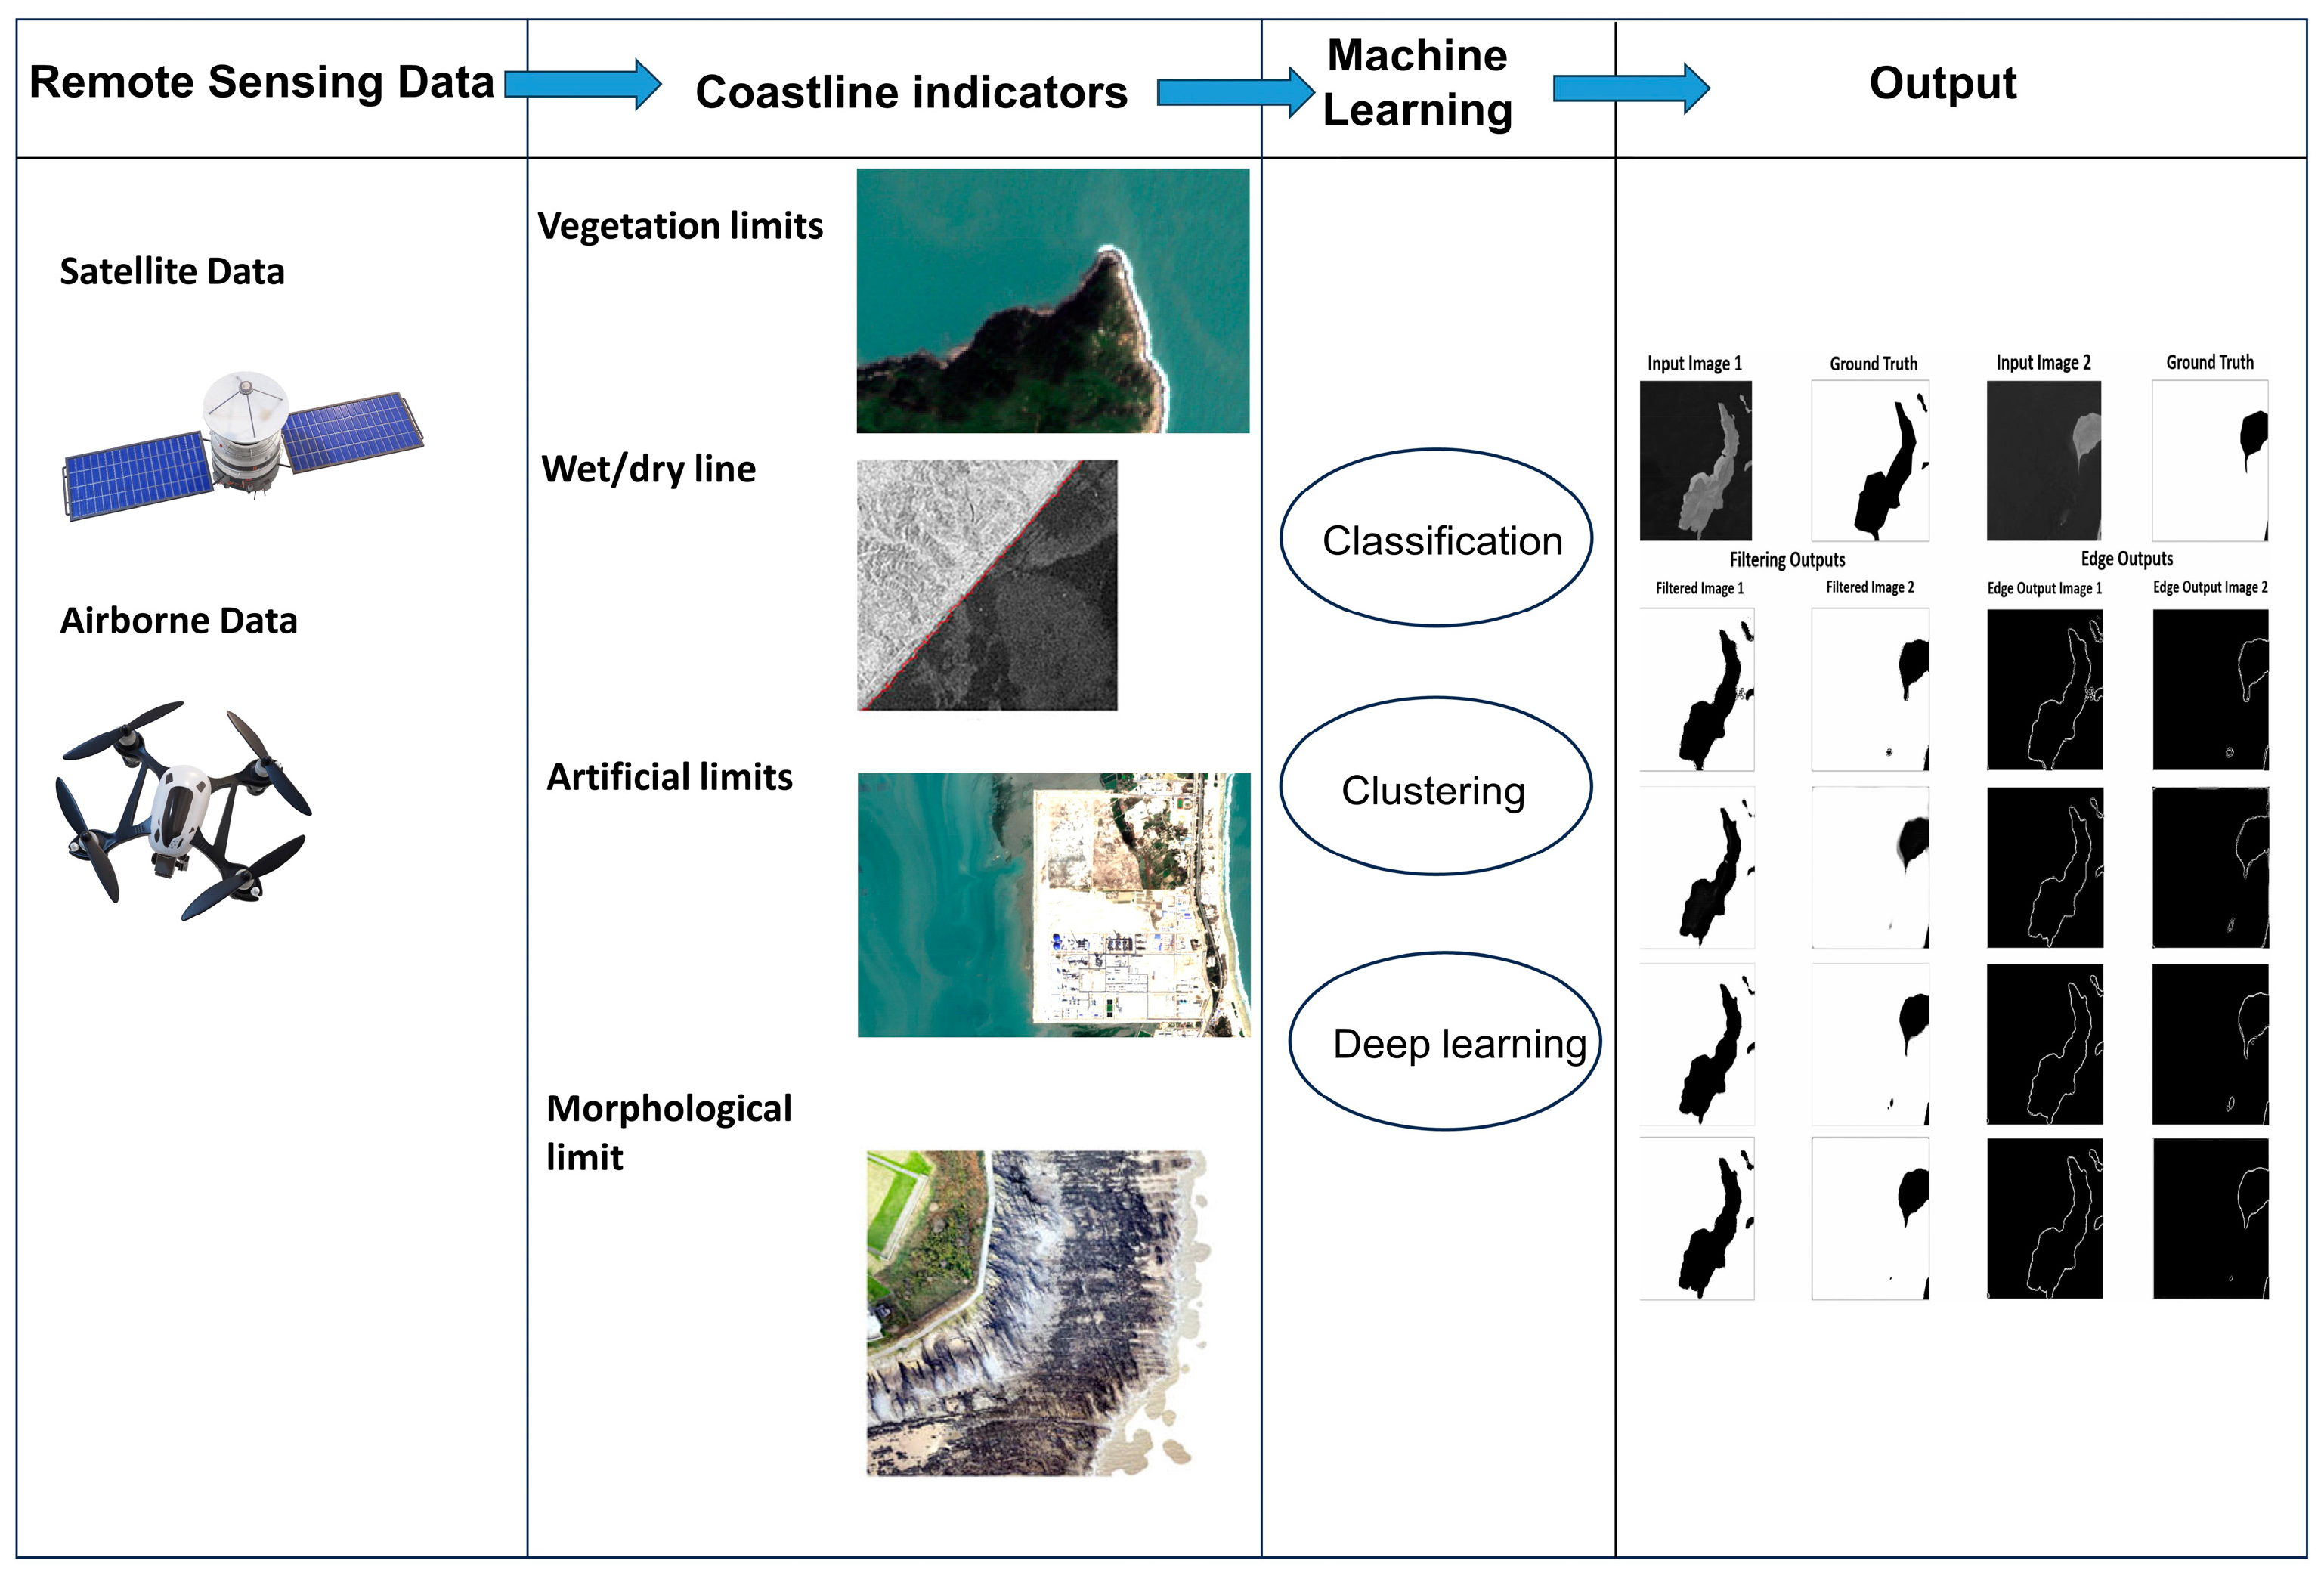
4. Coastline Types and Indicators
4.1. Coastline Types
4.2. Coastline Indicators
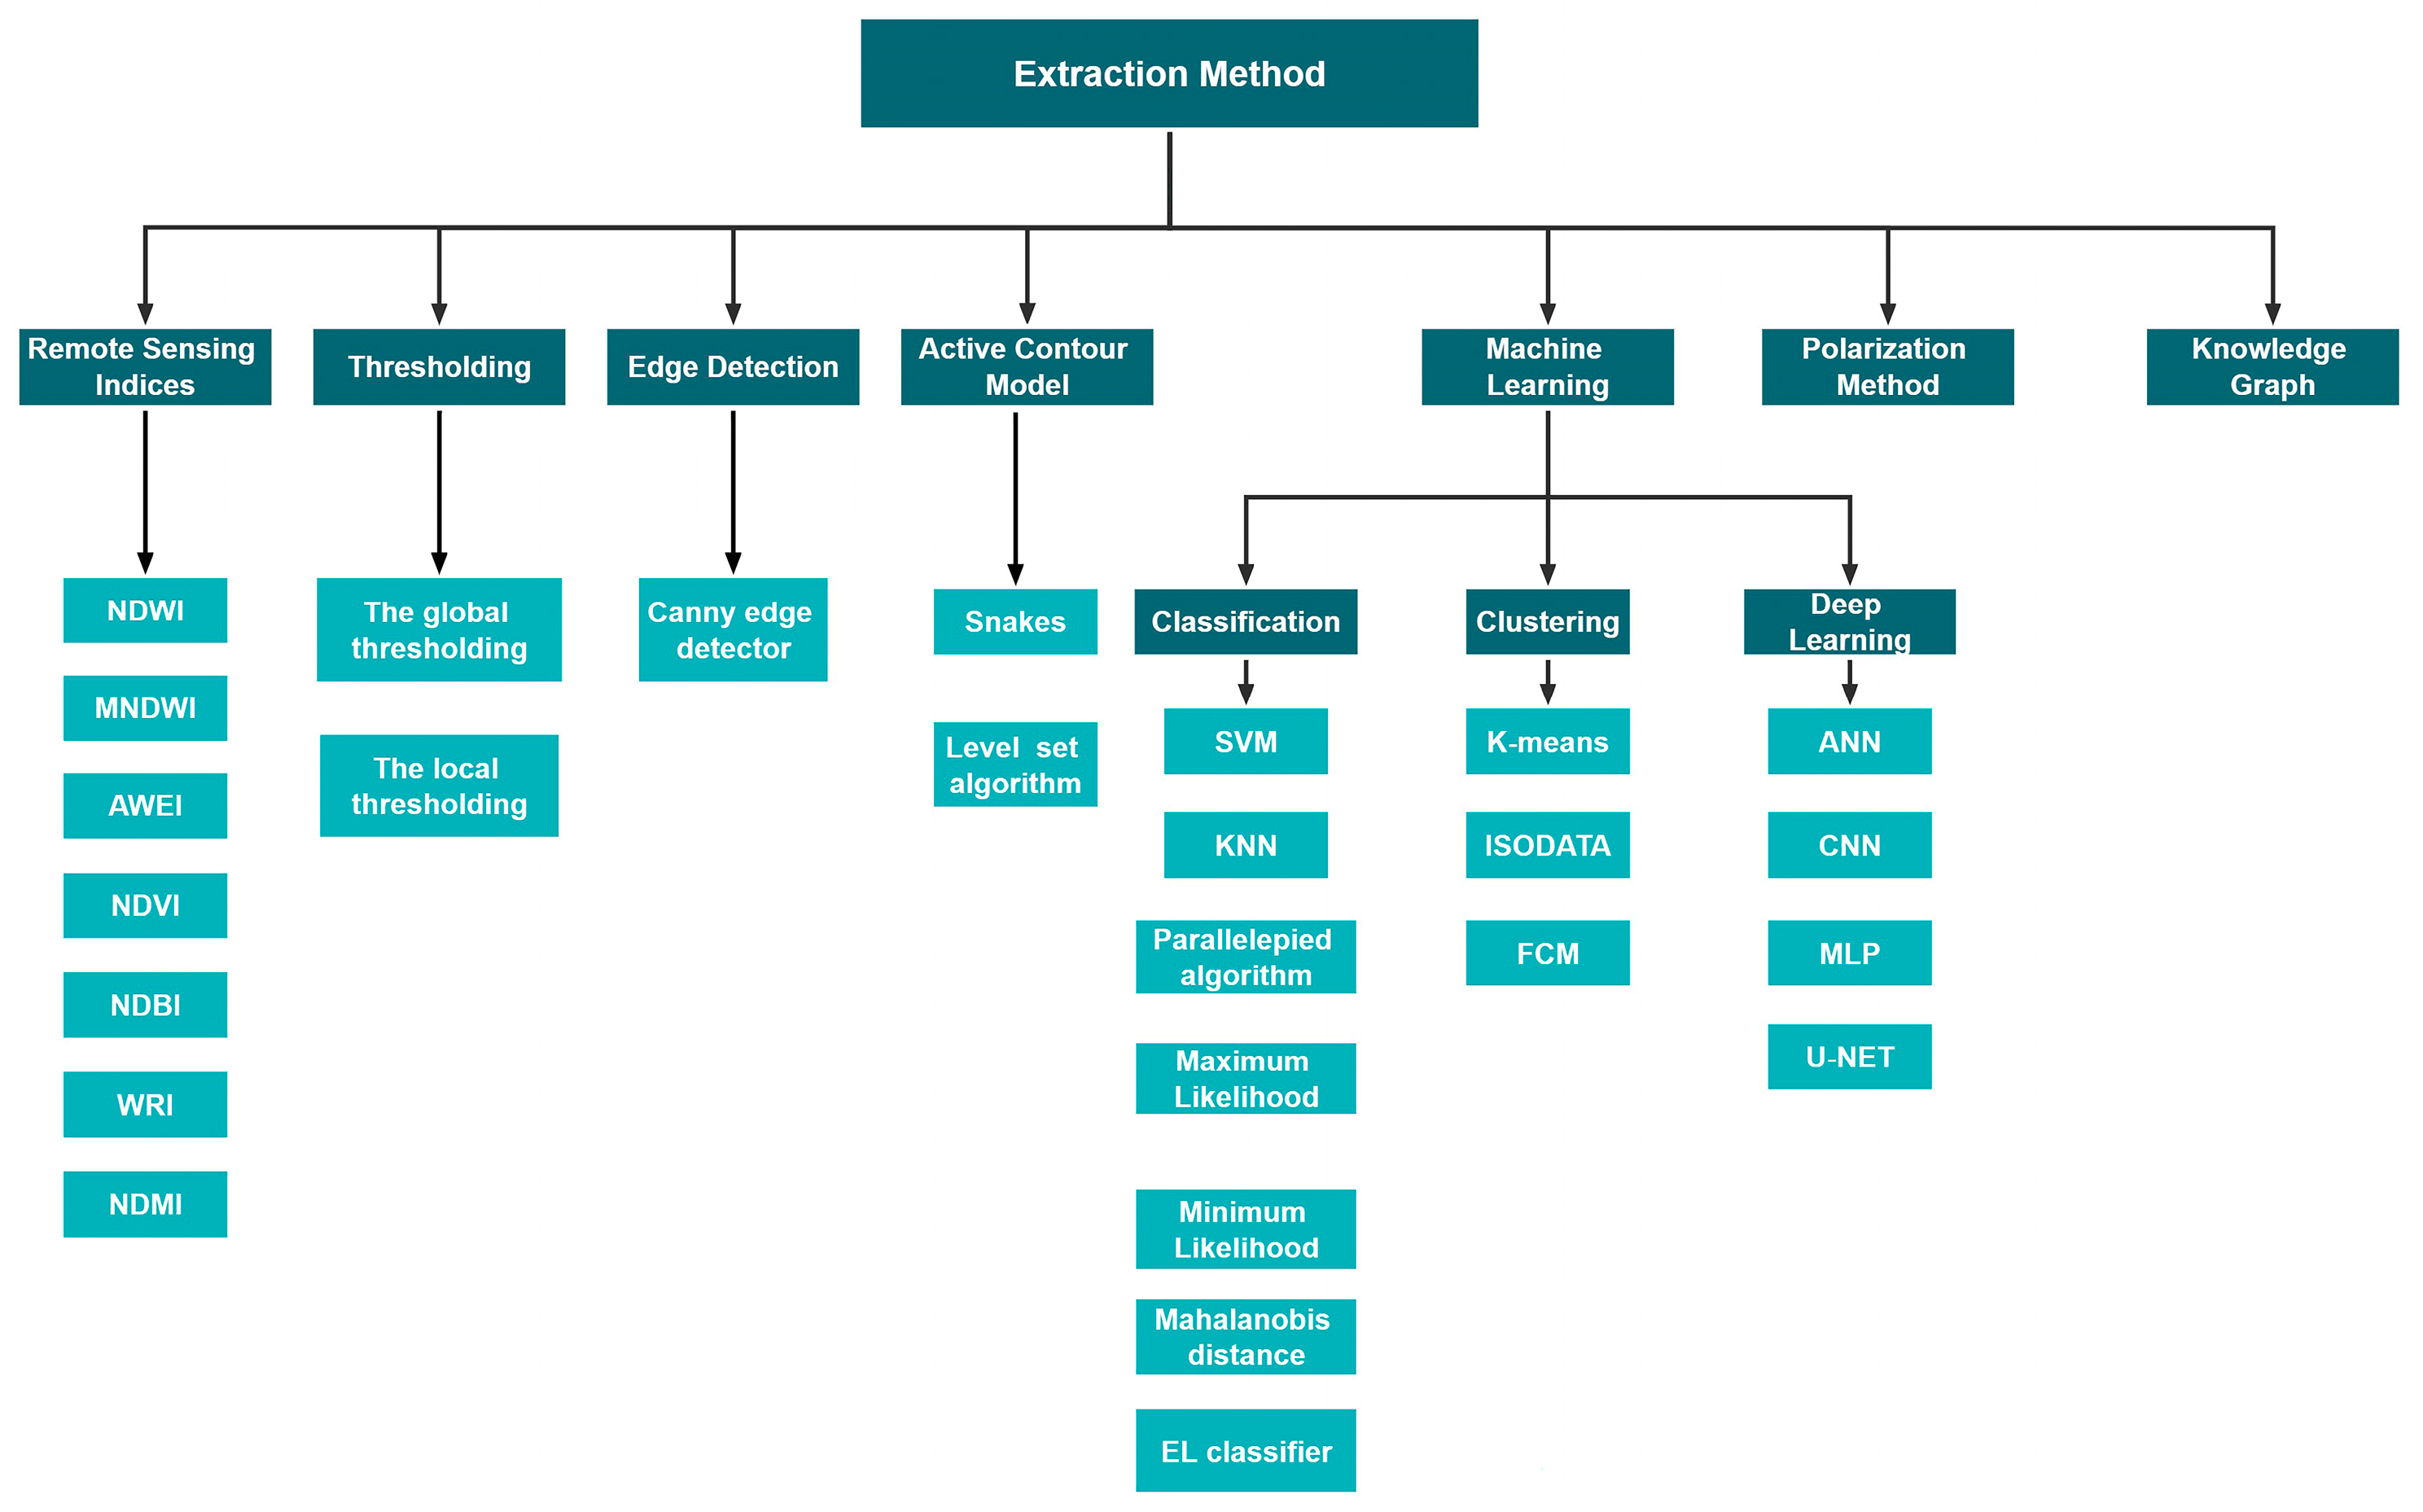
5. Coastline Extraction Techniques
5.1. Remote Sensing Indices
5.2. Thresholding
5.3. Edge Detection
5.4. Active Contour Model
5.5. Polarization Method
5.6. Machine Learning
5.6.1. Classification
5.6.2. Clustering
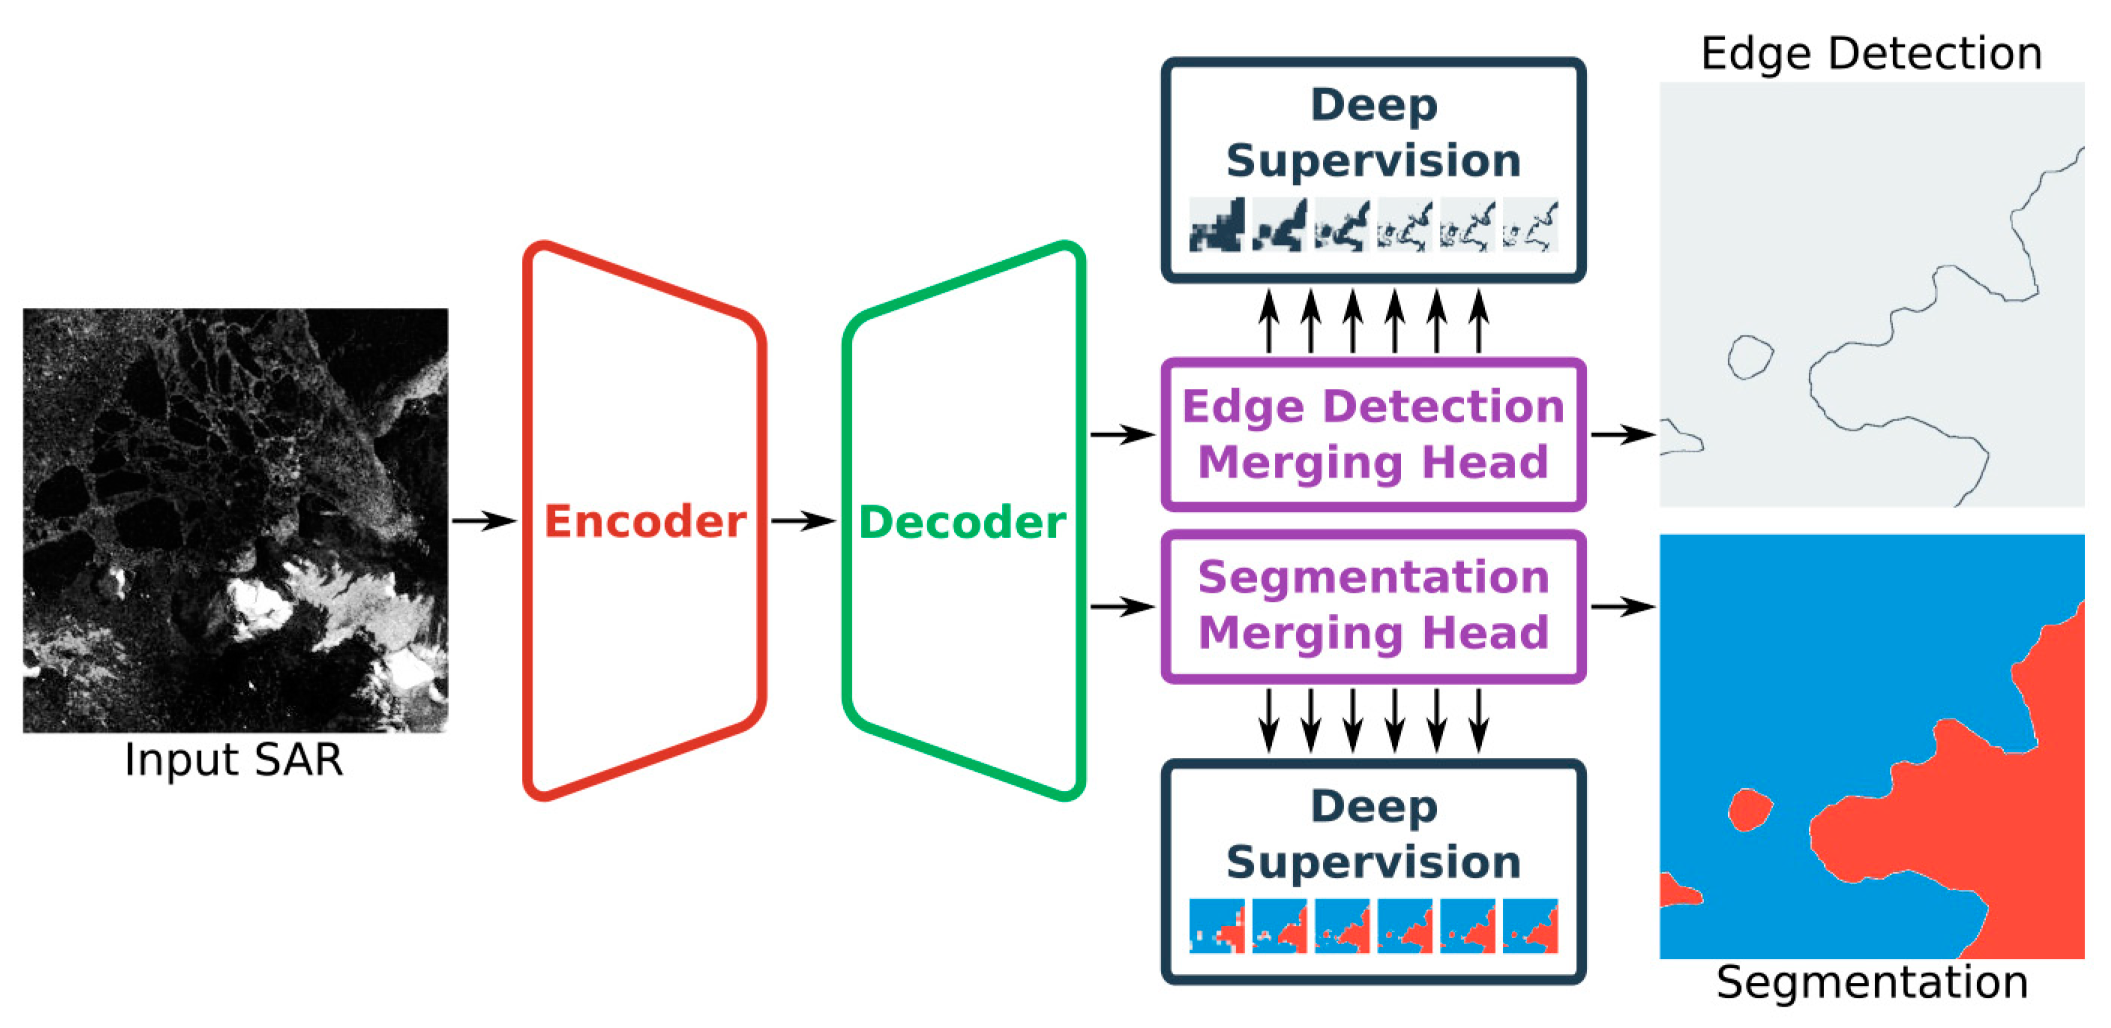
5.6.3. Deep Learning
- (1)
- Sentinel-2 Water Edges Dataset (SWED). This dataset contains 26,468 Sentinel-2 Level-1C images of size 256 × 256 and the corresponding sea–land segmented labels. Images annotations were created using a semi-supervised clustering procedure, followed by a manual verification and correction of mislabeled pixels [70].
- (2)
- Sea–land segmentation benchmark dataset. It contains 3361 Landsat-8 OLI images of size 512 × 512. The satellite images were manually labelled by dividing all their pixels into two classes: sea and land [134].
- (3)
- YTU-WaterNet. This dataset was also built based on Landsat-8 OLI data, using OpenStreetMap (OSM) water polygon data to generate binary segmentation labels [72]. The final dataset contains 1008 images with a size of 512 × 512.
5.7. Knowledge Graph
6. Discussions: Challenges and Future Prospective in Coastline Extraction
- (1)
- Construction of datasets. By leveraging machine learning methods, more valuable information can be extracted from big data. The introduction of deep learning improves the accuracy of the coastline binary classification problem, and the use of intelligent methods can achieve the fully automated extraction of coastlines. However, the absence of datasets can directly affect the effectiveness of these methods. Creating datasets can supply ample training and testing data for deep learning methods. At present, multiple datasets are available for remote sensing image classification and target recognition, but none of them can be directly applied to coastline extraction. Therefore, there is a need to establish standard coastline image datasets and promote the development of remote sensing image-based coastline extraction technology. The construction of coastline datasets requires two kinds of basic data: coastline data and remote sensing image. Coastline data can be obtained from scientific programs created by government agencies such as the National Oceanic and Atmospheric Administration. Remote sensing imageries are determined based on the date and location of selected stretches of coastline, with Sentinel 2 and Landsat8 currently in common use. The coastline data are combined with the water detection results on the remote sensing image to obtain the sea–land segmentation label, and finally the coastline is extracted with smaller label images. Coastline data can also be selected using Google Earth images or OpenStreeMap to match remote sensing images. Labeling methods include manual labeling and automatic labeling. Researchers can select the labeling method based on their requirements. When constructing the dataset, it can be considered to construct the dataset that can represent the characteristics of the coastline based on the processed data products such as the index image.
- (2)
- Select data with appropriate spatial resolution. Choosing a suitable spatial resolution is very important, considering the visibility and easy identification of the coastline indicator. When the eroded coastline size is smaller than the spatial resolution of the image, it is disregarded, leading to an inaccurate coastline extraction. Increasing the spatial resolution enhances indicator visibility but does not necessarily improve classification accuracy. For instance, in the case of coastline indicators such as vegetation lines, spectral characteristics effectively discriminate between vegetation and other features, while higher spatial resolution facilitates the precise extraction of coastlines. However, when the waterline is employed as an indicator, the combination of spectral similarity and extremely high spatial resolution can compromise extraction accuracy. Hence, selecting an appropriate spatial resolution based on specific scenarios during coastline extraction tasks is crucial.
- (3)
- Using hyperspectral data. The spectral characteristics of offshore areas exhibit a high degree of complexity, posing challenges in distinguishing the diverse features of coastal zones using single spectral information in conventional methods. However, with advancements in remote sensing sensors and the increasing availability of hyperspectral data, a novel approach emerges for extracting multi-band and abundant spectral information from coastlines. This enables the fusion of multiple bands’ spectral information to accurately delineate the distinctive characteristics of coastal zones.
- (4)
- Coping with the effects of the seasons and weather. In order to extract reliable indicators of coastline dynamics, it is essential to consider seasonal variations. The composition of many beaches undergoes changes throughout the seasons, such as shifts from sand to gravel and fluctuations in vegetation growth or withering. These alterations not only impact the visibility and accuracy of coastline indicators but also influence the slope of the coastal zone. Consequently, a uniform method for coastline extraction may not be suitable across different seasons. Therefore, we argue that conducting seasonal phase-based studies on coastline extraction and erosion would yield more valuable insights. Additionally, during periods of strong winds leading to large waves at sea, interference with transient waterline detection becomes particularly prominent in SAR data-based coastline extraction, thus, weather conditions and climate factors should be considered as they can significantly affect the outcome of coastline extraction efforts.
- (5)
- Improve the availability of SAR data. The separation of land and sea and the extraction of coastline using SAR data are highly feasible; however, due to the noisy nature of the data and difficulties in preprocessing, decoding accuracy is often low. The strong backscattering caused by wind and wave modulation on the sea surface greatly reduces contrast between land and sea, resulting in weak boundaries that are difficult to extract.
- (6)
- Combine various methods. From the analysis of this whole paper, it can be seen that various methods for the automatic extraction of coastlines from remote sensing images compiled in this paper have certain limitations, and each method is only for a specific coastline type, lacking universality. Therefore, in subsequent work, we can consider combining various methods and integrating the advantages of each method to improve the coastline extraction effect.
- (7)
- Realize coastline extraction with sub-pixel accuracy. The current coastline extraction experiments show that pixel-level extraction accuracy can be achieved, i.e., classification of each pixel. In fact, due to the transitional and variable nature of the coastline, the same pixel can be partially classified as a seawater region and partially classified as a land region. In data applications with low spatial resolution, especially for multispectral as well as hyperspectral data, there is a very typical phenomenon of mixed pixels, and it is necessary to perform pixels such that coastline extraction can be achieved at sub-pixel level accuracy and more accurate monitoring of coastlines. At the same time, the complex microtopography of the coastline can be realized.
- (8)
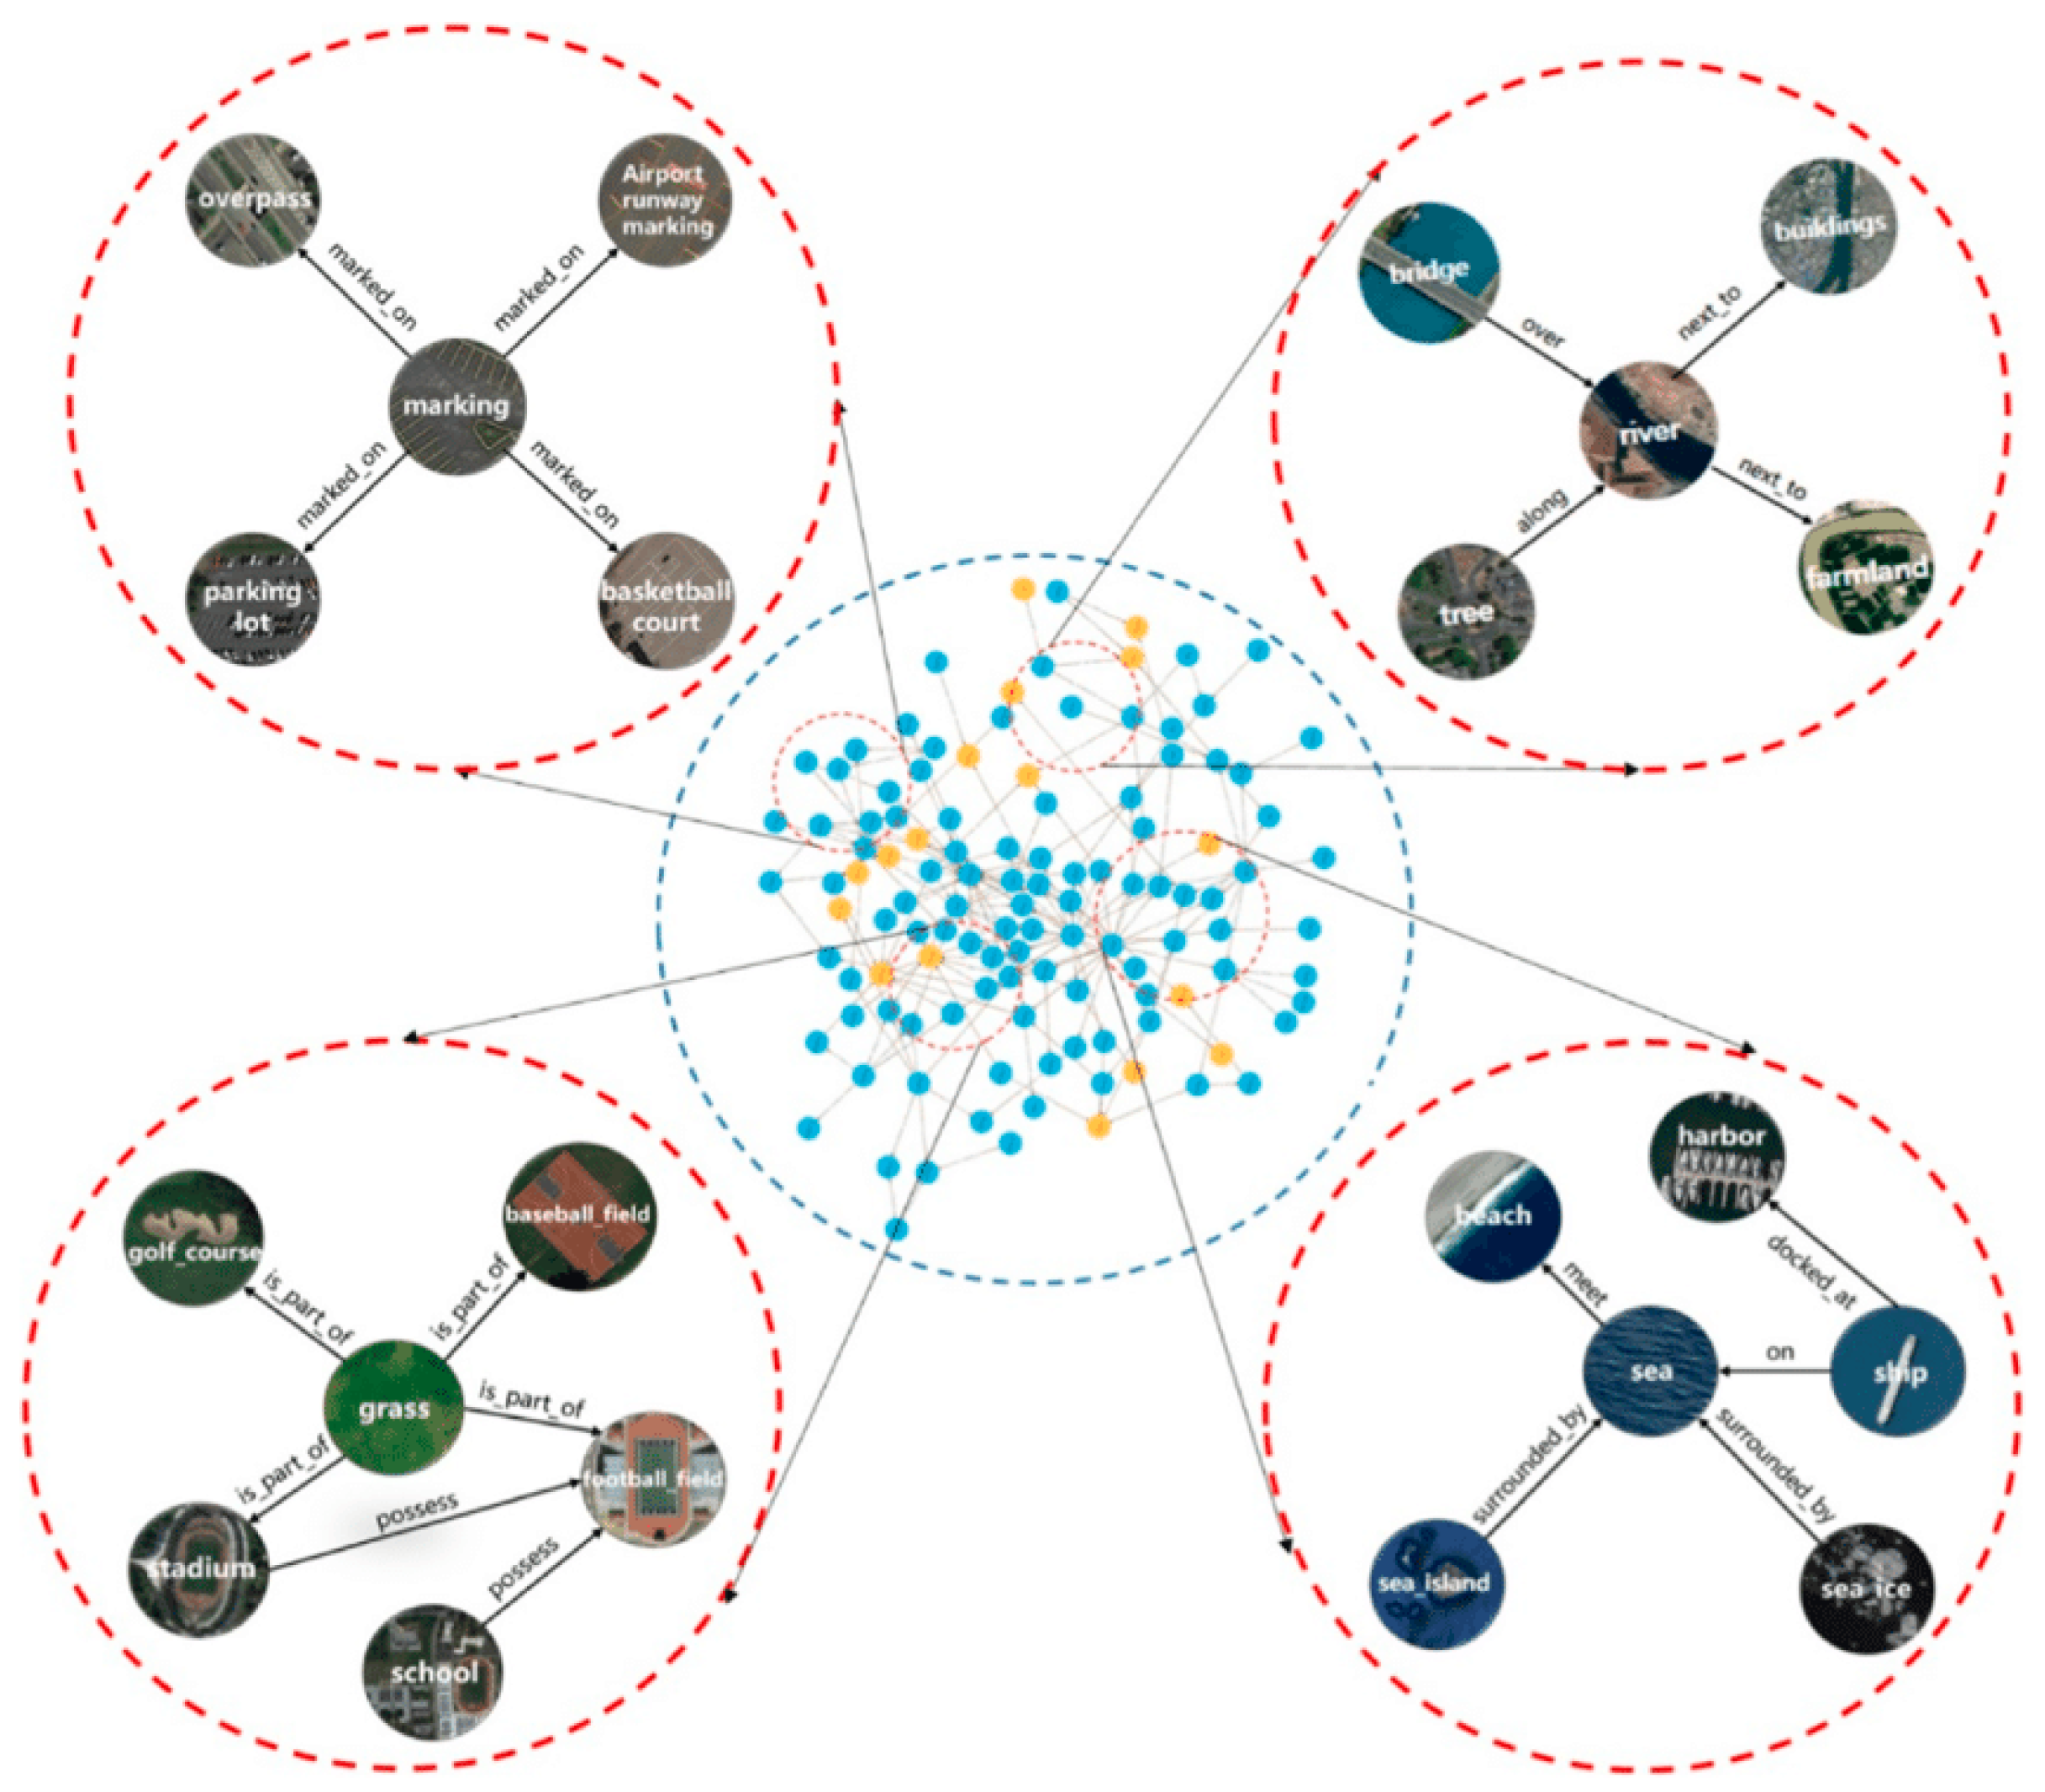
- Construction of remote sensing knowledge graphs. We will try to extend CSKG to the remote sensing scene knowledge graph (RSKG). Incorporating a larger repository of relevant structured knowledge graphs (RSKG) can enhance the availability of comprehensive prior knowledge, thereby facilitating the generation of more refined semantic representations for both RS scenarios and target classes. Monitoring of coastline changes can be achieved from a single-state remote sensing ontology structure to a sequential state ontology structure.
7. Conclusions
Author Contributions
Funding
Data Availability Statement
Acknowledgments
Conflicts of Interest
References
- Hossain, M.S.; Yasir, M.; Wang, P.; Ullah, S.; Jahan, M.; Hui, S.; Zhao, Z. Automatic shoreline extraction and change detection: A study on the southeast coast of Bangladesh. Mar. Geol. 2021, 441, 106628. [Google Scholar] [CrossRef]
- Cui, J.; Ji, W.; Wang, P.; Zhu, M.; Liu, Y. Spatial–Temporal Changes in Land Use and Their Driving Forces in the Circum-Bohai Coastal Zone of China from 2000 to 2020. Remote Sens. 2023, 15, 2372. [Google Scholar]
- San, B.T.; Ulusar, U.D. An approach for prediction of shoreline with spatial uncertainty mapping (SLiP-SUM). Int. J. Appl. Earth Obs. Geoinf. 2018, 73, 546–554. [Google Scholar] [CrossRef]
- Yang, S.; Liang, J.; Li, X.; Yi, Y.; Zhu, Z.; Li, X.; Chen, X.; Li, S.; Zhai, Y.; Pei, Z. The Impacts of Hydrology and Climate on Hydrological Connectivity in a Complex River–Lake Floodplain System Based on High Spatiotemporal Resolution Images. Water 2022, 14, 1836. [Google Scholar] [CrossRef]
- Kuleli, T.; Guneroglu, A.; Karsli, F.; Dihkan, M. Automatic detection of shoreline change on coastal Ramsar wetlands of Turkey. Ocean. Eng. 2011, 38, 1141–1149. [Google Scholar] [CrossRef]
- Paravolidakis, V.; Ragia, L.; Moirogiorgou, K.; Zervakis, M. Automatic Coastline Extraction Using Edge Detection and Optimization Procedures. Geosciences 2018, 8, 407. [Google Scholar] [CrossRef]
- Susilowati, Y.; Nur, W.H.; Sulaiman, A.; Kumoro, Y. Study of dynamics of coastal sediment cell boundary in Cirebon coastal area based on integrated shoreline Montecarlo model and remote sensing data. Reg. Stud. Mar. Sci. 2022, 52, 102268. [Google Scholar] [CrossRef]
- Yu, T.; Xu, S.W.; Tao, B.Y.; Shao, W.Z. Coastline detection using optical and synthetic aperture radar images. Adv. Space Res. 2022, 70, 70–84. [Google Scholar] [CrossRef]
- Lawrence, P.J.; Evans, A.J.; Jackson-Bue, T.; Brooks, P.R.; Crowe, T.P.; Dozier, A.E.; Jenkins, S.R.; Moore, P.J.; Williams, G.J.; Davies, A.J. Artificial shorelines lack natural structural complexity across scales. Proc. Biol. Sci. 2021, 288, 20210329. [Google Scholar] [CrossRef]
- Behling, R.; Milewski, R.; Chabrillat, S. Spatiotemporal shoreline dynamics of Namibian coastal lagoons derived by a dense remote sensing time series approach. Int. J. Appl. Earth Obs. Geoinf. 2018, 68, 262–271. [Google Scholar] [CrossRef]
- Latifovic, R.; Pouliot, D.; Campbell, J. Assessment of Convolution Neural Networks for Surficial Geology Mapping in the South Rae Geological Region, Northwest Territories, Canada. Remote Sens. 2018, 10, 307. [Google Scholar] [CrossRef]
- Sang, X.; Xue, L.; Ran, X.; Li, X.; Liu, J.; Liu, Z. Intelligent High-Resolution Geological Mapping Based on SLIC-CNN. ISPRS Int. J. Geo Inf. 2020, 9, 99. [Google Scholar] [CrossRef]
- García-Rubio, G.; Huntley, D.; Russell, P. Evaluating shoreline identification using optical satellite images. Mar. Geol. 2015, 359, 96–105. [Google Scholar] [CrossRef]
- Pina, P.; Vieira, G. UAVs for Science in Antarctica. Remote Sens. 2022, 14, 1610. [Google Scholar] [CrossRef]
- Zhao, Q.; Yu, L.; Du, Z.; Peng, D.; Hao, P.; Zhang, Y.; Gong, P. An Overview of the Applications of Earth Observation Satellite Data: Impacts and Future Trends. Remote Sens. 2022, 14, 1863. [Google Scholar] [CrossRef]
- Santos, C.A.G.; Nascimento, T.; Mishra, M.; Silva, R.M.D. Analysis of long- and short-term shoreline change dynamics: A study case of Joao Pessoa city in Brazil. Sci. Total Environ. 2021, 769, 144889. [Google Scholar] [CrossRef]
- Karaman, M. Comparison of thresholding methods for shoreline extraction from Sentinel-2 and Landsat-8 imagery: Extreme Lake Salda, track of Mars on Earth. J. Environ. Manag. 2021, 298, 113481. [Google Scholar] [CrossRef]
- Demir, N.; Kaynarca, M.; Oy, S. Extraction of Coastlines with Fuzzy Approach Using Sentinel-1 Sar Image. Remote Sens. Spat. Inf. Sci. 2016, XLI-B7, 747–751. [Google Scholar] [CrossRef]
- Wang, Y.; Liu, Y.; Jin, S.; Sun, C.; Wei, X. Evolution of the topography of tidal flats and sandbanks along the Jiangsu coast from 1973 to 2016 observed from satellites. ISPRS J. Photogramm. Remote Sens. 2019, 150, 27–43. [Google Scholar] [CrossRef]
- Xu, S.; Ye, N.; Xu, S. A new method for shoreline extraction from airborne LiDAR point clouds. Remote Sens. Lett. 2019, 10, 496–505. [Google Scholar] [CrossRef]
- Wei, X.; Zheng, W.; Xi, C.; Shang, S. Shoreline Extraction in SAR Image Based on Advanced Geometric Active Contour Model. Remote Sens. 2021, 13, 642. [Google Scholar] [CrossRef]
- Asokan, A.; Anitha, J.; Ciobanu, M.; Gabor, A.; Naaji, A.; Hemanth, D.J. Image processing techniques for analysis of satellite images for historical maps classification-an overview. Appl. Sci. 2020, 10, 4207. [Google Scholar] [CrossRef]
- Babbar, J.; Rathee, N. Satellite Image Analysis: A Review. In Proceedings of the IEEE International Conference on Electrical, Computer and Communication Technologies, Tamil Nadu, India, 20–22 February 2019; pp. 1–6. [Google Scholar] [CrossRef]
- Shirmard, H.; Farahbakhsh, E.; Müller, R.D.; Chandra, R. A review of machine learning in processing remote sensing data for mineral exploration. Remote Sens. Environ. 2022, 268, 112750. [Google Scholar] [CrossRef]
- Li, Y.; Kong, D.; Zhang, Y.; Tan, Y.; Chen, L. Robust deep alignment network with remote sensing knowledge graph for zero-shot and generalized zero-shot remote sensing image scene classification. ISPRS J. Photogramm. Remote Sens. 2021, 179, 145–158. [Google Scholar] [CrossRef]
- Cracknell, M.J.; Reading, A.M. Geological mapping using remote sensing data: A comparison of five machine learning algorithms, their response to variations in the spatial distribution of training data and the use of explicit spatial information. Comput. Geosci. 2014, 63, 22–33. [Google Scholar] [CrossRef]
- Ahmed, S.A.; Harishnaika, N. Land use and land cover classification using machine learning algorithms in google earth engine. Earth Sci. Inform. 2023, 1–17. [Google Scholar] [CrossRef]
- Yao, J.; Wu, J.; Xiao, C.; Zhang, Z.; Li, J. The Classification Method Study of Crops Remote Sensing with Deep Learning, Machine Learning, and Google Earth Engine. Remote Sens. 2022, 14, 2758. [Google Scholar] [CrossRef]
- Özkaya, U. Automatic Target Recognition (ATR) from SAR Imaginary by Using Machine Learning Techniques. Eur. J. Sci. Technol. 2020, 165–169. [Google Scholar] [CrossRef]
- Mao, Y.; Harris, D.L.; Xie, Z.; Phinn, S. Efficient measurement of large-scale decadal shoreline change with increased accuracy in tide-dominated coastal environments with Google Earth Engine. ISPRS J. Photogramm. Remote Sens. 2021, 181, 385–399. [Google Scholar] [CrossRef]
- Hossen, M.F.; Sultana, N. Shoreline change detection using DSAS technique: Case of Saint Martin Island, Bangladesh. Remote Sens. Appl. Soc. Environ. 2023, 30, 100943. [Google Scholar] [CrossRef]
- Li, W.; Ren, X.; Jing, A.; Han, J.; Xing, B. Remote Sensing Monitoring of Dynamic Change in Woodland-Grassland-Wetland: An Example from Northern Zhangjiakou-Chengde, China. In Proceedings of the 3rd International Conference on Geology, Mapping and Remote Sensing (ICGMRS), Zhoushan, China, 24 April 2022; pp. 740–743. [Google Scholar]
- Pardo-Pascual, J.E.; Almonacid-Caballer, J.; Ruiz, L.A.; Palomar-Vázquez, J. Automatic extraction of shorelines from Landsat TM and ETM+ multi-temporal images with subpixel precision. Remote Sens. Environ. 2012, 123, 1–11. [Google Scholar] [CrossRef]
- Li, W.; Gong, P. Continuous monitoring of coastline dynamics in western Florida with a 30-year time series of Landsat imagery. Remote Sens. Environ. 2016, 179, 196–209. [Google Scholar] [CrossRef]
- Tong, S.S.; Deroin, J.P.; Pham, T.L. An optimal waterline approach for studying tidal flat morphological changes using remote sensing data: A case of the northern coast of Vietnam. Estuar. Coast. Shelf Sci. 2020, 236, 106613. [Google Scholar] [CrossRef]
- Zhou, H.; Wang, Z.; Wu, M.; He, T.; Wan, H.; Jindi, W.; Liang, S. Land surface albedo estimation with Chinese GF-1 WFV data in Northwest China. IEEE J. Sel. Top. Appl. Earth Obs. Remote Sens. 2021, 15, 849–861. [Google Scholar] [CrossRef]
- Zhou, X.; Yang, L.; Wang, W.; Chen, B. UAV Data as an Alternative to Field Sampling to Monitor Vineyards Using Machine Learning Based on UAV/Sentinel-2 Data Fusion. Remote Sens. 2021, 13, 457. [Google Scholar] [CrossRef]
- Sur, K.; Verma, V.K.; Pateriya, B. Surface water estimation at regional scale using hybrid techniques in GEE environment-A case study on Punjab State of India. Remote Sens. Appl. Soc. Environ. 2021, 24, 100625. [Google Scholar] [CrossRef]
- Dai, Q.; Chenfeng, C.; Wang, S. Spatiotemporal variation and sustainability of NDVI in the Yellow River basin. Irrig. Drain. 2022, 71, 1304–1318. [Google Scholar] [CrossRef]
- Boggs, G.S. Assessment of SPOT 5 and QuickBird remotely sensed imagery for mapping tree cover in savannas. Int. J. Appl. Earth Obs. Geoinf. 2010, 12, 217–224. [Google Scholar] [CrossRef]
- Aedla, R.; Dwarakish, G.S.; Reddy, D.V. Automatic Shoreline Detection and Change Detection Analysis of Netravati-GurpurRivermouth Using Histogram Equalization and Adaptive Thresholding Techniques. Aquat. Procedia 2015, 4, 563–570. [Google Scholar] [CrossRef]
- Pour, A.B.; Ranjbar, H.; Sekandari, M.; El-Wahed, M.A.; Hossain, M.S.; Hashim, M.; Yousefi, M.; Zoheir, B.; Wambo, J.D.T.; Muslim, A.M. 2-Remote Sensing for Mineral Exploration. In Geospatial Analysis Applied to Mineral Exploration; Pour, A.B., Parsa, M., Eldosouky, A.M., Eds.; Elsevier: Amsterdam, The Netherlands, 2023; pp. 17–149. [Google Scholar] [CrossRef]
- Lv, J.; Jie, C.; Huang, Z.; Wan, H.; Zhou, C.; Wang, D.; Wu, B.; Sun, L. An Anchor-Free Detection Algorithm for SAR Ship Targets with Deep Saliency Representation. Remote Sens. 2022, 15, 103. [Google Scholar] [CrossRef]
- Li, B.; Fan, G.; Zhao, T.; Deng, Z.; Yu, Y. Retrieval of DTM under Complex Forest Stand Based on Spaceborne LiDAR Fusion Photon Correction. Remote Sens. 2022, 14, 218. [Google Scholar] [CrossRef]
- Guo, H.; Fu, W.; Guang, L. Scientific Satellite and Moon-Based Earth Observation for Global Change; Springer: Singapore, 2019. [Google Scholar] [CrossRef]
- Ding, X.; Nunziata, F.; Li, X.; Migliaccio, M. Performance Analysis and Validation of Waterline Extraction Approaches Using Single- and Dual-Polarimetric SAR Data. IEEE J. Sel. Top. Appl. Earth Obs. Remote Sens. 2015, 8, 1019–1027. [Google Scholar] [CrossRef]
- Adade, R.; Aibinu, A.M.; Ekumah, B.; Asaana, J. Unmanned Aerial Vehicle (UAV) applications in coastal zone management-a review. Env. Monit. Assess. 2021, 193, 154. [Google Scholar] [CrossRef]
- Young, S.S.; Rao, S.; Dorey, K. Monitoring the erosion and accretion of a human-built living shoreline with drone technology. Environ. Chall. 2021, 5, 100383. [Google Scholar] [CrossRef]
- Troy, C.D.; Cheng, Y.-T.; Lin, Y.-C.; Habib, A. Rapid lake Michigan shoreline changes revealed by UAV LiDAR surveys. Coast. Eng. 2021, 170, 104008. [Google Scholar] [CrossRef]
- Song, Y.; Liu, F.; Ling, F.; Yue, L. Automatic Semi-Global Artificial Shoreline Subpixel Localization Algorithm for Landsat Imagery. Remote Sens. 2019, 11, 1779. [Google Scholar] [CrossRef]
- Papakonstantinou, A.; Topouzelis, K.; Pavlogeorgatos, G. Coastline Zones Identification and 3D Coastal Mapping Using UAV Spatial Data. ISPRS Int. J. Geo-Inf. 2016, 5, 75. [Google Scholar] [CrossRef]
- Available online: https://response.restoration.noaa.gov/esi-shoreline-types (accessed on 30 September 2023).
- Yang, B.; Hwang, C.; Cordell, H.K. Use of LiDAR shoreline extraction for analyzing revetment rock beach protection: A case study of Jekyll Island State Park, USA. Ocean. Coast. Manag. 2012, 69, 1–15. [Google Scholar] [CrossRef]
- Limber, P.W.; Brad Murray, A.; Adams, P.N.; Goldstein, E.B. Unraveling the dynamics that scale cross-shore headland relief on rocky coastlines: 1. Model development. J. Geophys. Res. Earth Surf. 2014, 119, 854–873. [Google Scholar] [CrossRef]
- Yao, H.; Jiang, C.; Qian, Y. Developing Networks Using Artificial Intelligence; Springer: Berlin/Heidelberg, Germany, 2019. [Google Scholar] [CrossRef]
- Wang, C.; Zhang, J.; Song, P. An intelligent coastline interpretation of several types of seacoasts from TM/ETM+ images based on rules. Acta Oceanol. Sin. 2014, 33, 89–96. [Google Scholar] [CrossRef]
- Hagenaars, G.; de Vries, S.; Luijendijk, A.P.; de Boer, W.P.; Reniers, A.J.H.M. On the accuracy of automated shoreline detection derived from satellite imagery: A case study of the sand motor mega-scale nourishment. Coast. Eng. 2018, 133, 113–125. [Google Scholar] [CrossRef]
- Sagar, S.; Roberts, D.; Bala, B.; Lymburner, L. Extracting the intertidal extent and topography of the Australian coastline from a 28 year time series of Landsat observations. Remote Sens. Environ. 2017, 195, 153–169. [Google Scholar] [CrossRef]
- Visschers, L.; Santos, C.; Franco, A. Accelerated migration of mangroves indicate large-scale saltwater intrusion in Amazon coastal wetlands. Sci. Total Environ. 2022, 836, 155679. [Google Scholar] [CrossRef]
- Toure, S.; Diop, O.; Kpalma, K.; Maiga, A. Shoreline Detection using Optical Remote Sensing: A Review. ISPRS Int. J. Geo Inf. 2019, 8, 75. [Google Scholar] [CrossRef]
- Bishop-Taylor, R.; Nanson, R.; Sagar, S.; Lymburner, L. Mapping Australia’s dynamic coastline at mean sea level using three decades of Landsat imagery. Remote Sens. Environ. 2021, 267, 112734. [Google Scholar] [CrossRef]
- van der Werff, H.M.A. Mapping shoreline indicators on a sandy beach with supervised edge detection of soil moisture differences. Int. J. Appl. Earth Obs. Geoinf. 2019, 74, 231–238. [Google Scholar] [CrossRef]
- McAllister, E.; Payo, A.; Novellino, A.; Dolphin, T.; Medina-Lopez, E. Multispectral satellite imagery and machine learning for the extraction of shoreline indicators. Coast. Eng. 2022, 174, 104102. [Google Scholar] [CrossRef]
- Nunziata, F.; Migliaccio, M.; Li, X. Dual-Polarized COSMO-SkyMed SAR Data for Coastline Detection. In Proceedings of the IEEE International Geoscience and Remote Sensing Symposium, Munich, Germany, 22–27 July 2012; pp. 5109–5112. [Google Scholar]
- Bengoufa, S.; Niculescu, S.; Mihoubi, M.K.; Belkessa, R.; Abbad, K. Rocky Shoreline Extraction Using a Deep Learning Model and Object-Based Image Analysis. Int. Arch. Photogramm. Remote Sens. Spat. Inf. Sci. 2021, XLIII-B3-2021, 23–29. [Google Scholar] [CrossRef]
- Klinger, T.; Heipke, C.; Ott, N.; Schenke, H.W.; Ziems, M. Automated extraction of the Antarctic coastline using snakes. Int. Arch. Photogramm. Remote Sens. Spat. Inf. Sci. ISPRS Arch. 2012, XXXVIII Part 4, 38. [Google Scholar]
- Seale, C.; Redfern, T.; Chatfield, P.; Luo, C.; Dempsey, K. Coastline detection in satellite imagery: A deep learning approach on new benchmark data. Remote Sens. Environ. 2022, 278, 113044. [Google Scholar] [CrossRef]
- Aghdami-Nia, M.; Shah-Hosseini, R.; Rostami, A.; Homayouni, S. Automatic coastline extraction through enhanced sea-land segmentation by modifying Standard U-Net. Int. J. Appl. Earth Obs. Geoinf. 2022, 109, 102785. [Google Scholar] [CrossRef]
- Ishaand, I.B.; Adib, M.R.M. Shoreline monitoring using Unmanned Aerial Vehicle (UAV) at Regency Beach, Port Dickson. IOP Conf. Ser. Mater. Sci. Eng. 2021, 1144, 012060. [Google Scholar] [CrossRef]
- Acar, U.; Bayram, B.; Sanli, F.B.; Abdikan, S.; Sunar, F.; Cetin, H.I. An Algorithm for Coastline Detection Using Sar Images. Int. Arch. Photogramm. Remote Sens. Spat. Inf. Sci. 2012, XXXIX-B3, 457–460. [Google Scholar] [CrossRef]
- Tajima, Y.; Wu, L.; Watanabe, K. Development of a Shoreline Detection Method Using an Artificial Neural Network Based on Satellite SAR Imagery. Remote Sens. 2021, 13, 2254. [Google Scholar] [CrossRef]
- Erdem, F.; Bayram, B.; Bakirman, T.; Bayrak, O.C.; Akpinar, B. An ensemble deep learning based shoreline segmentation approach (WaterNet) from Landsat 8 OLI images. Adv. Space Res. 2021, 67, 964–974. [Google Scholar] [CrossRef]
- Abd Manaf, S.; Sulaiman, M.; Husin, N.; Zainuddin, M.; Shafri, H.; Shafri, M. Majority voting of ensemble classifiers to improve shoreline extraction of medium resolution satellite images. J. Theor. Appl. Inf. Technol. 2017, 3095, 6. [Google Scholar]
- Natarajan, S. Isodata classification technique to assess the shoreline changes of Kolachel to Kayalpattanam coast. Int. J. Eng. Res. Technol. 2018, 3. [Google Scholar]
- Tong, Q.; Shan, J.; Zhu, B.; Ge, X.; Sun, X.; Liu, Z. Object-Oriented Coastline Classification and Extraction from Remote Sensing Imagery. In Proceedings of the Remote Sensing of the Environment: 18th National Symposium on Remote Sensing of China, Beijing, China, 7–10 September 2007. [Google Scholar]
- Phan, M.H.; Stive, M.J.F. Managing mangroves and coastal land cover in the Mekong Delta. Ocean Coast. Manag. 2022, 219, 106013. [Google Scholar] [CrossRef]
- Rokni, K.; Ahmad, A.; Selamat, A.; Hazini, S. Water Feature Extraction and Change Detection Using Multitemporal Landsat Imagery. Remote Sens. 2014, 6, 4173–4189. [Google Scholar] [CrossRef]
- Azad, S.T.; Moghaddassi, N.; Sayehbani, M. Digital Shoreline Analysis System improvement for uncertain data detection in measurements. Environ. Monit. Assess. 2022, 194, 646. [Google Scholar] [CrossRef]
- Gao, B.-C. NDWI—A normalized difference water index for remote sensing of vegetation liquid water from space. Remote Sens. Environ. 1996, 58, 257–266. [Google Scholar] [CrossRef]
- Xu, H. Modification of normalised difference water index (NDWI) to enhance open water features in remotely sensed imagery. Int. J. Remote Sens. 2007, 27, 3025–3033. [Google Scholar] [CrossRef]
- Feyisa, G.L.; Meilby, H.; Fensholt, R.; Proud, S.R. Automated Water Extraction Index: A new technique for surface water mapping using Landsat imagery. Remote Sens. Environ. 2014, 140, 23–35. [Google Scholar] [CrossRef]
- Mishra, M.; Kar, D.; Santos, C.A.G.; Silva, R.M.D.; Das, P.P. Assessment of impacts to the sequence of the tropical cyclone Nisarga and monsoon events in shoreline changes and vegetation damage in the coastal zone of Maharashtra, India. Mar. Pollut. Bull. 2022, 174, 113262. [Google Scholar] [CrossRef]
- Chen, X.-L.; Zhao, H.-M.; Li, P.-X.; Yin, Z.-Y. Remote sensing image-based analysis of the relationship between urban heat island and land use/cover changes. Remote Sens. Environ. 2006, 104, 133–146. [Google Scholar] [CrossRef]
- Shen, L.; Li, C. Water body extraction from Landsat ETM+ imagery using adaboost algorithm. In Proceedings of the 18th International Conference on Geoinformatics, Beijing, China, 18–20 June 2010; pp. 1–4. [Google Scholar]
- Wilson, E.H.; Sader, S.A. Detection of forest harvest type using multiple dates of Landsat TM imagery. Remote Sens. Environ. 2002, 80, 385–396. [Google Scholar] [CrossRef]
- Li, Y.; Dang, B.; Zhang, Y.; Du, Z. Water body classification from high-resolution optical remote sensing imagery: Achievements and perspectives. ISPRS J. Photogramm. Remote Sens. 2022, 187, 306–327. [Google Scholar] [CrossRef]
- Castelle, B.; Masselink, G.; Scott, T.; Stokes, C.; Konstantinou, A.; Marieu, V.; Bujan, S. Satellite-derived shoreline detection at a high-energy meso-macrotidal beach. Geomorphology 2021, 383, 107707. [Google Scholar] [CrossRef]
- Otsu, N. A Threshold Selection Method from Gray-Level Histograms. IEEE Trans. Syst. Man. Cybern. 1979, 9, 62–66. [Google Scholar] [CrossRef]
- Karsli, F.; Guneroglu, A.; Dihkan, M. Spatio-temporal shoreline changes along the southern Black Sea coastal zone. J. Appl. Remote Sens. 2011, 5, 3545. [Google Scholar] [CrossRef]
- Vukadinov, D.; Jovanovic, R.; Tuba, M. An Algorithm for Coastline Extraction from Satellite Imagery. WSEAS Trans. Comput. Arch. 2017, 5, 8–15. [Google Scholar]
- Yan, J.; Zhang, L.; Luo, X.; Peng, H.; Wang, J. A novel edge detection method based on dynamic threshold neural P systems with orientation. Digit. Signal Process. 2022, 127, 103526. [Google Scholar] [CrossRef]
- Yasir, M.; Sheng, H.; Fan, H.; Nazir, S.; Niang, A.J.; Salauddin, M.; Khan, S. Automatic Coastline Extraction and Changes Analysis Using Remote Sensing and GIS Technology. IEEE Access 2020, 8, 180156–180170. [Google Scholar] [CrossRef]
- Hu, X.; Wang, Y. Monitoring coastline variations in the Pearl River Estuary from 1978 to 2018 by integrating Canny edge detection and Otsu methods using long time series Landsat dataset. Catena 2022, 209, 105840. [Google Scholar] [CrossRef]
- Kass, M.; Witkin, A.; Terzopoulos, D. Snakes: Active contour models. Int. J. Comput. Vis. 1988, 1, 321–331. [Google Scholar] [CrossRef]
- Klinger, T.; Ziems, M.; Heipke, C.; Schenke, H.W.; Ott, N. Antarctic Coastline Detection using Snakes Küstenliniendetektion in der Antarktis mit Hilfe von Snakes. Photogramm. Fernerkund. Geoinf. 2011, 2011, 421–434. [Google Scholar] [CrossRef] [PubMed]
- Ouyang, Y.; Chong, J.; Wu, Y. Two coastline detection methods in Synthetic Aperture Radar imagery based on Level Set Algorithm. Int. J. Remote Sens. 2010, 31, 4957–4968. [Google Scholar] [CrossRef]
- Li, C.; Xu, C.; Gui, C.; Fox, M.D. Distance regularized level set evolution and its application to image segmentation. IEEE Trans. Image Process 2010, 19, 3243–3254. [Google Scholar] [CrossRef]
- Toure, S.; Diop, O.; Kpalma, K.; Maiga, A.S. Coastline Detection Using Fusion of over Segmentation and Distance Regularization Level Set Evolution. Int. Arch. Photogramm. Remote Sens. Spat. Inf. Sci. 2018, XLII-3/W4, 513–518. [Google Scholar] [CrossRef]
- Yao, L.; Ou, Z.; Luo, B.; Xu, C.; Chen, Q. Machine Learning to Reveal Nanoparticle Dynamics from Liquid-Phase TEM Videos. ACS Cent. Sci. 2020, 6, 1421–1430. [Google Scholar] [CrossRef]
- Tajima, Y.; Wu, L.; Fuse, T.; Shimozono, T.; Sato, S. Study on shoreline monitoring system based on satellite SAR imagery. Coast. Eng. J. 2019, 61, 401–421. [Google Scholar] [CrossRef]
- Nunziata, F.; Buono, A.; Migliaccio, M.; Benassai, G. Dual-Polarimetric C- and X-Band SAR Data for Coastline Extraction. IEEE J. Sel. Top. Appl. Earth Obs. Remote Sens. 2016, 9, 4921–4928. [Google Scholar] [CrossRef]
- Nunziata, F.; Migliaccio, M. Coherent Dual-Pol HH-HV SAR Data to Extract Coastline. In Proceedings of the IEEE International Geoscience and Remote Sensing Symposium–IGARSS, Melbourne, Australia, 21–26 July 2013; pp. 3215–3218. [Google Scholar]
- Nunziata, F.; Migliaccio, M.; Li, X.; Ding, X. Coastline Extraction Using Dual-Polarimetric COSMO-SkyMed PingPong Mode SAR Data. IEEE Geosci. Remote Sens. Lett. 2014, 11, 104–108. [Google Scholar] [CrossRef]
- Paes, R.L.; Nunziata, F.; Migliaccio, M. Coastline Extraction and Coastal Area Classification via SAR Hybrid-Polarimetry Architecture. In Proceedings of the 2015 IEEE International Geoscience and Remote Sensing Symposium (IGARSS), Milan, Italy, 26–31 July 2015; pp. 3798–3801. [Google Scholar]
- Ferrentino, E.; Nunziata, F.; Migliaccio, M. Full-polarimetric SAR measurements for coastline extraction and coastal area classification. Int. J. Remote Sens. 2017, 38, 7405–7421. [Google Scholar] [CrossRef]
- Costa, H.; Foody, G.M.; Boyd, D.S. Supervised methods of image segmentation accuracy assessment in land cover mapping. Remote Sens. Environ. 2018, 205, 338–351. [Google Scholar] [CrossRef]
- Vapnik, V.N. An overview of statistical learning theory. IEEE Trans. Neural Netw. 1999, 10, 988–999. [Google Scholar] [CrossRef]
- Abid, N.; Shahzad, M.; Malik, M.I.; Schwanecke, U.; Ulges, A.; Kovács, G.; Shafait, F. UCL: Unsupervised Curriculum Learning for water body classification from remote sensing imagery. Int. J. Appl. Earth Obs. Geoinf. 2021, 105, 102568. [Google Scholar] [CrossRef]
- Kalkan, K.; Bayram, B.; Maktav, D.; Sunar, F. Comparison of support vector machine and object based classification methods for coastline detection. Int. Arch. Photogramm. Remote Sens. Spat. Inf. Sci. 2013, XL-7/W2, 125–127. [Google Scholar] [CrossRef]
- Çelik, O.İ.; Gazioğlu, C. Coast type based accuracy assessment for coastline extraction from satellite image with machine learning classifiers. Egypt. J. Remote Sens. Space Sci. 2022, 25, 289–299. [Google Scholar] [CrossRef]
- Wang, B.; Shidong, F.; Jiang, P.; Zhu, H.; Xiong, T.; Wei, W.; Fang, Z. A Novel Method with Stacking Learning of Data-Driven Soft Sensors for Mud Concentration in a Cutter Suction Dredger. Sensors 2020, 20, 6075. [Google Scholar] [CrossRef]
- Cover, T.; Hart, P. Nearest neighbor pattern classification. IEEE Trans. Inf. Theory 1967, 13, 21–27. [Google Scholar] [CrossRef]
- Sekovski, I.; Stecchi, F.; Mancini, F.; Del Rio, L. Image classification methods applied to shoreline extraction on very high-resolution multispectral imagery. Int. J. Remote Sens. 2014, 35, 3556–3578. [Google Scholar] [CrossRef]
- Yu, W.; Yao, X.; Shao, L.; Liu, J.; Shen, Y.; Zhang, H. Classification of Desertification on the North Bank of Qinghai Lake. Comput. Mater. Contin. 2022, 72, 695–711. [Google Scholar] [CrossRef]
- Thakur, N.; Maheshwari, D.A. Review of Image Classification Approaches and Techniques. Int. J. Recent. Trends Eng. Res. 2017, 3, 1–5. [Google Scholar] [CrossRef]
- Jiang, S.; Xu, X. Network Data Classification Mechanism for Intrusion Detection System. In Proceedings of the 2021 IEEE 24th International Conference on Computer Supported Cooperative Work. In Design (CSCWD), Dalian, China, 5–7 May 2021; pp. 342–347. [Google Scholar]
- Guo, Y.; Wang, X.; Xiao, P.; Xu, X. An ensemble learning framework for convolutional neural network based on multiple classifiers. Soft Comput. 2020, 24, 3727–3735. [Google Scholar] [CrossRef]
- Bayram, B.; Erdem, F.; Akpinar, B.; Ince, A.; Bozkurt, S.; Çatal, H.; Seker, D. The Efficiency of Random Forest Method for Shoreline Extraction from Landsat-8 and Gokturk-2 Imageries. ISPRS Ann. Photogramm. Remote Sens. Spat. Inf. Sci. 2017, IV-4/W4, 141–145. [Google Scholar] [CrossRef]
- Su, T.; Liu, T.; Zhang, S.; Qu, Z.; Li, R. Machine learning-assisted region merging for remote sensing image segmentation. ISPRS J. Photogramm. Remote Sens. 2020, 168, 89–123. [Google Scholar] [CrossRef]
- Gentleman, R.; Carey, V.J. Unsupervised Machine Learning. In Bioconductor Case Studies; Hahne, F., Huber, W., Gentleman, R., Falcon, S., Eds.; Springer: New York, NY, USA, 2008; pp. 137–157. ISBN 10.1007/978-0-387-77240-0_10. [Google Scholar]
- Choung, Y.-J.; Jo, M.-H. Comparison between a Machine-Learning-Based Method and a Water-Index-Based Method for Shoreline Mapping Using a High-Resolution Satellite Image Acquired in Hwado Island, South Korea. J. Sens. 2017, 2017, 8245204. [Google Scholar] [CrossRef]
- Sun, W.; Chen, C.; Weiwei, L.; Yang, G.; Meng, X.; Wang, L.; Ren, K. Coastline extraction using remote sensing: A review. GISci. Remote Sens. 2023, 60, 2243671. [Google Scholar] [CrossRef]
- Rasuly, A.; Naghdifar, R.; Rasoli, M. Monitoring of Caspian Sea Coastline Changes Using Object-Oriented Techniques. Procedia Environ. Sci. 2010, 2, 416–426. [Google Scholar] [CrossRef]
- Liu, X.-Y.; Jia, R.-S.; Liu, Q.-M.; Zhao, C.-Y.; Sun, H.-M. Coastline Extraction Method Based on Convolutional Neural Networks–A Case Study of Jiaozhou Bay in Qingdao, China. IEEE Access 2019, 7, 180281–180291. [Google Scholar] [CrossRef]
- Vos, K.; Splinter, K.D.; Harley, M.D.; Simmons, J.A.; Turner, I.L. CoastSat: A Google Earth Engine-enabled Python toolkit to extract shorelines from publicly available satellite imagery. Environ. Model. Softw. 2019, 122, 104528. [Google Scholar] [CrossRef]
- Puskarczyk, E. Artificial neural networks as a tool for pattern recognition and electrofacies analysis in Polish palaeozoic shale gas formations. Acta Geophys. 2019, 67, 1991–2003. [Google Scholar] [CrossRef]
- Pan, Y.; Pi, D.; Khan, I.; Han, M. DUFuse: Deep U-Net for visual and infrared images fusion. J. Ambient. Intell. Humaniz. Comput. 2022, 14, 12549–12561. [Google Scholar] [CrossRef]
- Yu, L.; Wang, Z.; Tian, S.; Ye, F.; Ding, J.; Kong, J. Convolutional Neural Networks for Water Body Extraction from Landsat Imagery. Int. J. Comput. Intell. Appl. 2017, 16, 12549–12561. [Google Scholar] [CrossRef]
- Tambe, R.G.; Talbar, S.N.; Chavan, S.S. Deep multi-feature learning architecture for water body segmentation from satellite images. J. Vis. Commun. Image Represent. 2021, 77, 103141. [Google Scholar] [CrossRef]
- Miao, Z.; Fu, K.; Sun, H.; Sun, X.; Yan, M. Automatic Water-Body Segmentation from High-Resolution Satellite Images via Deep Networks. IEEE Geosci. Remote Sens. Lett. 2018, 15, 602–606. [Google Scholar] [CrossRef]
- Liu, W.; Chen, X.; Ran, J.; Liu, L.; Wang, Q.; Xin, L.; Li, G. LaeNet: A Novel Lightweight Multitask CNN for Automatically Extracting Lake Area and Shoreline from Remote Sensing Images. Remote Sens. 2020, 13, 56. [Google Scholar] [CrossRef]
- Ronneberger, O.; Fischer, P.; Brox, T. U-Net: Convolutional Networks for Biomedical Image Segmentation. In Medical Image Computing and Computer-Assisted Intervention–MICCAI 2015, Proceedings of the 18th International Conference, Part III, Munich, Germany, 5–9 October 2015; Springer: Berlin/Heidelberg, Germany, 2015; pp. 234–241. [Google Scholar] [CrossRef]
- Heidler, K.; Mou, L.; Baumhoer, C.; Dietz, A.; Zhu, X.X. HED-UNet: Combined Segmentation and Edge Detection for Monitoring the Antarctic Coastline. IEEE Trans. Geosci. Remote Sens. 2022, 60, 4300514. [Google Scholar] [CrossRef]
- Yang, T.; Jiang, S.; Hong, Z.; Zhang, Y.; Han, Y.; Zhou, R.; Wang, J.; Yang, S.; Tong, X.; Kuc, T.-y. Sea-Land Segmentation Using Deep Learning Techniques for Landsat-8 OLI Imagery. Mar. Geod. 2020, 43, 105–133. [Google Scholar] [CrossRef]
- Li, Y.; Zhou, Y.; Zhang, Y.; Zhong, L.; Wang, J.; Chen, J. DKDFN: Domain Knowledge-Guided deep collaborative fusion network for multimodal unitemporal remote sensing land cover classification. ISPRS J. Photogramm. Remote Sens. 2022, 186, 170–189. [Google Scholar] [CrossRef]


| Types | Interpretation Signs | Location |
|---|---|---|
| Rocky coastlines | Large curvature, serrated shape | Use the land–water boundary as the coastline |
| Sandy coastlines | Relatively straight and the beach is striped, often with a beach ridge stacked up | Use the beach ridge as the coastline |
| Silty coastlines | Relatively straight, gentle slope, with large differences in vegetation density between the two sides of the intertidal zone | Use the obvious boundary between the tidal beach and the salt-tolerant vegetation as the coastline |
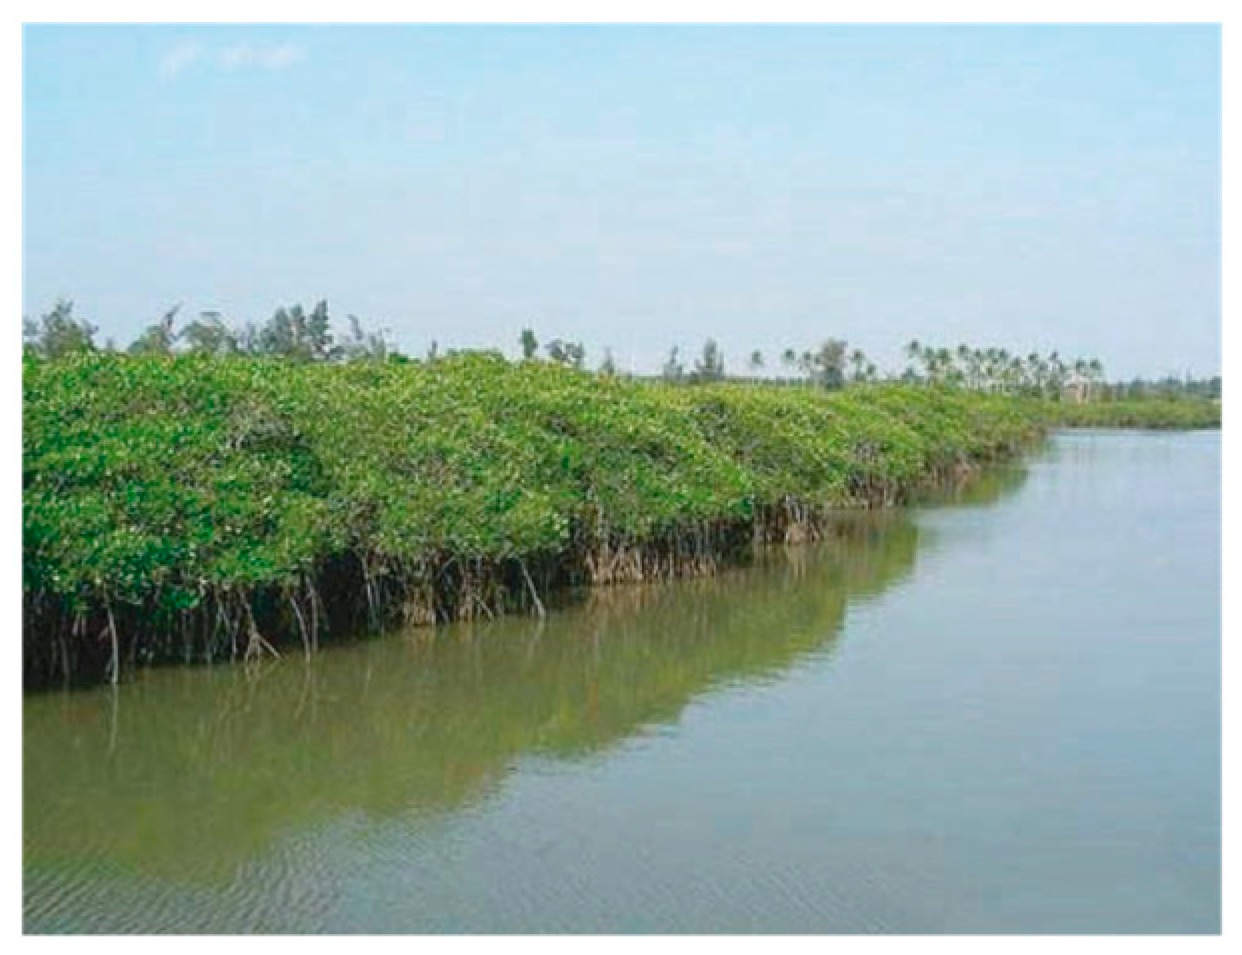
| Biological coastlines | The tidal ditch is obvious, with mangroves and other plants growing | Use the vegetation density difference as the coastline |
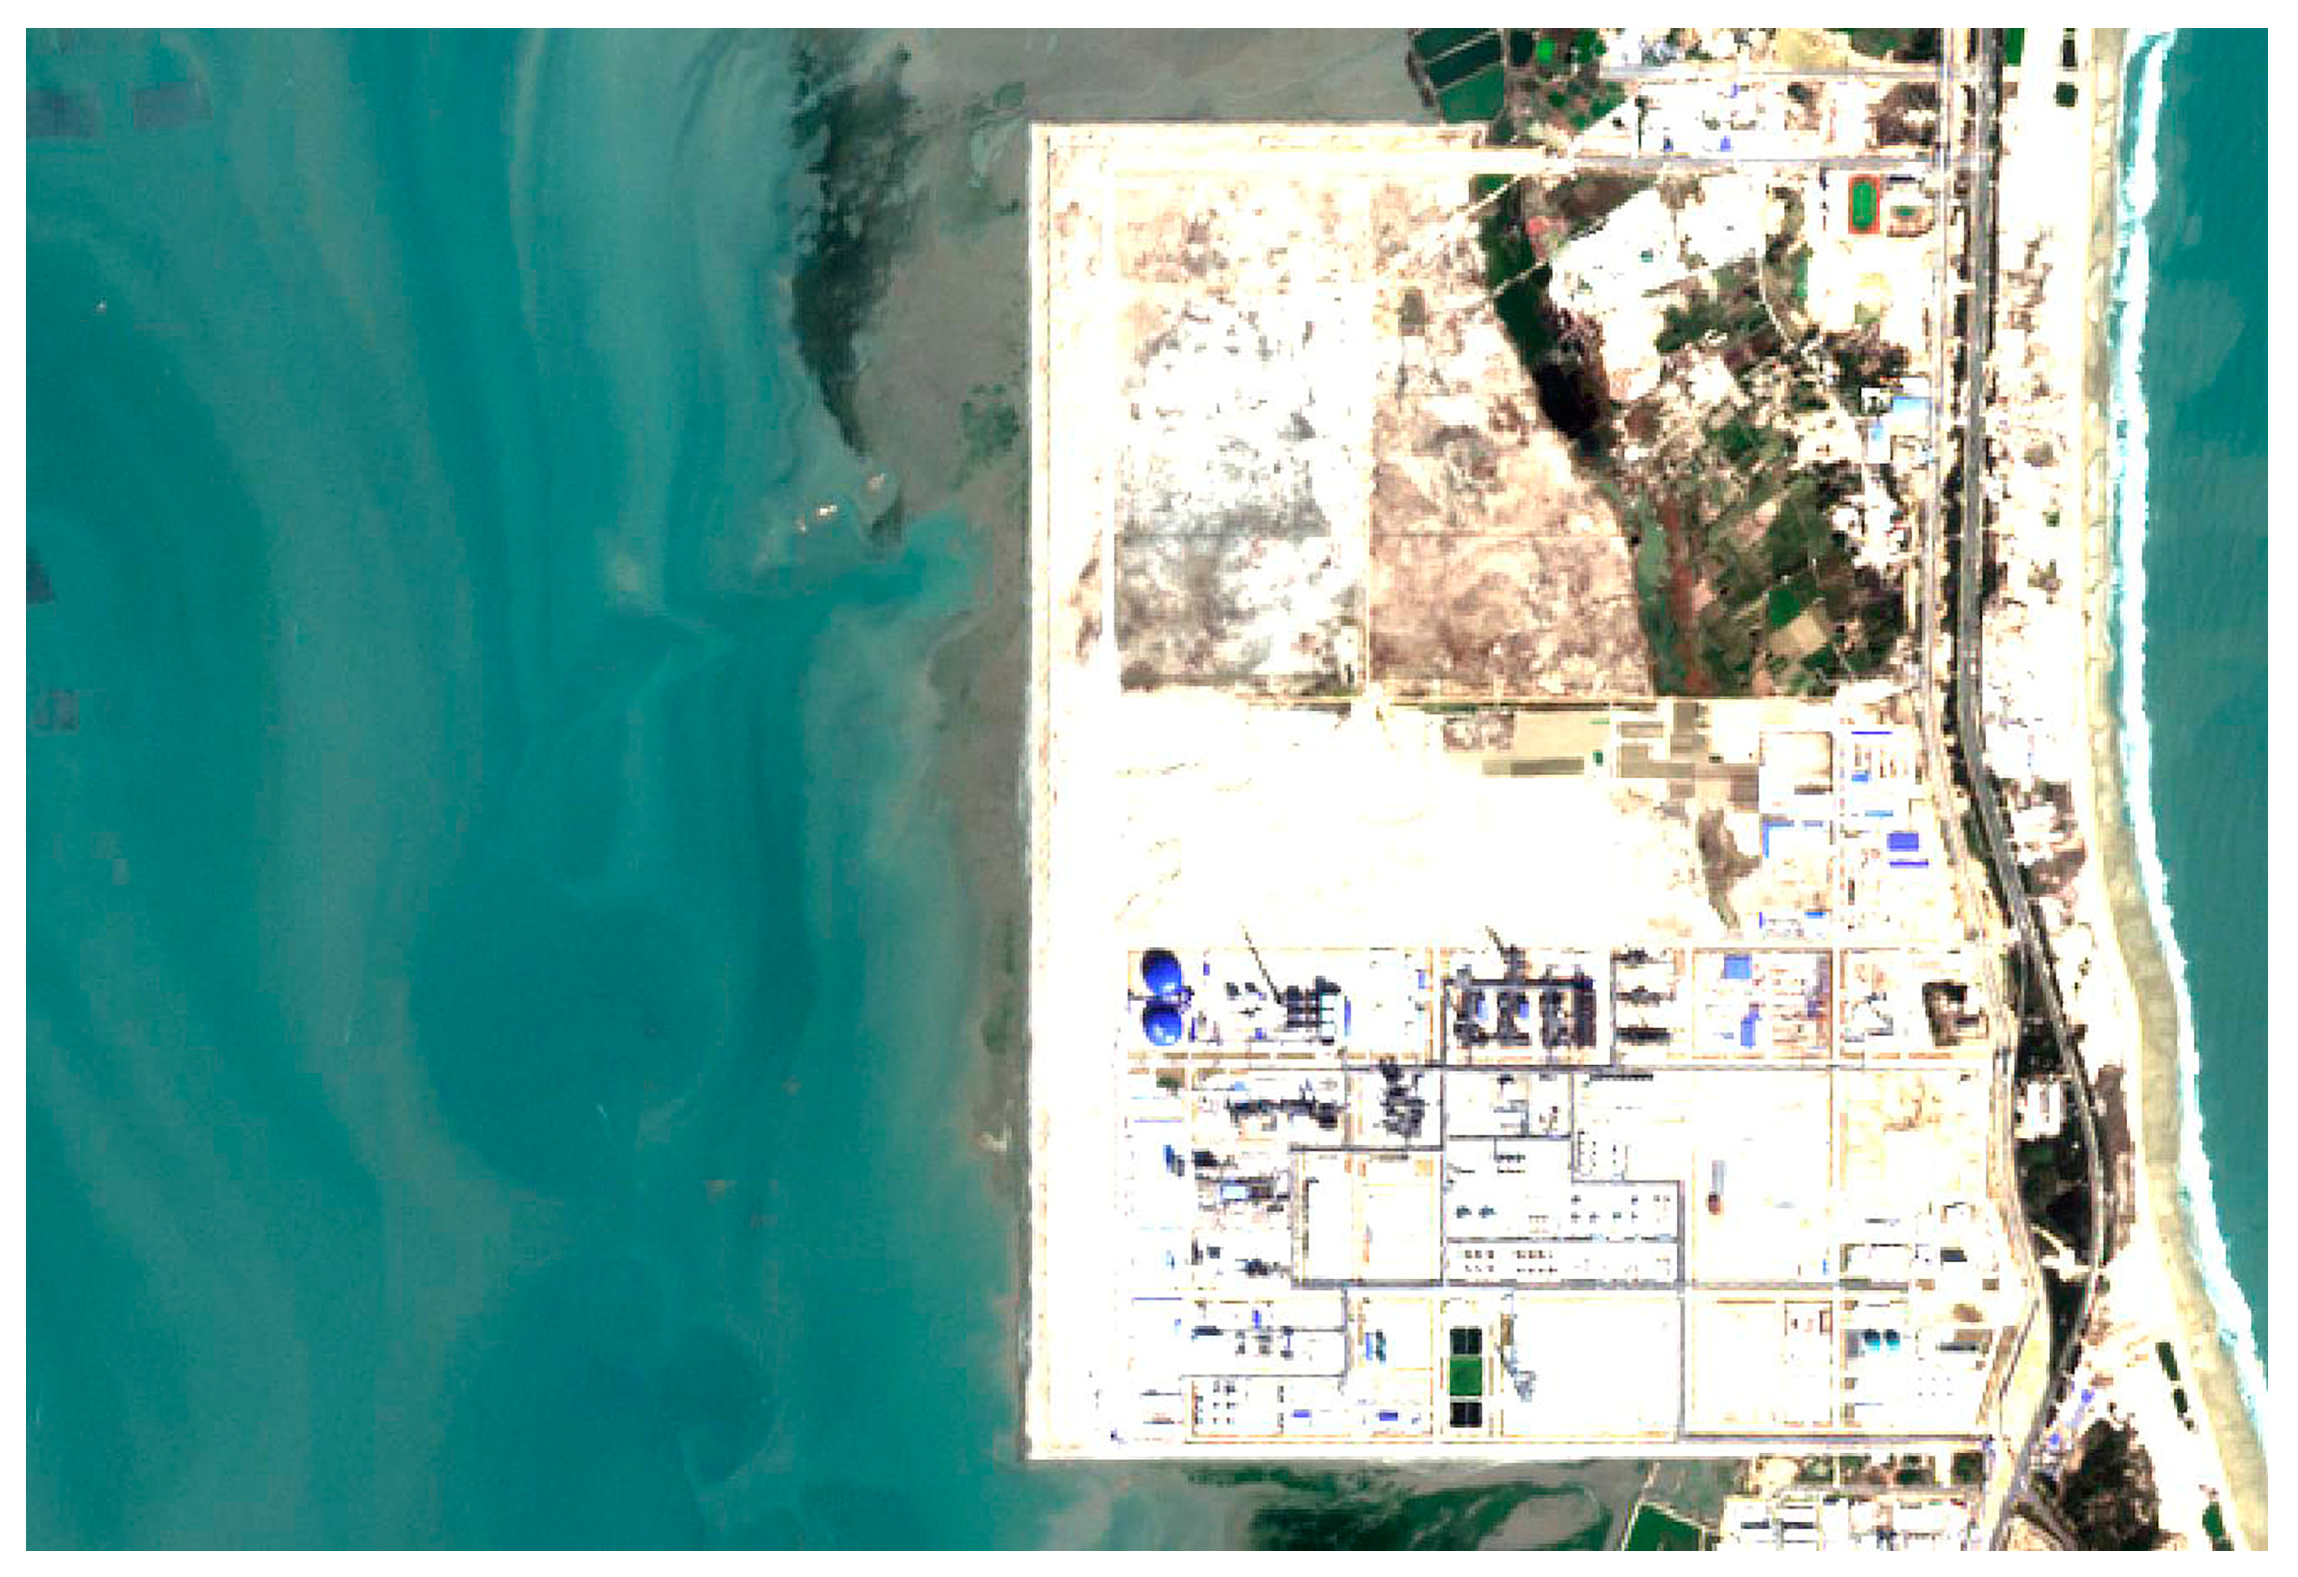
| Artificial coastlines | Straight direction, regular shape, and steep slope | Use the edge of artificial structures as the coastline |
| Coastline Types | Indicators | Extraction Technique |
|---|---|---|
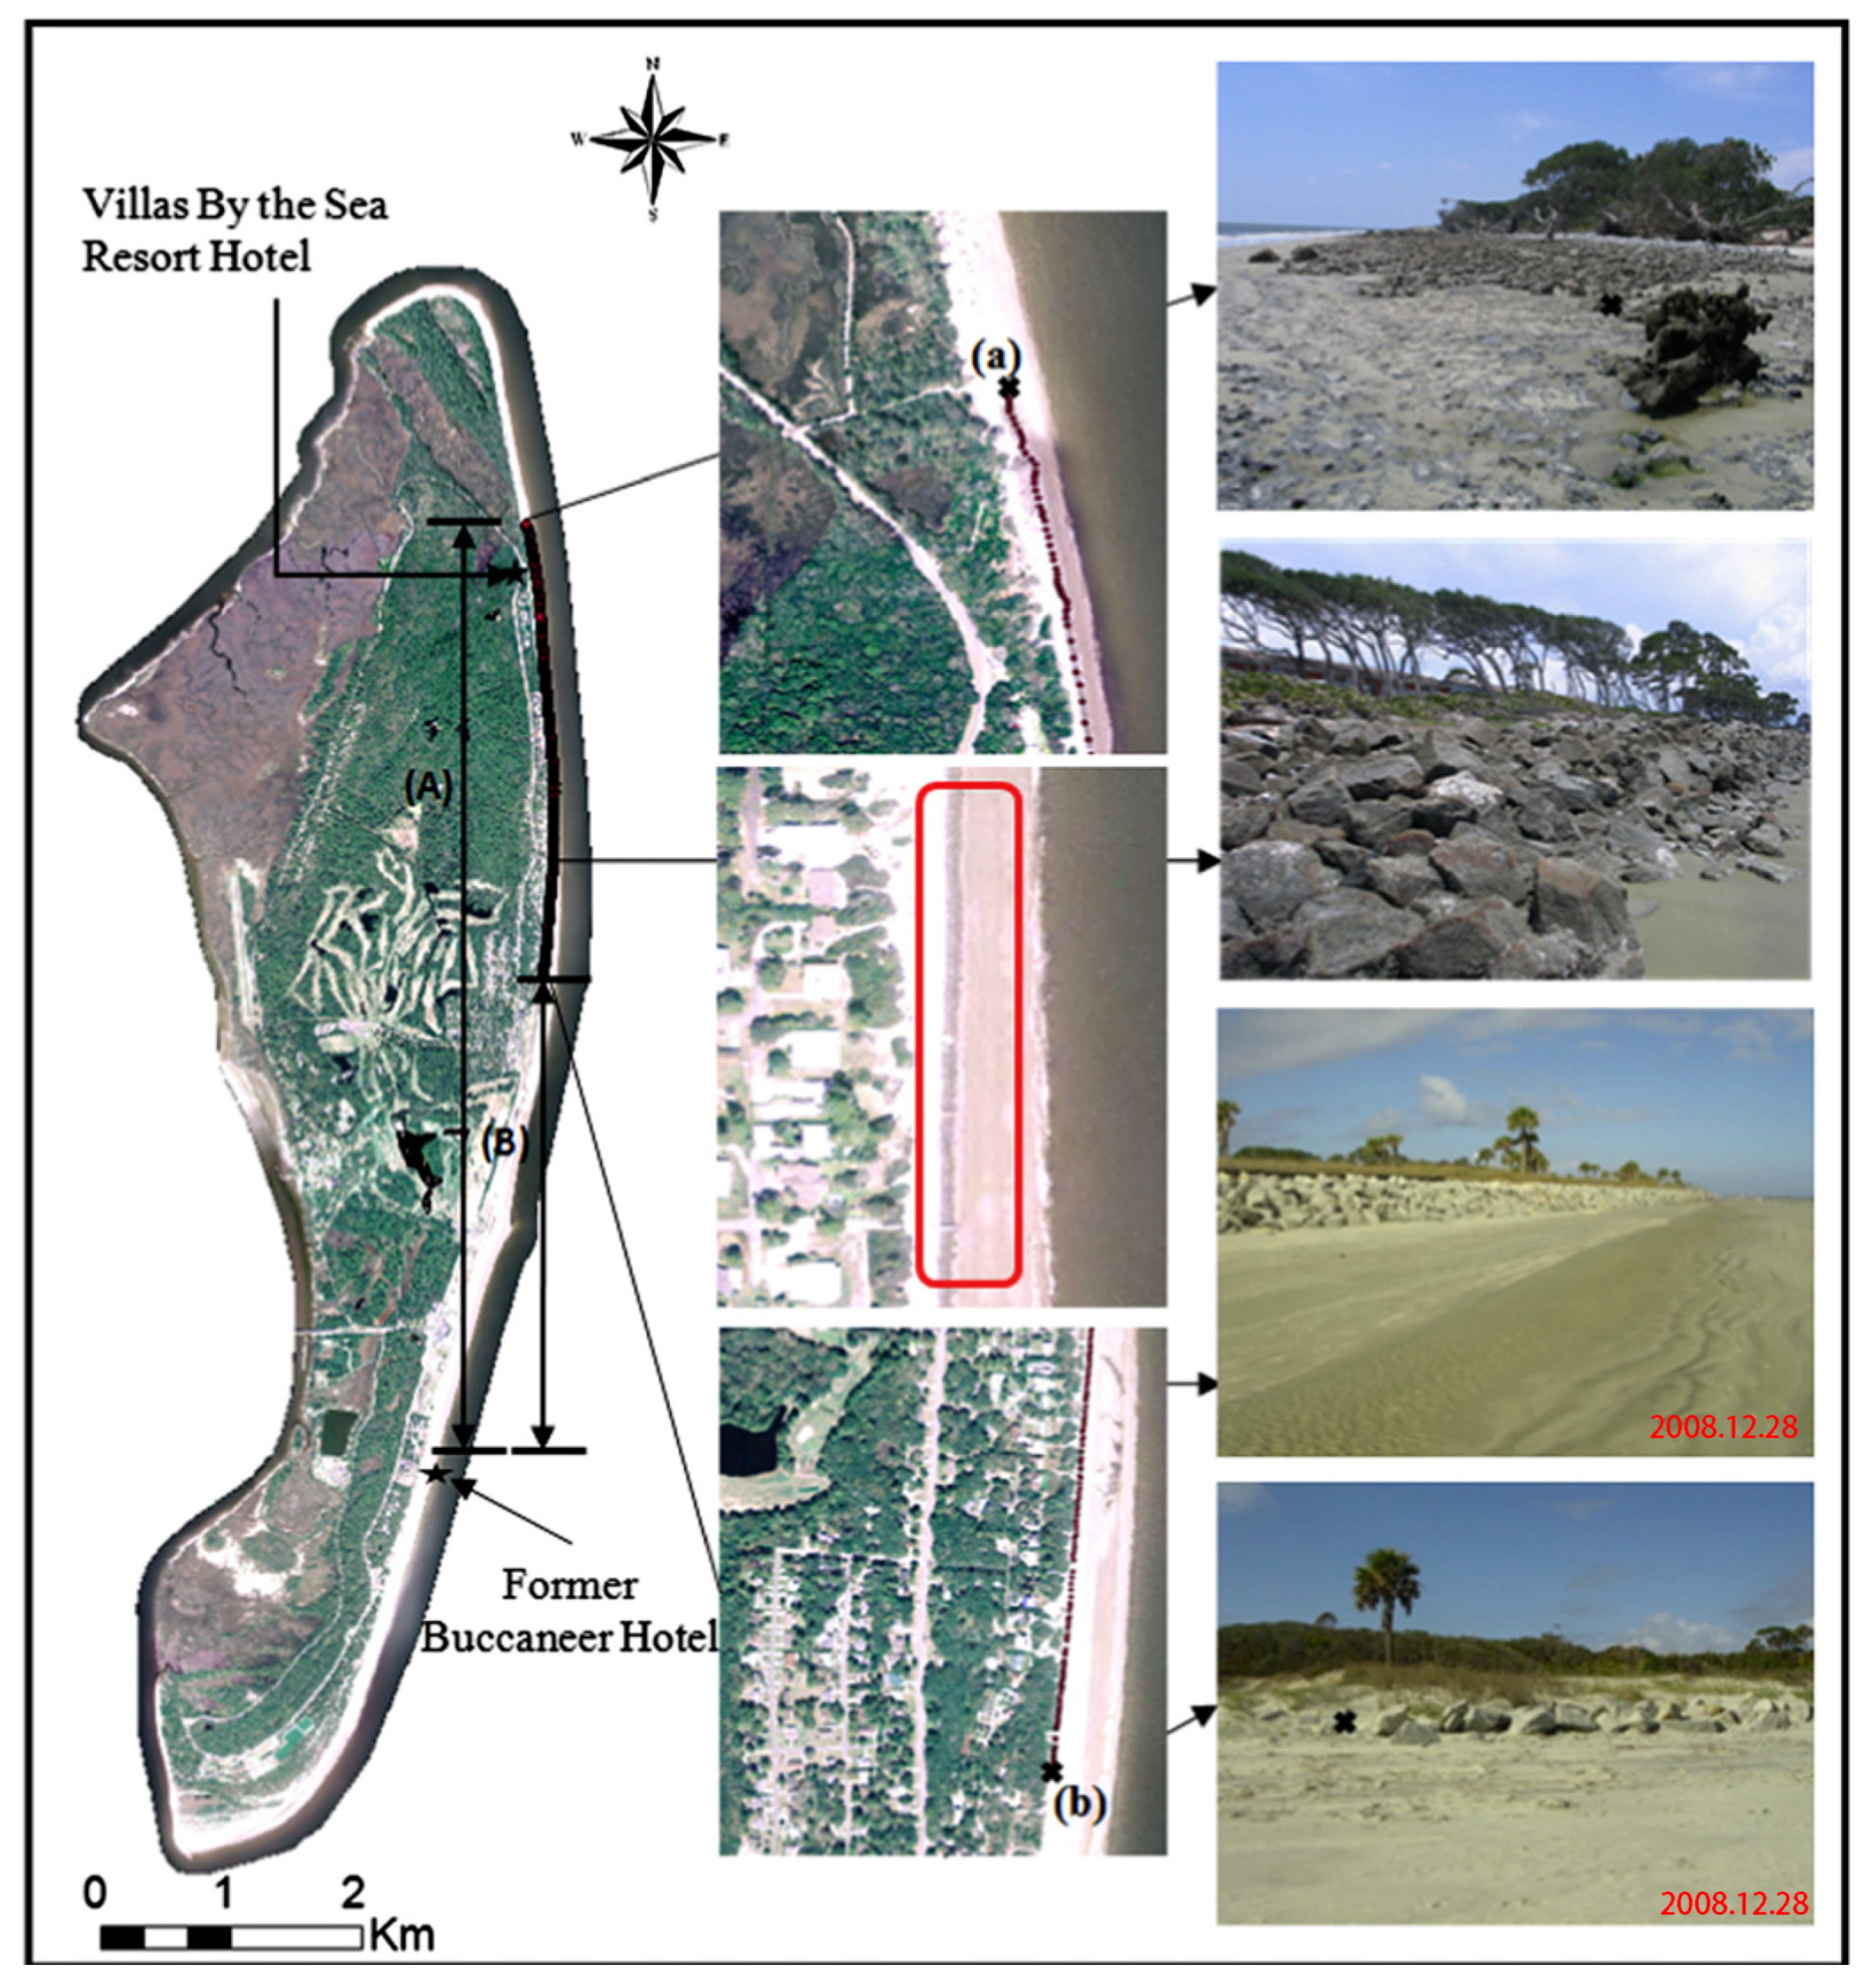
| Rocky coastlines | Morphological limits | Using differences between LiDAR intensity values of multiple return points on revetment rocks and water to locate coastline position [53]. |
| A dual-polarization model takes full benefit of the PingPong model peculiarities were exploited to distinguish sea surface from land, then used image processing technique to extract coastlines [64]. | ||
| An integrated model of Convolutional Neural Network (CNN) and Object-Based Image Analysis (OBIA) was used to extract coastlines from remotely sensed images [65]. | ||
| Extracting coastline by an automatic approach for coastline detection from images which is based on parametric active contours(snakes) [66]. Select the applicable model through the supervised classification of ice, water, and rock. | ||
| Sandy coastlines | Morphological limits | Using the Sentinel-2 Water Edges Dataset (SWED), develop a convolutional neural network design based on U-Net for detecting coastline morphology [67]. |
| The coastline was extracted in two steps. The first step is using the Level Set Algorithm (LSA) to obtain the coarse boundary, then the contour is processed finely by LSA in a high-resolution image based on the coarse boundary [68]. | ||
| Improving the sea-land segmentation performance by modifying Standard U-Net, and developing an automatic coastline extraction framework to extract coastline from sea-land segmentation results [69]. | ||
| Identify the coastline using Pix4Dcapture, Pix4Dmapper, and ArcGIS 10.3 software to use the images captured by unmanned aerial vehicles [70]. | ||
| The fuzzy approach generated a classification SAR image to distinguish the coastal pixels from the land surface pixels. The classified map is converted to vector form, and the Douglas-Peucker regularisation algorithm is applied to remove the zigzag effects and reconstruct the boundary [18]. | ||
| Instantaneous waterline | The waterline was extracted using the Normalized Difference Water Index (NDWI) with the Canny edge detection and thresholding used to create a binary image of land water [71]. | |
| A robust extraction method using an artificial neural network (ANN). ANN uses the feedforward NN to classify the pixels of SAR imagery into two categories, land, and sea. The coastline location is then determined as a boundary of these two groups of classified pixels [72]. | ||
| An ensemble automatic shoreline segmentation system (WaterNet) based on deep learning architectures to obtain coastlines automatically [73]. | ||
| The classification of water on land employs two ensemble classifiers, namely a majority voting ensemble classifier utilizing random forest and support vector machine with RBF kernel, and another ensemble classifier combining multi-layer perceptron and k-nearest neighbor [74]. | ||
| The satellite images of the coastline were analyzed using edge detection filters, mainly Sobel and Canny [21]. | ||
| Wet/dry line | The classified image was regrouped into two classes (land and sea) by ISODATA classification technique [74]. | |
| Supervised edge detection is used on optical remote sensing data to map wet/dry indicators in the sandy part of beaches [62]. | ||
| Silty coastlines | Wet/dry line | An object-oriented multi-scale segmentation method is used for automated extraction and classification of coastlines from remote sensing imagery [75]. |
| The NDWI and Otsu thresholding converts the image into a binary image. The coastline is delineated using binarized images which are produced from a thresholding-based segmentation algorithm [5]. | ||
| Biological coastlines | Vegetation limits | The vegetation and non-vegetation parts of the mangrove were distinguished by binary classification method based on the NDVI map [76]. |
| Artificial coastlines | Artificial limits | Extract coastline of man-made construction areas from airborne lidar data. Determination of pre-extracted coastline elevation by distinguishing the echo intensity of water and land, then translate coastline point cloud and generate coastline [9]. |
| Index | Equation | Remark | Reference |
|---|---|---|---|
| Normalized Difference Water Index | NDWI = (Green − NIR)/(Green + NIR) | The water pixel has a positive value | [79] |
| Modified Normalized Difference Water Index | MNDWI = (Green − MIR)/(Green + MIR) | The water pixel has a positive value | [80] |
| Automated Water Extraction Index | AWEI = 4(Green-MIR) − (0.25 NIR + 2.75 SWIR) | The water pixel has a positive value | [81] |
| Normalized Difference Vegetation Index | NDVI = (NIR − Red)/(NIR + Red) | The vegetation pixel has a positive value | [82] |
| Normalized Difference Building Index | NDBI = (MIR − NIR)/(MIR + NIR) | Artificial structure pixels have a positive value | [83] |
| Water Ration Index | WRI = (Green + Red)/(NIR + MIR) | The water pixel has a positive value | [84] |
| Normalized Difference Moisture Index | NDMI = (NIR − MIR)/(NIR + MIR) | The water pixel has a positive value | [85] |
Disclaimer/Publisher’s Note: The statements, opinions and data contained in all publications are solely those of the individual author(s) and contributor(s) and not of MDPI and/or the editor(s). MDPI and/or the editor(s) disclaim responsibility for any injury to people or property resulting from any ideas, methods, instructions or products referred to in the content. |
© 2023 by the authors. Licensee MDPI, Basel, Switzerland. This article is an open access article distributed under the terms and conditions of the Creative Commons Attribution (CC BY) license (https://creativecommons.org/licenses/by/4.0/).
Share and Cite
Zhou, X.; Wang, J.; Zheng, F.; Wang, H.; Yang, H. An Overview of Coastline Extraction from Remote Sensing Data. Remote Sens. 2023, 15, 4865. https://doi.org/10.3390/rs15194865
Zhou X, Wang J, Zheng F, Wang H, Yang H. An Overview of Coastline Extraction from Remote Sensing Data. Remote Sensing. 2023; 15(19):4865. https://doi.org/10.3390/rs15194865
Chicago/Turabian StyleZhou, Xixuan, Jinyu Wang, Fengjie Zheng, Haoyu Wang, and Haitao Yang. 2023. "An Overview of Coastline Extraction from Remote Sensing Data" Remote Sensing 15, no. 19: 4865. https://doi.org/10.3390/rs15194865
APA StyleZhou, X., Wang, J., Zheng, F., Wang, H., & Yang, H. (2023). An Overview of Coastline Extraction from Remote Sensing Data. Remote Sensing, 15(19), 4865. https://doi.org/10.3390/rs15194865