Abstract
Synthetic Aperture Radar (SAR) remote sensing has been widely used as one of the most effective tools for responding to earthquake disasters. In general, damaged-building detection with SAR data has been conducted based on change detection using temporal SAR data acquired in the same observation mode. However, it is not always possible to use SAR data obtained with the appropriate observation mode in unexpected events such as natural disasters. This study aims to detect earthquake-induced damaged buildings using temporal SAR data having different observation modes. We presented a contextual change analysis method to map damaged buildings based on novel textural features. This study was conducted using the bi-temporal Komapsat-5 data obtained in different polarization modes. Experimental results for the area severely damaged by the 2016 Kumamoto earthquake showed that the proposed textural analysis can improve detectability in building-damaged areas while maintaining low false alarm rates in agricultural areas. According to the grid-based accuracy analysis, the proposed method can successfully detect the damaged areas with a detection rate of about 72.5% and false alarms of about 6.8% even on challenging data sets.
1. Introduction
The ground shaking of an earthquake can cause structural damage to numerous buildings in urban areas in a short time. Since most casualties are primarily related to building collapses [1], immediate planning and response based on accurate building damage are important after earthquakes. Remote sensing techniques have been actively used as one of the most effective tools for responding to disasters due to the advantage of mapping damage over a wide area [2]. In particular, the Synthetic Aperture Radar (SAR) system can play an important role in the rapid detection of damaged areas because it enables timely observation with its all-weather and day/night observation capability.
Previous studies to detect building damage caused by earthquakes using SAR data have generally used change detection methods for SAR images acquired in pre- and post-disaster conditions [3]. Several studies have investigated the damage indices derived from the backscattering intensities of temporal SAR data. The intensity difference and intensity correlation parameters between pre- and post-seismic SAR data were analyzed to evaluate building damages caused by the 1995 Kobe earthquakes [4], the 2003 Bam earthquakes [5], and the 2003 Peru earthquakes [6]. In these studies, the intensity difference and correlation parameters were combined to derive a damage index to discriminate damaged buildings from non-damaged areas. Chini et al. [7] proposed an improvement of damage augmentation using additional pre-seismic intensity correlation. Dekker [8] analyzed the normalized intensity difference and intensity correlation of high-resolution X-band SAR data to detect the building damages caused by the 2010 Haiti earthquakes. The possibility of detection of building damage using a normalized intensity difference was evaluated according to the type of building and the degree of damage.
When the temporal SAR acquisitions are appropriate for performing the interferometric SAR (InSAR) processing, the complex coherence of the interferometric pair can be used to detect damaged buildings. To evaluate urban damage caused by earthquakes, interferometric coherence was analyzed along with intensity differences and intensity correlations [9,10]. In addition, several studies presented coherence-based damage detection methods by comparing pre-seismic coherence with co-seismic coherence [11,12,13,14]. The damage index derived from the interferometric coherence contains useful information for interpreting damage conditions, but the change in temporal decorrelation generally requires multiple temporal In-SAR pairs and can be greatly influenced by various natural factors besides damage-induced changes [15]. On the other hand, if the SAR systems provide fully polarimetric observations, the detectability of building damages caused by earthquakes can be significantly improved by exploiting polarimetric scattering information [16,17,18,19,20,21]. The polarimetric parameters can emphasize the scattering information related to building damages by distinguishing it from other natural phenomena, thereby enabling effective detection of damages over wide areas without in situ information [19]. Park and Jung [22] examined various polarimetric damage detection approaches and proposed the polarimetric damage indicator for building damages caused by the 2016 Kumamoto earthquakes.
In addition to pixel-wise analysis of intensities, polarimetric features, and interferometric coherence, the spatial contextual information of the SAR image can be useful for improving the detectability of damaged buildings in complex urban areas. Textural features, such as the Gray Level Co-occurrence Matrix (GLCM) [23], can indicate spatial variability in the SAR and have the potential to identify different types of changes between land cover types. Dell’Acqua et al. [24] and Sun et al. [25] reported that the GLCM texture analysis of post-seismic SAR data can be applied to assess building damage levels. Moya et al. [26] performed temporal texture analysis using three-dimensional GLCM and found the potential to identify collapsed buildings caused by the 2011 Tohoku earthquakes. Li et al. [27] analyzed a correlation through GLCM-derived temporal SAR data features and successfully detected the collapsed buildings induced by the 2009 L’Aquila earthquakes.
Previous studies have reported experimental evidence for the usability of SAR observations in the detection and assessment of building damages. Most of these studies have used multi-temporal or bi-temporal SAR data of the same observation mode for effective detection of changes caused by earthquakes. However, it is often difficult to obtain post-event SAR data with the same observation geometry as the pre-event baseline data for disaster circumstances. Therefore, it may be necessary to use challenging SAR data sets acquired with different observation modes to quickly respond to disaster situations. This study aims to detect earthquake-induced damaged buildings using temporal SAR data having different observation modes. The pixel-wise estimation of disaster information may be limited because individual pixel values of SAR data acquired in different modes contain differences in scattering mechanisms due to differences in observational conditions as well as information about disaster-related changes.
In this study, a texture-based change detection approach was examined to derive meaningful information about disasters from pre- and post-seismic SAR data obtained in different modes. We presented a contextual change analysis method to map damaged buildings based on novel textural features. This study was conducted using the bi-temporal X-band Komapsat-5 SAR data obtained for the area severely damaged by the 2016 Kumamoto earthquake. The two pre- and post-seismic SAR data have the advantage of high discrimination ability for urban scatterers but are limited in effective detection with existing intensity-based or phase-based approaches since they were acquired with a long temporal baseline and different polarization modes. The remainder of this paper consists of the following: In Section 2, the study area, Kompsat-5 data set, and manually generated reference damage map are introduced. In Section 3, the application of GLCM-based change detection is performed, and the novel texture-based change detection method is proposed. In Section 4, the experimental results of previous methods and the proposed method are qualitatively and quantitatively evaluated. The effects of parameters of the proposed texture-based method and the areal damage rate evaluation are discussed in Section 5. Lastly, concluding remarks are presented in Section 6.
2. Study Area and Data
The study area is located in Kumamoto Prefecture, Kyushu region in Japan as shown in Figure 1a. The specific study site is Mashiki town (white rectangle in Figure 1a), a residential area in the Kamimashiki district. This area was seriously affected by earthquakes on 14 April 2016 with a Mw 6.2 foreshock and 16 April 2016 with a Mw 7.0 mainshock. This series of earthquakes occurred around the junction of the Hinagu fault and Futagawa fault (cyan dashed lines in Figure 1a) [28]. According to the ground survey [29], the 2016 Kumamoto earthquakes destroyed 7996 houses, half-destroyed 17,886 houses, and partially destroyed 73,035 houses, and resulted in 1258 people slightly injured, 360 severely injured, and 49 deaths. Figure 1b shows the Google Earth optical image and the specific location of the Mashiki town study area. A lot of small houses are concentrated in the center of the study areas, and agricultural areas widely surround the residential areas.
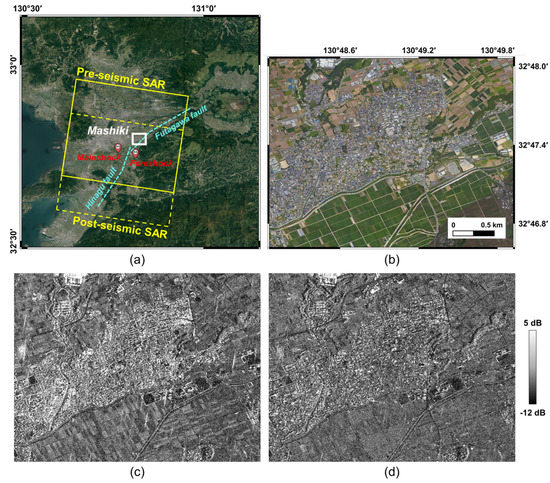
Figure 1.
Study area and data: (a) Kompsat-5 data coverage and location of the Mashiki town study area (white rectangle) marked on Google Earth image. The cyan dashed lines illustrate the approximate location of the Hinagu and Futagawa faults. The locations of the foreshock and mainshock are also marked in (a). (b) Google Earth optical images of study sites acquired on 8 August 2018. (c) Pre-seismic Kompsat-5 (HH polarization). (d) Post-seismic Kompsat-5 (VV polarization).
To investigate earthquake-induced damaged buildings in this area, the X-band Kompsat-5 data operated by Korea Aerospace Research Institute (KARI) were used. Among several observation modes of the Kompsat-5 system, two enhanced standard mode data observed on 20 December 2015 (pre-seismic) and 24 October 2017 (post-seismic) were obtained in this study as summarized in Table 1. Figure 1c,d show the Kompsat-5 data obtained in pre- and post-seismic conditions of the main study area, respectively. The pre- and post-seismic data were obtained in different polarization modes with HH- and VV-polarization, respectively, with the temporal baseline of about 2 years. Both data sets were obtained in descending orbit with the ground range and azimuth resolutions of 2.5 m and 2.5 m. The two images were co-registered and geocoded and, to reduce the speckle effect in the textural feature analysis, the Lee sigma filter [30] was applied before analysis.

Table 1.
Acquisition information of temporal Kompsat-5 data set.
Since there was no appropriate field survey information corresponding to the acquisition time of the post-seismic Kompsat-5 data, we manually generated the reference damage map to develop and validate the SAR-based damage detection algorithms. In order to generate the reference damage map, we obtained land cover and land use information of the study area from the OpenStreetMap (OSM) database [31] and extracted building footprints in the form of the 2D polygon in the WGS 84 coordinate system. All building footprints in the form of 2D polygons in Mashiki town are shown in Figure 2a. All building polygons in the region of interest were visually inspected one by one using the high-resolution Google Earth historical images corresponding to the time of SAR data acquisitions. By comparing historical optical images, only the polygons whose buildings existed in pre-seismic conditions and disappeared after the earthquake were selected as collapsed buildings for the reference damage map. Figure 2b shows the reference damage map for Mashiki town. Among all buildings in the region of interest, manually generated collapsed building polygons were displayed in red color.
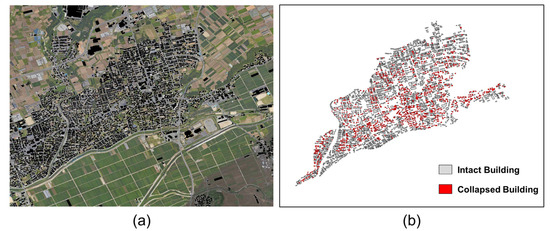
Figure 2.
(a) OSM Building footprints in Mashiki town study area marked on Google Earth image. (b) Manually extracted building damage map for Mashiki town study area. The intact and collapsed buildings are displayed in gray and red color, respectively.
3. Method
3.1. Applicability and Limitations of GLCM-Based Damage Index
Textural features provide information about spatial contextual variations in the SAR image and can be useful for identifying changes in building structures in urban areas. We first investigated whether the GLCM-based building damage detection method proposed in the previous study [27] can be applied to Kompsat-5 data observed in different polarization modes. GLCM analyzes the second-order statistics considering the spatial contextual relationship of pixels. For pre-defined spatial relationship parameters, multiple textural features can be extracted from normalized GLCM including contrast, dissimilarity, homogeneity, energy, angular second moment, entropy, mean, variance, and correlation. In this study, a quantization level of 64, a distance of 1, and a window size of 5 × 5 were adopted to extract GLCM features. In addition, to cope with buildings in various orientations, omni-directional GLCM features that are averaged across four directions (0°, 45°, 90°, and 135°) are calculated. In order to reduce the inter-correlation of multiple textural features extracted from GLCM, principal component analysis (PCA) was used to reduce the dimension of redundant information and to maximize the advantage of the texture features in the detection of building damages [27].
The difference between the first principal components of pre- and post-seismic SAR can be used as the damage index. Figure 3a shows the GLCM-based damage index of the study area. Here, the reddish color of the GLCM-based damage index indicates regions with large changes. To examine in more detail whether the GLCM-based damage index obtained from the two SAR data of different polarization modes effectively highlights the collapsed area, a zoom area is selected and displayed in Figure 3b. Compared to the enlarged reference damage map (Figure 3c), the GLCM-based damage index shows excessive false alarms such as areas marked with blue ellipses. According to the original SAR intensity images shown in Figure 3d,e, undamaged areas with high values in the GLCM-based damage index were significantly related to areas with large differences between the scattering intensities of the temporal SAR data. These results illustrate that the GLCM-based damage index calculated directly from the pixel intensities can be significantly affected by the change in scattering intensity caused by the difference in observation mode as well as the temporal change in the scatterers. Therefore, we were not able to obtain sufficient performance in detecting damage-related changes in temporal SAR data under different observation conditions by applying the GLCM-based damage index in urban areas composed of buildings of various sizes and orientations.
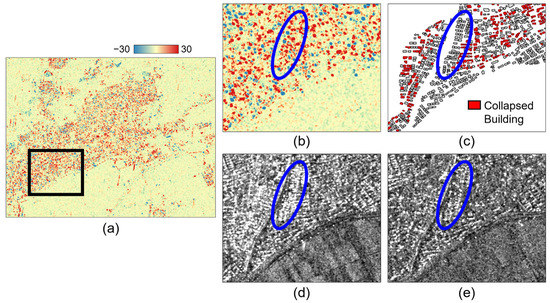
Figure 3.
The GLCM-based damage index of (a) the whole study area, and (b) a zoomed area. The blue circle in the zoom areas illustrates undamaged areas with high values in the GLCM-based damage index. (c) The reference damage map and the original SAR intensity of (d) pre-seismic and (e) post-seismic data for a zoom area.
3.2. Development of Novel Textural Feature-Based Change Analysis Method
The Local Binary Pattern (LBP) [32] is one of the widely used texture descriptors that are less affected by pixel intensity. Traditional LBP operates in a 3 × 3 window and all neighbor pixels are assigned either 0 or 1 using the center pixel as the threshold constant. The LBP texture of the center pixel is defined as a decimal value ranging from 0 to 255 for a 3 × 3 neighborhood, as follows:
where Ic is intensity of center pixel, Ii is intensity of ith neighbor pixel, N is the number of pixels in the neighborhood, and the binary codes S(x) is defined as:
The LBP feature was used in the analysis of SAR images, such as estimating building damage grades [25] and image matching [33]. However, since LBP can be affected by noise in the homogeneous region during the binarization process, it can be sensitive to the speckle effect of the SAR image. Tan and Triggs [34] proposed an extension of the binary pattern to 3-valued codes, named Local Ternary Pattern (LTP). The local ternary codes (LTC) can be formulated by replacing S(x) with a 3-valued function, such as
The LTC further distinguishes darker areas than the center pixel, assigning −1 in the encoding scheme. In addition, the user-specific threshold constant T introduced in LTC can reduce the noise sensitivity of the textural pattern in uniform regions. To apply the LTC to the SAR image, an appropriate threshold constant should be selected according to the radar backscatter characteristics. The variability of the backscatter intensity in the homogeneous area is mainly attributed to the speckle effect of the SAR image. In this study, the speckle standard deviation of the homogeneous region was assigned as the threshold constant of LTC to take into account inherent variability in the SAR image. Figure 4 illustrates the encoding process result of LBP and LTP applied to the pre-seismic SAR image. Here, a window size of 5 × 5 was adopted for the binary and ternary encoding processes to match the GLCM texture. The enlarged area in Figure 4a is the area where the boundary between the agricultural and urban areas is. Compared to the binary code (Figure 4c), the ternary code (Figure 4d) can distinguish between pixels that are slightly brighter than the center pixel and those that are very bright. It can also separate different landcover types by assigning −1 for pixels darker than the center pixel.
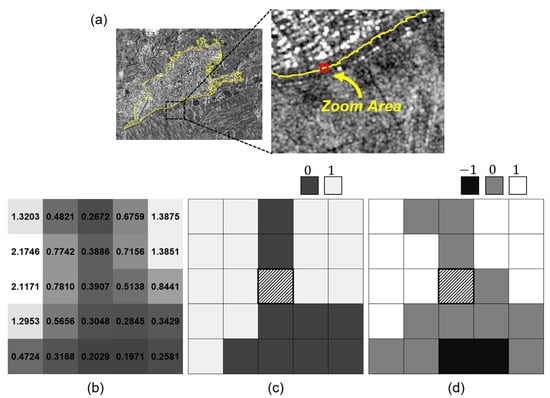
Figure 4.
The comparison of binary and ternary codes: (a) SAR image showing a 5 × 5 zoom area, (b) SAR intensities, (c) binary codes, and (d) ternary code within the window.
The degree of changes can be measured by comparing the two ternary codes obtained from each pixel of the pre-and post-seismic SAR. In this study, we adopted the Hamming distance [35] as a distance metric that can quantitatively calculate the degree of changes from two ternary codes. The Hamming distance DH is defined as the number of positions where the corresponding digits between two equal-length codes are different, such as
where S1 and S2 are two ternary codes of the same length N, and denotes the exclusive-or (XOR) operation. Figure 5 schematically illustrates the contextual change augmentation workflow using the Hamming distance for a window over a severely damaged area. For each of the pre- and post-seismic SAR images, the ternary code for the central pixel was acquired at each sliding window. Then, we compared two ternary codes at the same location within the window and determined the number of different codes. The Hamming distance of the center pixel was calculated by dividing the number of different codes by the total number of neighboring pixels. It is a contextual dissimilarity measure between the two data ranges from 0 for no change to 1 for a complete change.
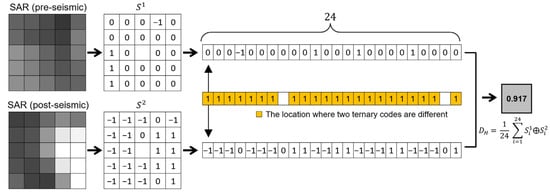
Figure 5.
The process of calculating the Hamming distance of each pixel.
After obtaining the degree of changes from the Hamming distance, a binary classification or decision can be performed to derive a change detection map. One of the simple and unsupervised methods to achieve a binary decision is to set the threshold value. In this study, the threshold value 0.75, which corresponds to the upper 10% of the whole Hamming distance distribution, was empirically determined for the proposed damage detection algorithm.
4. Experimental Results
The proposed change detection method based on the local ternary codes and Hamming distance (hereafter called ‘LTCHD’) was applied to Kompsat-5 data observed in different polarization modes. For comparison, conventional intensity-based and texture-based damage detection methods were also applied to the Kompsat-5 data set. The intensity difference method presented in [4,5,6,7,8] was used for intensity-based damage detection. The log-ratio of pre- and post-seismic SAR intensities was first calculated as the damage index, and then binary change detection was performed using a simple histogram thresholding method [36]. For texture-based damage detection, the GLCM-PCA method [27] was used. Similar to the intensity difference method, the GLCM-based damage index was first calculated from the SAR images before and after the earthquake, and then binary detection was performed using the histogram threshold method.
Figure 6a–c show change detection results obtained from intensity difference, GLCM-PCA, and proposed LTCHD-based methods, respectively. For the convenience of visual interpretation of detection performance, two zoomed areas were selected and assessed in the Mashiki town study area. Within the S1 zoom area, the previous methods detected a lot of changes unrelated to earthquakes. In addition, most of the damaged buildings aligned from the center to the northeast regions were not detected. The change detection result obtained by the proposed method can significantly reduce false alarms in undamaged buildings while properly detecting the damaged areas. There were relatively fewer damages in the S2 zoom area; however, previous methods showed excessive false alarms. The proposed method improved the detection performance by significantly lowering false alarms in the northeast and southeast regions.
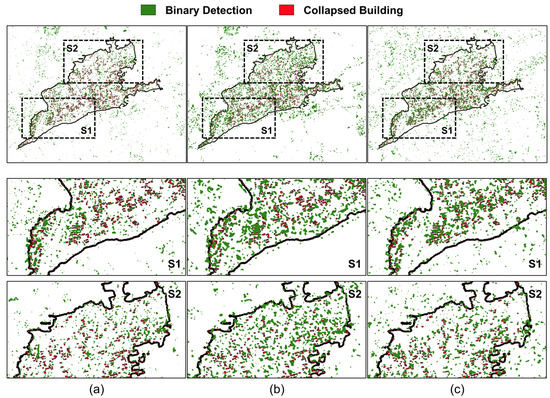
Figure 6.
The damage detection map (green) derived from (a) intensity difference method, (b) GLCM-PCA method, and (c) proposed LTCHD method (Top: study area Mashiki town, Middle: S1 zoom areas, Bottom: S2 zoom areas). Red polygons denote reference building damages.
The accuracy of earthquake damage mapping can be evaluated by comparing the change detection results with the manually generated building damage map. Here, pixel-wise evaluation may not be appropriate because the differences between radar geometry and OSM building geometry can cause discrepancies between SAR pixel coordinates and building footprints of the reference data. For an effective assessment of detection performance, a grid-based approach [8] was used in this study. To generate grid-based damage detection results, we selected a 100 m (40 × 40 pixels) grid cell and obtained the areal damage rate by counting the number of detected pixels within the grid cell. According to manual inspection of OSM building footprints, buildings in Mashiki town had an average size of 225 m2, and each grid cell contained about 9~10 buildings. Therefore, the average proportion of the total area occupied by buildings in each grid cell was about 20%. If the damage rate of each grid was greater than 10% (half of the area occupied by the building), that grid cell was assigned as a damaged grid cell in this study. Figure 7 shows the grid-based damage detection results for each method and the reference damage map.
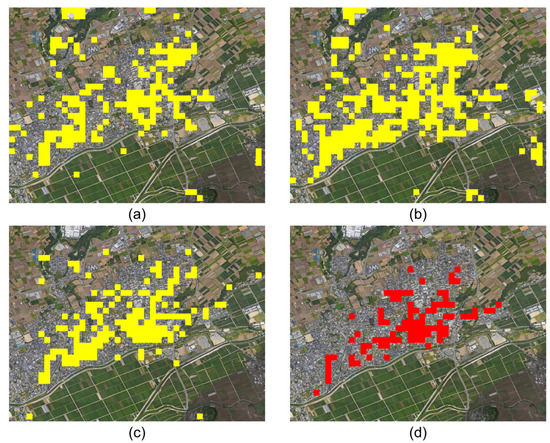
Figure 7.
The results of grid-based damage map (yellow) derived from (a) intensity-based method, (b) GLCM-based method, (c) proposed LTCHD method, and (d) OSM-based reference damage map.
In order to quantitatively assess the detection results, several accuracy metrics were calculated including the detection rate, false alarm rate, Kappa coefficient [37], F1 score [38], and Critical Success Index (CSI) [39]. Table 2 shows the grid-based accuracy analysis for each detection result. Despite the higher false alarm rate, the GLCM-PCA method outperformed the intensity difference method in terms of overall accuracy metrics. It should be noted that the proposed method improved the detection rate compared to the previous GLCM-PCA result and significantly reduced the false alarm rates. According to Kappa, F1 score, and CSI accuracy metrics, the proposed method provided the best overall detection performance among the three methods. Consequently, it can be concluded the texture descriptor that does not directly use the gray level value of the SAR image can significantly improve performance.
Table 2.
Detection accuracies for the different methods.
5. Discussion
In performing the proposed LTCHD-based change detection method, it is necessary to set several parameters, such as the neighborhood window size, threshold constant for ternary code, and threshold for grid-based detection. In this section, the effect of parameter selection on detection performance was further examined.
5.1. The Effect of Window Size on the Change Detection
To implement texture-based change detection methods, a 5 × 5 local window was adopted in this study. However, since the size of the window is an important parameter to extract spatial contextual information, we further analyzed the effects of window size on the proposed texture-based change detection method. In this section, the Hamming distance to determine the degree of change was recalculated using local ternary codes extracted from different window sizes, and the results were evaluated.
To compare the detectability regardless of the threshold values, the performance of each window size was assessed using the Receiver Operating Characteristic (ROC) curve as shown in Figure 8. Here, in the calculation of the detection and false alarm rates in the ROC plane, we used grid-based analysis. The size of the grid and the method of assigning each grid as the damaged grid were the same as in Section 4. In addition to the ROC curve, the Area Under the Curve (AUC) was used for the comparison of detection results obtained from different window sizes as summarized in Table 3. We evaluated different window sizes ranging from 3 × 3 to 11 × 11 in assigning ternary codes and calculating the Hamming distance. Figure 8 and Table 3 revealed that the 5 × 5 window size proposed in this study provided the best detection performance. However, detection abilities were not significantly different among the results obtained from different window sizes.
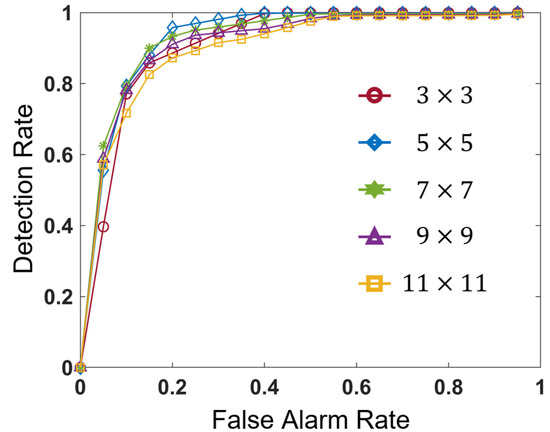
Figure 8.
The ROC curve of detection results obtained from different window sizes ranging from 3 × 3 to 11 × 11 on the proposed texture-based method.
Table 3.
The comparison of AUC for selected window size.
5.2. The Effect of Threshold Contant T of the Ternary Code on the Change Detection
In the extension of binary to ternary codes, the threshold constant T was introduced to improve the resistance to noise. In this study, we set the T value of the ternary code as the standard deviation of the homogeneous areas to consider only the speckle-induced intensity variation. Since it affects local ternary codes, it is necessary to examine the expected change detection results for different T values. Figure 9 shows the degree of changes denoted by the Hamming distance between the ternary codes of temporal SAR data. Here, we used different T values for the calculation of the local ternary codes. Figure 9a corresponds to the case where the T value is 0, that is, the case where the binary code is used for change detection. Figure 9b is the case where the local ternary code is calculated based on the speckle standard deviation of the homogeneous area as proposed in Section 3. Figure 9c corresponds to the case where the ternary code is calculated using a T value three times greater than the speckle standard deviation.
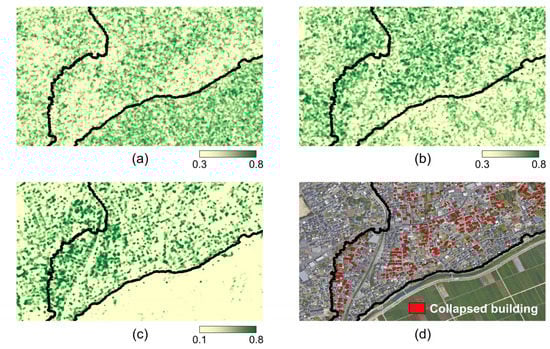
Figure 9.
The Hamming distances calculated from different threshold constants of the local ternary codes: (a) no threshold (local binary codes), (b) speckle standard deviation (intensity standard deviation of the homogeneous area), and (c) three times greater than the speckle standard deviation. (d) The reference damage map.
Compared to the reference image in Figure 9d, damaged buildings were well distinguished from non-damaged buildings with binary codes as shown in Figure 9a. However, the effects of seasonal changes in agricultural areas and speckle variabilities were sensitively reflected in the degree of changes and there were weak contrasts between damaged buildings and changes in agricultural areas. On the other hand, the Hamming distance adequately captured the changes in the building while minimizing the seasonal changes in the agricultural areas in the case of the proposed T value as shown in Figure 9b. When the threshold constant was greater than the speckle variability, changes in damaged building areas were not appropriately highlighted in the Hamming distance as shown in Figure 9c. This is because the ternary code of zero value is often assigned even though the land cover types are different. As a result, it was similar to the result of the GLCM-based method since it can be greatly influenced by the SAR intensity values.
5.3. Grid-Based Damage Rate Evaluation
In Section 4, grid-based accuracy evaluation was performed by assuming that grid cells with a damage rate, i.e., the ratio of the damaged pixels to the total pixels in the grid cell, greater than 10% were damaged grids. Although a binary decision was made on grid cells for quantitative evaluation, the decision criteria for the number of damaged pixels had to be set empirically and may vary depending on urban structures. In this section, damage detection performance was qualitatively evaluated using the damage rate value, instead of making a binary decision for a grid cell. Figure 10a shows the damage rate calculated with the proposed LTCHD method. For comparison, the damage rate derived from the reference damage map is shown in Figure 10b. The overall spatial pattern of SAR-based damage rates exhibited good agreement with the areal damage rates derived from the reference damage map. Both data showed a similar spatial pattern in which more damaged pixels were distributed along the southern boundary of Mashiki town and the number of damaged pixels decreased toward the northeast of the town.
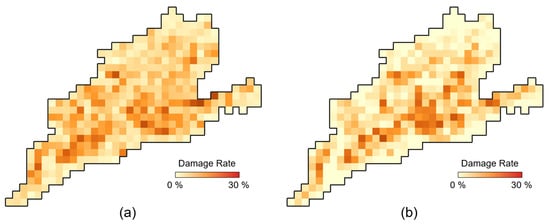
Figure 10.
The grid-based damage rate map derived from (a) the LTCHD-based change detection result and (b) from the OSM-based reference damage map.
To effectively compare the relationship between the SAR-based damage detection and the reference damage map, the damage rates were classified into six damage categories at 5% intervals. The ratios of SAR-based damage categories corresponding to each reference damage category are plotted on the stacked bar graph as shown in Figure 11. Although the two damage rates did not match perfectly as can be inferred from the previous accuracy analysis, the overall trend between the damage levels was highly correlated. As the reference damage rate increases, the ratio of categories with low SAR-based damage rates decreases, and the ratio of categories with high SAR-based damage rates increases. In addition, we can also identify specific patterns of damage levels that can be inferred to be attributed to the inherent characteristics of the SAR signals. The SAR-based damage rate overestimated grid cells with less actual damage, which can be attributed to the changes in SAR signals caused by speckle effects and other natural variations. In addition, since the pixel area corresponding to the building can be smaller than the actual building footprint in the side-looking geometry of the SAR image, the degree of damages in the SAR-based detection results underestimated approximately 10% of the areal damage levels in the severely damaged area.
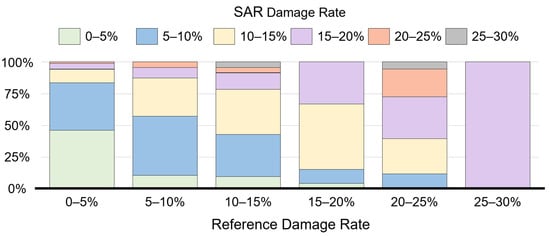
Figure 11.
Comparison of SAR-based damage and reference damage rates.
6. Conclusions
SAR remote sensing has demonstrated great potential in detecting areas affected by natural disasters such as earthquakes. Most studies on the application of SAR remote sensing to damage detection used temporal SAR data in the same observation mode to derive damage information while excluding the effect of the observation mode. However, it is not always possible to obtain time-series SAR data of the same observation mode for unpredictable natural disasters. In particular, when multiple stakeholders are involved in operating a single system, these problems may result in the limited use of SAR technology for disaster applications. In this context, the objective of this study was to develop a method to detect earthquake-induced building damages from temporal SAR data acquired in different observation modes.
This study was conducted using the bi-temporal Komapsat-5 data obtained in different polarization modes. The study area was Mashiki town, which was severely damaged by the 2016 Kumamoto earthquake. In order to overcome the difference in spatial patterns of SAR intensities, we exploited the spatial contextual information to reveal damage-related changes of spatial patterns instead of using conventional intensity-based damage detection. To derive texture information of SAR images by building damages while minimizing the effect of scattering intensity, we proposed a new change detection method based on the local ternary code and Hamming distance. The experimental results showed that the proposed textural analysis can improve detectability in building-damaged areas while maintaining low false alarm rates in agricultural areas even on challenging data. According to the grid-based accuracy analysis, the proposed method can successfully detect the damaged areas with a detection rate of about 72.5% and false alarms of about 6.8%. It was also confirmed that the proposed texture analysis method showed robustness in selecting the window size for local texture calculation and can provide meaningful information on the damage levels as well as binary detection.
The proposed method demonstrates the potential of utilizing SAR having different polarization modes for damage detection. However, sufficient exploration of more challenging data that can have a greater effect on the radar signal than the polarization difference will be required to improve the usability of SAR data for disaster response. Therefore, for rapid and operational detection of damaged areas, an extension of this study for the utilization of multi-modal SAR data such as multi-resolution, multi-incidence angle, and multi-frequency will be investigated in our future study.
Author Contributions
Conceptualization, M.K. and S.-E.P.; Methodology, software, and formal analysis, M.K.; Resources and data curation, S.-J.L.; Writing—original draft preparation, validation, formal analysis, and writing—review & editing, M.K. and S.-E.P.; Project administration, S.-J.L. All authors have read and agreed to the published version of the manuscript.
Funding
This research was supported by the “Satellite Information Application” program of the Korea Aerospace Research Institute (KARI).
Data Availability Statement
The OpenStreetMap data of Japan was downloaded from Geofabrik (http://download.geofabrik.de/asia/japan.html (accessed on 8 March 2021)). Only Kyushu data from Japan was used for the analysis in this study.
Acknowledgments
The authors are grateful to KARI for providing Kompsat-5 data.
Conflicts of Interest
The authors declare no conflict of interest.
References
- Coburn, A.; Spence, R. Earthquake Protection, 2nd ed.; John Wiley & Sons Ltd: Chichester, UK, 2002; p. 338. [Google Scholar]
- Voigt, S.; Kemper, T.; Riedlinger, T.; Kiedfl, R.; Scholte, K.; Mehl, H. Satellite image analysis for disaster and crisis-management support. IEEE Trans. Geosci. Remote Sens. 2007, 45, 1520–1528. [Google Scholar] [CrossRef]
- Dong, L.; Shan, J. A comprehensive review of earthquake-induced building damage detection with remote sensing techniques. ISPRS J. Photogramm. Remote Sens. 2013, 84, 85–99. [Google Scholar] [CrossRef]
- Matsuoka, M.; Yamazaki, F. Use of satellite SAR intensity imagery for detecting building areas damaged due to earthquake. Earthq. Spectra 2004, 20, 975–994. [Google Scholar] [CrossRef]
- Matsuoka, M.; Yamazaki, F. Building damage mapping of the 2003 Bam, Iran, earthquake using Envisat/ASAR intensity imagery. Earthq. Spectra 2005, 21, 285–294. [Google Scholar] [CrossRef]
- Matsuoka, M.; Nojima, N. Building damage estimation by integration of seismic intensity information and satellite L-band SAR imagery. Remote Sens. 2010, 2, 2111–2126. [Google Scholar] [CrossRef]
- Chini, M.; Bignami, C.; Stramondo, S.; Pierdicca, N. Uplift and subsidence due to the 26 December 2004 Indonesian earthquake detected by SAR data. Int. J. Remote Sens. 2008, 29, 3891–3910. [Google Scholar] [CrossRef]
- Dekker, R.J. High-resolution radar damage assessment after the earthquake in Haiti on 12 January 2010. IEEE J. Sel. Top. Appl. Earth Obs. Remote Sens. 2011, 4, 960–970. [Google Scholar] [CrossRef]
- Arciniegas, G.A.; Bijker, W.; Kerle, N.; Tolpekin, V.A. Coherence-and amplitude-based analysis of seismogenic damage in Bam, Iran, using ENVISAT ASAR data. IEEE Trans. Geosci. Remote Sens. 2007, 45, 1571–1581. [Google Scholar] [CrossRef]
- Liu, W.; Yamazaki, F. Extraction of collapsed buildings in the 2016 Kumamoto earthquake using multi-temporal PALSAR-2 data. J. Disaster Res. 2017, 12, 241–250. [Google Scholar] [CrossRef]
- Hoffman, J. Mapping damage during the Bam (Iran) earthquake using interferometric coherence. Int. J. Remote Sens. 2007, 28, 1199–1216. [Google Scholar] [CrossRef]
- Watanabe, M.; Thapa, R.B.; Ohsumi, T.; Fujiwara, H.; Yonezawa, C.; Tomii, N.; Suzuki, S. Detection of damaged urban areas using interferometric SAR coherence change with PALSAR-2. Earth Planets Space 2016, 68, 131. [Google Scholar] [CrossRef]
- Lu, C.H.; Ni, C.F.; Chang, C.P.; Yen, J.Y.; Chuang, R.Y. Coherence difference analysis of Sentinel-1 SAR interferogram to identify earthquake-induced disasters in urban areas. Remote Sens. 2018, 10, 1318. [Google Scholar] [CrossRef]
- Natsuaki, R.; Nagai, H.; Tomii, N.; Tadono, T. Sensitivity and Limitation in Damage Detection for Individual Buildings Using InSAR Coherence–A Case Study in 2016 Kumamoto Earthquakes. Remote Sens. 2018, 10, 245. [Google Scholar] [CrossRef]
- Jung, J.K.; Kim, D.-J.; Lavalle, M.; Yun, S.-H. Coherent change detection using InSAR temporal decorrelation model: A case study for volcanic ash detection. IEEE Trans. Geosci. Remote Sens. 2016, 54, 5765–5775. [Google Scholar] [CrossRef]
- Chen, S.W.; Li, Y.Z.; Wang, X.S.; Xiao, S.P.; Sato, M. Modeling and interpretation of scattering mechanisms in polarimetric synthetic aperture radar: Advances and perspectives. IEEE Signal Proc. Mag. 2014, 31, 79–89. [Google Scholar] [CrossRef]
- Sato, M.; Chen, S.W.; Satake, M. Polarimetric SAR analysis of tsunami damage following the March 11, 2011 East Japan earthquake. Proc. IEEE 2012, 100, 2861–2875. [Google Scholar] [CrossRef]
- Watanabe, M.; Motohka, T.; Miyagi, Y.; Yonezawa, C.; Shimada, M. Analysis of urban areas affected by the 2011 off the Pacific Coast of Tohoku earthquake and tsunami with L-band SAR full-polarimetric mode. IEEE Geosci. Remote. 2012, 9, 472–476. [Google Scholar] [CrossRef]
- Park, S.-E.; Yamaguchi, Y.; Kim, D.-J. Polarimetric SAR remote sensing of the 2011 Tohoku earthquake using ALOS/PALSAR. Remote Sens. Environ. 2013, 132, 212–220. [Google Scholar] [CrossRef]
- Chen, S.-W.; Sato, M. Tsunami damage investigation of built-up areas using multitemporal spaceborne full polarimetric SAR images. IEEE Trans. Geosci. Remote Sens. 2013, 51, 1985–1997. [Google Scholar] [CrossRef]
- Chen, S.-W.; Wang, X.-S.; Sato, M. Urban damage level mapping based on scattering mechanism investigation using fully polarimetric SAR data for the 3.11 East Japan earthquake. IEEE Trans. Geosci. Remote Sens. 2016, 54, 6916–6929. [Google Scholar] [CrossRef]
- Park, S.-E.; Jung, Y.T. Detection of earthquake-induced building damages using polarimetric SAR data. Remote Sens. 2020, 12, 137. [Google Scholar] [CrossRef]
- Haralick, R.M.; Shanmugan, K.; Dinstein, I. Textural features for image classification. IEEE Trans. Syst. Man Cybern. SMC 1973, 3, 610–621. [Google Scholar] [CrossRef]
- Dell’Acqua, F.; Bignami, C.; Chini, M.; Lisini, G.; Polli, D.A.; Stramondo, S. Earthquake damages rapid mapping by satellite remote sensing data: L’Aquila April 6th, 2009 event. IEEE J. Sel. Topics Appl. Earth Observ. Remote Sens. 2011, 4, 935–943. [Google Scholar] [CrossRef]
- Sun, W.; Shi, L.; Yang, J.; Li, P. Building collapse assessment in urban areas using texture information from postevent SAR data. IEEE J. Sel. Topics Appl. Earth Observ. Remote Sens. 2016, 9, 3792–3808. [Google Scholar] [CrossRef]
- Moya, L.; Zakeri, H.; Yamazaki, F.; Liu, W.; Mas, E.; Koshimura, S. 3D gray level co-occurrence matrix and its application to identifying collapsed buildings. ISPRS J. Photogramm. Remote Sens. 2019, 149, 14–28. [Google Scholar] [CrossRef]
- Li, Q.; Gong, L.; Zhang, J. A correlation change detection method integrating PCA and multi-texture features of SAR image for building damage detection. Eur. J. Remote Sens. 2019, 52, 435–447. [Google Scholar] [CrossRef]
- Kato, A.; Nakamura, K.; Hiyama, Y. The 2016 Kumamoto earthquake sequence. Proc. Jpn. Acad. Ser. B 2016, 92, 358–371. [Google Scholar] [CrossRef]
- Asian Disaster Reduction Center, 2016. 2016 Kumamoto Earthquake Survey Report (Preliminary). Available online: https://www.adrc.asia/publications/201604_KumamotoEQ/ADRC_2016KumamotoEQ_Report_1.pdf (accessed on 25 November 2022).
- Lee, J.-S.; Wen, J.-H.; Ainsworth, T.L.; Chen, K.-S.; Chen, A.J. Improved sigma filter for speckle filtering of SAR imagery. IEEE Trans. Geosci. Remote Sens. 2009, 47, 202–213. [Google Scholar]
- Geofabrik, OpenStreetMap Contributors. 2021. Available online: http://download.geofabrik.de/asia/japan.html (accessed on 29 March 2021).
- Ojala, T.; Pietikäinen, M.; Harwood, D. A comparative study of texture measure with classification based on featured distributions. Pattern Recognit. 1996, 29, 51–59. [Google Scholar] [CrossRef]
- Ghannadi, M.A.; Saadaseresht, M. A modified local binary pattern descriptor for SAR image matching. IEEE Geosi. Remote Sens. Lett. 2018, 16, 568–572. [Google Scholar] [CrossRef]
- Tan, X.; Triggs, B. Enhanced local texture feature sets for face recognitiare two ternary codes of the same lengthon under difficult lighting conditions. IEEE Trans. Image Proc. 2010, 19, 1635–1650. [Google Scholar]
- Hamming, R.W. Error detecting and error correcting codes. Bell Syst. Tech. J. 1950, 29, 147–160. [Google Scholar] [CrossRef]
- Kittler, J.; Illingworth, J. Minimum error thresholding. Pattern Recognit. 1986, 19, 41–47. [Google Scholar] [CrossRef]
- Cohen, J. A coefficient of agreement for nominal scales. Educ. Psychol. Meas. 1960, 20, 37–46. [Google Scholar] [CrossRef]
- Goutte, C.; Gaussier, E. A probabilistic interpretation of precision, recall and f-score, with implication for evaluation. In Proceedings of the 27th European Conference on IR Research (ECIR), Santiago de Compostela, Spainy, 21–23 March 2005; pp. 345–359. [Google Scholar]
- Schaefer, J.T. The critical success index as an indicator of warning skill. Weather Forecast. 1990, 5, 570–575. [Google Scholar] [CrossRef]


Disclaimer/Publisher’s Note: The statements, opinions and data contained in all publications are solely those of the individual author(s) and contributor(s) and not of MDPI and/or the editor(s). MDPI and/or the editor(s) disclaim responsibility for any injury to people or property resulting from any ideas, methods, instructions or products referred to in the content. |
© 2023 by the authors. Licensee MDPI, Basel, Switzerland. This article is an open access article distributed under the terms and conditions of the Creative Commons Attribution (CC BY) license (https://creativecommons.org/licenses/by/4.0/).