1. Introduction
Polar regions are very important for studies of the upper atmosphere and magnetosphere as part of the Sun–Earth interaction and space weather. Indeed, in these areas, the solar wind particles can penetrate the Earth’s atmosphere and reach the lower altitudes, contributing to the generation of electric currents and Earth’s magnetic field perturbations. In addition, local field lines are connected to extreme magnetospheric regions, such as the magnetopause and the geomagnetic tail [
1,
2,
3,
4,
5,
6,
7]. The measurement of the geomagnetic field fluctuations in polar regions is therefore an important research tool for the study of magnetospheric dynamics. Important information on this topic can be inferred from a comparison between geomagnetic field observations at Antarctic stations located at the footprint of open and closed field lines [
8] or between Antarctica and Greenland conjugate stations [
9].
The distribution of geomagnetic observatories at a planetary scale strongly favours the northern hemisphere for the predominant presence of industrialized countries. As stated by Alken et al. [
10], data from ground observatories, especially those located in remote areas, together with data from satellites, play a crucial role in the development of geomagnetic field reference models. In this sense, the establishment of geomagnetic observatories and stations in the Antarctic continent should then be considered an admirable effort, to contribute to extending and balancing the geomagnetic monitoring in the two hemispheres. Data collected from the Antarctic INGV observatories at Mario Zucchelli Station (previously Terra Nova Bay, IAGA code TNB, where IAGA is the acronym of the International Association of Geomagnetism and Aeronomy) and at Concordia station (Dome C, IAGA code DMC), the latter managed in cooperation with French institutions, are very useful to fill this gap. The recent Korean Jang Bogo Station [
11], located in immediate proximity to TNB, fits in this context. With the aim of integrating observatory data and monitoring with more spatial detail in this Antarctic sector, we planned to carry out the installation of an autonomous magnetic station in the area of Victoria Land.
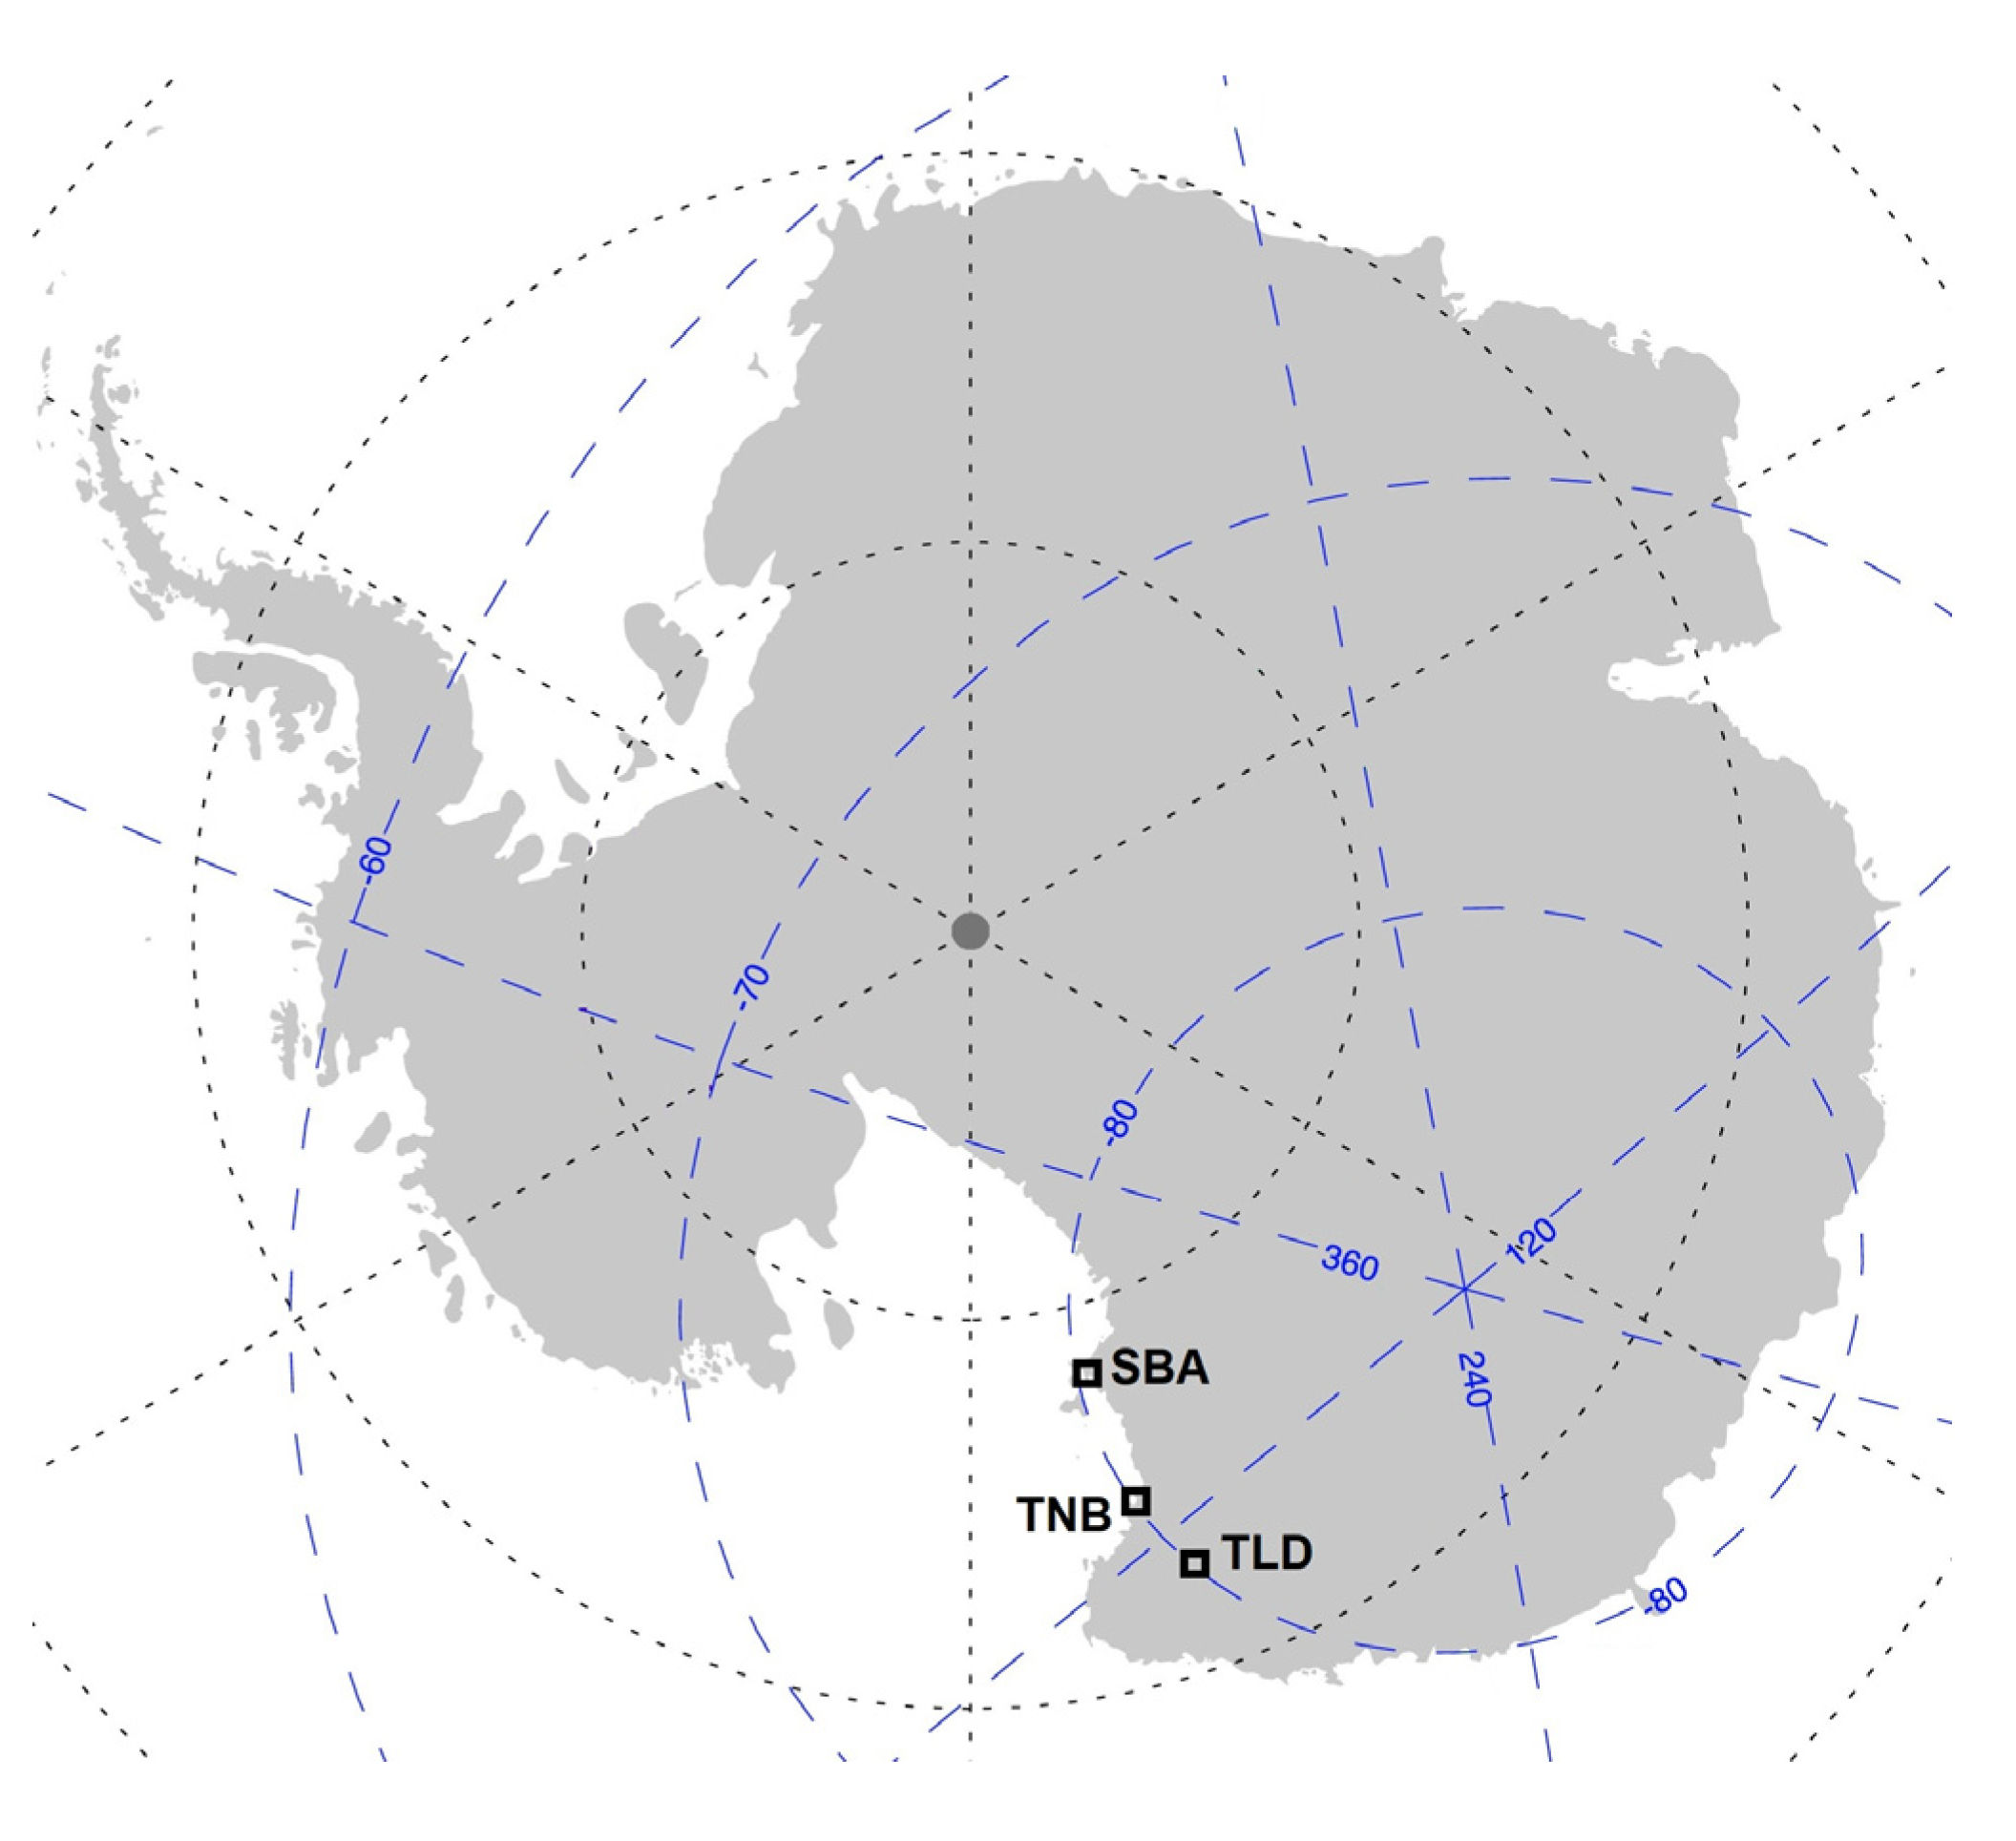
A stand-alone geomagnetic station, able to ensure autonomous operation of the instrumentation with a single annual intervention for maintenance and downloading data and suitable to operate at low temperatures during the Antarctic winter, was developed at the INGV laboratories. This station was installed in December 2020 on the plateau at Talos Dome (TLD), about 300 km from TNB. Talos Dome, together with TNB and New Zealand Observatory at Scott Base (IAGA code SBA), constitutes a network along the 80°S geomagnetic parallel, covering about two hours in magnetic local time (
Figure 1 and
Table 1).
This installation allows a more complete temporal and spatial coverage of the geomagnetic monitoring along the 80°S parallel within the Polar Cap, which is interesting for the study of the longitudinal propagation of the variations triggered by external sources.
Data collected from this new station and from the existing geomagnetic observatories, together with data from the LEO satellites addressed to the same kind of observations, will allow to study of different phenomena related to the dynamics of the magnetosphere and its interaction with the solar wind. In particular, the coherence and propagation of ULF waves in the polar cap and the contribution of different current systems to the diurnal variation can be investigated.
In 2007, Italy joined an international program, AIMNet (Antarctic International Magnetometer Network), for the installation of a network of stand-alone magnetometers in Antarctica contributing to the installation of a magnetometer station at TLD. The experiment was partially successful because technical problems in instrumental devices limited the length of the dataset to only two months (18 January–14 March 2008). Thanks to this dataset, a comparative analysis of geomagnetic field variations at SBA, TNB and TLD was performed to analyse the daily variation and low-frequency pulsations at the three sites along the 80°S magnetic meridian [
12]. The results showed that the daily variation is dependent on local time rather than MLT, suggesting that, even at such high latitudes, the effects of mid-latitude ionospheric currents are dominant, with respect to the field-aligned currents, in determining the diurnal geomagnetic field variation. As to low-frequency pulsations (Pc5, 1–7 mHz), the authors found that their power maximizes around magnetic local noon, when the stations approach the polar cusp, while the coherence between pairs of stations maximizes in the magnetic local nighttime sector; from the analysis of single pulsation events, the wave propagation direction, consistent with a solar-wind-driven source in the daytime and with substorm-associated processes in the nighttime sector, was also determined. A peculiarity of the TLD position with respect to TNB and SBA is that it is more than 200 km from the coast, while TNB and SBA, like most of the Antarctic observatories, are coastal observatories. This different location with respect to the coast provided the opportunity to study the coast effect [
13]. The results showed that in the Pc5 frequency range, the spectral power levels in the vertical component and the coherence between horizontal and vertical components are higher at the coastal stations, as well as the amplitude of induction arrows. These results confirm TLD as a suitable reference station since the coast effect is relatively small.
For such reasons, the scientific potential and the promising results from the limited dataset collected in 2008 inspired the proposal of a new project to address the same scientific questions with more performing instrumentation to face the very harsh environmental conditions of the Antarctic plateau.
In this paper, we present the characteristics of the instrument and of the installation of the overall station. We also show an overview of the dataset available to date, with a comparison to in loco meteorological data. Finally, we select two days—one characterized by quiet geomagnetic conditions and the other by the occurrence of a geomagnetic storm—for a comparison with simultaneous observations from the TNB and SBA.
2. Instrumental Design and Installation
The Antarctic geomagnetic station was installed at Talos Dome (geographic coordinates 72°49′57”S–159°12′58”E), along the 80°S magnetic parallel.
The station was designed and built at the INGV laboratory of electronics in Rome. It is equipped with a fluxgate Lemi-046 vector magnetometer for the continuous recording of the Earth’s three orthogonal magnetic field components (H, D, Z).
The goal was to obtain the longest data time series, including the months of complete darkness when the temperature can reach −60 °C, with the intention to maintain a continuous acquisition of the instrument also in the coming austral winters.
Regarding the technological development, a complete stand-alone system for measuring geomagnetic field variations was developed using a low-power system (1.2 W), powered by batteries charged by a wind generator and solar panel (
Figure 2). This double energy source for charging batteries represents an advantage in that it can reduce the potential of a complete stop of the station. The entire technologic architecture was designed to operate independently during the austral winter, with a single annual intervention for maintenance and data download, to face the very low environmental temperature and to minimize the noise from the installation itself to magnetic recordings. Data sampling is at 1 Hz. The position and timestamps are retrieving by using a GPS system embedded in the station. The structure of the station power supply system and the connection diagram are shown in
Figure 2.
Figure 3 shows a schematic representation of the station, with connections among the elements and their spatial location. We therefore have power supply parts, connected to the batteries, and an area with magnetic instrumentation, at an appropriate distance. The diagram represents the real distribution of the elements above and below the snow surface. Elements above the snow level are supported by robust structural parts to make them stable even in the presence of strong winds. Starting from the right side, a 260 WMarlec Rutland 914i wind generator is shown, mounted on a pole of about 4 m height. A 100 W solar panel mounted on 2.5 m poles provides a constant current intensity of about 20 A and is oriented towards the geographic North; the vertical position of the panel and its orientation guarantee the least deposit of snow and the greatest solar radiation on the surface.
Below the photovoltaic panel, on the aluminum poles, an insulated box houses a MarlecHRSi charge controller, which allows for the adjustment of the voltages of both the wind generator and the solar panel. The charge controller is connected to the two battery packs for their recharging. The batteries are FIAMM flooded batteries with a density of 1.32 mg/L of acid. These batteries have already been tested and used in the harsh conditions of the Antarctic plateau. The batteries were positioned below the surface of the snow for protection and thermal insulation and to guarantee a stable working temperature.
The batteries power the fluxgate magnetometer LEMI-046 electronics, specifically designed by the Lviv Centre of the Institute for Space Research of National Academy of Sciences of Ukraine and State Space Agency of Ukraine to work in the polar regions (with an operating temperature ranging from −65 °C to +50 °C). Moreover, Amphenol military connectors and silicone rubber wires, specifically manufactured for low temperatures, were used. The electronics are located about 15 m from the power supply area. To ensure an adequate operation, the electronics were placed inside a box with double thermal insulation, along with the GPS antenna. The box was positioned just below the snow surface to guarantee its thermal stability and to facilitate data downloading. The fluxgate sensor was installed below the snow surface, at about a 1.5-m depth, leaning on a marble base; it was levelled and oriented along the magnetic meridian and covered by an insulated wooden case. Once the installation was completed, the acquisition started, and data were addressed to a compact flash card.
Geomagnetic measurements are particularly sensitive to any interference with other instrumentation, so all elements of the station were mounted in a row to maximize the distance of the fluxgate sensor from the parts which generate the greatest electromagnetic noise. In this configuration, the wind generator, which is the noisiest energy source, has a distance of about 30 m from the magnetometer. Moreover, nonmagnetic materials (i.e., aluminium or wood) were used for the development of the station.
In the polar regions, electronic parts need a suitable temperature for working and the lowest possible energy consumption must be achieved. In this sense, we exploited the heat of the electronics already present for increasing the thermostating effect, housing the switching elements inside the insulated boxes containing the electronics parts.
3. Data Overview and Analysis
Variations in the Earth’s magnetic field are measured along three directions oriented with respect to the local magnetic meridian: the horizontal magnetic field H component (south–north), the orthogonal component D in the horizontal plane (west–east, D is an intensive element, expressed in nT, and not the angular element declination) and the vertical Z component.
Collected data cover about 11 months between the end of year 2020 and 2021, more specifically from 3 December 2020 to 7 December 2021, with a data gap from 11 July 2021 to 29 August 2021 during the local winter, when the absence of light and weak wind caused a complete stop in data collection.
For characterizing the environment in which the new station operates and to understand whether failures in our acquisition system could be due to some adverse meteorological conditions, we used data from Paola meteorological station, operating in the same area of the TLD. This station is part of the Meteo Climatological Observatory Network (
https://www.climantartide.it/dataaccess/aws/index.php?lang=it&aws=Paola (accessed on 2 November 2021)), operating in the Victoria Land region. In detail, the meteorological data we consider are the wind velocity and the ambient temperature (T), with a 1-h time resolution.
In
Figure 4 we show meteorological and geomagnetic data for the first (upper panels) and the second (lower panels) semester of 2021.
In this figure, geomagnetic data are plotted with a 1-h resolution for a suitable comparison with meteorological data. For each semester from top to bottom we present wind speed, ambient temperature, electronic unit temperature, fluxgate sensor temperature, power system voltage, and H, D and Z geomagnetic field components. The first and the second quantities in each panel are from the Paola database, while the others are from the geomagnetic station.
During the local winter, both stations stopped working due to the extreme conditions (the geomagnetic station worked longer, until almost mid-July). Coincidentally, at the end of August, both the geomagnetic and meteorological data acquisition started again. From this, it became clear that the wind gusts recharge the batteries (see, for example, in mid-June after the previous stop).
Analysing the measured raw signals (not shown here), we found that the data are noisy only during about one month (from 13 April 2021 to 8 May 2021); this noise is present on all components but more evident on the D component. We note that the 13 April is the first day when T drops below −55 °C and the wind is negligible. On that day, the temperature of the electronics drops below −30 °C for the first time; this could be related to the data noise observed.
In the T trend, as well as in the temperature of the electronics, it is interesting to see how in the first and last months of the year, there is a very regular variation due to the presence of the sun. Around the December solstice, the sun is always present in the sky but its movement takes on an apparent curve, with greater and lesser height with respect to the horizon. For a few days around the equinoxes, the sun appears and disappears with a day/night alternation.
It is evident that in austral summer months, as well as in equinoctial months, the batteries are recharged mainly by the solar panel, and the voltage shows a regular daily variation. Conversely, in the months when the solar radiation is missing, the batteries can be charged only by a wind generator; see for example the voltage increase in mid-June, as well as in mid-September, which correspond to wind gusts with a velocity up to 15–18 m/s.
Looking at the data related to the electronics and ambient temperature in
Figure 4, it is also interesting to see that heat dissipation from the electronics prevents the temperature inside the hosting box from dropping below −40 °C even when, at the same time, the ambient temperature reaches at least −55 °C.
Furthermore, the main characteristics of the fluxgate Lemi-046 magnetometer, in addition to its operating temperature, are the noise level measured at the frequency of 1 Hz ≤ 10 pT/√Hz, the measurement range of ±68,000 nT and the possibility of operating with a voltage ranging from 9V to 18V when the battery level drops below 12 V.
For evaluating the quality of the data from the temporary station at TLD, we performed a comparison with simultaneous data from the nearby geomagnetic observatories TNB and SBA. For uniformity, we used 1-min averaged data in the geomagnetic reference frame. SBA data, downloaded from the INTERMAGNET data repository (
https://intermagnet.github.io/ (accessed on 10 November 2022)), were rotated from the geographic to the geomagnetic reference frame.
Two examples of the Earth’s magnetic field variations, measured along three directions oriented with respect to the local magnetic meridian (that is: H, D and Z) are shown for TLD, TNB and SBA both in a quiet (a) and in a disturbed day (b) in
Figure 5. The disturbed day on 12 May 2021 is characterized by a geomagnetic storm with a Sudden Storm Commencement (SSC) occurring at 06:37 UT; this storm was unique in the sense that it occurred during a solar minimum at a time when usually very few geomagnetic storms are expected. The parameters characterizing this geomagnetic storm are: Dst peak = −61 nT, Kp = 7, AE∼1500 nT.
The choice of the quiet day was made on the basis of the Southern Polar Cap Magnetic Index (
https://pcindex.org/ (accessed on 15 November 2021)) which, according to IAGA, constitutes a quantitative estimate of geomagnetic activity at polar latitudes [
14]; indeed, the
PC index can be considered as a proxy for energy that enters into the magnetosphere during solar wind–magnetospehere coupling and is derived from the magnetic data of only two stations—Thule and Vostok—located in the northern (
PCN) and southern (
PCS) near-pole regions.
The comparison of the daily magnetograms of the three geomagnetic field components indicates that in both cases (quiet and stormy situations), there is a good agreement for the three stations. The agreement of the TLD data with the two other historical permanent observatories is a valid test of the quality of the measurements.
The quiet day plot (a) shows that the geomagnetic fluctuations increase in the last hours of the day when the stations are closer to their magnetic local noon (
Table 1). In fact, the Pc5 fluctuation power at all stations reaches a maximum around local magnetic noon, when the stations approach the polar cusp and the local field lines are closer to the magnetopause [
15,
16,
17,
18], and reach their minimum in the magnetic post-midnight sector.
Even in the moderate stormy day plot (b), it is evident that the observations at the three stations are very similar.
Another positive test is provided by the power spectral density of TLD signals for the quiet and disturbed day that is comparable to the other stations (
Figure 6), showing that the data quality is still comparable to that of well-established geomagnetic observatories. In this figure (panels a, b) the power spectral density (PSD) of the components was computed using Welch’s overlapped segment-averaging method.
Figure 7 shows the comparison of the dynamic spectra of the H component for the three stations for the quiet day (a) and for the disturbed one (b), respectively. The dynamical spectral analysis on 1-min data for the two days was performed, with a 2-h time window at 1-h step size. The H component dynamic spectra for the quiet day (a) shows a sharp, persistent power enhancement (between 2 and 4 mHz) when each station approaches the polar cusp region, in correspondence of its local geomagnetic noon (at 19:10 UT for SBA; 20:22 UT for TNB; 21:13 UT for TLD, see
Table 1). Conversely, for the day in which the geomagnetic storm occurs, both the magnetograms and the dynamic power spectra show features which simultaneously occur at the three stations (b): the SSC at 06:37 UT with the corresponding sharp power enhancements and the following power intensifications (in the intervals ~12–17 UT and ~20–21 UT).
For the disturbed day, in which simultaneous fluctuations occur, we also performed a coherence analysis between the three possible, with 2-h time window at a 1-h step size (
Figure 8). We restricted the analysis to the 04–22 UT time interval, when Pc5 fluctuations occur (
Figure 5b and
Figure 7b). In correspondence of the SI at 06:37 UT the coherence is high between all of the coupled stations and for the whole analysed frequency range. For the rest of the day, we note that the coherence is higher for the couple of stations TLD-TNB, which are closer with respect to TNB-SBA (
Figure 1,
Table 1); as expected, the coherence between TLD and SBA is the lowest, being that the distance among these stations the largest. The coherence also exhibits some peaks, at discrete frequencies, in the same time intervals 12–17 UT and 20–21 UT in which power enhancements occur, as shown in
Figure 7. The high coherence between TLD and TNB provides a further confirmation of the high quality of the TLD data.
4. Discussion
Geomagnetic field observations in Antarctica are particularly valuable since the local field lines reach the extreme magnetospheric regions, i.e., the magnetopause, the polar cusp and the geomagnetic tail, where several interaction mechanisms with the solar wind occur, giving rise to the magnetospheric dynamics [
1,
2,
3,
4,
5,
6,
7].
Therefore, any new observation point is important and plays an interesting key role in this context.
The chosen measurement site of Talos Dome, on the Antarctic plateau, is about 300 km from TNB, the geomagnetic Italian observatory at Mario Zucchelli Station, run by the INGV. In December 2020, in the frame of the PNRA project, an automatic geomagnetic station for monitoring the Earth’s magnetic field variations was installed at this location. This autonomous station was designed and assembled in the INGV electronic laboratories in Rome, using a vector magnetometer specifically manufactured by Lviv Institute (Ukraine) for operating at very low temperatures. The low-power system is supplied by batteries recharged by a wind generator and solar panel. Data sampling is 1Hz. A weakness of the station is that it is not equipped with any remote link, so an annual intervention is necessary for data download; this feature can represent a disadvantage in that no real-time data are available. Moreover, in these conditions any possible instrumental failures occurring between two annual visits cannot be detected until the following scheduled visit, so any necessary maintenance intervention is delayed. Even during these periodic visits, other possible difficulties may arise from the unpredictable weather conditions such as the possibility for an airplane/helicopter to fly and land, and the snow accumulation that may require the periodic raising of poles, panels and battery packs.
The availability of simultaneous measurements from the TNB and the New Zealand observatory of Scott Base SBA (data accessible via INTERMAGNET database), allows an interesting comparison in that the three stations are located at approximately the same geomagnetic latitude (~80°S); the stations at such latitude lay in the polar cap, approaching the dayside cusp around local magnetic noon. Moreover, SBA, TNB and TLD are at approximately 2 hours total span in magnetic local time. TLD, together with TNB and SBA, constitutes a network along the 80°S geomagnetic parallel, which is interesting for the study of the longitudinal propagation of signals, as made clear from a past study based on a limited dataset from a previous installation at TLD [
12].
The opportunity of using data from an additional point of observation allows a deeper investigation of phenomena, extending the past scientific works on that polar region. In fact, starting from previous studies based on measurements from TNB, at the corrected geomagnetic latitude of 80°S, and from the Italian–French Concordia Observatory at Dome C (DMC) close to the geomagnetic pole [
19,
20,
21,
22], further investigations may benefit from the TLD dataset for further characterization of the geomagnetic field temporal and spatial variations and its relation with Solar Wind parameters in the Antarctic region.
Previous studies have shown that the Pc5 fluctuation power at TNB presents a well-known pronounced maximum around local magnetic noon, when the station approaches the polar cusp and the local field lines are closer to the magnetopause [
15,
16,
17,
18]. The same behaviour is observed at SBA, and a comparison between the Pc5 power at TNB and SBA has been used as a tool for estimating the longitudinal position of the cusp and for examining its movements in response to interplanetary conditions [
23]; this study has proven that ground-based data at 80°S geomagnetic latitude can be used as a reliable alternative to satellite data, which are typically used to study the polar cusp position and displacement, as shown also by [
24].
The alignment of the SBA, TNB and TLD along the 80°S geomagnetic parallel, which also includes the French observatory of Dumont D’Urville DRV at a longer distance, allowed us to study the longitudinal propagation of geomagnetic signals [
12,
25,
26]. These studies have shown that Pc5 geomagnetic field fluctuations propagate in the anti-sunward direction around local geomagnetic noon, as expected for a generation mechanism related to the solar wind flow. In the nighttime sector, the propagation direction was found to be away from midnight, as expected for substorm-related phenomena ([
27] and references therein). With the inclusion of TLD, a total extension of 6 hours in magnetic local time along the 80°S geomagnetic parallel may be considered, which will allow an increase in the cited studies on wave propagation.
Another interesting aspect of geomagnetic field variations in Antarctica is the daily variation, which gives information on the magnetospheric current systems [
28,
29,
30,
31,
32,
33]. In this case, the TLD observations can be useful to extend these studies, as shown in [
12].
In the present study, we perform a dynamical spectral analysis for SBA, TNB and TLD in two different magnetospheric conditions: a quiet and a disturbed day (a and b, respectively, in
Figure 7). The H component dynamic spectra for the quiet day show a sharp power peak when each station approaches the polar cusp region, in correspondence of its own local geomagnetic noon (at 19:10 UT for SBA; 20:22 UT for TNB; 21:13 UT for TLD). Such a clear time shift between the stations, corresponding to the difference in MLT (with SBA leading ~1 hr with respect to TNB and ~2 hrs with respect to TLD), clearly indicates the local character of the observed phenomena related to the cusp region. This result agrees with previous findings [
12,
25]. For the disturbed day, in which a geomagnetic storm occurs, the dynamic power spectra show evident simultaneous features at the three sites, also detectable from magnetograms: the SSC at 06:37 UT corresponding to the relative sharp power enhancement and the other power intensifications in the following temporal intervals in
Figure 7b. For this disturbed day we also performed a coherence analysis which shows that simultaneous features are also highly coherent (
Figure 8). Such synchronous, coherent events indicate the global character of the observed phenomena during a day with a high level of geomagnetic activity of external origin [
34]. In fact, a geomagnetic storm is a global disturbance of the Earth’s magnetosphere that occurs in correspondence with a burst of radiation and charged particles emitted from the Sun.
5. Conclusions
In general, the global distribution of geomagnetic observatories is still quite unbalanced in favour of the Northern Hemisphere; trying to increase the few measuring points of the geomagnetic field in Antarctica is a very important task for better studying the magnetospheric dynamics at high latitudes and for characterizing of the Southern Hemisphere polar regions. In this sense, in the Antarctic continent more than in other parts of the planet, any new installation of a magnetometer from uncovered areas is appreciable and useful.
The PNRA Project “Temporary magnetometer network for longitudinal and latitudinal monitoring in Antarctica” aimed at activating a new station in the Antarctic territory, in order to integrate observatory measurements with those made at different points of the polar region, whose relative geometry with respect to the other observatories makes them particularly interesting. In December 2022, a new geomagnetic station was installed at Talos Dome, on the Antarctic plateau. The goal of obtaining the longest possible data series and keeping the station working even during the austral winter, when the temperature can reach −60 °C, was achieved. Indeed, we recorded almost 11 months of data in one year. Currently, the station is still operating and hopefully will provide additional data, which will be downloaded every year. The quality of the recorded data was checked by a comparison with two near observatories, with daily magnetograms, spectral analysis and coherence analysis.
The preliminary results from this study confirm the importance and utility of considering an additional geomagnetic field observation point for a deeper investigation of the remote areas of our planet, which are still poorly monitored. TLD results showed this to be a good remote site for retrieving geomagnetic data, away from well-established geomagnetic observatories. In this sense, the new installed station results are useful. The availability of a sufficiently-long time series will allow for a robust statistical analysis in comparison with simultaneous ground and satellite data.

 ,
, 


