
Landslide Susceptibility Mapping and Interpretation in the Upper Minjiang River Basin


Abstract
:
1. Introduction
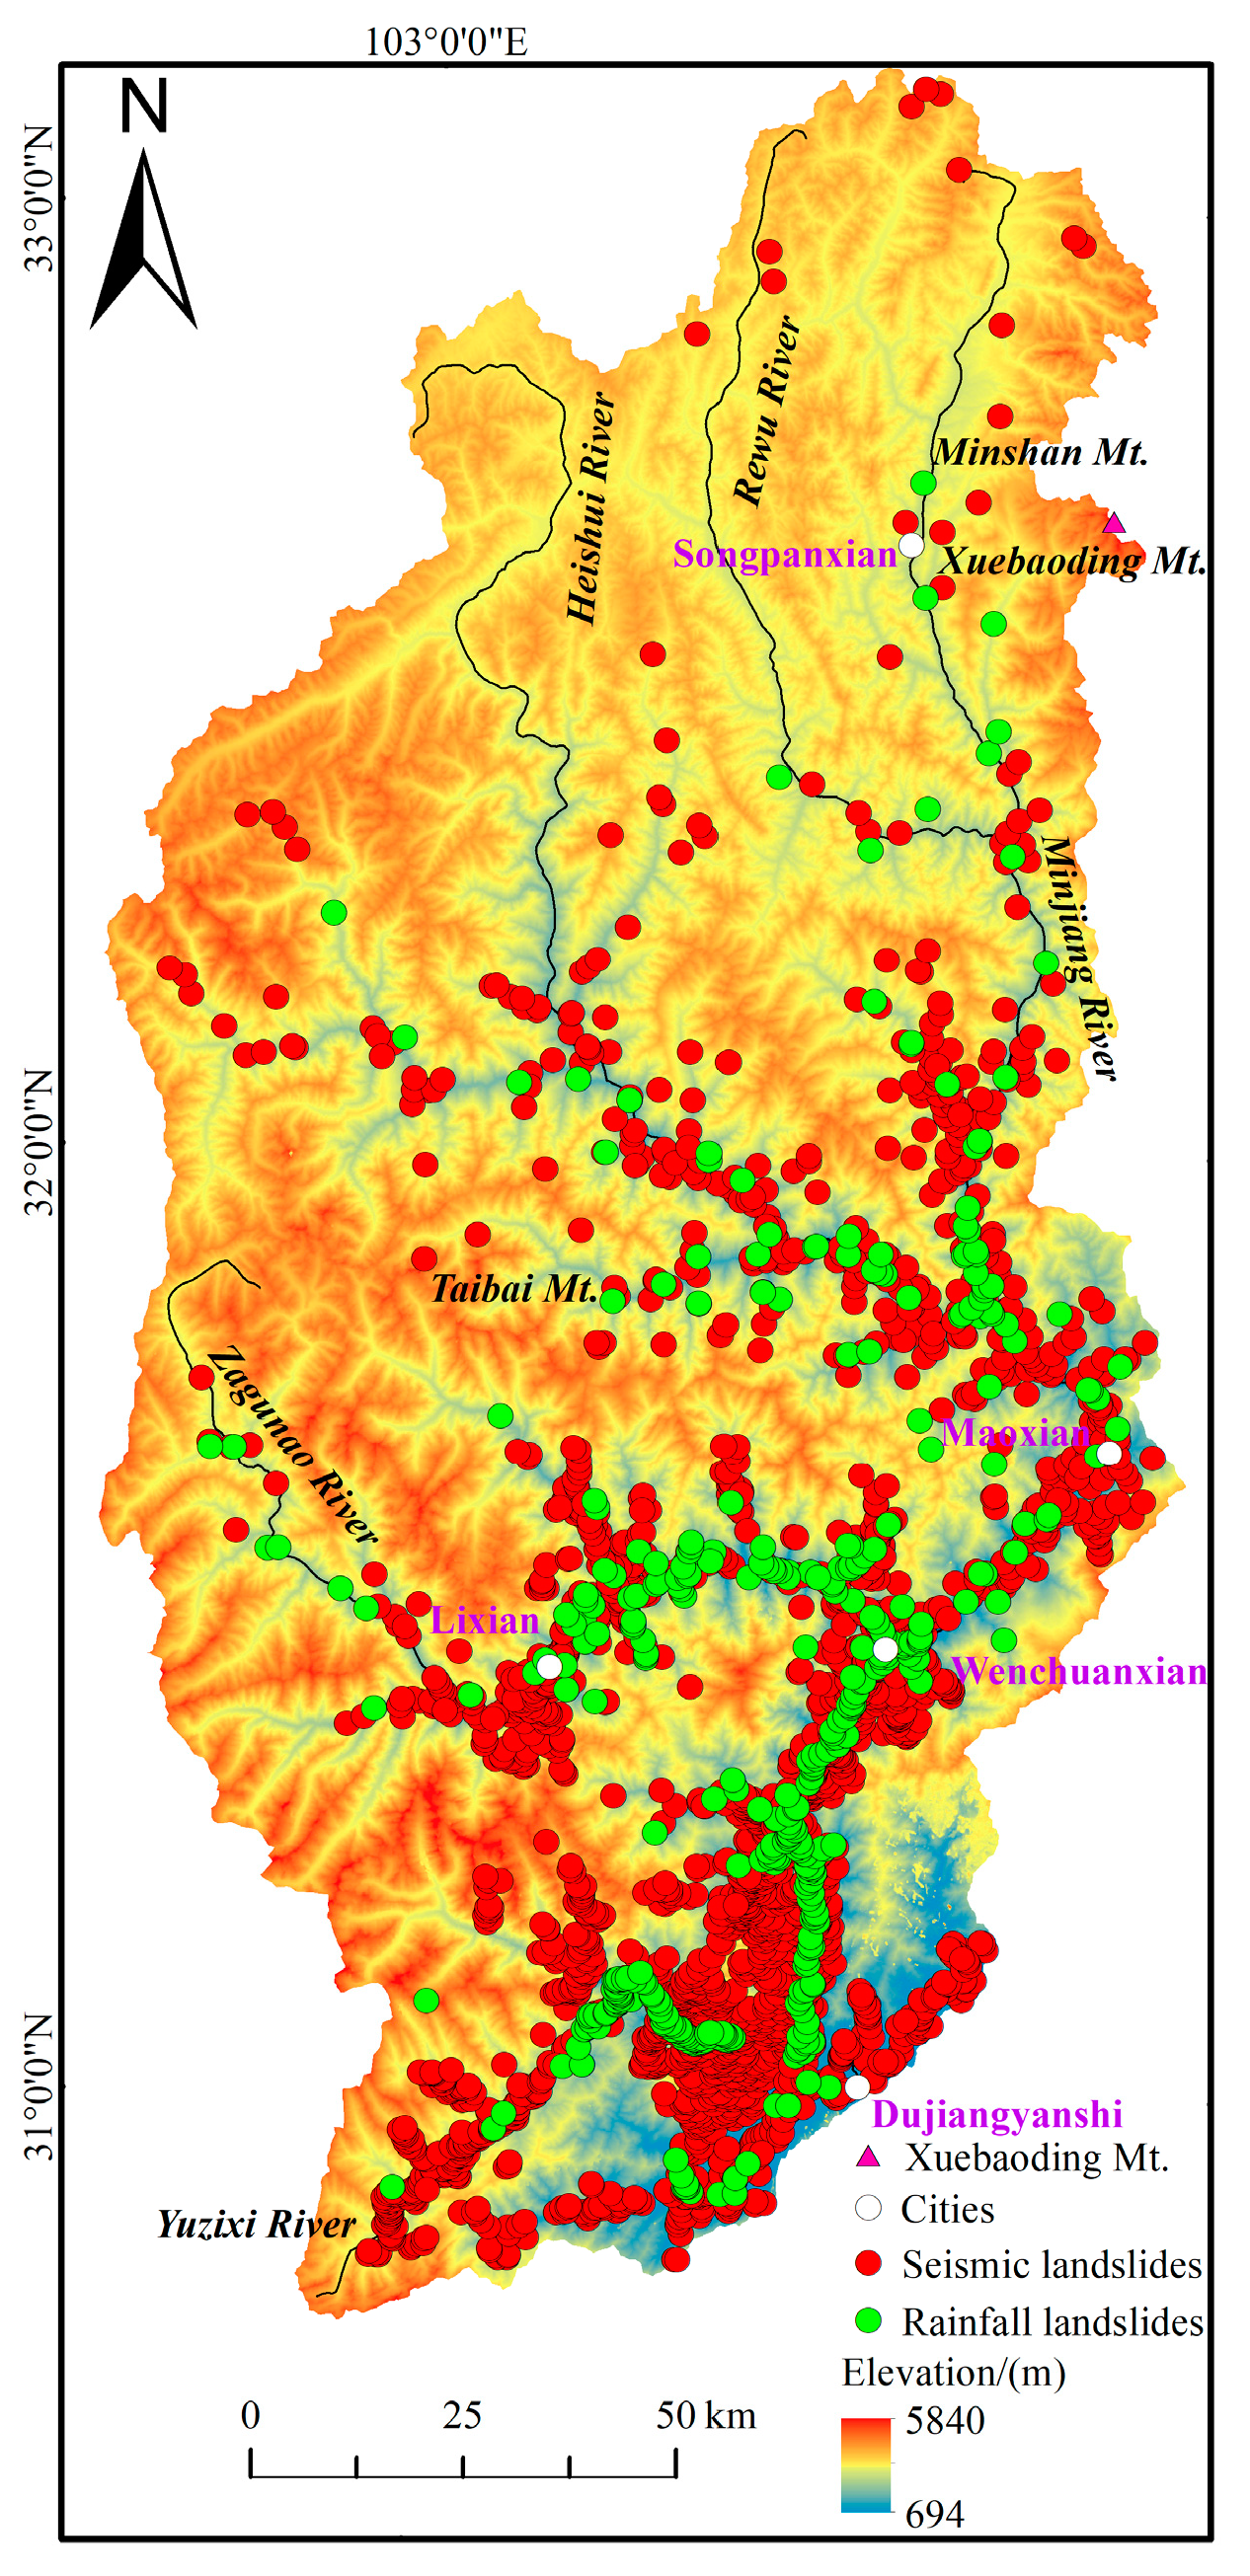
2. Study Area
3. Research Data and Methods
3.1. Data
3.2. Study Methods
3.2.1. Weight of Evidence Model
3.2.2. Random Forest Model
3.2.3. WOE-RF Model
3.2.4. Accuracy Validation of WOE-RF Model
3.2.5. Landslide Susceptibility Classification
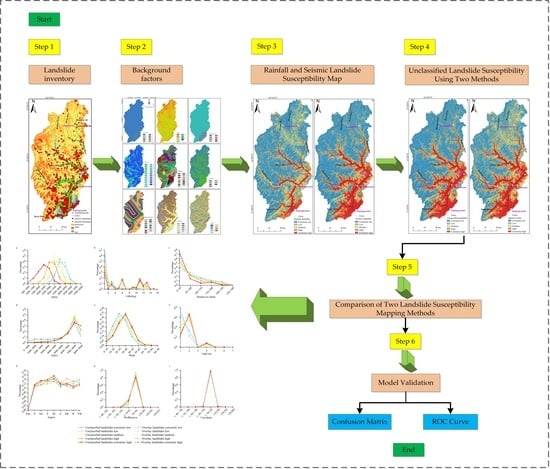
4. Results
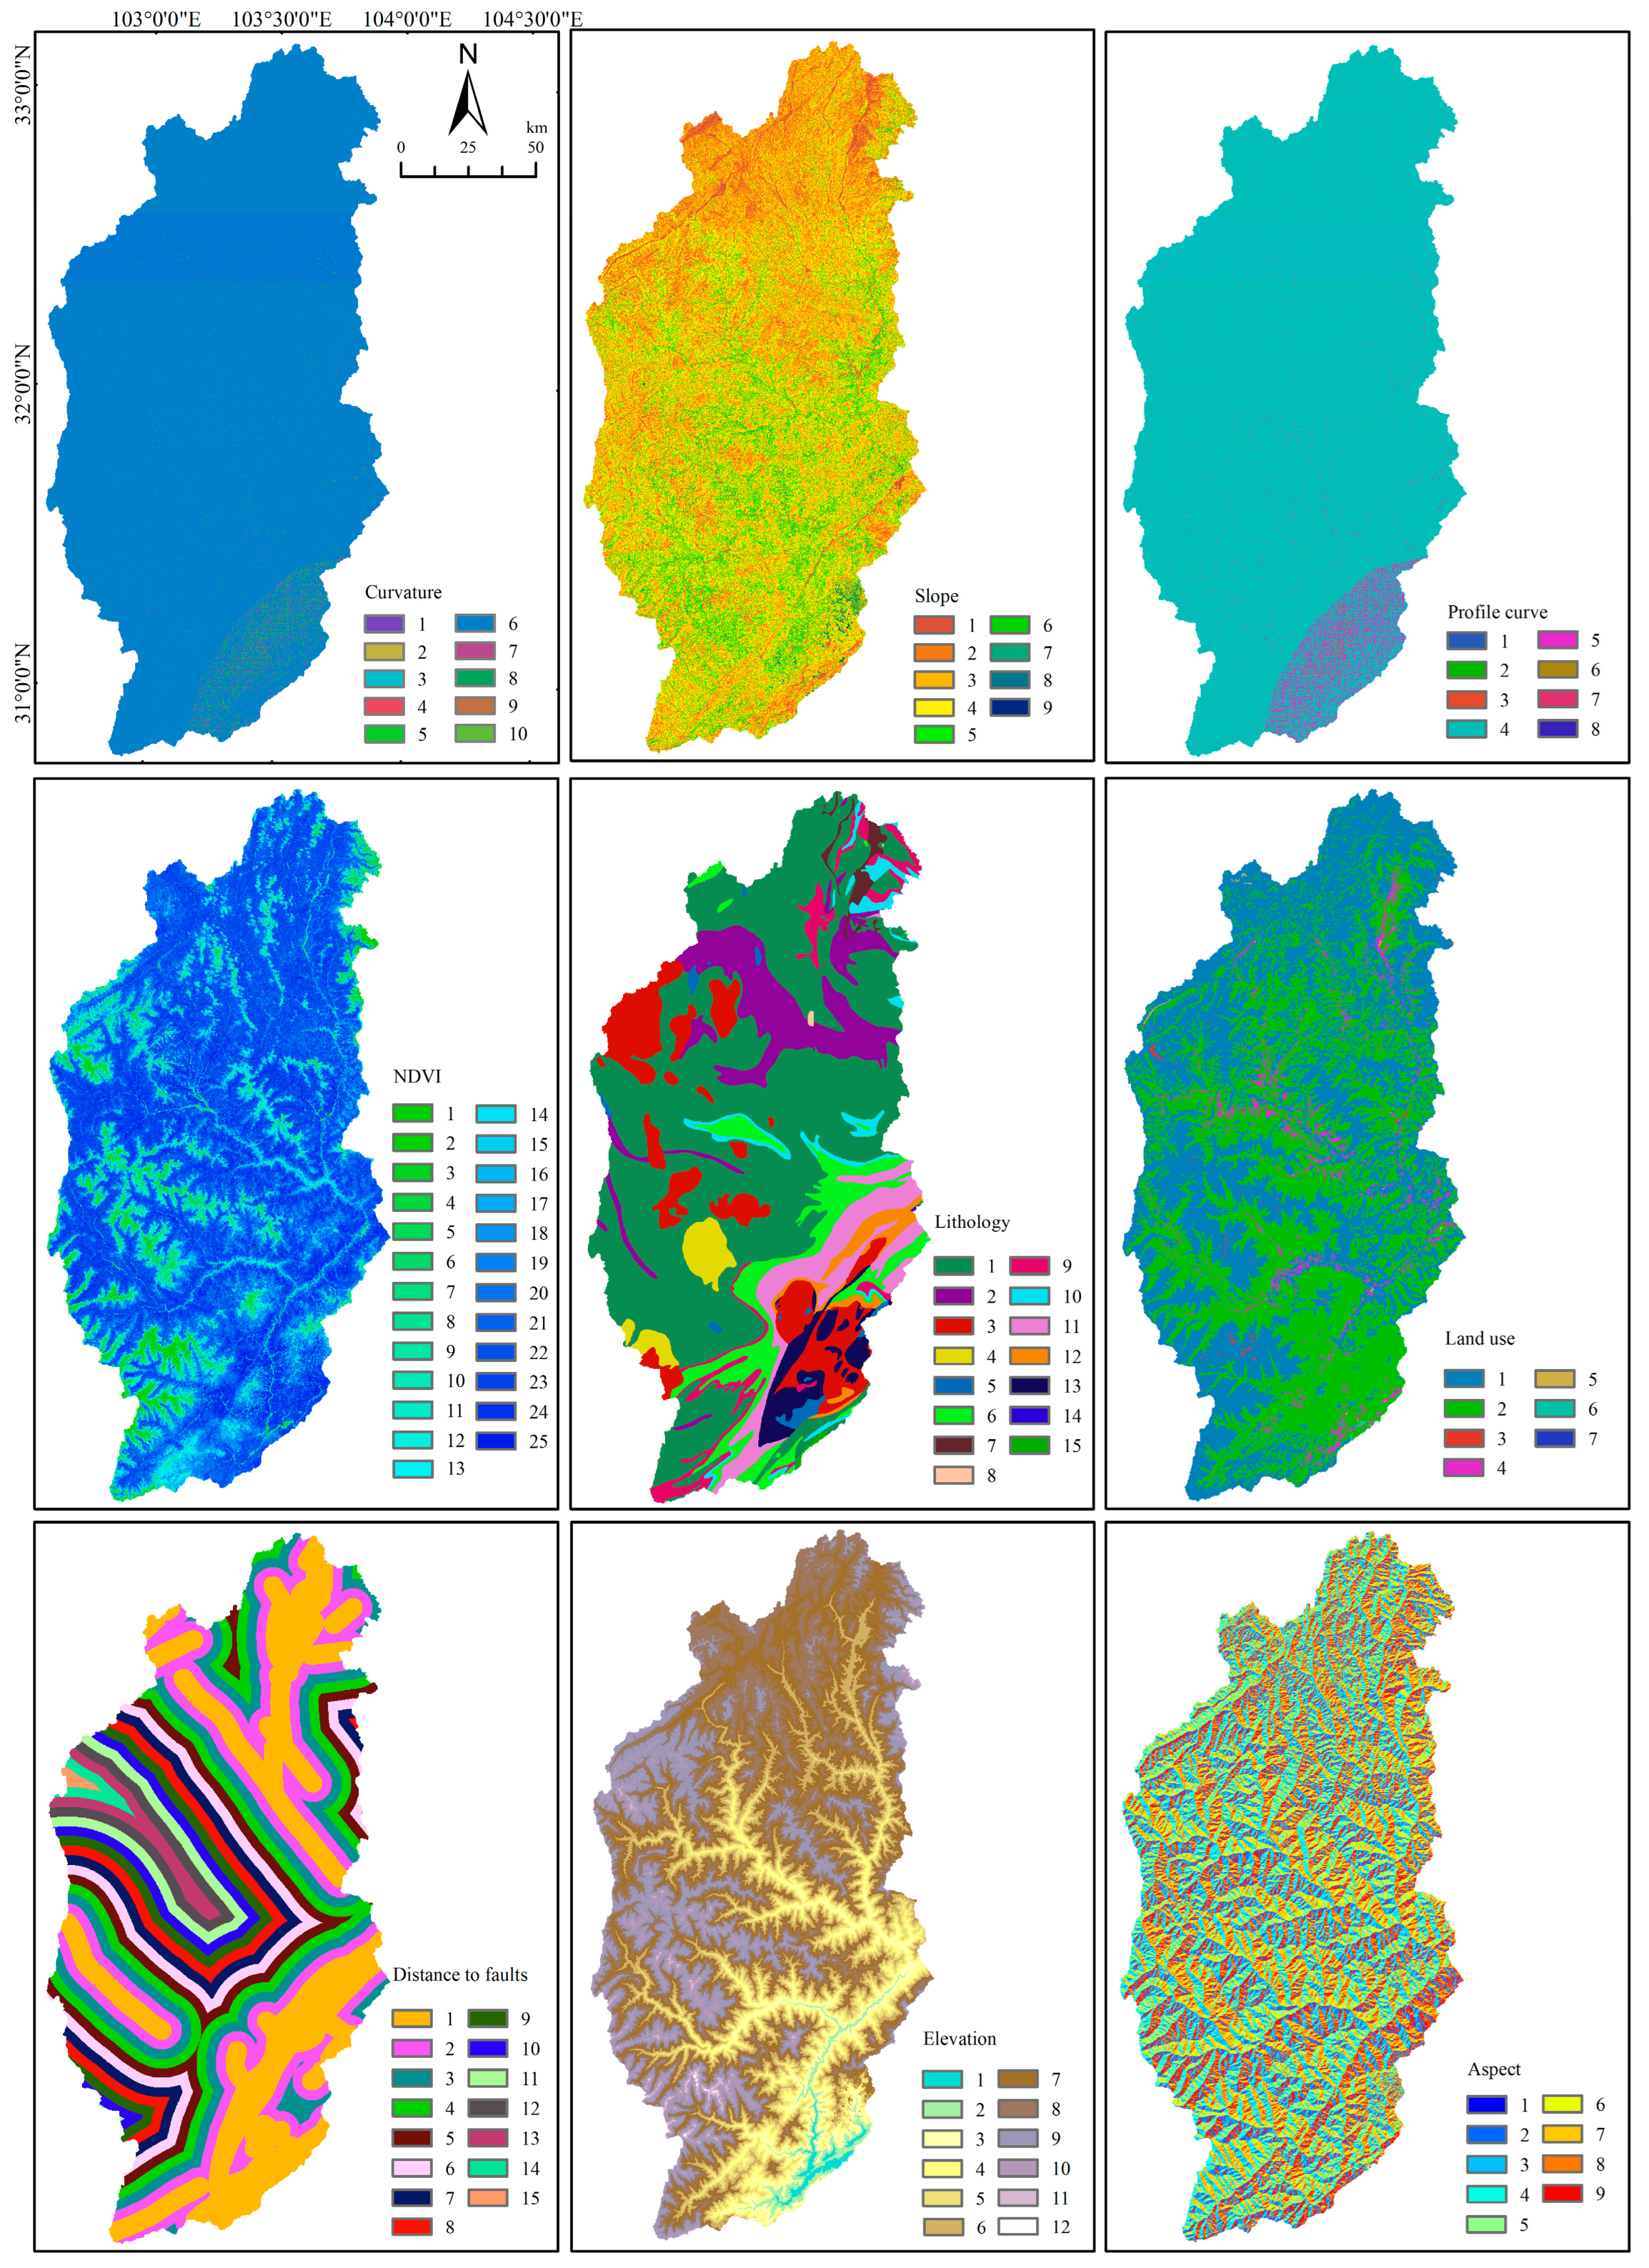
4.1. Landslide Background Factors Pretreatment
4.2. Acquisition of Weights for Landslide Background Factors
4.3. Landslide Susceptibility Evaluation by WOF-RF Model
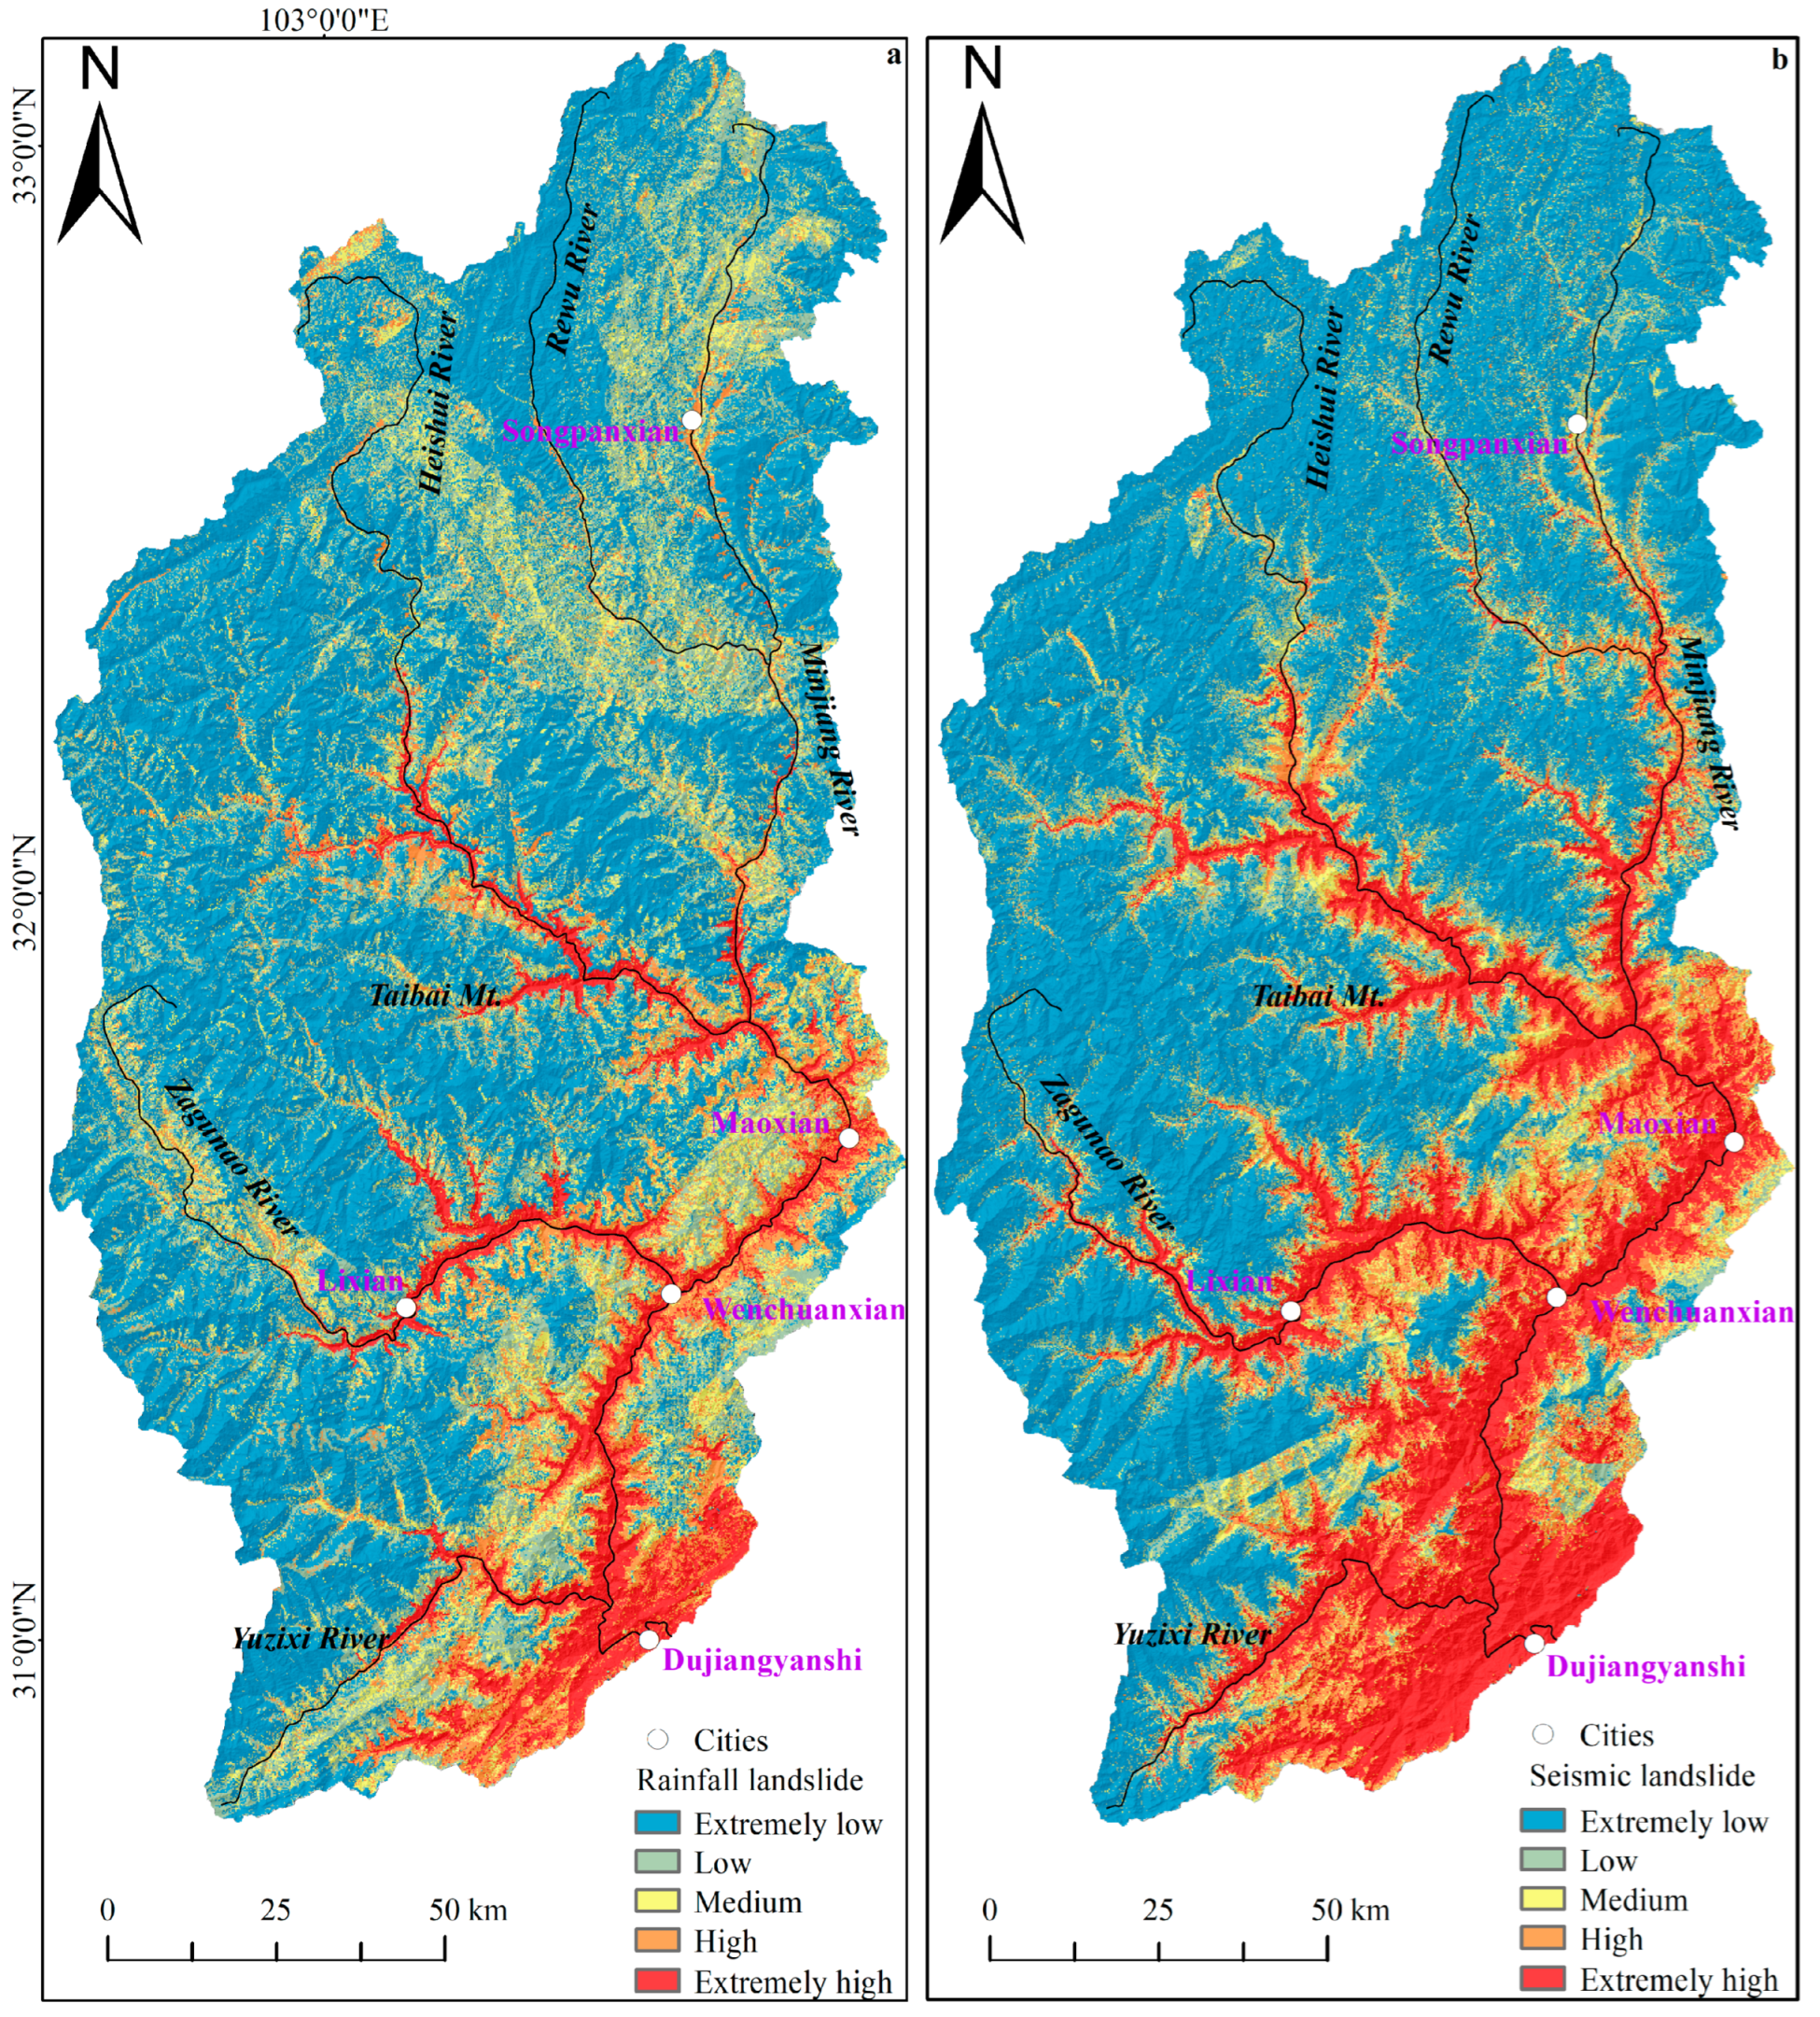
4.3.1. Comparison of Rainfall and Seismic Landslide Posteriori Probability Calculation and Zoning
4.3.2. Comparison of Landslide Susceptibility Areas from Two Methods
4.3.3. WOF-RF Model Accuracy Evaluation
- (1)
- Confusion matrix
- (2)
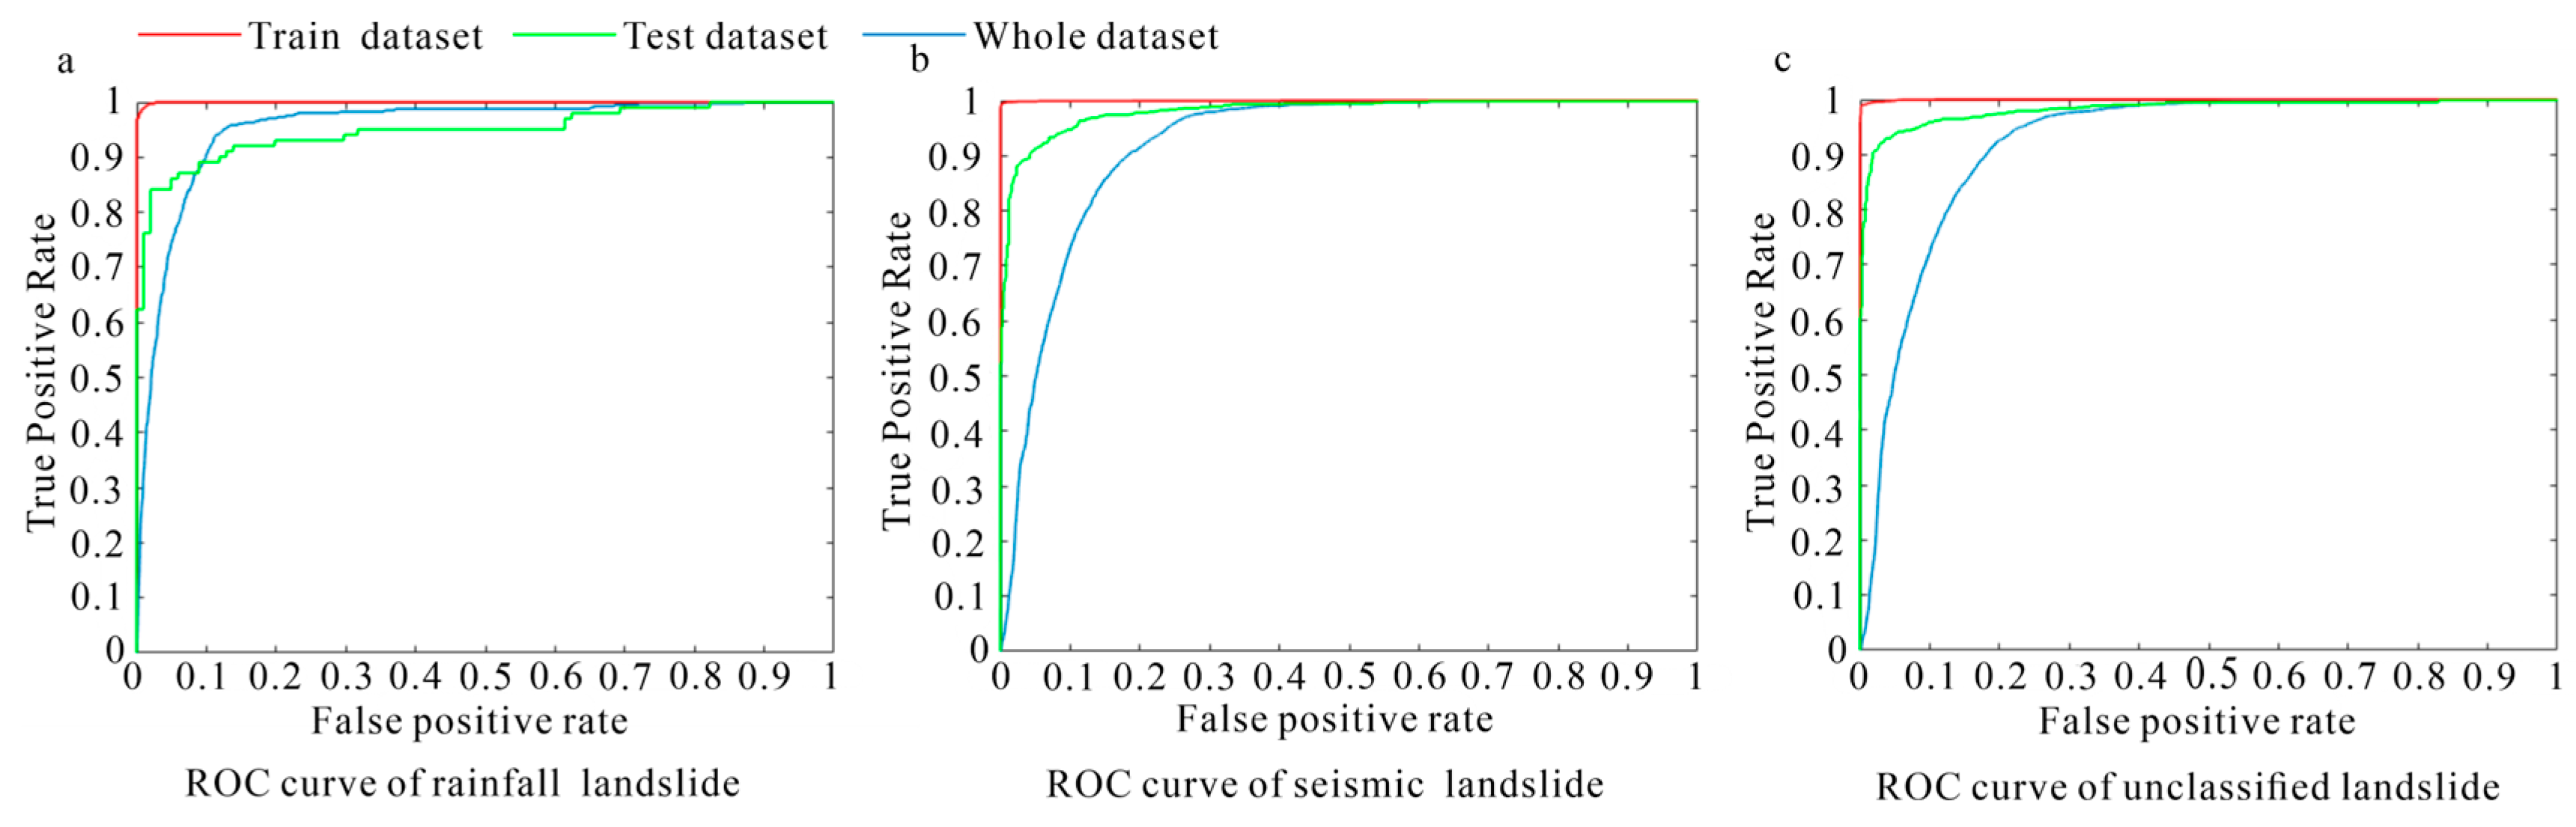
- ROC curve
5. Discussion
5.1. Comparison of Rainfall and Seismic Landslide Susceptibility in the Upper Reaches of Minjiang River Basin
5.2. Comparison of Two Mapping Methods for Landslide Susceptibility in the Upper Minjiang River Basin
5.3. Limitations and Prospects
6. Conclusions
- (1)
- In terms of model construction, the event impact factors entered into the machine learning model in previous studies are often assigned weights by the expert scoring method, AHP, and other biased subjective methods. In this research, we used a purely data-driven weight of evidence method without human intervention to assign corresponding weights to each factor to participate in the calculation of the model, and the factor weights obtained from weight of evidence are the expression of the spatial relationship between landslides and the factors influencing the occurrence of the landslides, which can reduce the redundancy of the data input to the machine learning model to a certain extent.
- (2)
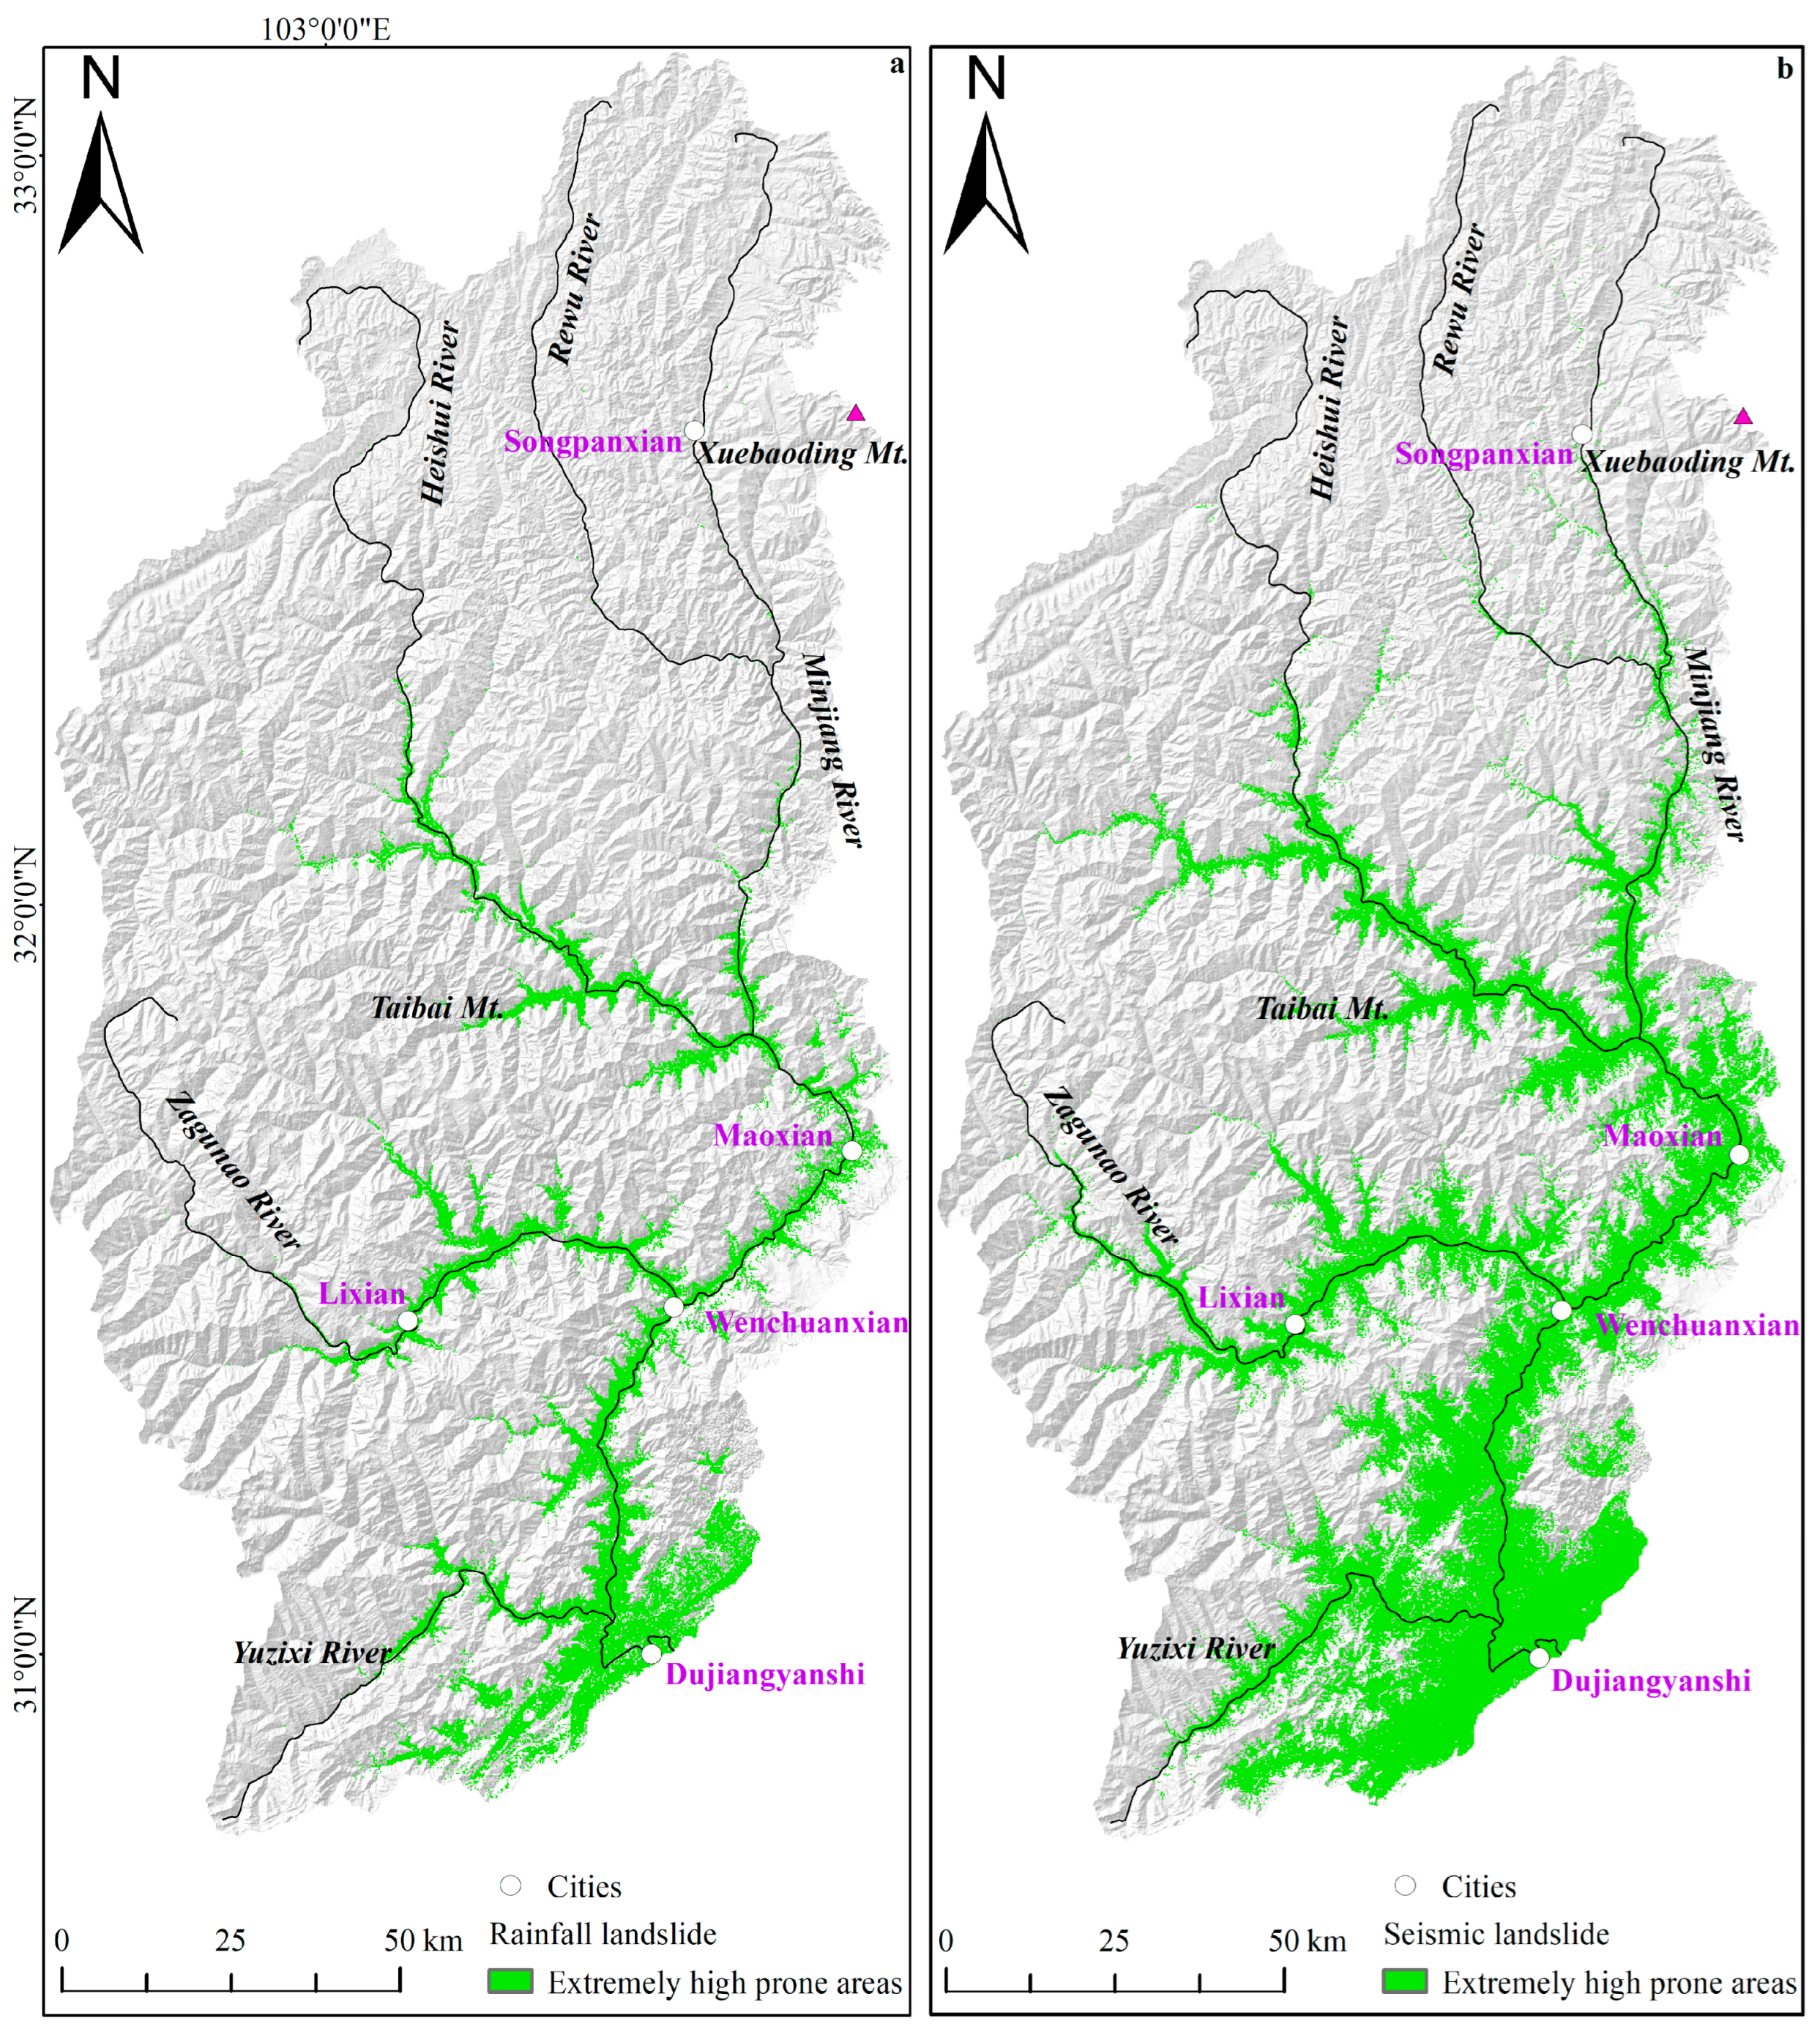
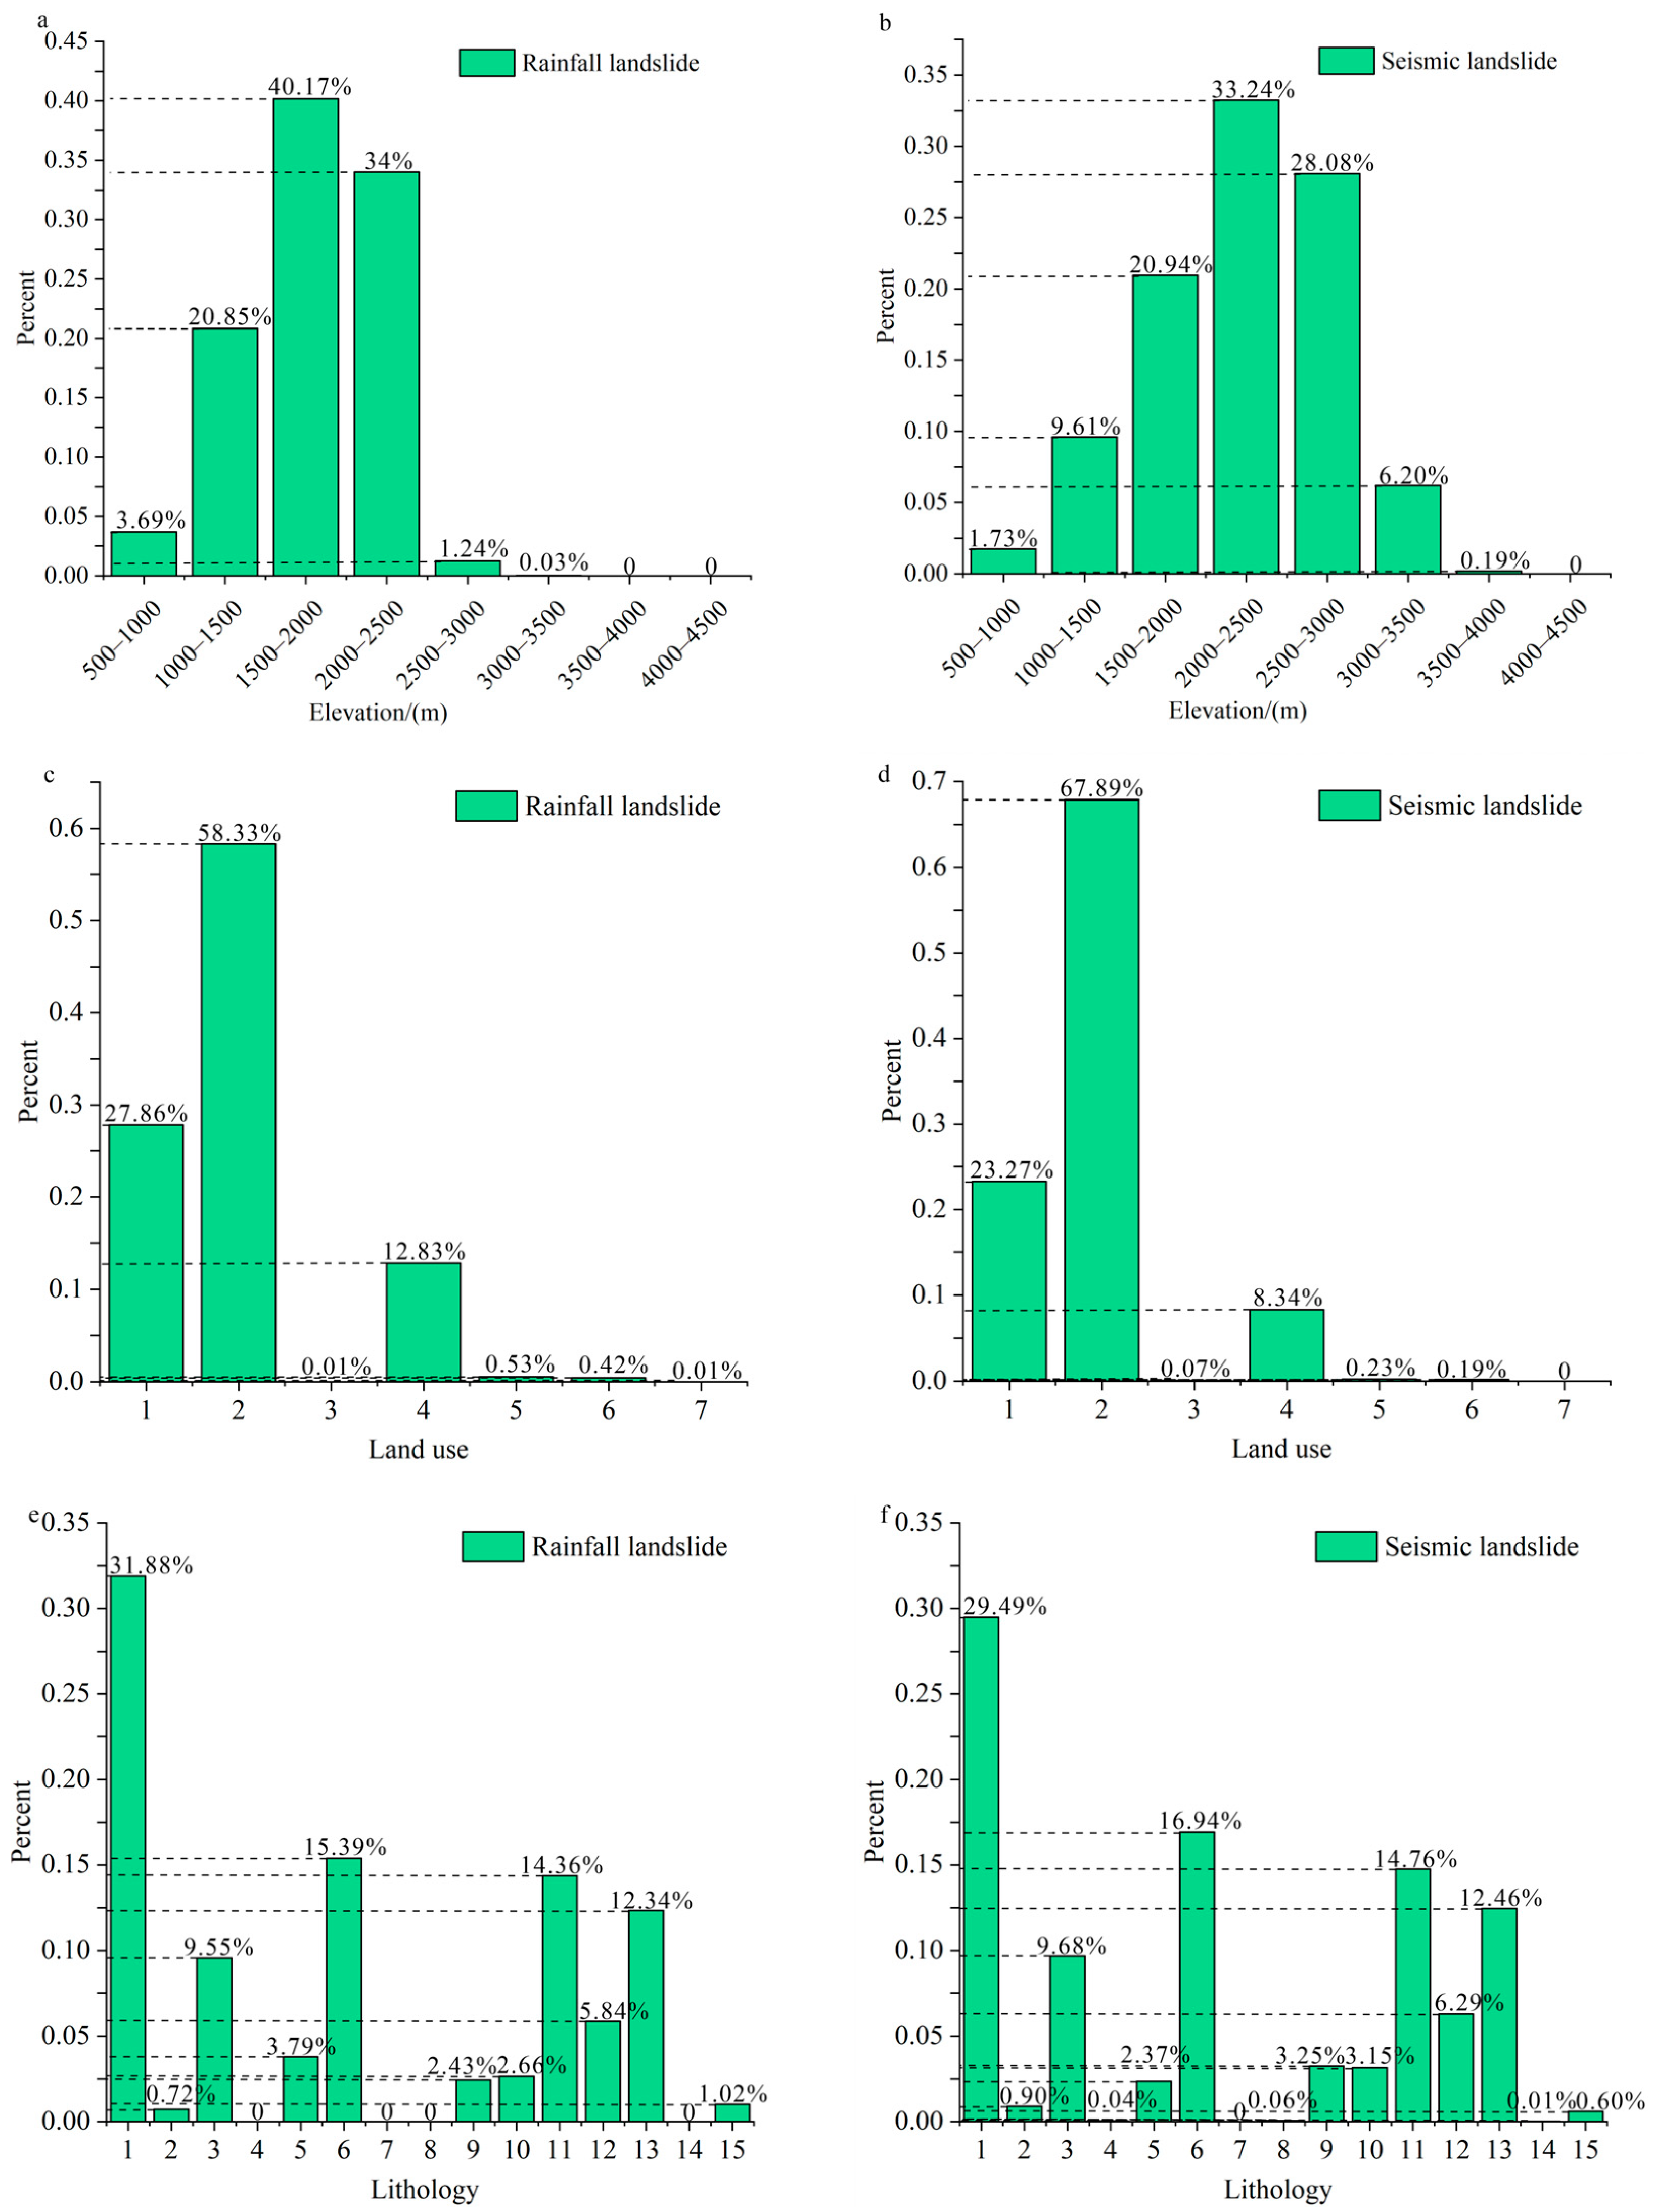
- In terms of spatial location distribution, rainfall and seismic landslides have the following points in common: they are prone to occur along rivers; landslides are more likely to occur in Maoxian, Lixian, Wenchuanxian, and Dujiangyancity, while landslides are less likely to occur in Songpanxian; and landslides are more likely to occur in the southeast of the line from Xuebaoding to Lixian. In terms of the distribution of geological factors, seismic landslides are distributed at a slightly higher elevation than rainfall landslides, whilst land use and lithological conditions in both susceptible areas are similar.
- (3)
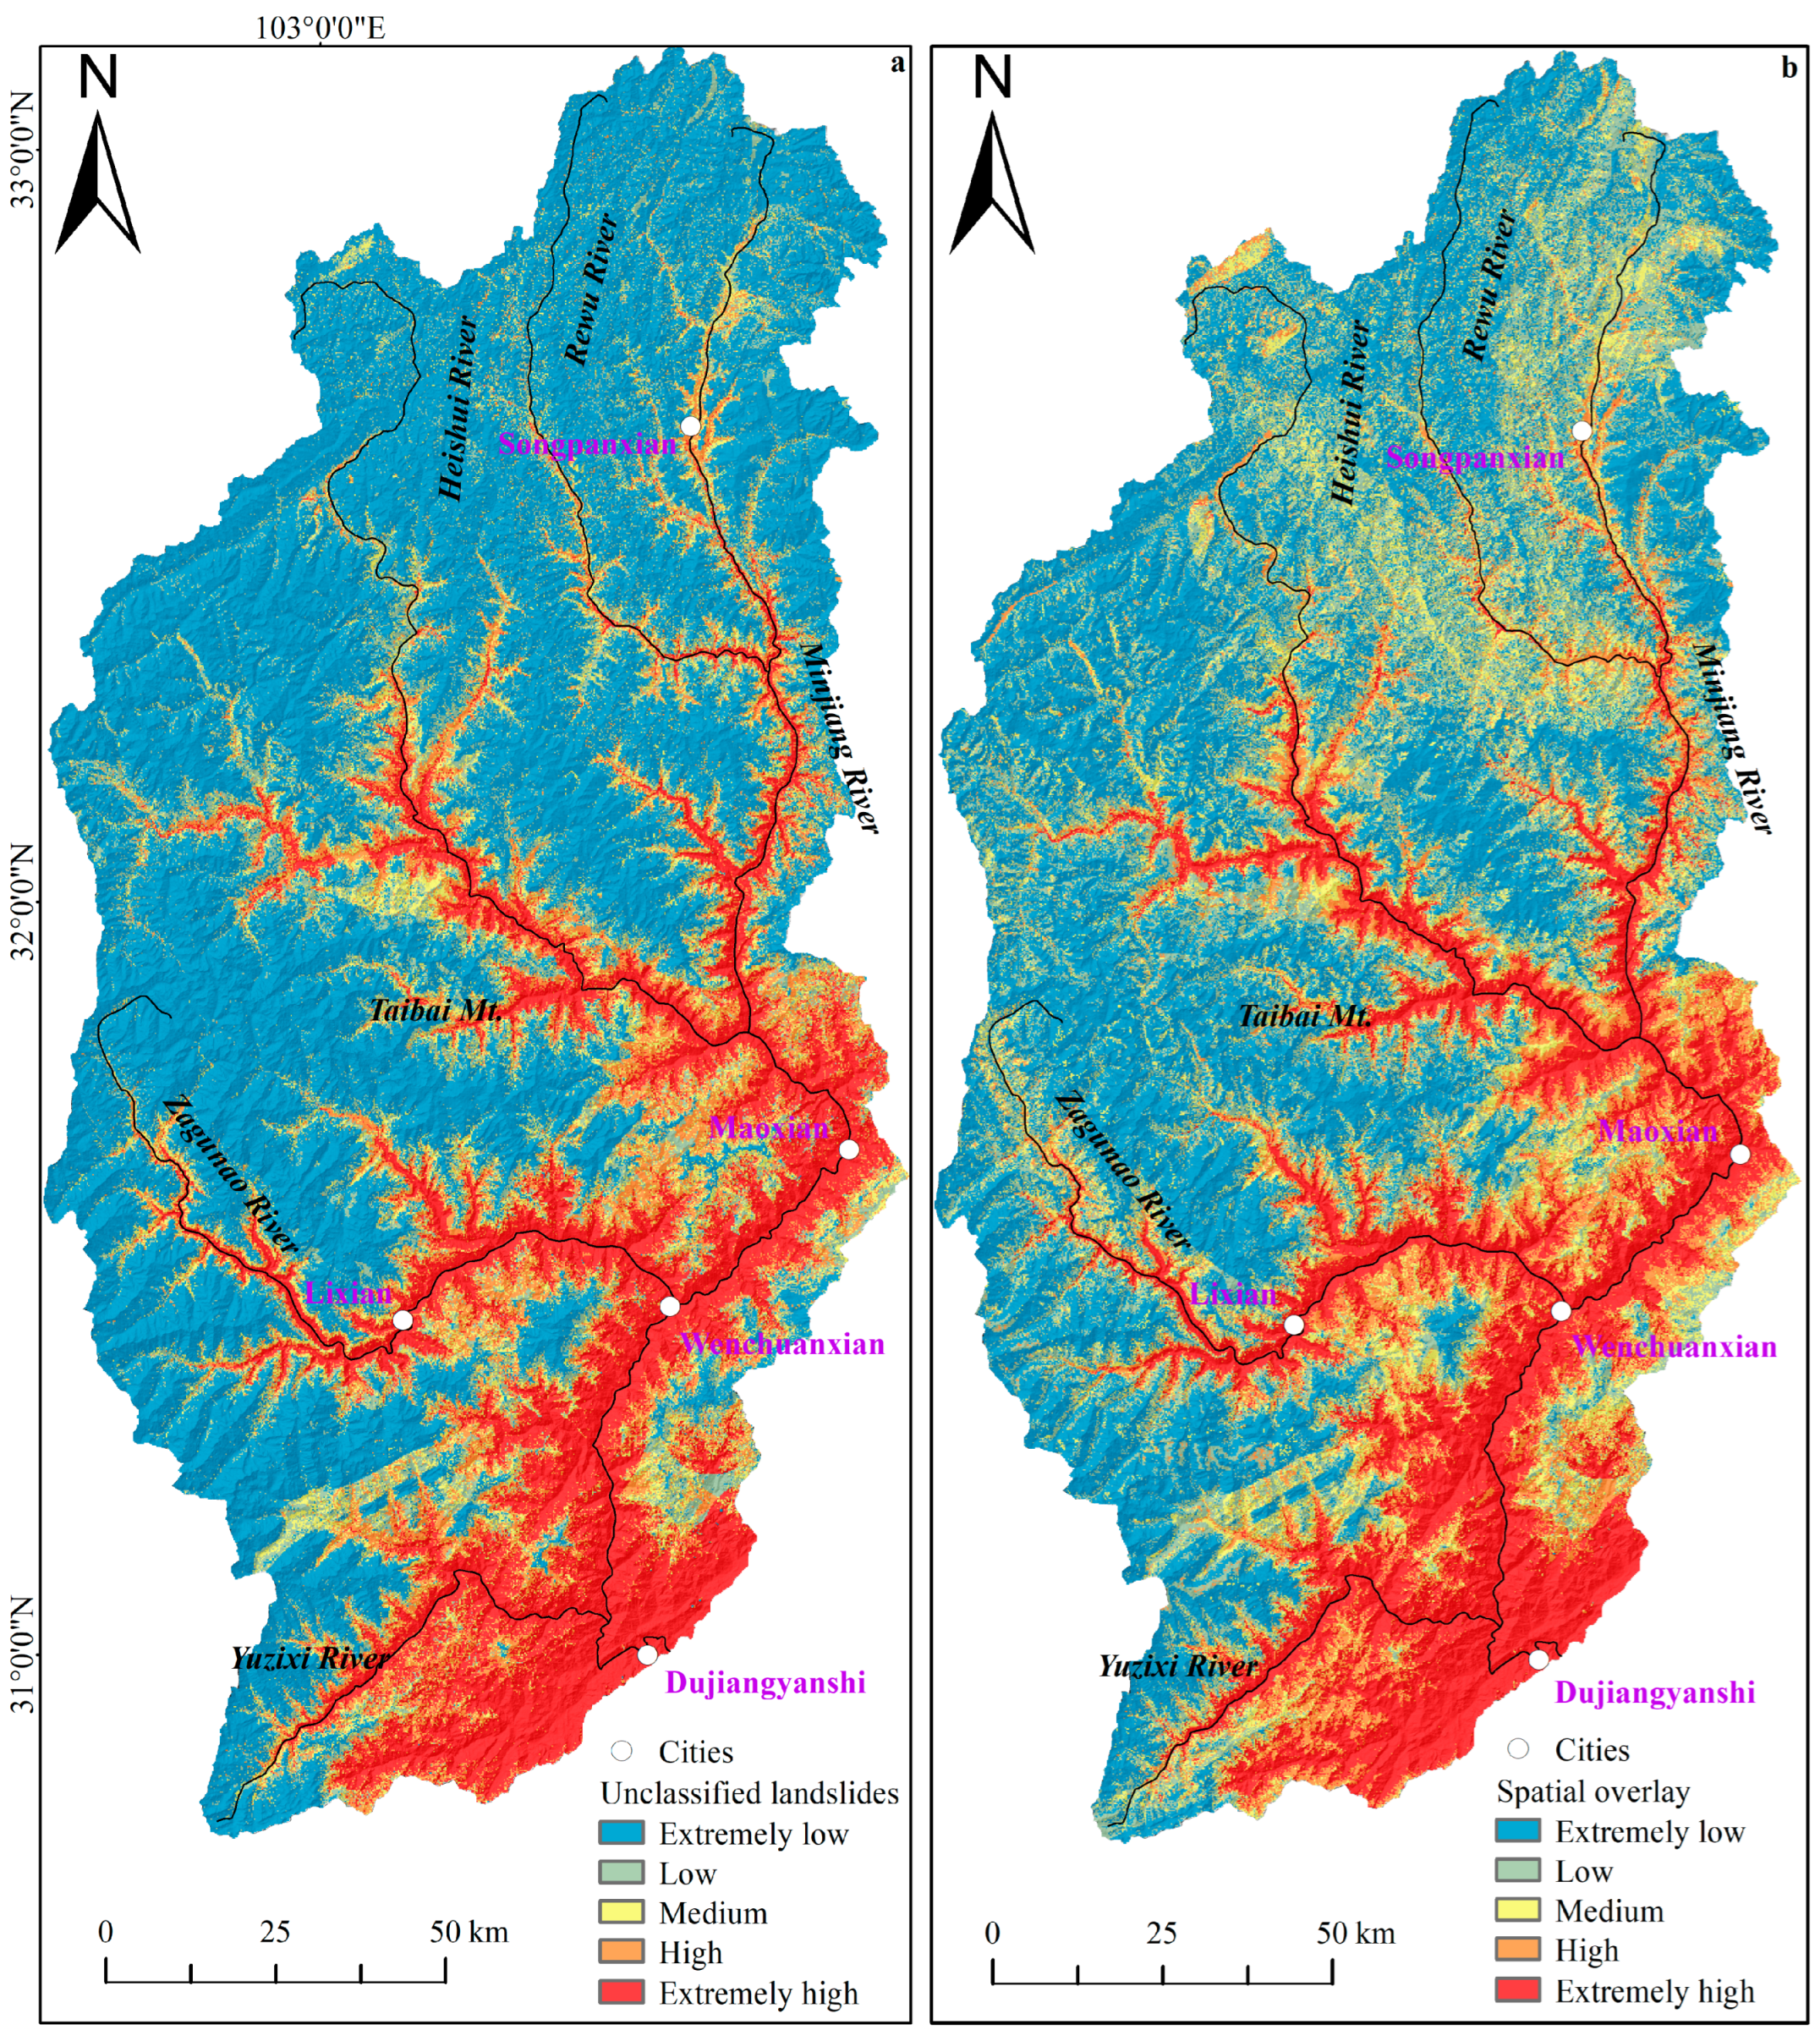
- The differences between the landslide susceptibility maps obtained by superimposing rainfall and seismic landslide susceptibility maps and the result obtained by directly using unclassified landslides are large, which is mainly caused by the difference in the principles of the two mapping methods and shows that it is important to see whether it is necessary to differentiate the types of landslides for solving the problems in different contexts.
- (4)
- The accuracy of the rainfall, seismic, and unclassified landslide models calculated from the confusion matrix are all above 80%, and the AUC area is greater than 0.9, both of which indicate the high accuracy of the WOE-RF model.
Author Contributions
Funding
Data Availability Statement
Conflicts of Interest
References
- Bai, S.B.; Wang, J.; Zhang, Z.G.; Cheng, C. Combined landslide susceptibility mapping after Wenchuan earthquake at the Zhouqu Segment in the Bailongjiang Basin, China. Catena 2012, 99, 18–25. [Google Scholar] [CrossRef]
- Chang-Jo, F.C.; Andrea, G.F. Probabilistic prediction models for landslide hazard mapping. Photogramm. Eng. Remote Sens. J. Am. Soc. Photogramm. 1999, 65, 1389–1399. [Google Scholar]
- Shi, J.S.; Shi, L.; Wu, S.R.; Wang, T. Difficulties and countermeasures in the practice of landslide risk assessment. Geol. Bull. China 2009, 28, 1020–1030, (In Chinese with English Abstract). [Google Scholar]
- Agterberg, F.P. Computer programs for mineral exploration. Science 1989, 245, 76–81. [Google Scholar] [CrossRef] [PubMed]
- Agterberg, F.P.; Bonham-Carter, G.F.; Wright, D.F. Statistical pattern integration for mineral exploration. Comput. Appl. Resour. Estim. 1990, 1–21. [Google Scholar] [CrossRef]
- Fan, D.L.; Cui, X.M.; Yuan, D.B.; Wang, J.F.; Yang, J.L.; Wang, S.Y. Weight of evidence method and its applications and development. Procedia Environ. Sci. 2011, 11, 1412–1418. [Google Scholar] [CrossRef]
- Dahal, R.K.; Hasegawa, S.; Nonomura, A.; Yamanaka, M.; Masuda, T.; Nishino, K. GIS-based weights-of-evidence modelling of rainfall-induced landslides in small catchments for landslide susceptibility mapping. Environ. Geol. 2008, 54, 311–324. [Google Scholar] [CrossRef]
- Sadisun, I.A.; Telaumbanua, J.A.; Kartiko, R.D.; Dinata, I.A. Weight of evidence method for landslide susceptibility mapping in Sigi Biromaru, central Sulawesi. IOP Conf. Ser. Earth Environ. Sci. 2021, 830, 12026–12029. [Google Scholar] [CrossRef]
- Yang, H.Y.; Xu, X.N.; Yang, H.F. Risk assessment of earthquake-triggered landslides in Jiuzhaigou Valley based on weight of evidence. Chin. J. Geol. Hazard Control 2020, 31, 20–29, (In Chinese with English Abstract). [Google Scholar]
- Hu, Y.; Li, D.Y.; Meng, S.S.; Sun, Y.Q. Evaluation of landslide susceptibility in Badong county based on weight of evidence. Bull. Geol. Sci. Technol. 2020, 39, 187–194, (In Chinese with English Abstract). [Google Scholar]
- Cheng, Q.M.; Agterberg, F.P. Fuzzy weights of evidence method and its application in mineral potential mapping. Nat. Resour. Res. 1999, 8, 27–35. [Google Scholar] [CrossRef]
- Huang, H.F.; Yao, S.J.; Ding, Z.J. Application of GIS-based weight of evidence in ore formation prediction—A case Study of gold ore prediction in Minxian-Lixian area of Gansu province. Bull. Geol. Sci. Technol. 2003, 22, 77–82, (In Chinese with English Abstract). [Google Scholar]
- Bai, S.B.; Lü, G.N.; Wang, J.; Zhou, P.G.; Ding, L. GIS-based rare events logistic regression for landslide-susceptibility mapping of Lianyungang, China. Environ. Earth Sci. 2011, 62, 139–149. [Google Scholar] [CrossRef]
- Mao, Y.M.; Zhang, M.X.; Cheng, X.J.; Peng, Z. Landslide hazard evaluation based on uncertain Bayesian classification technique. J. China Univ. Min. Technol. 2015, 44, 769–774, (In Chinese with English Abstract). [Google Scholar]
- Wang, Q.; Xue, Y.; Zhang, W.; Long, Y.H.; Zhou, S.L. Landslide susceptibility evaluation based on support vector machine. J. Hunan City Coll. Nat. Sci. Ed. 2021, 30, 22–28, (In Chinese with English Abstract). [Google Scholar]
- Li, T.; Tian, Y.; Wu, L.; Liu, L. Landslide hazard zoning based on random forest method. Geogr. Geo-Inf. Sci. 2014, 30, 25–30, (In Chinese with English Abstract). [Google Scholar]
- Yang, S.; Li, D.Y.; Yan, L.X.; Huang, Y.; Wang, M.Z. Evaluation of landslide geological hazard susceptibility of high and steep bank slopes of Wujiang River based on random forest model. Saf. Environ. Eng. 2021, 28, 131–138, (In Chinese with English Abstract). [Google Scholar]
- Wu, X.Q.; Lai, C.G.; Chen, X.H.; Ren, X.W. Landslide hazard evaluation based on random forest weights: An example from the Dongjiang River Basin. J. Nat. Disasters 2017, 26, 119–129, (In Chinese with English Abstract). [Google Scholar]
- Liu, J.; Li, S.L.; Chen, T. Landslide susceptibility evaluation based on optimized random forest model. Geomat. Inf. Sci. Wuhan Univ. 2018, 43, 1085–1091, (In Chinese with English Abstract). [Google Scholar]
- Mandal, K.; Saha, S.; Mandal, S. Applying deep learning and benchmark machine learning algorithms for landslide susceptibility modelling in Rorachu river basin of Sikkim Himalaya, India. Geosci. Front. 2021, 12, 101203. [Google Scholar] [CrossRef]
- Wang, D.; Yang, R.H.; Wang, X.; Li, S.D.; Tan, J.X.; Zhang, S.Q.; Wei, S.Y.; Wu, Z.Y.; Chen, C.; Yang, X.X. Evaluation of deep learning algorithms for landslide susceptibility mapping in an alpine-gorge area: A case study in Jiuzhaigou County. J. Mt. Sci. 2023, 20, 484–500. [Google Scholar] [CrossRef]
- Arabameri, A.; Pradhan, B.; Rezaei, K.; Sohrabi, M.; Kalantari, Z. GIS-based landslide susceptibility mapping using numerical risk factor bivariate model and its ensemble with linear multivariate regression and boosted regression tree algorithms. J. Mt. Sci. 2019, 16, 595–618. [Google Scholar] [CrossRef]
- PourghasemI, H.R.; Gayen, A.; Panahi, M.; Rezaie, F.; Blaschke, T. Multi-hazard probability assessment and mapping in Iran. Sci. Total Environ. 2019, 692, 556–571. [Google Scholar] [CrossRef] [PubMed]
- Guo, Z.Z.; Yin, K.L.; Fu, S.; Huang, F.M.; Gui, L.; Xia, H. Landslide susceptibility evaluation based on GIS and WOE-BP model. Earth Sci. 2019, 44, 4299–4312, (In Chinese with English Abstract). [Google Scholar]
- Li, Y.J.; Hu, Q.C.; Liu, H.Z.; Du, Z.; Chen, J.W.; Huang, J.C.; Huang, F.M. Landslide susceptibility evaluation with coupled informativeness and logistic regression model. Yangtze River 2021, 52, 95–102, (In Chinese with English Abstract). [Google Scholar]
- Ma, X.; Wang, N.Q.; Li, X.K.; Yan, D.; Li, J.L. Evaluation of landslide susceptibility based on RF-FR model--Lueyang county as an example. Northwestern Geol. 2022, 55, 335–344, (In Chinese with English Abstract). [Google Scholar]
- Bai, Z.G.; Liu, Q.M.; Liu, Y. Landslide susceptibility evaluation based on entropy index and random forest model. Yangtze River 2022, 53, 95–102, (In Chinese with English Abstract). [Google Scholar]
- Araya-Munoz, D.; Metzger, M.J.; Stuart, N.; Wilson, A.; Carvajal, D. A spatial fuzzy logic approach to urban multi-hazard impact assessment in Concepción, Chile. Sci. Total Environ. 2017, 576, 508–519. [Google Scholar] [CrossRef]
- Bathrellos, G.D.; Skilodimou, H.D.; Chousianitis, K.; Youssef, A.M.; Pradhan, B. Suitability estimation for urban development using multi-hazard assessment map. Sci. Total Environ. 2017, 575, 119–134. [Google Scholar] [CrossRef]
- Furlan, E.; Torresan, S.; Critto, A.; Marcomini, A. Spatially explicit risk approach for multi-hazard assessment and management in marine environment: The case study of the Adriatic Sea. Sci. Total Environ. 2018, 618, 1008–1023. [Google Scholar] [CrossRef]
- Hagenlocher, M.; Renaud, F.G.; Haas, S.; Sebesvari, Z. Vulnerability and risk of deltaic social-ecological systems exposed to multiple hazards. Sci. Total Environ. 2018, 631–632, 71–80. [Google Scholar] [CrossRef] [PubMed]
- Thierry, P.; Stieltjes, L.; Kouokam, E.; Nguéya, P.; Salley, P.M. Multi-hazard risk mapping and assessment on an active volcano: The GRINP project at Mount Cameroon. Nat. Hazards 2008, 45, 429–456. [Google Scholar] [CrossRef]
- Mahendra, R.S.; Mohanty, P.C.; Bisoyi, H.; Kumar, T.S.; Nayak, S. Assessment and management of coastal multi-hazard vulnerability along the Cuddalore–Villupuram, east coast of India using geospatial techniques. Ocean Coast. Manag. 2011, 54, 302–311. [Google Scholar] [CrossRef]
- Ke, C.Y.; He, S.; Qin, Y.G. Comparison of natural breaks method and frequency ratio dividing attribute intervals for landslide susceptibility mapping. Bull. Eng. Geol. Environ. 2023, 82, 384. [Google Scholar] [CrossRef]
- Wang, H.F.; Meng, Y.; Wang, H.L.; Wu, Z.N.; Guan, X.J. The application of integrating comprehensive evaluation and clustering algorithms weighted by maximal information coefficient for urban flood susceptibility. J. Environ. Manag. 2023, 344, 118846. [Google Scholar] [CrossRef]
- Shi, C.J.; Zhang, F.Q. A forest fire susceptibility modeling approach based on integration machine learning algorithm. Forests 2023, 14, 1506. [Google Scholar] [CrossRef]
- Wang, W.F.; Geng, Y.; Wang, Q.Z.; Shan, J.X.; Chen, X.L. Experimental study of rainfall and seismic landslides. Seismol. Geol. 2012, 34, 810–819, (In Chinese with English Abstract). [Google Scholar]
- Ding, J.H. Study on the Formation Mechanism and Dynamic Model of Landslide by Earthquake and Rainfall. Master’s Thesis, Fuzhou University, Fuzhou, China, 2013. (In Chinese with English Abstract). [Google Scholar]
- Bai, S.B.; Cheng, C.; Wang, J.; Thiebes, B.; Zhang, Z.G. Regional scale rainfall- and earthquake-triggered landslide susceptibility assessment in Wudu county, China. J. Mt. Sci. 2013, 10, 743–753. [Google Scholar] [CrossRef]
- Kappes, M.S.; Keiler, M.; von Elverfeldt, K.; Glade, T. Challenges of analyzing multi-hazard risk: A review. Nat. Hazards 2012, 64, 1925–1958. [Google Scholar] [CrossRef]
- Bai, S.B.; Lu, P.; Thiebes, B. Comparing characteristics of rainfall- and earthquake-triggered landslides in the upper Minjiang Catchment, China. Eng. Geol. 2020, 268, 105518. [Google Scholar] [CrossRef]
- Chang, X.J.; Ding, J.; Wei, L.W.; Wang, D.W.; Mao, Y.; Yan, Y. A preliminary investigation on the distribution pattern of geological hazard development in the upper reaches of Minjiang River. Sediment. Geol. Tethyan Geol. 2007, 27, 103–108, (In Chinese with English Abstract). [Google Scholar]
- Lu, P.; Han, J.P.; Hao, T.; Li, R.X.; Qiao, G. Seasonal deformation of permafrost in Wudaoliang Basin in Qinghai-Tibet Plateau revealed by StaMPS-InSAR. Mar. Geod. 2019, 43, 1–20. [Google Scholar] [CrossRef]
- Xu, X.L. 30 m Year-by-Year NDVI Maximum Dataset in China. Resource and Environmental Science Data Registration and Publication System. (In Chinese with English Abstract). Available online: https://www.resdc.cn/ (accessed on 1 October 2022).
- Bonham-Carter, G.F. Geographic Information Systems for Geoscientists: Modelling with GIS; Elsevier: Amsterdam, The Netherlands, 1994; pp. 302–329. [Google Scholar]
- Li, Y.W.; Zhao, J.M.; Li, C.Y. Potential Mineral Resource Evaluation Methods Based on GMS, DSS and GIS (Previous); Seismological Press: Beijing, China, 2007; (In Chinese with English Abstract). [Google Scholar]
- Breiman, L. Random forests. Mach. Learn. 2001, 45, 5–32. [Google Scholar] [CrossRef]
- Li, H. Statistical Learning Methods; Tsinghua University Press: Beijing, China, 2012; pp. 55–63, (In Chinese with English Abstract). [Google Scholar]
- Loomis, J.M. Analysis of Tactile and Visual Confusion Matrices. Percept. Psychophys. 1982, 31, 41–52. [Google Scholar] [CrossRef] [PubMed]
- Cantarino, I.; Carrion, M.A.; Goerlich, F.; Ibañez, V.M. A ROC analysis-based classification method for landslide susceptibility maps. Landslides 2018, 16, 265–282. [Google Scholar] [CrossRef]
- Ye, C.M.; Wei, R.L.; Ge, Y.G.; Li, Y.; José, M.J.; Jonathan, L. GIS-based spatial prediction of landslide using road factors and random forest for Sichuan-Tibet Highway. J. Mt. Sci. 2022, 19, 461–476. [Google Scholar] [CrossRef]
- Jin, Y.J. Statistics; China Renmin University Press: Beijing, China, 2010; (In Chinese with English Abstract). [Google Scholar]


| Data | Source |
|---|---|
| Rainfall landslides | Ministry of Land and Resources of China: Survey and mapping of 1:100,000 landslides in China from 1999 to 2008 [41] |
| Seismic landslides | Ministry of Land and Resources of China: Investigation of Landslide Hazard Caused by 2008 Wenchuan Earthquake in China [41] |
| Factors related to landslide occurrence | DTM image with 90 m spatial resolution [41] |
| NDVI | Resource and environmental science data registration and publishing system [44] |
| Evidence Factors | Classification of Factors | Weight | |||
|---|---|---|---|---|---|
| Aspect | Lithology | ||||
| Flat | 1 | 0.0007 | Sandstone, siltstone interbedded with phyllite | 1 | −0.9971 |
| N | 2 | −0.6819 | Shale, phyllite, and siltstone | 2 | −1.7158 |
| NE | 3 | 0.0007 | Granitic rocks | 3 | −0.1886 |
| E | 4 | 0.0007 | Syenite | 4 | −0.1886 |
| SE | 5 | 0.3216 | Diorite | 5 | 1.4918 |
| S | 6 | 0.0007 | Limestone and sandstone | 6 | 0.8567 |
| SW | 7 | 0.0007 | Unconsolidated deposits | 7 | −0.1886 |
| W | 8 | 0.0007 | Sandstone, siltstone, and shale | 8 | −0.1886 |
| NW | 9 | 0.0007 | Limestone intercalated with shale | 9 | 0.5665 |
| NDVI | Limestone, sandstone, and shale | 10 | −0.1886 | ||
| (46, 396.9) | 1 | −0.1110 | Limestone and dolomite intercalated with phyllite | 11 | 0.9109 |
| (396.9, 747.8) | 2 | −0.1110 | Dolomite, silicalite, phyllite, sandstone, and siltstone | 12 | 0.7918 |
| (747.8, 1098.8) | 3 | −0.1110 | Amphibolite | 13 | 1.8850 |
| (1098.8, 1449.7) | 4 | −0.1110 | Sandstone and siltstone intercalated with slate | 14 | −0.1886 |
| (1449.7, 1800.6) | 5 | −0.1110 | Sandstone and siltstone interbedded with shale | 15 | −0.1886 |
| (1800.6, 2151.5) | 6 | −0.1110 | Profile curve | ||
| (2151.5, 2502.4) | 7 | −0.1110 | (−38.6, −28.6) | 1 | −1.6067 |
| (2502.4, 2853.4) | 8 | 1.0049 | (−28.6, −18.6) | 2 | −1.6067 |
| (2853.4, 3204.3) | 9 | 0.8565 | (−18.6, −8.6) | 3 | 2.0356 |
| (3204.3, 3555.2) | 10 | 0.8724 | (−8.6, 2.6) | 4 | −0.0839 |
| (3555.2, 3906.1) | 11 | −0.1110 | (2.6, 12.6) | 5 | 0.8969 |
| (3906.1, 4257.0) | 12 | −0.1110 | (12.6, 22.6) | 6 | 2.3935 |
| (4257.0, 4608.0) | 13 | 0.7309 | (22.6, 32.6) | 7 | −1.6067 |
| (4608.0, 4958.9) | 14 | 0.7546 | (32.6, 44.3) | 8 | −1.6067 |
| (4958.9, 5309.8) | 15 | −0.1110 | Curvature | ||
| (5309.8, 5660.7) | 16 | −0.1110 | (−87, −71) | 1 | −2.0171 |
| (5660.7, 6011.6) | 17 | −0.1110 | (−71, −55) | 2 | −2.0171 |
| (6011.6, 6362.6) | 18 | 0.4277 | (−55, −39) | 3 | −2.0171 |
| (6362.6, 6713.5) | 19 | −0.1110 | (−39, −23) | 4 | −2.0171 |
| (6713.5, 7064.4) | 20 | −0.1110 | (−23, −7) | 5 | 1.1956 |
| (7064.4, 7415.3) | 21 | −0.1110 | (−7, 9) | 6 | −0.0528 |
| (7415.3, 7766.2) | 22 | −0.2762 | (9, 26) | 7 | 1.5568 |
| (7766.2, 8117.2) | 23 | −0.2694 | (26, 42) | 8 | −2.0171 |
| (8117.2, 8468.1) | 24 | −0.1110 | (42, 58) | 9 | −2.0171 |
| (8468.1, 8819.0) | 25 | 0.7211 | (58, 73) | 10 | −2.0171 |
| Elevation | Land use | ||||
| (712.0, 1132.5) | 1 | 2.7367 | Garden plot | 1 | −0.5322 |
| (1132.5, 1553.0) | 2 | 2.9041 | Woodland | 2 | 0.1154 |
| (1553.0, 1973.5) | 3 | 2.2586 | Land for water bodies and water conservancy facilities | 3 | −4.4595 |
| (1973.5, 2394.0) | 4 | 1.0646 | Grassland | 4 | 1.7991 |
| (2394.0, 2814.5) | 5 | −1.7875 | Commercial area | 5 | 3.0203 |
| (2814.5, 3235.0) | 6 | −1.3411 | Land for industrial and mining warehousing | 6 | −4.4595 |
| (3235.0, 3655.5) | 7 | −2.9547 | Other land | 7 | −4.4595 |
| (3655.5, 4076.0) | 8 | −1.7875 | Distance to faults | ||
| (4076.0, 4496.5) | 9 | −1.7875 | (0, 17.8) | 1 | 0.6291 |
| (4496.5, 4917.0) | 10 | −2.8276 | (17.8, 35.6) | 2 | 0.4427 |
| (4917.0, 5337.5) | 11 | −1.7875 | (35.6, 53.4) | 3 | −0.7052 |
| (5337.5, 5758.0) | 12 | −1.7875 | (53.4, 71.2) | 4 | −0.3361 |
| Slope | (71.2, 89.0) | 5 | −0.3361 | ||
| (0, 10) | 1 | 0.9478 | (89.0, 106.8) | 6 | −1.1051 |
| (10, 20) | 2 | −0.6397 | (106.8, 124.6) | 7 | −0.8145 |
| (20, 30) | 3 | −0.3065 | (124.6, 142.4) | 8 | −1.4800 |
| (30, 40) | 4 | −0.1079 | (142.4, 160.2) | 9 | −1.1470 |
| (40, 50) | 5 | 0.3697 | (160.2, 178) | 10 | −1.8685 |
| (50, 60) | 6 | 0.7293 | (178, 195.8) | 11 | −1.0934 |
| (60, 70) | 7 | 1.3741 | (195.8, 213.6) | 12 | −1.0272 |
| (70, 80) | 8 | −0.1079 | (213.6, 231.4) | 13 | −0.3361 |
| (80, 90) | 9 | −0.1079 | (231.4, 249.2) | 14 | −0.3361 |
| (249.2, 267.0) | 15 | −0.3361 |
| Evidence Factors | Classification of Factors | Weight | |||
|---|---|---|---|---|---|
| Aspect | Lithology | ||||
| Flat | 1 | −0.0223 | Sandstone, siltstone interbedded with phyllite | 1 | −0.7654 |
| N | 2 | −0.0223 | Shale, phyllite, and siltstone | 2 | −2.2745 |
| NE | 3 | −0.0223 | Granitic rocks | 3 | 0.1397 |
| E | 4 | 0.2072 | Syenite | 4 | −2.7594 |
| SE | 5 | 0.2476 | Diorite | 5 | 1.6636 |
| S | 6 | 0.1265 | Limestone and sandstone | 6 | 0.4612 |
| SW | 7 | −0.1626 | Unconsolidated deposits | 7 | −3.2859 |
| W | 8 | −0.3399 | Sandstone, siltstone, and shale | 8 | 0.0117 |
| NW | 9 | −0.2294 | Limestone intercalated with shale | 9 | 0.0117 |
| NDVI | Limestone, sandstone, and shale | 10 | 0.0117 | ||
| (46, 396.9) | 1 | 0.0249 | Limestone and dolomite intercalated with phyllite | 11 | 0.7738 |
| (396.9, 747.8) | 2 | 0.0249 | Dolomite, silicalite, phyllite, sandstone, and siltstone | 12 | 1.0732 |
| (747.8, 1098.8) | 3 | −3.2095 | Amphibolite | 13 | 2.0384 |
| (1098.8, 1449.7) | 4 | −2.3885 | Sandstone and siltstone intercalated with slate | 14 | 0.0117 |
| (1449.7, 1800.6) | 5 | −1.2734 | Sandstone and siltstone interbedded with shale | 15 | 0.0117 |
| (1800.6, 2151.5) | 6 | −0.9951 | Profile curve | ||
| (2151.5, 2502.4) | 7 | −0.5969 | (−38.6, −28.6) | 1 | 1.0324 |
| (2502.4, 2853.4) | 8 | 0.0249 | (−28.6, −18.6) | 2 | 1.0324 |
| (2853.4, 3204.3) | 9 | 0.0249 | (−18.6, −8.6) | 3 | 2.0926 |
| (3204.3, 3555.2) | 10 | 0.0249 | (−8.6, 2.6) | 4 | −0.1531 |
| (3555.2, 3906.1) | 11 | 0.0249 | (2.6, 12.6) | 5 | 1.4408 |
| (3906.1, 4257.0) | 12 | 0.0249 | (12.6, 22.6) | 6 | 2.3560 |
| (4257.0, 4608.0) | 13 | 0.3107 | (22.6, 32.6) | 7 | 1.0324 |
| (4608.0, 4958.9) | 14 | 0.2456 | (32.6, 44.3) | 8 | 1.0324 |
| (4958.9, 5309.8) | 15 | 0.0249 | Curvature | ||
| (5309.8, 5660.7) | 16 | 0.4826 | (−87, −71) | 1 | 0.6172 |
| (5660.7, 6011.6) | 17 | 0.2905 | (−71, −55) | 2 | 0.6172 |
| (6011.6, 6362.6) | 18 | 0.1779 | (−55, −39) | 3 | 0.6172 |
| (6362.6, 6713.5) | 19 | 0.2509 | (−39, −23) | 4 | 0.6172 |
| (6713.5, 7064.4) | 20 | 0.0249 | (−23, −7) | 5 | 1.5330 |
| (7064.4, 7415.3) | 21 | 0.0249 | (−7, 9) | 6 | −0.0776 |
| (7415.3, 7766.2) | 22 | −0.2809 | (9, 26) | 7 | 1.8013 |
| (7766.2, 8117.2) | 23 | −0.1779 | (26, 42) | 8 | 0.6172 |
| (8117.2, 8468.1) | 24 | 0.1977 | (42, 58) | 9 | 0.6172 |
| (8468.1, 8819.0) | 25 | 0.7341 | (58, 73) | 10 | 0.6172 |
| Elevation | Land use | ||||
| (712.0, 1132.5) | 1 | 2.2752 | Garden plot | 1 | −0.6334 |
| (1132.5, 1553.0) | 2 | 2.5161 | Woodland | 2 | 0.3175 |
| (1553.0, 1973.5) | 3 | 1.9906 | Land for water bodies and water conservancy facilities | 3 | −1.1400 |
| (1973.5, 2394.0) | 4 | 1.3606 | Grassland | 4 | 1.2023 |
| (2394.0, 2814.5) | 5 | 0.5051 | Commercial area | 5 | 1.0398 |
| (2814.5, 3235.0) | 6 | −0.4698 | Land for industrial and mining warehousing | 6 | −1.1400 |
| (3235.0, 3655.5) | 7 | −1.6533 | Other land | 7 | −1.1400 |
| (3655.5, 4076.0) | 8 | −2.7238 | Distance to faults | ||
| (4076.0, 4496.5) | 9 | −4.4023 | (0, 17.8) | 1 | 0.8153 |
| (4496.5, 4917.0) | 10 | −3.7094 | (17.8, 35.6) | 2 | 0.1081 |
| (4917.0, 5337.5) | 11 | −7.3573 | (35.6, 53.4) | 3 | −0.5102 |
| (5337.5, 5758.0) | 12 | −7.3573 | (53.4, 71.2) | 4 | −0.3852 |
| Slope | (71.2, 89.0) | 5 | −0.5233 | ||
| (0, 10) | 1 | −0.1749 | (89.0, 106.8) | 6 | −0.6628 |
| (10, 20) | 2 | −0.7377 | (106.8, 124.6) | 7 | −1.2068 |
| (20, 30) | 3 | −0.5357 | (124.6, 142.4) | 8 | −1.8504 |
| (30, 40) | 4 | 0.0610 | (142.4, 160.2) | 9 | −1.3686 |
| (40, 50) | 5 | 0.6785 | (160.2, 178) | 10 | −1.1733 |
| (50, 60) | 6 | 1.0211 | (178, 195.8) | 11 | −1.2810 |
| (60, 70) | 7 | 1.0880 | (195.8, 213.6) | 12 | −1.7543 |
| (70, 80) | 8 | 1.5884 | (213.6, 231.4) | 13 | −2.2307 |
| (80, 90) | 9 | 0.8379 | (231.4, 249.2) | 14 | −7.9980 |
| (249.2, 267.0) | 15 | −7.9980 |
| Evidence Factors | Classification of Factors | Weight | |||
|---|---|---|---|---|---|
| Aspect | Lithology | ||||
| Flat | 1 | 0.0331 | Sandstone, siltstone interbedded with phyllite | 1 | −0.7916 |
| N | 2 | −0.1245 | Shale, phyllite, and siltstone | 2 | −2.1887 |
| NE | 3 | 0.0331 | Granitic rocks | 3 | 0.1404 |
| E | 4 | 0.1680 | Syenite | 4 | −2.8900 |
| SE | 5 | 0.2614 | Diorite | 5 | 1.6488 |
| S | 6 | 0.0981 | Limestone and sandstone | 6 | 0.5199 |
| SW | 7 | −0.1140 | Unconsolidated deposits | 7 | −2.7231 |
| W | 8 | −0.2686 | Sandstone, siltstone, and shale | 8 | −0.7046 |
| NW | 9 | −0.2340 | Limestone intercalated with shale | 9 | 0.2194 |
| NDVI | Limestone, sandstone, and shale | 10 | −0.2741 | ||
| (46, 396.9) | 1 | 0.0010 | Limestone and dolomite intercalated with phyllite | 11 | 0.7933 |
| (396.9, 747.8) | 2 | 0.0010 | Dolomite, silicalite, phyllite, sandstone, and siltstone | 12 | 1.0446 |
| (747.8, 1098.8) | 3 | −2.6467 | Amphibolite | 13 | 2.0284 |
| (1098.8, 1449.7) | 4 | −2.5191 | Sandstone and siltstone intercalated with slate | 14 | −0.7046 |
| (1449.7, 1800.6) | 5 | −1.3168 | Sandstone and siltstone interbedded with shale | 15 | −0.7046 |
| (1800.6, 2151.5) | 6 | −0.7417 | Profile curve | ||
| (2151.5, 2502.4) | 7 | −0.4388 | (−38.6, −28.6) | 1 | 0.9019 |
| (2502.4, 2853.4) | 8 | 0.0010 | (−28.6, −18.6) | 2 | 0.9019 |
| (2853.4, 3204.3) | 9 | 0.3448 | (−18.6, −8.6) | 3 | 2.0946 |
| (3204.3, 3555.2) | 10 | 0.3301 | (−8.6, 2.6) | 4 | −0.1445 |
| (3555.2, 3906.1) | 11 | 0.0010 | (2.6, 12.6) | 5 | 1.3907 |
| (3906.1, 4257.0) | 12 | 0.0010 | (12.6, 22.6) | 6 | 2.3735 |
| (4257.0, 4608.0) | 13 | 0.3733 | (22.6, 32.6) | 7 | 0.9019 |
| (4608.0, 4958.9) | 14 | 0.3242 | (32.6, 44.3) | 8 | 0.9019 |
| (4958.9, 5309.8) | 15 | 0.0010 | Curvature | ||
| (5309.8, 5660.7) | 16 | 0.4448 | (−87, −71) | 1 | 0.4866 |
| (5660.7, 6011.6) | 17 | 0.2405 | (−71, −55) | 2 | 0.4866 |
| (6011.6, 6362.6) | 18 | 0.2123 | (−55, −39) | 3 | 0.4866 |
| (6362.6, 6713.5) | 19 | 0.2279 | (−39, −23) | 4 | 0.4866 |
| (6713.5, 7064.4) | 20 | 0.0010 | (−23, −7) | 5 | 1.5008 |
| (7064.4, 7415.3) | 21 | 0.0010 | (−7, 9) | 6 | −0.0746 |
| (7415.3, 7766.2) | 22 | −0.2807 | (9, 26) | 7 | 1.7797 |
| (7766.2, 8117.2) | 23 | −0.1889 | (26, 42) | 8 | 0.4866 |
| (8117.2, 8468.1) | 24 | 0.1636 | (42, 58) | 9 | 0.4866 |
| (8468.1, 8819.0) | 25 | 0.7339 | (58, 73) | 10 | 0.4866 |
| Elevation | Land use | ||||
| (712.0, 1132.5) | 1 | 2.3614 | Garden plot | 1 | −0.6211 |
| (1132.5, 1553.0) | 2 | 2.5933 | Woodland | 2 | 0.2952 |
| (1553.0, 1973.5) | 3 | 2.0378 | Land for water bodies and water conservancy facilities | 3 | −1.2705 |
| (1973.5, 2394.0) | 4 | 1.3316 | Grassland | 4 | 1.3025 |
| (2394.0, 2814.5) | 5 | 0.4473 | Commercial area | 5 | 1.6173 |
| (2814.5, 3235.0) | 6 | −0.5438 | Land for industrial and mining warehousing | 6 | −1.2705 |
| (3235.0, 3655.5) | 7 | −1.7469 | Other land | 7 | −1.2705 |
| (3655.5, 4076.0) | 8 | −2.8544 | Distance to faults | ||
| (4076.0, 4496.5) | 9 | −4.5328 | (0, 17.8) | 1 | 0.7957 |
| (4496.5, 4917.0) | 10 | −3.5522 | (17.8, 35.6) | 2 | 0.1558 |
| (4917.0, 5337.5) | 11 | −7.4878 | (35.6, 53.4) | 3 | −0.5325 |
| (5337.5, 5758.0) | 12 | −7.4878 | (53.4, 71.2) | 4 | −0.3549 |
| Slope | (71.2, 89.0) | 5 | −0.4789 | ||
| (0, 10) | 1 | 0.0442 | (89.0, 106.8) | 6 | −0.7080 |
| (10, 20) | 2 | −0.7259 | (106.8, 124.6) | 7 | −1.1509 |
| (20, 30) | 3 | −0.5053 | (124.6, 142.4) | 8 | −1.7985 |
| (30, 40) | 4 | 0.0442 | (142.4, 160.2) | 9 | −1.3398 |
| (40, 50) | 5 | 0.6464 | (160.2, 178) | 10 | −1.2371 |
| (50, 60) | 6 | 0.9914 | (178, 195.8) | 11 | −1.2571 |
| (60, 70) | 7 | 1.1309 | (195.8, 213.6) | 12 | −1.6333 |
| (70, 80) | 8 | 1.5557 | (213.6, 231.4) | 13 | −2.3612 |
| (80, 90) | 9 | 0.0442 | (231.4, 249.2) | 14 | −3.2262 |
| (249.2, 267.0) | 15 | −6.7693 |
| Landslide Type | Landslide Probability Grading Interval | Landslide Probability Grading Category | Proportion of Known Landslides Corresponding to the Landslide Probability Grading Category | Area Occupied by Landslide Probability Grading Category |
|---|---|---|---|---|
| Rainfall landslide | [0.9000, 1] | Extremely high | 80.34% | 6.60% |
| [0.4745, 0.9000] | High | 15.72% | 8.34% | |
| [0.2588, 0.4745] | Medium | 1.97% | 10.95% | |
| [0.0902, 0.2588] | Low | 0.74% | 22.06% | |
| [0, 0.0902] | Extremely low | 1.23% | 52.05% | |
| Seismic landslide | [0.9000, 1] | Extremely high | 88.18% | 17.13% |
| [0.5922, 0.9000] | High | 8.62% | 9.42% | |
| [0.3333, 0.5922] | Medium | 1.77% | 8.28% | |
| [0.1137, 0.3333] | Low | 0.85% | 12.58% | |
| [0, 0.1137] | Extremely low | 0.58% | 52.59% |
| Landslide Type | Landslide Probability Grading Interval | Landslide Probability Grading Category | Proportion of Known Landslides Corresponding to the Landslide Probability Grading Category | Area Occupied by Landslide Probability Grading Category |
|---|---|---|---|---|
| Unclassified landslide | [0.9000, 1] | Extremely high | 87.40% | 16.88% |
| [0.5882, 0.9000] | High | 9.53% | 10.24% | |
| [0.3333, 0.5882] | Medium | 1.28% | 7.95% | |
| [0.1137, 0.3333] | Low | 1.13% | 11.06% | |
| [0, 0.1137] | Extremely low | 0.66% | 53.87% | |
| Spatial overlay | Extremely high | 89.06% | 17.38% | |
| High | 8.23% | 11.66% | ||
| Medium | 1.61% | 12.39% | ||
| Low | 0.67% | 21.28% | ||
| Extremely low | 0.43% | 37.29% |
| Reality | 0 | 1 | ||
|---|---|---|---|---|
| Prediction | ||||
| Rainfall landslide training set | 0 | 306 | 47 | |
| 1 | 0 | 259 | ||
| Rainfall landslide testing set | 0 | 100 | 33 | |
| 1 | 1 | 68 | ||
| Rainfall landslide whole set | 0 | 468,447 | 39 | |
| 1 | 94,661 | 368 | ||
| Seismic landslide training set | 0 | 2202 | 221 | |
| 1 | 0 | 1981 | ||
| Seismic landslide testing set | 0 | 724 | 127 | |
| 1 | 10 | 607 | ||
| Seismic landslide whole set | 0 | 466,625 | 486 | |
| 1 | 93,954 | 2450 | ||
| Unclassified landslide training set | 0 | 2466 | 273 | |
| 1 | 0 | 2192 | ||
| Unclassified landslide testing set | 0 | 813 | 143 | |
| 1 | 8 | 678 | ||
| Unclassified landslide whole set | 0 | 467,927 | 559 | |
| 1 | 92,302 | 2727 | ||
| Accuracy | Recall | |
|---|---|---|
| Rainfall landslide training set | 0.9232 | 0.8464 |
| Rainfall landslide testing set | 0.8317 | 0.6733 |
| Rainfall landslide whole set | 0.8319 | 0.9042 |
| Seismic landslide training set | 0.9498 | 0.8996 |
| Seismic landslide testing set | 0.9067 | 0.8270 |
| Seismic landslide whole set | 0.8324 | 0.8345 |
| Unclassified landslide training set | 0.9446 | 0.8892 |
| Unclassified landslide testing set | 0.9080 | 0.8258 |
| Unclassified landslide whole set | 0.8352 | 0.8299 |
Disclaimer/Publisher’s Note: The statements, opinions and data contained in all publications are solely those of the individual author(s) and contributor(s) and not of MDPI and/or the editor(s). MDPI and/or the editor(s) disclaim responsibility for any injury to people or property resulting from any ideas, methods, instructions or products referred to in the content. |
© 2023 by the authors. Licensee MDPI, Basel, Switzerland. This article is an open access article distributed under the terms and conditions of the Creative Commons Attribution (CC BY) license (https://creativecommons.org/licenses/by/4.0/).
Share and Cite
Wang, X.; Bai, S. Landslide Susceptibility Mapping and Interpretation in the Upper Minjiang River Basin. Remote Sens. 2023, 15, 4947. https://doi.org/10.3390/rs15204947
Wang X, Bai S. Landslide Susceptibility Mapping and Interpretation in the Upper Minjiang River Basin. Remote Sensing. 2023; 15(20):4947. https://doi.org/10.3390/rs15204947
Chicago/Turabian StyleWang, Xin, and Shibiao Bai. 2023. "Landslide Susceptibility Mapping and Interpretation in the Upper Minjiang River Basin" Remote Sensing 15, no. 20: 4947. https://doi.org/10.3390/rs15204947
APA StyleWang, X., & Bai, S. (2023). Landslide Susceptibility Mapping and Interpretation in the Upper Minjiang River Basin. Remote Sensing, 15(20), 4947. https://doi.org/10.3390/rs15204947