Article

Analysis of Winter Anomaly and Annual Anomaly Based on Regression Approach

1
School of Civil Engineering and Geomatics, Shandong University of Technology, Zibo 255000, China
2
State Key Laboratory of Space Weather, Chinese Academy of Sciences, Beijing 100190, China
3
State Key Laboratory of Geo-Information Engineering, Xi’an 710054, China
*
Author to whom correspondence should be addressed.
Remote Sens. 2023, 15(20), 4968; https://doi.org/10.3390/rs15204968
Submission received: 18 September 2023 / Revised: 10 October 2023 / Accepted: 11 October 2023 / Published: 15 October 2023
(This article belongs to the Special Issue Ionosphere Monitoring with Remote Sensing II)

Abstract

:
Studying the temporal and spatial dependence of ionospheric anomalies using total electron content (TEC) can provide an important reference for developing empirical ionospheric models. In this study, winter anomaly, annual anomaly, and the contributions of winter anomaly to annual anomaly were investigated during solar cycle 24 (2008–2018) by using the global ionosphere maps of the Center for Orbit Determination in Europe during the geomagnetic activity quiet period (Kp ≤ 5) based on a regression approach. Our detailed analysis shows the following: (1) Winter anomaly is more significant at 11:00–13:00 local time (LT), and the region of winter anomaly extends from North America to the Far East with increasing solar activity levels. (2) The minimum level of solar activity corresponding to the occurrence of winter anomaly was calculated at each grid point, which can provide a reference for single-point ionospheric modeling. (3) The annual anomaly reaches its maximum at 12:00 LT when the TEC in December is 34.4% higher than in June. (4) At 12:00 LT, the winter anomaly contributes up to 32% to the annual anomaly (at this time, the winter hemisphere contributes 57% to the annual anomaly).

1. Introduction

Behaviors of the ionospheric F2 layer that depart from the prediction of Chapman’s model are considered anomalies [1]. These ionospheric anomalies are related to the plasma motion of the ionosphere, variations in the composition of the atmosphere, etc., [2]. Ionospheric anomalies include annual anomaly, semiannual anomaly, winter anomaly, equatorial anomaly, and midlatitude summer nighttime anomaly, etc., which show regular temporal and spatial variation characteristics. The annual anomaly indicates that the F2-layer peak electron density (NmF2) combined from both hemispheres is greater (about 20%) during December than during June [3]. The semiannual anomaly indicates that NmF2 is greater during equinoxes than during either solstice [4]. The winter anomaly indicates that daytime NmF2 is greater in winter than in summer at middle latitudes at approximately the same solar activity level [5]. The equatorial anomaly indicates the occurrence of NmF2 peaks in the region 15°–20° north and south of the magnetic equator in magnetic coordinates [6]. The midlatitude summer nighttime anomaly indicates that the peak of summer NmF2 occurs around midnight [7]. Among the above ionospheric anomalies, winter anomaly is coupled with the annual anomaly, with both attracting extensive attention from scholars.
In 1936, Berkner et al. [5] discovered winter anomaly for the first time in both hemispheres, and since then, winter anomaly has been extensively investigated. Many scholars have studied the relationship between winter anomaly and solar activity. For example, Torr and Torr [8] constructed a global distribution of NmF2 at low-, medium-, and high- solar activity levels. They found winter anomaly in the middle and high latitudes of the Northern Hemisphere and the Australian region of the Southern Hemisphere. Moreover, the winter anomaly is more intense and widespread with increasing solar activity levels. Based on global ionosphere maps (GIMs) from the Jet Propulsion Laboratory (JPL) for the years spanning 1998–2015, Yasyukevich et al. [9] analyzed the relationship between winter anomaly and solar activity using regression. They found that winter anomaly was most significant in North America, the Far East, and Australia and showed a positive correlation with solar activity. Azpilicueta and Nava [10] calculated the minimum level of solar activity corresponding to the occurrence of winter anomaly at 66 Global Positioning System (GPS) single stations. They found that the proportion of stations with winter anomaly in the northern and southern hemispheres was 1/33 and 21/33, respectively. In addition, Yasyukevich et al. [9] studied the relationship between winter anomaly and geomagnetic activity for the first time. They found that the growth of geomagnetic disturbance facilitates the intensity of the winter anomaly. Pavlov and Pavlova [11] found a higher correlation between winter anomaly and geomagnetic latitude than geographical latitude. Many scholars investigated the relationship between winter anomaly and magnetic pole positions and found that winter anomaly is more obvious near the poles [12,13,14]. But this conclusion is not absolute. Huo et al. [15] studied the geographical distribution of winter anomaly by using GPS total electron content (TEC) in 2002. They found that winter anomaly is more significant in the East Siberian region (far pole region) than in Europe. Many scholars also studied the altitudinal extent of winter anomaly and found that the winter anomaly exists only over a limited height range (about 150–450 km) around the peak height [13,16,17].
The physical mechanisms of winter anomaly have been extensively studied. Rishbeth and Setty [18] suggested that changes in neutral composition cause the winter anomaly, specifically the ratio of O/N2. King [19] suggested that the changes are the results of global circulation in the thermosphere. This mechanism has been the most commonly accepted and confirmed in many publications [2,4,9,12,20,21]. However, longitudinal variations of the winter anomaly cannot be attributed to O/N2 behavior. Yasyukevich et al. [9] concluded that it may be related to longitudinal variations of the vertical plasma transport induced by the thermosphere wind in local winter. Other influence factors of winter anomaly have also been put forward, such as the effects of temperature on the recombination coefficient between O + and the molecular neutral gas [20], the interruptions of the equatorial anomaly for the solar-heating induced summer-to-winter meridional wind [22], and the influences of vibrationally excited molecules [23].
In 1938, Berkner and Wells [3] discovered annual anomaly for the first time. Subsequently, Yonezawa [24] further studied this anomaly by using the NmF2 data from pairing ionosonde measurements. Rishbeth [4] and Rishbeth et al. [25] provided a good overview of the work on annual anomaly variations in the ionosphere. Rishbeth and Müller-Wodarg [26] combined paired NmF2 data from both hemispheres to describe annual anomaly by defining an annual asymmetry index. They found annual anomaly at noon and midnight, which was positively correlated with the level of solar activity. Mendillo et al. [2] demonstrated that annual anomaly does not have a longitude effect but is a global-scale phenomenon by using global TEC data. Su et al. [27] found more significant annual anomaly in the top ionosphere than in the bottom. Gowtam and Ram [28] calculated the annual asymmetry index at different altitudes and found that the index reached the maximum at an altitude of 300–500 km during periods of low solar activity and at 600 km as the solar activity increased. Currently, the physical mechanism of the annual anomaly remains controversial, and is listed as one of the top scientific goals concerning the ionosphere by Rishbeth [29].
Since 1998, the ionospheric analysis centers of the International Global Navigation Satellite System Service have been releasing global ionosphere map data products that span more than two solar activity cycles [30]. Many researchers have focused on the study of ionospheric anomaly by using GIMs. For example, Zhao et al. [12] and Yasyukevich et al. [9] studied the winter anomaly by using the GIMs provided by the JPL. Mendillo et al. [2] also used these data to study the annual anomaly. Feng et al. [31] studied the midlatitude summer nighttime anomaly by using the GIMs released by the Center for Orbit Determination in Europe (CODE). Feng et al. [32] studied anomalies produced by the Tonga volcano using CODE GIMs. Their results can provide an important reference for establishing empirical ionospheric models. For example, the TECM-GRID model and TEC model of multi-source fusion introduce midlatitude summer nighttime anomaly correction terms [33,34], and the Global Neustrelitz TEC Model introduces equatorial anomaly correction terms [35,36]. These corrections significantly improve the ionospheric model accuracy.
In summary, it is of great significance to study the temporal and spatial variation characteristics of ionospheric anomalies based on TEC data, and some of the current works need to be further developed. For example, at each grid point, calculating the minimum solar activity level corresponding to the occurrence of winter anomaly can provide a reference for single-point ionospheric modeling. Winter anomaly is coupled with annual anomaly, and a quantitative analysis of the contribution of the winter anomaly to the annual anomaly can help deepen the understanding of these two anomalies. The main purpose of this study is to show the maps for the solar activity levels at which the winter anomaly appears and to assess the contribution of winter anomaly on the annual anomaly. Additionally, we verified the reliability of the regression approach.

2. Data and Approach

2.1. Data

In 1999, the CODE developed a global ionospheric model by using a spherical harmonics expansion up to degree and order 15, which has significant advantages for fitting global TEC [37]. From 3 November 2002 to 18 October 2014, the data started at 00:00 universal time (UT) and ended at 24:00 UT, with a time resolution of 2 h for a total of 13 global ionosphere maps per day. From 19 October 2014 to the present, the data starts at 00:00 UT and ends at 24:00 UT, with a time resolution of 1 h for a total of 25 global ionosphere maps per day. The latitude of the data ranges from 87.5°S to 87.5°N with 2.5° intervals, and its longitude ranges from 180°W to 180°E with 5° intervals, for a total of 5183 grid points. This study used the GIMs data of the 24th solar activity cycle (2008–2018) provided by CODE to investigate winter anomaly, annual anomaly, and the contribution of winter anomaly on annual anomaly. First, data with a temporal resolution of 2 h were linearly interpolated to uniform the amount of data for different years. Second, we transformed these data from the UT to the local time (LT) for further research (see Equation (1)). In the formula, lon is the geographic longitude of each grid point; ut is the universal time; lt is the local time; dh and dmin are the hours and minutes of difference between lt and ut, respectively. For ease of description, this study abbreviates CODE GIMs as CODG.
d h = r o u n d l o n / 15 d m i n = r o u n d l o n / 15 d h × 60 l t = u t + d h + d m i n / 60
Solar extreme ultraviolet (EUV) radiation is the best parameter to study solar radiation temporal variation characteristics and solar-ionospheric effects. However, the space-based EUV observation records lack continuity and have a short observation history. Therefore, some solar activity indices are often used as the proxy for EUV when measuring solar activity levels. The daily F10.7p has a higher correlation coefficient with solar extreme ultraviolet than other indices, which better describes the level of solar activity [38]. Equation (2) defines the daily F10.7p, where F10.7 is 10.7 cm solar radiation flux, and F10.7A is the 81-day moving average of F10.7. The unit of F10.7p is sfu (1 sfu = 10−22 Wm−2Hz−1).
F 10 . 7 p = F 10 . 7 + F 10 . 7 A / 2
The Kp index is usually used to describe the overall level of global geomagnetic activity. According to the scales (https://www.swpc.noaa.gov/noaa-scales-explanation, accessed on 10 October 2023) provided by the National Oceanic and Atmospheric Administration, the Kp value smaller than 5 implies minor geomagnetic activity. In this study, we studied winter anomaly, annual anomaly, and the contributions of winter anomaly to annual anomaly during the geomagnetic activity quiet period. Therefore, we excluded TEC data with Kp values greater than 5.
To characterize the relationship between winter anomaly and geomagnetic field configurations, we calculated the geomagnetic inclination contour by using the 13th-generation International Geomagnetic Reference Field (IGRF-13) model [39]. To verify the physical mechanism of the winter anomaly, we obtained the O/N2 of solar cycle 24 from the Global Ultraviolet Imager (GUVI).

2.2. Approach

In this study, the correlation coefficient was used to describe the correlation between TEC and the daily F10.7p to verify the reliability of the regression approach (see Equation (3)). In the formula, R is the correlation coefficient; A denotes TEC; B denotes the daily F10.7p; N is the number of data; μ A and σ A are the mean and standard deviation of TEC; μ B and σ B are the mean and standard deviation of the daily F10.7p. The correlation is low linear when R is less than 0.4, significant when R is between 0.4 and 0.7, and high linear when R is greater than 0.7 [40].
R = 1 N 1 i = 1 N A i μ A σ A B i μ B σ B
In general, winter anomaly is reflected by comparing the local time variation of TEC in summer and winter. However, ignoring the difference in solar activity levels between summer and winter introduces bias in the analysis of winter anomaly. Therefore, Yasyukevich et al. [9] investigated the winter anomaly by using a linear regression approach, which can calculate the winter anomaly index (WAI) at the same level of solar activity. The approach is extended as shown in Equations (4) and (5), where TECSLT and TECWLT are the summer and winter TEC values calculated based on the regression equation in different local times; a, b, c, d are coefficients to be estimated.
TECS LT = a l a t , l o n × F 10 . 7 p d o y + b l a t , l o n TECW LT = c l a t , l o n × F 10 . 7 p d o y + d l a t , l o n
WAI = TECW LT TECS LT
In this study, June was used to represent the Northern Hemisphere summer, and December was used to represent the Northern Hemisphere winter. At each grid point and local time, we performed linear regressions of TEC and F10.7p for summer and winter based on Equation (4), respectively. The coefficients were estimated by using least squares to obtain the corresponding regression equations. Thus, the WAI can be calculated for different local times after specifying F10.7p on the basis of Equation (5). We counted the local time corresponding to the maximum of these winter anomaly indices during 08:00–16:00 LT (ignoring low latitudes). Its global distribution was shown in Figure 1. We found that it mainly ranges between 11:00–13:00 LT and shifts backward with increasing solar activity levels. Therefore, we take the maximum value of the WAI for 11:00–13:00 LT as the final index. We describe the presence and strength of winter anomaly through the WAI. If WAI is less than 1, there is no winter anomaly; if WAI is greater than 1, there is a winter anomaly, and the larger the WAI is, the more significant the winter anomaly is.
For ease of description, the minimum solar activity level corresponding to the occurrence of winter anomaly was represented by F10.7p triggering values (FTVs). We limited the range of FTVs to 66–181 sfu since the values of F10.7p for 2018–2018 range from 66 to 181 sfu. In this study, the global map of FTVs was calculated based on the regression equation at 12:00 LT, which is as follows: (1) At each grid point, we specify F10.7p in the range of 66–181 sfu with an interval of 1 sfu and substitute it into the corresponding summer and winter regression equations for 12:00 LT. Thus, the summer and winter TEC sequences calculated by using the regression equation are obtained at different levels of solar activity. (2) If TECWLT is always greater than TECSLT at the same level of solar activity, then FTVs are set to 66 sfu, in which case winter anomaly is always considered to occur. (3) If TECWLT is always smaller than TECSLT at the same level of solar activity, then FTVs are set to NAN, in which case winter anomaly is always considered to be absent. (4) If there is an intersection of TECWLT and TECSLT, then we calculate the FTVs based on Equation (6), where a, b, c, d are coefficients of regression equations in Equation (4). Winter anomaly is considered to occur when the level of solar activity is greater than FTVs.
FTVs = d b / a c
In this study, we described the magnitude of the annual anomaly by annual anomaly index (AI), the relative size of TEC in December to that in June, as shown in Equation (7). In the formula, TEC12 is the global TEC average for December, and TEC06 is the global TEC average for June.
AI = TEC 12 TEC 06 / TEC 06
By decomposing the annual anomaly index to the hemispheric scale, we derived the proportion of the winter hemisphere contributing to the annual anomaly (WHCP) and that of the winter anomaly contributing to the annual anomaly (WACP). See Appendix A for a detailed derivation.

3. Results

3.1. Viability Analysis

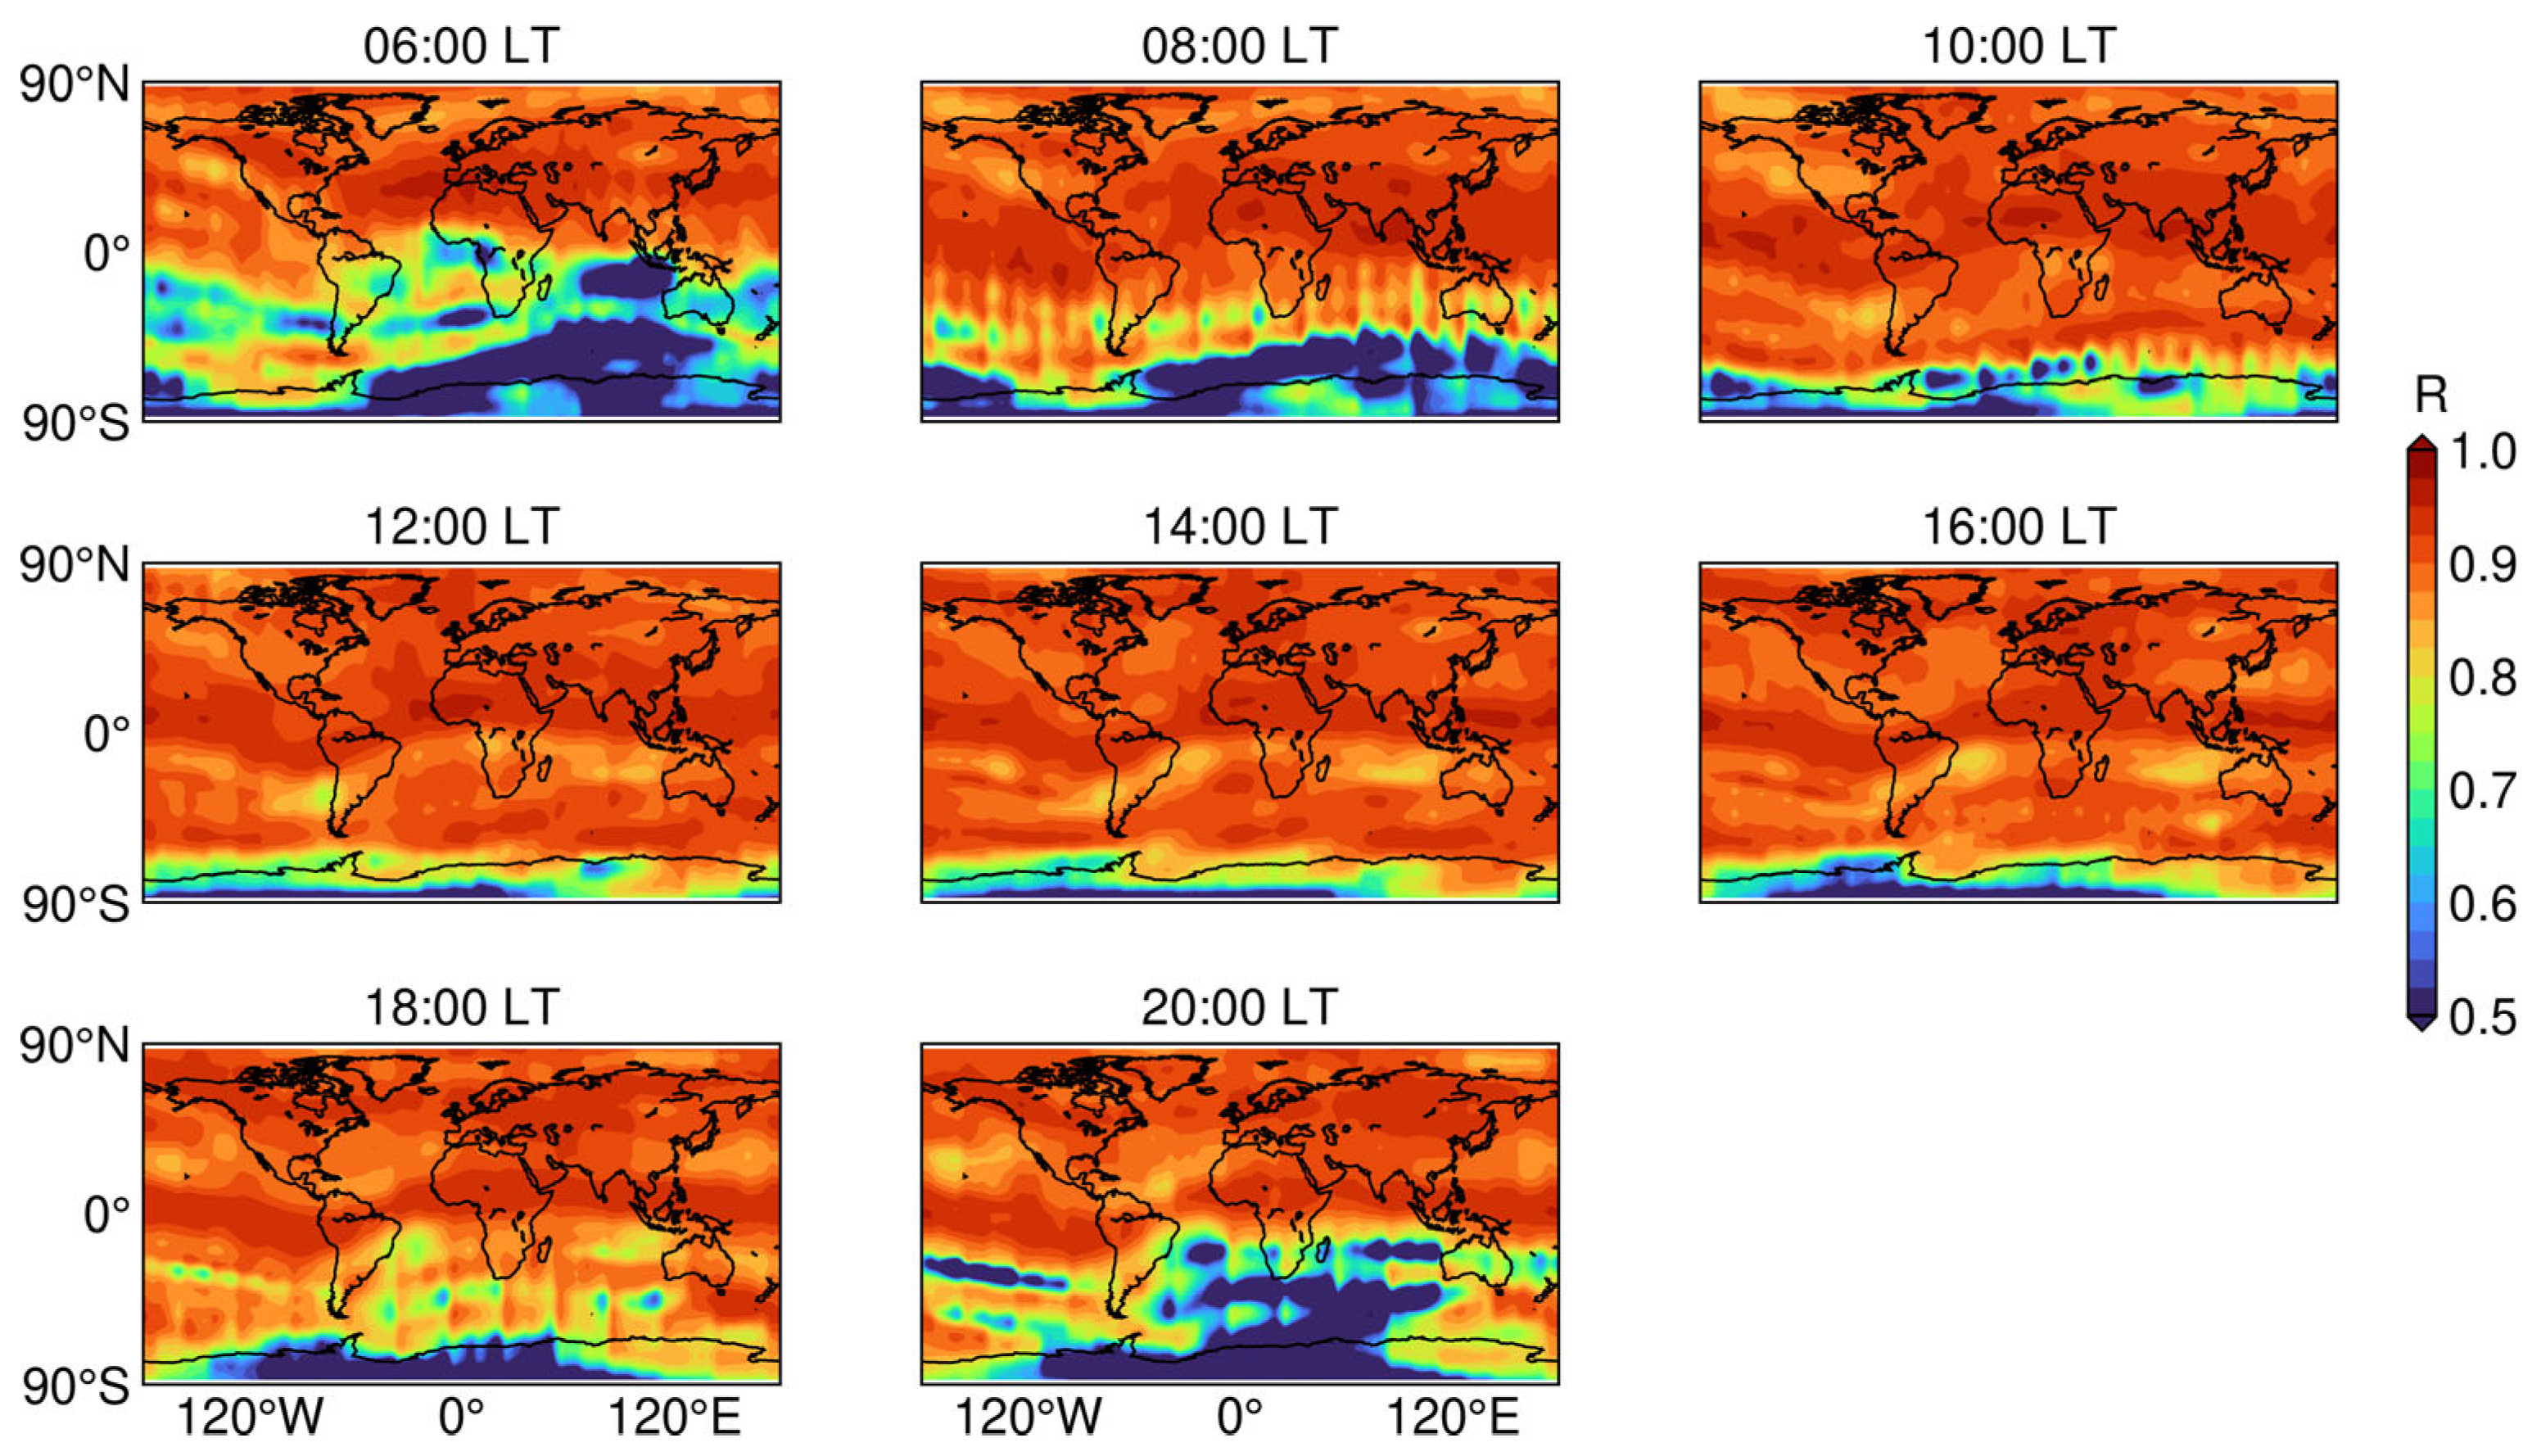
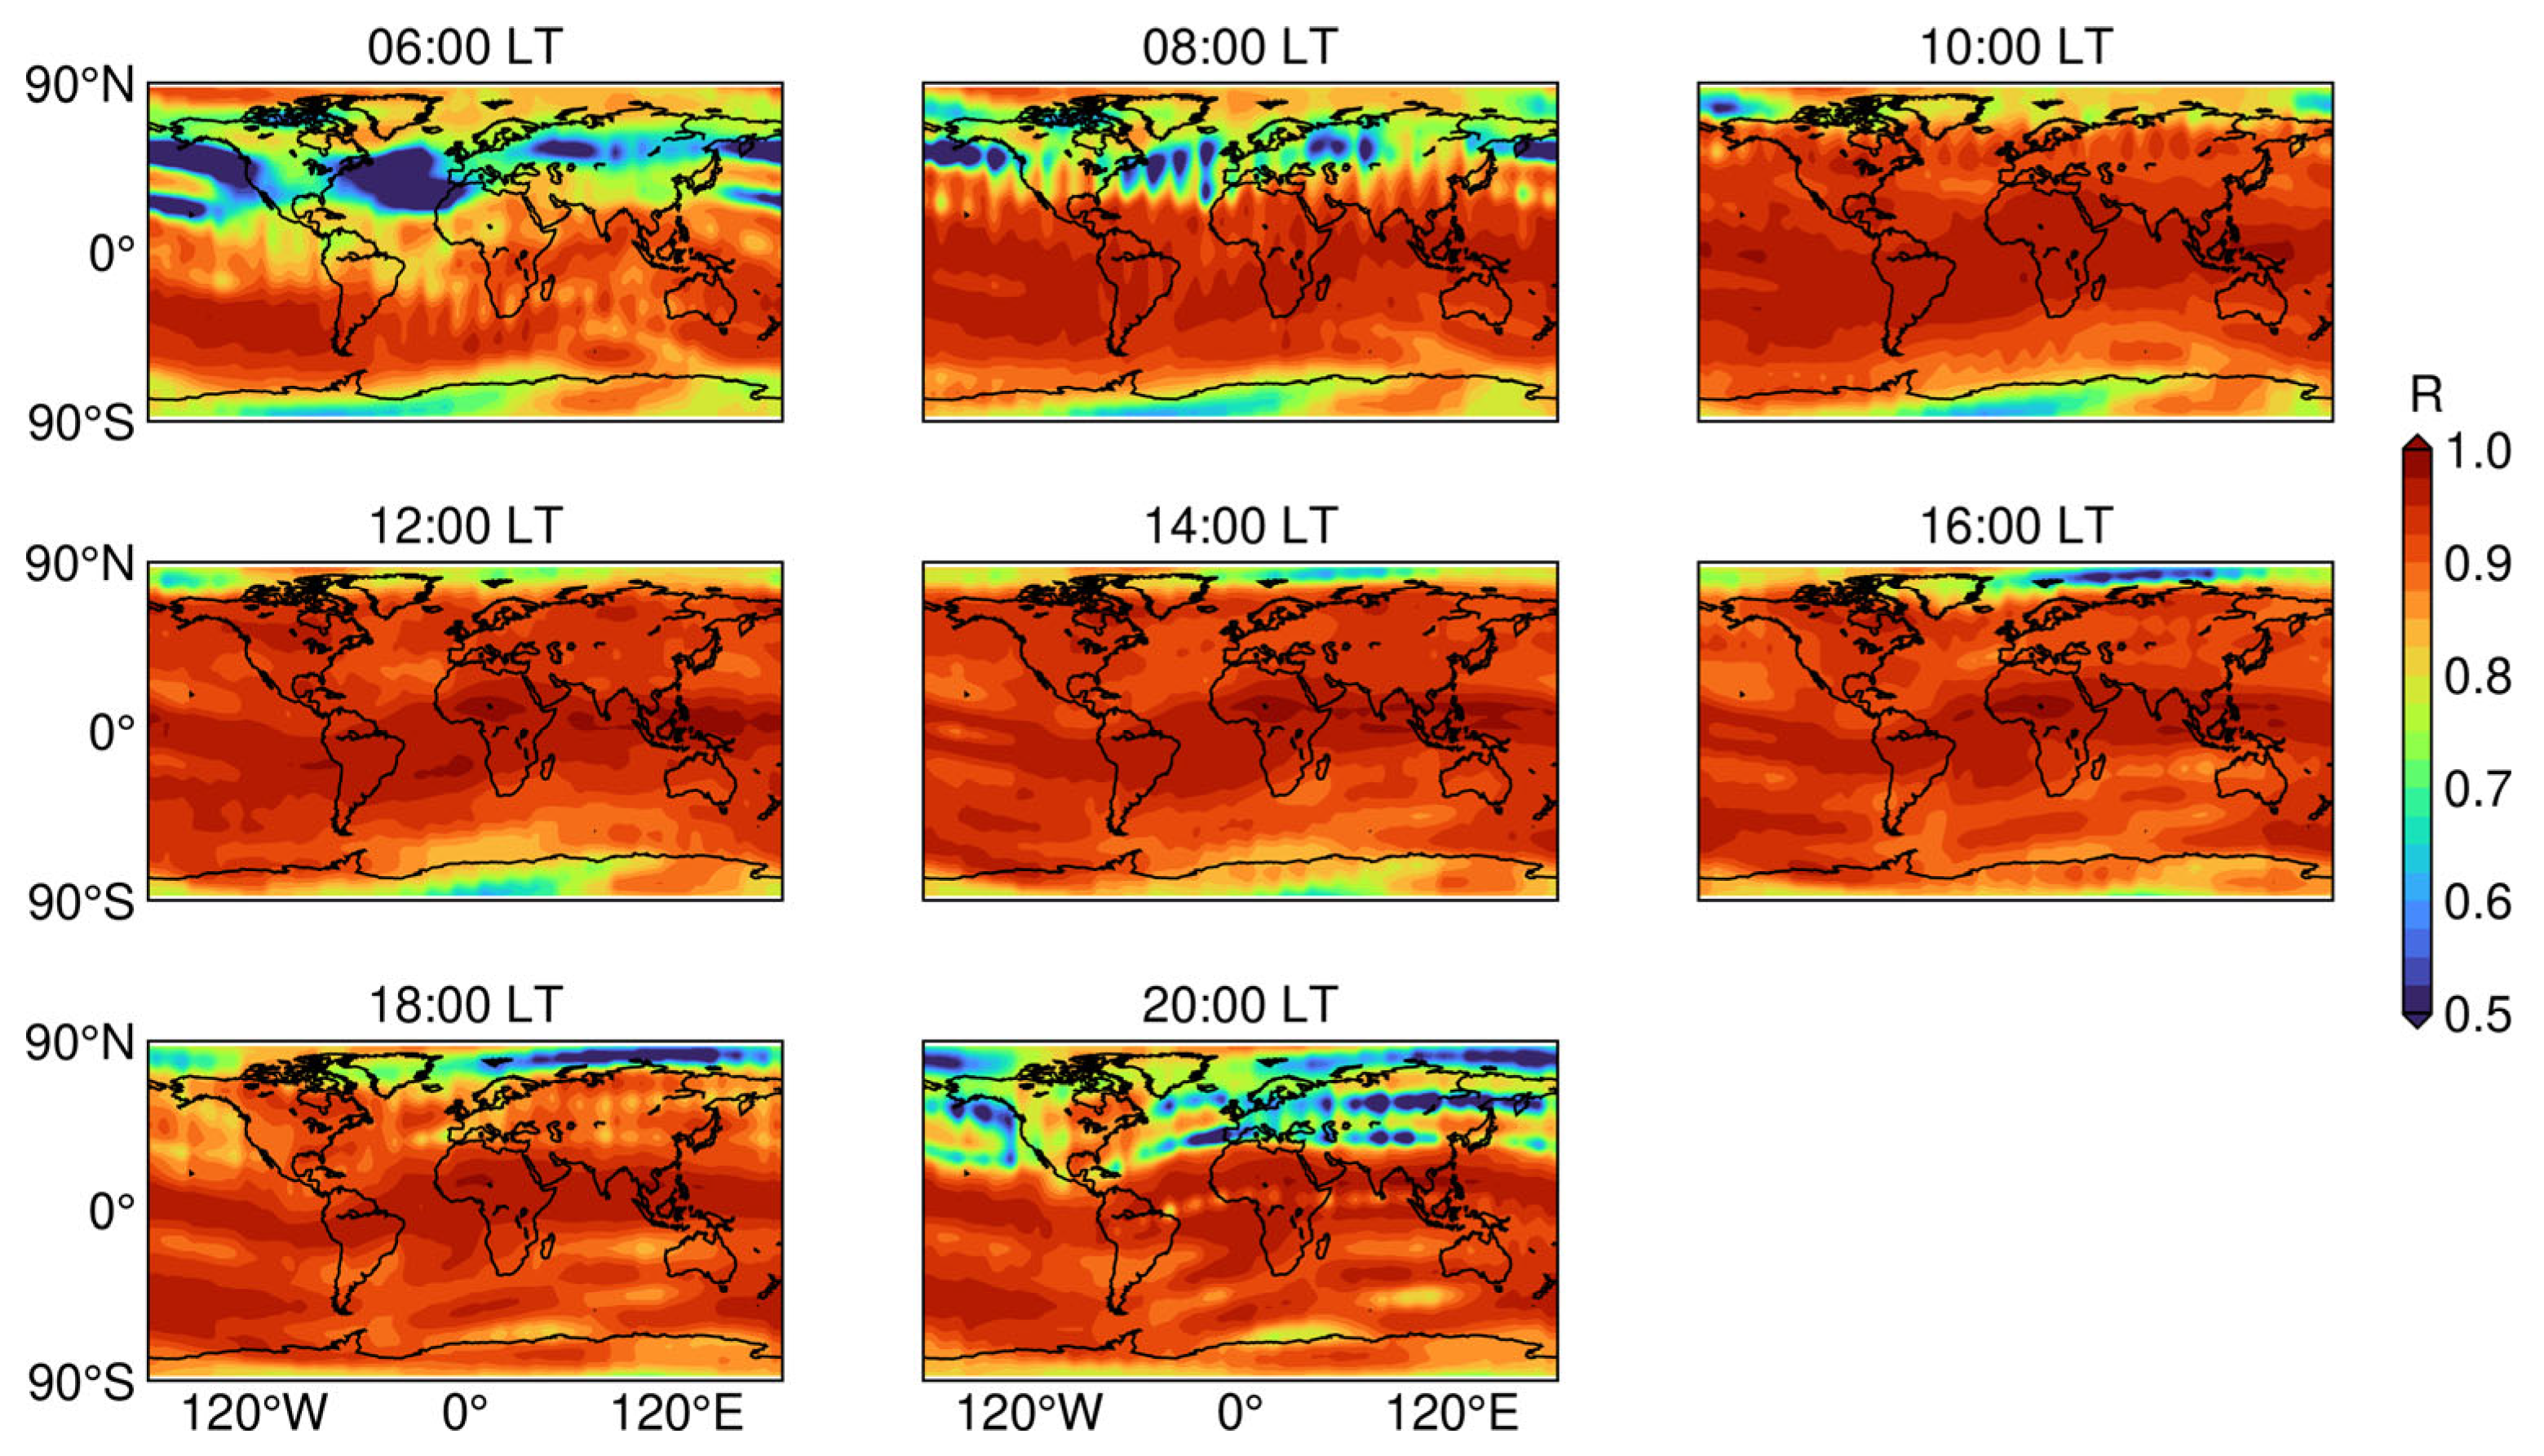
We showed the global distribution of the correlation coefficients between TEC and the daily F10.7p at different local times (06:00–20:00 LT) in June and December (see Figure 2 and Figure 3). In June, the correlation coefficients are lower near the Antarctic Peninsula. Additionally, the correlation coefficients are also relatively lower before 08:00 LT and after 18:00 LT in the middle latitudes of the Southern Hemisphere. The TEC calculated using the regression equation in this region may not describe the true variation in TEC. In December, the correlation coefficients are lower near the North Pole. Additionally, the correlation coefficients are also relatively lower before 08:00 LT and after 20:00 LT in the middle latitudes of the Northern Hemisphere. The TEC calculated using the regression equation in this region may not describe the true variation in TEC. Outside of these regions, correlation coefficients are over 0.9. Therefore, one can reliably use the regression approach to study anomalies when choosing the appropriate geographic location and local time.
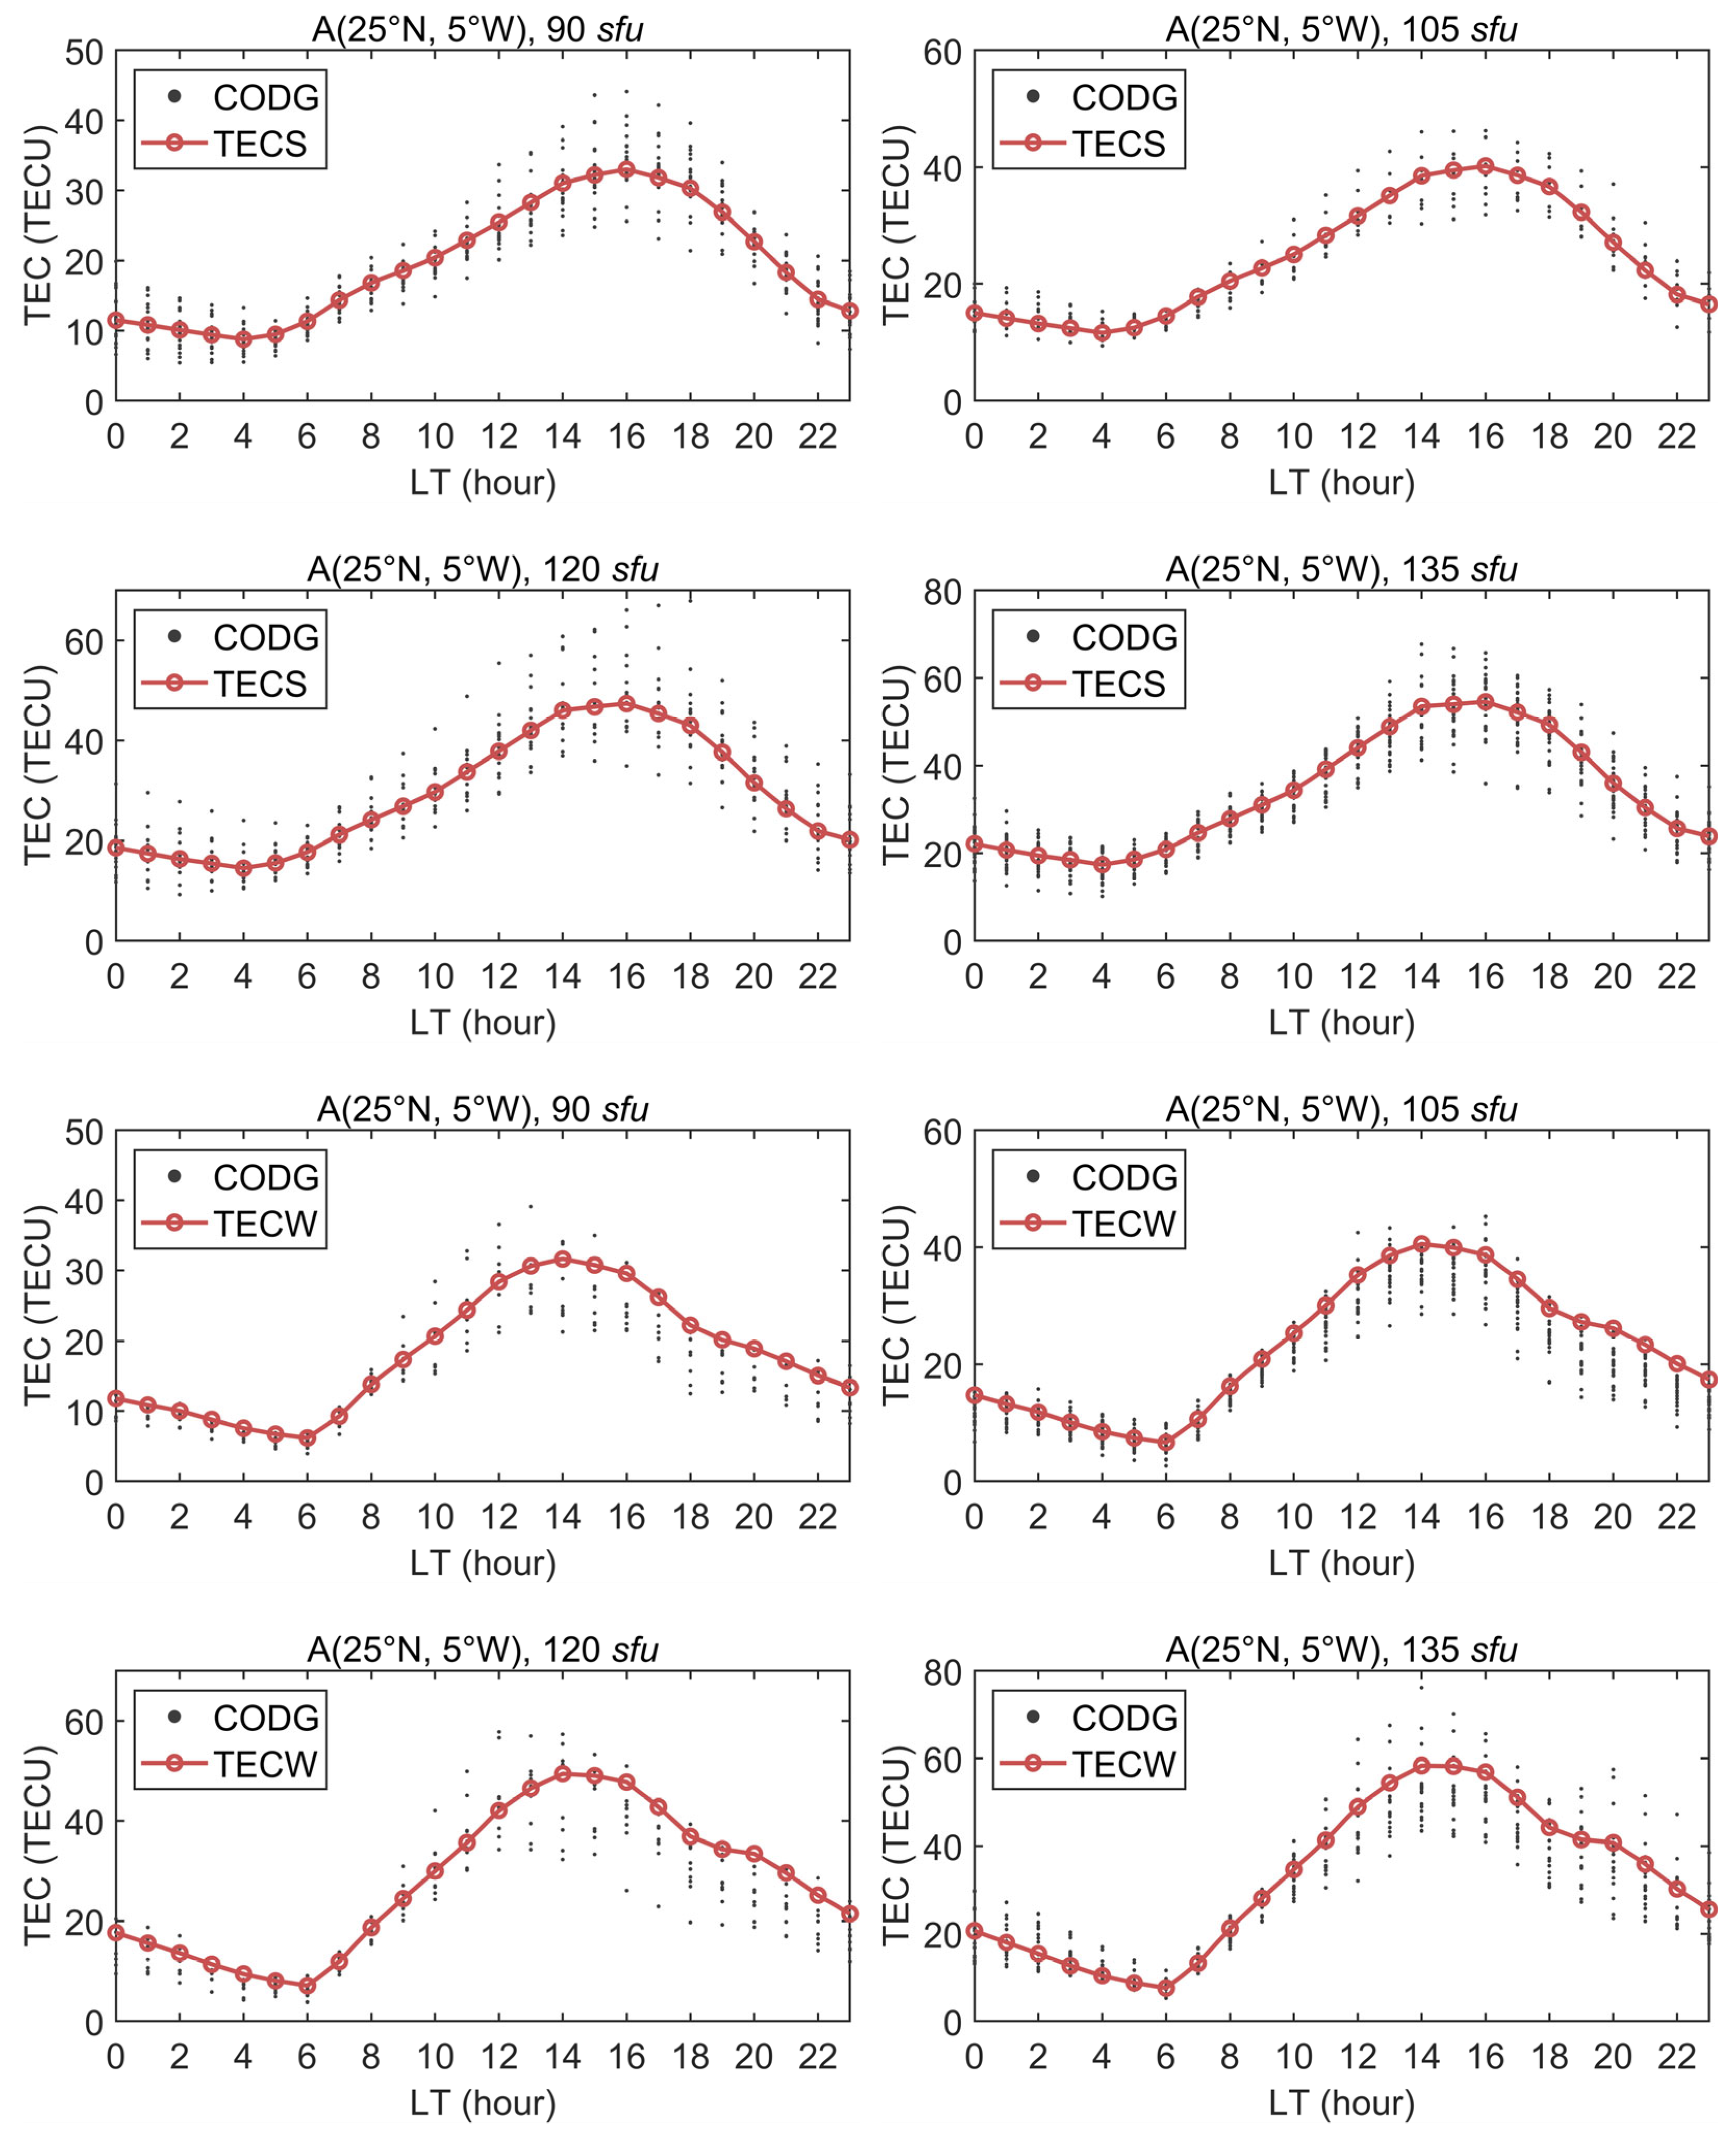
In this study, points A (25.5°N, 5°W) and B (52.5°N, 95°W) were selected to verify the conformity of CODG with the TEC calculated by regression equations at different levels of solar activity, as shown in Figure 4 and Figure 5. In these figures, TECS and TECW represent the summer TEC and winter TEC values calculated based on the regression equation, respectively. We selected four levels of solar activity: 90 sfu, 105 sfu, 120 sfu, and 135 sfu. The difference between the solar activity level corresponding to CODG and the labeled solar activity level is ±3 sfu. Point A is located at low latitudes and exhibits minimal seasonal variations in TEC, whereas point B is located at middle latitudes and displays more significant seasonal variations in TEC. Both at point A and point B, CODG conformed better with TECS and less well with TECW, but both conformed to the requirements of this study. Overall, the study of winter anomaly and annual anomaly based on the regression approach is reliable.
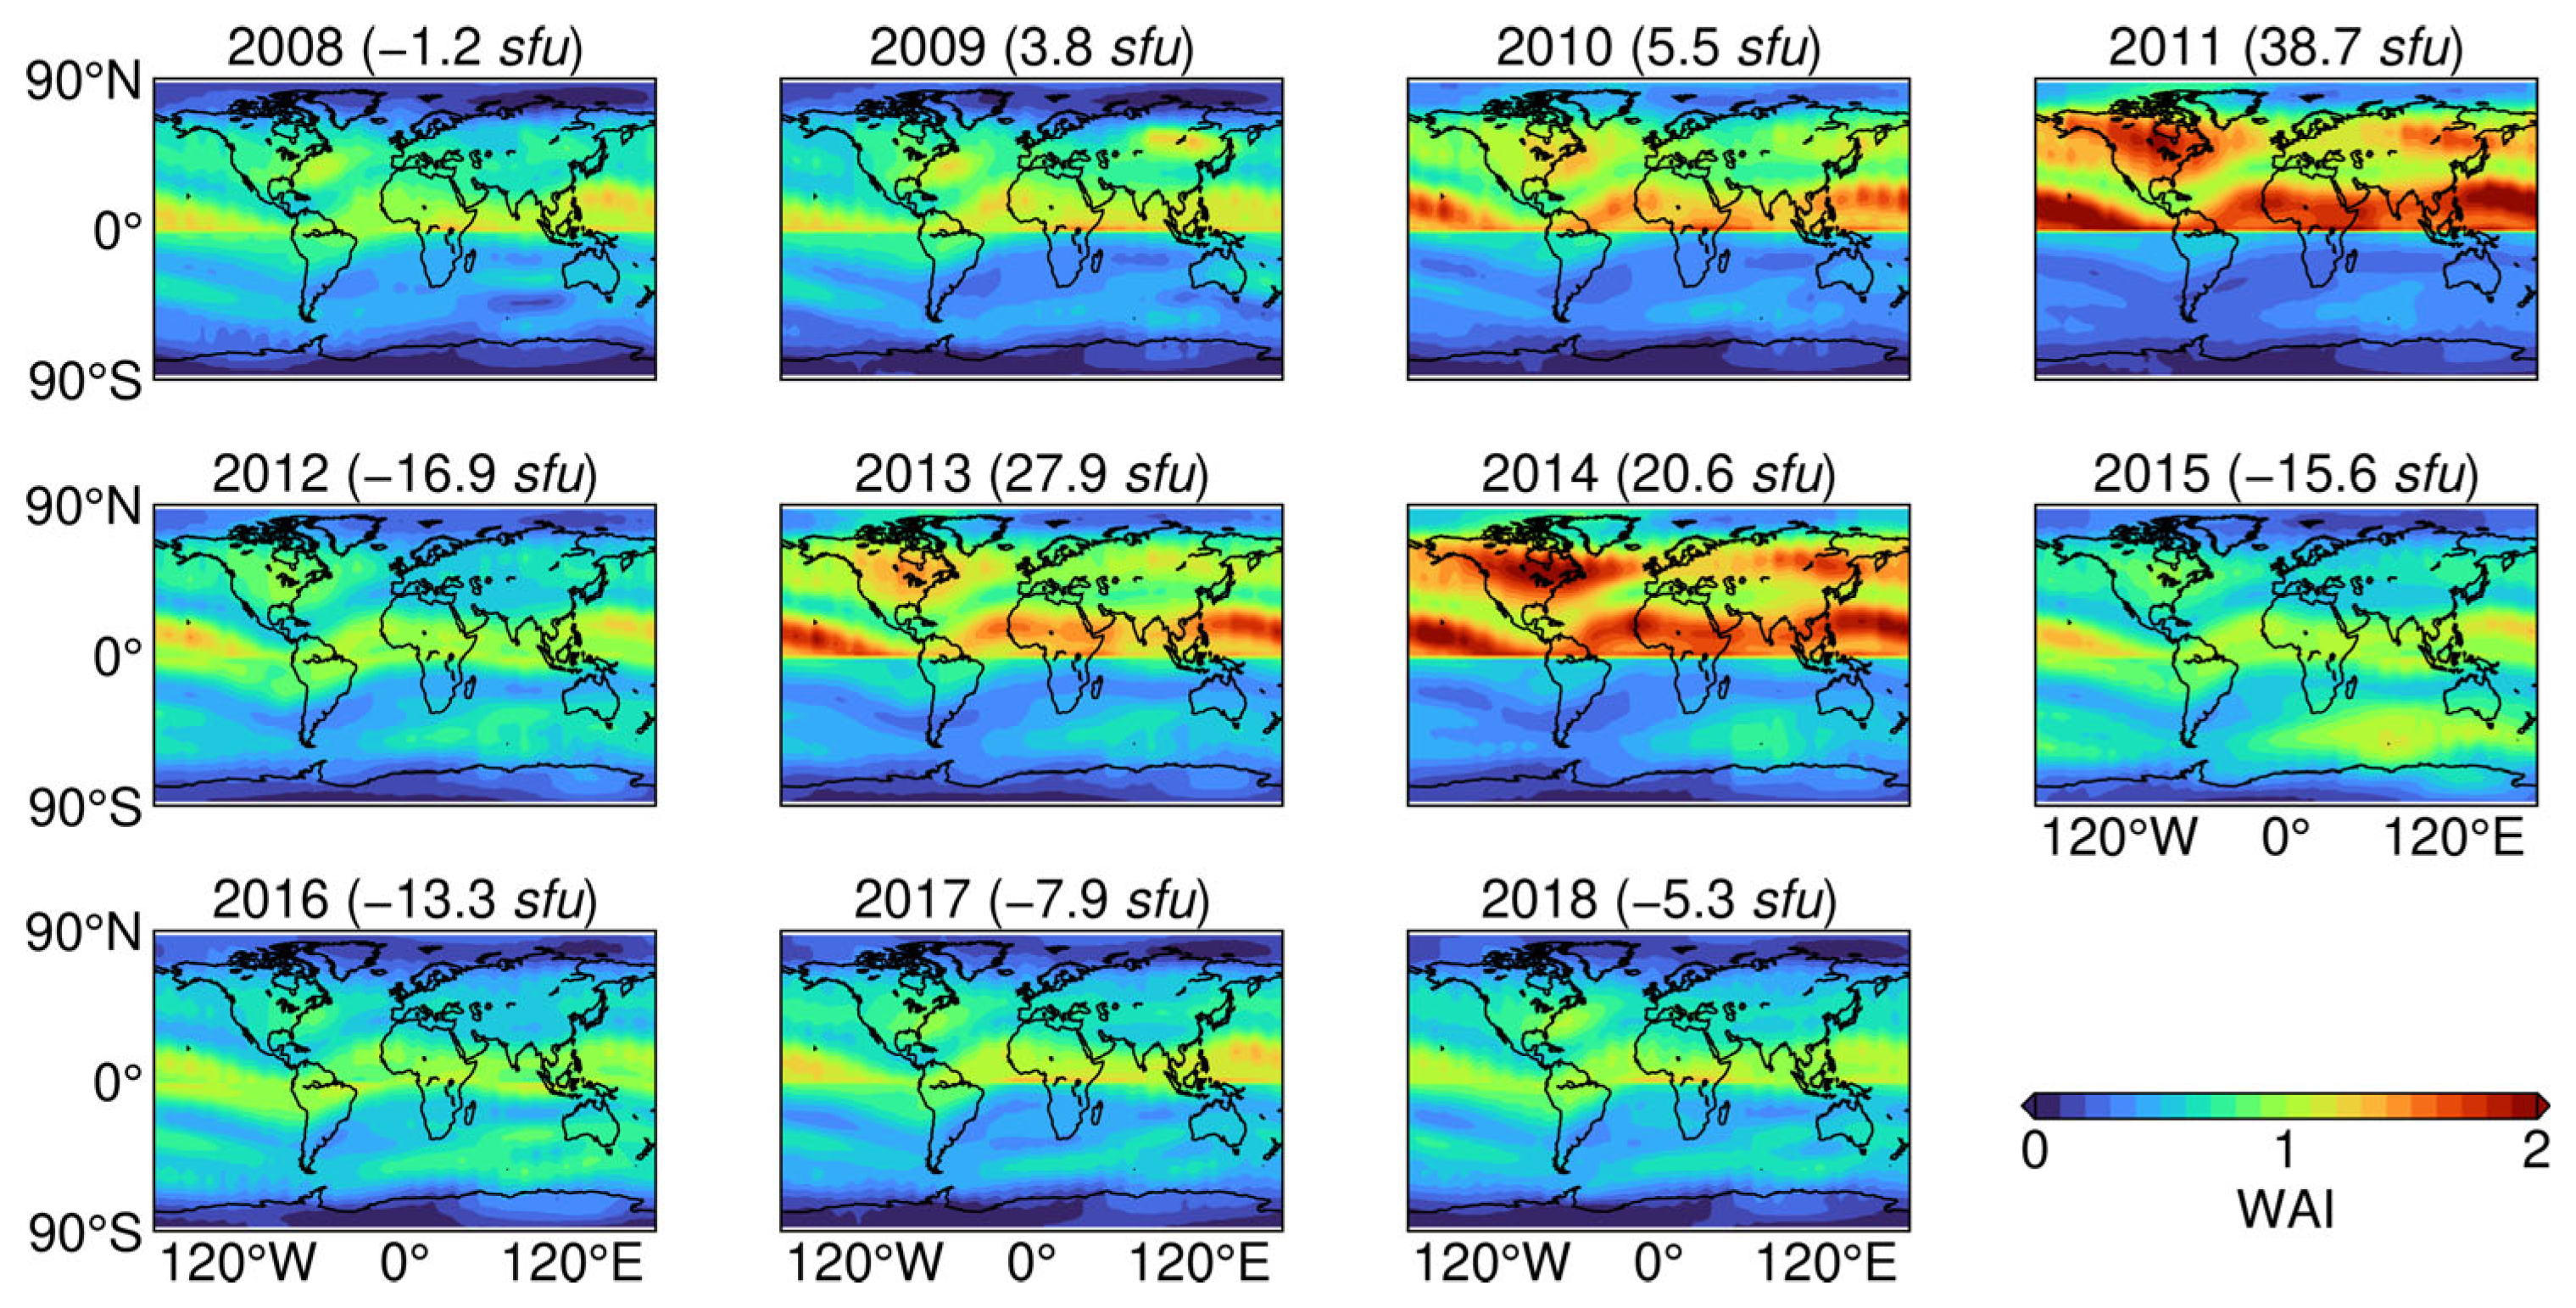
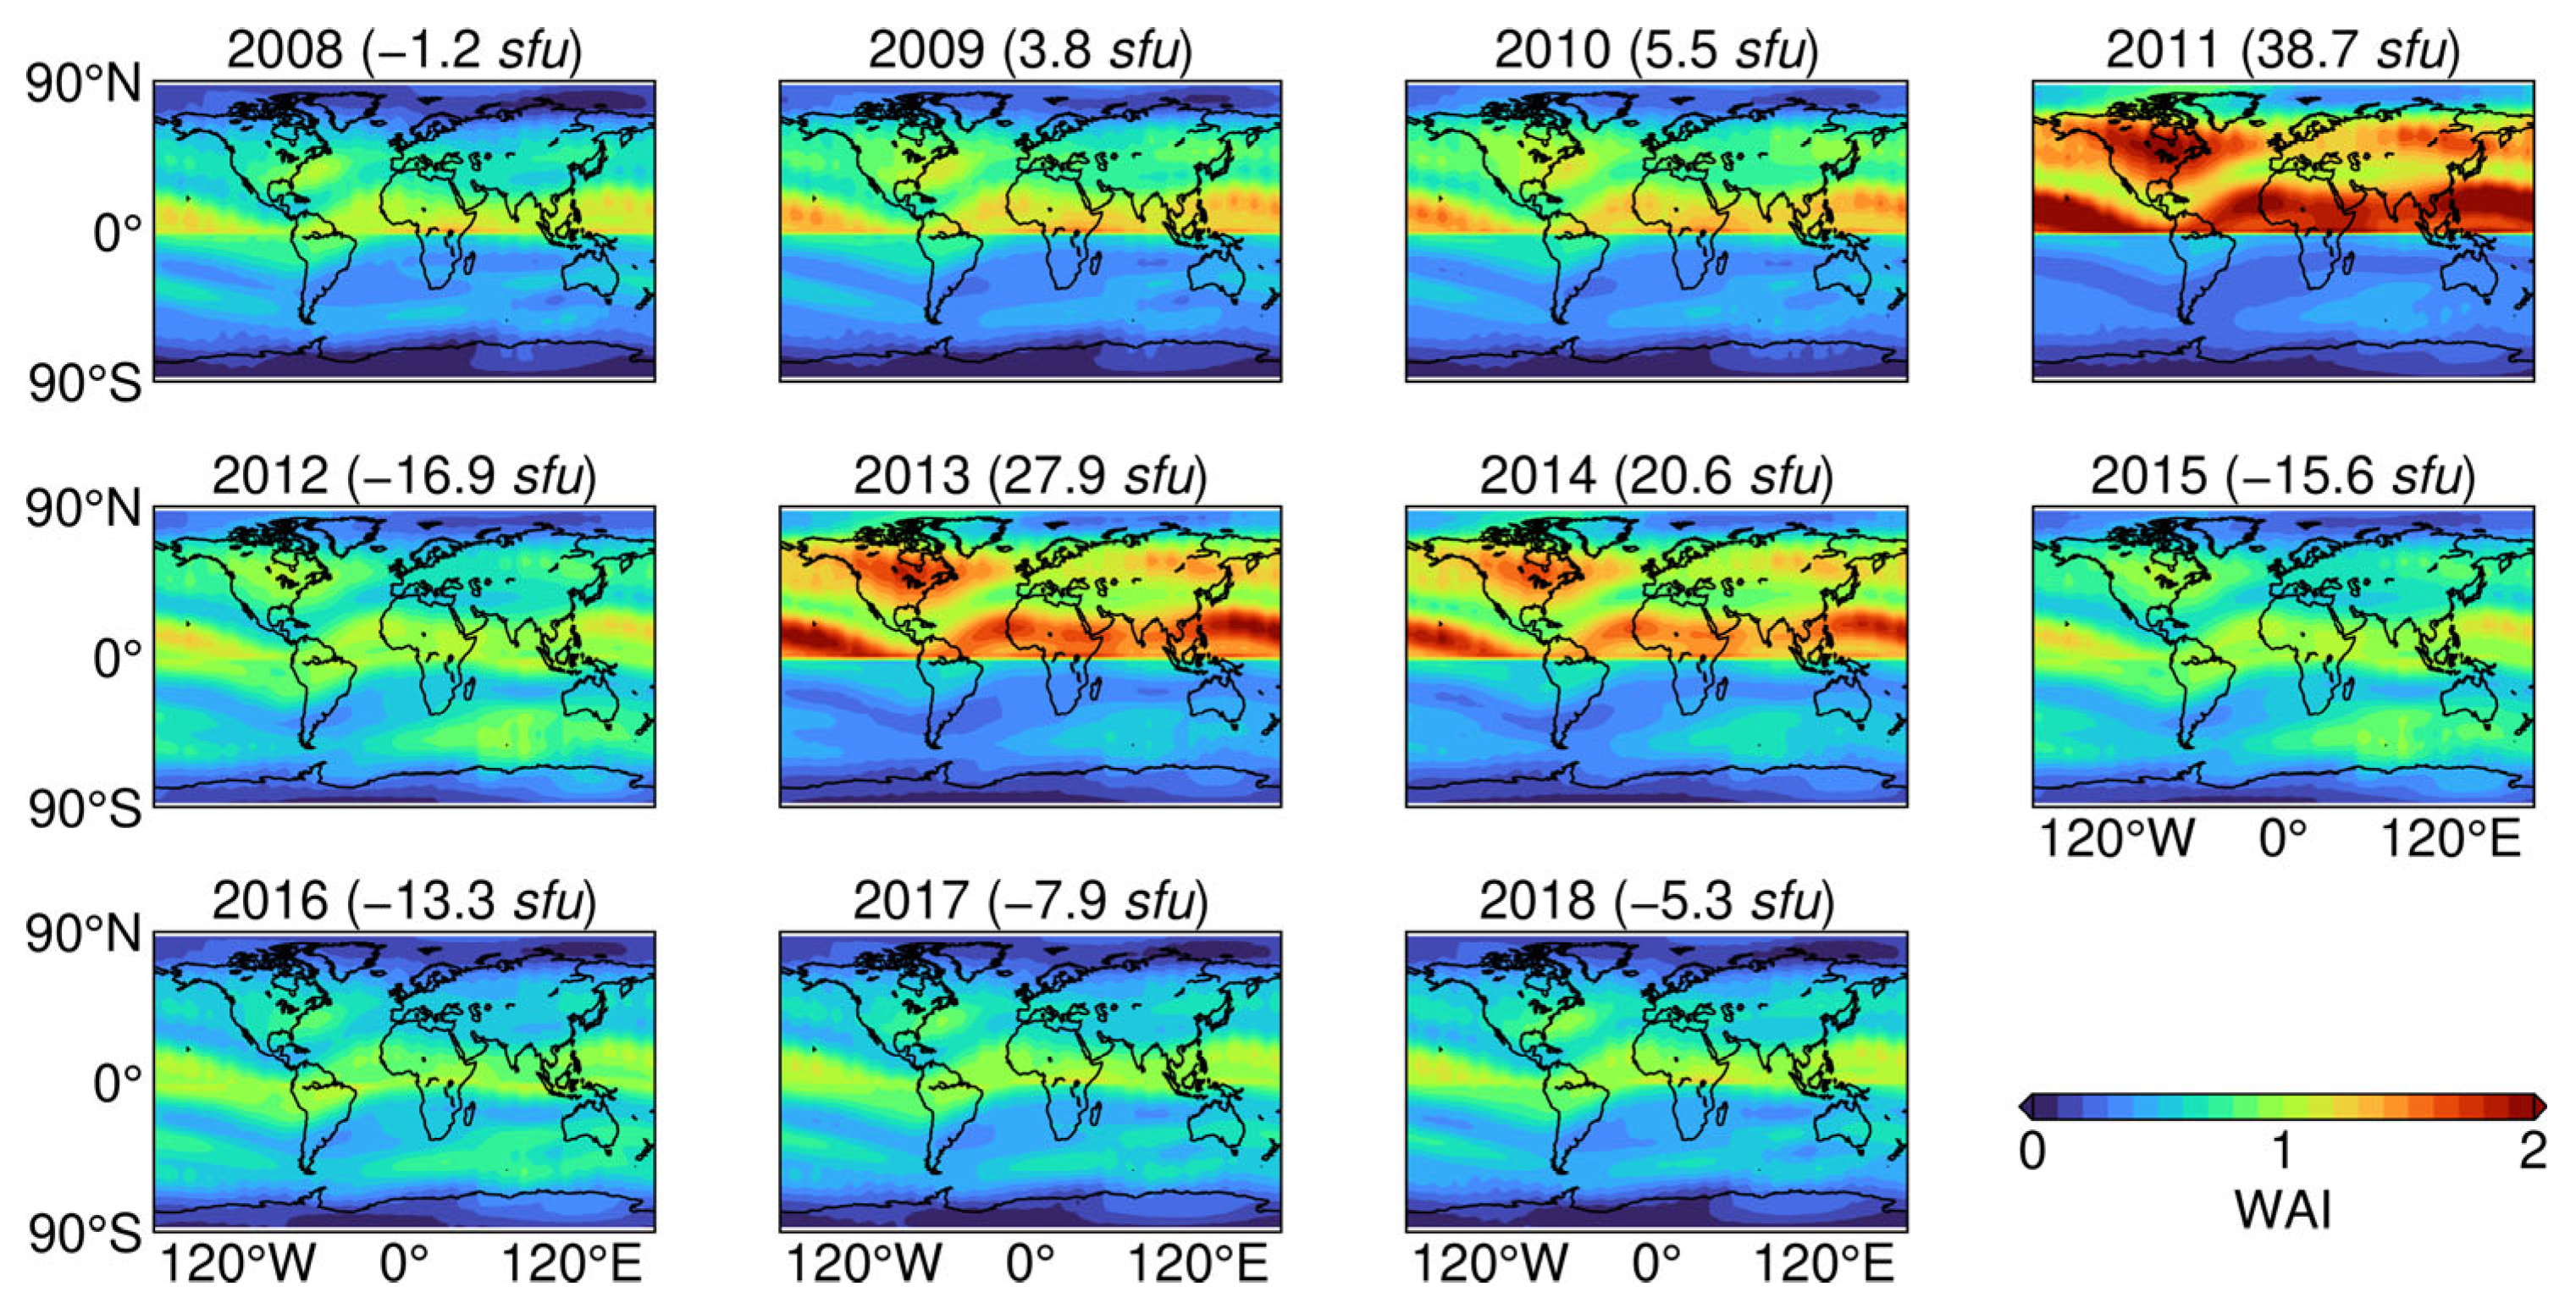
A spurious winter anomaly index can be obtained by dividing the mean winter and summer TEC values at each grid point. The method incorporates the difference in solar activity levels between winter and summer. For ease of description, this method is called the averaging method. Figure 6 depicts the global distribution of the winter anomaly index from 2008–2018 based on the averaging method, with the F10.7p difference between December and June in parentheses in the subplot. Figure 6 does not reflect a positive correlation between winter anomaly and solar activity due to differences in winter and summer solar activity levels. The winter anomaly index calculated by this method is overestimated when the level of solar activity in winter is higher than that in summer.
In Equations (4) and (5), assigning different F10.7p to TECSLT and TECWLT can calculate the winter anomaly index with differences in solar activity levels. Based on this property, we can use the regression approach to calculate the winter anomaly index that includes the difference between winter and summer solar activity levels. Thus, we can compare the maps of the winter anomaly index calculated based on averaging and regression methods. Table 1 provides the average values of F10.7p from 2008–2018 for June and December. This study calculated the corresponding winter anomaly index by substituting F10.7p for June into TECSLT and F10.7p for December into TECWLT. Figure 7 depicts the global distribution of the winter anomaly index from 2008–2018 based on the regression method. The similarity of the global distribution of the winter anomaly index in Figure 6 and Figure 7 validates the superiority of the regression approach.

3.2. Winter Anomaly

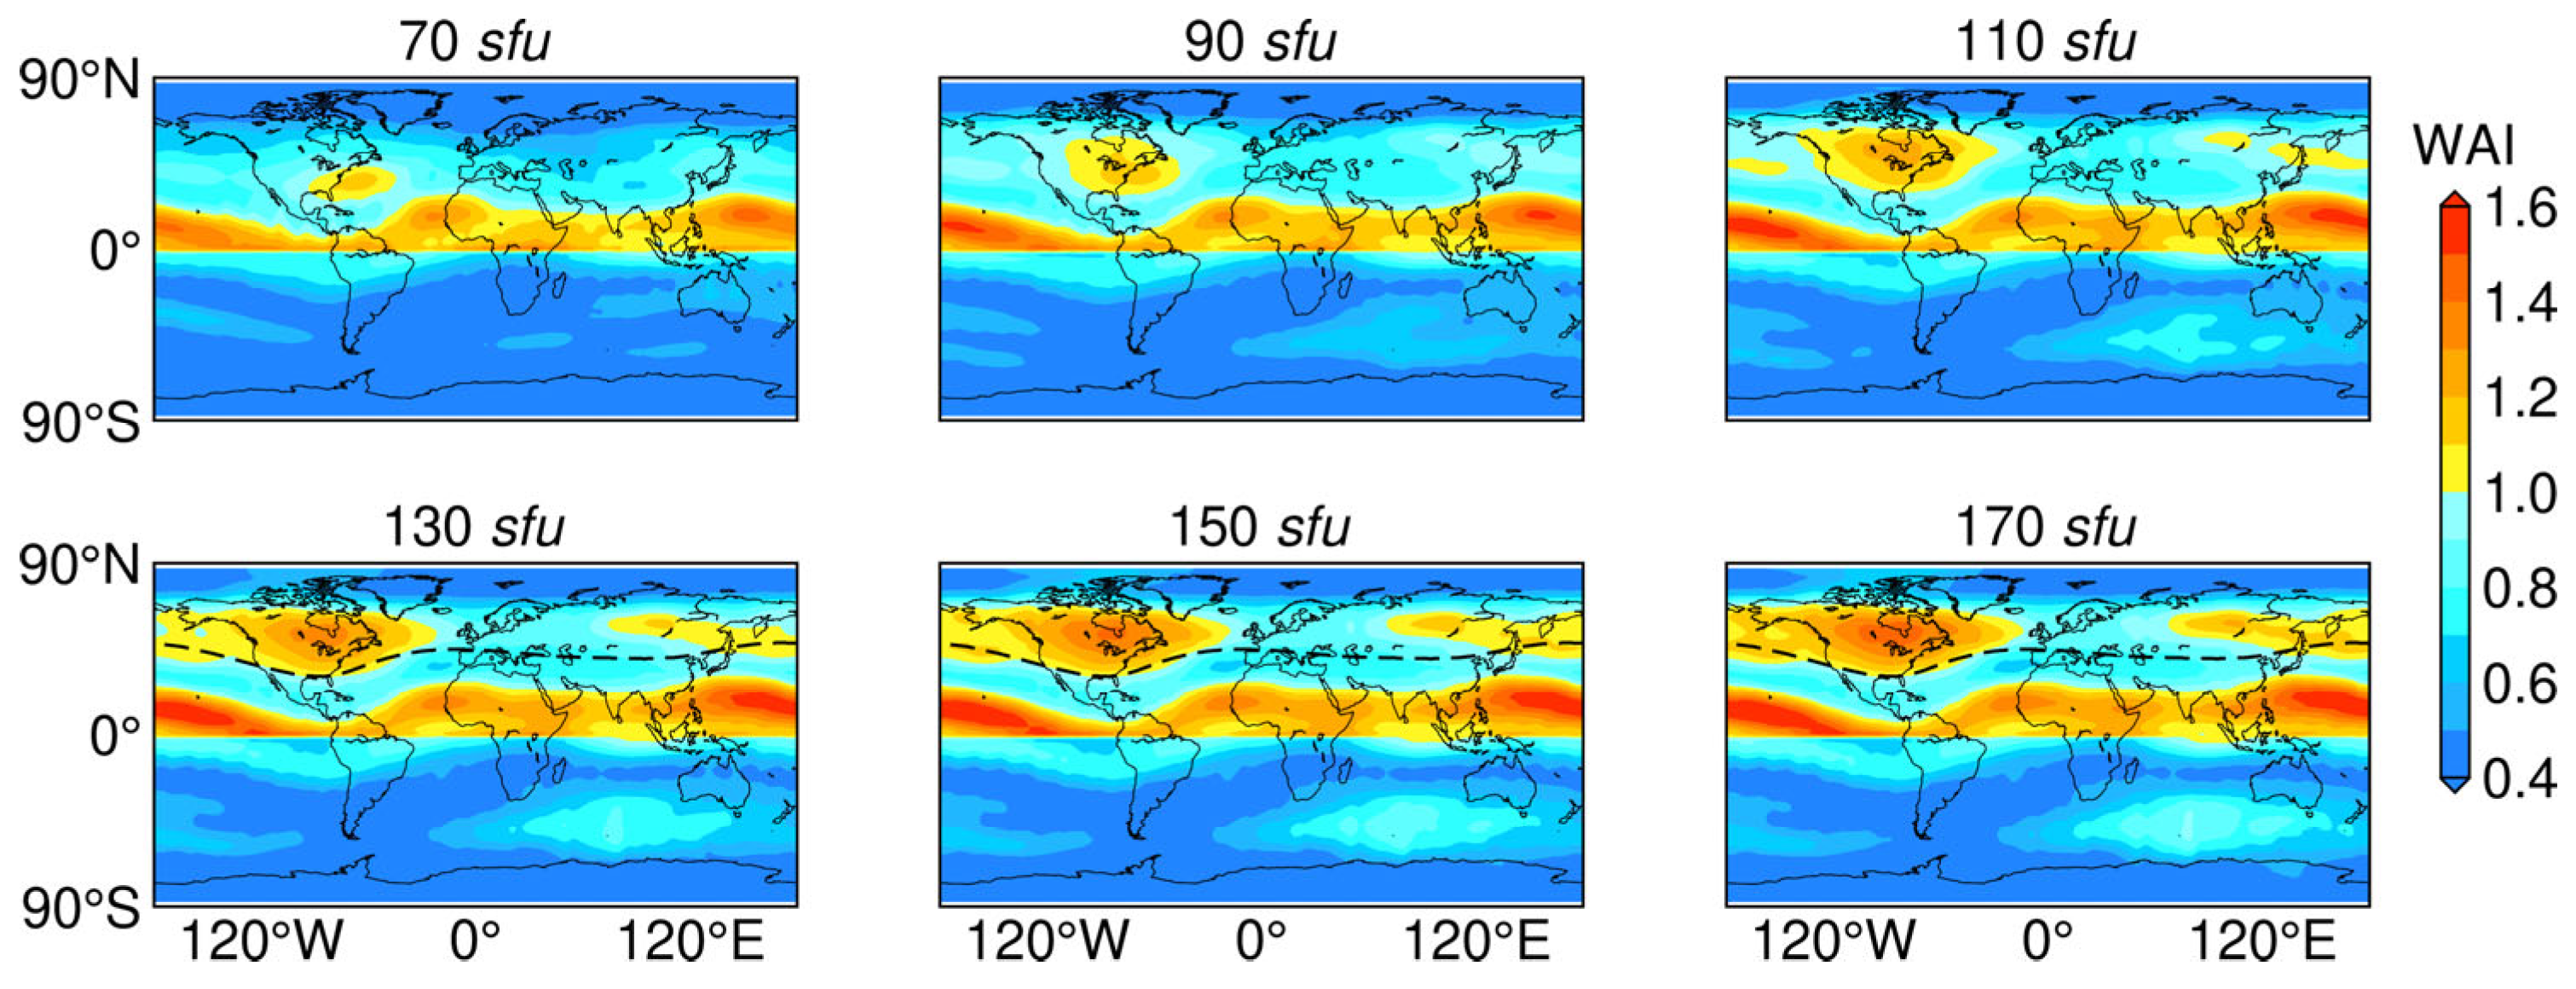
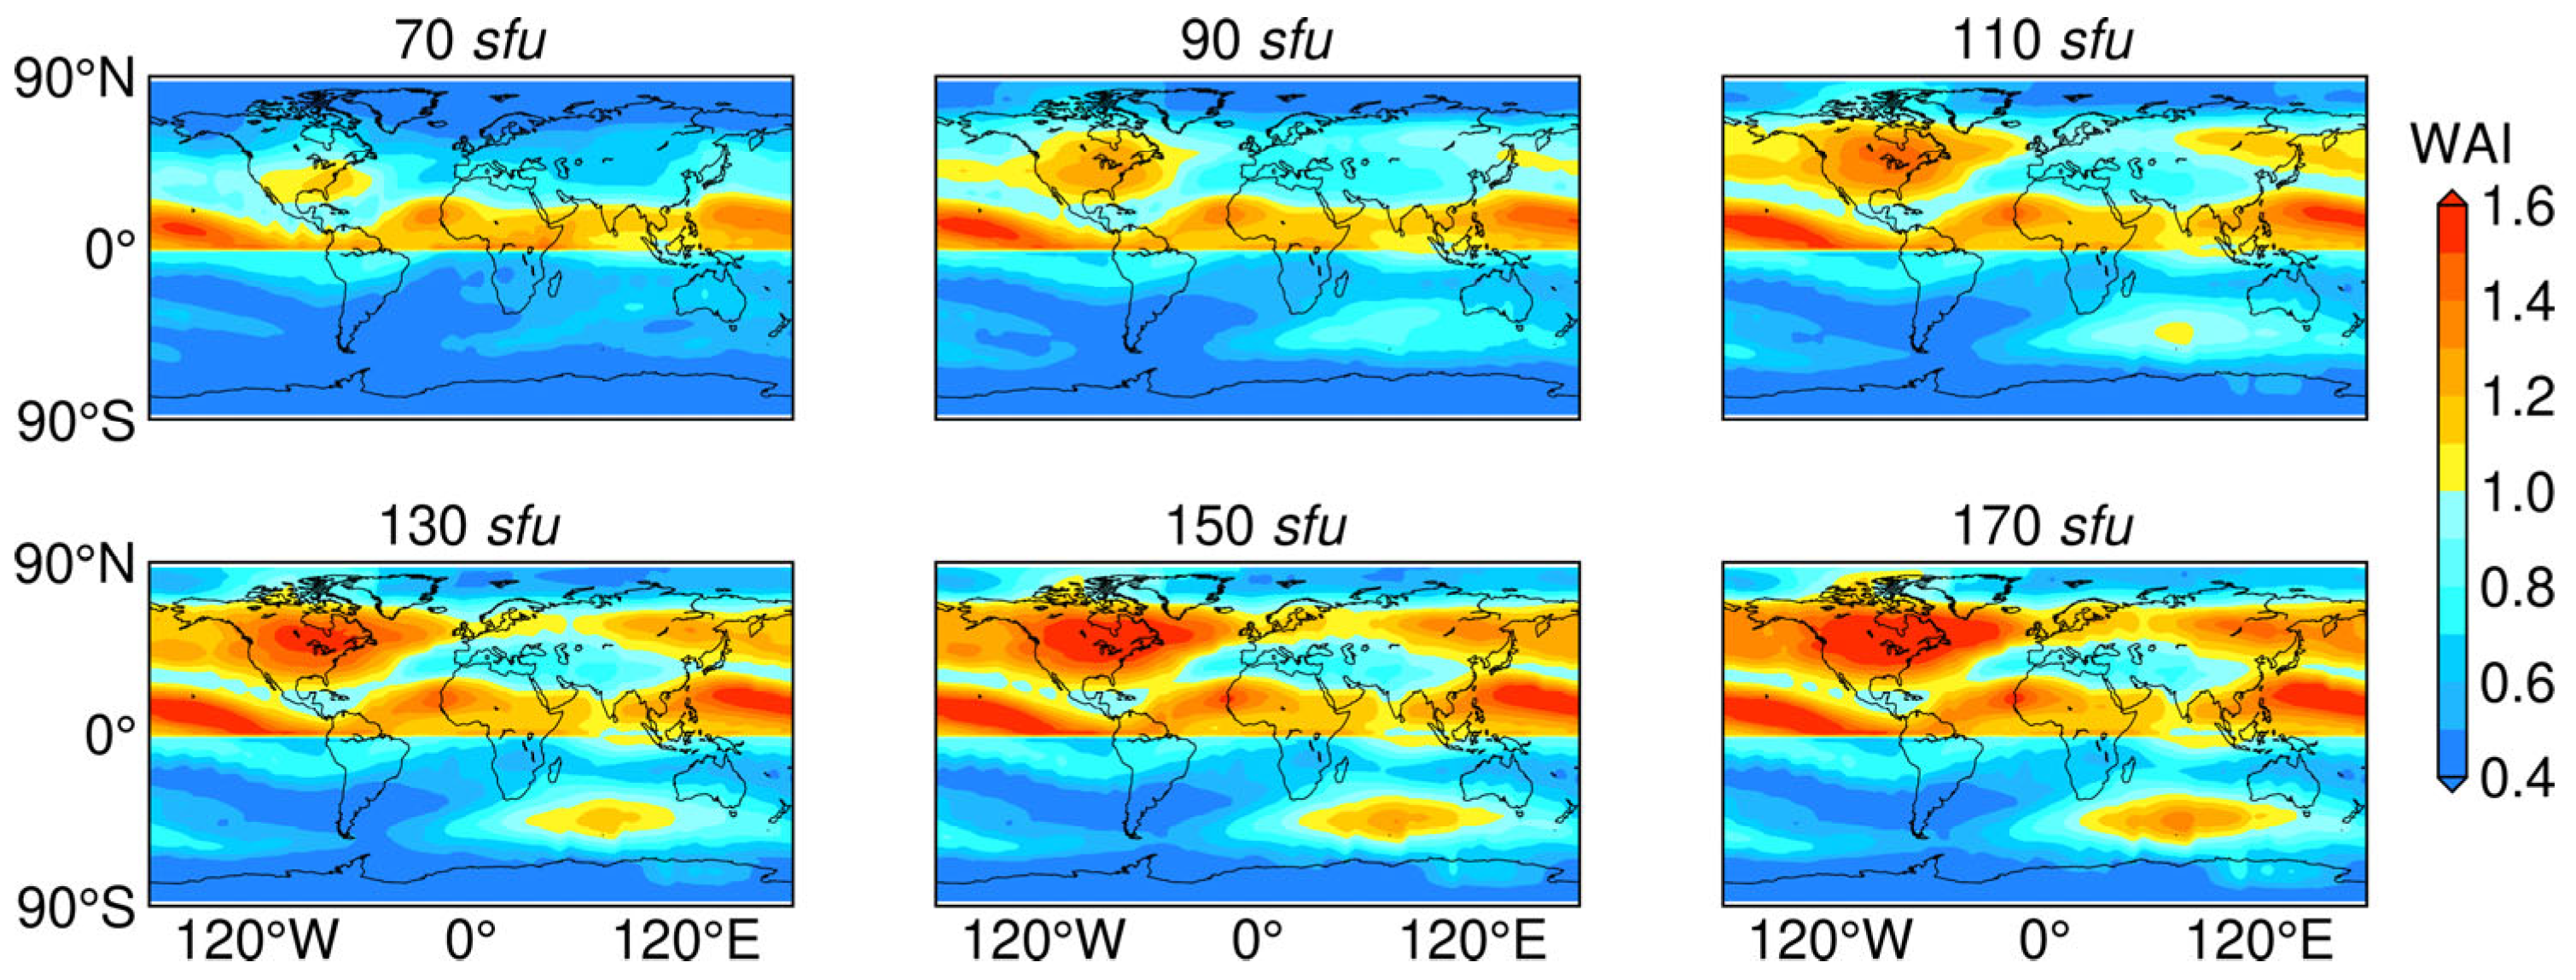
We depicted the global distribution of the winter anomaly index at different levels of solar activity (see Figure 8). When F10.7p < 90 sfu, the winter anomaly is weak and occurs only near the southeastern region of North America. When solar activity levels are enhanced, winter anomaly increases in scope and magnitude. When F10.7p > 110 sfu, the winter anomaly gradually extends to the Far East. The black dotted line in Figure 8 is the 60° geomagnetic inclination contour, which matches well with the winter anomaly region in North America, suggesting that the distribution of winter anomaly may be related to the geomagnetic inclination. The winter anomaly index is higher compared to its surroundings in the marine region in the southwest of Australia. However, the winter anomaly index of this region is less than one, which may be related to the fact that the regression equation was established in this study during the geomagnetic activity quiet period. To verify this, we also calculated the global distribution of the winter anomaly index by using the TEC data with Kp > 3 (see Figure 9). It can be seen that the winter anomaly in Australia is captured during periods of stronger geomagnetic activity. Therefore, winter anomaly does not necessarily occur in the Southern Hemisphere.
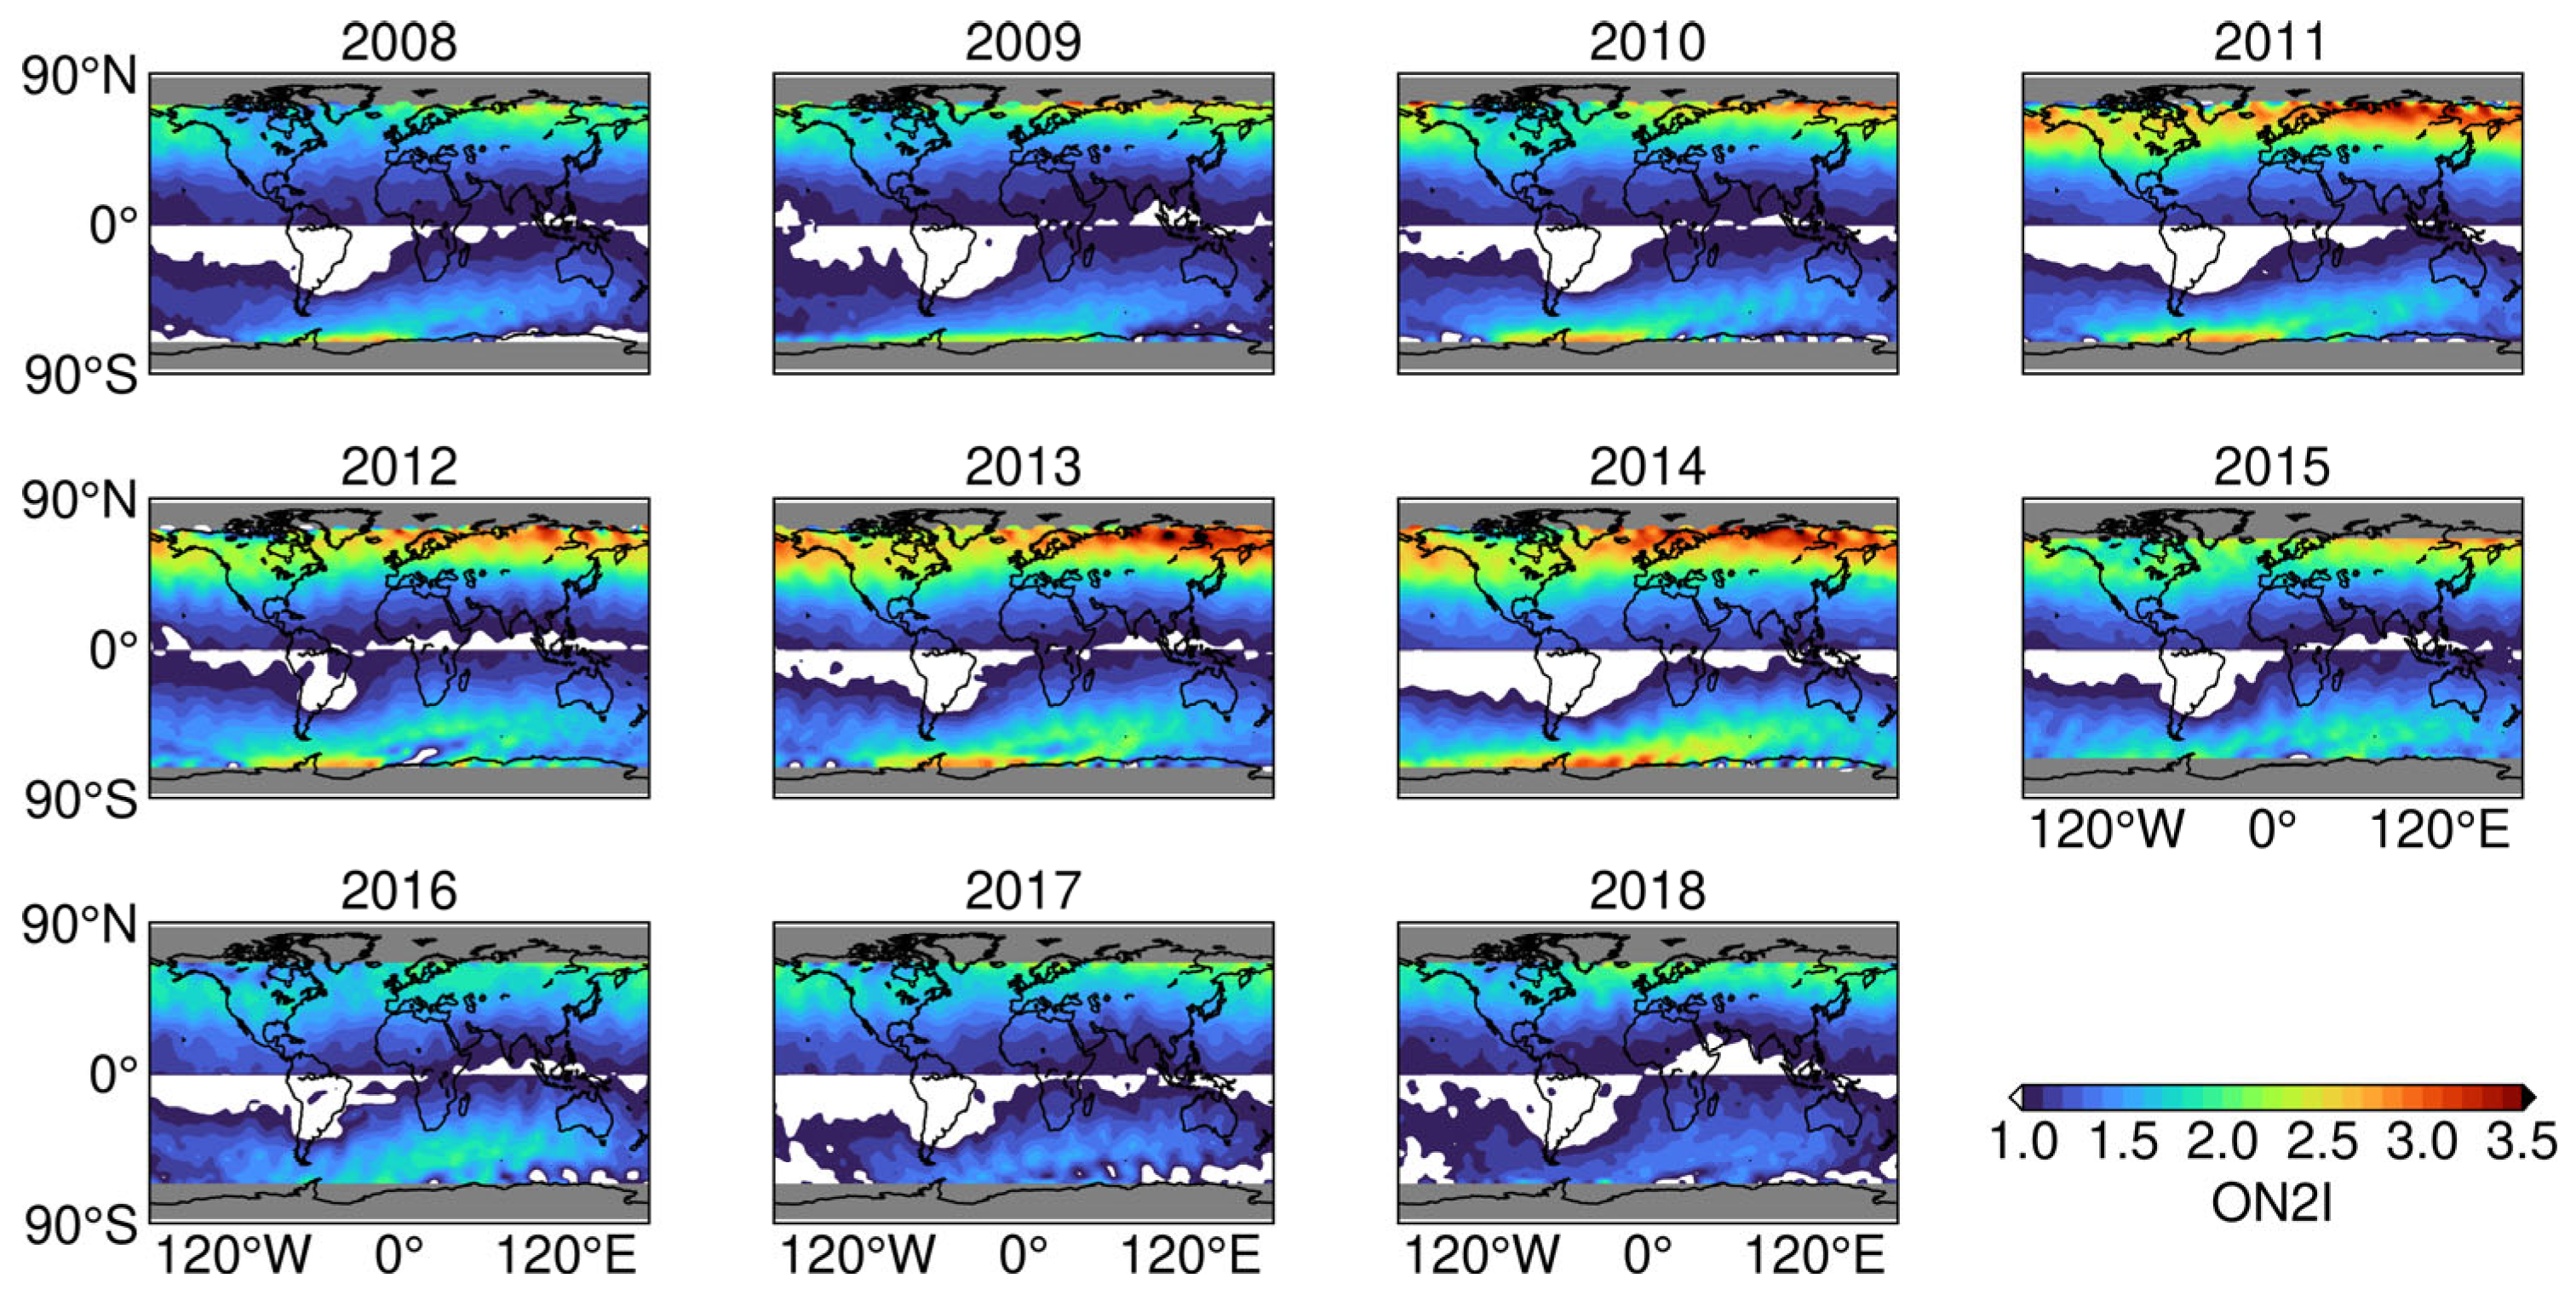
Figure 10 depicts the interannual variations in the global distribution of winter and summer ratio of O/N2 (ON2I). In this figure, the part of ON2I less than 0 is not shown. ON2I is the largest in the Far East, while the winter anomaly is strongest in North America. Yasyukevich et al. [9] concluded that it may be related to longitudinal variations of the vertical plasma transport induced by the thermosphere wind in local winter. In general, seasonal variations in O/N2 not only explain winter anomaly near North America and Australia but also the positive correlation between winter anomaly and solar activity.
In this study, the global distribution of FTVs was calculated (see Figure 11). FTVs are the smallest in the southeastern region of North America, which means that this region is the most prone to winter anomaly, and it corresponds to the 70–90 sfu situation in Figure 8. The FTVs are relatively larger in the western regions of North America and the Far East, which means that the winter anomaly in these regions occurs at higher levels of solar activity, corresponding to the 130–170 sfu situation in Figure 8. The map can provide a reference for single-point ionospheric modeling and illustrate the solar activity level at which winter anomaly is considered for each grid point.

3.3. Annual Anomaly

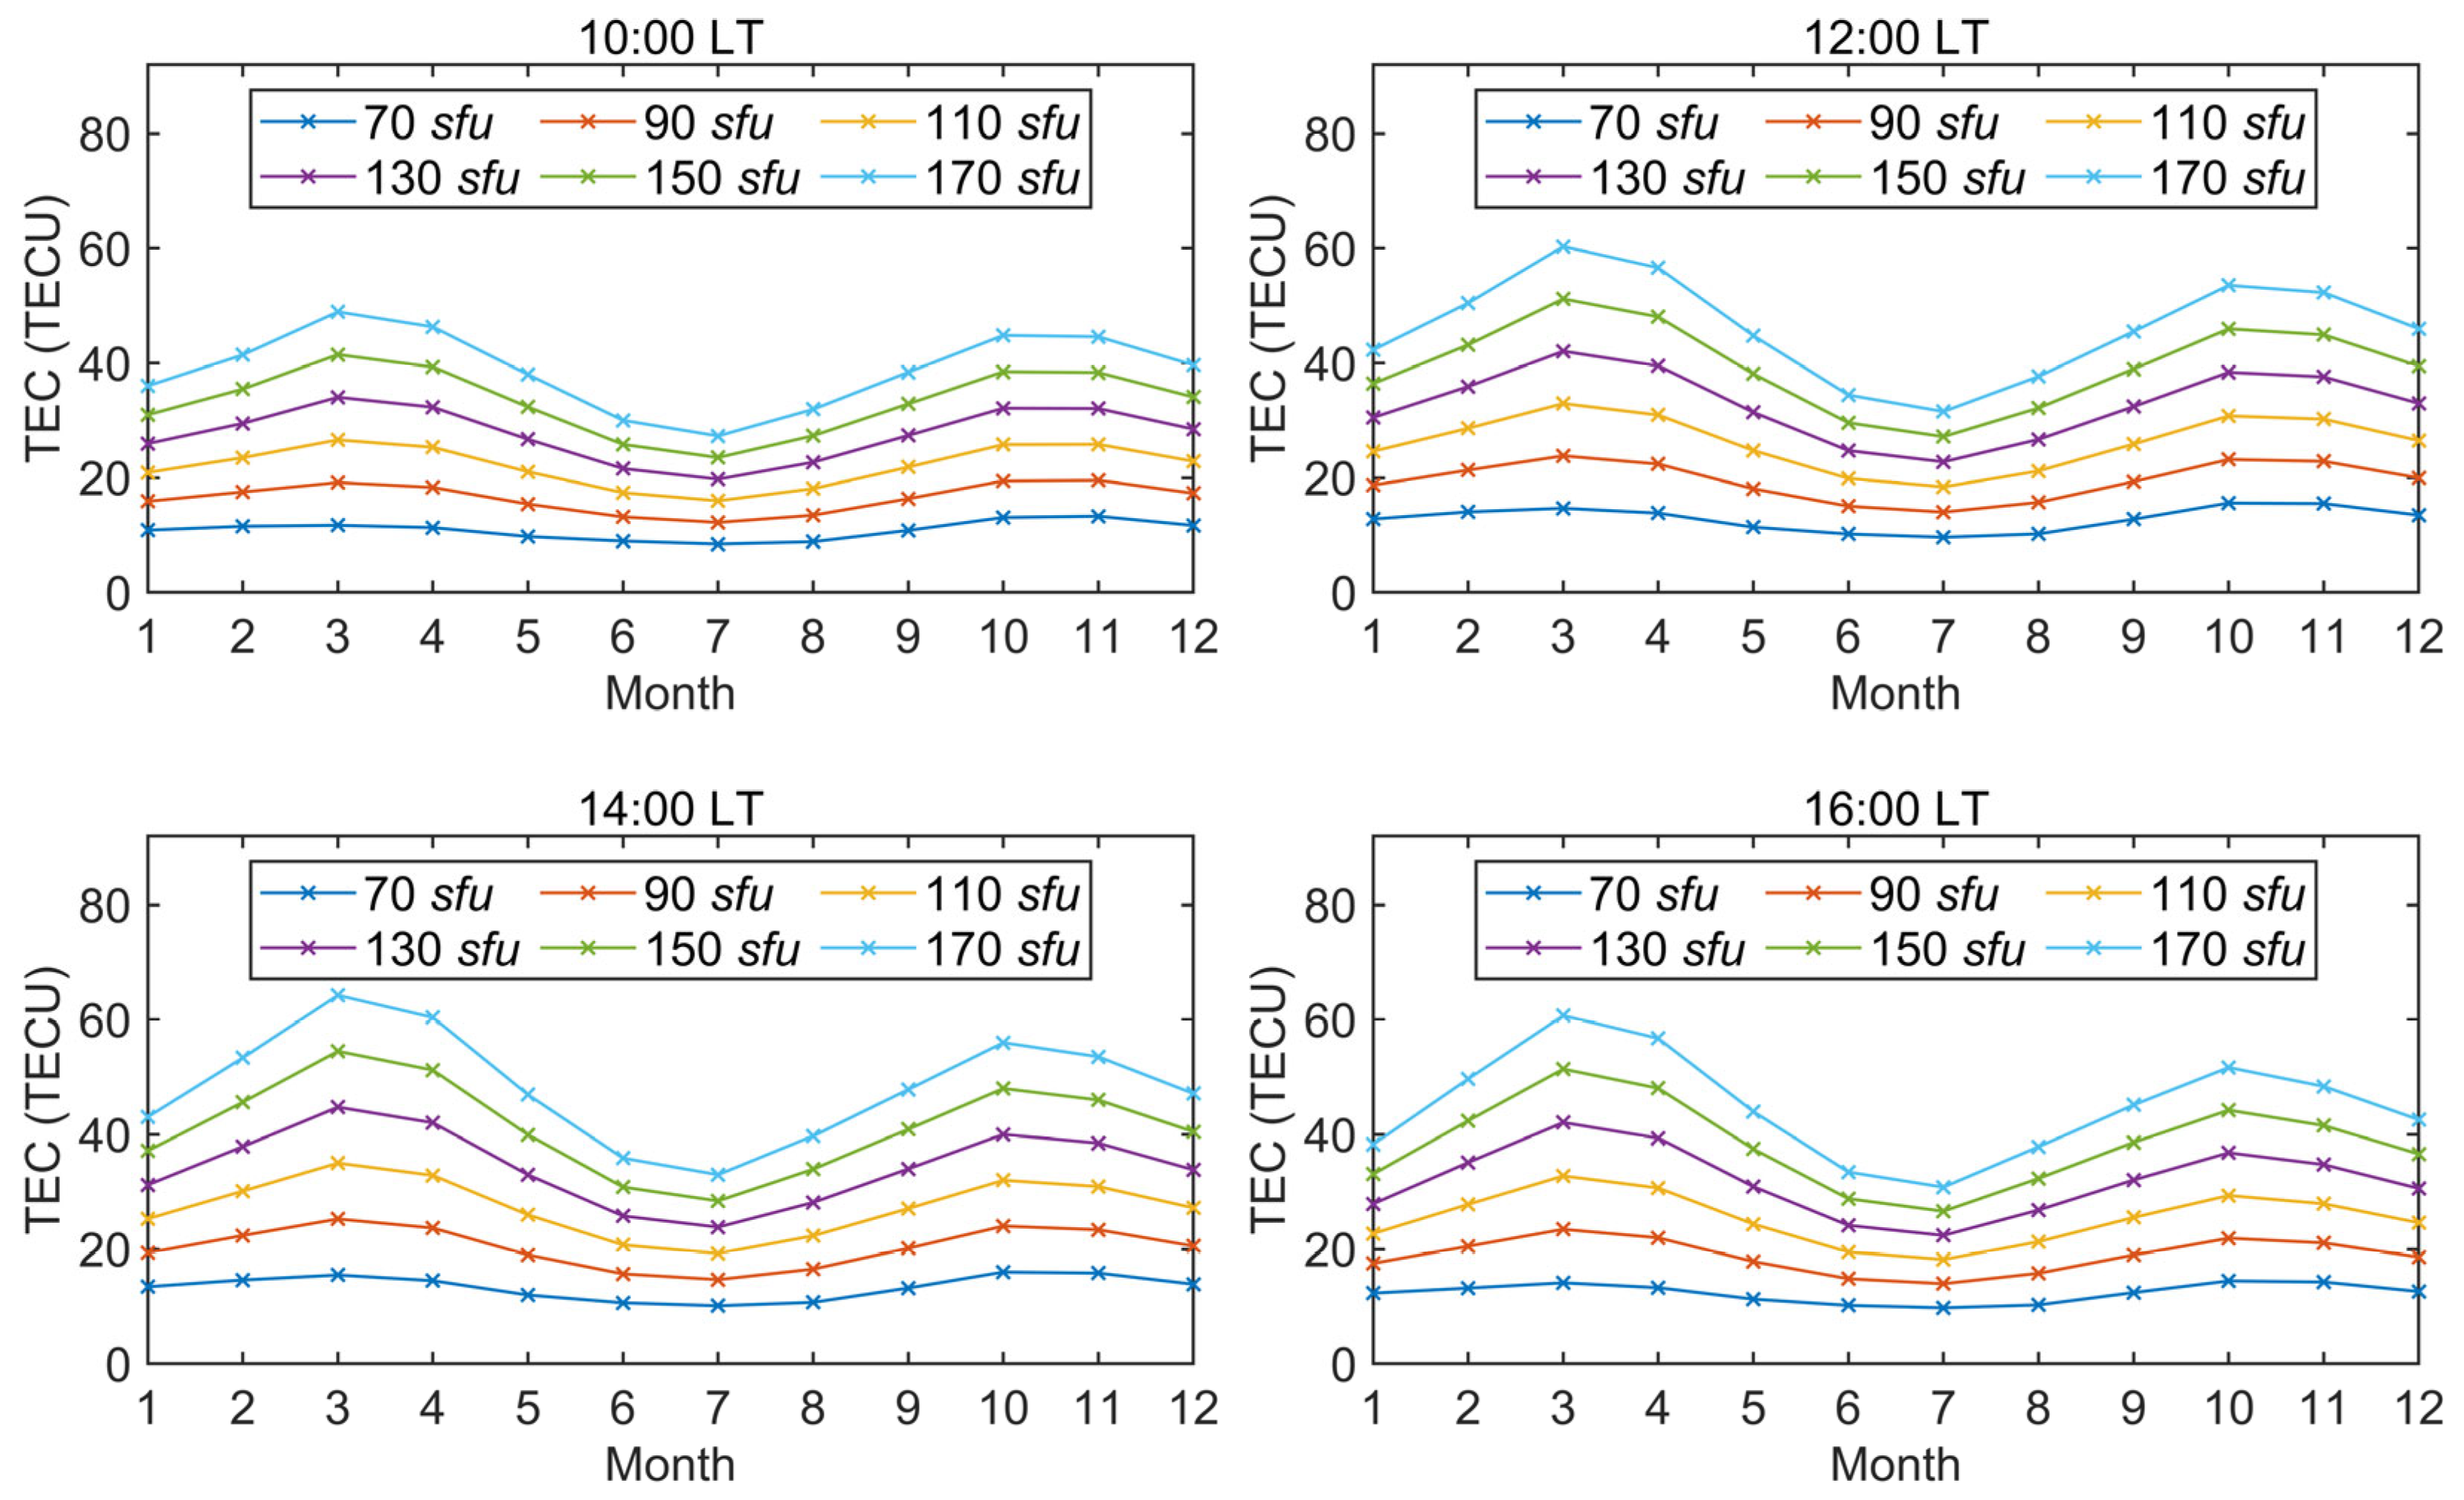
Monthly differences in solar activity levels introduce a bias in the analysis of monthly variations in TEC. In this study, the monthly TEC was calculated under different solar activity levels and local time by using regression equations. This methods can ensure that each month corresponds to the same level of solar activity (see Figure 12). With the enhanced level of solar activity, the TEC values of each month increased, and the contrast in TEC between months became more pronounced. The TEC value in December is greater than in June, reflecting the annual anomaly. The TEC values in March and October are greater than the other months, reflecting the semiannual anomaly.
Based on the results in Figure 2 and Figure 3, we selected the main grid points in the Southern Hemisphere (2.5°S–65°S) and the Northern Hemisphere (2.5°N–65°N) to accurately calculate the annual anomaly index as well as the contribution of the winter hemisphere and winter anomaly to the annual anomaly. We calculated the difference between the global TEC averages for December and June as well as the annual anomaly index. We then provided its variation with local time and solar activity (see Figure 13). In Figure 13a, 12:00 LT and 14:00 LT corresponds to the maximum value of the difference, followed by 10:00 LT, and 16:00 LT is the minimum. In Figure 13b, 12:00 LT corresponds to the maximum value of the annual anomaly index, followed by 10:00 LT and 14:00 LT, and 16:00 LT is the minimum. The annual anomaly index increases with increasing levels of solar activity, with greater growth at low levels of solar activity and smaller growth at high levels of solar activity. The annual anomaly index can be up to 0.344 at 12:00 LT (at this time, F10.7p = 170 sfu), which indicates that the TEC in December was approximately 34.4% larger than the TEC in June.

3.4. Contribution of the Winter Anomaly to Annual Anomaly

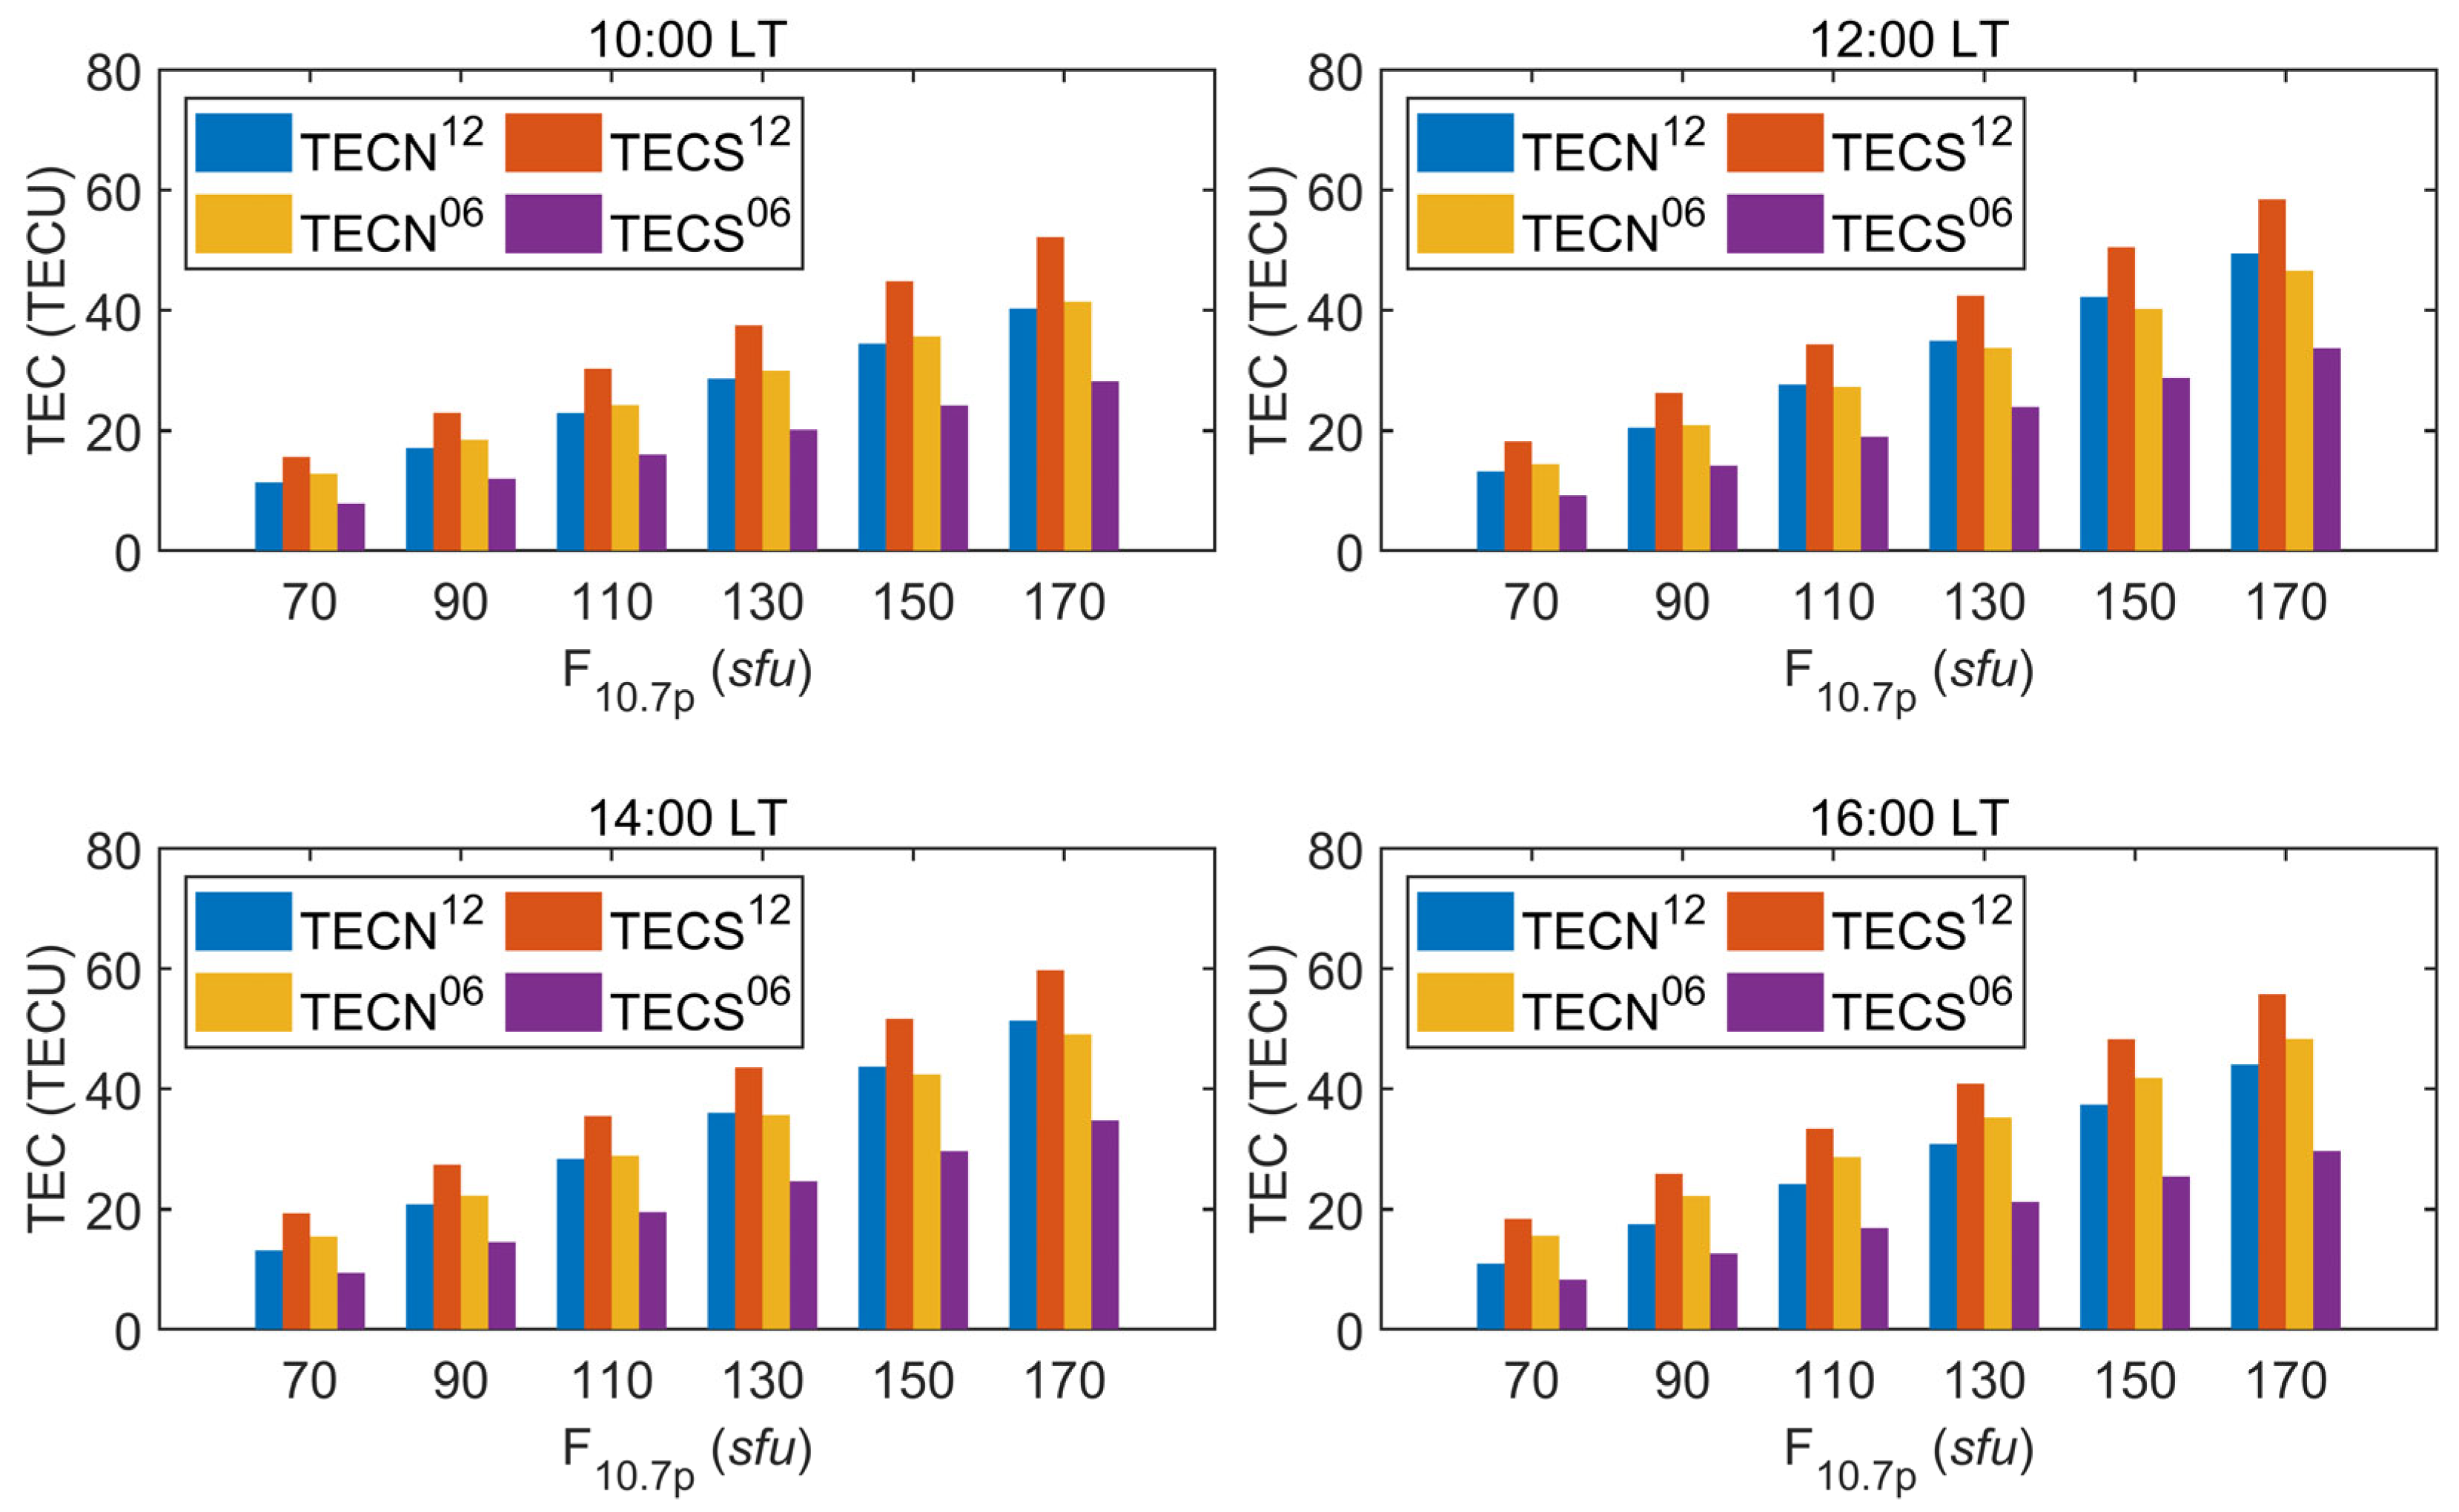
We calculated the mean TEC of the southern and northern hemispheres in June and December. We then provided its variation with local time and solar activity (see Figure 14). The TEC in the summer hemisphere (TECN06 + TECS12) is consistently larger than the TEC in the winter hemisphere (TECN12 + TECS06), which is caused by the smaller solar zenith angle in the summer hemisphere according to the Chapman model. At 12:00 LT and 14:00 LT, the TEC in the Northern Hemisphere winter (TECN12) is larger than that in the Northern Hemisphere summer (TECN06) when F10.7p > 130 sfu, which is related to the winter anomaly enhanced with the levels of solar activity. The TEC in the Northern Hemisphere winter (TECN12) is larger than the TEC in the Southern Hemisphere winter (TECS06) due to a stronger winter anomaly in the Northern Hemisphere, and their difference is a partial source of the annual anomaly. The TEC in the Southern Hemisphere summer (TECS12) is consistently larger than the TEC in the Northern Hemisphere summer (TECN06), which may be related to variations in the Sun–Earth distance, and their difference is another source of annual anomaly.
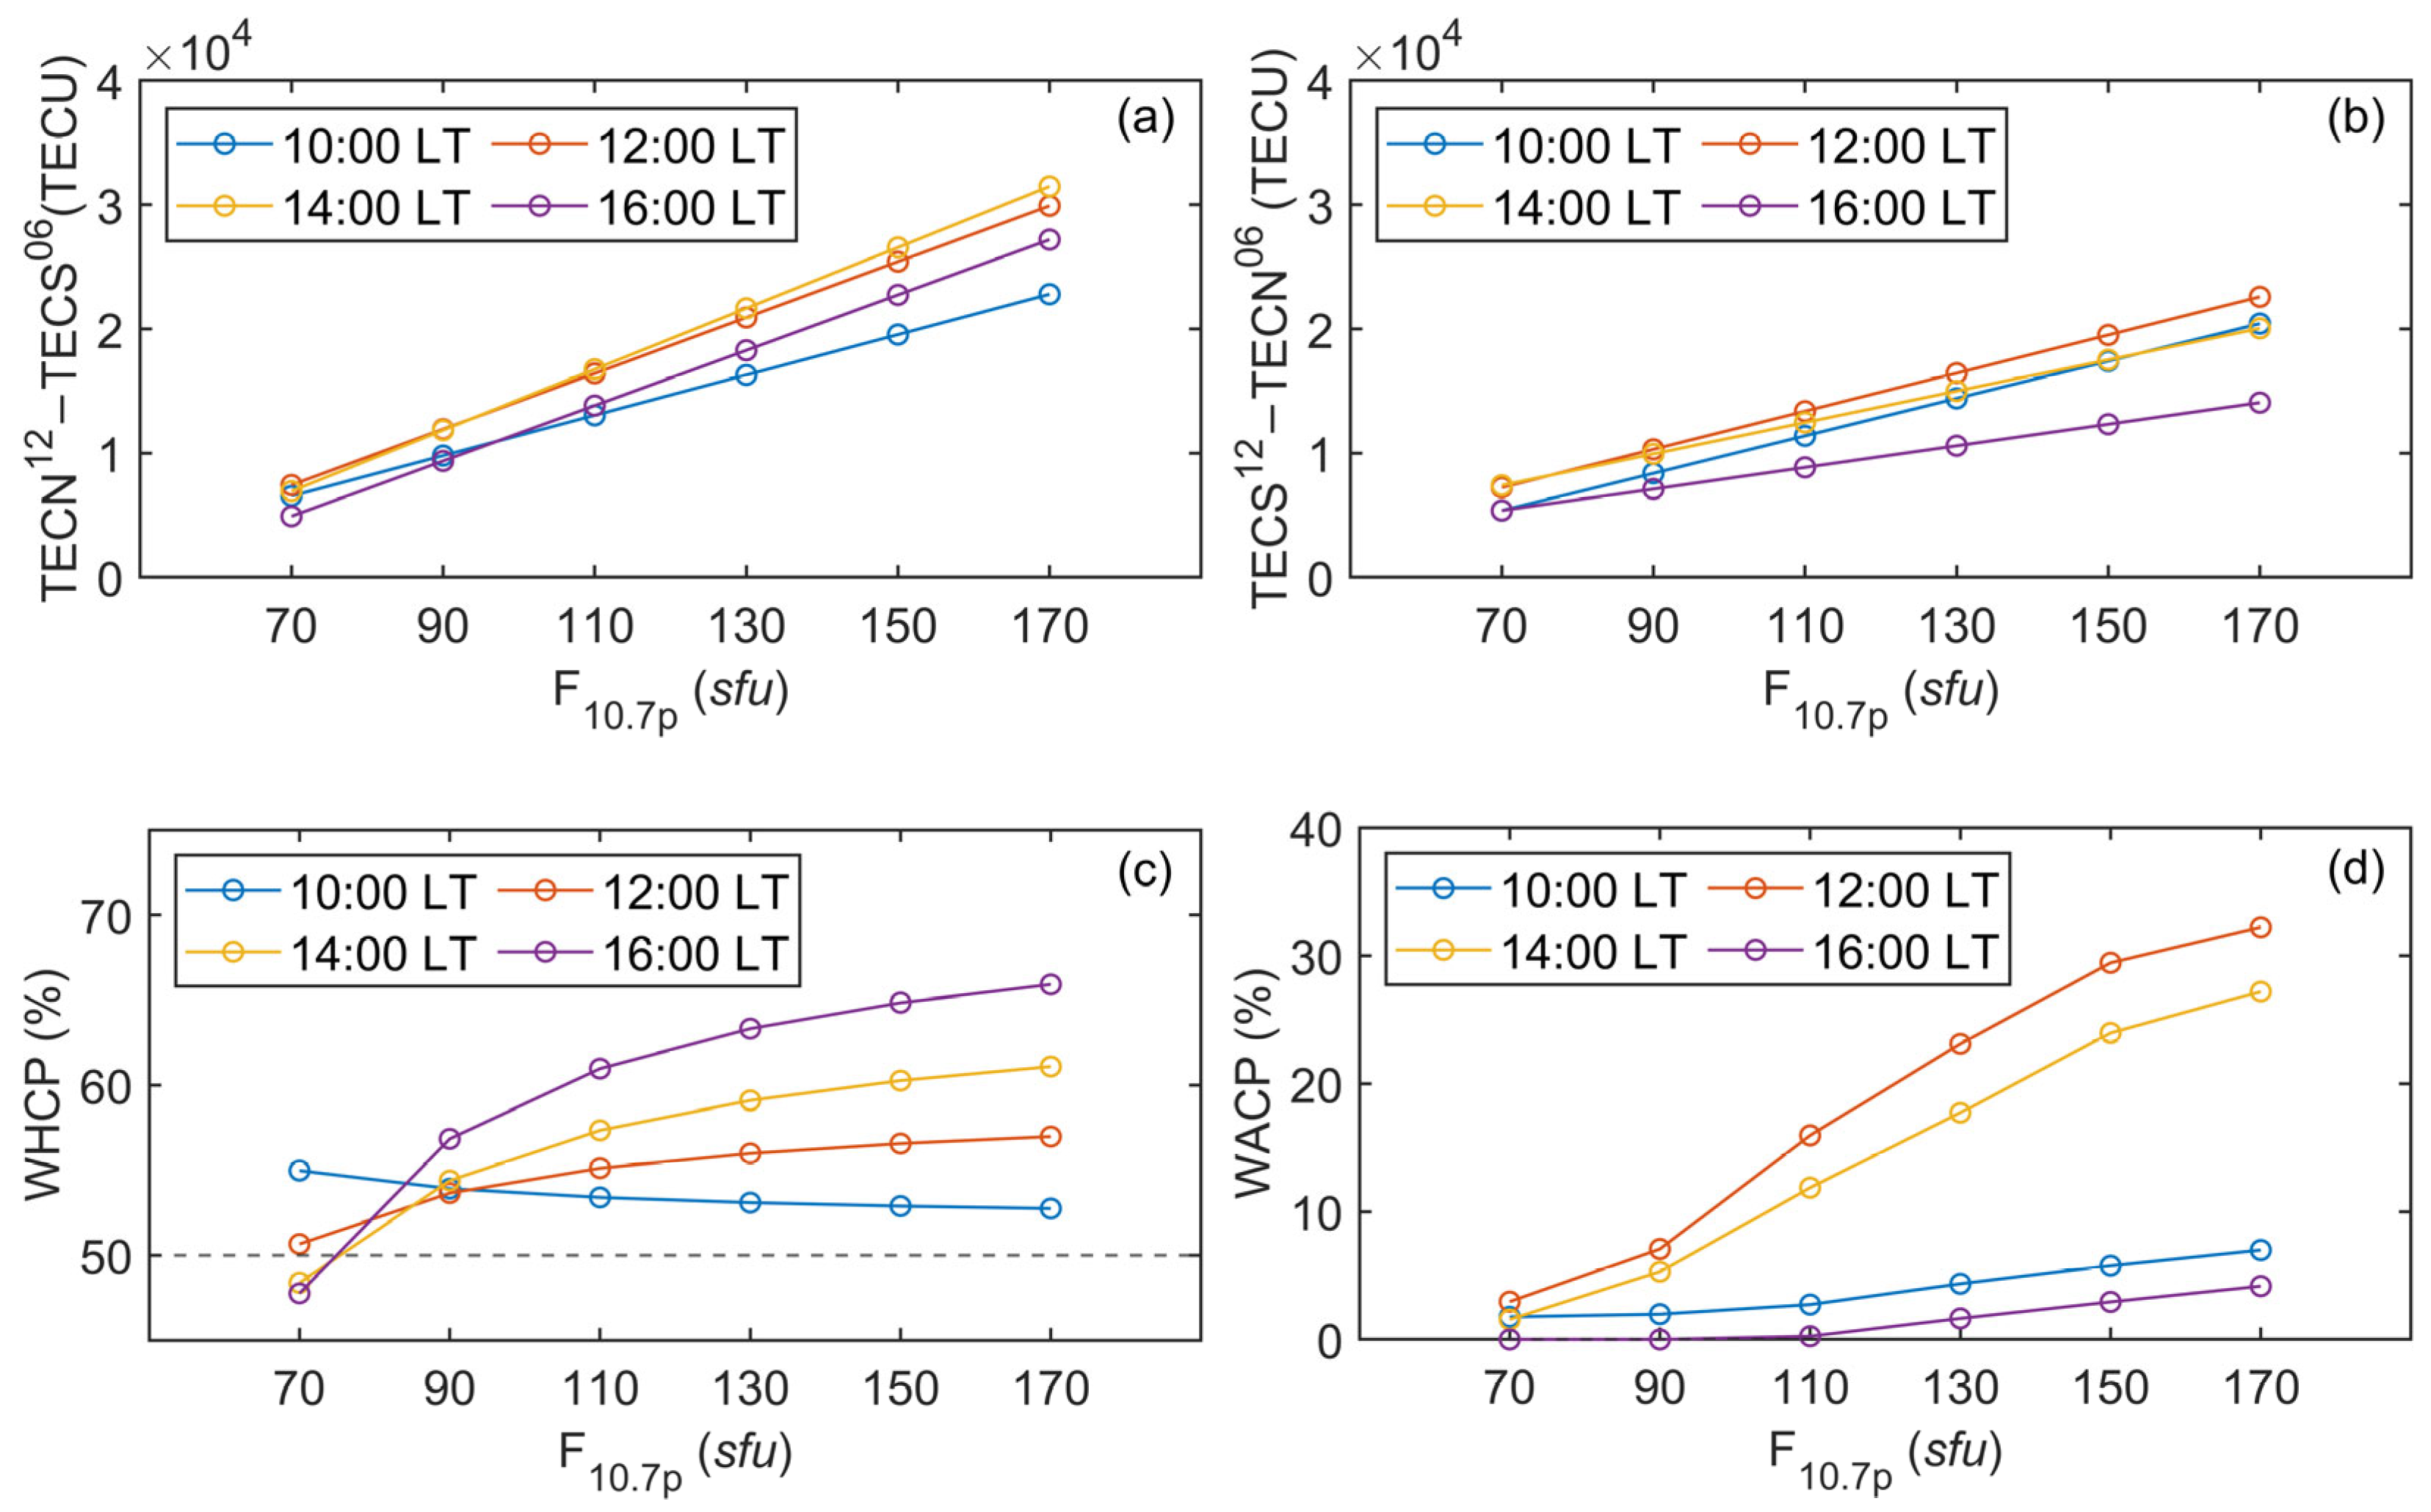
Figure 15c depicts the percentage contribution of the winter hemisphere to the annual anomaly with local time and solar activity. The winter hemisphere contributes more than 50% to the annual anomaly when the solar activity level exceeds 90 sfu. The percentage contribution of the winter hemisphere to the annual anomaly can be up to 65% when the solar activity level exceeds 130 sfu. At moderate-to-high solar activity levels, the percentage contribution of the winter hemisphere to the annual anomaly is largest at 16:00 LT, followed by 14:00 LT and 12:00 LT, and smallest at 10:00 LT. We summed the TEC at the selected grid points in each hemisphere in June and December, then calculated the contribution to the annual anomaly for the winter hemisphere and the summer hemisphere, respectively. Figure 15a depicts the total contribution of the winter hemisphere to the annual anomaly with local time and solar activity. At 10:00 LT, the growth of the total contribution of the winter hemisphere is the smallest, leading to a decreased WHCP. Figure 15b depicts the total contribution of the summer hemisphere to the annual anomaly with local time and solar activity. At 16:00 LT, the growth of the total contribution of the winter hemisphere is the largest, leading to an increased WACP. Figure 15d depicts the proportion of the winter anomaly contributing to the annual anomaly with local time and solar activity. There is a significant growth in this proportion at 12:00 LT and 14:00 LT, which is related to the solar activity dependence of winter anomaly. At 12:00 LT, winter anomaly can contribute up to 32% to the annual anomaly (at this time, F10.7p = 170 sfu). In contrast, there is a slight growth in this proportion at 10:00 LT and 16:00 LT, which is related to the local time dependence of winter anomaly. By comparing WHCP and WACP, we can conclude that the lower latitudes of the Northern Hemisphere also contribute significantly to the annual anomaly.

4. Summary and Conclusions

In this study, we investigated the winter anomaly, annual anomaly, and the proportion of the winter anomaly contributing to the annual anomaly based on CODG data of the 24th solar activity cycle (2008–2018) during the geomagnetic activity quiet period (Kp ≤ 5) using a regression approach. First, the reliability of the regression approach was verified. The pattern of variation of the winter anomaly index was then analyzed, and the global distribution of the FTVs was given. Next, the annual anomaly was analyzed. Finally, the contribution of the winter anomaly and winter hemisphere to the annual anomaly was quantitatively analyzed.
We analyzed the global distribution of the correlation coefficients between TEC and F10.7p, as well as the agreement between CODG and TEC calculated by regression equations. These all indicate that the regression approach has high accuracy. In addition, the winter anomaly index, which includes the difference between winter and summer solar activity levels, was calculated using the regression and averaging methods, and they are in good agreement.
We measured the local time corresponding to the maximum of winter anomaly indices during 08:00–16:00 LT and found that winter anomaly is more significant at 11:00–13:00 LT. By analyzing the global distribution of the winter anomaly index at different solar activity levels, we verified the positive correlation between winter anomaly and solar activity levels and found that the winter anomaly region extends from North America to the Far East with enhanced solar activity levels. We also found that the distribution of winter anomaly in North America may be related to the geomagnetic inclination. In addition, we verified that winter anomaly near Australia is more significant when geomagnetic activity is stronger. By analyzing the interannual variation of ON2I, we verified that seasonal variations in O/N2 not only explain winter anomaly near North America and Australia but also the positive correlation between winter anomaly and solar activity.
We established the global distribution of FTVs by calculating the intersection of the regression equations, which can be used as a reference for single-point ionospheric modeling.
We found that the annual anomaly was strongest at 12:00 LT (December TEC was 34.4% larger than the June TEC) by analyzing the variation of the annual anomaly index with local time and solar activity level. In addition, we also verified the positive correlation between annual anomaly and solar activity and found that the growth rate of the annual anomaly index is lower at higher levels of solar activity.
By analyzing the variation of WHCP with local time and solar activity level, we found that the TEC in the winter hemisphere will be the main factor determining the size of the annual anomaly when the solar activity level is stronger. For example, the winter hemisphere contributes more than 50% to the annual anomaly when the solar activity level exceeds 90 sfu, while the contribution of the winter hemisphere can be up to 65% when the solar activity level exceeds 130 sfu. By analyzing the variation of WACP with local time and solar activity level, we found that winter anomaly can contribute up to 32% to the annual anomaly.
We hope that the results of this study will deepen the current knowledge of scholars about winter and annual anomalies, and provide a reference for establishing and improving empirical ionospheric models. Since NmF2 is an important parameter for the study of ionospheric anomalies, the quantitative analysis of winter anomaly, annual anomaly, and the contribution of winter anomaly to annual anomaly through NmF2 should be considered in the next study.

Author Contributions

Conceptualization, writing—original draft preparation, writing—review and editing, and methodology, K.W., J.F. and Z.Z.; validation, K.W.; data curation, Z.Z. and B.H.; formal analysis, K.W. and J.F.; funding acquisition, J.F. All authors have read and agreed to the published version of the manuscript.

Funding

This work was supported by the National Natural Science Foundation of China under Grant Nos. 42274040 and 41804032, by the Specialized Research Fund for State Key Laboratories, by the State Key Laboratory of Geo-Information Engineering under Grant No. SKLGIE2021-M-3-2, and by the Youth Project of Natural Science Foundation of Shandong Province under Grant No. ZR2022QD078.

Data Availability Statement

The GIMs data provided by the CODE in the study are available at http://ftp.aiub.unibe.ch/CODE/ (accessed on 10 October 2023). The F10.7 and Kp data provided by the OMNIWEB in the study are available at https://omniweb.gsfc.nasa.gov/form/dx1.html (accessed on 10 October 2023). The geo-magnetic inclination data provided by the IGRF-13 in the study are available at https://wdc.kugi.kyoto-u.ac.jp/igrf/index.html (accessed on 10 October 2023). The O/N2 data provided by the GUVI in the study are available at http://guvitimed.jhuapl.edu/ (accessed on 10 October 2023).

Acknowledgments

We are grateful for the GIM products provided by the CODE, the F10.7 and Kp data provided by the OMNIWEB, the geomagnetic inclination data provided by the IGRF-13, and the O/N2 data provided by the GUVI. We acknowledge the use of MATrix LABoratory (MATLAB R2023a) software, the Generic Mapping Tools (GMT v6.4.0). We would like to thank the anonymous reviewers for their helpful suggestions.

Conflicts of Interest

The authors declare no conflict of interest.

Appendix A

The following content in Appendix A comprises the supplemental descriptions in Section 2.2 on how to deduce the proportion of the winter hemisphere contributing to the annual anomaly and that of the winter anomaly contributing to the annual anomaly.
To explore the proportion of the winter hemisphere contributing to the annual anomaly, we decomposed the annual anomaly index to the hemispheric scale, as shown in Equation (A1). In the formula, TEC12 (TEC06) represents the global TEC average for December (June); TECN12 (TECS12) represents the total TEC in the Northern Hemisphere (Southern Hemisphere) in December; TECN06 (TECS06) represents the total TEC in the Northern Hemisphere (Southern Hemisphere) in June. In this study, June was used to represent Northern Hemisphere summer, and December was used to represent Northern Hemisphere winter. TECN12 and TECS06 are both winter, TECN06 and TECS12 are both summer. The summation of TECN12 − TECS06 and TECS12 − TECN06 can describe the annual anomaly. Therefore, we make TECN12 − TECS06 as the total contribution of the winter hemisphere to the annual anomaly, and TECS12 − TECN06 as the total contribution of the summer hemisphere to the annual anomaly.
AI = TEC 12 TEC 06 / TEC 06 = TECN 12 + TECS 12 TECN 06 + TECS 06 / TECN 06 + TECS 06 = TECN 12 TECS 06 + TECS 12 TECN 06 / TECN 06 + TECS 06
The annual anomaly index can be calculated by summing the magnitude of the contribution from the winter hemisphere (WHC, see Equation (A2)) and that of the summer hemisphere (SHC, see Equation (A3)). With this idea of decomposition, we can calculate the proportion of the winter hemisphere contributing to the annual anomaly (WHCR, see Equation (A4)).
WHC = TECN 12 TECS 06 / TECN 06 + TECS 06
SHC = TECS 12 TECN 06 / TECN 06 + TECS 06
WHCR = WHC / AI × 100 %
To explore the proportion of the winter anomaly contributing to the annual anomaly, we further decompose Equation (A2). The process of decomposition is shown in Equation (A5), where YWA represents grid points where winter anomaly is present, and NWA represents grid points where winter anomaly is not absent. It is worth noting that winter anomaly is not considered to exist at low latitudes, even if the winter anomaly index is greater than one.
WHC = TECN 12 TECS 06 / TECN 06 + TECS 06 = TECN ( YWA ) 12 + TECS ( NWA ) 12 TECN ( YWA ) 06 + TECS ( NWA ) 06 / TECN 06 + TECS 06 = TECN ( YWA ) 12 TECS ( YWA ) 06 + TECS ( NWA ) 12 TECN ( NWA ) 06 / TECN 06 + TECS 06
The WHC can be calculated by summing the magnitude of the contribution from the winter anomaly (WAC, see Equation (A6)) and the magnitude of the contribution from the non-winter anomaly (NWAC, see Equation (A7)). With this idea of decomposition, we can calculate the proportion of winter anomaly contributing to the annual anomaly (WACR, see Equation (A8)).
WAC = TECN ( YWA ) 12 TECS ( YWA ) 06 / TECN 06 + TECS 06
NWAC = TECS ( NWA ) 12 TECN ( NWA ) 06 / TECN 06 + TECS 06
WACR = WAC / AI × 100 %

References

  1. Appleton, E.V.; Naismith, R. Some Further Measurements of Upper Atmospheric Ionization. Proc. R. Soc. Lond. Ser. A Math. Phys. Sci. 1935, 150, 685–708. [Google Scholar] [CrossRef]
  2. Mendillo, M.; Huang, C.-L.; Pi, X.; Rishbeth, H.; Meier, R. The Global Ionospheric Asymmetry in Total Electron Content. J. Atmos. Sol.-Terr. Phys. 2005, 67, 1377–1387. [Google Scholar] [CrossRef]
  3. Berkner, L.V.; Wells, H.W. Non-Seasonal Change of F2-Region Ion-Density. Terr. Magn. Atmos. Electr. 1938, 43, 15–36. [Google Scholar] [CrossRef]
  4. Rishbeth, H. How the Thermospheric Circulation Affects the Ionospheric F2-Layer. J. Atmos. Sol.-Terr. Phys. 1998, 60, 1385–1402. [Google Scholar] [CrossRef]
  5. Berkner, L.V.; Wells, H.W.; Seaton, S.L. Characteristics of the Upper Region of the Ionosphere. Terr. Magn. Atmos. Electr. 1936, 41, 173–184. [Google Scholar] [CrossRef]
  6. Appleton, E.V. Two Anomalies in the Ionosphere. Nature 1946, 157, 691. [Google Scholar] [CrossRef]
  7. Thampi, S.V.; Lin, C.; Liu, H.; Yamamoto, M. First Tomographic Observations of the Midlatitude Summer Nighttime Anomaly over Japan. J. Geophys. Res. Space Phys. 2009, 114, 1–10. [Google Scholar] [CrossRef]
  8. Torr, M.R.; Torr, D.G. The Seasonal Behaviour of the F2-Layer of the Ionosphere. J. Atmos. Terr. Phys. 1973, 35, 2237–2251. [Google Scholar] [CrossRef]
  9. Yasyukevich, Y.; Yasyukevich, A.; Ratovsky, K.; Klimenko, M.; Klimenko, V.; Chirik, N. Winter Anomaly in NmF2 and TEC: When and Where It Can Occur. J. Space Weather Space Clim. 2018, 8, A45. [Google Scholar] [CrossRef]
  10. Azpilicueta, F.; Nava, B. A Different View of the Ionospheric Winter Anomaly. Adv. Space Res. 2021, 67, 150–162. [Google Scholar] [CrossRef]
  11. Pavlov, A.V.; Pavlova, N.M. Variations in Statistical Parameters of the NmF2 Winter Anomaly with Latitude and Solar Activity. Geomagn. Aeron. 2012, 52, 335–343. [Google Scholar] [CrossRef]
  12. Zhao, B.; Wan, W.; Liu, L.; Mao, T.; Ren, Z.; Wang, M.; Christensen, A.B. Features of Annual and Semiannual Variations Derived from the Global Ionospheric Maps of Total Electron Content. Ann. Geophys. 2007, 25, 2513–2527. [Google Scholar] [CrossRef]
  13. Lee, W.K.; Kil, H.; Kwak, Y.-S.; Wu, Q.; Cho, S.; Park, J.U. The Winter Anomaly in the Middle-Latitude F Region during the Solar Minimum Period Observed by the Constellation Observing System for Meteorology, Ionosphere, and Climate. J. Geophys. Res. Space Phys. 2011, 116, 1–10. [Google Scholar] [CrossRef]
  14. Meza, A.; Natali, M.; Fernandez, L. Analysis of the Winter and Semiannual Ionospheric Anomalies in 1999–2009 Based on GPS Global International GNSS Service Maps. J. Geophys. Res. Space Phys. 2012, 117, 1319. [Google Scholar] [CrossRef]
  15. Huo, X.L.; Yuan, Y.B.; Ou, J.K.; Zhang, K.F.; Bailey, G.J. Monitoring the Global-Scale Winter Anomaly of Total Electron Contents Using GPS Data. Earth Planets Space 2009, 61, 1019–1024. [Google Scholar] [CrossRef]
  16. Mikhailov, A.V.; Perrone, L. Comment on “The Winter Anomaly in the Middle-Latitude F Region during the Solar Minimum Period Observed by the Constellation Observing System for Meteorology, Ionosphere, and Climate” by W. K. Lee, H. Kil, Y.-S. Kwak, Q. Wu, S. Cho, and J. U. Park. J. Geophys. Res. Space Phys. 2014, 119, 7972–7978. [Google Scholar] [CrossRef]
  17. Klimenko, M.V.; Klimenko, V.V.; Zakharenkova, I.E.; Ratovsky, K.G.; Yasyukevich, A.S.; Yasyukevich, Y.V. Altitudinal Extent of Winter Anomaly and Its Manifestation in the Total Electron Content. Russ. J. Phys. Chem. B 2019, 13, 884–891. [Google Scholar] [CrossRef]
  18. Rishbeth, H.; Setty, C.S.G.K. The F-Layer at Sunrise. J. Atmos. Terr. Phys. 1961, 20, 263–276. [Google Scholar] [CrossRef]
  19. King, G.A.M. The Dissociation of Oxygen and High Level Circulation in the Atmosphere. J. Atmos. Sci. 1964, 21, 231–237. [Google Scholar] [CrossRef]
  20. Burns, A.G.; Wang, W.; Qian, L.; Solomon, S.C.; Zhang, Y.; Paxton, L.J.; Yue, X. On the Solar Cycle Variation of the Winter Anomaly. J. Geophys. Res. Space Phys. 2014, 119, 4938–4949. [Google Scholar] [CrossRef]
  21. Zou, L.; Rishbeth, H.; Müller-Wodarg, I.C.F.; Aylward, A.D.; Millward, G.H.; Fuller-Rowell, T.J.; Idenden, D.W.; Moffett, R.J. Annual and Semiannual Variations in the Ionospheric F2-Layer. I. Modelling. Ann. Geophys. 2000, 18, 927–944. [Google Scholar] [CrossRef]
  22. Qian, L.; Burns, A.G.; Wang, W.; Solomon, S.C.; Zhang, Y.; Hsu, V. Effects of the Equatorial Ionosphere Anomaly on the Interhemispheric Circulation in the Thermosphere. J. Geophys. Res. Space Phys. 2016, 121, 2522–2530. [Google Scholar] [CrossRef]
  23. Torr, D.G.; Torr, M.R.; Richards, P.G. Causes of the F Region Winter Anomaly. Geophys. Res. Lett. 1980, 7, 301–304. [Google Scholar] [CrossRef]
  24. Yonezawa, T. The Solar-Activity and Latitudinal Characteristics of the Seasonal, Non-Seasonal and Semi-Annual Variations in the Peak Electron Densities of the F2-Layer at Noon and at Midnight in Middle and Low Latitudes. J. Atmos. Terr. Phys. 1971, 33, 889–907. [Google Scholar] [CrossRef]
  25. Rishbeth, H.; Müller-Wodarg, I.C.F.; Zou, L.; Fuller-Rowell, T.J.; Millward, G.H.; Moffett, R.J.; Idenden, D.W.; Aylward, A.D. Annual and Semiannual Variations in the Ionospheric F2-Layer: II. Physical Discussion. Ann. Geophys. 2000, 18, 945–956. [Google Scholar] [CrossRef]
  26. Rishbeth, H.; Müller-Wodarg, I.C.F. Why Is There More Ionosphere in January than in July? The Annual Asymmetry in the F2-Layer. Ann. Geophys. 2006, 24, 3293–3311. [Google Scholar] [CrossRef]
  27. Su, Y.Z.; Bailey, G.J.; Oyama, K.-I. Annual and Seasonal Variations in the Low-Latitude Topside Ionosphere. Ann. Geophys. 1998, 16, 974–985. [Google Scholar] [CrossRef]
  28. Gowtam, V.S.; Ram, S.T. Ionospheric Winter Anomaly and Annual Anomaly Observed from Formosat-3/COSMIC Radio Occultation Observations during the Ascending Phase of Solar Cycle 24. Adv. Space Res. 2017, 60, 1585–1593. [Google Scholar] [CrossRef]
  29. Rishbeth, H. Thermospheric Targets. Eos Trans. Am. Geophys. Union 2007, 88, 189–193. [Google Scholar] [CrossRef]
  30. Roma-Dollase, D.; Hernández-Pajares, M.; Krankowski, A.; Kotulak, K.; Ghoddousi-Fard, R.; Yuan, Y.; Li, Z.; Zhang, H.; Shi, C.; Wang, C.; et al. Consistency of Seven Different GNSS Global Ionospheric Mapping Techniques during One Solar Cycle. J. Geod. 2018, 92, 691–706. [Google Scholar] [CrossRef]
  31. Feng, J.; Wang, K.; Li, W.; Han, B.; Zhao, Z.; Zhang, T.; Meng, D. Analysis of Temporal and Spatial Variation Characteristics of Midlatitude Summer Nighttime Anomaly in Low and Middle Solar Activity Period. Adv. Space Res. 2023, 71, 4351–4360. [Google Scholar] [CrossRef]
  32. Feng, J.; Han, B.; Zhao, Z.; Wang, Z. A New Global Total Electron Content Empirical Model. Remote Sens. 2019, 11, 706. [Google Scholar] [CrossRef]
  33. Feng, J.; Yuan, Y.; Zhang, T.; Zhang, Z.; Meng, D. Analysis of Ionospheric Anomalies before the Tonga Volcanic Eruption on 15 January 2022. Remote Sens. 2023, 15, 4879. [Google Scholar] [CrossRef]
  34. Feng, J.; Zhang, T.; Li, W.; Zhao, Z.; Han, B.; Wang, K. A New Global TEC Empirical Model Based on Fusing Multi-Source Data. GPS Solut. 2022, 27, 20. [Google Scholar] [CrossRef]
  35. Jakowski, N.; Hoque, M.M.; Mayer, C. A New Global TEC Model for Estimating Transionospheric Radio Wave Propagation Errors. J. Geod. 2011, 85, 965–974. [Google Scholar] [CrossRef]
  36. Hoque, M.M.; Jakowski, N.; Orús-Pérez, R. Fast Ionospheric Correction Using Galileo Az Coefficients and the NTCM Model. GPS Solut. 2019, 23, 41. [Google Scholar] [CrossRef]
  37. Schaer, S. Mapping and Predicting the Earth’s Ionosphere Using the Global Positioning System; Institutfür Geodäsie und Photogrammetrie, Eidg, Technische Hochschule Zürich: Zürich, Switzerland, 1999. [Google Scholar]
  38. Lei, J.; Liu, L.; Wan, W.; Zhang, S.-R. Variations of Electron Density Based on Long-Term Incoherent Scatter Radar and Ionosonde Measurements over Millstone Hill. Radio Sci. 2005, 40, 1–10. [Google Scholar] [CrossRef]
  39. Alken, P.; Thébault, E.; Beggan, C.D.; Amit, H.; Aubert, J.; Baerenzung, J.; Bondar, T.N.; Brown, W.J.; Califf, S.; Chambodut, A.; et al. International Geomagnetic Reference Field: The Thirteenth Generation. Earth Planets Space 2021, 73, 49. [Google Scholar] [CrossRef]
  40. Oinats, A.V.; Ratovsky, K.G.; Kotovich, G.V. Influence of the 27-Day Solar Flux Variations on the Ionosphere Parameters Measured at Irkutsk in 2003–2005. Adv. Space Res. 2008, 42, 639–644. [Google Scholar] [CrossRef]
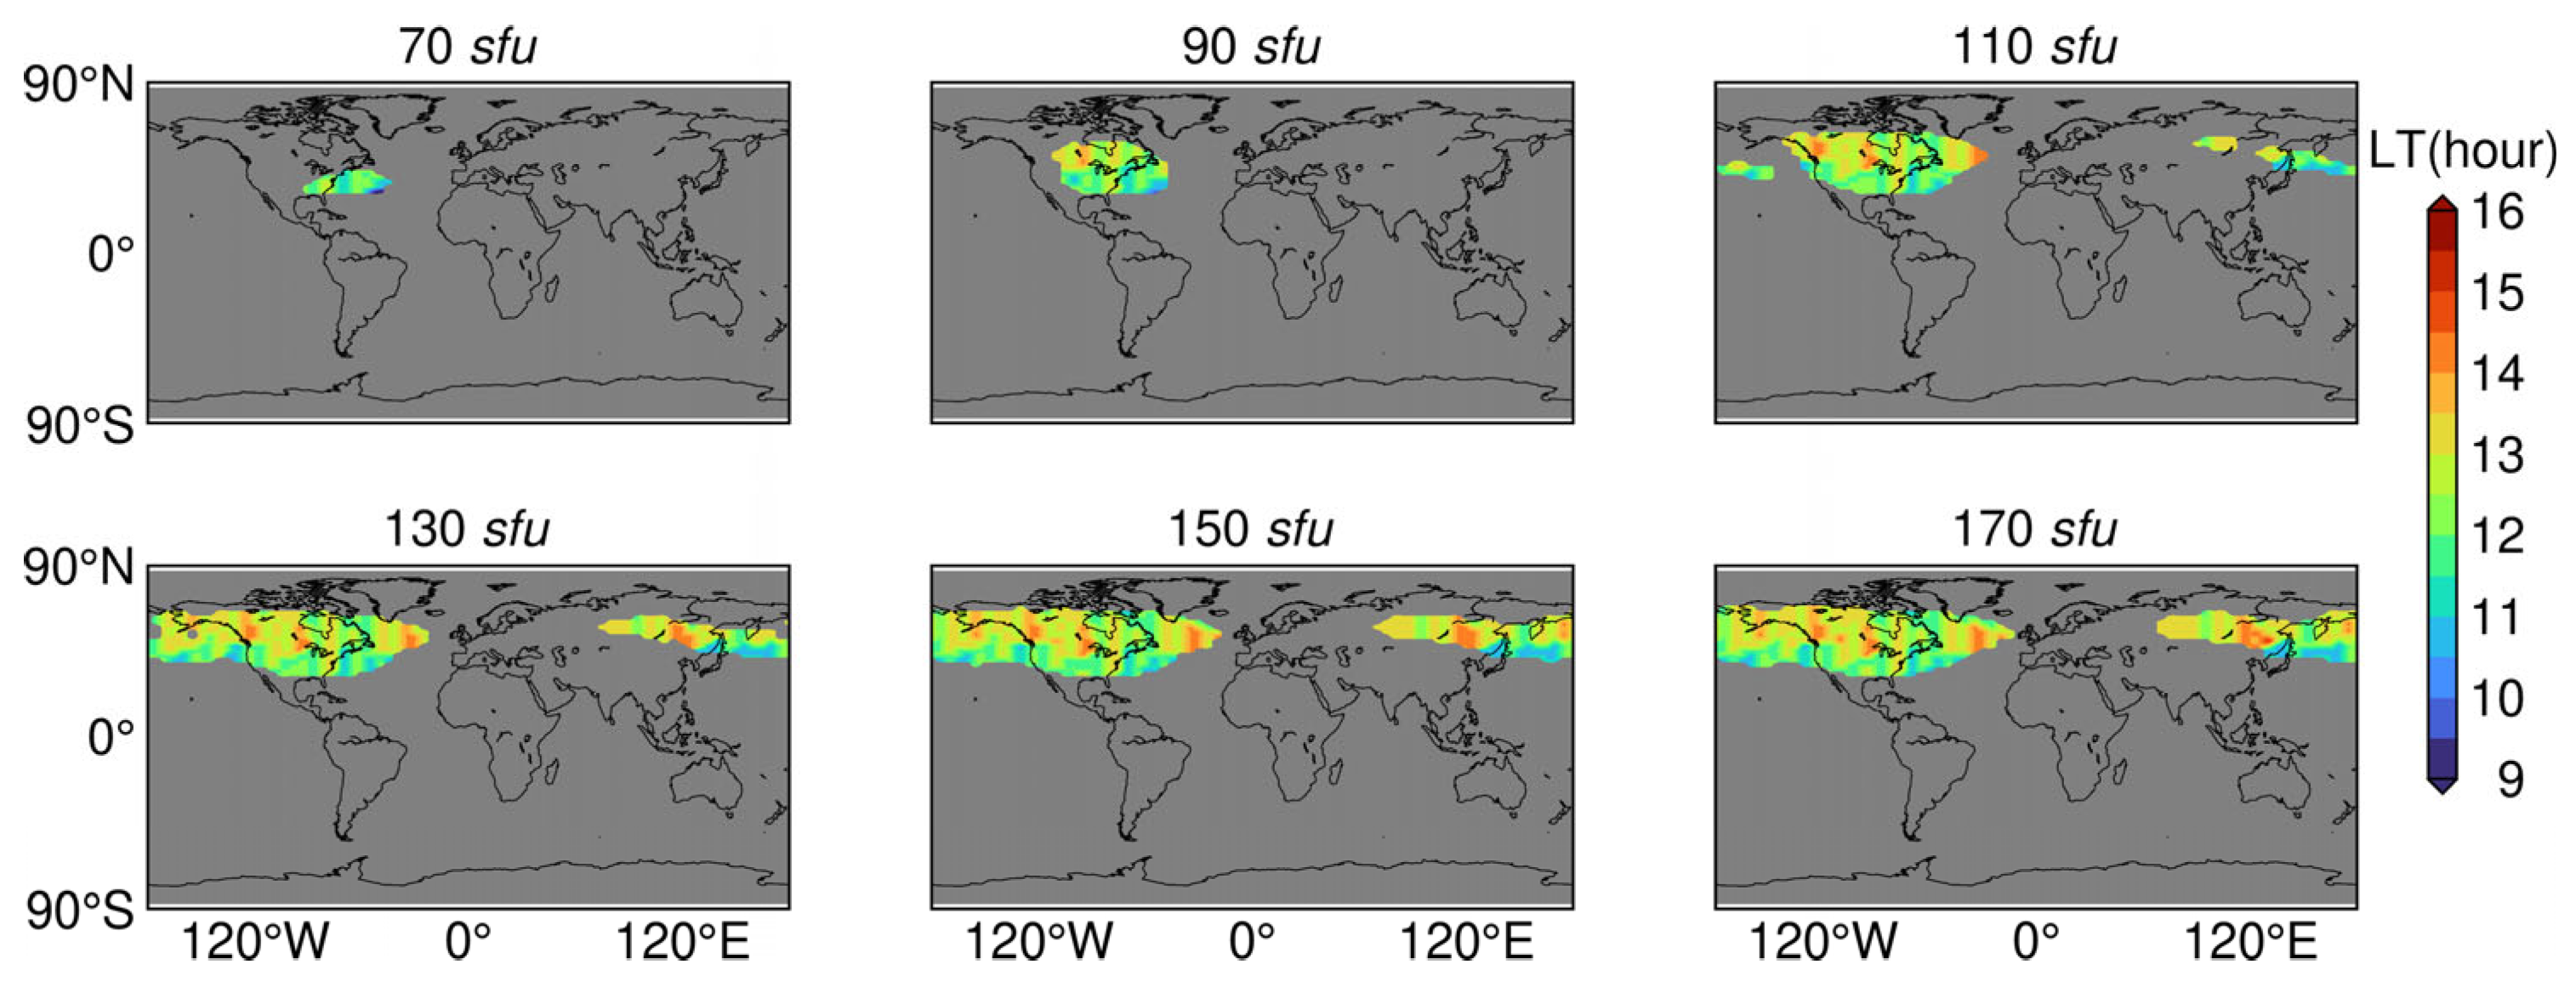
Figure 1. The global distribution of local time corresponds to the maximum of winter anomaly indices during 08:00–16:00 LT.
Remotesensing 15 04968 g001
Figure 2. The global distribution of correlation coefficient between TEC and F10.7p during 06:00–20:00 LT in June.
Remotesensing 15 04968 g002
Figure 3. The global distribution of correlation coefficient between TEC and F10.7p during 06:00–20:00 LT in December.
Remotesensing 15 04968 g003
Figure 4. The conformity of CODG with TECS and TECW at point A (25°N, 5°W) for different levels of solar activity and local time.
Remotesensing 15 04968 g004
Figure 5. The conformity of CODG with TECS and TECW at point B (52.5°N, 95°W) for different levels of solar activity and local time.
Remotesensing 15 04968 g005
Figure 6. Global distribution of winter anomaly index based on the averaging method, with F10.7p difference between December and June in parentheses in the subplot.
Remotesensing 15 04968 g006
Figure 7. Global distribution of winter anomaly index based on the regression approach, with F10.7p difference between December and June in parentheses in the subplot.
Remotesensing 15 04968 g007
Figure 8. Global distribution of winter anomaly index at different levels of solar activity (Kp ≤ 5), the dotted black line is the 60° geomagnetic inclination contour.
Remotesensing 15 04968 g008
Figure 9. Global distribution of winter anomaly index at different levels of solar activity (Kp > 3).
Remotesensing 15 04968 g009
Figure 10. Interannual variations in the global distribution of winter and summer ratio of O/N2.
Remotesensing 15 04968 g010
Figure 11. The global distribution of the minimum solar activity level corresponding to the occurrence of winter anomaly (Kp ≤ 5).
Remotesensing 15 04968 g011
Figure 12. Variation in monthly TEC calculated by using regression equations with local time and solar activity.
Remotesensing 15 04968 g012
Figure 13. (a) Variation of the global TEC difference between December and June with local time and solar activity; (b) Variation of annual anomaly index with local time and solar activity.
Remotesensing 15 04968 g013
Figure 14. Variation of the mean TEC of the southern and northern hemispheres in June and December with local time and solar activity.
Remotesensing 15 04968 g014
Figure 15. (a) Variation in the total winter hemispheric contribution to the annual anomaly with local time and solar activity; (b) Variation in the total summer hemispheric contribution to the annual anomaly with local time and solar activity; (c) Variation in the proportion of the winter hemisphere contributing to the annual anomaly with local time and solar activity; (d) Variation in the proportion of the winter anomaly contributing to the annual anomaly with local time and solar activity.
Remotesensing 15 04968 g015
Table 1. The F10.7p of June and December for each year (sfu).
Year20082009201020112012201320142015201620172018
June68.370.975.998.2127.8117.5130.5123.087.177.373.2
December67.174.781.4136.9110.9145.4151.1107.473.869.467.9
Disclaimer/Publisher’s Note: The statements, opinions and data contained in all publications are solely those of the individual author(s) and contributor(s) and not of MDPI and/or the editor(s). MDPI and/or the editor(s) disclaim responsibility for any injury to people or property resulting from any ideas, methods, instructions or products referred to in the content.