
Effects of Climate Variability and Human Activities on Vegetation Dynamics across the Qinghai–Tibet Plateau from 1982 to 2020


Abstract
:1. Introduction
2. Data and Methods
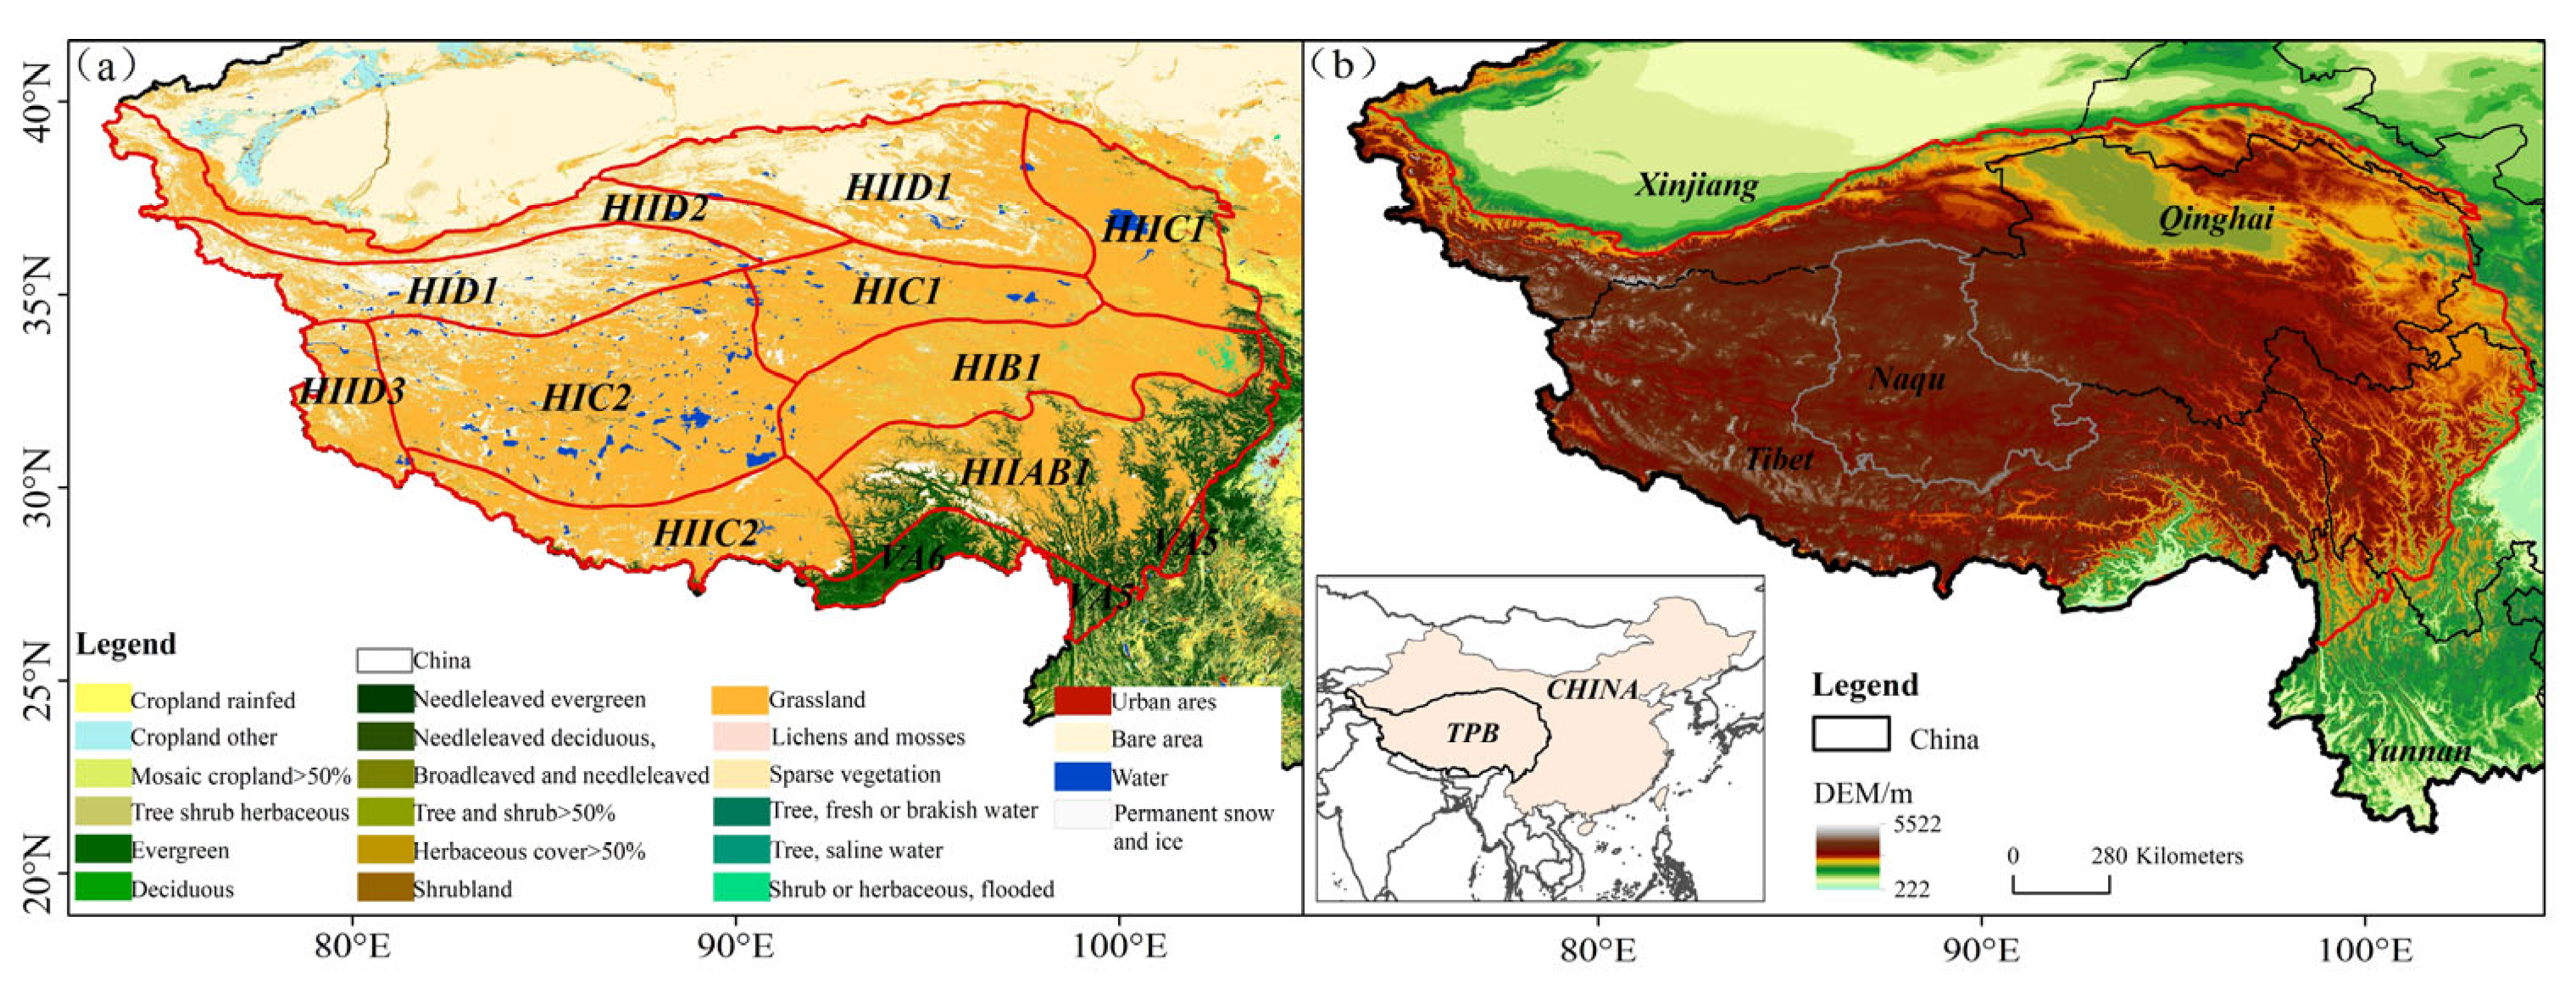
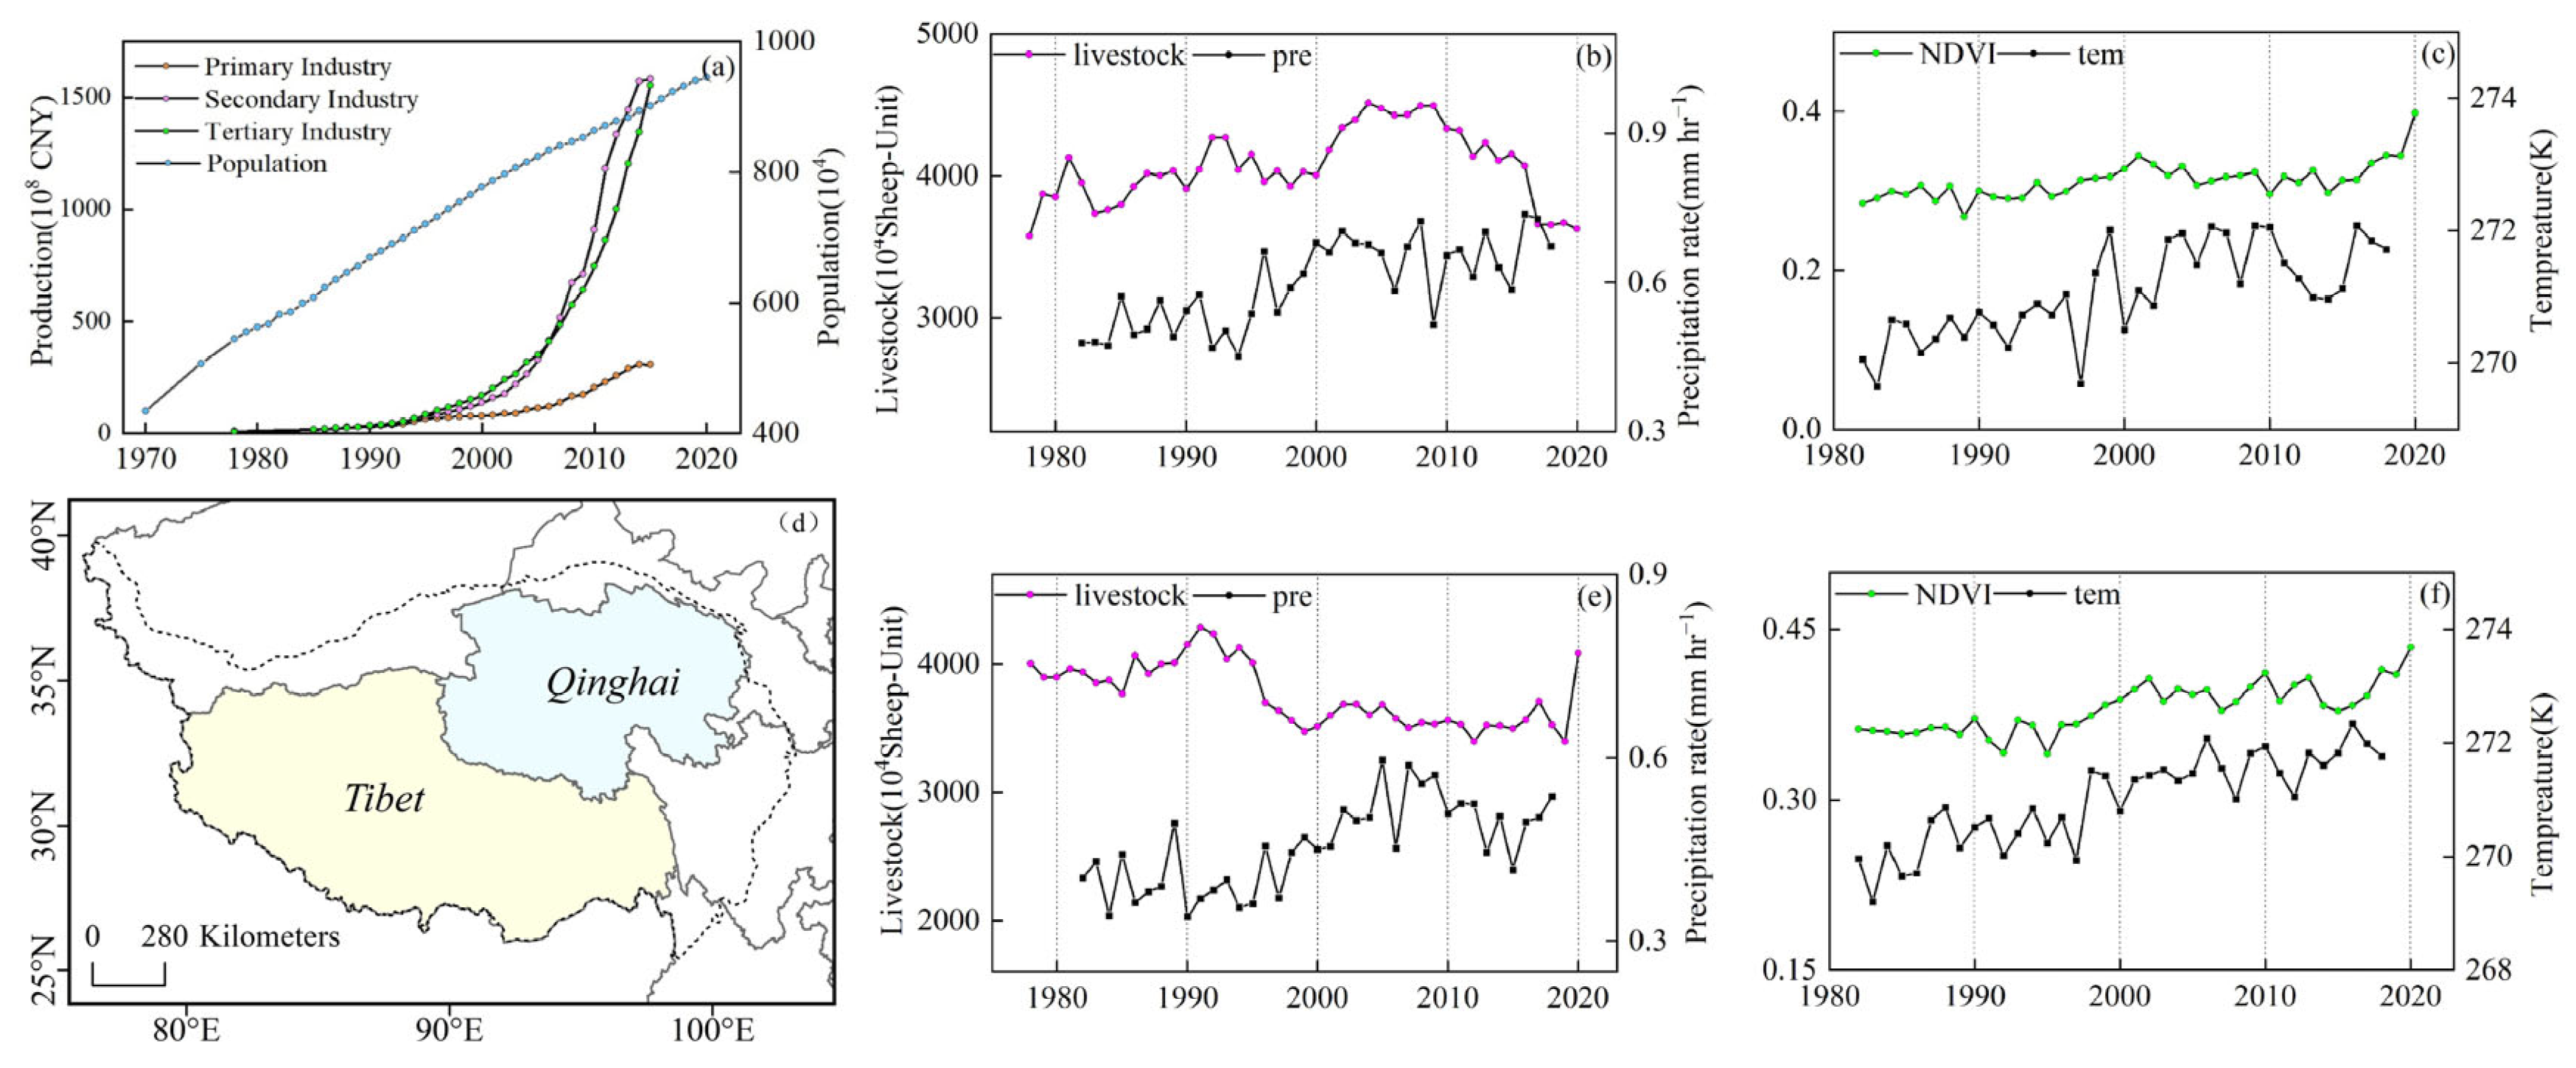
2.1. Study Area
2.2. Data and Materials
2.3. Methods
- (1)
- Maximum Value Composition Method
- (2)
- Trend Analysis
- (3)
- Residual Analysis
- (4)
- Pearson Correlation Analysis
3. Results
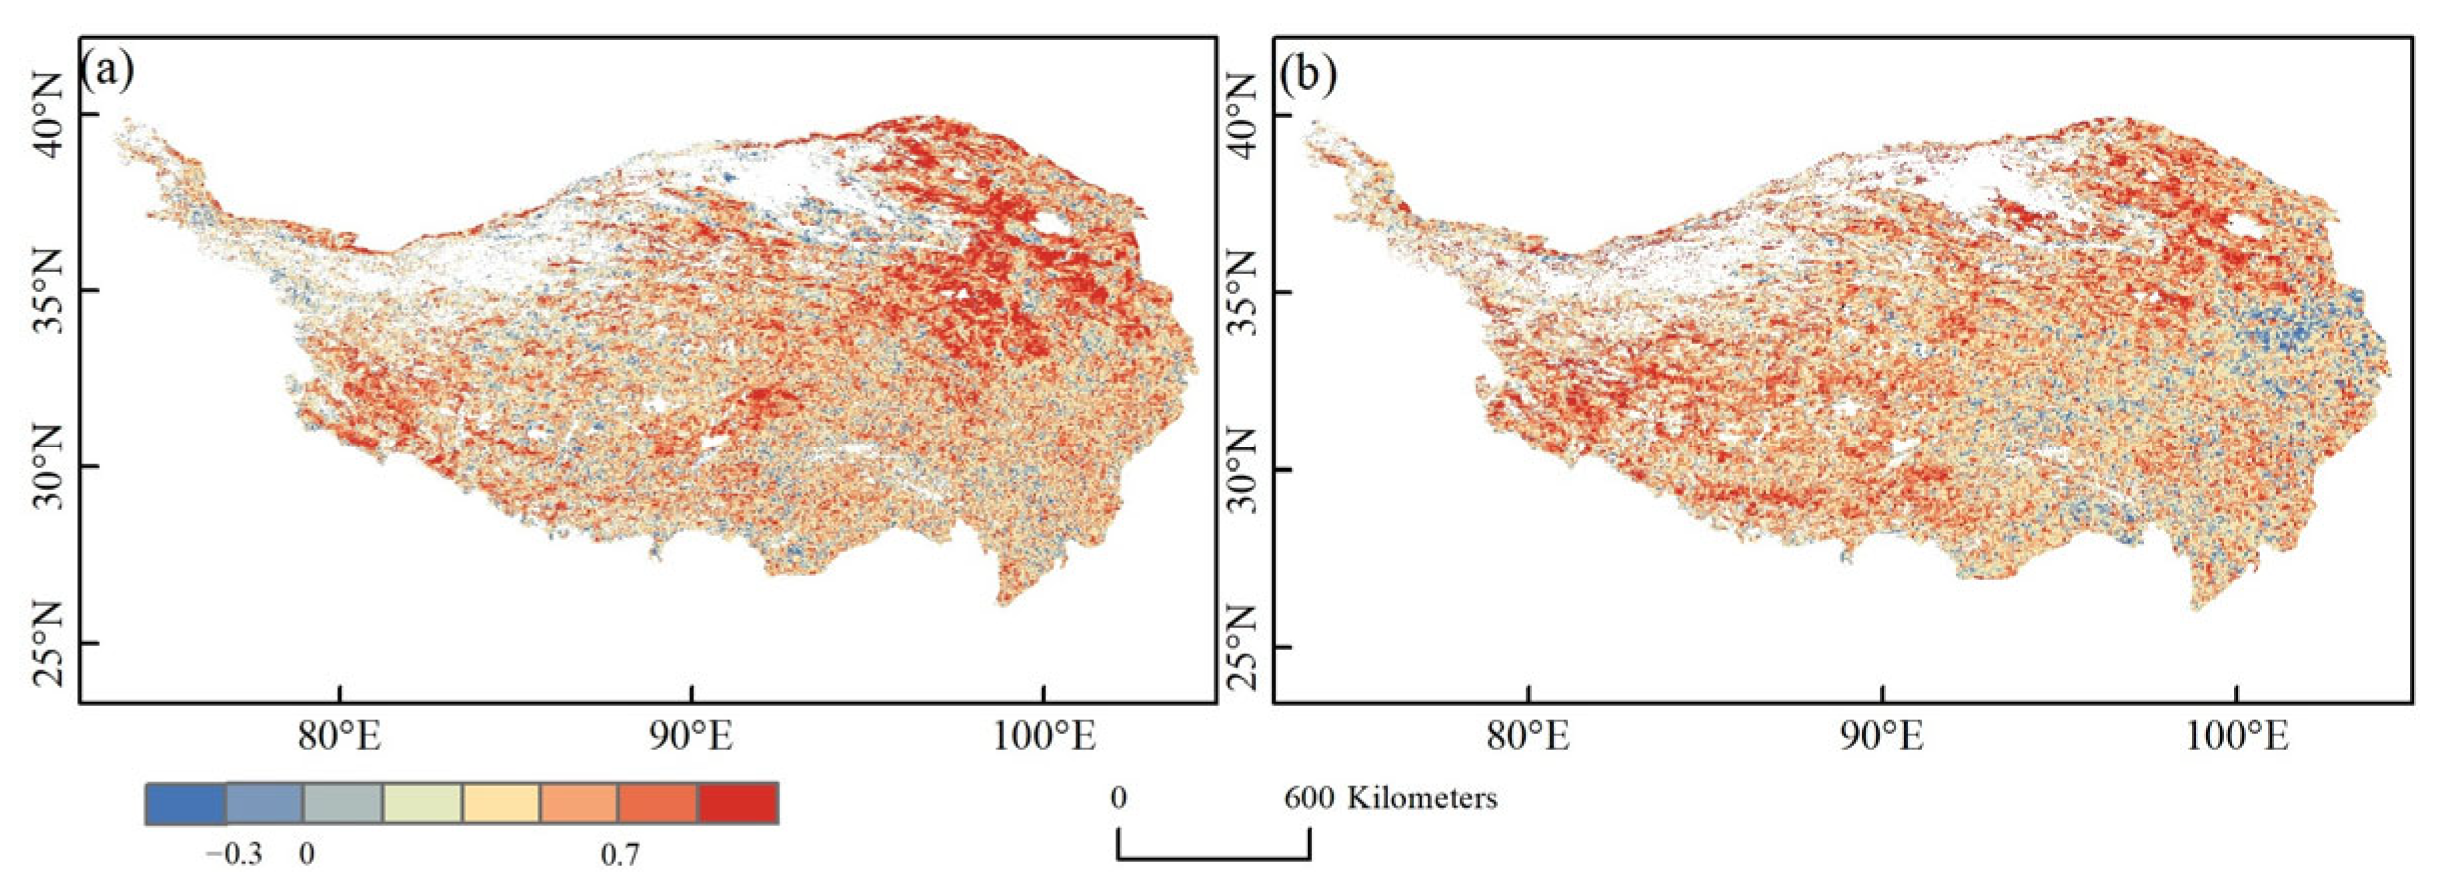
3.1. Data Quality Assessment
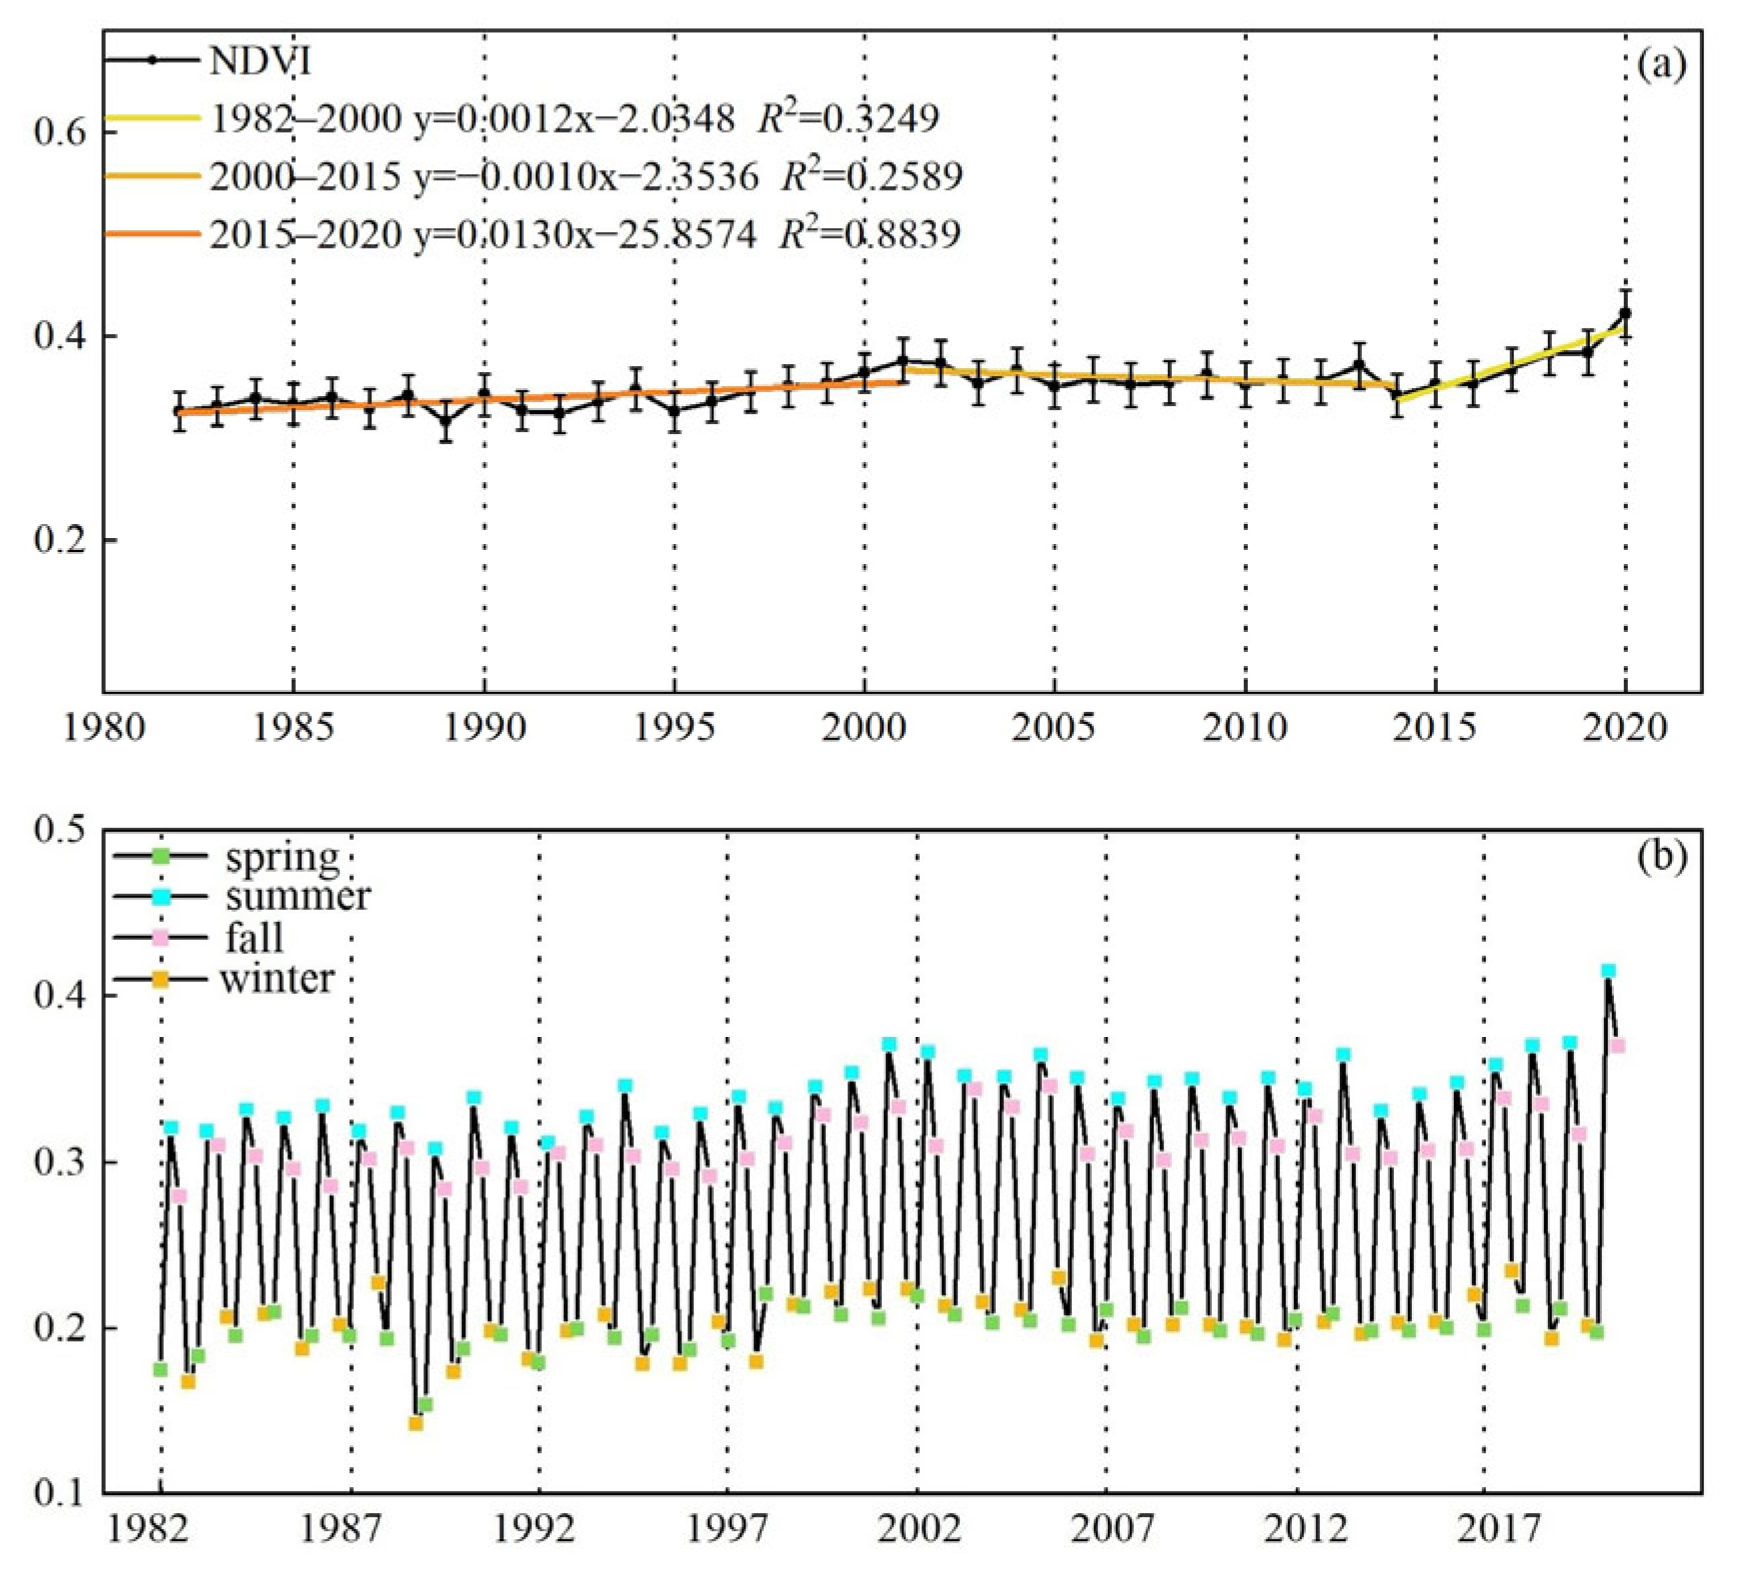
3.2. Time Series of Major Change
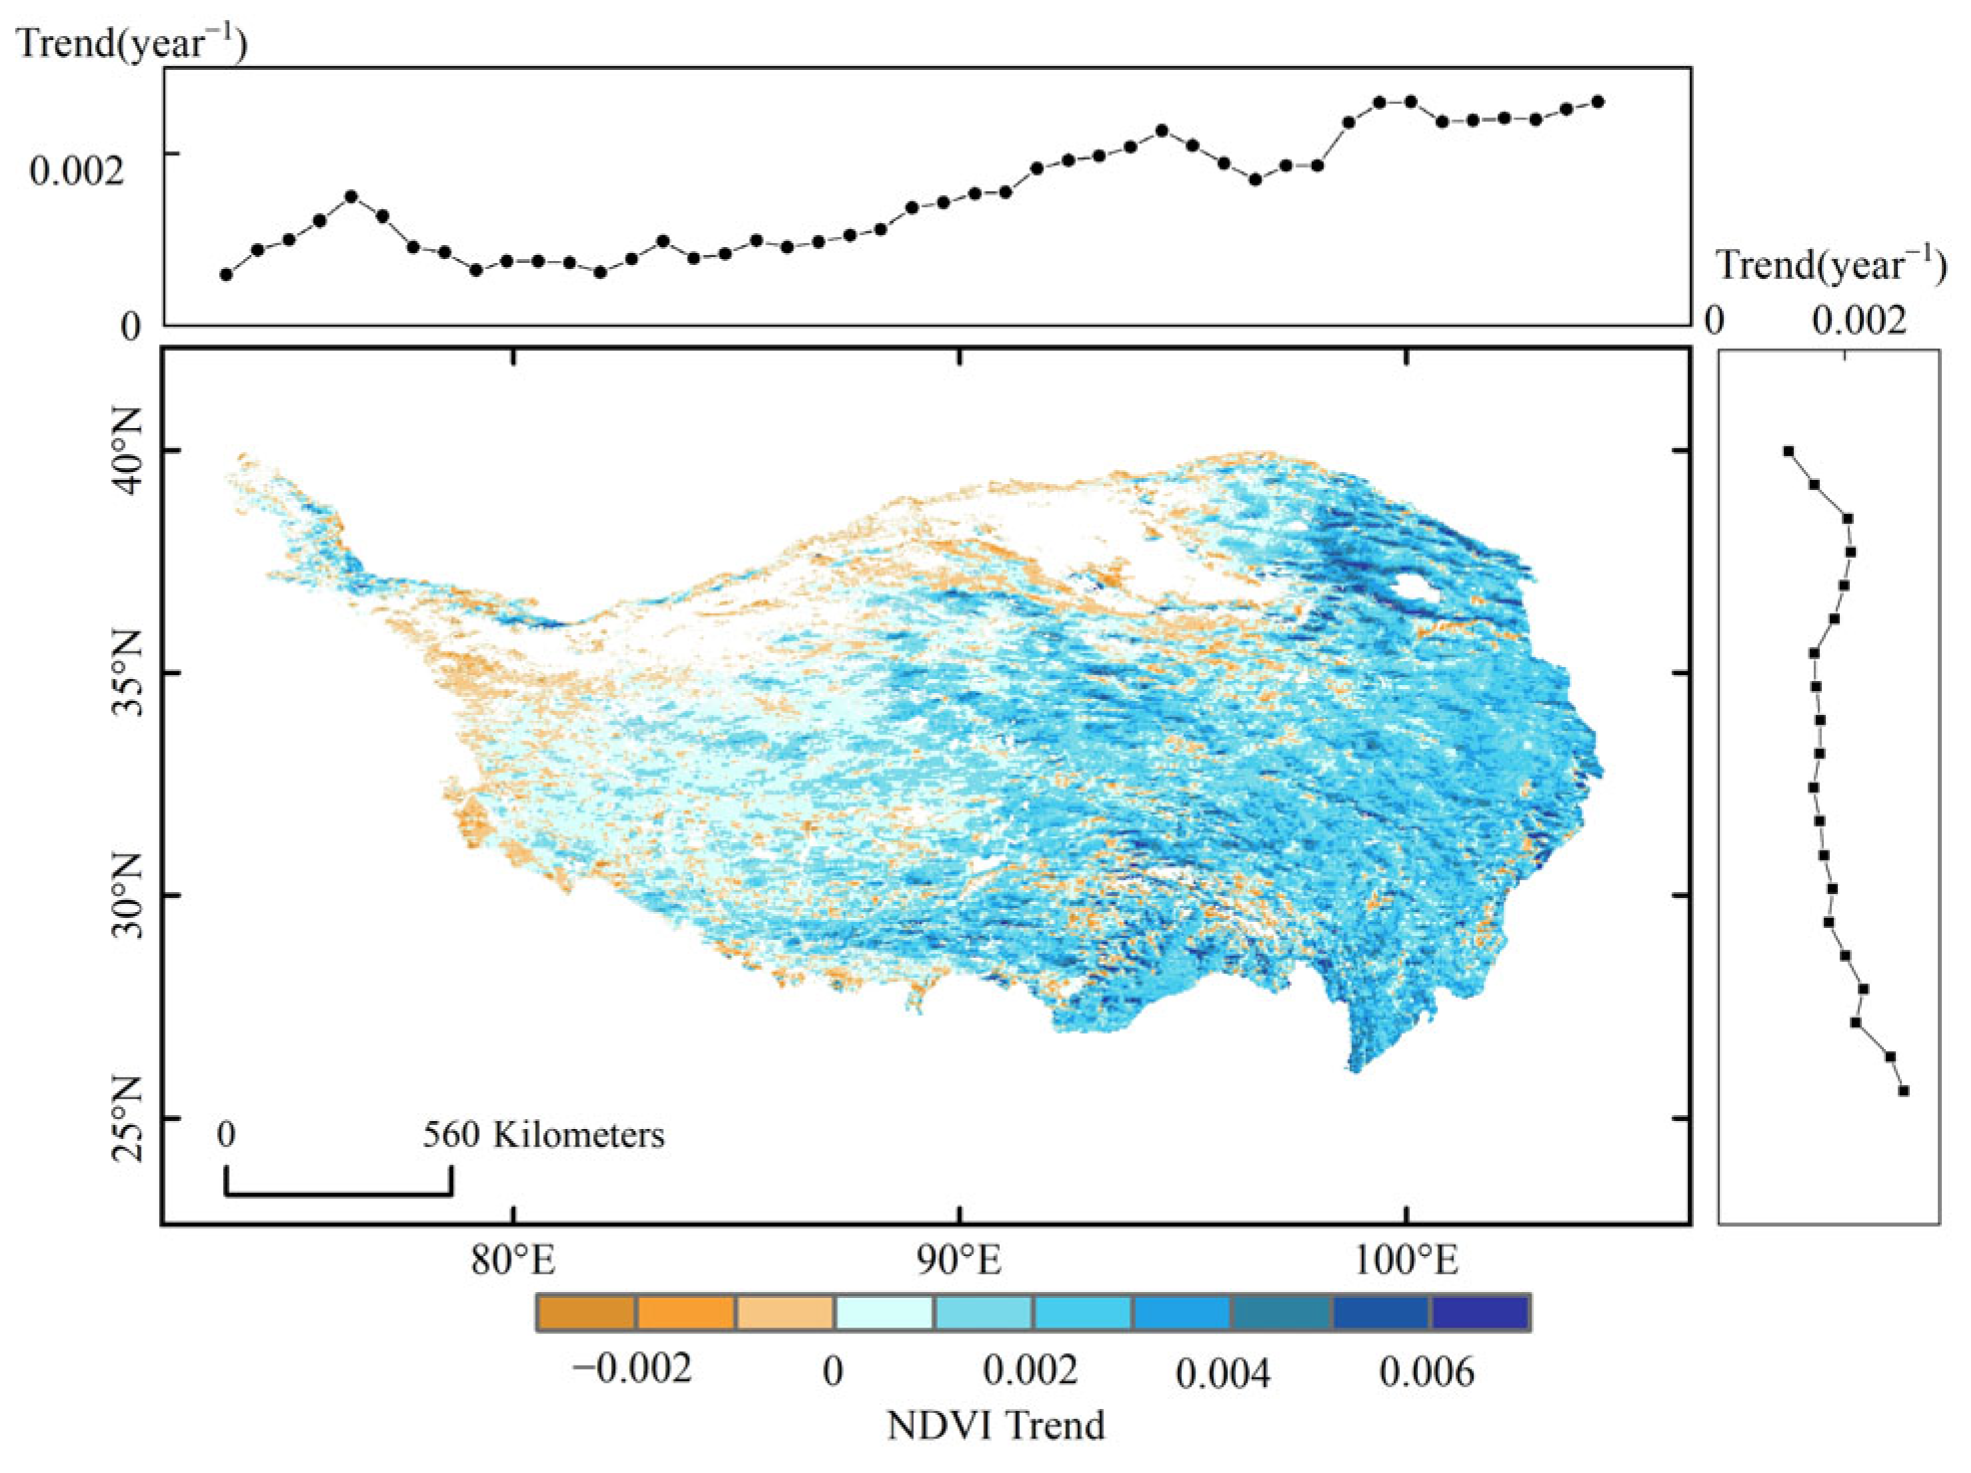
3.3. Spatial Change
3.3.1. Spatial Variability of Major Change
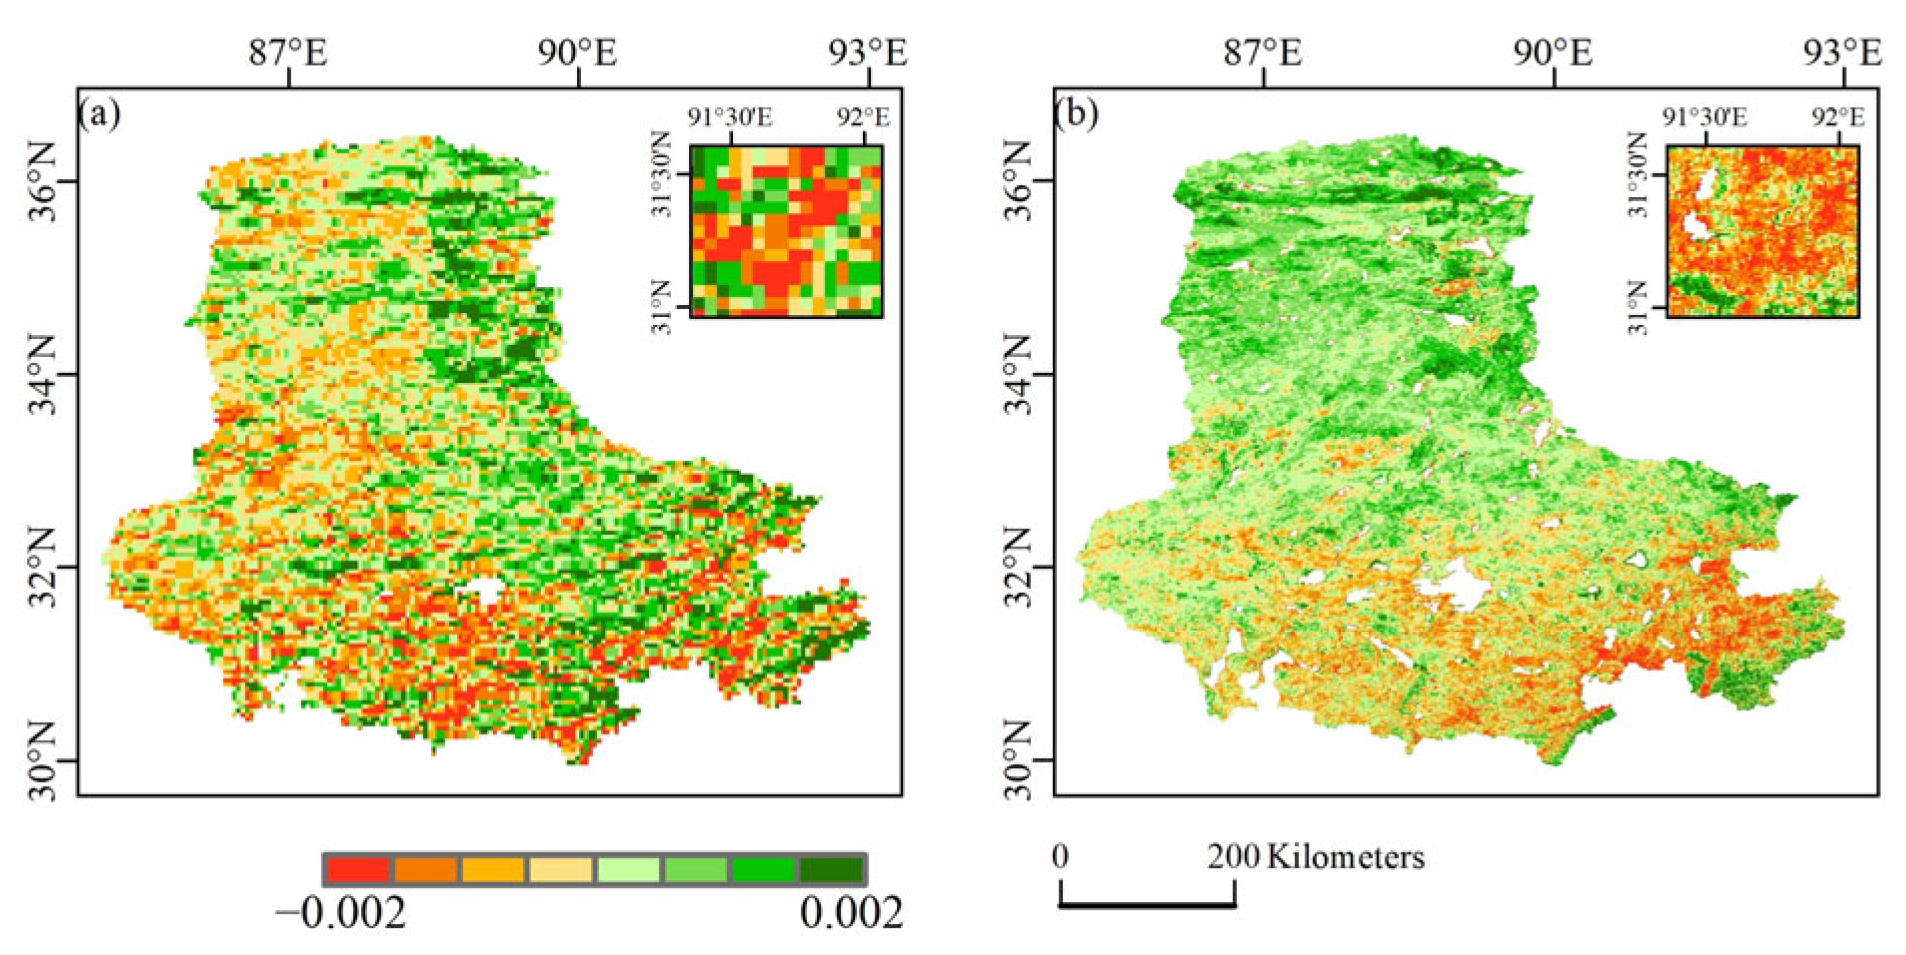
3.3.2. Spatial Changes in Different Zones
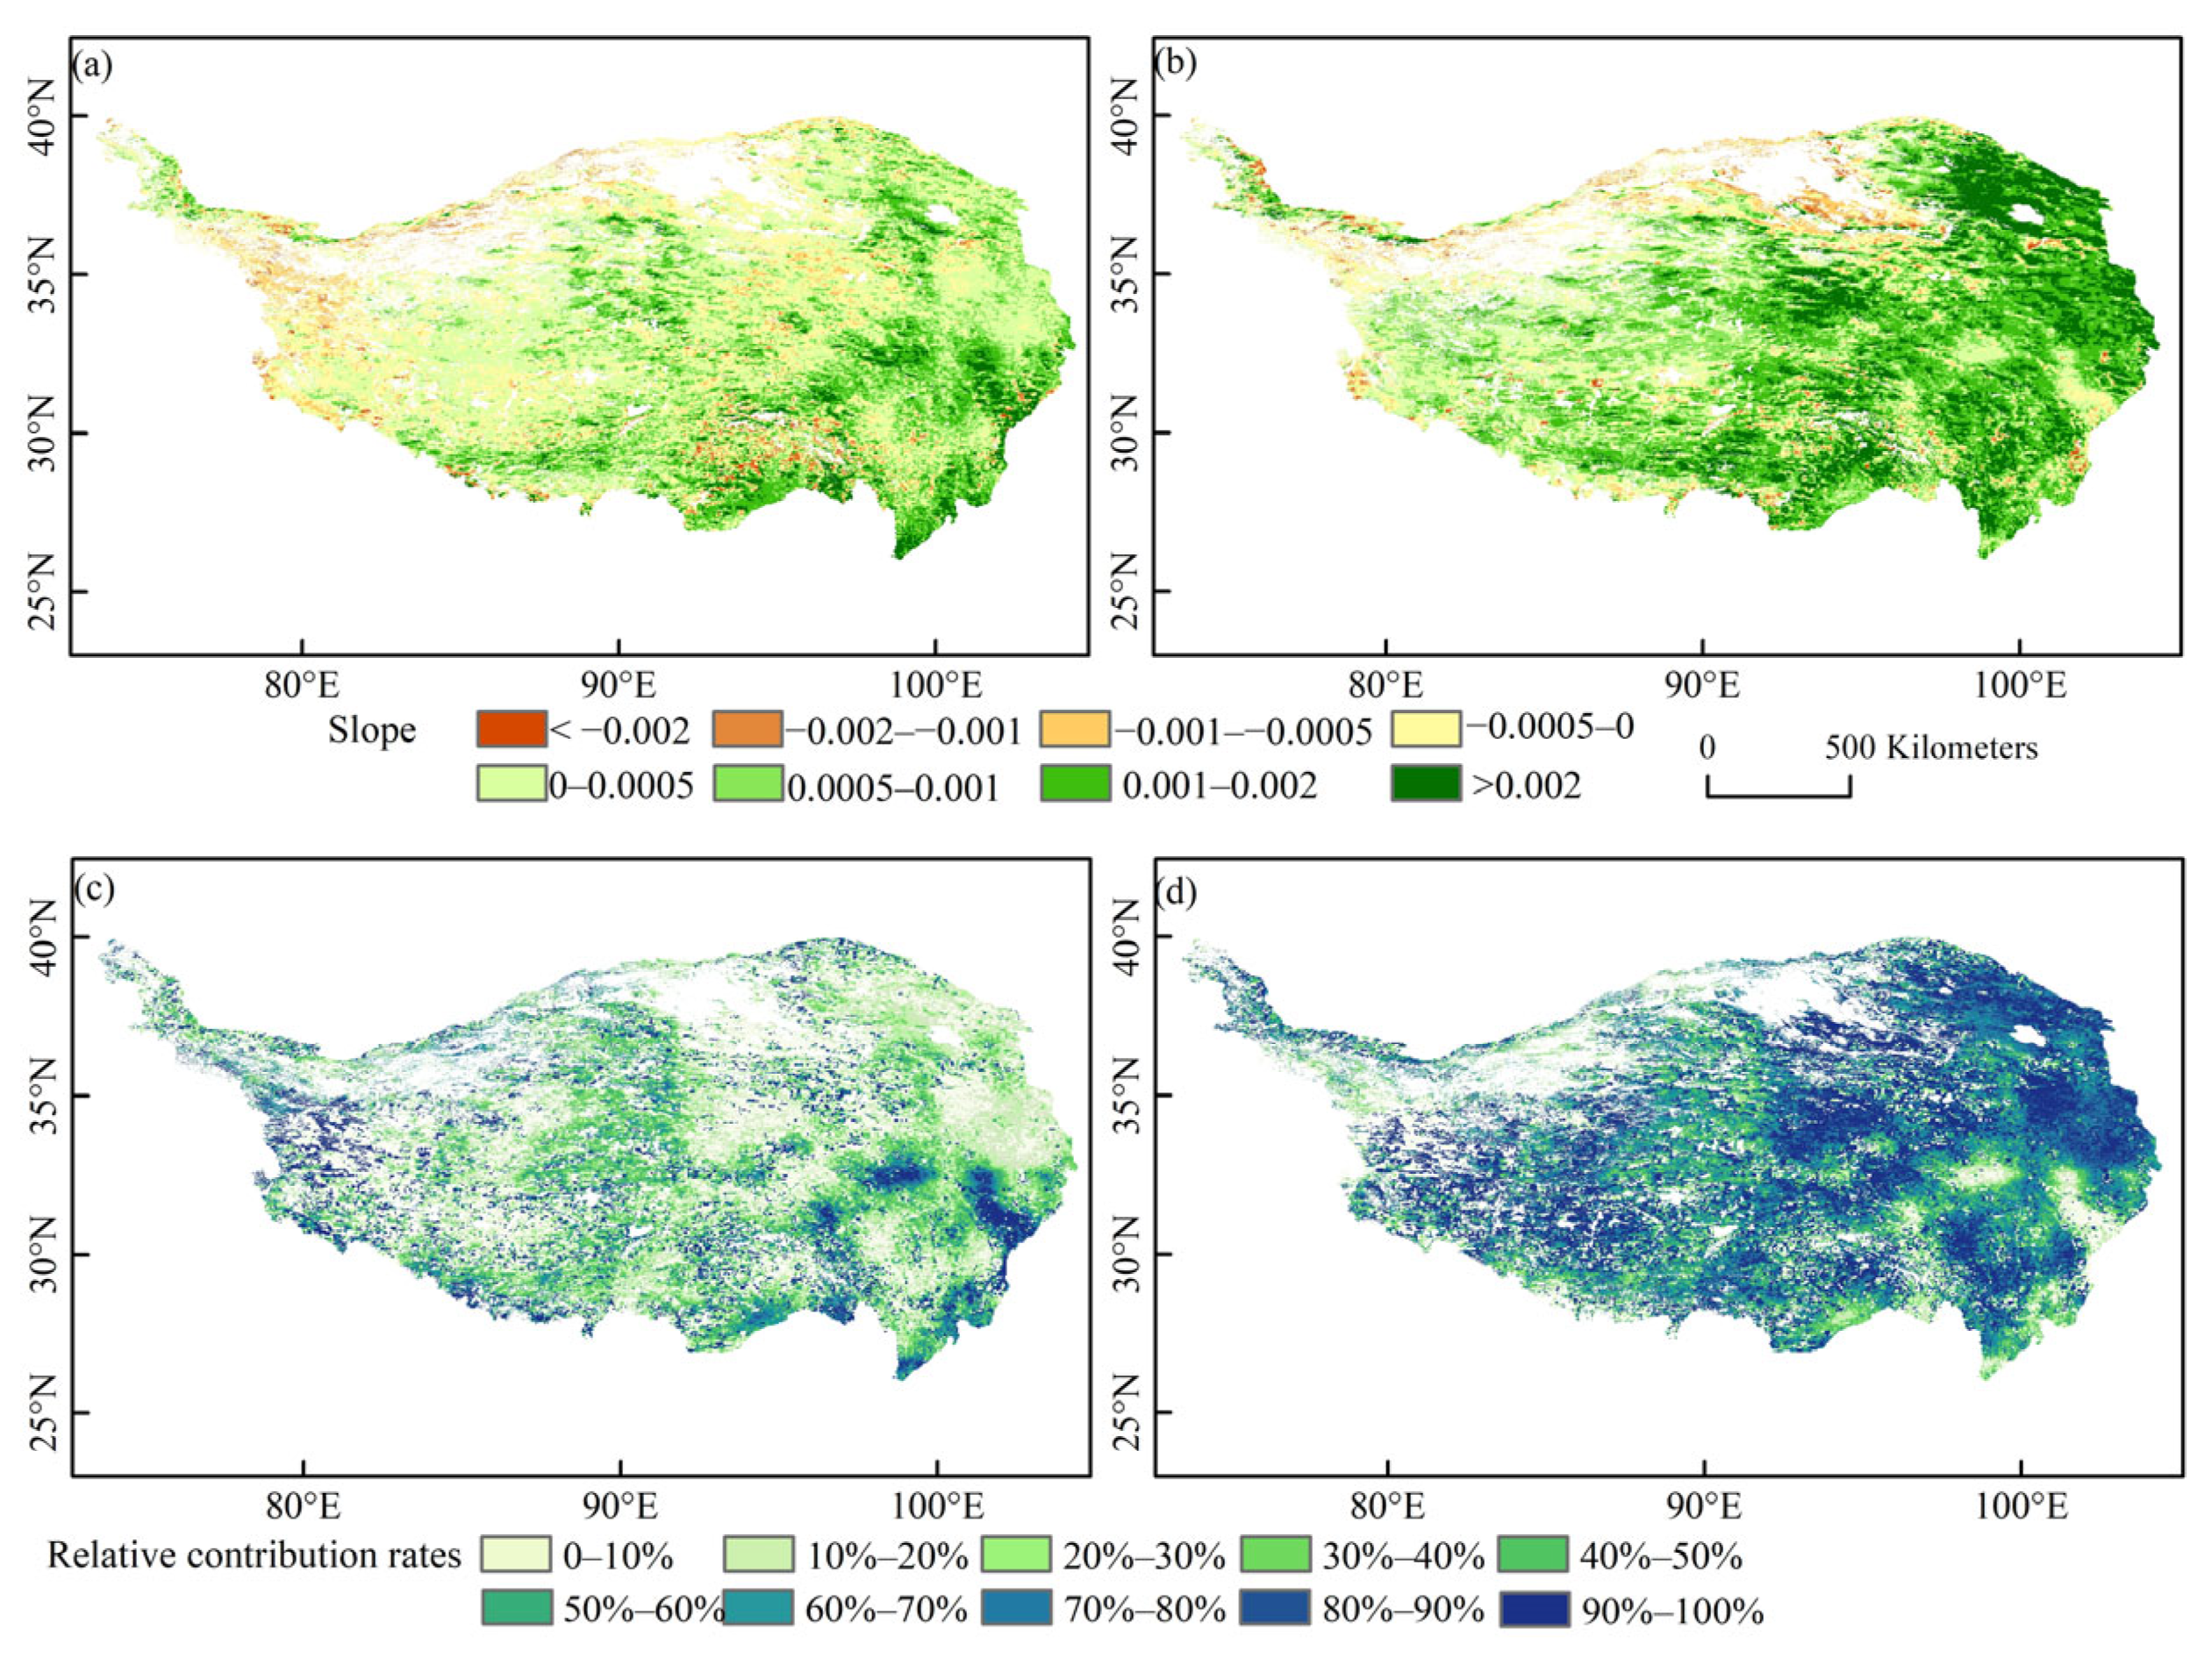
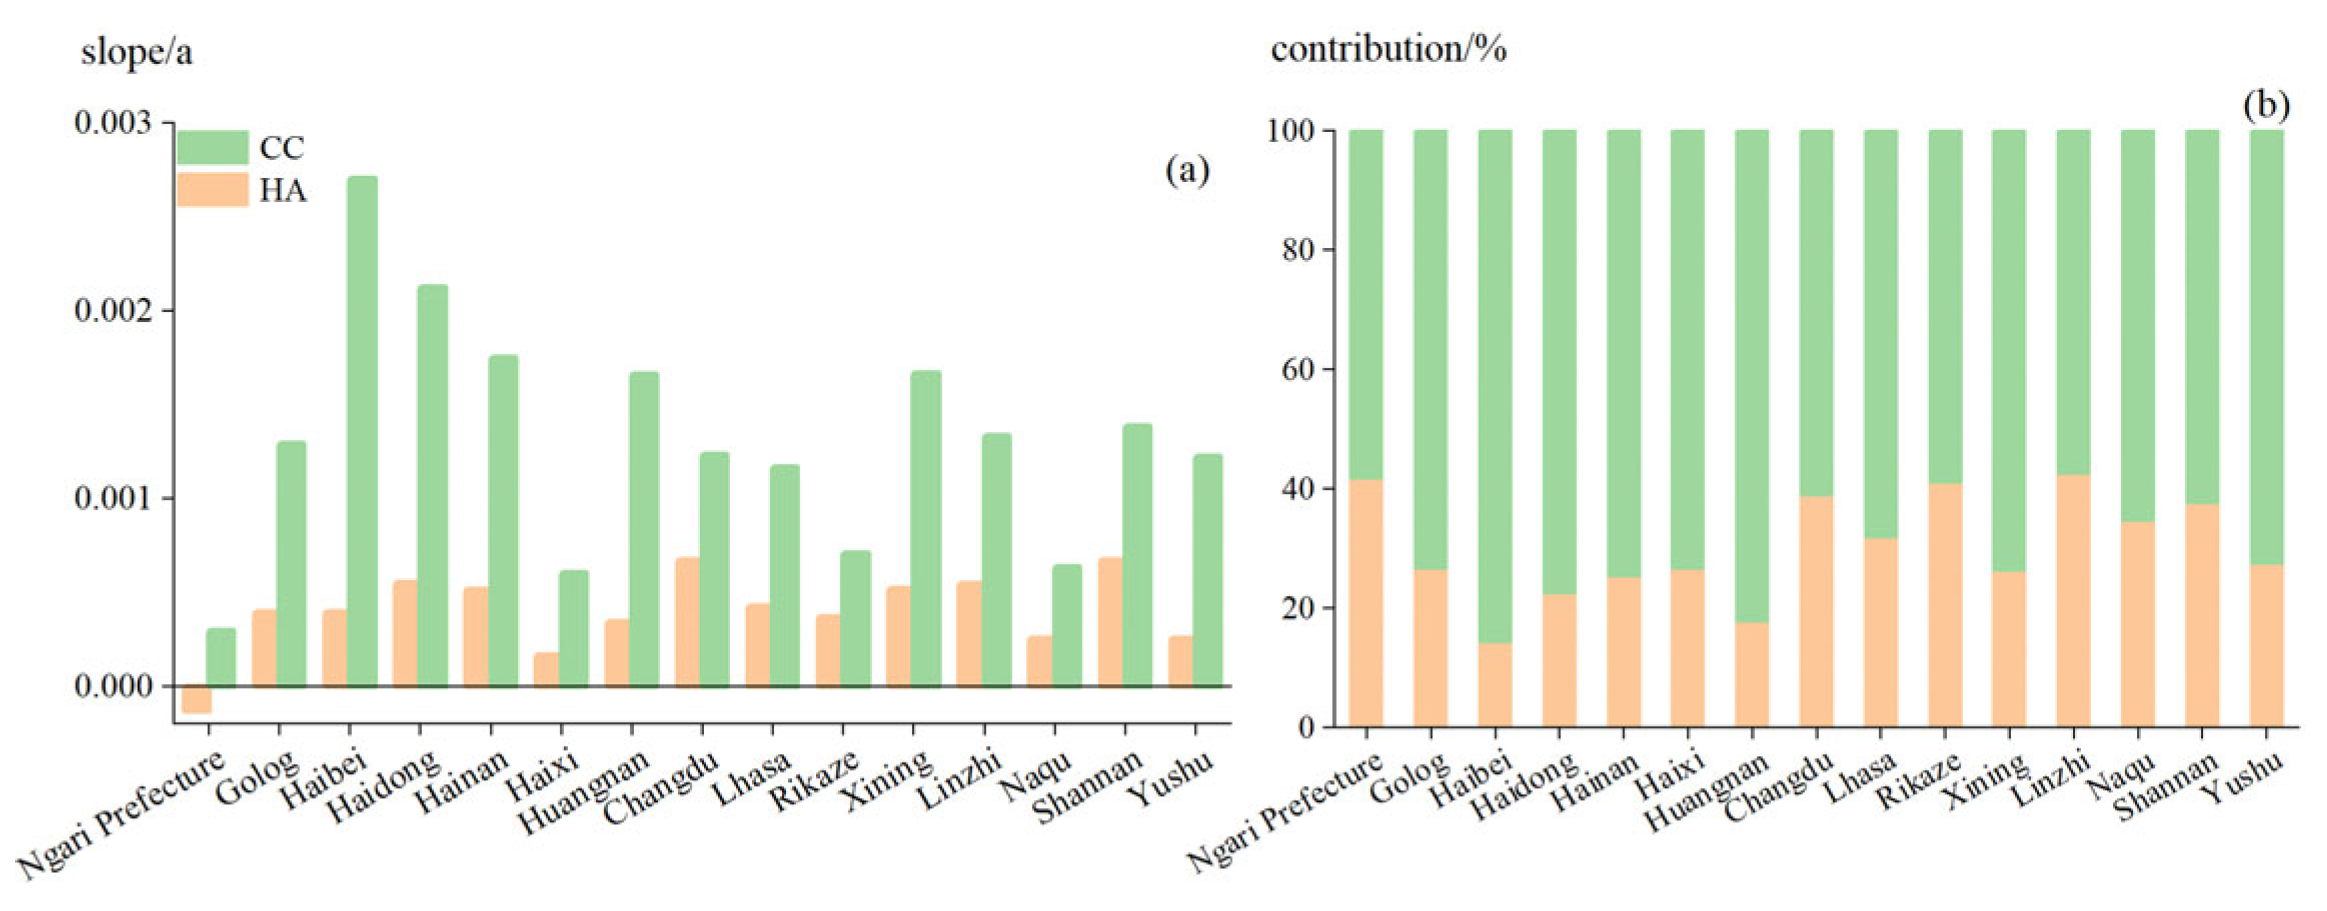
3.4. Contribution of HA and CC to NDVI Change
4. Discussion
4.1. Vegetation and Climate Change
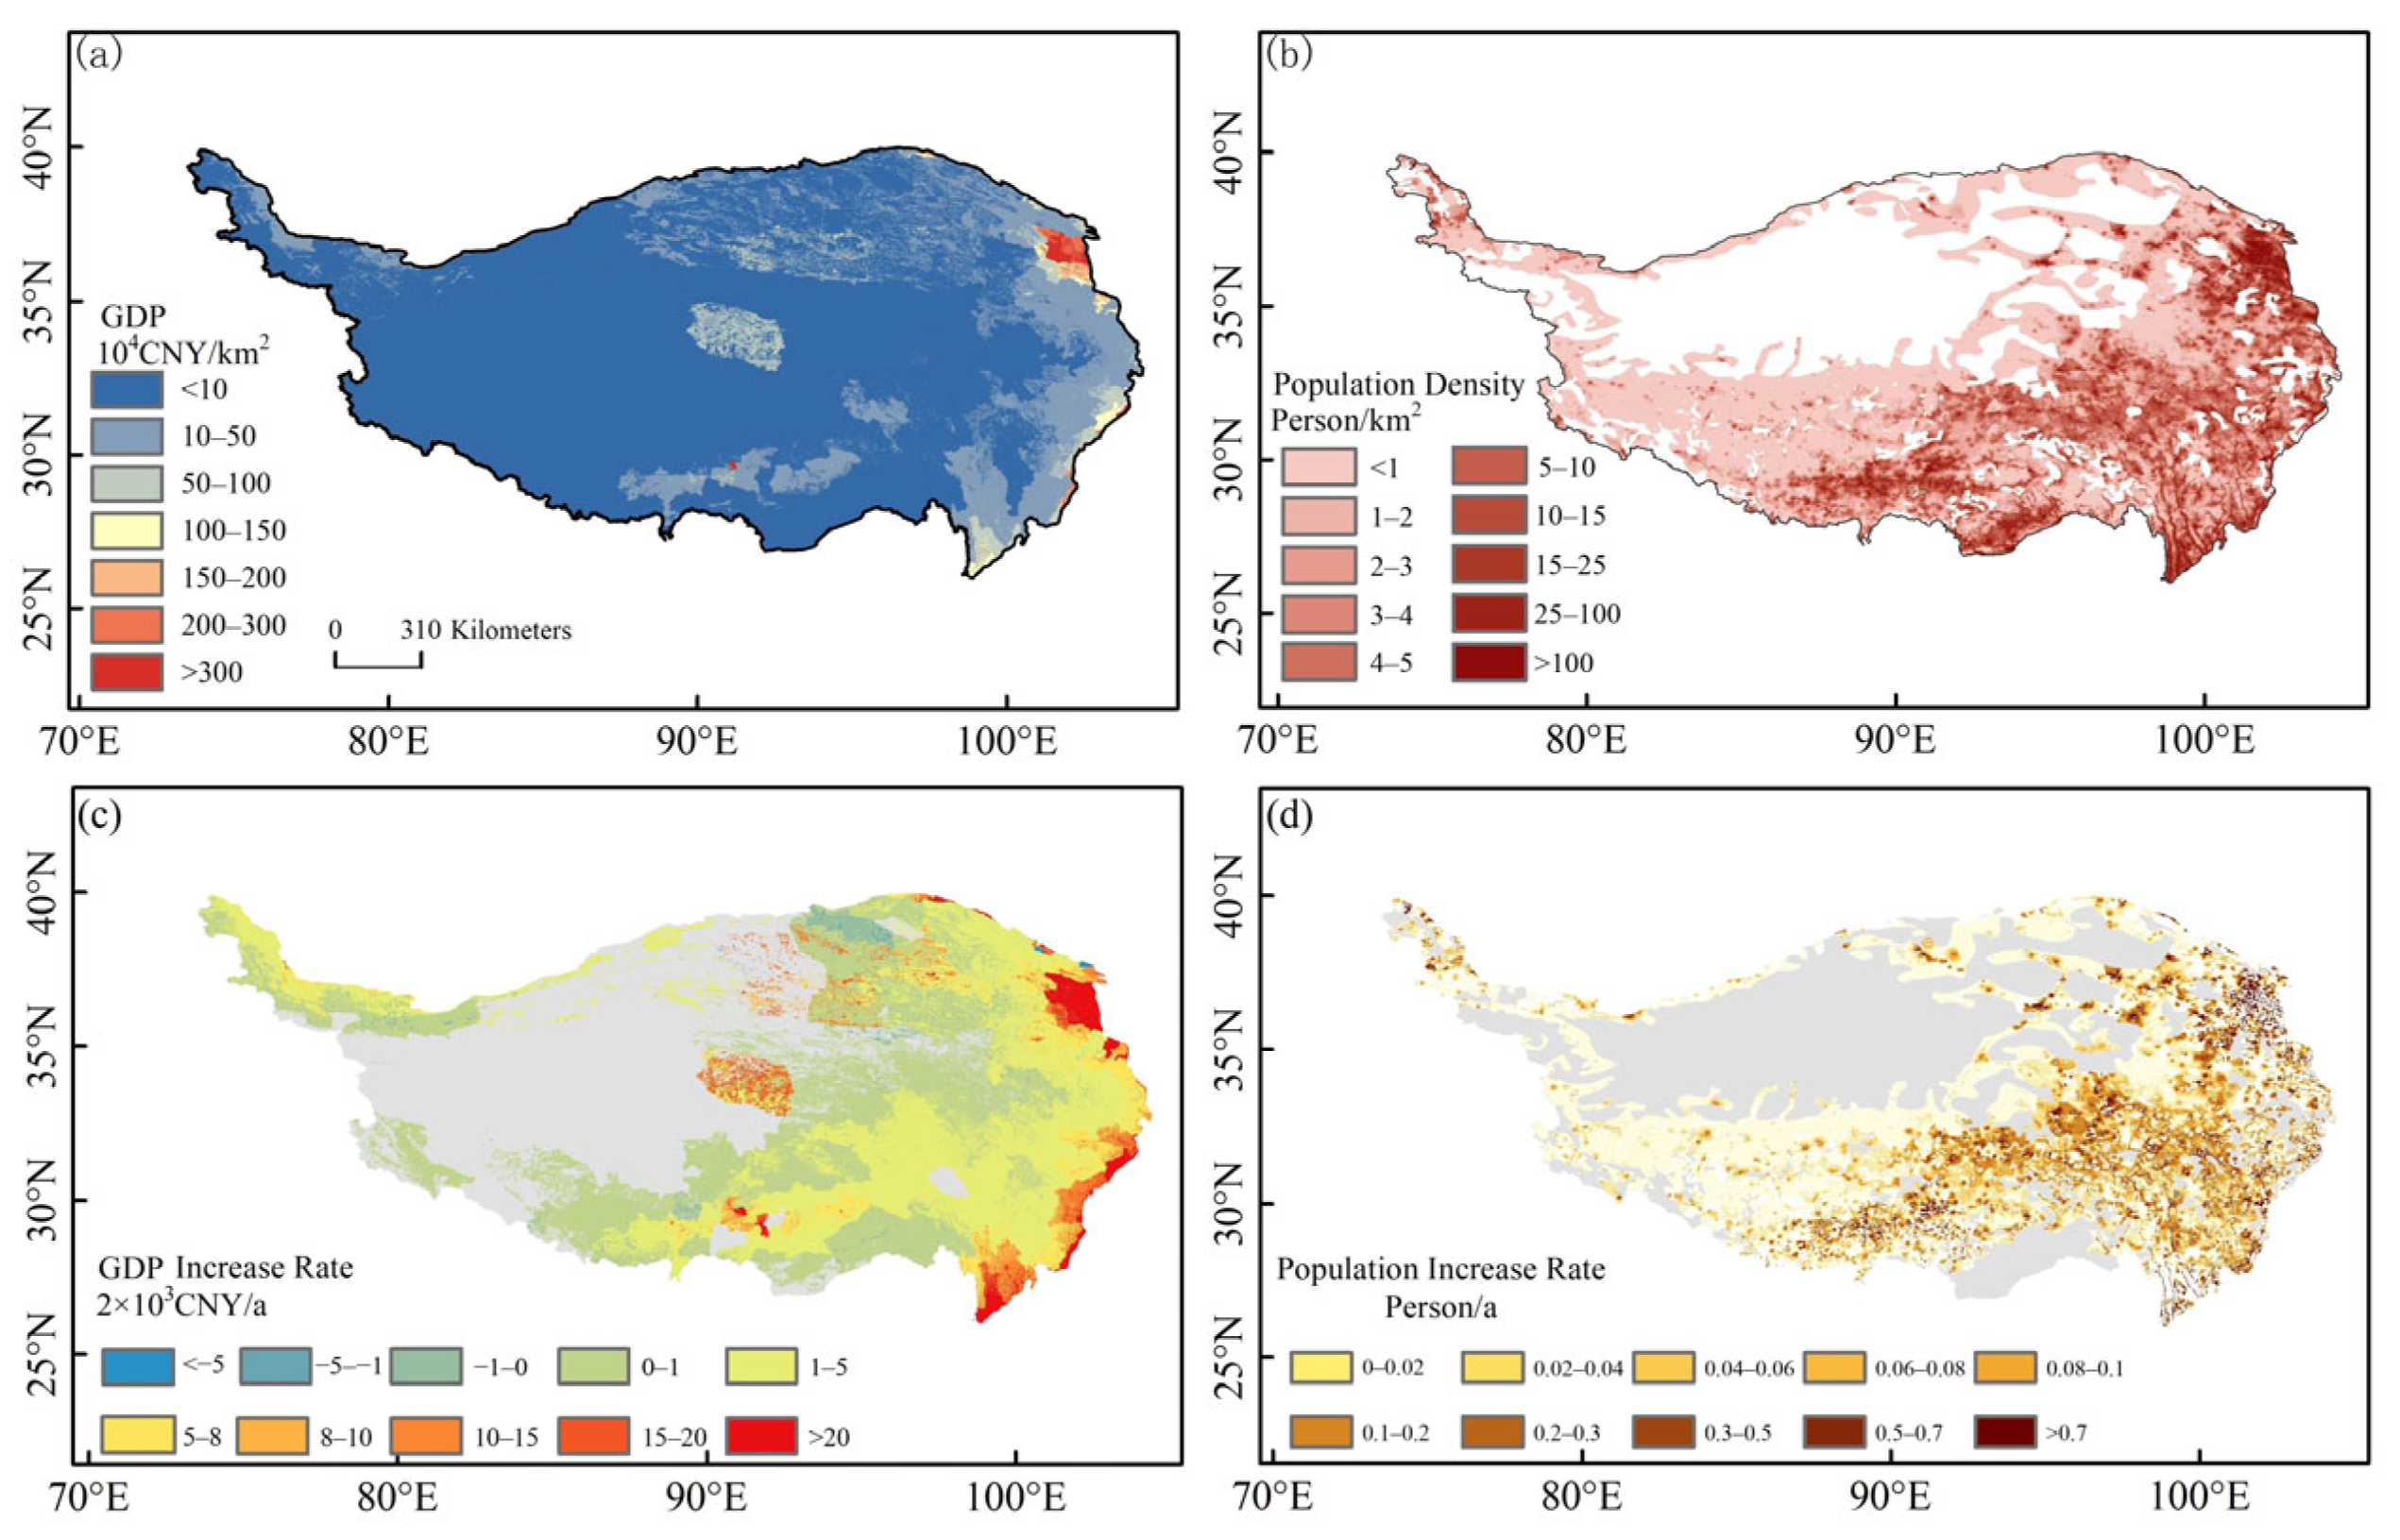
4.2. Human Drivers
4.3. Limitations
5. Conclusions
Author Contributions
Funding
Data Availability Statement
Conflicts of Interest
References
- IPCC. Climate Change 2021: The Physical Science Basis; Contribution of Working Group I to the Sixth Assessment Report of the Intergovernmental Panel on Climate Change; Cambridge University Press: Cambridge, UK; New York, NY, USA, 2021. [Google Scholar]
- Kong, D.; Zhang, Q.; Singh, V.P.; Shi, P. Seasonal vegetation response to climate change in the Northern Hemisphere (1982–2013). Glob. Planet. Chang. 2017, 148, 1–8. [Google Scholar] [CrossRef]
- Zhang, Z.; Chang, J.; Xu, C.-Y.; Zhou, Y.; Wu, Y.; Chen, X.; Jiang, S.; Duan, Z. The response of lake area and vegetation cover variations to climate change over the Qinghai-Tibetan Plateau during the past 30years. Sci. Total Environ. 2018, 635, 443–451. [Google Scholar] [CrossRef] [PubMed]
- Zhang, Q.; Shen, Z.; Pokhrel, Y.; Farinotti, D.; Singh, V.P.; Xu, C.-Y.; Wu, W.; Wang, G. Oceanic climate changes threaten the sustainability of Asia’s water tower. Nature 2023, 615, 87–93. [Google Scholar] [CrossRef]
- Chen, D.; Xu, B.; Yao, T.; Guo, Z.; Cui, P.; Chen, F.; Zhang, T. Assessment of past, present and future environmental changes on the Tibetan Plateau. Chin. Sci. Bull. 2015, 60, 1–2+3025–3035. [Google Scholar]
- Kuang, X.; Jiao, J.J. Atmospheres: JGR. Review on climate change on the Tibetan Plateau during the last half century. J. Geophys. Res. D. Atmos. JGR 2016, 121, 3979–4007. [Google Scholar] [CrossRef]
- Pauli, H.; Gottfried, M.; Reiter, K.; Klettner, C.; Grabherr, G. Signals of range expansions and contractions of vascular plants in the high Alps: Observations (1994–2004) at the GLORIA * master site Schrankogel, Tyrol, Austria. Glob. Chang. Biol. 2007, 13, 147–156. [Google Scholar] [CrossRef]
- Huss, M.; Hock, R. Global-scale hydrological response to future glacier mass loss. Nat. Clim. Chang. 2018, 8, 135–140. [Google Scholar] [CrossRef]
- Shen, M.; Piao, S.; Jeong, S.-J.; Zhou, L.; Zeng, Z.; Ciais, P.; Chen, D.; Huang, M.; Jin, C.-S.; Li, L.Z.X.; et al. Evaporative cooling over the Tibetan Plateau induced by vegetation growth. Proc. Natl. Acad. Sci. USA 2015, 112, 9299–9304. [Google Scholar] [CrossRef]
- National Bureau of Statistics of China. China Statistics Yearbook; China Statistics Press: Beijing, China, 2020. [Google Scholar]
- Bao, C.; Liu, R. Spatiotemporal Evolution of the Urban System in the Tibetan Plateau. J. Geo-Inf. Sci. 2019, 21, 1330–1340. [Google Scholar]
- Pang, G.; Wang, X.; Yang, M. Using the NDVI to identify variations in, and responses of, vegetation to climate change on the Tibetan Plateau from 1982 to 2012. Quat. Int. 2016, 444, 87–96. [Google Scholar] [CrossRef]
- Li, L.; Zhang, Y.; Liu, L.; Wu, J.; Wang, Z.; Li, S.; Zhang, H.; Zu, J.; Ding, M.; Paudel, B. Spatiotemporal Patterns of Vegetation Greenness Change and Associated Climatic and Anthropogenic Drivers on the Tibetan Plateau during 2000–2015. Remote Sens. 2018, 10, 1525. [Google Scholar] [CrossRef]
- Fu, B.J.; Ouyang, Z.Y.; Shi, P.; Fan, J.; Wang, X.D.; Zheng, H.; Zhao, W.; Wu, F. Current Condition and Protection Strategies of Qinghai-Tibet Plateau Ecological Security Barrier. Bull. Chin. Acad. Sci. 2021, 36, 1298–1306. [Google Scholar]
- Yang, Y.; Wu, L.; Lin, Q.; Yuan, M.; Xu, D.; Yu, H.; Hu, Y.; Duan, J.; Li, X.; He, Z.; et al. Responses of the functional structure of soil microbial community to livestock grazing in the Tibetan alpine grassland. Glob. Chang. Biol. 2013, 19, 637–648. [Google Scholar] [CrossRef] [PubMed]
- Huang, K.; Zhang, Y.; Zhu, J.; Liu, Y.; Zu, J.; Zhang, J. The Influences of Climate Change and Human Activities on Vegetation Dynamics in the Qinghai-Tibet Plateau. Remote Sens. 2016, 8, 876. [Google Scholar] [CrossRef]
- Lehnert, L.W.; Wesche, K.; Trachte, K.; Reudenbach, C.; Bendix, J. Climate variability rather than overstocking causes recent large scale cover changes of Tibetan pastures. Sci. Rep. 2016, 6, 24367. [Google Scholar] [CrossRef] [PubMed]
- Xiong, Q.; Xiao, Y.; Liang, P.; Li, L.; Zhang, L.; Li, T.; Pan, K.; Liu, C. Trends in climate change and human interventions indicate grassland productivity on the Qinghai–Tibetan Plateau from 1980 to 2015. Ecol. Indic. 2021, 129, 108010. [Google Scholar] [CrossRef]
- Wei, Y.; Lu, H.; Wang, J.; Wang, X.; Sun, J. Dual Influence of Climate Change and Anthropogenic Activities on the Spatiotemporal Vegetation Dynamics Over the Qinghai-Tibetan Plateau From 1981 to 2015. Earth’s Future 2022, 10, e2021EF002566. [Google Scholar] [CrossRef]
- Fensholt, R.; Proud, S.R. Evaluation of Earth Observation based global long term vegetation trends—Comparing GIMMS and MODIS global NDVI time series. Remote Sens. Environ. 2012, 119, 131–147. [Google Scholar] [CrossRef]
- Wang, X.; Xiao, J.; Li, X.; Cheng, G.; Ma, M.; Che, T.; Dai, L.; Wang, S.; Wu, J. No Consistent Evidence for Advancing or Delaying Trends in Spring Phenology on the Tibetan Plateau. J. Geophys. Res. Biogeosci. 2017, 122, 3288–3305. [Google Scholar] [CrossRef]
- Wang, H.; Zhan, J.; Wang, C.; Liu, W.; Yang, Z.; Liu, H.; Bai, C. Greening or browning? The macro variation and drivers of different vegetation types on the Qinghai-Tibetan Plateau from 2000 to 2021. Front. Plant Sci. 2022, 13, 1045290. [Google Scholar] [CrossRef]
- Ran, Q.; Hao, Y.; Xia, A.; Liu, W.; Hu, R.; Cui, X.; Xue, K.; Song, X.; Xu, C.; Ding, B.; et al. Quantitative Assessment of the Impact of Physical and Anthropogenic Factors on Vegetation Spatial-Temporal Variation in Northern Tibet. Remote Sens. 2019, 11, 1183. [Google Scholar] [CrossRef]
- Wang, Y.; Lv, W.; Xue, K.; Wang, S.; Zhang, L.; Hu, R.; Zeng, H.; Xu, X.; Li, Y.; Jiang, L.; et al. Grassland changes and adaptive management on the Qinghai–Tibetan Plateau. Nat. Rev. Earth Environ. 2022, 3, 668–683. [Google Scholar] [CrossRef]
- Lou, P.; Wu, T.; Yang, S.; Wu, X.; Chen, J.; Zhu, X.; Chen, J.; Lin, X.; Li, R.; Shang, C.; et al. Deep learning reveals rapid vegetation greening in changing climate from 1988 to 2018 on the Qinghai-Tibet Plateau. Ecol. Indic. 2023, 148, 110020. [Google Scholar] [CrossRef]
- Bai, Y.; Guo, C.; Degen, A.A.; Ahmad, A.A.; Wang, W.; Zhang, T.; Li, W.; Ma, L.; Huang, M.; Zeng, H.; et al. Climate warming benefits alpine vegetation growth in Three-River Headwater Region, China. Sci. Total Environ. 2020, 742, 140574. [Google Scholar] [CrossRef]
- Kong, R.; Zhang, Z.; Zhang, F.; Tian, J.; Chang, J.; Jiang, S.; Zhu, B.; Chen, X. Increasing carbon storage in subtropical forests over the Yangtze River basin and its relations to the major ecological projects. Sci. Total Environ. 2020, 709, 136163. [Google Scholar] [CrossRef]
- Liu, E.; Xiao, X.; Shao, H.; Yang, X.; Zhang, Y.; Yang, Y. Climate Change and Livestock Management Drove Extensive Vegetation Recovery in the Qinghai-Tibet Plateau. Remote Sens. 2021, 13, 4808. [Google Scholar] [CrossRef]
- Zhu, B.; Zhang, Z.; Tian, J.; Kong, R.; Chen, X. Increasing Negative Impacts of Climatic Change and Anthropogenic Activities on Vegetation Variation on the Qinghai–Tibet Plateau during 1982–2019. Remote Sens. 2022, 14, 4735. [Google Scholar] [CrossRef]
- MCA. Brief Book of Administrative Divisions of the People’s Republic of China 2015; Ministry of Civil Affairs of the People’s Republic of China; China Cartographic Publishing House: Beijing, China, 2015. [Google Scholar]
- Cui, Q.H.; Jiang, Z.G.; Liu, J.K.; Su, J.P. A Review of the cause of rangeland degradation on Qinghai-Tibet Plateau. Pratacult. Sci. 2007, 24, 7. [Google Scholar]
- Vermote, E. NOAA Climate Data Record (CDR) of Normalized Difference Vegetation Index (NDVI); Version 5; NOAA National Centers for Environmental Information: Boulder, CO, USA, 2019. [Google Scholar] [CrossRef]
- Yang, K.; He, J. China Meteorological Forcing Dataset (1979–2018); National Tibetan Plateau Data Center: Beijing, China, 2019. [Google Scholar] [CrossRef]
- Yue, S.; Pilon, P.; Cavadias, G. Power of the Mann–Kendall and Spearman’s rho tests for detecting monotonic trends in hydrological series. J. Hydrol. 2002, 259, 254–271. [Google Scholar] [CrossRef]
- Li, L.; Zhang, Y.; Liu, L.; Wu, J.; Li, S.; Zhang, H.; Zhang, B.; Ding, M.; Wang, Z.; Paudel, B. Current challenges in distinguishing climatic and anthropogenic contributions to alpine grassland variation on the Tibetan Plateau. Ecol. Evol. 2018, 8, 5949–5963. [Google Scholar] [CrossRef]
- Evans, J.; Geerken, R. Discrimination between climate and human-induced dryland degradation. J. Arid Environ. 2004, 57, 535–554. [Google Scholar] [CrossRef]
- Sun, W.; Song, X.; Mu, X.; Gao, P.; Wang, F.; Zhao, G. Spatiotemporal vegetation cover variations associated with climate change and ecological restoration in the Loess Plateau. Agric. For. Meteorol. 2015, 209–210, 87–99. [Google Scholar] [CrossRef]
- Ma, M.; Wang, Q.; Liu, R.; Zhao, Y.; Zhang, D. Effects of climate change and human activities on vegetation coverage change in northern China considering extreme climate and time-lag and -accumulation effects. China. Sci. Total Environ. 2022, 860, 160527. [Google Scholar] [CrossRef]
- Pan, T.; Zou, X.; Liu, Y.; Wu, S.; He, G. Contributions of climatic and non-climatic drivers to grassland variations on the Tibetan Plateau. Ecol. Eng. 2017, 108, 307–317. [Google Scholar] [CrossRef]
- Zhu, Z.; Piao, S.; Myneni, R.B.; Huang, M.; Zeng, Z.; Canadell, J.G.; Ciais, P.; Sitch, S.; Friedlingstein, P.; Arneth, A.; et al. Greening of the Earth and its drivers. Nat. Clim. Chang. 2016, 6, 791. [Google Scholar] [CrossRef]
- Sun, J.; Liu, M.; Fu, B.; Kemp, D.; Zhao, W.; Liu, G.; Han, G.; Wilkes, A.; Lu, X.; Chen, Y.; et al. Reconsidering the efficiency of grazing exclusion using fences on the Tibetan Plateau. Sci. Bull. 2020, 65, 1405–1414. [Google Scholar] [CrossRef]
- Zhou, H.; Zhou, L.; Zhao, X.; Liu, W.; Li, Y.; Gu, S.; Zhou, X. Stability of alpine meadow ecosystem on the Qinghai-Tibetan Plateau. Chin. Sci. Bull. 2006, 51, 320–327. [Google Scholar] [CrossRef]
- Ganjurjav, H.; Gao, Q.; Zhang, W.; Liang, Y.; Li, Y.; Cao, X.; Wan, Y.; Li, Y.; Danjiu, L. Effects of Warming on CO2 Fluxes in an Alpine Meadow Ecosystem on the Central Qinghai–Tibetan Plateau. PLoS ONE 2015, 10, e0132044. [Google Scholar] [CrossRef]
- Huang, S.W.; Li, X.S.; Wu, B.F.; Pei, L. The Distribution and Drivers of Land Degradation in the Three-North Shelter Forest Region of China during 1982–2006. Acta Geogr. Sin. 2012, 67, 589–598. [Google Scholar]
- Ding, J.; Yang, T.; Zhao, Y.; Liu, D.; Wang, X.; Yao, Y.; Peng, S.; Wang, T.; Piao, S. Increasingly Important Role of Atmospheric Aridity on Tibetan Alpine Grasslands. Geophys. Res. Lett. 2018, 45, 2852–2859. [Google Scholar] [CrossRef]
- Sun, J.; Hou, G.; Liu, M.; Fu, G.; Zhan, T.; Zhou, H.; Tsunekawa, A.; Haregeweyn, N. Effects of climatic and grazing changes on desertification of alpine grasslands, Northern Tibet. Ecol. Indic. 2019, 107, 105647. [Google Scholar] [CrossRef]
- Wu, J.; Wang, X. Effect of enclosure ages on community characters and biomass of the degraded alpine steppe at the northern Tibet. Acta Agrestia Sin. 2017, 25, 261–266. [Google Scholar]
- Liu, Y.; Lu, C. Quantifying Grass Coverage Trends to Identify the Hot Plots of Grassland Degradation in the Tibetan Plateau during 2000–2019. Int. J. Environ. Res. Public Health 2021, 18, 416. [Google Scholar] [CrossRef] [PubMed]


| Band | Resolution | Wavelength | Main Application |
|---|---|---|---|
| 1 | 1.09 km | 0.58–0.68 | Daytime images, vegetation, snow and ice, climate |
| 2 | 1.09 km | 0.725–1.00 | Daytime imagery, vegetation, water/road boundaries, agricultural estimate |
| 3A | 1.09 km | 1.58–1.64 | Daytime images, soil moisture, cloud and snow discrimination, drought monitoring |
| 3B | 1.09 km | 3.55–3.93 | Subsurface elevation, nighttime cloud charts, forest fires, volcanic activity |
| 4 | 1.09 km | 10.30–11.30 | Diurnal images, sea and surface temperature, soil moisture |
| 5 | 1.09 km | 11.50–12.50 | Diurnal images, sea and surface temperature, soil moisture |
| Temperature Region | Arid/Humid | Eco-Climate Zone |
|---|---|---|
| H1. Plateau sub-cold Region | B. Semi-humid region | H1B1 Guoluo-Nagqu alpine shrub meadow zone |
| C. Semi-arid region | H1C1 South Qinghai alpine steppe zone | |
| H1C2 Qutang alpine steppe zone | ||
| H1D1 Kunlun Mountain alpine desert zone | ||
| H2. Plateau temperate region | D. Arid region | H2AB1 West Sichuan alpine coniferous forest |
| AB. Humid/Sub-humid region | H2C1 East Tibet-Qilian alpine coniferous/steppe | |
| C. Semi-arid region | H2C2 South Tibet alpine shrub steppe zone | |
| H2D1 Qaidam Basin desert zone | ||
| H2D3 Ngari mountains desert zone | ||
| H3. Subtropical broadleaf evergreen forest region | H2D2 Kunlun Mountain north desert zone | |
| FNDVI | FCC | FHA | Relative Contribution Rate (%) | |
|---|---|---|---|---|
| CC | HA | |||
| >0 | >0 | >0 | ||
| >0 | <0 | 100% | 0 | |
| <0 | >0 | 0 | 100 | |
| <0 | <0 | <0 | ||
| >0 | <0 | 0 | 100% | |
| <0 | >0 | 100% | 0 | |
Disclaimer/Publisher’s Note: The statements, opinions and data contained in all publications are solely those of the individual author(s) and contributor(s) and not of MDPI and/or the editor(s). MDPI and/or the editor(s) disclaim responsibility for any injury to people or property resulting from any ideas, methods, instructions or products referred to in the content. |
© 2023 by the authors. Licensee MDPI, Basel, Switzerland. This article is an open access article distributed under the terms and conditions of the Creative Commons Attribution (CC BY) license (https://creativecommons.org/licenses/by/4.0/).
Share and Cite
Liu, Y.; Xie, Y.; Guo, Z.; Xi, G. Effects of Climate Variability and Human Activities on Vegetation Dynamics across the Qinghai–Tibet Plateau from 1982 to 2020. Remote Sens. 2023, 15, 4988. https://doi.org/10.3390/rs15204988
Liu Y, Xie Y, Guo Z, Xi G. Effects of Climate Variability and Human Activities on Vegetation Dynamics across the Qinghai–Tibet Plateau from 1982 to 2020. Remote Sensing. 2023; 15(20):4988. https://doi.org/10.3390/rs15204988
Chicago/Turabian StyleLiu, Yiyang, Yaowen Xie, Zecheng Guo, and Guilin Xi. 2023. "Effects of Climate Variability and Human Activities on Vegetation Dynamics across the Qinghai–Tibet Plateau from 1982 to 2020" Remote Sensing 15, no. 20: 4988. https://doi.org/10.3390/rs15204988
APA StyleLiu, Y., Xie, Y., Guo, Z., & Xi, G. (2023). Effects of Climate Variability and Human Activities on Vegetation Dynamics across the Qinghai–Tibet Plateau from 1982 to 2020. Remote Sensing, 15(20), 4988. https://doi.org/10.3390/rs15204988