Abstract
The point cloud-based 3D model of forest helps to understand the growth and distribution pattern of trees, to improve the fine management of forestry resources. This paper describes the process of constructing a fine rubber forest growth model map based on 3D point clouds. Firstly, a multi-scale feature extraction module within the point cloud column is used to enhance the PointPillars learning capability. The Swin Transformer module is employed in the backbone to enrich the contextual semantics and acquire global features with the self-attention mechanism. All of the rubber trees are accurately identified and segmented to facilitate single-trunk localisation and feature extraction. Then, the structural parameters of the trunks calculated by RANSAC and IRTLS cylindrical fitting methods are compared separately. A growth model map of rubber trees is constructed. The experimental results show that the precision and recall of the target detection reach 0.9613 and 0.8754, respectively, better than the original network. The constructed rubber forest information map contains detailed and accurate trunk locations and key structural parameters, which are useful to optimise forestry resource management and guide the enhancement of mechanisation of rubber tapping.
1. Introduction
Entering the era of precision agriculture, all fields of traditional agriculture have been given a new lease of life with the help of information technology and advanced equipment [1,2,3]. In modern forestry research, the study of forestry resources is of great significance. Forestry resources are not only crucial to the conservation and sustainable management of forest ecosystems but also involve a number of important environmental, economic and social areas [4,5]. Research on forestry resources not only helps to improve knowledge of the structure [6] and functioning of forest ecosystems but also contributes to optimising the sustainable use of timber resources and increasing production efficiency. This has given rise to the concept of precision forestry [7]. Precision forestry is a modern approach to forestry management that uses advanced technology and equipment to achieve high-precision measurement and the monitoring of forest resources [8]. It provides data analysis and decision support to manage forest resources in a more accurate, sustainable and efficient manner.
Natural rubber products have become an indispensable part of human life, but rubber production is still one of the few areas where mechanisation has not been achieved. The traditional method of rubber tapping operations and the lack of automated equipment have constrained the improvement of rubber production efficiency [9,10]. The use of advanced technology to study rubber forest resources and map trunk information not only helps the positioning and navigation of operating vehicles but also enables rational planning and optimisation of production rhythms and improves the resource management and monitoring of rubber forests. In a standard rubber plantation, the dense branches and leaves of rubber trees will weaken the signals of positioning sensors such as RTK-GNSS. A 3D laser point cloud-based mapping method is thus a very suitable choice [11].
3D LiDAR has a wide range of applications in forestry research. With the help of 3D LIDAR, the height, diameter and other structural information of trees can be accurately measured, to realise forest inventory and health monitoring [12,13,14]. At the same time, it can generate a 3D model of the forest structure, including tree distribution, density and spatial distribution, to deepen the understanding of the forest structure. In 3D reconstruction, the accurate detection of the target crop is a key step in building a fine map [15]. With the breakthrough progress of artificial intelligence, especially deep learning technology, the field of 3D target detection has made great progress. A large number of 3D target detection algorithms based on LiDAR have been proposed [16,17].
Xia et al. [18] proposed a single tree species point cloud extraction method combining deep semantic segmentation and clustering. The deep semantic segmentation network Improved-RandLA-Net developed based on RandLA-Net is used firstly. Subsequently, the clustering method is used to extract a single tree point cloud from the segmented point cloud. The experimental results show that the proposed method can effectively extract single-tree point clouds in complex scenes. Wielgosz et al. [19] present Point2Tree, a modular and versatile framework. A three-layer approach including semantic segmentation, instance segmentation, and hyper-parameter optimisation analysis is used, aiming to deal with laser point clouds in forestry. The modular design of the framework enables it to handle different point cloud densities and terrestrial laser scanning data types. And Eysn et al. [20] benchmarked and investigated eight airborne laser scanning (ALS)-based single-tree detection methods. The restricted nearest neighbour detection methods were used to automatically match detection results to accurate field forest resource data and evaluate the results in a repeatable manner. This study provides new insights into the potential and limitations of using ALS for tree detection.
There are fewer direct studies on the 3D reconstruction of rubber trees. The novelty of this paper lies in the computation of the structural parameters of tree trunks from the 3D point cloud, and the study of growth modelling of rubber forests in terms of target detection and feature extraction. The main contributions of this paper can be summarised as follows. Firstly, the original PointPillars network is improved to enhance the feature extraction capability in complex unstructured environments. Secondly, a map construction method for forestry growth models based on trunk fitting is constructed and evaluated for its accuracy.
The rest of the paper is structured as follows. Section 2 describes the process of data acquisition and improvement of the object detection network for processing. Section 3 shows the results of object detection and structural parameter computation. Section 4 presents the related discussion. Finally, Section 5 concludes the whole paper.
2. Materials and Methods
2.1. Collection of Point Clouds
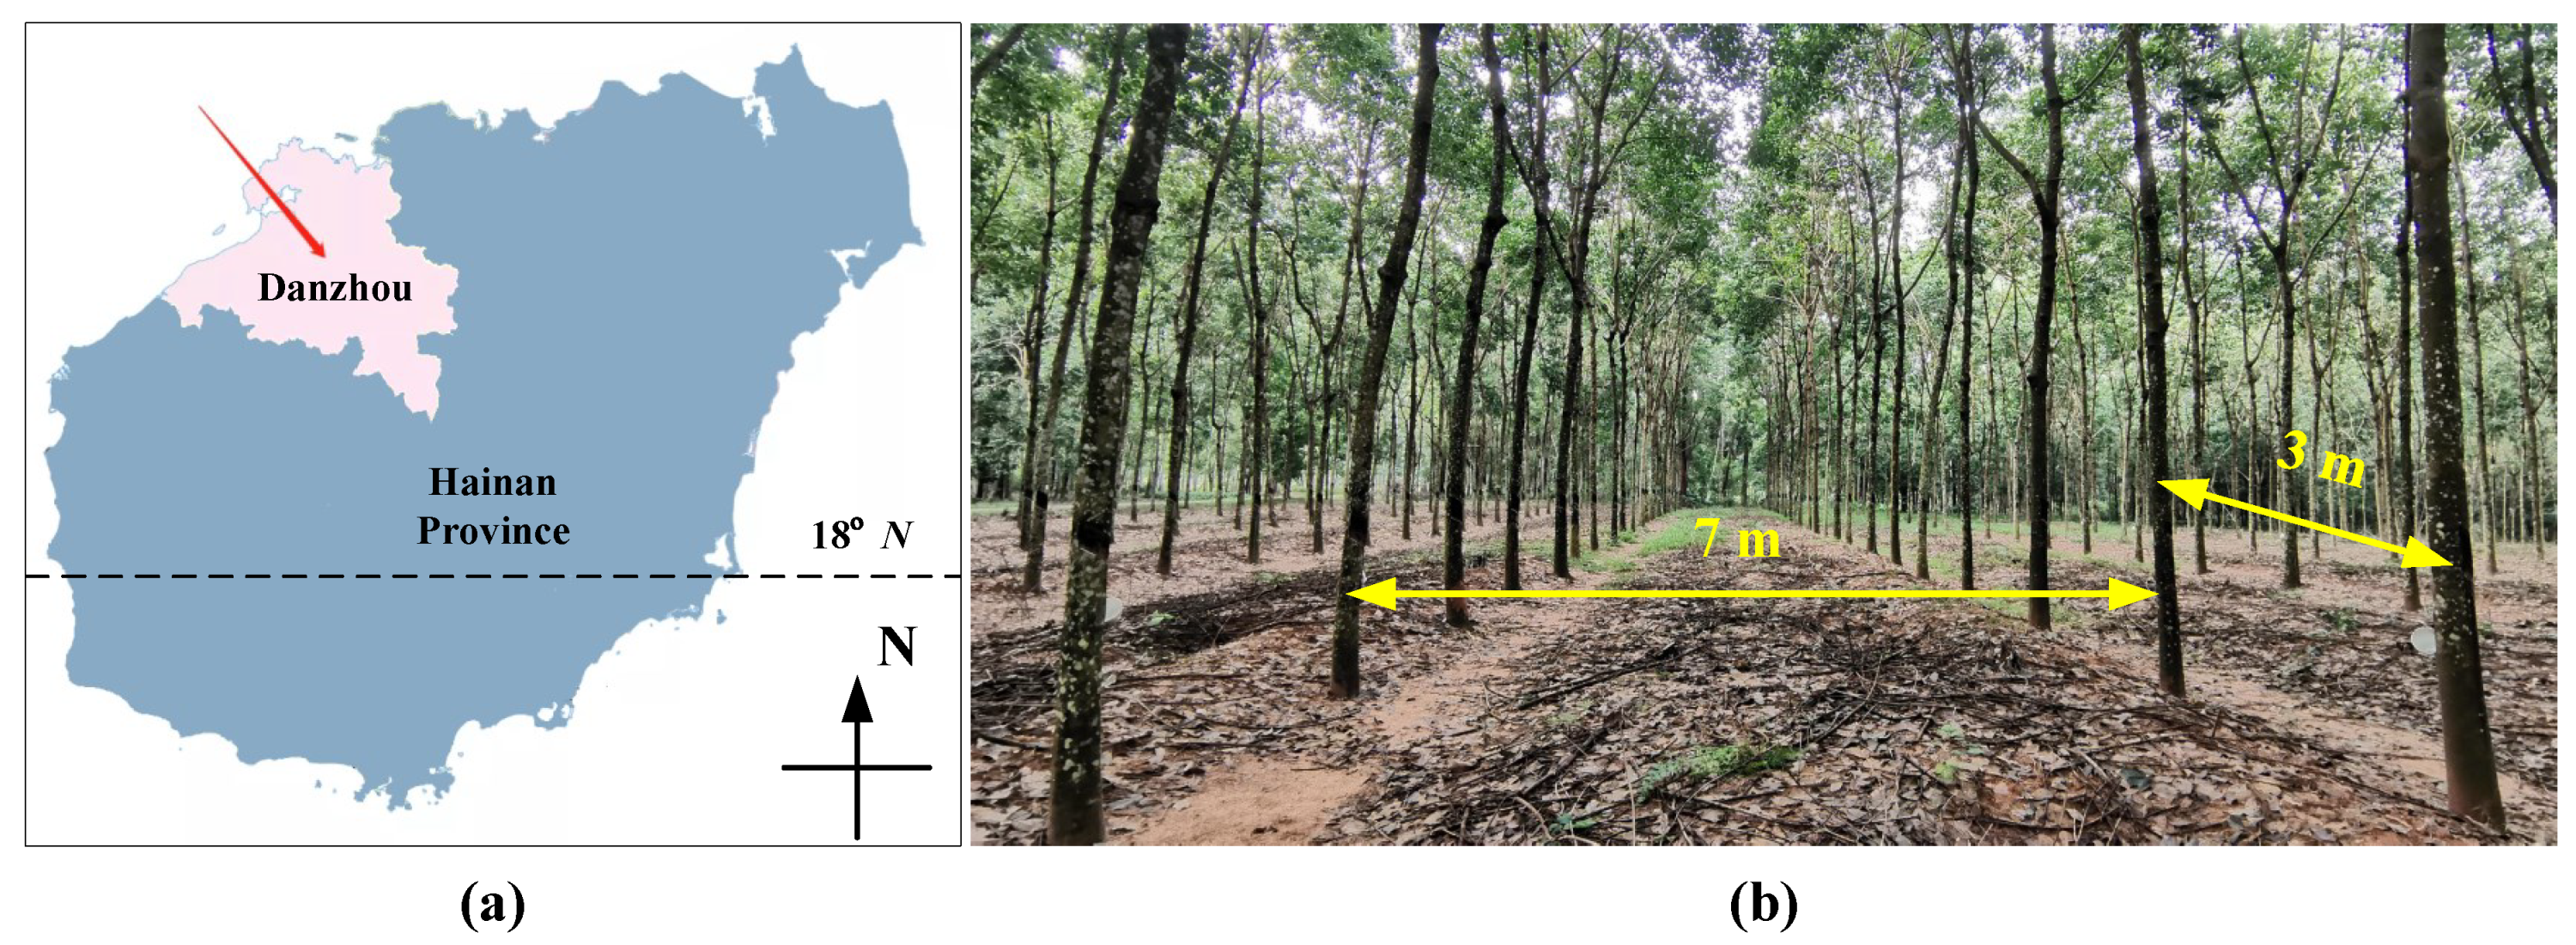
The 3D point cloud was collected from a natural rubber plantation (1092825E and 193244N) in Danzhou City, Hainan Province, China. The 18N line passes through the lower part of the province, as shown in Figure 1a. Danzhou City is located in the northwestern part of Hainan Province, adjacent to the ocean. The target rubber forest is located at Position 31901, with a total of 224 trees distributed in 8 rows on average. In particular, an identity card with the tree position and unique numbering information is mounted on each rubber tree. Figure 1b shows a localised scene of the rubber forest. The rubber trees were planted at 7 m × 3 m from 2012. The variety is Reyan 73397. Most of the trees are over 10 m in height. In addition, Hainan Province is located in a tropical area with high typhoon occurrence. Even with the protection of windbreaks, the trees are often in a leaning state.

Figure 1.
Geography of point cloud data collection. (a) Schematic location of Danzhou City. (b) A typical scene in the rubber plantation.
In order to achieve flexible point cloud data collection, a backpack-type solo data collection device was designed and constructed. As shown in Figure 2a, a laptop A42J (Asus, Taiwan, China) was placed in front of the operator to control the system and collect data. A Bluetooth IMU WT901BLE5.0C (WitMotion, Shenzhen, China) was fixed on top of the LiDAR VLP-16 (Velodyne, San Jose, CA, USA) to instantly correct the point cloud’s position (see Figure 2b). The main parameters of the 2 sensors are shown in Table 1. Figure 2c illustrates the U-shaped walking route when collecting point cloud data. The operator maintains an equidistant walk between rows as much as possible. The acquisition was performed based on ROS Melodic & Ubuntu 18.04.6 LTS, and the LOAM-SLAM algorithm was used for initial map building.
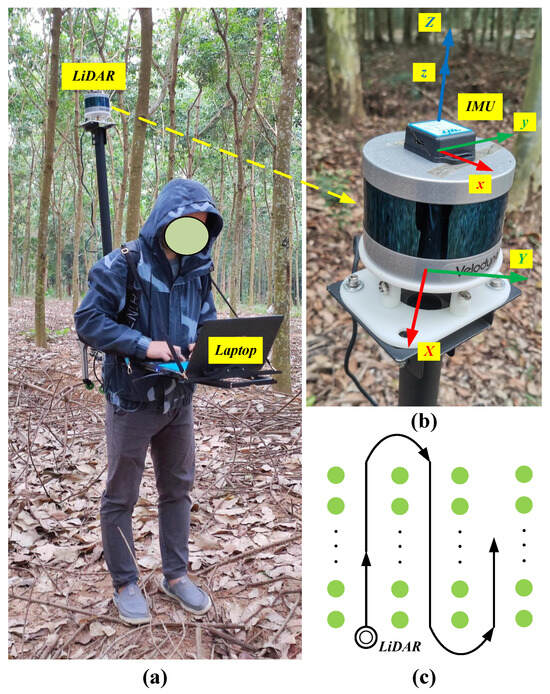
Figure 2.
Scene of manual collection of LiDAR point cloud data in the rubber forest. (a) Scenario of manually carrying point cloud data collection equipment. (b) A close-up of the 3D LIDAR and IMU. The definition of the coordinate system of the two sensors themselves is shown. (c) Schematic diagram of U-walking in the rubber forest.

Table 1.
Key parameters of LiDAR and IMU.
2.2. Object Detection Algorithms
2.2.1. Data Organization
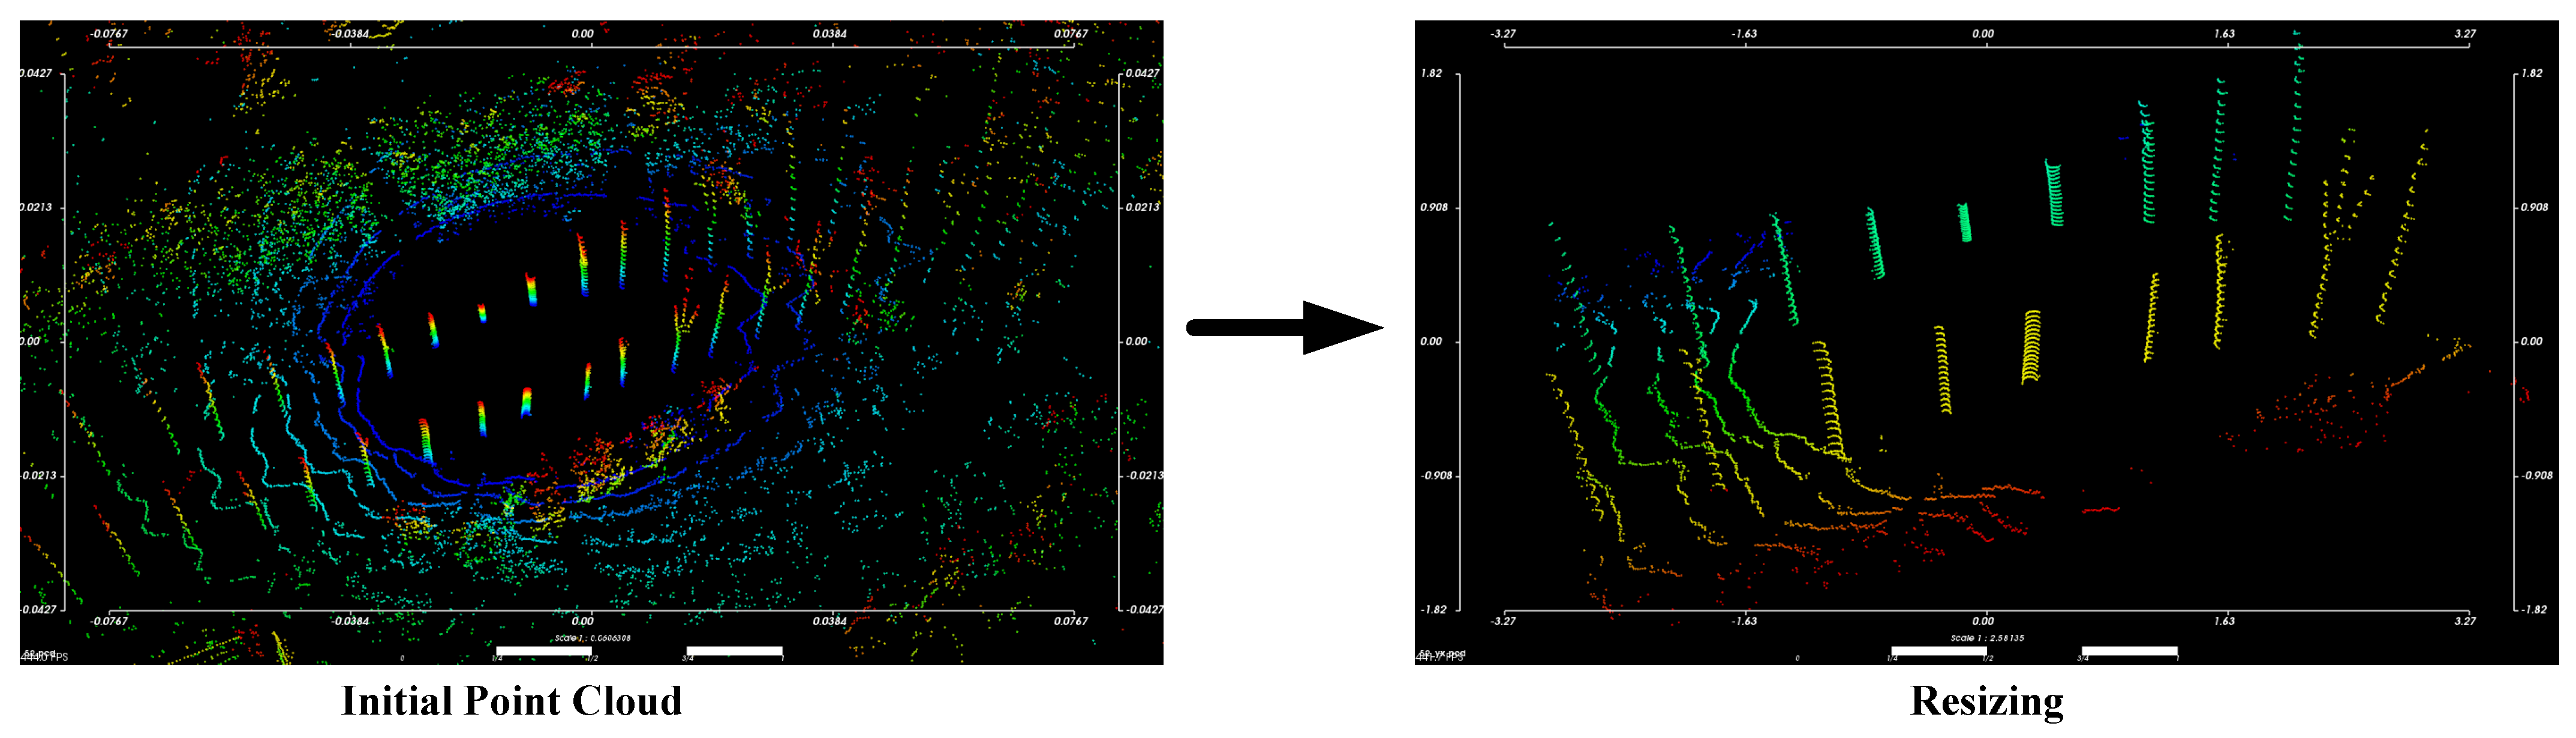
The acquired 3D point cloud data is processed for resizing and noise reduction with statistical filtering. Progressive morphological filtering is used to remove interfering objects such as the ground. Figure 3 illustrates the flow of point cloud data preprocessing.
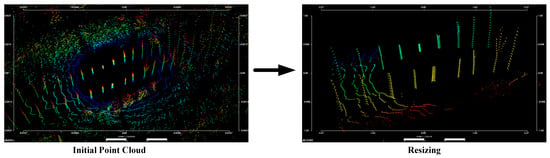
Figure 3.
Schematic diagram of the process of 3D point cloud data pre−processing.
In this study, 3D point clouds are mainly processed into the format of the KITTI dataset for target detection [21]. The part about 2D images was removed, and some adjustments were made. The processing tool is Point Cloud Library (PCL) 1.12. Then, the OpenPCDet (Open Point Cloud Detection Toolbox) framework [22,23] is employed to construct the target detection network. OpenPCDet is an open-source project that aims to provide a deep learning framework and toolset for point cloud object detection. OpenPCDet supports a wide range of point cloud object detection models. The framework provides flexible interfaces and modules to easily extend, modify and customise the algorithms. Moreover, OpenPCDet includes many features required for point cloud object-detection tasks, including data loading, data augmentation, model training and evaluation, and visualisation tools. OpenPCDet provides an open, flexible and easy-to-use toolset for the field of point cloud object detection, which can help to accelerate the development of the fields of autonomous driving, robotics and three-dimensional perception.
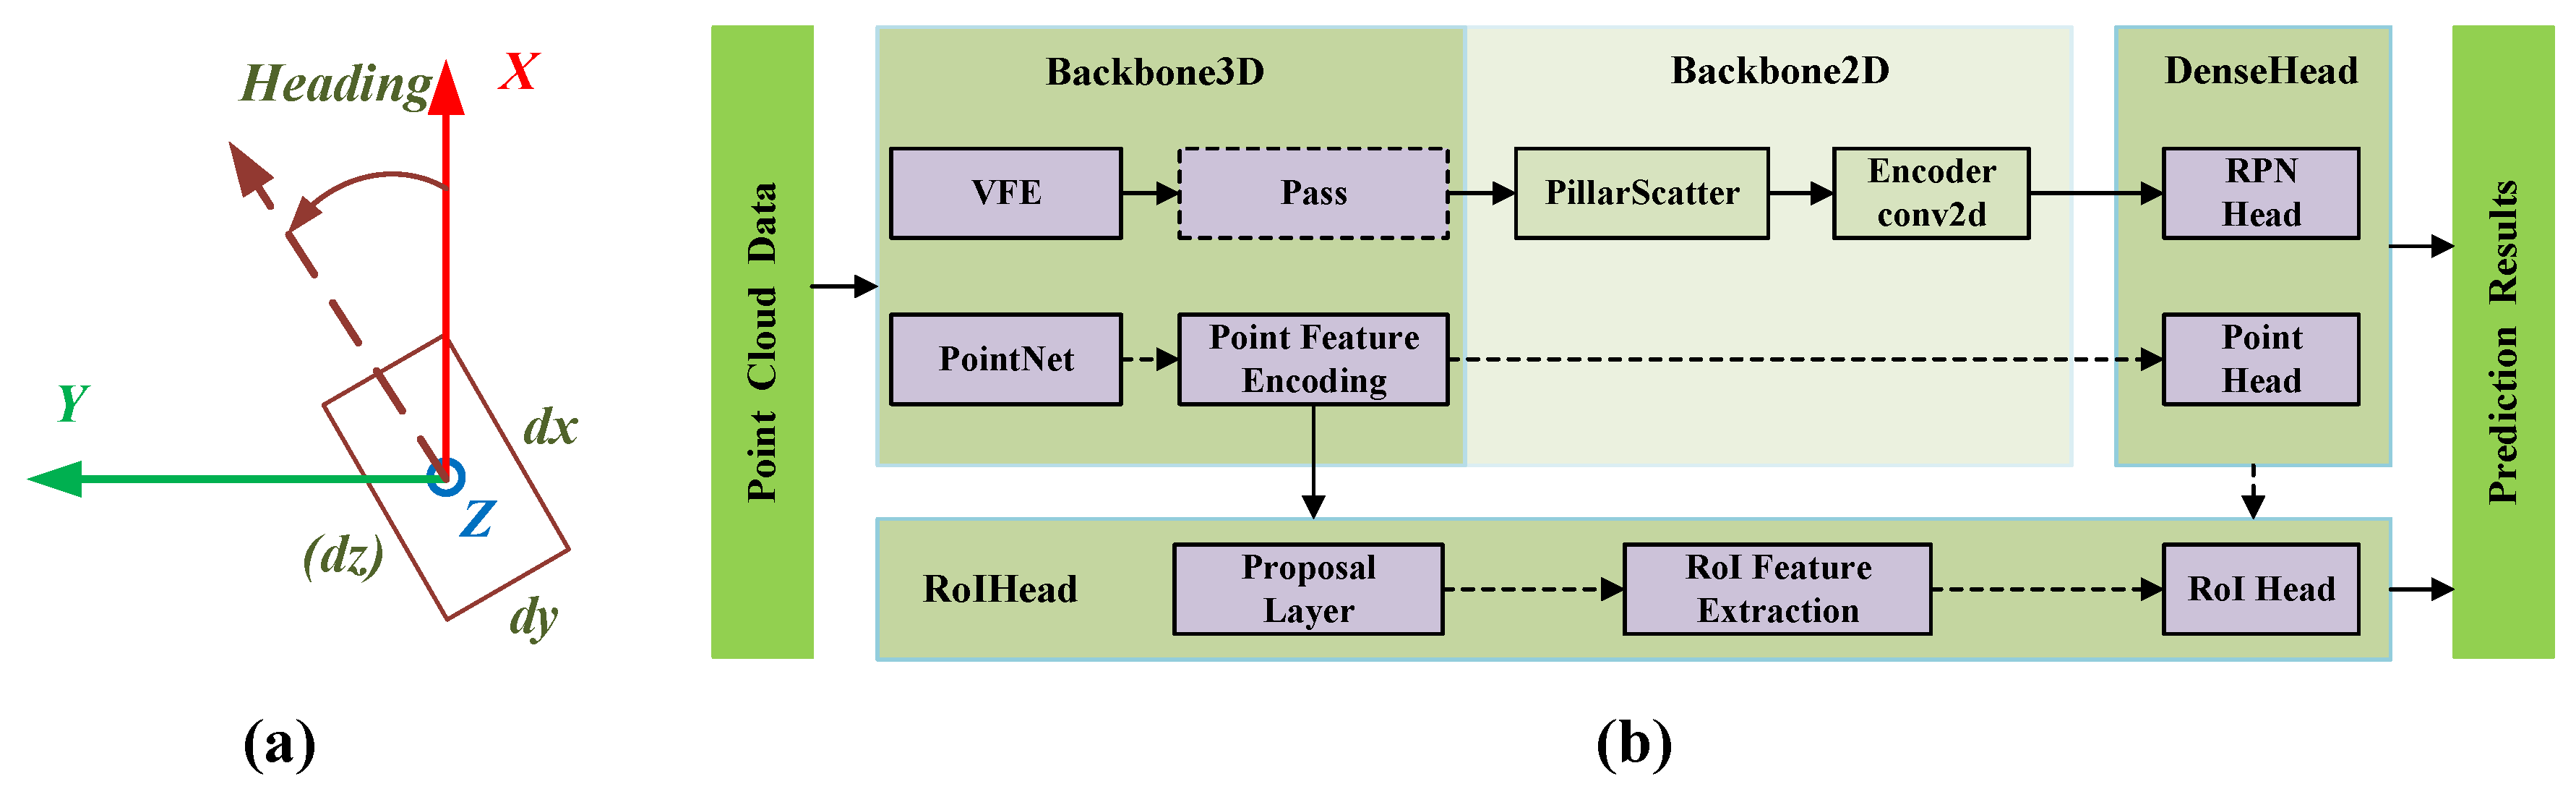
In particular, OpenPCDet defines a unified normalised 3D coordinate representation, thus completely separating the data module from the model processing module. The definition of the unified coordinate system is shown in Figure 4a. This allows for the uniform use of a normalised 3D coordinate system to process different structural models without having to pay attention to the variability of the coordinate representations of different datasets. Deep learning networks can then easily be modularly adapted and improved.

Figure 4.
Coordinate system definition and example module composition for the OpenPCDet framework. (a) Unified 3D box definition. dx, dy and dz represent the length, width and height of the 3D bounding box, respectively. Heading: positive from X-axis to Y-axis direction. (b) Module composition and computational flow of PointPillars under the OpenPCDet framework.
Figure 4b shows the flexible and comprehensive modular model topology design of OpenPCDet using PointPillars as an example. Firstly, the point cloud data (N, 3) is assigned in top view to a cubic column of equal size in the X-Y plane, which is called pillar (N, 4). Feature extraction is then performed on the pillar data. The voxel feature encoding (VFE) layer used is a simplified version of the Pointnet network. Next, the data from each pillar is put back into its original 2D coordinates. That is, a Scatter operator is used to create pseudo-images (C, H, W) by reducing the pillar to the original space according to the coordinate index. At the Densehead, the feature map is passed into the region proposal networks (RPN) to perform object detection. RoIHead is used to further classify the RoI and adjust the position and size of the rectangular box to make the prediction result more fine. Finally, the calculation of the loss function for localisation, classification and angle is performed.
Next, the 3D point cloud was labelled in the LiDAR Labeler toolbox in Matlab R2021b (MathWorks, Natick, MA, USA). All the objects in the point cloud were classified into three categories, i.e., trunks, branches and shrubs. The labelling result uses a seven-dimensional vector (, , , l, w, h, ) to represent the hand-labelled 3D bounding box, where (, , ) is the centre point of the bounding box and (l, w, h) is the length, width and height of the box. is the orientation of the target. When performing manual labelling, the object is simultaneously labelled on the main view, left view and top view. The ideal 3D bounding box should cover all the required points with minimum volume. A sum of 500 frames of point clouds were labelled. After counting, a total of 7360 trunks, 2586 branches and 3367 shrubs objects were labelled, respectively.
2.2.2. Data Augmentation
Data augmentation is an important strategy when training point cloud object detection models, which aims to improve the robustness and performance of the model by augmenting the training data with diversity and variability to make it more adaptable to different application scenarios. Depending on the specific task and dataset, different data enhancement methods can be chosen to optimise the training process of the model. In this study, several methods were chosen to increase the number of labelled data, including Gt_ Sampling, Random_World_Flipping, Random_World_Rotation and Random_World_Scaling. After testing, these approaches are more in line with the densified and disordered characteristics of rubber forest point clouds. Data augmentation makes the model more robust and generalisable when facing the position changes of the target objects in the field environment.
2.2.3. Algorithm Improvement and Training
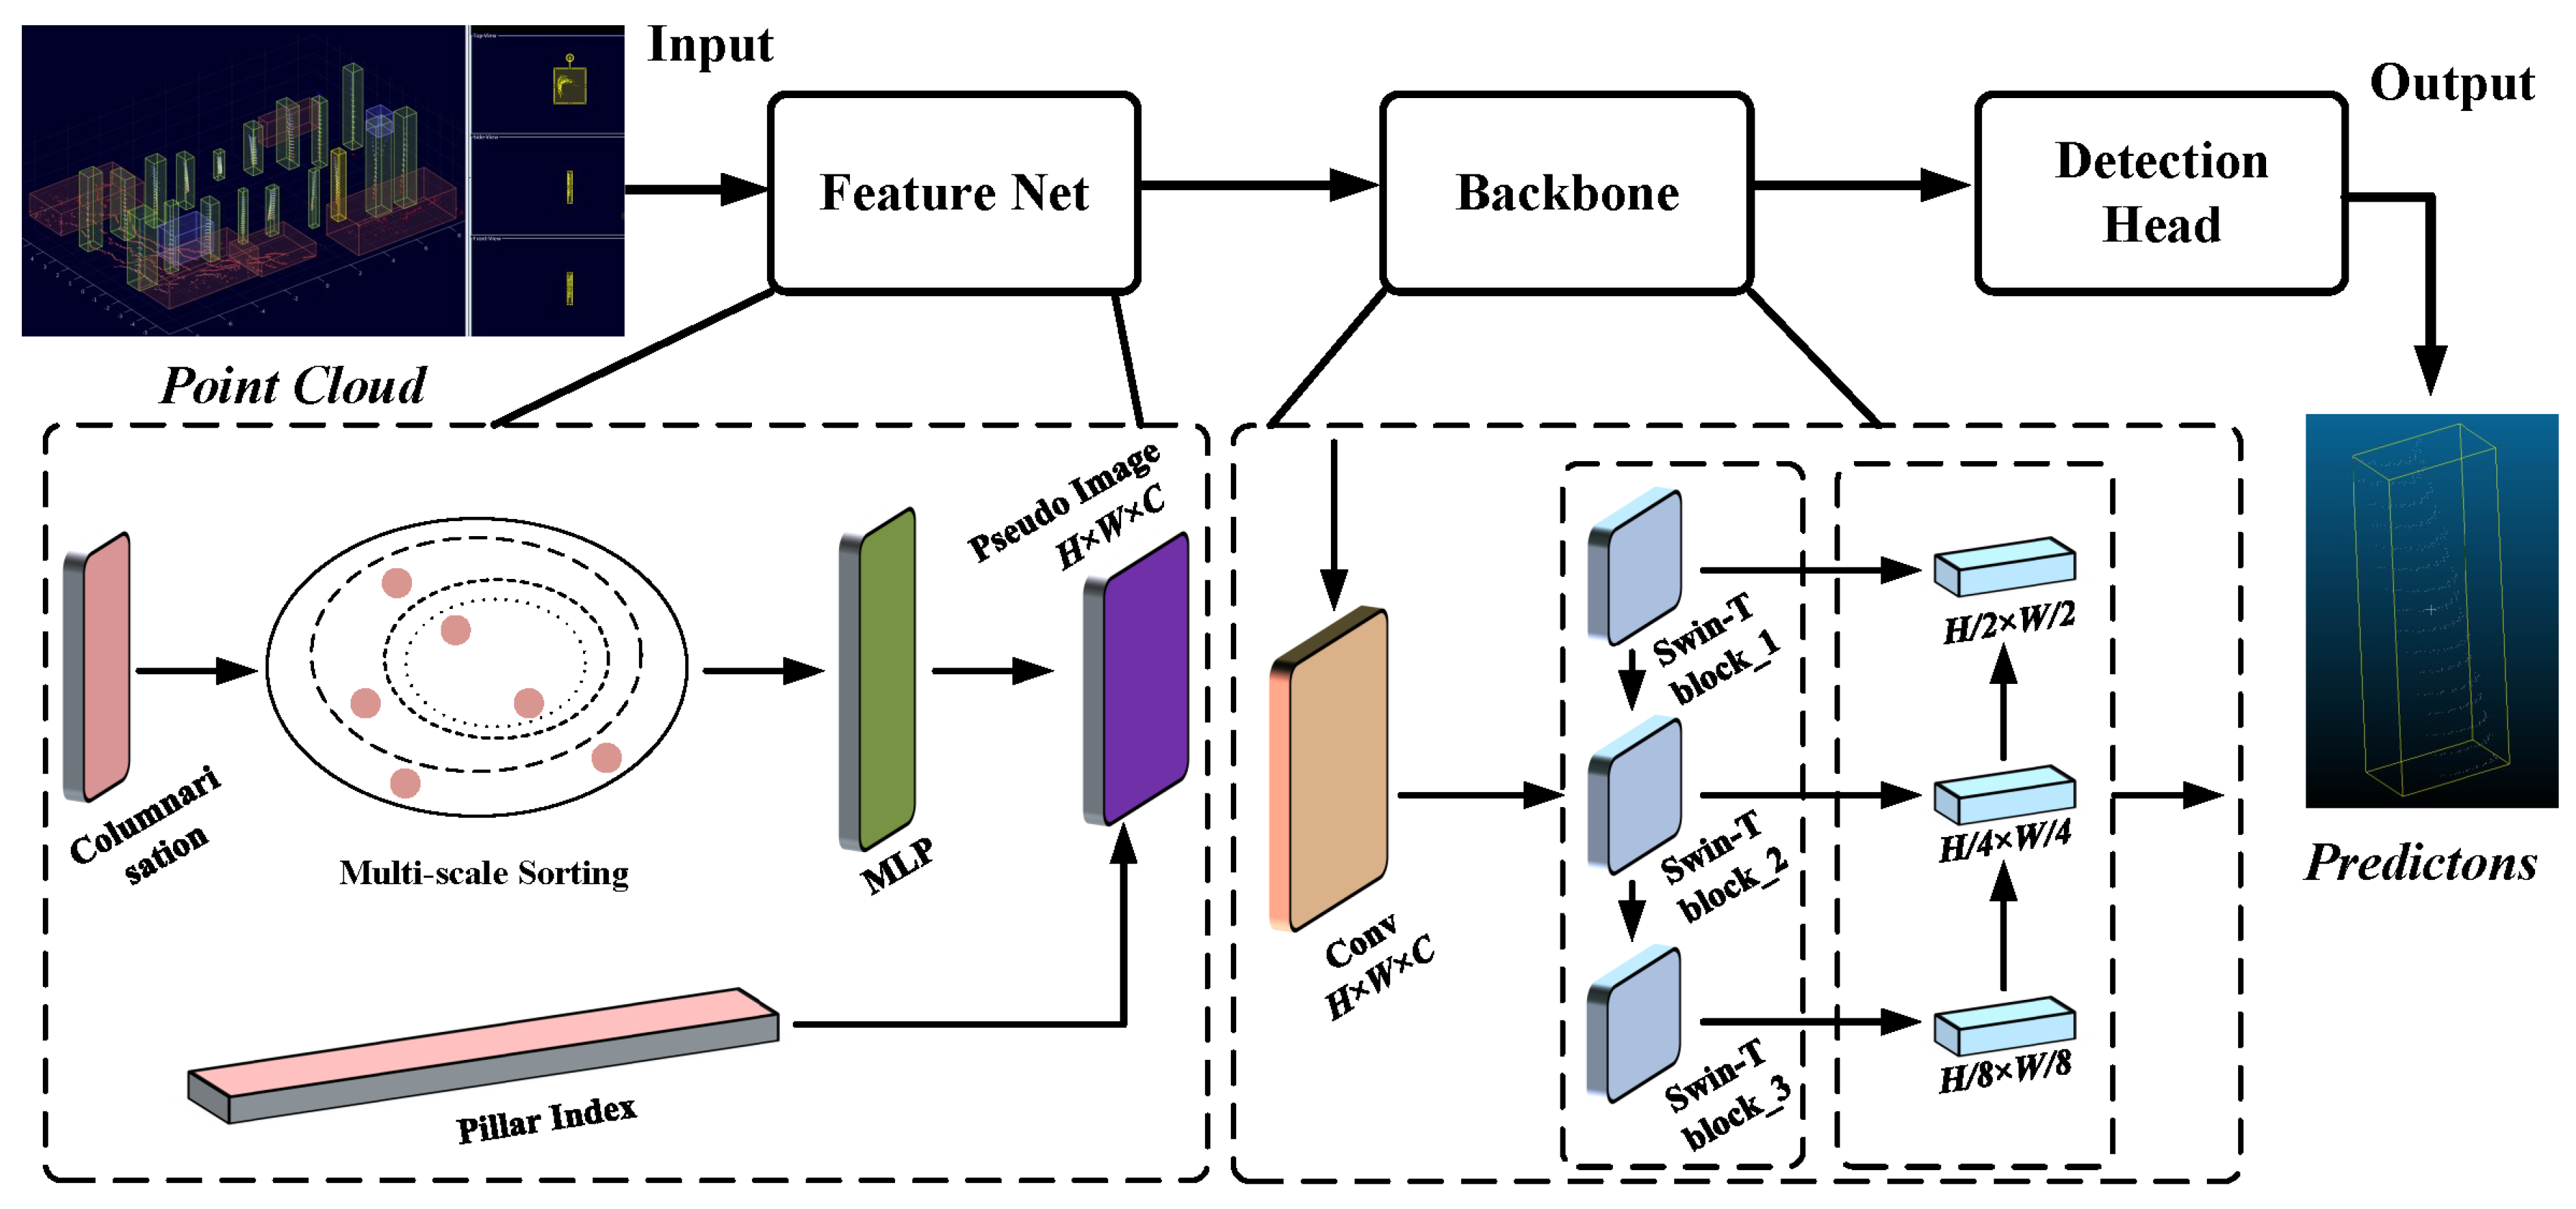
In the field of 3D vision research, PointPillars have been one of the most commonly used models for point cloud target detection tasks [24,25]. The idea behind PointPillars’ processing is to convert a 3D point cloud into a 2D image and perform target detection on the 2D pseudo-image. 2D convolution is utilised for computational speedup. In this study, PointPillars was adapted and improved accordingly for the detection requirements of rubber tree trunks in non-structural environments. Figure 5 illustrates the processing flow of the adapted detection framework. The input point cloud data are the result of the labelling. The different classes of objects in the point cloud are wrapped with different coloured 3D bounding boxes.
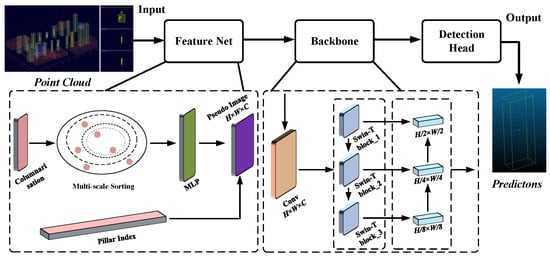
Figure 5.
Block diagram of the adapted 3D target detection process.
In the original PointPillars network, the point cloud data are segmented into multiple pillar units for feature extraction. In order to process large-scale point cloud data, PointPillars usually need to divide the point cloud into smaller grid cells. This may lead to a decrease in the resolution of the internal point cloud geometric information as the detailed information inside the point cloud may be lost during the segmentation and projection process. Also, PointPillars projects the point cloud data onto a 2D feature map, which means that the 3D information of the point cloud is downscaled to some extent to 2D. This may result in the loss of some geometric information as points at different depths, heights and widths are mapped onto the same 2D grid cells. In conclusion, the lack of internal columnar feature learning in the PointPillars framework often leads to the loss of geometric information in 3D localised point clouds. In this study, the multi-scale feature extraction module is used to enhance the ability of intra-pillar point cloud feature aggregation [26]. The module computes global features on each pillar, sorts the in-column point features according to their proximity to the global features and finally aggregates the point cloud features adjacent to the global features by incrementally expanding the sensory field. The multilayer perceptron (MLP) layer is introduced in each grid cell to achieve the fusion of multi-scale features, enabling the network to focus on different scales of point cloud information simultaneously. This is useful for detecting objects of different sizes and for processing point cloud data at different distances. The local geometric structure of the point cloud and the precise location information are preserved in this process.
At the Backbone stage, PointPillars perform sampling and feature extraction only with a common 2D convolutional neural network, which is more efficient but has relatively weak feature extraction capability. These networks are typically used for image processing rather than feature extraction from point cloud data. As a result, the networks may not be flexible enough to capture the complex 3D geometry in point cloud data. In order to enhance the feature extraction ability of the algorithm and overcome the sense of division caused by point cloud columnisation, Swin Transformer is introduced to achieve feature sampling [27]. Swin Transformer is a variant of Transformer [28], which is a structure derived from the field of natural language processing (NLP). Its biggest feature is the self-attention mechanism [29], which enables the feature graph to obtain global information about its own features and rich contextual semantics and is suitable for parallel computation. The classical computation of the self-attention mechanism is:
where Q is the attention query matrix, K is the attention key matrix, V is the attention value matrix, and is the vector dimension in Q and K. The original backbone network consists of two sub-networks. One is downsampling and generates features at increasingly smaller spatial resolutions. The other performs the upsampling and concatenation of features. In the designed Swin Transformer network structure, each of the three stages of the Transformer module has its own depth and number of attention heads, and the resolution of downsampling is the same as that used in the original PointPillars. This constitutes a convenient replacement for the original 2D convolutional neural network.
Moreover, choose efficient activation functions. The standard ReLU is replaced with Leaky ReLU to improve computational efficiency.
The original PointPillars, VoxelNet and PointRCNN models were simultaneously applied to the target detection task for comparison. Regarding the specific training parameters, the batch size was set to 16 and epochs were set to 100. The optimiser, learning rate, momentum, weight decay and loss function were set to Adam, 0.01, 0.9, 0.01 and focal loss, respectively. Selecting appropriate training parameters usually requires experimentation and tuning. In deep learning tasks, it is often necessary to weigh the relationship between training speed, model performance and hardware resources to find the optimal parameter settings.
A professional point cloud processing workstation was used for the target detection task. The hardware and software environment consisted of an AMD Ryzen threadripper 3990× 64-core processor 128 and an NVIDIA Quadro RTX 8000 and Ubuntu 18.04.6 LTS. The tools employed were PyTorch 1.10.1 and cuda 11.1.
2.3. Trunk Modelling
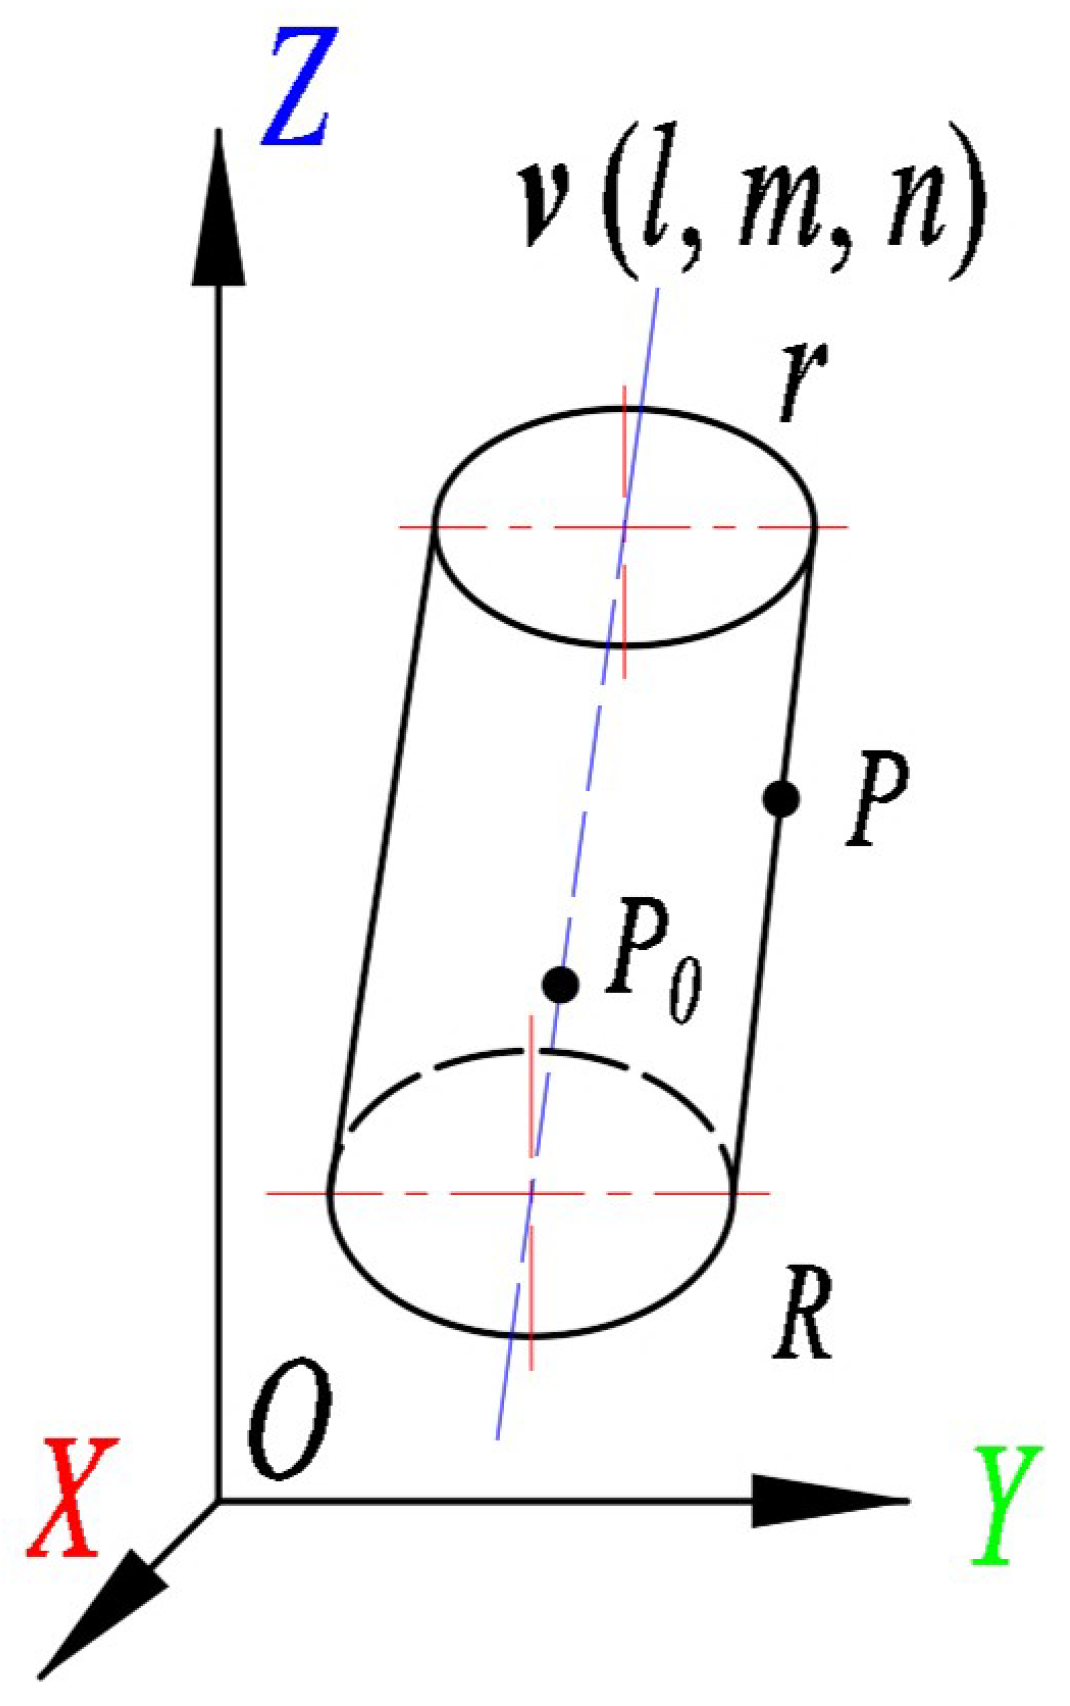
Typically, research objects such as rubber tree trunks are treated as ideal cylinders. Figure 6 illustrates the composition of a standard cylindrical model. v(l, m, n) is the direction vector of the axis. The equation of the cylinder can be expressed as:
where P(x, y, z) is one point on the cylindrical surface. (, , ) is one point on the axis of the cylinder v and R is the radius of the cylinder. These parameters identify a cylinder. However, in practice, most trunks are narrower at the top and wider at the bottom than standard cylinders. That is, the top radius r of the geometry in Figure 5 is smaller than the bottom radius R. In this study, two trunk modelling methods are applied for point clouds of single trees and compared.

Figure 6.
Mathematical model diagram of a standard cylinder.
2.3.1. RANSAC Cylinder Fitting
The random sample consensus (RANSAC) algorithm fits the cylinder by considering the probability that all points in a random sample belong to a model (Equation (3)) [30].
where N denotes the number of iterations required to find at least one outlier-free sample with probability a. a is the confidence level; n is the number of observations per sample; q is the probability that a point belongs to the model, estimated by M/D, where M is the number of outliers in the dataset; and D is the total number of points.
The point cloud of single trees obtained from the segmentation was cut into small pieces with a height of 0.3 m each. Segmented point clouds with this height value were tested to contain a data volume more suitable for the processing requirements. The sum of squares of the distances from the points to the cylindrical model is minimised by iterating through the RANSAC algorithm [31]. The cylindrical model was built on each segment. The minimisation is done by means of the Nelder–Mead simplex algorithm [32], with initial parameters taken from an estimate of the centre of gravity of the segment. For each zone, the cylinder parameters selected are those that correspond to the minimum distance between the surface of the cylindrical model and the corresponding point.
where d is the distance from the point to the surface of the cylinder, p is a point on the surface of the cylinder, is a point on the axis, v is the direction vector of the axis and R is the radius of the cylinder.
2.3.2. IRTLS Cylinder Fitting
The single-wood point cloud was uniformly segmented using 0.3 m as the unit height dimension. On each section, the cylinder model was established by iterated reweighted total least squares (IRTLS) [33]. The initial parameters are estimated based on the centre of gravity of the segments, thus completing the first iteration of the modelling algorithm. At each iteration, the sum of the weighted squared distances from each point to the surface of the cylinder is also minimised using the Naird–Mead simplex algorithm [32]. Tukey’s biweight function was used to calculate the weights [34]. When the sum of weighted squared distances stabilises or reaches the maximum number of iterations, the iterative algorithm converges and stops running. Equation (4) defines the distance from a point to a cylinder.
Locally in Danzhou, when the tree circumference at 1.0 m from the ground reaches 50 cm, it meets the criteria to start cutting. The range of about 1.0 m is also the part where workers carry out cutting operations, which is in line with human habit. After obtaining the respective single-wood models using these two methods, the point clouds with heights of 0.2 m, 0.6 m, 1.0 m, 1.4 m, 1.8 m and 2.2 m were selected for least-squares circle fitting, respectively. The true trunk radius at each of these six heights was also measured and recorded separately. In addition, the centre coordinates of a fitted circle with a height of 1.0 m were used to represent the position of the trunks and the distances between adjacent trunks were calculated in the across-row and within-row directions, respectively.
2.4. Performance Evaluation
The overlap thresholds used in the assessment of accuracy were calculated based on the 3D space between the 3D enclosing box of the target detection and the labelled enclosing box. Precision, recall, F1-score and overall accuracy (Acc) were used to assess the detection quality (Equations (5)–(8)). In addition, the runtime (Hz) is introduced as an important evaluation metric.
For individual tree trunks, their distance from neighbouring trees can be used to indicate their position in the rubber forest, both across-row and within-row distances. These parameters were measured manually and recorded as measurement datasets. The accuracy of the calculations was assessed with MAE, R and RMSE. The computations were performed as follows:
where n stands for the number of trunks, is the value of the computed dataset, is the corresponding value of the measurement dataset and is the average value in the measurement dataset.
3. Results
3.1. Accuracy Assessment of Trunk Target Detection
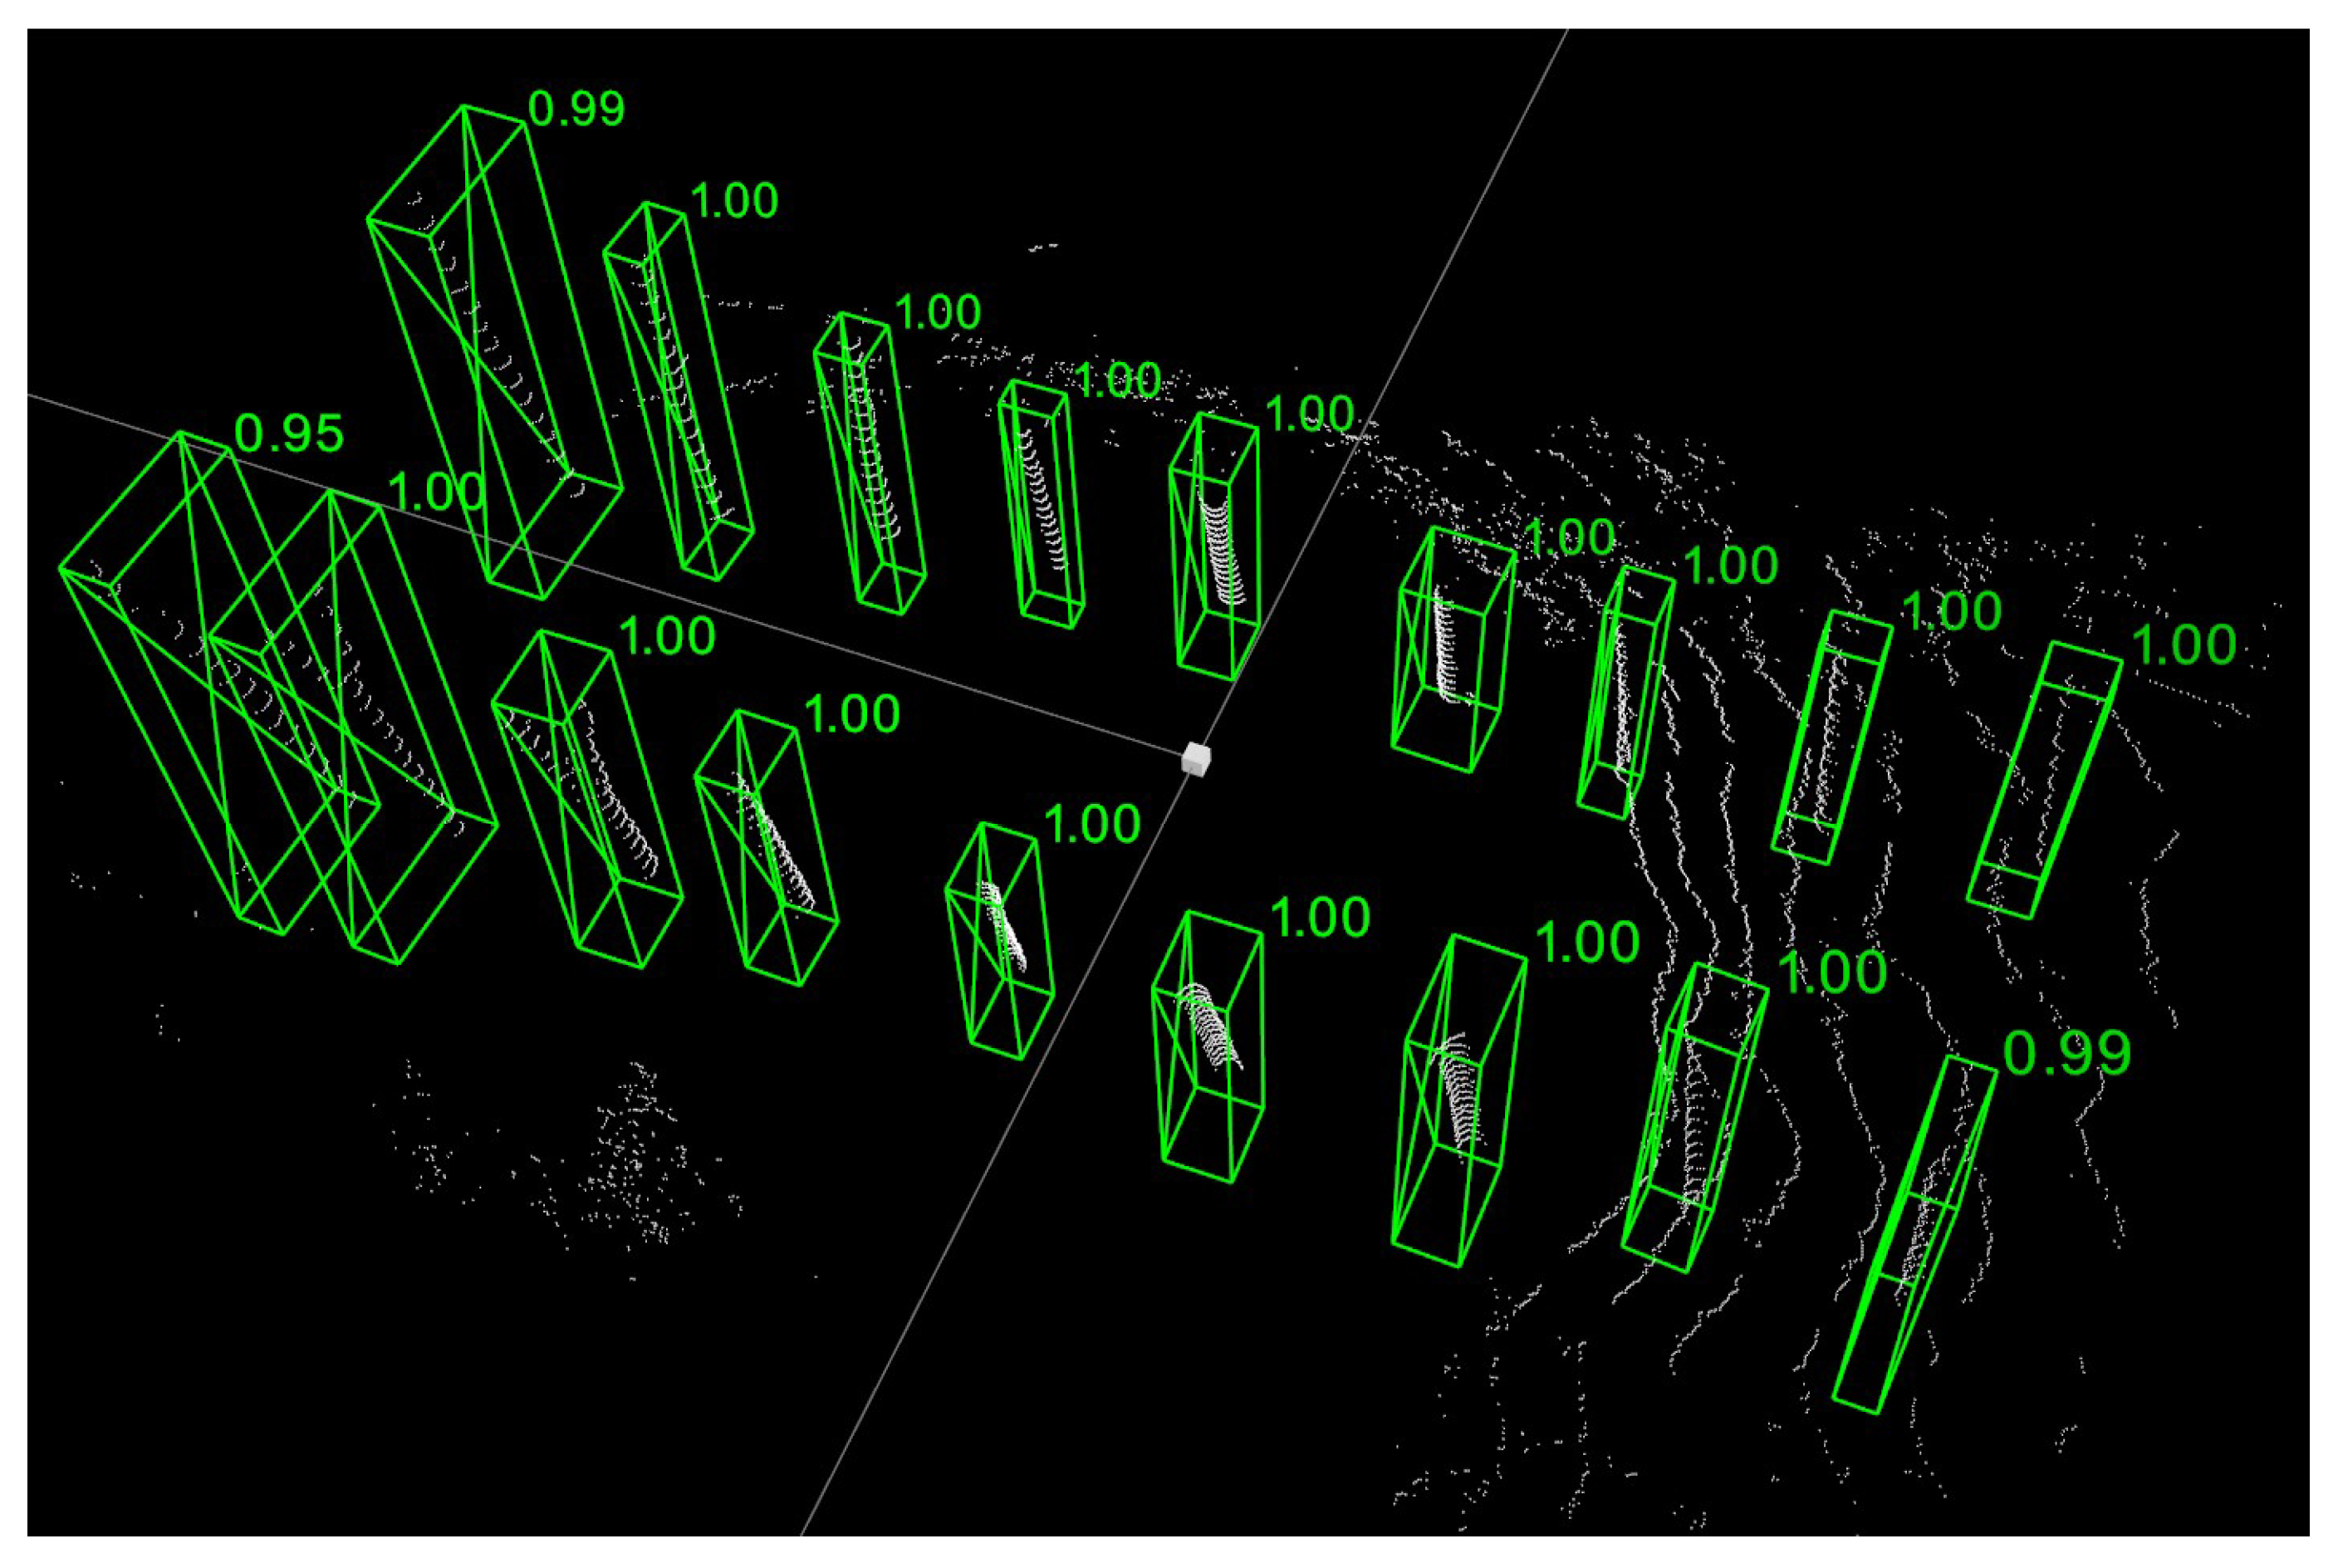
To ensure the accuracy of subsequent trunk growth modelling, all parts of the rubber tree trunk point cloud should be covered correctly and with as few redundant points as possible. Figure 7 shows one frame of the processed point cloud. All trunks have been successfully detected and segmented individually. The values near the 3D bounding box indicate how well the new box matches the bounding box used in the initial labelling process. An overall average match of 0.973 was achieved.
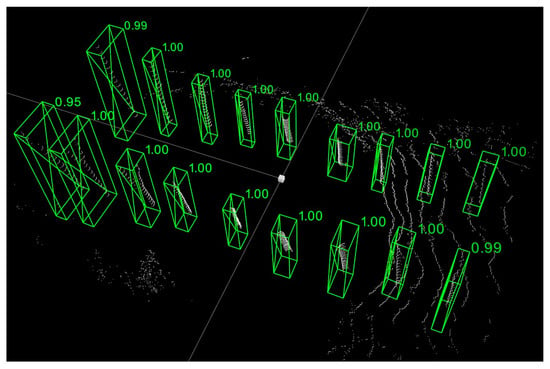
Figure 7.
Example results of trunk detection on a rubber forest point cloud.
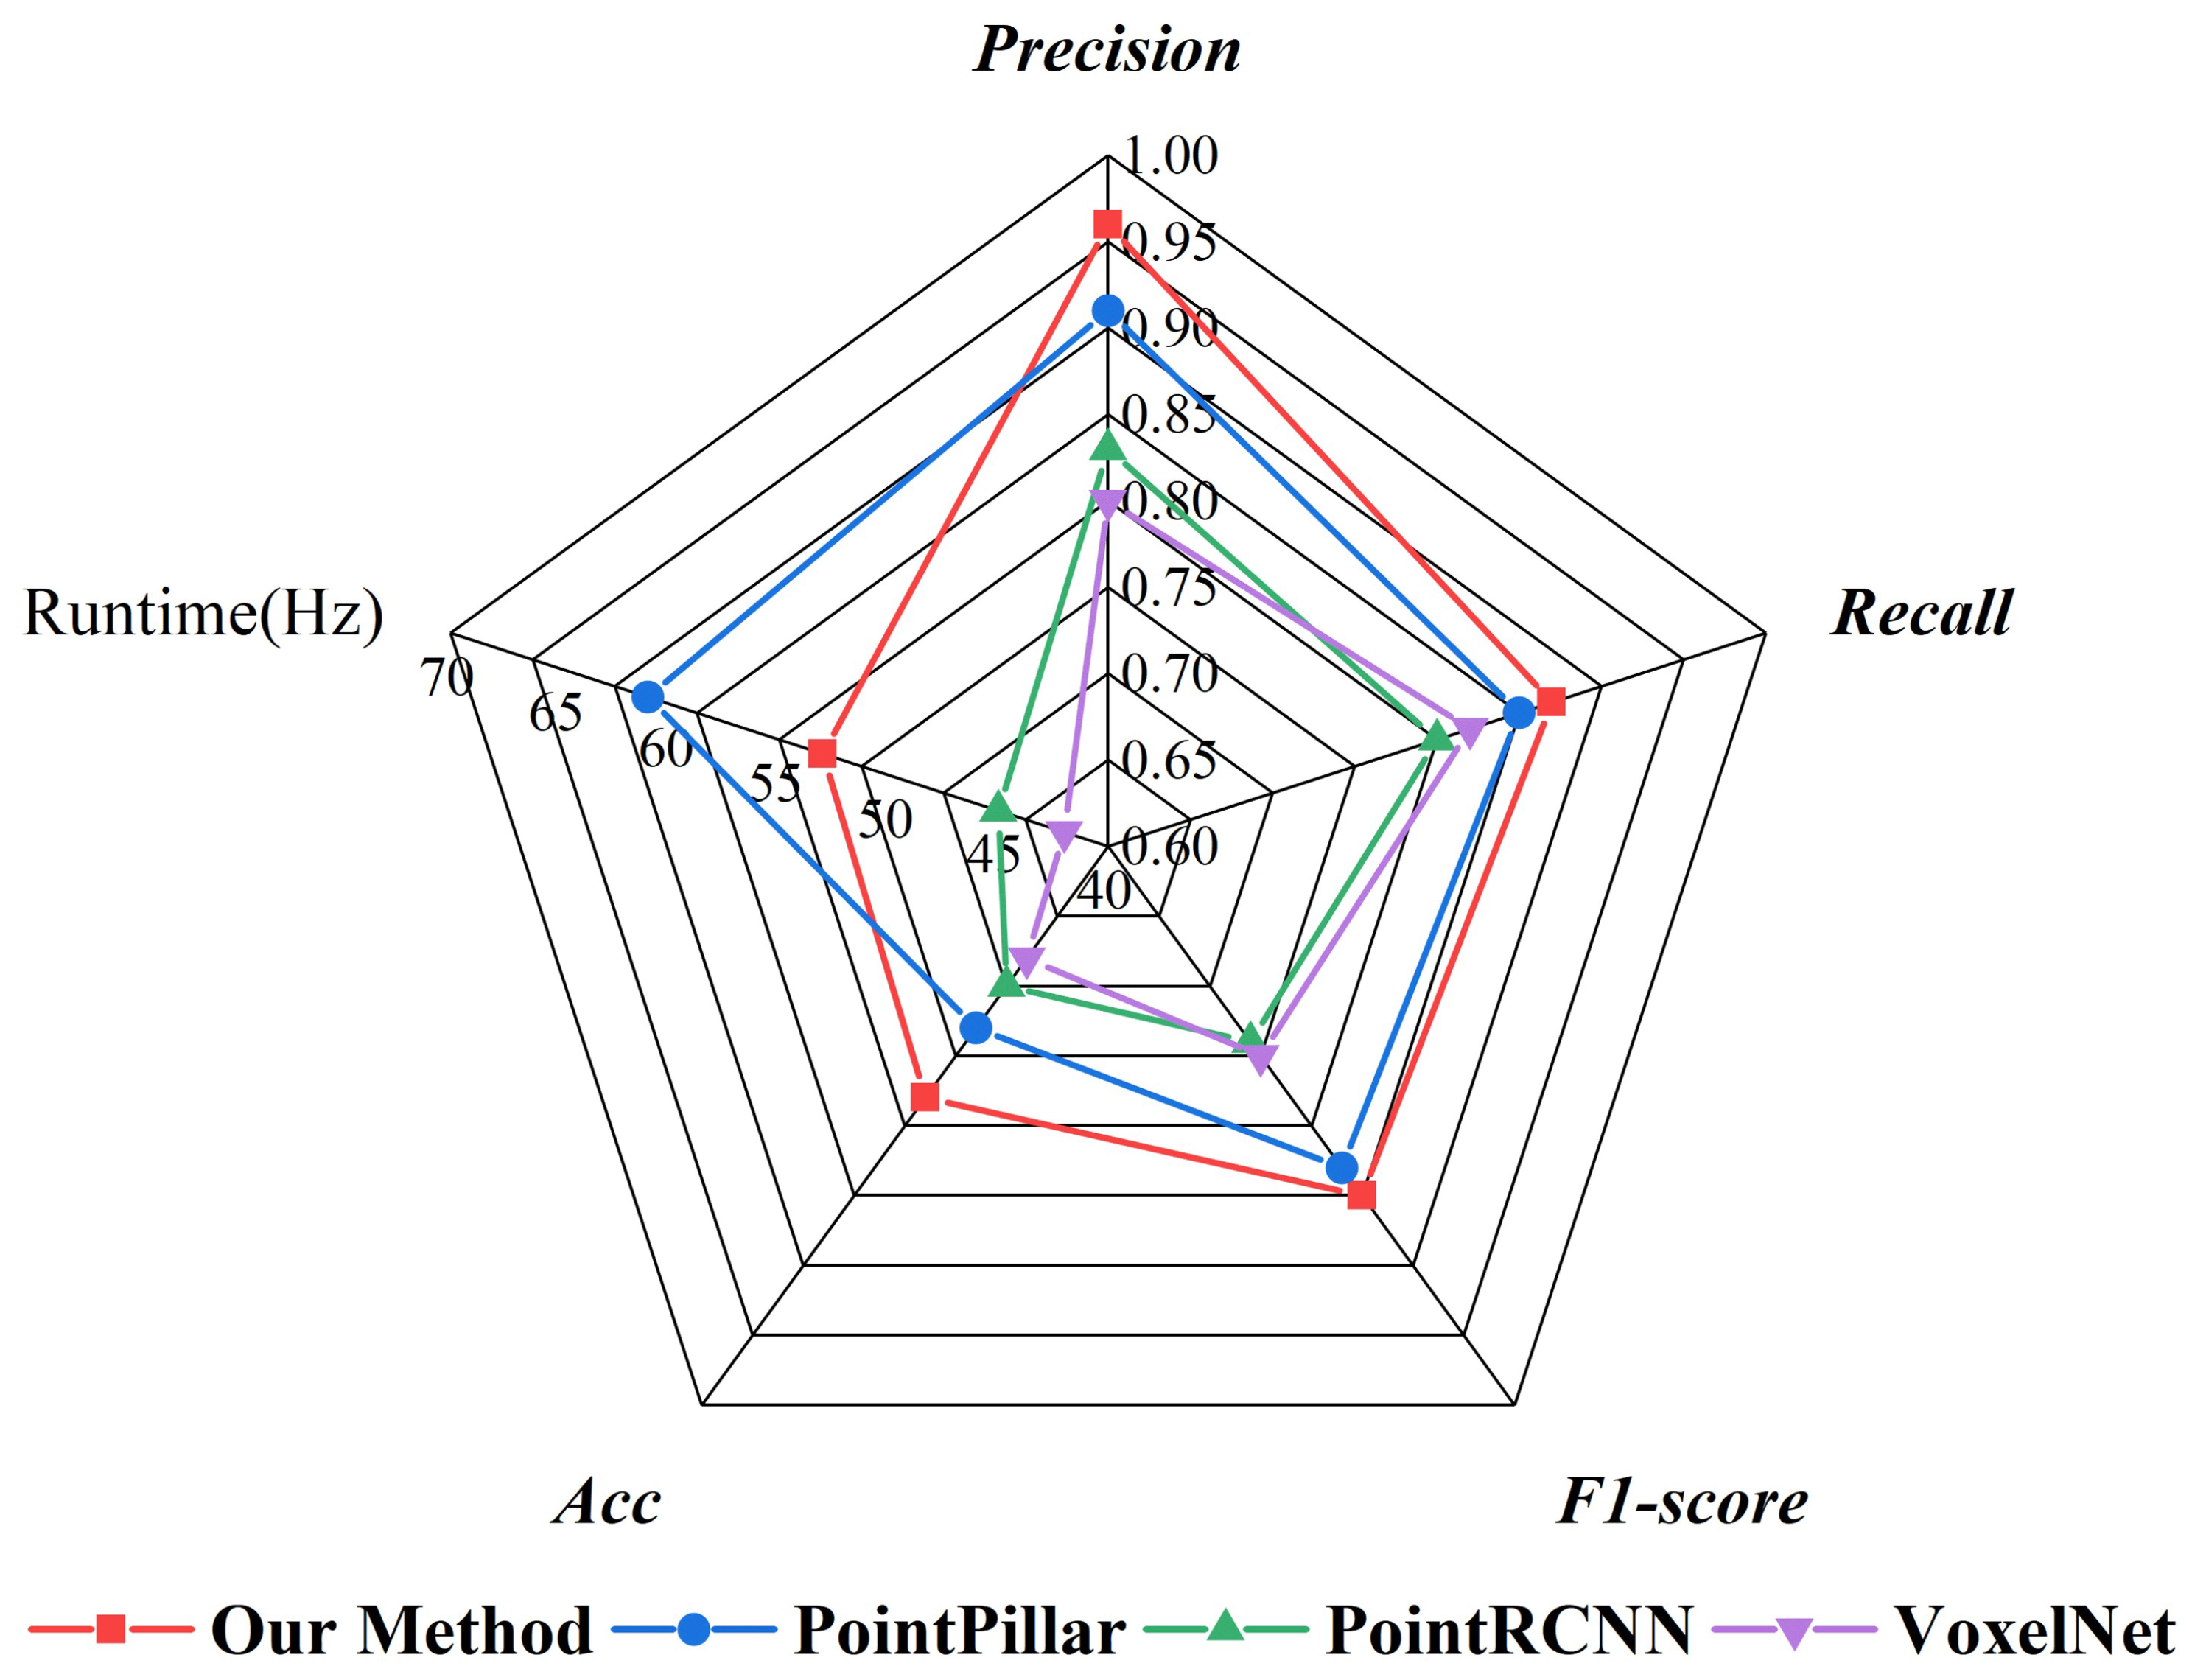
Figure 8 shows a summary of the comparative results of the target detection processing for all 500 frames of the point cloud. Among the quantitative analysis results of the four methods, the improved method achieves precision of 0.96 and recall of 0.87, which is better than the remaining three methods. In terms of F1-score, the method used is slightly higher than the original PointPillars. A similar performance was seen in the assessment of Acc. The original PointPillars is the fastest, and our method is the second fastest.
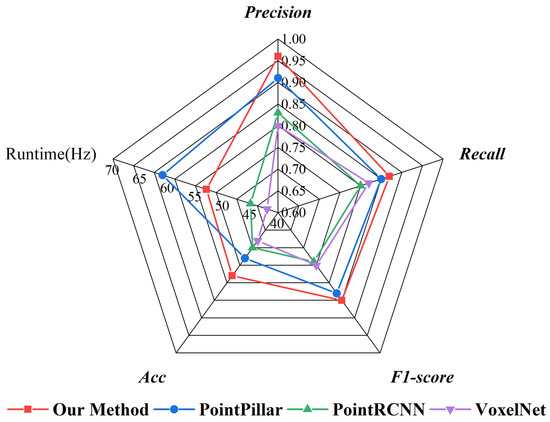
Figure 8.
Comparison of different networks for target detection results.
3.2. Accuracy Assessment of Trunk Modelling
Firstly, the true values of relative distances between neighbouring rubber tree trunks were counted to explore the distribution pattern. As shown in Figure 9a, most of the trunks were concentrated in the range of [680, 710] across the rows. A few are distributed in [645, 680] and [710, 745]. The median line is at approximately 695 cm. Figure 9b demonstrates the statistics of within-row distances of neighbouring trunks. The vast majority of the values are distributed in [295, 305], and only a small portion is distributed in [260, 295] and [305, 345]. A high degree of concentration is shown. The median is approximately 300 cm.
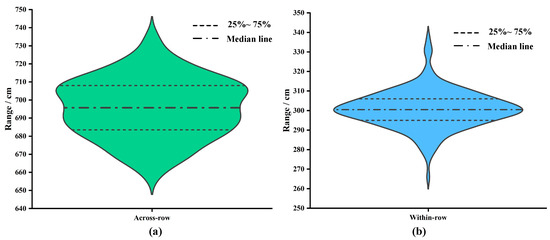
Figure 9.
Statistics on the distribution of distances between trunks of neighbouring rubber trees. (a) Statistical results of across-row distances. (b) Statistical results of within-row distances.
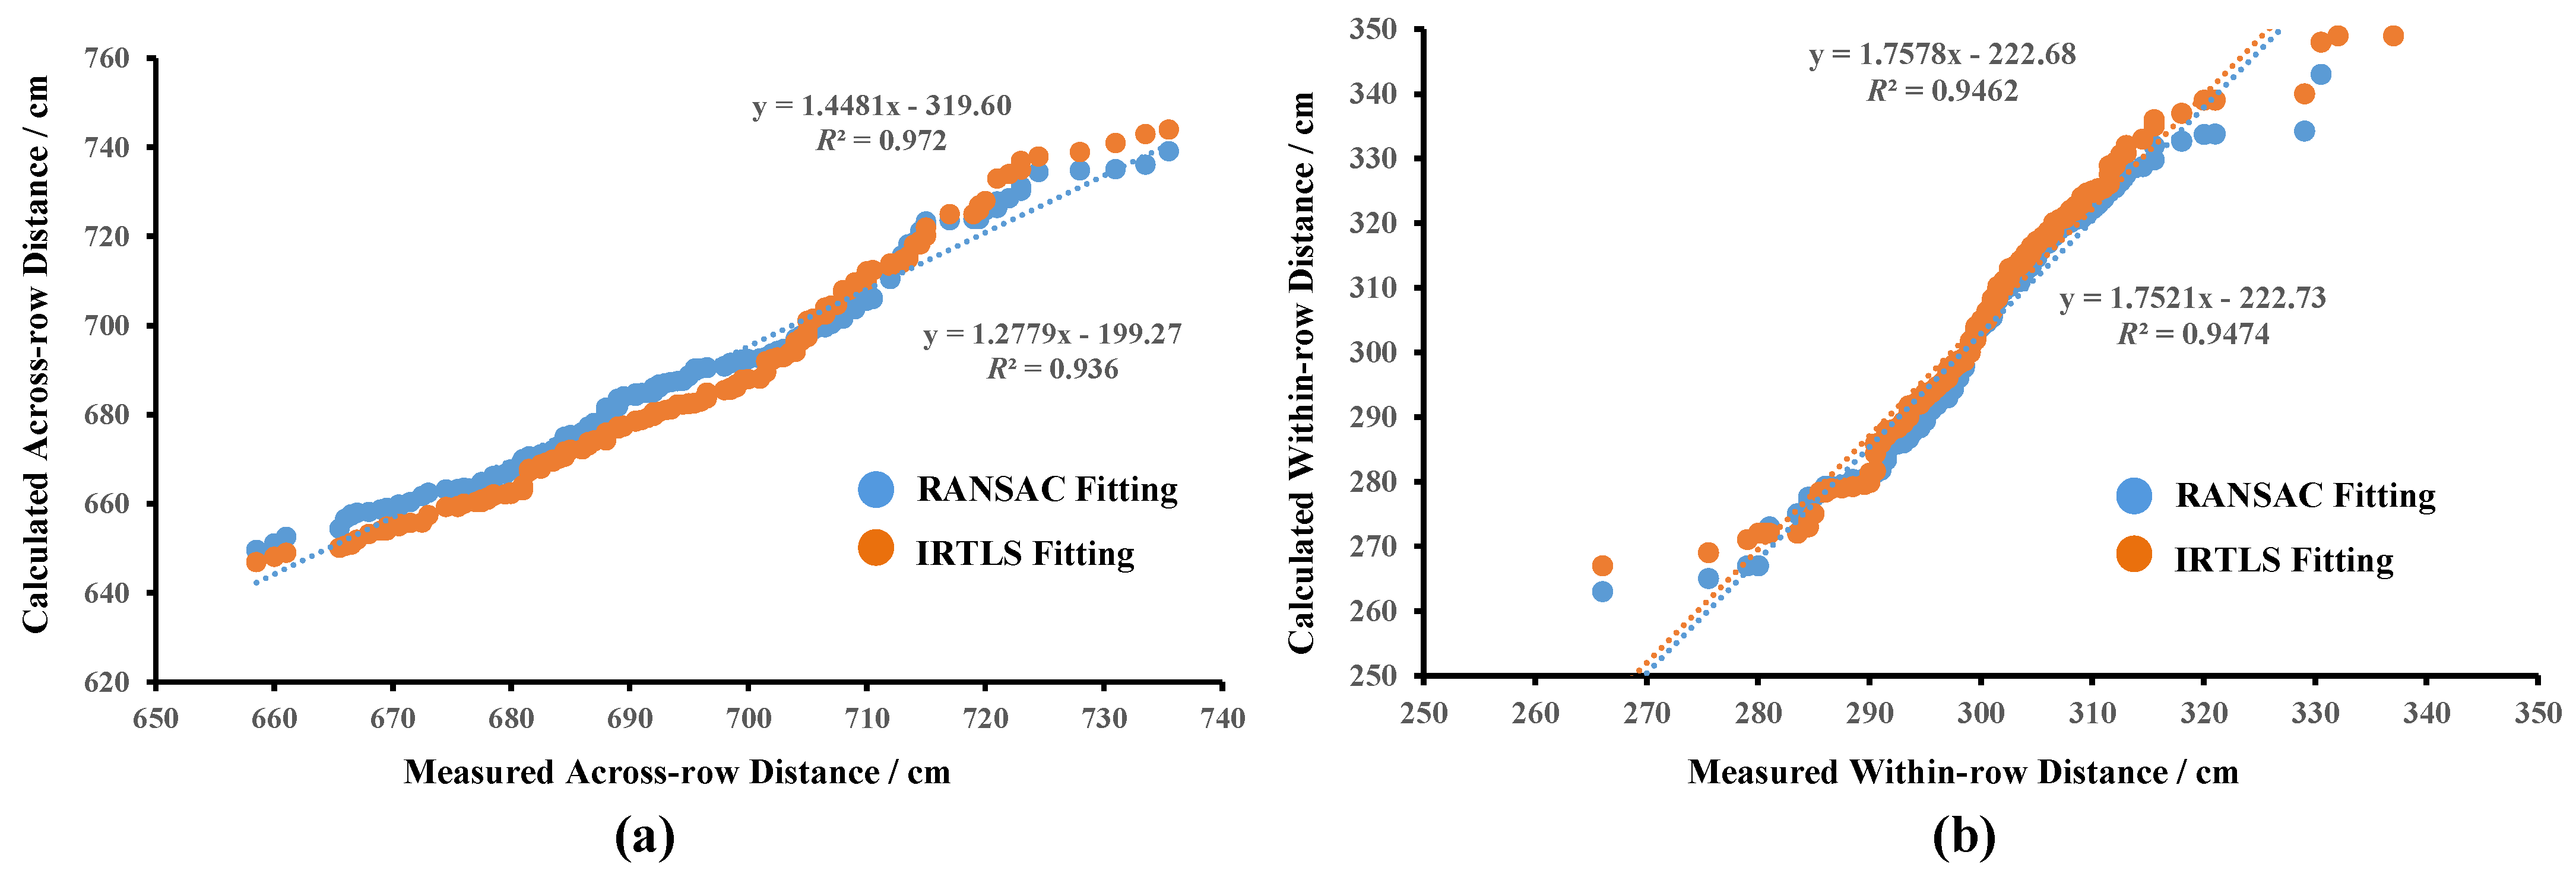
Figure 10 illustrates how well the true values of the distances to neighbouring trunks match the calculated values under the two cylindrical fitting methods. The results of the calculations are further collated and summarised in Table 2. Overall, the neighbouring trunk distances calculated by both cylindrical fitting methods are close to the true values. For the across-row distance, the R 0.972 of the calculated value for the IRTLS cylindrical fitting is slightly higher than the RANSAC value of 0.936. Its MAE and RMSE values are also both smaller. The values of both fitting methods show increased dispersion at distances greater than 720 cm. For within-row distances, the R and MAE results of the two fitting methods are very close. The RMSE values of IRTLS are relatively larger. Both methods also showed increased fluctuation in individual results at greater than 320 cm.
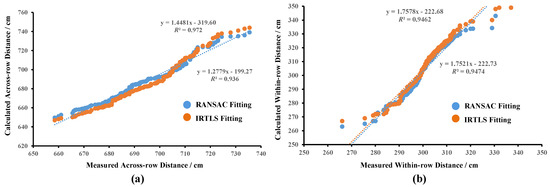
Figure 10.
Statistical results of adjacent trunk spacing. (a) Comparative results of across-row spacing calculations. (b) Comparative results of within-row spacing calculations.
Table 2.
Statistics of the calculated distances of neighbouring trunks under the two cylindrical fitting methods.
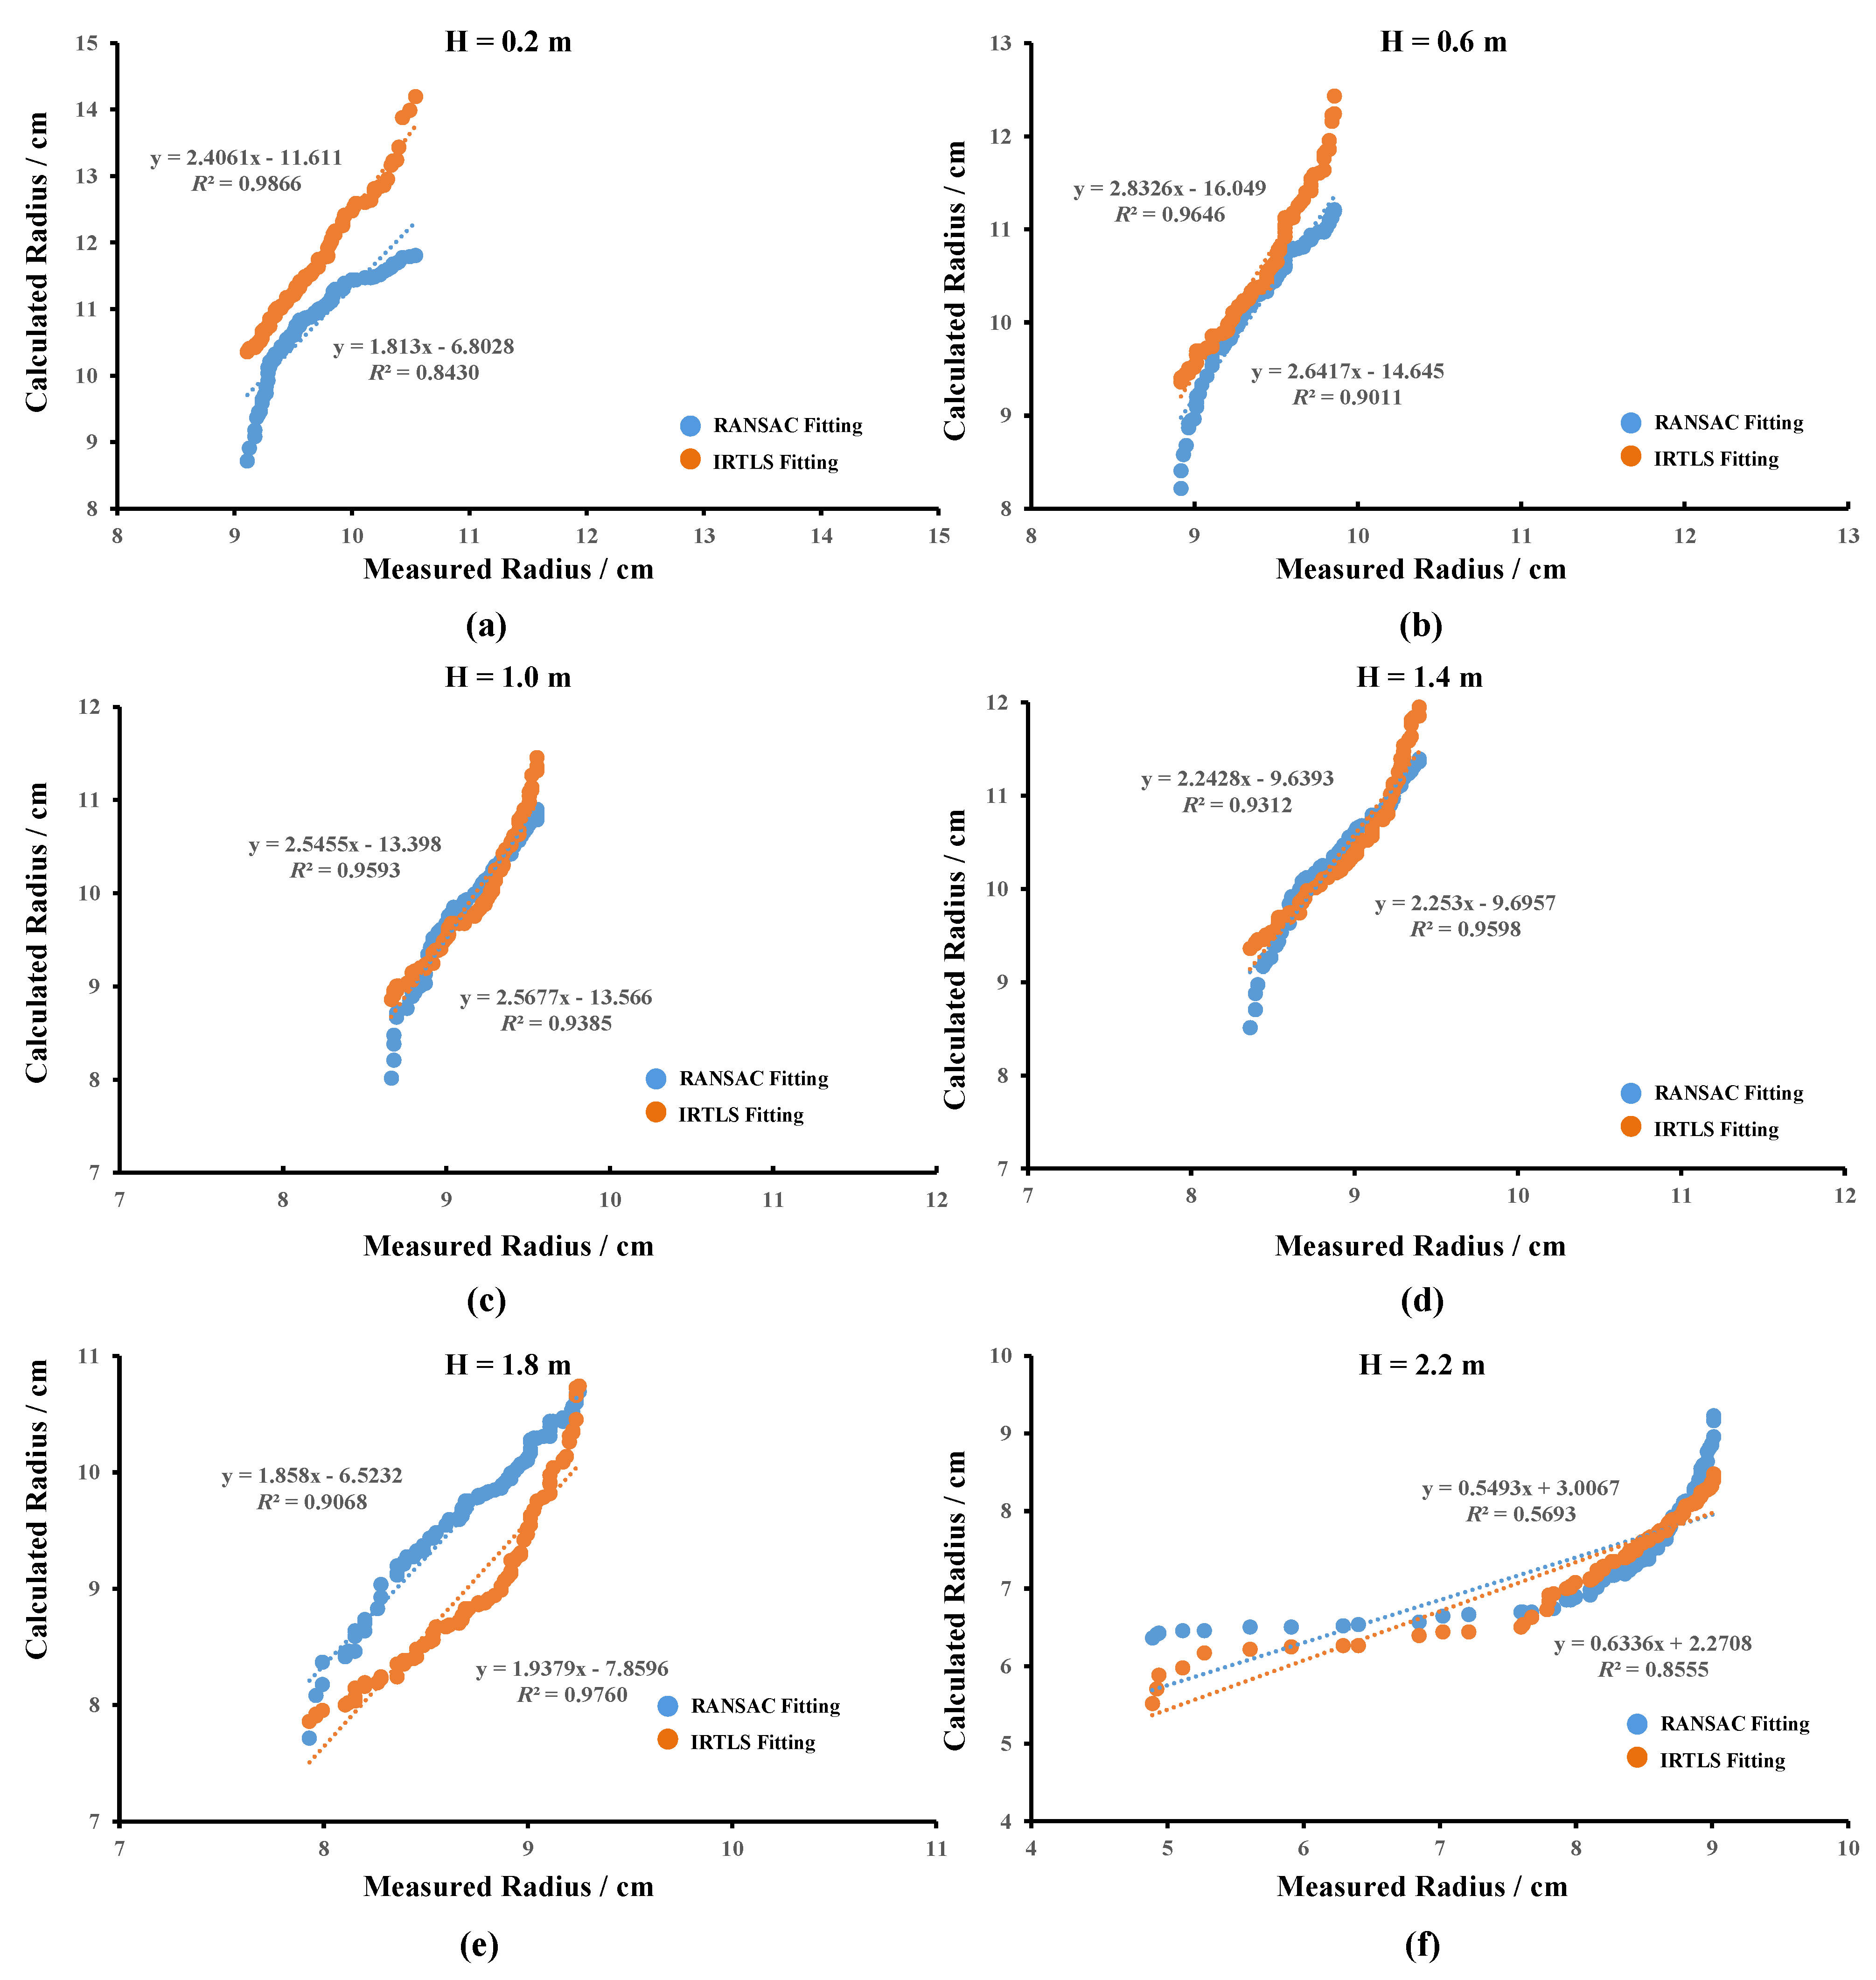
Figure 11 illustrates the results of matching the true values of the radius of the trunk at six different heights with the calculated values under the two cylindrical fitting methods. The combined quantitative results are collated in Table 3. Combining the results of the trunk radius calculations at the six heights, the two fitting methods have different performances at these heights. Overall, the trunk radius decreased gradually with increasing height. At the lowest position of 0.2 m, the R 0.9866 of the IRTLS fitting method was significantly higher than the RANSAC value of 0.8430. There was no significant difference in the MAE and RMSE values. As the height increased, the R values of the two fitting methods did not differ significantly, whereas the MAE and RMSE of the IRTLS method showed a slight advantage. Up to a height of 1.8 m, the R values of the IRTLS method performed relatively well. At the highest height of 2.2 m, the results of the RANSAC fitting method show a large fluctuation, and its R value of 0.5693 is significantly lower than that of the IRTLS method of 0.8555. The MAE and RMSE results show similar performance. It is worth noting that at the highest height, the distribution of trunk radius is much wider, showing a greater degree of randomness.
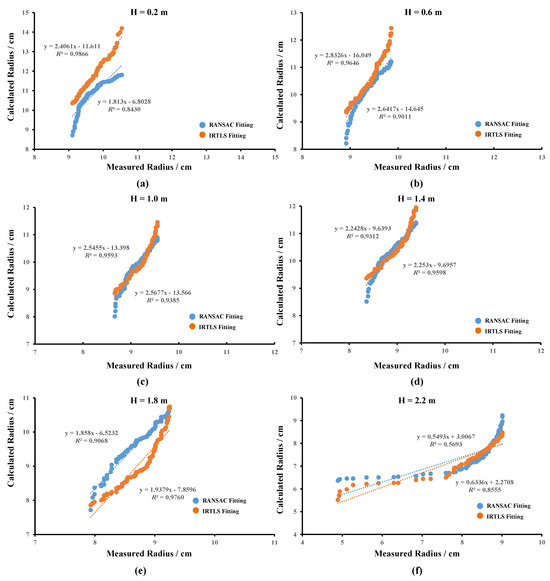
Figure 11.
Statistical results of rubber tree trunk radius calculations at six heights. The results of the RANSAC fitting and IRTLS fitting were calculated separately. (a) Results of radius calculations at 0.2 m. (b) Results of radius calculations at 0.6 m. (c) Results of radius calculations at 1.0 m. (d) Results of radius calculations at 1.4 m. (e) Results of radius calculations at 1.8 m. (f) Results of radius calculations at 2.2 m.
Table 3.
Statistics of the calculated trunk radius at six different heights under two cylindrical fitting methods.
3.3. Remote Sensing Map of Rubber Forests
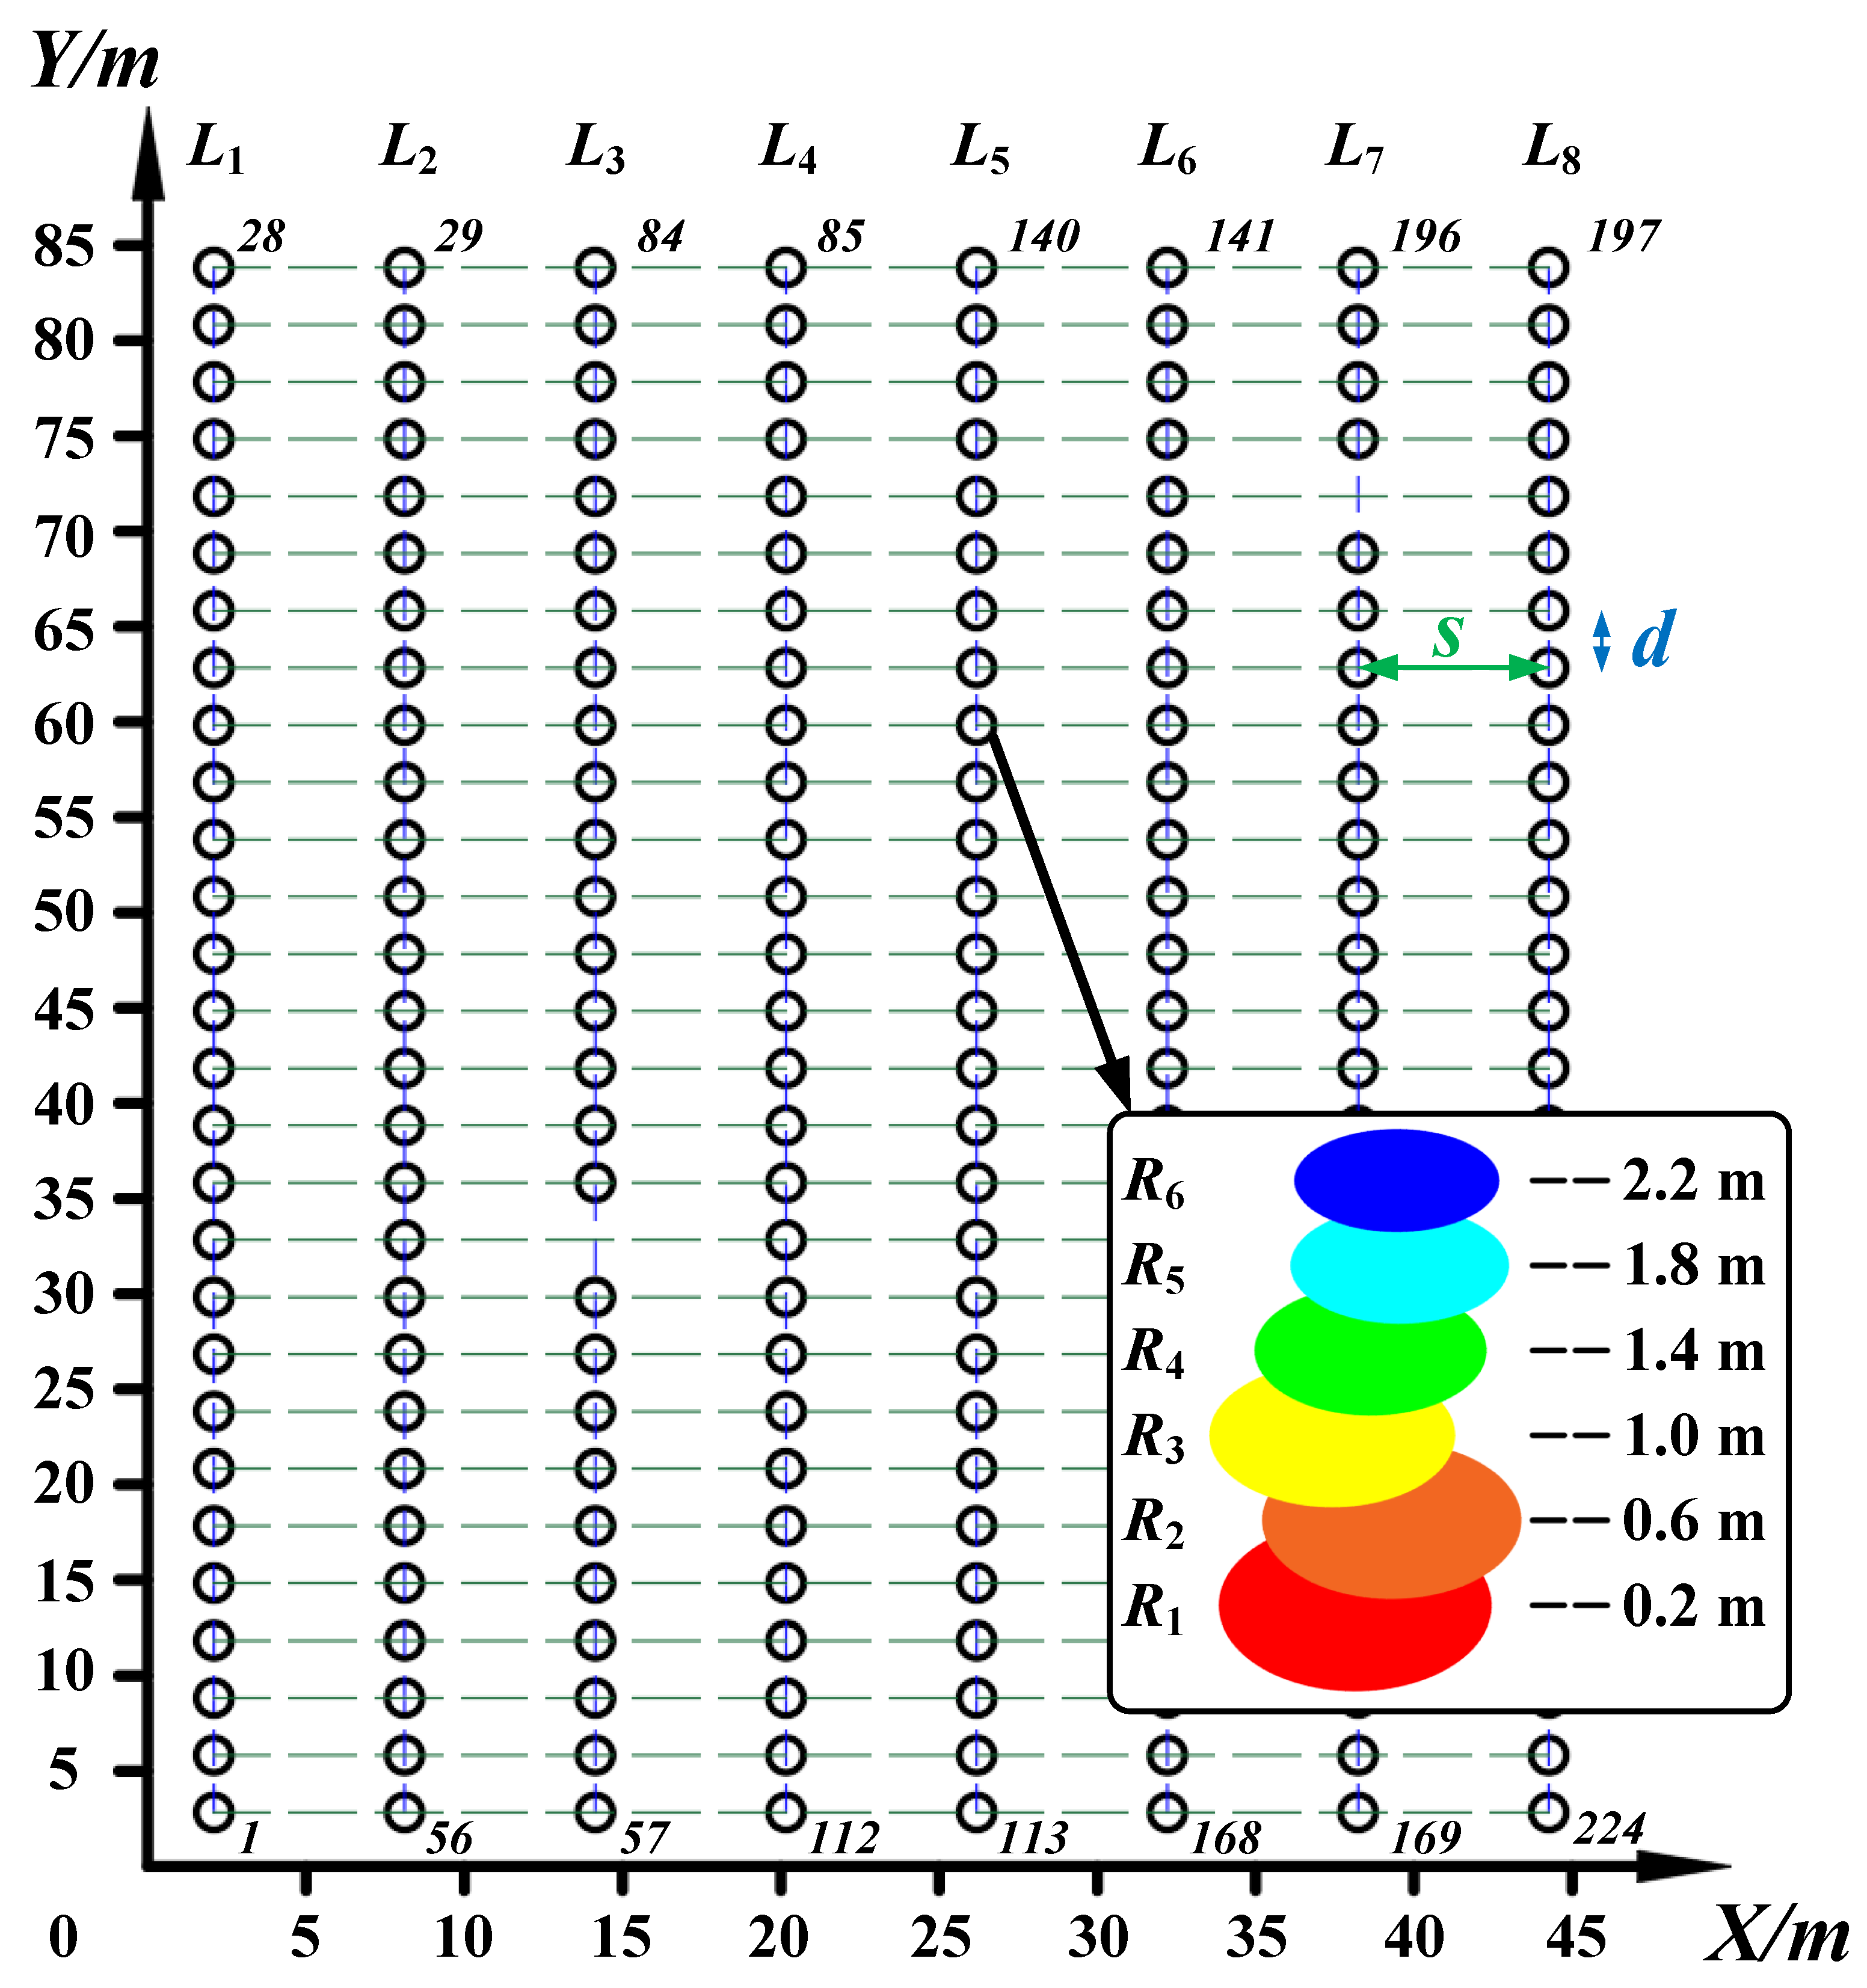
Data results from IRTLS cylinder fitting were employed. All the trunk spacing data and radius information were combined and collated to create a map of the rubber forest growth at Position 31901 (see Figure 12). The starting point of the coordinate system was adjusted. The relative positions of all of the trunks are clearly visible. s and d represent the across-row and within-row distances of neighbouring trunks, respectively. Even in rubber plantations that are carefully maintained by hand, there are still missing trees due to stunting and other reasons. For example, in and , one tree each is missing. However, subsequent trees are still numbered in the original order.

Figure 12.
Map of rubber forest growth information at the Position 31901. The number of the trunk at the beginning and end of each row is labelled. A schematic diagram of the fitted circle and radius of the trunk at different heights is included.
4. Discussions
4.1. Scalability and Limitations of the Backpack Point Cloud Acquisition System
The backpack point cloud acquisition system is a portable point cloud data acquisition tool, which is widely used in the fields of geographic mapping, building information modelling, environmental monitoring and agriculture. It is important to attempt to apply it to the research of the 3D reconstruction of rubber forest. The flexibility and convenience of the backpack system is well suited for unstructured complex environments. In future research, more information can be provided by adding more types of sensors, such as multispectral cameras. This allows the system to adapt to different applications. Multiple backpack point cloud acquisition systems can also be considered to be connected into a distributed network to extend the coverage or improve the efficiency of data collection. This is useful for large-scale mapping projects.
However, limited by manual intervention, the backpack system still has some limitations in terms of data collection efficiency and accuracy. On the one hand, the speed and range of human travelling is small and the payload is limited. It is difficult to sustain improvements in the breadth and dimension of information. On the other hand, the human’s own movement is a kind of interference to the sensors’ information acquisition process. New methods can be targeted to address these limitations. To improve efficiency, a multi-resolution sampling strategy can be used during acquisition. Reduce sampling density at long distances and increase density only when more detailed data are needed. Automating the data acquisition process and sensor calibration are also key to improving efficiency and accuracy. Automated calibration tools ensure accurate alignment between sensors. Next, provide operators with real-time feedback and data visualisation so they can check data quality and take corrective action in a timely manner. This helps improve the real-time monitoring and control of data acquisition. Finally, other mobile vehicles can be introduced, such as all-terrain vehicle (ATV) and cars capable of auto-navigation. Modular backpack point cloud acquisition systems can be quickly transferred to mobile vehicles to further improve efficiency and accuracy. It is even possible to set up a local area network (LAN) to simultaneously control multiple autonomous vehicles for large-scale information acquisition tasks.
4.2. Construction of the Target Detection Framework
Target detection has been one of the research hotspots in the field of 3D vision. The proposal of PointPillars has led to a dramatic increase in the speed of 3D target detection. PointPillars converts the point cloud columnarisation into pseudo-images and applies 2D deep learning backbone while preserving the 3D features of the point cloud. The use of a two-dimensional 2D convolutional neural network for feature learning greatly speeds up the algorithm [35]. Although this algorithm makes the 3D target detection speed increase dramatically, there are still some problems that constrain its detection accuracy. For example, the lack of internal columnar feature learning in the framework leads to the loss of geometric information in the 3D local point cloud, and the 2D convolutional neural network is inefficient for multi-scale pseudo-image feature learning [36]. Currently, 3D target detection is handled from two main perspectives. Firstly, the problem is solved from a 3D perspective, and features are extracted by 3D convolution operators. The accuracy of this method will be a little higher, but the demand for computational resources is greater, which is not conducive to the deployment of production practice. Secondly, the point cloud is characterised into a pseudo-feature graph, and then a 2D convolutional neural network is used for feature extraction. The computational speed is accelerated.
In order to extract the features within the point cloud pillars, PointPillars maps the points within the pillars to high-dimensional feature vectors through a fully connected layer and performs feature aggregation with the maximum pooling operation. However, it does not consider the spatial geometric distribution of the points within each point cloud column, which leads to the possible loss of position information during the aggregation process, making it difficult for subsequent target detection. In this study, an in-column multi-scale feature extraction module is introduced to enhance the PointPillars processing capability. Firstly, the global features are obtained by maximum pooling of the in-column features, and then the global features are used as the centre to search for different numbers of nearest-neighbour points and enhance the in-column features with aggregated features of different scales. This enhances the 3D target detection capability. Parametric efficiency is also improved. No additional number of parameters is added in the internal column point cloud feature learning phase.
In the backbone stage, the original PointPillars uses a pure 2D convolutional neural network to obtain feature maps of different resolutions. The feature maps of different sizes are then up-sampled to the same size and stitched together. Although more efficient, the feature extraction capability is relatively weak [37]. This study uses a 2D convolutional downsampling module based on Swin Transformer. It is able to enrich the contextual semantics and acquire global features with the self-attention mechanism in the feature extraction phase. There are two problems in applying Transformer to the field of 3D target detection. Firstly, the 3D target entity has a wide range of variations. For objects of different sizes, the detection effect of Transformer is not stable. Secondly, the height (H) and width (W) are very large and too long after being transformed into feature words (tokens). It is difficult to deploy and run on embedded devices. In this study, a variant version of the Transformer structure, Swin Transformer, is used for feature map sampling. It restricts the attention computation to a certain window range by two sliding window operations: non-overlapping local window and overlapping cross window. While introducing the localisation of CNN operations, it greatly reduces the computational effort of the Transformer in computing the attention matrix. Moreover, the sliding window computation is more friendly to hardware implementation. However, the improvements in the feature acquisition module have definitely made the network more complex, increasing the difficulty of deploying it on an embedded system. The results in Figure 8 also show that the processing speed of the used network is slower than the original one. There is still much space for advancing in simplifying the network structure and increasing the processing speed.
In addition, we applied two additional improved networks derived from PointPillars to the rubber forest dataset for the segmentation task. Zhang et al. [24] proposed an improved algorithm named TGPP: Transformer-based Global PointPillars. After dividing the point cloud into multiple pillars, global contextual features and local structural features are extracted through a multi-head attention mechanism. Zhang et al. [38] propose a 2D fusion attention module that fuses features from multiple pseudo-images in height and channel dimensions to enhance the representation of feature information. The experimental results showed that the segmentation precision achieved 0.8745 and 0.9132, respectively. It shows the effectiveness of the composite use of multi-scale feature extraction and Swin Transformer in this study.
The aim of our research has always been to reduce the accuracy loss and increase the processing speed. Firstly, in reducing the accuracy loss, more powerful backbone networks such as PointNet++ or SparseConvNet are considered. In order to better retain the information about the objects, different sampling densities and methods can be tried to obtain better performance. And post-processing techniques, such as non-maximal suppression (NMS) or post-segmentation analysis of connected components, can be introduced to help remove overlapping detection frames or noise points in the segmentation results. Secondly, in terms of increasing the processing speed, simplifying the network structure is a necessary operation. Pruning (the removal of unimportant connections) and quantisation (the reduction in weighting accuracy) of the trained network is considered to reduce the model size and computational complexity. Downsampling operations can be used in the early stages of the network, and then upsampling can be used in the subsequent stages to restore the resolution to reduce the computation. Dedicated hardware accelerators (e.g., FPGAs, ASICs) can also be considered to be introduced to accelerate the point cloud segmentation task for higher processing speed. Finally, when applying improved point cloud segmentation networks to practical production applications, especially when deployed on embedded systems, a number of improvements and optimisations need to be considered to ensure that the model can operate efficiently in resource-constrained environments. Reducing the computational and memory requirements of the model is critical. Consider optimising the data preprocessing steps to reduce processing time and memory footprint. After completing all simplifications, staticise the model. The model can also be split into multiple parts and run in parallel on multiple processing units to increase processing speed. This is especially important for embedded systems using multi-core CPUs or GPUs. These methods can be selected and combined based on specific application requirements and hardware resources. Different approaches are carefully evaluated, and several performance tests and optimisation iterations are performed to determine the most appropriate strategy for a given task and environment.
4.3. Comparison of Trunk Fitting Methods
From the distribution of true values of neighbouring trunk spacing (see Figure 9), it can be observed that the planting rule of 7 m × 3 m is basically complied with. There are still differences in the distribution of spacing across and within rows. For across-row spacing, there is still a considerable distribution outside the 25∼75% range, while for within-row spacing, there were significantly fewer values outside the 25∼75% range. This indicates that the rubber trees were actually planted in rows and the within-row spacing was better controlled. It is also in line with the actual situation. The parallel arrangement of tree rows is more difficult to control as there are often intervening factors between rows such as fertiliser ditches and footpaths.
The quality of the fit to the trunk columns directly affects the subsequent construction of the map. Combined with the quantitative analyses in Figure 10 and Table 2, the results of the RANSAC and IRTLS fitting methods do not differ significantly for the calculation of the distance between neighbouring rubber tree trunks. And both show similar dispersion at larger distances. The differences between the two fitting methods are mainly in the calculation of trunk radius at different heights. At lower sites below 1.0 m, the overall IRTLS fitting results are closer to the true values. Their MAE and RMSE perform better than the RANSAC values. Above 1.0 m, the IRTLS calculations remain better as the height increases. However, the MAE and RMSE values for both methods increased significantly. It is presumed that this is due to the increased offset of the centre of the trunk circle at higher parts of the tree. And at the same time the trunk radius decreases, which increases the fitting difficulty. Especially at the highest part of the dataset, 2.2 m, the correlation coefficient of IRTLS, 0.8555, is lower than the values at other heights and significantly higher than that of RANSAC, 0.5693. This indicates that IRTLS shows more robustness to the trunk radius outliers at the higher parts of the dataset.The iterative correction attribute of IRTLS itself helps to reduce the computational errors and improve the fitting accuracy.
4.4. Map Creation for Trunk Growth Modelling
Establishing the growth information map of rubber trees is very important for improving the fine management of rubber forests. The map building method based on 3D LiDAR remote sensing undoubtedly meets the demand for smoothing between large-scale and complex details in the rubber forest environment. In Figure 12, the across-row distances and within-row distances of all neighbouring trunks at the Position 31901 are counted, characterising the location of the rubber tree. This approach can replace the absolute position coordinates obtained by RTK-GNSS in some practical scenarios.
The effective composite of multidimensional information forms the core of the rubber forest growth model map. In Figure 12, each trunk carries radius data at six heights ranging from 0.2 m to 2.2 m. As the tree continues to grow, the height increases. The centre coordinates of the trunk circle at different heights may be shifted. The external manifestation is the tilted posture of the tree. In addition, the trunk usually appears as a rounded platform with a narrow top and a wide bottom. A solid base firmly supports the tall body. However, abnormalities may still occur due to typhoons, pests, diseases, etc. A variety of factors make up the various appearances of trees.
In future studies, information such as canopy [39] and leaf area index will also be added to the growth model maps to enrich the information dimension. This will greatly benefit applications such as biomass statistics and precision management. Enhancing the model’s ability to more accurately estimate plant growth and biomass will help to better understand and manage vegetation. Specifically, multiple sensors such as LiDAR and spectral cameras are used to acquire information such as canopy and leaf area index, which are combined with growth model maps for multimodal data fusion and used in model training and inference. Deep learning methods can effectively capture complex relationships between data and provide more accurate predictions. Developing models based on plant parameterisation can better simulate plant growth and change processes. However, the complexity of data collection, processing and integration needs to be considered together to ensure the feasibility and benefits of subsequent approaches.
Also, in the forestry or field domains where operations are carried out on a large scale, the creation of priori maps can help vehicles to achieve rapid positioning and path planning. For example, in field spraying studies, priori maps provide precise geographic information that can help in target crop detection and spray path optimisation [40,41]. The data associated with the crops can be used to monitor the health of the field, evaluate the effectiveness of different spraying strategies and improve future spraying programmes.
5. Conclusions
In this paper, a backpack point cloud acquisition system is built to collect 3D LiDAR point clouds in a rubber forest. An improved PointPillars-based 3D target detection network is proposed. And a growth model map of the rubber forest is constructed based on the relative positions and key structural parameters of the neighbouring tree trunks obtained from IRTLS cylindrical fitting. The method used can effectively detect the target trunks with precision and recall of 0.9613 and 0.8754, respectively. The established information map can clearly display the position and growth data of the trunks, which guides the precise navigation and automated operation of the operating vehicles. In future research, more data will be added to the information map to enrich the structural dimension of forest resources.
Author Contributions
Conceptualization, C.Z.; methodology, H.Z.; software, H.Z.; validation, J.Z.; formal analysis, J.Z.; writing—original manuscript preparation, H.Z.; writing—review and editing, G.Z.; investigation, J.Z.; project management, C.Z.; and funding acquisition, G.Z. All authors have read and agreed to the published version of the manuscript.
Funding
This research was supported by the Inner Mongolia Science and Technology Program (2022YFSJ0039) and the General Program of National Natural Science Foundation of China (62273001).
Data Availability Statement
The data presented in this study are available on request from the corresponding author.
Acknowledgments
We want to thank the Chinese Academy of Tropical Agricultural Sciences (CATAS) for their help during the experiments. We would also like to thank Jin Gao and Fan Zhang for their support and feedback.
Conflicts of Interest
The authors declare that they have no known competing financial interest or personal relationships that could have appeared to influence the work reported in this paper.
References
- Haboudane, D.; Miller, J.R.; Tremblay, N.; Zarco-Tejada, P.J.; Dextraze, L. Integrated narrow-band vegetation indices for prediction of crop chlorophyll content for application to precision agriculture. Remote Sens. Environ. 2002, 81, 416–426. [Google Scholar] [CrossRef]
- Corwin, D.L.; Lesch, S.M. Application of Soil Electrical Conductivity to Precision Agriculture. Agron. J. 2003, 95, 455–471. [Google Scholar]
- Mulla, D.J. Twenty five years of remote sensing in precision agriculture: Key advances and remaining knowledge gaps. Biosyst. Eng. 2013, 114, 358–371. [Google Scholar] [CrossRef]
- Li, D.; Fan, S.; He, A.; Yin, F. Forest resources and environment in China. J. For. Res. 2005, 9, 307–312. [Google Scholar] [CrossRef]
- Tang, L.; Shao, G. Drone remote sensing for forestry research and practices. J. For. Res. 2015, 26, 791–797. [Google Scholar] [CrossRef]
- LaRue, E.A.; Wagner, F.W.; Fei, S.; Atkins, J.W.; Fahey, R.T.; Gough, C.M.; Hardiman, B.S. Compatibility of Aerial and Terrestrial LiDAR for Quantifying Forest Structural Diversity. Remote Sens. 2020, 12, 1407. [Google Scholar] [CrossRef]
- Mercker, D. Precision Forestry. Ala. Treasured For. 2005, 2, 24. [Google Scholar]
- Senganimalunje, T.C.; Chirwa, P.W.; Babalola, F.D. Potential of institutional arrangements for sustainable management of forests under co-management with local forest organisations in Mua-Livulezi Forest Reserve, Mtakataka, Malawi. Int. For. Rev. 2015, 17, 340–354. [Google Scholar] [CrossRef]
- Zhou, H.; Zhang, S.; Zhang, J.; Zhang, C.; Wang, S.; Zhai, Y.; Li, W. Design, development, and field evaluation of a rubber tapping robot. J. Field Robot. 2022, 39, 28–54. [Google Scholar] [CrossRef]
- Zhou, H.; Gao, J.; Zhang, F.; Zhang, J.; Wang, S.; Zhang, C.; Li, W. Evaluation of Cutting Stability of a Natural-Rubber-Tapping Robot. Agriculture 2023, 13, 583. [Google Scholar] [CrossRef]
- Zhou, H.; Zhang, J.; Ge, L.; Yu, X.; Wang, Y.; Zhang, C. Research on volume prediction of single tree canopy based on three-dimensional (3D) LiDAR and clustering segmentation. Int. J. Remote Sens. 2021, 42, 738–755. [Google Scholar] [CrossRef]
- Thiel, C.; Schmullius, C. Comparison of UAV photograph-based and airborne lidar-based point clouds over forest from a forestry application perspective. Int. J. Remote Sens. 2017, 38, 2411–2426. [Google Scholar] [CrossRef]
- Zald, H.S.J.; Wulder, M.A.; White, J.C.; Hilker, T.; Hermosilla, T.; Hobart, G.W.; Coops, N.C. Integrating Landsat pixel composites and change metrics with lidar plots to predictively map forest structure and aboveground biomass in Saskatchewan, Canada. Remote Sens. Environ. 2016, 176, 188–201. [Google Scholar] [CrossRef]
- Atkins, J.W.; Bhatt, P.; Carrasco, L.; Francis, E.; Garabedian, J.E.; Hakkenberg, C.R.; Hardiman, B.S.; Jung, J.; Koirala, A.; LaRue, E.A.; et al. Integrating Forest Structural Diversity Measurement into Ecological Research. Ecosphere 2023, 14, e4633. [Google Scholar] [CrossRef]
- Kang, J.; Wang, L.; Jia, K.; Niu, Z.; Shakir, M.; Qiao, H.; Zhao, X. Identifying crown areas in an undulating area planted with eucalyptus using unmanned aerial vehicle near-infrared imagery. Remote Sens. Lett. 2016, 7, 561–570. [Google Scholar] [CrossRef]
- Jeronimo, S.M.; Kane, V.R.; Churchill, D.J.; McGaughey, R.J.; Franklin, J.F. Applying LiDAR Individual Tree Detection to Management of Structurally Diverse Forest Landscapes. J. For. 2018, 116, 336–346. [Google Scholar] [CrossRef]
- Einzmann, K.; Immitzer, M.; Böck, S.; Bauer, O.; Schmitt, A.; Atzberger, C. Windthrow Detection in European Forests with Very High-Resolution Optical Data. Forests 2017, 8, 21. [Google Scholar] [CrossRef]
- Xia, K.; Li, C.; Yang, Y.; Deng, S.; Feng, H. Study on Single-Tree Extraction Method for Complex RGB Point Cloud Scenes. Remote Sens. 2023, 15, 2644. [Google Scholar] [CrossRef]
- Wielgosz, M.; Puliti, S.; Wilkes, P.; Astrup, R. Point2Tree(P2T)—Framework for Parameter Tuning of Semantic and Instance Segmentation Used with Mobile Laser Scanning Data in Coniferous Forest. Remote Sens. 2023, 15, 3737. [Google Scholar] [CrossRef]
- Eysn, L.; Hollaus, M.; Lindberg, E.; Berger, F.; Monnet, J.-M.; Dalponte, M.; Kobal, M.; Pellegrini, M.; Lingua, E.; Mongus, D.; et al. A Benchmark of Lidar-Based Single Tree Detection Methods Using Heterogeneous Forest Data from the Alpine Space. Forests 2015, 6, 1721–1747. [Google Scholar] [CrossRef]
- Geiger, A.; Lenz, P.; Stiller, C.; Urtasun, R. Vision meets robotics: The KITTI dataset. Int. J. Robot. Res. 2013, 32, 1231–1237. [Google Scholar] [CrossRef]
- Ding, P.; Wang, Z. 3D LiDAR point cloud loop detection based on dynamic object removal. In Proceedings of the 2021 IEEE International Conference on Real-time Computing and Robotics (RCAR), Xining, China, 15–19 July 2021; pp. 980–985. [Google Scholar]
- Wang, J.; Fan, J.; Xue, J.; Bai, X.; Diao, J. Lidar Point Cloud Object Detection and Semantic Segmentation Fusion Based on Bird’s-Eye-View. In Proceedings of the 2022 6th CAA International Conference on Vehicular Control and Intelligence (CVCI), Nanjing, China, 28–30 October 2022; pp. 1–6. [Google Scholar]
- Zhang, L.; Meng, H.; Yan, Y.; Xu, X. Transformer-Based Global PointPillars 3D Object Detection Method. Electronics 2023, 12, 3092. [Google Scholar] [CrossRef]
- Stanisz, J.; Lis, K.; Gorgon, M. Implementation of the pointpillars network for 3D object detection in reprogrammable heterogeneous devices using FINN. J. Signal Process. Syst. 2022, 94, 659–674. [Google Scholar] [CrossRef]
- Gao, S.H.; Cheng, M.M.; Zhao, K.; Zhang, X.Y.; Yang, M.H.; Torr, P. Res2Net: A New Multi-Scale Backbone Architecture. IEEE Trans. Pattern Anal. Mach. Intell. 2021, 2, 652–662. [Google Scholar] [CrossRef]
- Liu, Z.; Lin, Y.; Cao, Y.; Hu, H.; Wei, Y.; Zhang, Z.; Lin, S.; Guo, B. Swin transformer: Hierarchical vision transformer using shifted windows. In Proceedings of the IEEE/CVF International Conference on Computer Vision, Montreal, QC, Canada, 10–17 October 2021; pp. 10012–10022. [Google Scholar]
- Han, K.; Xiao, A.; Wu, E.; Guo, J.; Xu, C.; Wang, Y. Transformer in transformer. Adv. Neural Inf. Process. Syst. 2021, 34, 15908–15919. [Google Scholar]
- Chen, X.L.; Zhao, J.; Chen, S.Y. Lightweight semantic segmentation network based on attention coding. Laser Optoelectron. Prog. 2021, 58, 1410012. [Google Scholar]
- Choi, S.; Kim, T.; Yu, W. Performance evaluation of RANSAC family. J. Comput. Vis. 1997, 24, 271–300. [Google Scholar]
- Schnabel, R.; Wahl, R.; Klein, R. Efficient RANSAC for Point-Cloud Shape Detection. Comput. Graph. Forum 2007, 26, 214–226. [Google Scholar] [CrossRef]
- Nelder, J.A.; Mead, R. A simplex method for function minimization. Comput. J. 1965, 7, 308–313. [Google Scholar] [CrossRef]
- de Conto, T.; Olofsson, K.; Görgens, E.B.; Rodriguez, L.C.E.; Almeida, G. Performance of stem denoising and stem modelling algorithms on single tree point clouds from terrestrial laser scanning. Comput. Electron. Agric. 2017, 143, 165–176. [Google Scholar] [CrossRef]
- Liang, X.; Litkey, P.; Hyyppä, J.; Kaartinen, H.; Vastaranta, M.; Holopainen, M. Automatic stem mapping using single-scan terrestrial laser scanning. IEEE Trans. Geosci. Remote Sens. 2012, 50, 661–670. [Google Scholar] [CrossRef]
- Li, Z.; Wu, Y.; Peng, B.; Chen, X.; Sun, Z.; Liu, Y.; Paul, D. SeTransformer: A Transformer-Based Code Semantic Parser for Code Comment Generation. IEEE Trans. Reliab. 2023, 72, 258–273. [Google Scholar] [CrossRef]
- Yi, S.; Li, J.; Jiang, G.; Liu, X.; Chen, L. CTseg: A cascade composite transformer semantic segmentation network for UAV visual perception. Measurement 2023, 211, 112612. [Google Scholar] [CrossRef]
- Chen, D.; Yu, W.; Gao, Y. Lidar 3D Target Detection Based on Improved PointPillars. Laser Optoelectron. Prog. 2023, 60, 1028012. [Google Scholar]
- Zhang, J.; Xu, D.; Wang, J.; Li, Y. An Improved Detection Algorithm for Pre-processing Problem Based on PointPillars. In Proceedings of the 2021 14th International Congress on Image and Signal Processing, BioMedical Engineering and Informatics (CISP-BMEI), Shanghai, China, 23–25 October 2021; Volume 2021, pp. 1–6. [Google Scholar]
- Ma, Z.; Pang, Y.; Wang, D.; Liang, X.; Chen, B.; Lu, H.; Weinacker, H.; Koch, B. Individual Tree Crown Segmentation of a Larch Plantation Using Airborne Laser Scanning Data Based on Region Growing and Canopy Morphology Features. Remote Sens. 2020, 12, 1078. [Google Scholar] [CrossRef]
- Campos, J.; Llop, J.; Gallart, M.; García-Ruiz, F.; Gras, A.; Salcedo, R.; Gil, E. Development of canopy vigour maps using UAV for site-specific management during vineyard spraying process. Precis. Agric. 2019, 20, 1136–1156. [Google Scholar] [CrossRef]
- Esau, T.; Zaman, Q.U.; Groulx, D.; Chang, Y.K.; Schumann, A.W.; Havard, P. Supplementary Light Source Development for Camera-Based Smart Spraying in Low Light Conditions. Appl. Eng. Agric. 2017, 33, 5–14. [Google Scholar]


Disclaimer/Publisher’s Note: The statements, opinions and data contained in all publications are solely those of the individual author(s) and contributor(s) and not of MDPI and/or the editor(s). MDPI and/or the editor(s) disclaim responsibility for any injury to people or property resulting from any ideas, methods, instructions or products referred to in the content. |
© 2023 by the authors. Licensee MDPI, Basel, Switzerland. This article is an open access article distributed under the terms and conditions of the Creative Commons Attribution (CC BY) license (https://creativecommons.org/licenses/by/4.0/).