

Flood Monitoring Using Sentinel-1 SAR for Agricultural Disaster Assessment in Poyang Lake Region


Abstract
:1. Introduction
2. Study Area and Data Sources
2.1. Overview of the Study Area
2.2. Data Source
2.3. Data Preprocessing
3. Methods
3.1. Image Feature Extraction
- (1)
- Radar image feature
- (2)
- Sentinel-1 dual-polarized water index
- (3)
- Topographic feature
3.2. Water Extraction Method
- (1)
- Decision Tree
- (2)
- Random Forest
- (3)
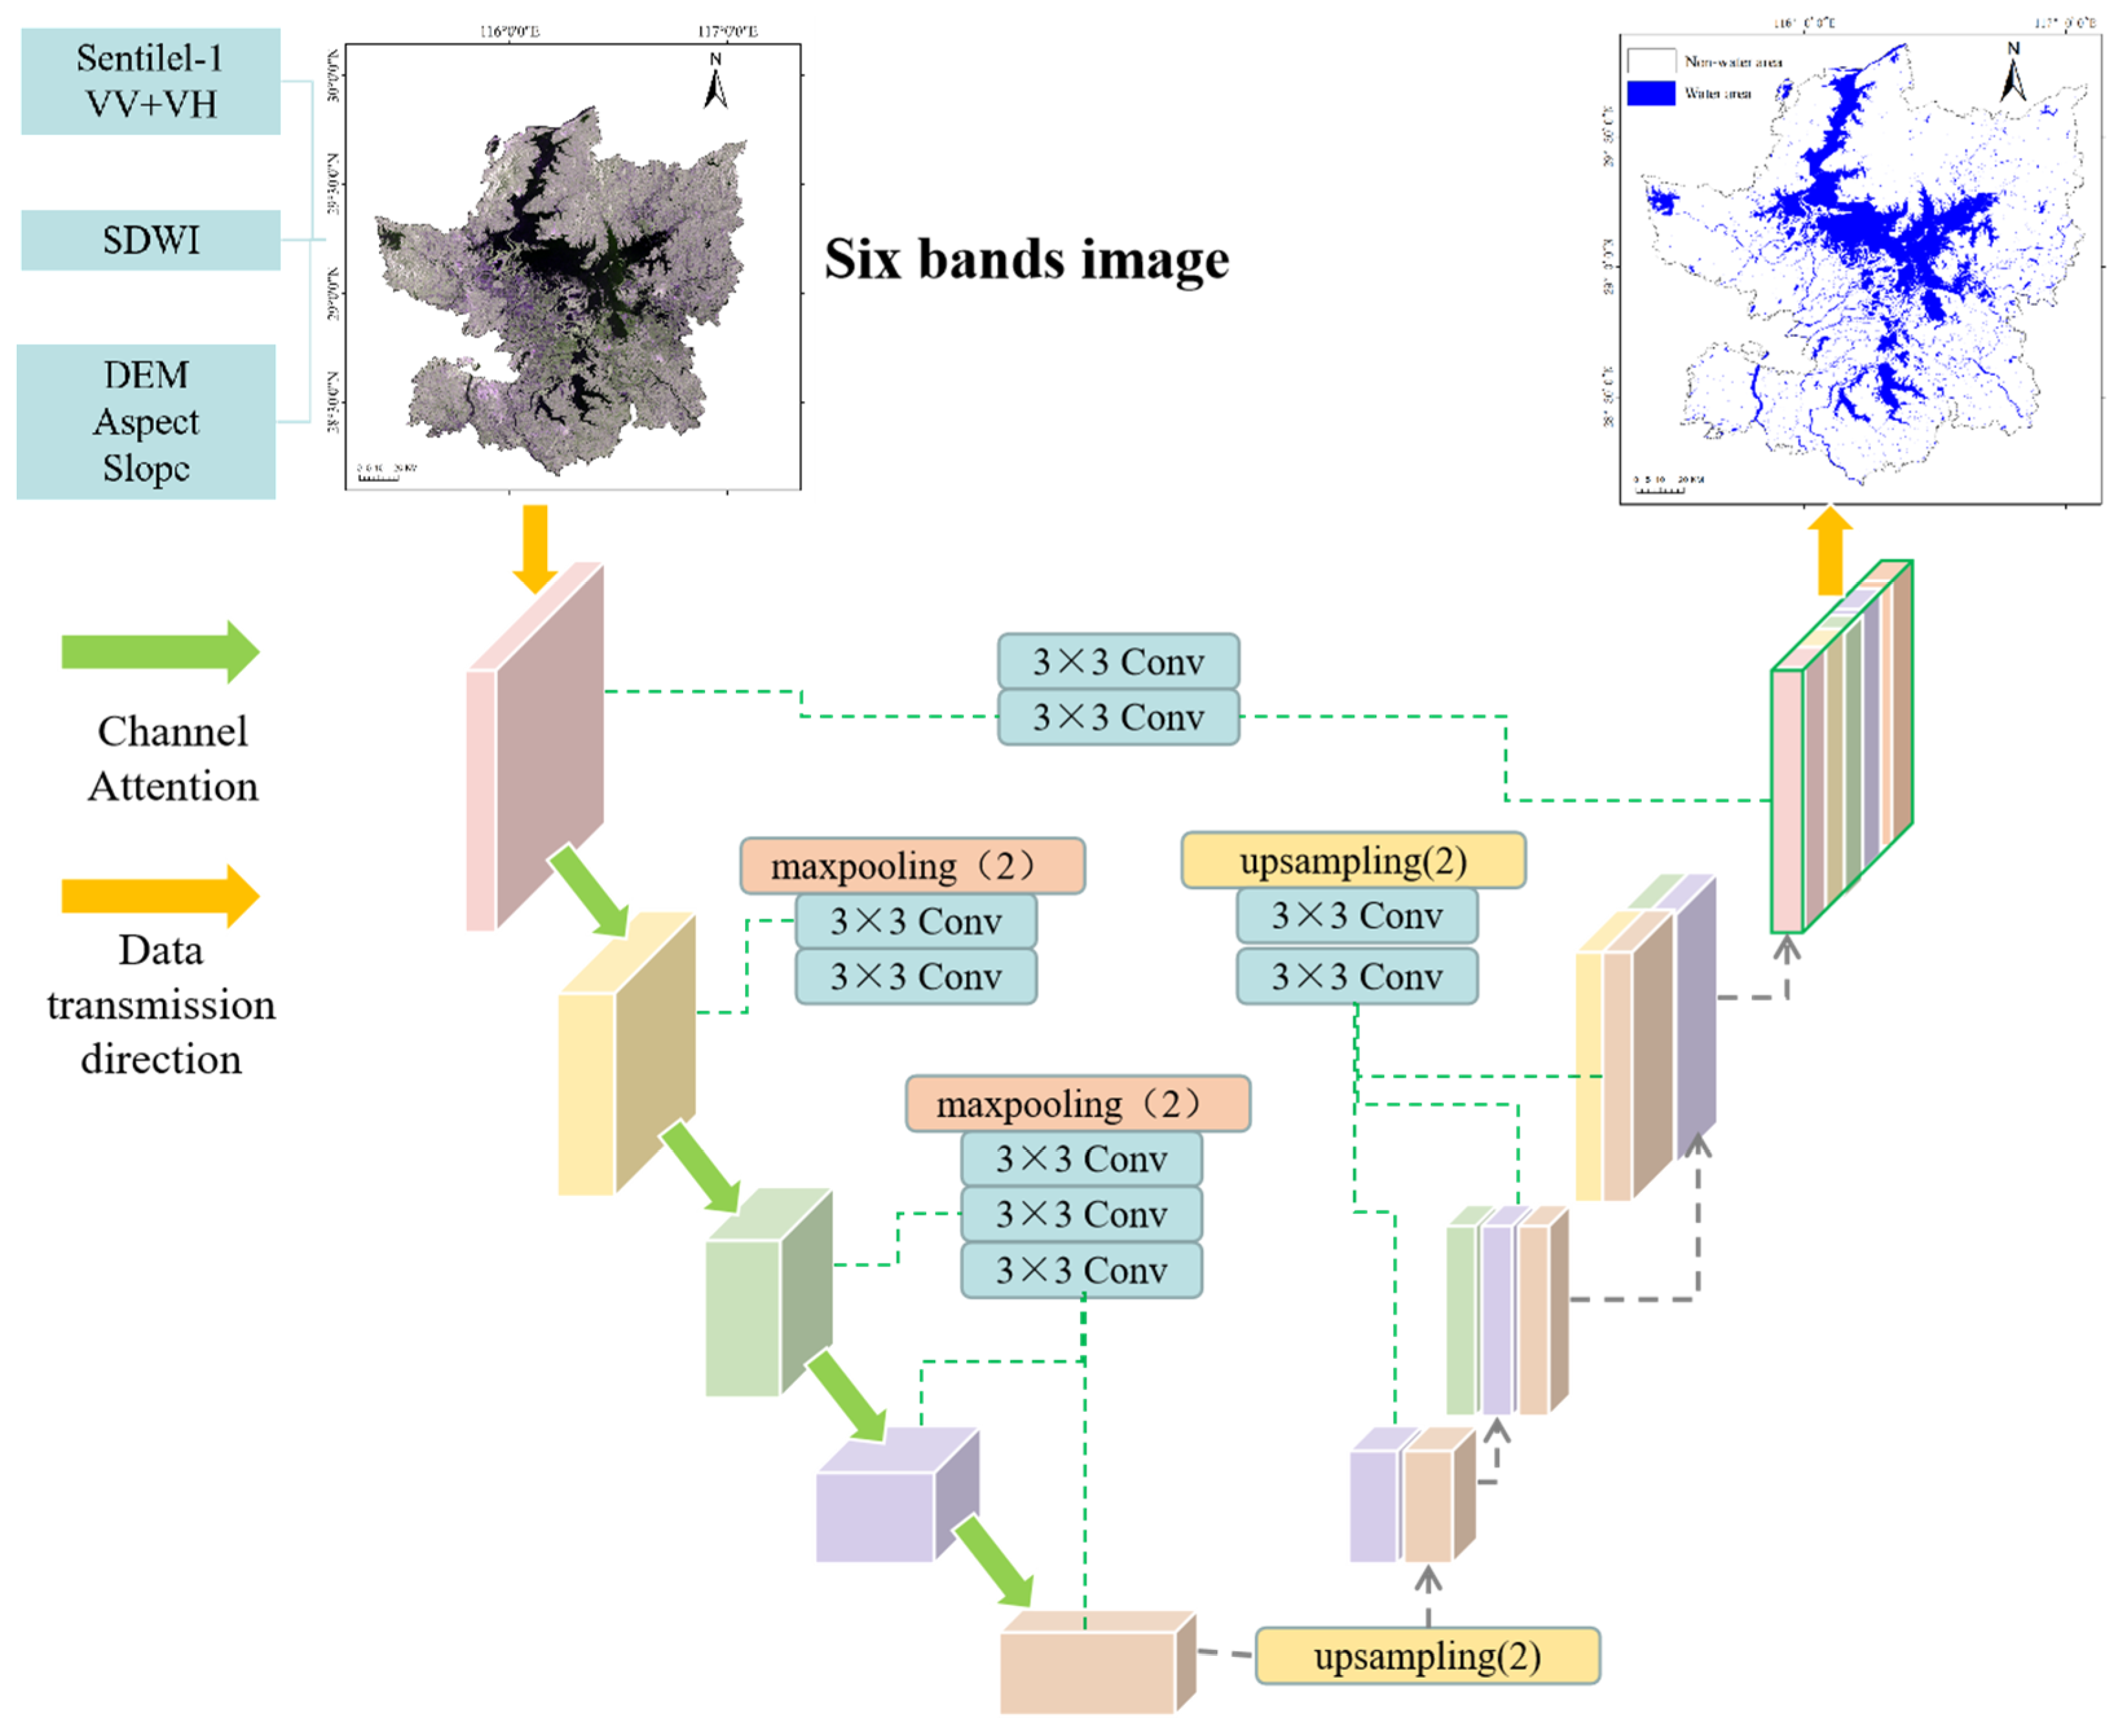
- Improved U-Net
3.3. Sample Selection
3.4. Accuracy Evaluation
4. Results
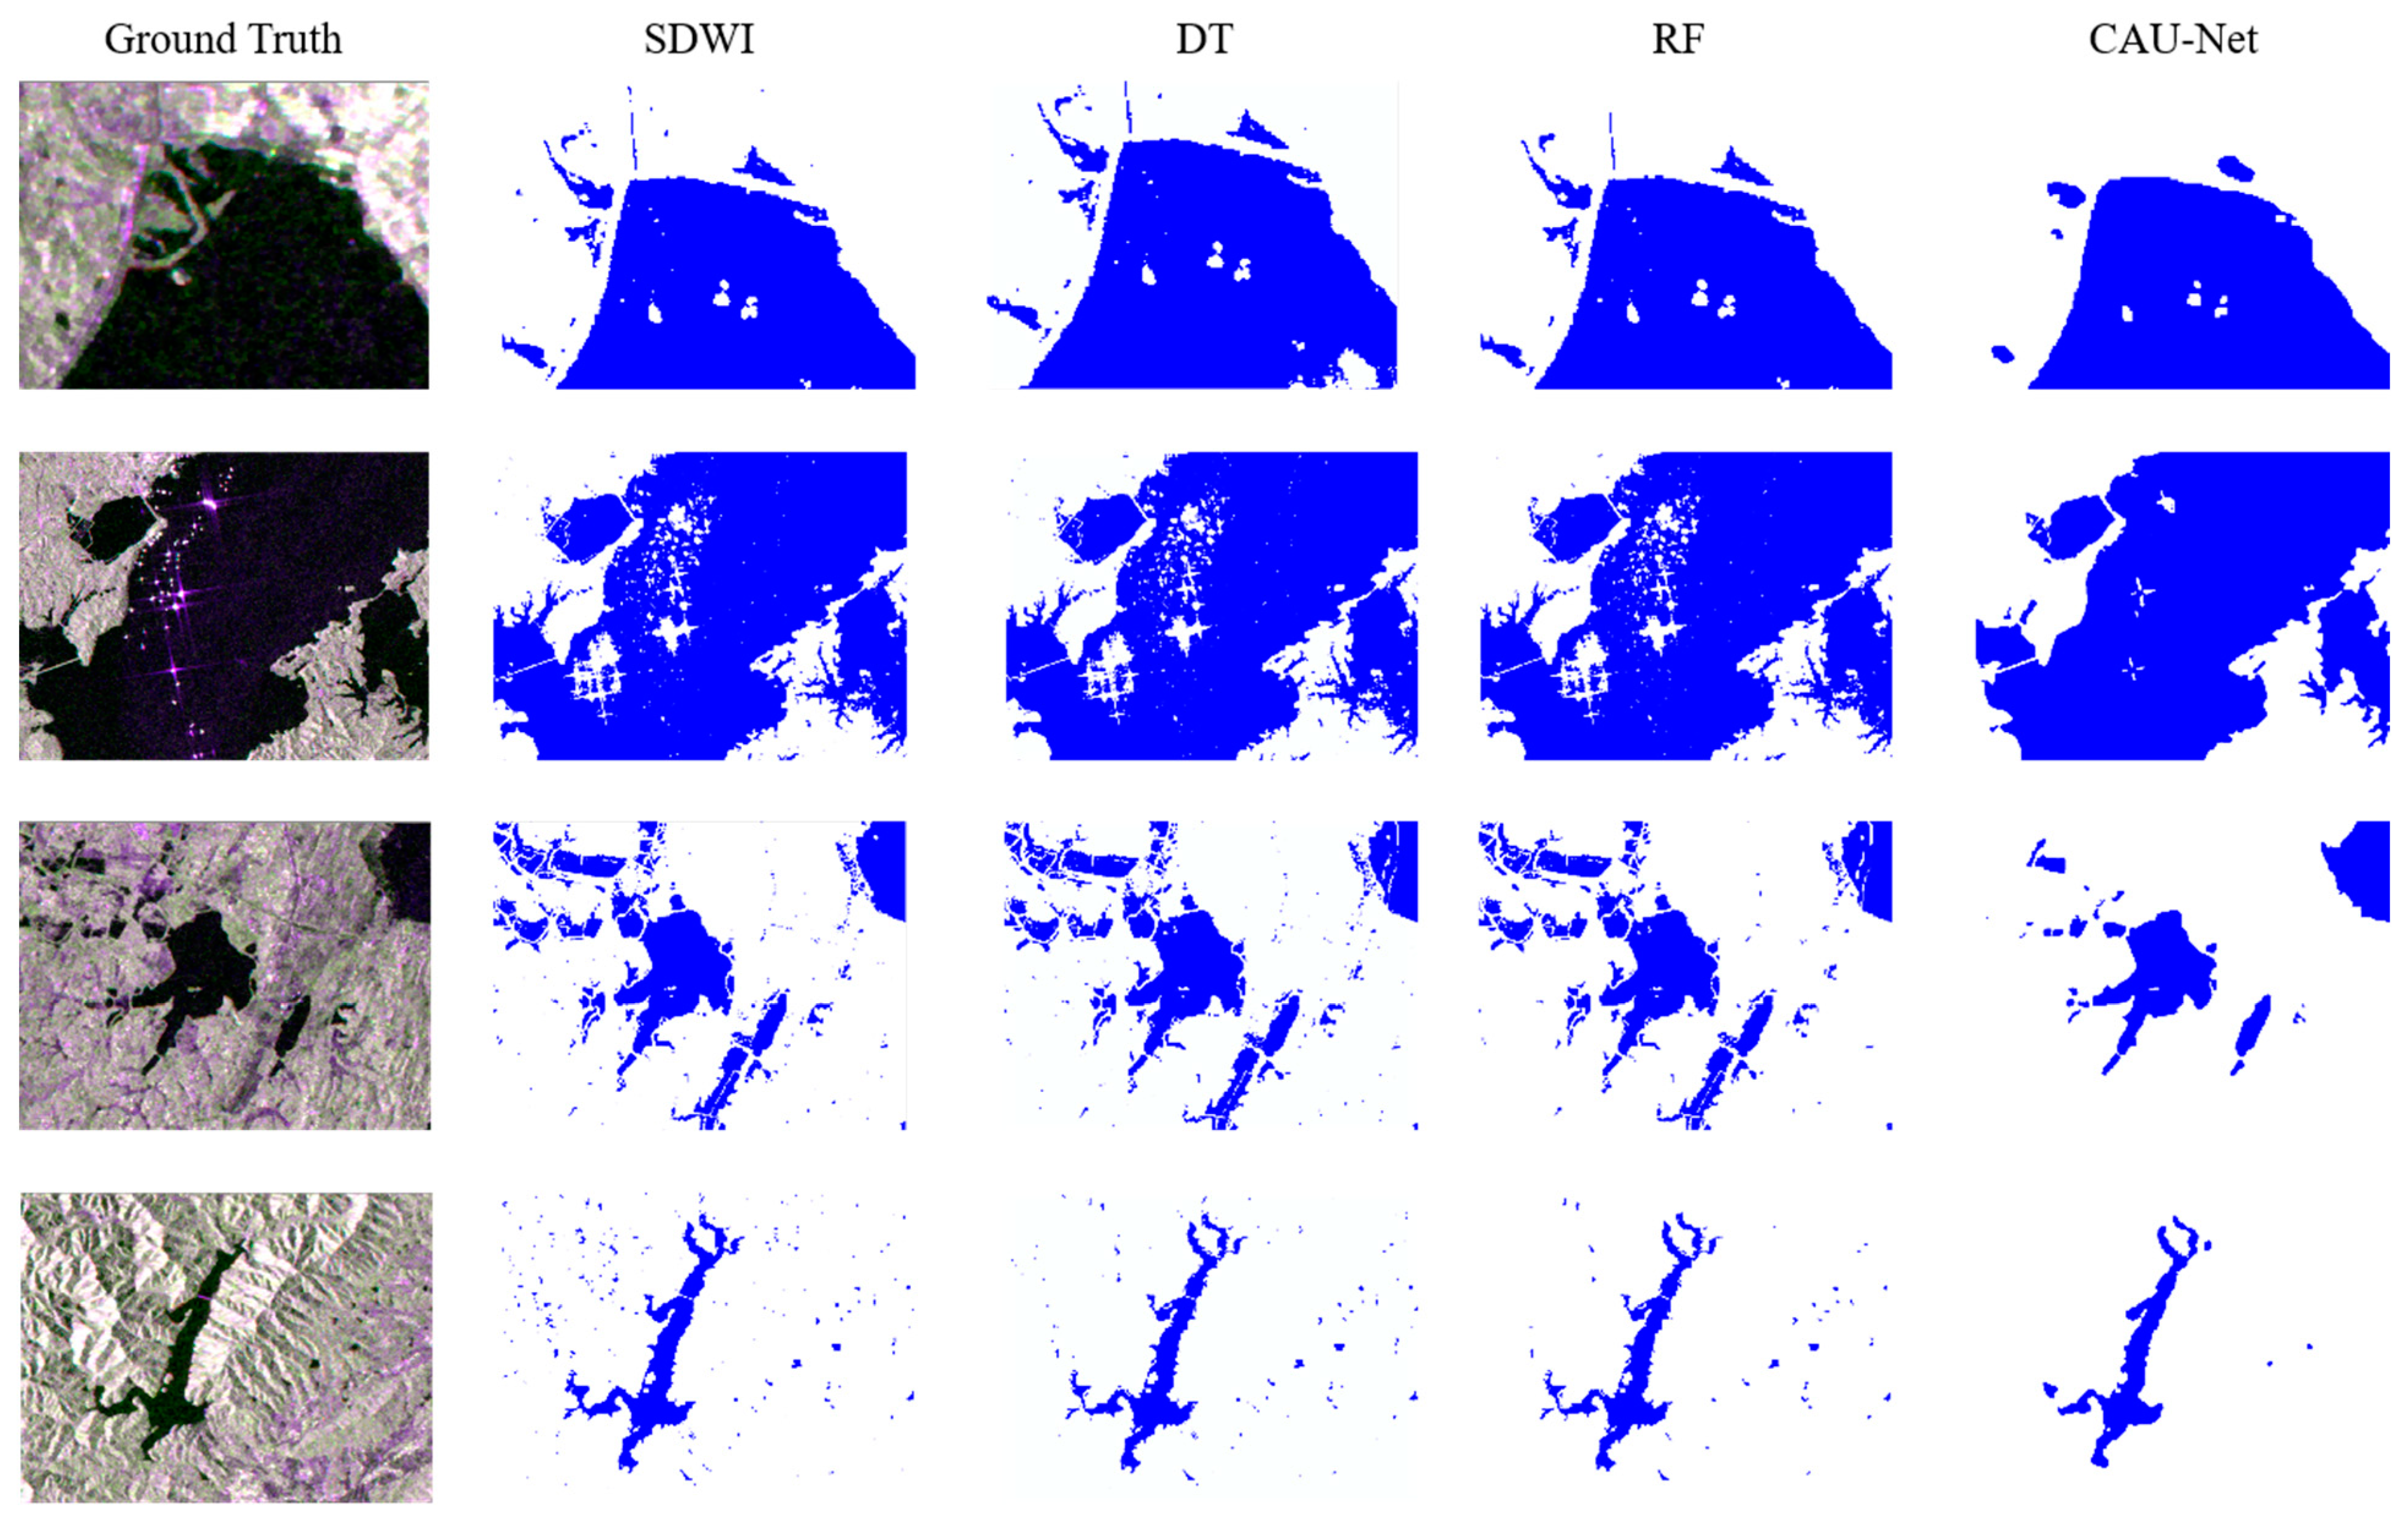
4.1. Qualitative Comparison of Water Extraction Results
4.2. Quantitative Comparison of Water Extraction Results
4.3. Analysis of Flood Disaster in Poyang Lake
5. Discussion
6. Conclusions
- (1)
- During the rainy season, optical imagery in the southern hilly regions is severely constrained by cloudy and rainy weather conditions. This study effectively addressed this issue by utilizing Sentinel-1 SAR imagery in conjunction with multi-source data. The results demonstrate the feasibility of employing SAR imagery in flood disaster monitoring in the Poyang Lake region, providing a key technological reference for future efforts in flood disaster management.
- (2)
- The deep learning approach demonstrates notable advantages in land feature extraction tasks. With the aim of addressing the issue of interference from mountain shadows in the study area, we propose the CAU-Net method for water body extraction. This method achieves an overall accuracy of 98.71% and a Kappa coefficient of 0.97 in water body extraction within the study area, both of which are at the highest level among the various methods. In the highland areas with abundant mountain shadows, its extraction accuracy reaches 96.45%, representing a significant improvement of 7.09% compared to the SDWI method. CAU-Net effectively facilitates water body extraction in hilly regions. Moreover, it enables the water exaction of long-term image sequences, thereby realizing the monitoring of flood disaster processes. CAU-Net provides a new technical means for flood monitoring in the Poyang Lake region.
- (3)
- The analysis of long-term image sequences in the study area reveals that the flood area expanded rapidly and subsequently receded slowly. The severely affected areas are primarily located around lakes and rivers, or in relatively low-lying terrain, coinciding with the crop cultivation areas. By analyzing the water body extraction results before and after the flood, this study accurately quantified the flooded area, providing data support for disaster assessments and post-disaster reconstruction.
Author Contributions
Funding
Data Availability Statement
Conflicts of Interest
References
- The Ministry of Emergency Management Released the Basic Situation of National Natural Disasters in 2020; China Disaster Reduction: Beijing, China, 2021; p. 60.
- Top Ten Natural Disasters in China in 2020; China Disaster Reduction: Beijing, China, 2021; p. 60.
- McFeeters, S.K. The use of the Normalized Difference Water Index (NDWI) in the delineation of open water features. Int. J. Remote Sens. 1996, 17, 1425–1432. [Google Scholar] [CrossRef]
- Duan, J.W.; Zhong, J.S.; Jiang, L.; Zhong, M. Extraction Method of Ultra-Green Water Index for Flood Area After Rain Based on GF-2 Image. Geogr. Geogr. Inf. Sci. 2021, 37, 35–41. [Google Scholar]
- Wu, Q.S.; Wang, M.X.; Shen, Q.; Yao, Y.; Li, J.; Zhang, F.; Zhou, Y. Small water body extraction method based on Sentinel-2 satellite multi-spectral remote sensing image. Natl. Remote Sens. Bull. 2022, 26, 781–794. [Google Scholar] [CrossRef]
- Guo, X.; Zhao, Y.D. Floodinundation Monitoring in Ningxiang of Hunan Province Based on Sentinel-1A SAR. Remote Sens. Technol. Appl. 2018, 33, 646–656. [Google Scholar]
- Zeng, L.F.; Li, L.; Wan, L.H. SAR-based Fast Flood Mapping Using Sentinel-1 Imagery. Geomat. World 2015, 22, 100–103, 107. [Google Scholar]
- Chen, S.N.; Jiang, M. Application Research of Sentinel-1 SAR in Flood Range Extraction and Polarization Analysis. J. Geo-Inf. Sci. 2021, 23, 1063–1070. [Google Scholar]
- Jia, S.C.; Xue, D.J.; Li, C.R. Study on New Method for Water Area Information Extraction based on Sentinel-1 data. Yangtze River 2019, 50, 213–217. [Google Scholar]
- Qiu, J.; Cao, B.; Park, E.; Yang, X.; Zhang, W.; Tarolli, P. Flood Monitoring in Rural Areas of the Pearl River Basin (China) Using Sentinel-1 SAR. Remote Sens. 2021, 13, 1384. [Google Scholar] [CrossRef]
- Tang, L.; Liu, W.; Yang, D.; Chen, L.; Su, Y.; Xu, X. Flooding Monitoring Application Based on the Object-oriented Method and Sentinel-1A SAR Data. J. Geo-Inf. Sci. 2018, 20, 377–384. [Google Scholar]
- Yang, C.J.; Wei, Y.M.; Wang, S.Y. Extracting the Flood Extent from SAR imagery on Basis of DEM. J. Nat. Disasters 2002, 11, 121–125. [Google Scholar]
- Li, F.; Sang, G.Q.; Sun, Y.; Cao, F.J. Research on Methods of Complex Water Body Information Extraction Based on GF-1 Satellite Remote Sensing Data. J. Univ. Jinan (Sci. Technol.) 2021, 35, 572–579. [Google Scholar]
- Pal, M.; Mather, P.M. An assessment of the effectiveness of decision tree methods for land cover classification. Remote Sens. Environ. 2003, 86, 554–565. [Google Scholar] [CrossRef]
- Li, H.K.; Wang, L.J.; Xiao, S.S. Random Forest Classification of Land Use in hilly and mountaineous Area of Southern China Using Multi-source Remote Sensing Data. Trans. Chin. Soc. Agric. Eng. 2021, 37, 244–251. [Google Scholar]
- Zhang, W.C.; Liu, H.B.; Wu, W. Classification of Land Use in Low Mountain and Hilly Area Based on Random Forest and Sentinel-2 Satellite Data: A Case Study of Lishi Town, Jiangjin, Chongqing. Resour. Environ. Yangtze Basin 2019, 28, 1334–1343. [Google Scholar]
- AKollert; Bremer, M.; Loew, M.; Rutzinger, M. Exploring the potential of land surface phenology and seasonal cloud free composites of one year of Sentinel-2 imagery for tree species mapping in a mountainous region. Int. J. Appl. Earth Obs. Geoinf. 2021, 94, 102208. [Google Scholar] [CrossRef]
- Chen, Y.; Fan, R.; Yang, X.; Wang, J.; Latif, A. Extraction of Urban Water Bodies from High-Resolution Remote-Sensing Imagery Using Deep Learning. Water 2018, 10, 585. [Google Scholar] [CrossRef]
- Song, S.; Liu, J.; Liu, Y.; Feng, G.; Han, H.; Yao, Y.; Du, M. Intelligent Object Recognition of Urban Water Bodies Based on Deep Learning for Multi-Source and Multi-Temporal High Spatial Resolution Remote Sensing Imagery. Sensors 2020, 20, 397. [Google Scholar] [CrossRef]
- Zheng, T.H.; Wang, Q.T.; Li, J.G.; Zheng, F.; Zhang, Y.; Zhang, N. Automatic Water Extraction from GF-6 Image Based on Deep Learning. Sci. Technol. Eng. 2021, 21, 1459–1470. [Google Scholar]
- Wang, B.; Chen, Z.L.; Wu, L.; Xie, P.; Fan, D.L.; Fu, B.L. Road extraction of high-resolution satellite remote sensing images in U-Net network with consideration of connectivity. J. Remote Sens. 2020, 24, 1488–1499. [Google Scholar] [CrossRef]
- Wang, X.W.; Zhao, Q.Z.; Tian, W.Z. Influence of U-Net Model on the Accuracy of Shelter Forest Extraction with Different Spatial Resolutions. Bull. Surv. Mapp. 2021, 39–43. [Google Scholar] [CrossRef]
- Wang, J.M.; Wang, S.X.; Wang, F.T.; Zhou, Y.; Ji, J.; Xiong, Y.; Wang, Z.; Zhao, Q. Flood inundation region extraction method based on Sentinel-1 SAR data. J. Catastrophol. 2021, 36, 214–220. [Google Scholar]
- Lei, S. Review and Thinking of Poyang Lake Flood in 2020. Water Resour. Prot. 2021, 37, 7–12. [Google Scholar]
- Luan, Y.J.; Guo, J.Y.; Gao, Y.G.; Liu, X. Remote Sensing Monitoring of Flood and Disaster Analysis in Shouguang in 2018 from Sentinel-1B SAR Data. J. Nat. Disasters 2021, 30, 168–175. [Google Scholar] [CrossRef]
- Zhang, D.Y.; Dai, Z.; Xu, X.G.; Yang, G.; Meng, Y.; Feng, H.; Hong, Q.; Jiang, F. Crop Classification of Modern Agricultural Park Based on Time-series Sentinel-2 Images. Infrared Laser Eng. 2021, 50, 262–272. [Google Scholar]
- Breiman, L. Random forests. Mach. Learn. 2001, 45, 5–32. [Google Scholar] [CrossRef]
- Zhao, X.; Tian, B.; Niu, Y.; Chen, C.; Zhou, Y. Classification of coastal salt marsh based on Sentinel-1 time series backscattering characteristics: The case of the Yangtze River delta. J. Remote. Sens. 2022, 26, 672–682. [Google Scholar] [CrossRef]
- Yang, S.; Li, D.; Yan, L.; Huang, Y.; Wang, M. Landslide Susceptibility Assessment in High and Steep Bank Slopes Along Wujiang River Based on Random Forest Model. Saf. Environ. Eng. 2021, 28, 131–138. [Google Scholar] [CrossRef]
- Ronneberger, O.; Fischer, P.; Brox, T. U-Net: Convolutional Networks for Biomedical Image Segmentation. arXiv 2015, arXiv:1505.04597. Available online: http://arxiv.org/abs/1505.04597 (accessed on 27 July 2023).
- Dong, Z.; Wang, G.; Amankwah, S.O.Y.; Wei, X.; Feng, A. Monitoring the summer flooding in the Poyang Lake area of China in 2020 based on Sentinel-1 data and multiple convolutional neural networks. Int. J. Appl. Earth Obs. Geoinf. 2021, 102, 102400. [Google Scholar] [CrossRef]
- Ning, X.-G.; Chang, W.-T.; Wang, H.; Zhang, H.; Zhu, Q. Extraction of marsh wetland in Heilongjiang Basin based on GEE and multi-source remote sensing data. Natl. Remote Sens. Bull. 2022, 26, 386–396. [Google Scholar] [CrossRef]
- Li, L.; Su, H.; Du, Q.; Wu, T. A novel surface water index using local background information for long term and large-scale Landsat images. ISPRS J. Photogramm. Remote Sens. 2021, 172, 59–78. [Google Scholar] [CrossRef]
- Njoku, E.G.; Moghaddam, M.; Moller, D.; Molotch, N. Microwave Remote Sensing for Land Hydrology Research and Applications: Introduction to the Special Issue. IEEE J. Sel. Top. Appl. Earth Obs. Remote Sens. 2010, 3, 3–5. [Google Scholar] [CrossRef]


| Data | Platform | Type | Polarization Mode |
|---|---|---|---|
| 30 September 2019 | Sentinel-1 B | GRD | VV, VH |
| 20 June 2020 | Sentinel-1 B | GRD | VV, VH |
| 2 July 2020 | Sentinel-1 B | GRD | VV, VH |
| 14 July 2020 | Sentinel-1 B | GRD | VV, VH |
| 26 July 2020 | Sentinel-1 B | GRD | VV, VH |
| 7 August 2020 | Sentinel-1 B | GRD | VV, VH |
| 19 August 2020 | Sentinel-1 B | GRD | VV, VH |
| Landform | Evaluation Index | SDWI | DT | RF | CAU-Net |
|---|---|---|---|---|---|
| High hill | OA | 89.36% | 95.87% | 96.19% | 96.45% |
| Kappa | 0.87 | 0.89 | 0.89 | 0.91 | |
| Low hill | OA | 91.48% | 94.69% | 95.18% | 95.11% |
| Kappa | 0.87 | 0.88 | 0.89 | 0.89 |
| Gauging Station | Highest Water Level/m | Warning Water Level/m | Occurrence Time | |
|---|---|---|---|---|
| 1 | Hukou | 22.49 | 19.50 | 12 July 2020 |
| 2 | Xingzi | 22.63 | 19.00 | 12 July 2020 |
| 3 | Yongxiu | 23.63 | 20.00 | 11 July 2020 |
| 4 | Duchang | 22.42 | 19.00 | 11 July 2020 |
| 5 | Poyang | 22.75 | 19.50 | 12 July 2020 |
Disclaimer/Publisher’s Note: The statements, opinions and data contained in all publications are solely those of the individual author(s) and contributor(s) and not of MDPI and/or the editor(s). MDPI and/or the editor(s) disclaim responsibility for any injury to people or property resulting from any ideas, methods, instructions or products referred to in the content. |
© 2023 by the authors. Licensee MDPI, Basel, Switzerland. This article is an open access article distributed under the terms and conditions of the Creative Commons Attribution (CC BY) license (https://creativecommons.org/licenses/by/4.0/).
Share and Cite
Li, H.; Xu, Z.; Zhou, Y.; He, X.; He, M. Flood Monitoring Using Sentinel-1 SAR for Agricultural Disaster Assessment in Poyang Lake Region. Remote Sens. 2023, 15, 5247. https://doi.org/10.3390/rs15215247
Li H, Xu Z, Zhou Y, He X, He M. Flood Monitoring Using Sentinel-1 SAR for Agricultural Disaster Assessment in Poyang Lake Region. Remote Sensing. 2023; 15(21):5247. https://doi.org/10.3390/rs15215247
Chicago/Turabian StyleLi, Hengkai, Zikun Xu, Yanbing Zhou, Xiaoxing He, and Minghua He. 2023. "Flood Monitoring Using Sentinel-1 SAR for Agricultural Disaster Assessment in Poyang Lake Region" Remote Sensing 15, no. 21: 5247. https://doi.org/10.3390/rs15215247
APA StyleLi, H., Xu, Z., Zhou, Y., He, X., & He, M. (2023). Flood Monitoring Using Sentinel-1 SAR for Agricultural Disaster Assessment in Poyang Lake Region. Remote Sensing, 15(21), 5247. https://doi.org/10.3390/rs15215247