1. Introduction
Extreme precipitation events are increasing in frequency and intensity in a number of regions of the globe, driven by climate change [
1]. These disruptions in precipitation patterns have consequences on the distribution of water areas, as well as their spatiotemporal dynamics, at various scales. Having knowledge about availability and distribution of water resources is extremely important in order to facilitate their management in the context of climate change. In particular, flooding is on the increase in many countries [
2], potentially leaving some 1.81 billion people exposed to a risk of 100-year floods [
3]. In Madagascar and the islands in the western Indian Ocean, these problems are compounded by cyclones [
4]. While the number of cyclones in the Indian Ocean is not rising, their impacts are increasingly severe [
5] and further amplified in developing nations through a lack of land planning and reliable and accessible data to inform decisions [
6]. Thanks to the increased availability of Earth observation data and the proliferation of different types of images (optical, radar, etc.), satellite imagery has proven to be a valuable tool for continuously mapping the distribution and dynamics of water bodies on a large scale. It also quickly helps identify large-scale flooded areas, aids in disaster relief planning, and contributes to damage quantification in the event of a cyclonic event [
7].
Flood map products are generated by a range of international organisations depending on the severity of specific cyclone events. ESA’s rapid mapping products are one example [
8]. They are usually obtained at the request of local authorities and/or through the International Charter Space and Major Disasters [
9]. The FAO also produces flood maps for assessing food security [
10]. However, these maps only cover relatively localised areas hit by major cyclones and not all territories affected by flooding. This level of event coverage justifies the need for other larger mapping products at the scale of the affected territories.
Because floods are accompanied by dense cloud cover, the utility of optical remote sensing approaches is nevertheless limited. Indeed, optical remote sensing can lead to an underestimation of flood extents due to the lack of timely cloud-free satellite imagery to coincide with cyclone events [
11]. Earth imaging systems like Landsat 8 and 9 or Sentinel-2 are therefore strongly constrained. Furthermore, intertropical zones are subject to frequent cloud cover. Radar satellite imagery offers a way around this issue, as the wavelengths in radar imagery are on the order of a centimetre, so the atmosphere is almost transparent to them [
12].
A flood is an uncommon body of standing water. Such surface water is detected by radar data because backpropagation radar waves from the water surface are much weaker than from other surfaces [
13,
14,
15]. However, radar imaging systems are also sensitive to surface roughness and the dielectric properties of the surface [
16]. It is also possible that the radar response from a standing water surface and a smooth soil surface will be similar. Moreover, side-view radar systems can create shadows in imagery. Comparing two radar images acquired before and during or just after a flood happened enables low backscatter features and permanent water bodies to be filtered out [
15].
Image comparison supports flood analysis and can be performed using supervised or unsupervised [
17,
18] change detection algorithms [
19,
20]. It can be performed using pixel-by-pixel simple algebraic operations like a ratio [
21] or textural indices [
22]. Comparisons can also be operated on previously identified features [
23]. The ratio between two images attenuates the speckle effect in radar images [
24]. Machine learning is also increasingly used in this field [
25]. Phase information from each pixel can also be used to identify changes. Interferometric coherence has been employed to detect floodwaters in urban areas [
26].
A digital elevation model (DEM) and water flow properties can improve flood detection by masking and reducing areas to be processed. For this, we use topographic indices like the geomorphic flood index (GFI) [
27] or height above nearest drainage (HAND) [
28]. Razafipahatelo et al. [
29] used the HAND index to define preferred samples for nonsupervised classification. The ever-increasing volume of radar data and the sometimes very wide extent of floods justify this need to bound processing, and radar images could take a long time to download depending on available data rates.
Cloud computing services offer a way around these issues. Since Google Earth Engine (GEE) has come on stream [
30], a growing number of applications have been developed to use this service for remote sensing and geographic information systems. GEE is a cloud-based geospatial analysis platform that allows users to visualise and analyse Earth observation (EO) data. GEE’s database includes all freely accessible satellite imagery and is refreshed daily. Imagery can be processed directly in the cloud without the need to download it [
31], which is very useful in countries like Madagascar, where bandwidth can be low and downloading heavy data complicated. GEE is used in a wide range of applications like vegetation mapping and monitoring, land cover mapping, agriculture, and hazard management [
32,
33], including for floods [
34].
GEE is accessible via two client libraries. The first one is based on the JavaScript (JS) programming language and the second on Python. While both libraries provide access to the same services, Python makes it easy to automate the execution of laborious and multiple tasks. This advantage afforded by Python enables the parallel processing of several images. Google Colab, an online Python interpreter, is the tool used with GEE’s Python application programming interface (API).
In this paper, we report on the development of an image-processing chain for identifying floods from several Sentinel-1 scenes. The approach is designed to address the challenges of monitoring extensive areas using synthetic aperture radar (SAR) and its automatisation. This chain is implemented in Google Colab using the Python API. It was first tested and calibrated on the immediate outskirts of Antananarivo (Madagascar) using optical and radar images acquired before and after a series of floods in 2018. It is then applied to the whole of Madagascar after the passage of Cyclone Batsirai on 5 and 6 February 2022.
The next section of the paper covers the data we used, where we calibrated the method and how we carried out the testing. We also explain the steps in our process. Then, we share our results and compare them to other flood maps from when Cyclone Batsirai occurred. We also check our results against another method called S1Chain [
34]. Lastly, we dive into discussing our results in detail.
2. Materials and Methods
This section outlines the methodology, data sources, and processing steps used in our flood detection approach. Calibration and testing were performed in Madagascar, with Sentinel-1 satellite imagery as the primary data source. The processing chain includes the delineation of flood-prone areas based on the HAND index, choice of reference images acquired before flooding to compare to post-flood images, radar image filtering, and delineating flood by change detection.
2.1. Study Areas
To calibrate the processing chain, it was applied first on the plain in the immediate outskirts of Antananarivo, in the centre of the island. This calibration was conducted following a specific rainy season in 2018 characterised by continuous and heavy rainfall. This region was selected because it offers a wealth of information regarding previous flood events, experiences recurrent flooding, and possesses the most documented knowledge of flood-prone areas in the country [
4]. These attributes greatly facilitated the calibration process and made it an ideal location for fine-tuning our flood detection methodology.
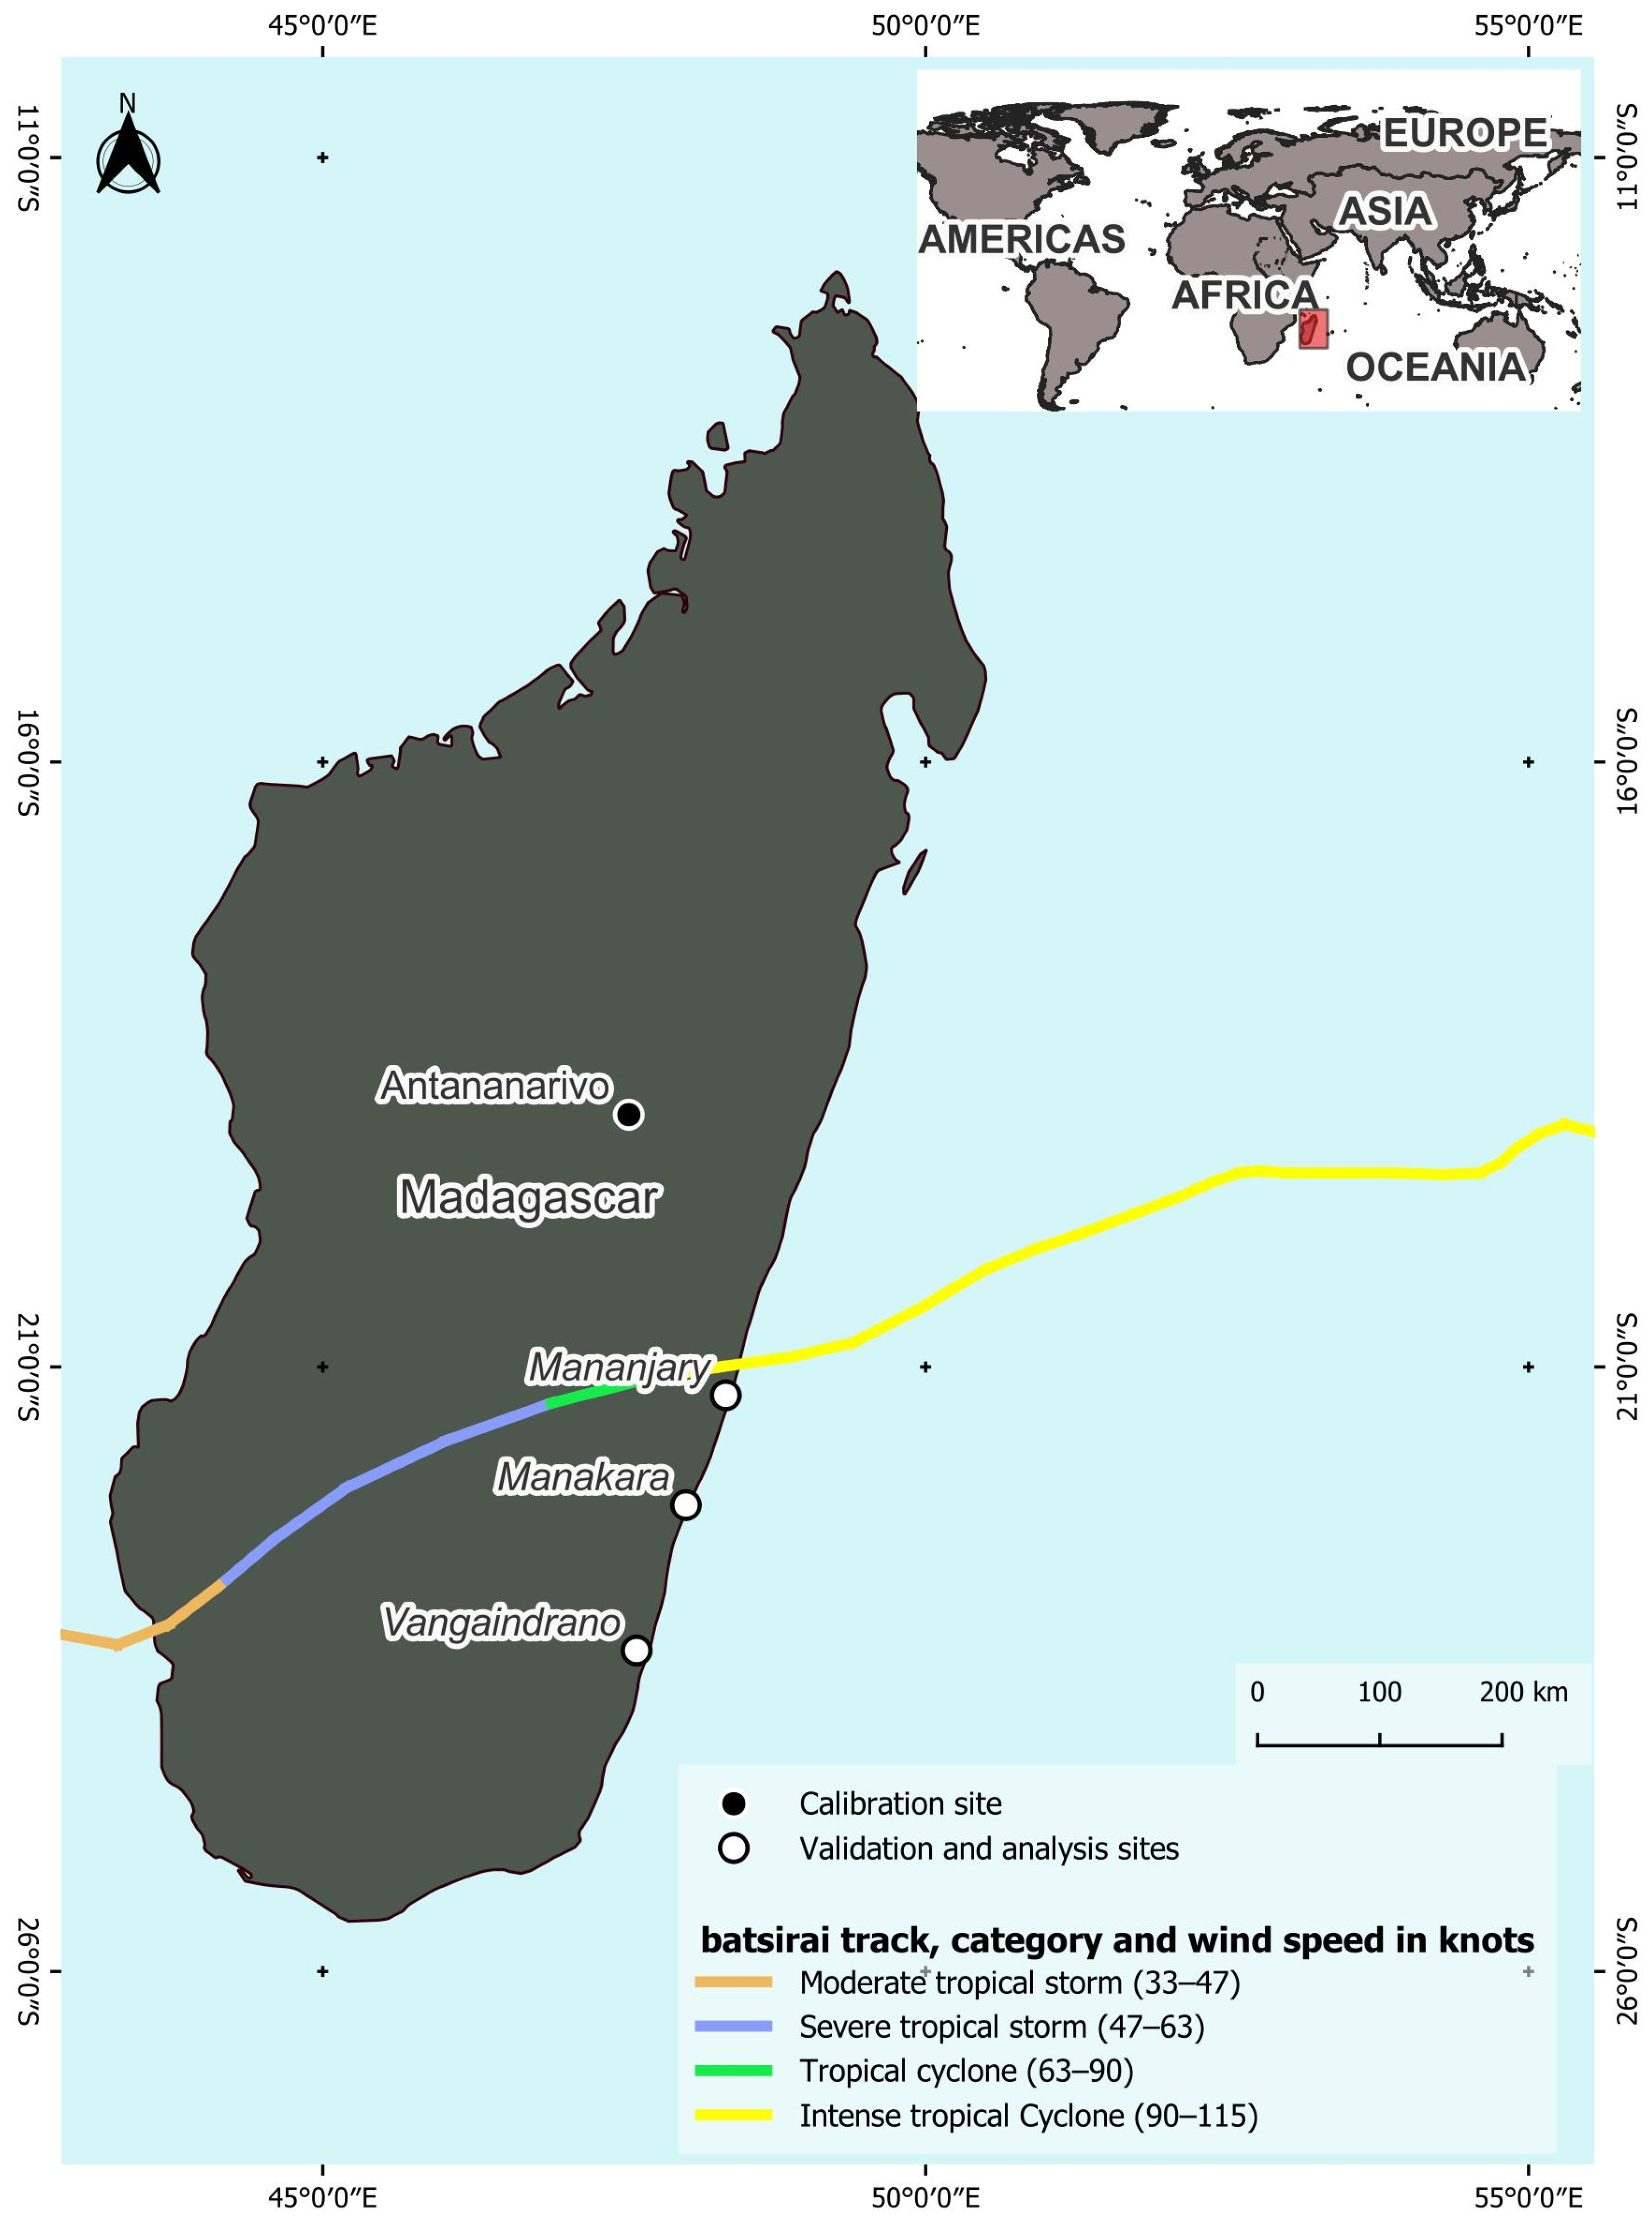
Our chain was then tested during the passage of the Batsirai cyclone. Cyclone Batsirai swept across southern Madagascar on 5 and 6 February 2022 (
Figure 1). Several zones along the island’s eastern seaboard were declared disaster areas. Reference flood maps are available for a few zones [
8,
10]. To showcase the chain’s ability to detect floods over an extensive area, the detection period was extended to 12 days. Thus, some detected floods may not be related to the cyclonic event. More detailed analyses were conducted in areas where other flood map products were also available, notably in the districts of Mananjary and Manakara.
2.2. Data
This section provides an overview of the data sources and satellite imagery used in our flood detection methodology. We focus on available HAND datasets, the Sentinel-1 constellation and its operational details, data availability in Google Earth Engine, and the specifics of data used for both calibration and application.
2.2.1. HAND Dataset
Flood-proneness can be measured by the GIS-based flood index FSI (flood susceptibility index) [
36] or a topographic index, among them GFI (geomorphic flood index) [
27] or HAND (height above nearest drainage) [
28]. The advantage of the HAND index is that it can be calculated from a DEM without hydrology data.
A set of HAND values covering the entire globe is already available in GEE [
37]. DEMs used are SRTM (30 m) and Viewfinder Panoramas (90 m) [
38] for latitudes above 60 degrees, where SRTM data are lacking.
To obtain the HAND, it is assumed that water in a given pixel flows towards the next downstream pixel following the steepest slope. Any given pixel may receive water from zero, one or several pixels upstream of it. Water can thus accumulate in a pixel, since water can only flow into a single pixel downstream. The direction of water flow in each pixel is first deduced from the DEM. The water accumulation rate is then calculated for each pixel (the number of upstream pixels feeding water into it). All pixels with a water accumulation rate above a given threshold, called the flow accumulation threshold (FAT), are considered part of the thalweg network. These are valley lines along which water flows and accumulates when it rains. Once all points in the thalweg network are identified, a matrix connecting each pixel in the study zone to the first point in the network receiving water from this specific pixel is established. This connection matrix, combined with the DEM, enables the value of the HAND parameter to be deduced by calculating elevation difference between each of the connected two points.
Two values of FAT were considered for the HAND dataset available in GEE: 100 for local drainage basins and 1000 for large drainage basins.
2.2.2. Sentinel-1
Our methodology relies on synthetic aperture radar (SAR) images from the Sentinel-1 constellation, operated by the European Space Agency (ESA). This constellation is composed of two satellites, Sentinel-1A and Sentinel-1B. Each satellite is equipped with an imaging radar operating in C band. Sentinel-1B ceased operating in July 2022 [
36]. The native spatial resolution of Sentinel-1 imagery depends on the satellite’s acquisition mode, of which there are four: Stripmap (SM), Interferometric Wide (IW), Extra Wide (EW), and Wave (WV). The respective spatial resolutions for these acquisition modes are 5 × 5 m, 5 × 20 m, 20 × 40 m, and 5 × 5 m.
Sentinel-1 imagery is acquired each 5 to 12 days depending on where the territory being imaged is and on ESA’s satellite tasking plans. Unfortunately, these plans do not support emergency retasking [
39]. For Madagascar, past and planned acquisition scenarios show that images are acquired by Sentinel-1A in IW mode during the descending phase of its orbit, except for southwest Madagascar, where scenes are regularly acquired on two ascending passes. Data are available in both VV and VH polarisations and at least every 12 days. It takes 4 to 10 days to acquire images covering all of Madagascar.
The Sentinel-1 data we used are already stored in GEE. Only GRD (ground range detected) products are available in GEE. In this format, Sentinel-1 image pixels are square—5 × 5 m, 10 × 10 m or 25 × 25 m maximum, depending on acquisition mode—and noise is attenuated at the price of coarser resolution and loss of phase information. GEE performs preprocessing on the Sentinel-1 imagery after refreshing the orbit metadata before posting online to suppress edge noise and thermal noise, and to perform radiometric calibration and terrain correction. In the latter case, SRTM 30 m digital elevation model data are used [
40].
Images available in GEE are stored at several levels of resolution in pyramid mode. The pyramid is built from the original image at its native resolution (base of the pyramid). The next level is formed by combining pixels in groups of four and averaging them. This operation is repeated until an image no larger than 256 × 256 pixels (apex of the pyramid) is obtained. The pyramid level used by GEE for processing is determined automatically by the specified output spatial resolution (display or export) [
41]. This enables processing of a vast zone at optimal resolution and avoids overwhelming GEE’s computing capacity. However, it is also possible to specify the desired spatial resolution, and while exporting from the JS and Python libraries is possible, automating multiple exports is easier with Python, as each export operation in Javascript in GEE’s IDE requires interaction with the user. To streamline the computation without sacrificing too much information, 20-m resolution images were used.
2.2.3. Data Used for Calibration
For the calibration, in addition to Sentinel-1 images, optical images from Sentinel-2 satellites are used. Part of the ESA Copernicus program, Sentinel-2 comprises twin satellites: Sentinel-2A and Sentinel-2B. The combination of the two satellites provides a 5-day revisit period. Sentinel-2 images have a native spatial resolution of 10 m, 20 m or 60 m depending on the spectral band. The bands used—visible and near-infrared—offer a resolution of 10 m. Cloudless optical images are often used to validate flood detection from radar image processing. Optical images allow one to obtain very high accuracy due to their multispectral bands [
13].
During the beginning of 2018, there was abundant rainfall in the area around Antananarivo up to the beginning of March, flooding low-lying zones around the city. In March, the rainfall was driven by a tropical depression and then Cyclone Dumazile. On 13 March 2018, good weather conditions enabled a Sentinel-2 optical image with only 1% cloud cover to be acquired, while a Sentinel-1 image was available for 12 March 2018. This Sentinel-2 image and another Sentinel-2 image acquired during the dry season were used to delineate the flooded areas and calibrate processing for Sentinel-1 data. In Sentinel-2 images, water surfaces are detected by thresholding the NDWI (normalised difference water index) with Otsu algorithm [
42]. The same method is applied to the reference Sentinel-2 image to detect and filter out permanent surface waters. The results thus obtained are compared to the processing of radar images.
2.2.4. Data Used for Application
To simulate a calculation covering the entire territory of Madagascar, flood detection is extended over a 12-day period. This approach aims to ensure complete coverage of the territory using Sentinel images, as the revisit frequency of Sentinel-1 satellites is every 12 days. To ensure a significant presence of flooding, the period following the passage of Cyclone Batsirai on 5 and 6 February 2022, is chosen. A total of 30 Sentinel-1 scenes were required. They were acquired between 5 and 17 February 2022. Radar images acquired at the same period as these post-flood images for each previous year were used as reference images.
2.3. Processing Chain
To make everything less computer-intensive, processing will be applied only to flood-prone zones predetermined according to topography. This is performed by thresholding the HAND model. The processing chain developed is based on detecting changes between two Sentinel-1 radar images using the normalised difference ratio: images acquired before floods for reference and images acquired during or after a flood has peaked are required. Before attempting to detect flooded areas, it is also crucial to filter out speckle noise from radar images. The choice of reference Sentinel-1 images will have a significant impact on results and their interpretation. The procedure for selecting these images is outlined in a dedicated subsection.
2.3.1. Delineating Flood-Prone Areas
Flood-prone areas are delineated in order to limit processing only on such zones. It also avoids false positive flood detection. The HAND model enables a pixel’s flood-proneness to be determined: the greater the difference in elevation between the pixel and the thalweg network, the less likely it is to be flooded [
29]. By applying a threshold to HAND values, we can identify flood-prone areas and mask all pixels outside of them. This threshold must be chosen to maintain a balance between accuracy and performance. If the threshold value is set too high, non-flood-prone zones will be included and thus needlessly slow down processing; too low, and zones genuinely at risk of flooding will be excluded.
In the specific case of Madagascar, a HAND threshold value of 5 m and a FAT value of 100 were chosen to include zones already known to have flooded previously. These values were determined on the basis of data on previous floods and local terrain features.
2.3.2. Choice of Reference Sentinel-1 Images
Reference images used in the change detection process are usually chosen from dates when there were no floods. There are several options when choosing them. We can choose images acquired during the dry season when water levels are at their lowest. However, this can lead to mistaking a stream bed filling up for a flood. We can also choose an image acquired just before the flood event, but in this case, the results would only factor in submersions caused by this specific event and could therefore include seasonal rains, which are not strictly speaking floods, or exclude subsequent submersions due to the floods. The best option would be to use radar images acquired when the main stream beds of water courses are full but not overflowing. However, this precise moment may not coincide with a satellite pass.
An alternative approach is employed here for selecting reference images. For a given scene (post-flood image), all available images acquired during the same period in previous years are selected, starting from 2014. To guarantee at least one image for each year, for Sentinel-1, the period is extended to cover the 12 days preceding the event. A flood-detection operation is then applied to the post-flood image and each of these reference images. The results are combined using a majority-voting process to select pixels corresponding to water. This approach excludes zones that are usually under water (permanent water bodies) during the event in question.
2.3.3. Radar Image Filtering
Radar image filters play a crucial role in image processing, enhancing the quality of radar imagery for various applications. That is why Mullissa et al. [
43] developed a speckle filtering tool in GEE. However, this tool is not available in Google Colab. Therefore, it was rewritten in Python while developing this processing chain. Speckle filter performance is generally assessed by analysing how much speckle noise is reduced and how well features are preserved in the filtered image [
44]. Each filter is assessed in terms of the accuracy with which water bodies are detected. Five filters have been incorporated in the processing chain. These filters include the boxcar filter, which smooths images by averaging neighbouring pixels; the gamma map [
45], a technique for adjusting brightness and contrast; the Lee filter [
46], designed for speckle noise reduction; the Lee sigma filter [
47], an enhanced version with adjustable noise reduction; the refined Lee filter [
48], which further refines speckle noise reduction; and the Quegan multitemporal filter [
49], utilising information from multiple radar images taken at different times to reduce noise.
2.3.4. Delineating Flood Extent by Change Detection
The change-detection method is based on the normalised difference, first used by Coppin and Bauer [
50] and subsequently developed by Gianinetto and Villa [
51]. It has already been used to establish flood extents [
52].
For two images, Y1 and Y2, from the same scene but acquired on different dates, the normalised difference between them is given by:
D is between −1 and +1. A value close to 0 indicates no change, while a value near to +/−1 corresponds to a large decrease or increase in the pixel value between the two dates.
As the reflected signal from areas under water is much weaker, the normalised difference will be negative. We can establish a normalised difference threshold value to delineate flooded areas.
2.3.5. Processing Chain Overview
Figure 2 below shows a simplified overview of the processing chain. Flood detection begins by selecting satellite images covering the study area and applying a mask to identify flood-prone areas using HAND data. These selected images are then divided into pre-event and post-event categories based on the flood event date. Subsequently, speckle filtering techniques are applied. Change detection is carried out by comparing each post-event image with multiple reference images acquired before the event, with a focus on selecting reference images that overlap with the post-event image. The results of the change detection process, involving multiple reference images, are integrated using a majority voting approach.
2.3.6. Calibration and Validation of Results
To calibrate and assess the effectiveness of the processing chain, the flood-detection protocol was applied to the outskirts of Antananarivo (
Figure 3). Results of the processing chain are compared to results from optical Sentinel 2 images presented on data subsection. After comparing results, we chose the best filter and polarisations as well as the NDR threshold for flood detection.
To achieve a more impartial validation process, a set of 100 random points was generated for each predicted class, distinguishing between areas affected by flooding and those unaffected (flooded and non-flooded, respectively). Subsequently, a comprehensive analysis of optical and radar images, along with water index, was conducted using a visual interpretation approach. This method allowed for the actual ground-truth state of each point within the study area. This interpretation process was conducted with consideration for the available information regarding historical occurrences of flooding within the study area, ensuring a robust and reliable validation process.
During Batsirai, partial flood maps were produced by the FAO [
10] for the island’s eastern seaboard and the Rapid Mapping component of the Copernicus Emergency Management Service (CEMS) program for certain zones. The CEMS Rapid Mapping product is a mapping solution tailored for rapid disaster response [
8]. It leverages advanced Earth observation satellites (such as TerraSar-X data) to deliver near-real-time, high-resolution satellite imagery and geospatial data during crucial early phases of emergencies like earthquakes, floods, and wildfires. CEMS Rapid Mapping empowers authorities and first responders to quickly assess damage, identify affected areas, and coordinate targeted relief efforts. This rapid access to precise mapping data enhances situational awareness and accelerates aid delivery, bolstering community resilience and safety. Those products were compared to the results obtained by our processing chain for the same zones.
For further validation, the results of the processing chain were compared to the results of the S1Chain developed by Alexandre et al. [
52]. This processing chain downloads and extracts Sentinel-1 imagery within the Sentinel-2 tile footprints, incorporates multitemporal filtering, calculates the normalised difference ratio, and generates a mask delineating flooded regions. The data used were processed following the passage of Cyclone Batsirai in 2022, using the same Sentinel-1 data that we processed for this cyclone event. This makes it possible to compare the different chain outputs.
3. Results
3.1. Calibration Phase
The processing chain is calibrated on the outskirts of Antananarivo by comparing results with those obtained from two optical images (pre- and post-flood).
Figure 3 shows surface water detected from Sentinel-2 optical imagery with automatic thresholding of the normalised difference water index (NDWI). Permanent water bodies are filtered out by processing another Sentinel-2 image acquired on 18 September 2017 (dry season) in the same fashion. This date was chosen because a Sentinel-1 image acquired the same day will be used as the reference radar image when processing radar data.
As the calibration is small enough, it was easy to variate the threshold. Maximum precision is obtained with a −0.35 threshold.
Figure 4 shows flood detection results obtained using a single polarisation (VV and then VH) and both polarisations at the same time.
We note that VV polarisation is sensitive to the irregularity of water surfaces caused by wind [
3]. That is why this polarisation does not detect flooding better in the relatively open northwestern part of the calibration area. On the other hand, the effectiveness of VV polarisation in the agricultural fields is due to the sensitivity of VH to the double bounce phenomenon that occurs when vegetation still emerges from water. These two polarisations are then complementary, minimising false negative flood detection. Both polarisations will therefore be used henceforth.
Table 1 shows how processing chain results match according to the type of filter used with respect to the result obtained with two Sentinel-2 optical images.
The best match is obtained with the refined Lee filter on a single image. We note that accuracy is slightly reduced when using multidate filters. This may be because different nonpermanent features (temporary water bodies) are in different places and have different shapes in the multidate imagery.
After generating 100 random points for each predicted class (flood/non-flood), the real state of each pixel was verified manually (reference). The confusion matrix is presented in
Table 2, indicating an overall accuracy of 85%. A significantly improved accuracy is achieved for the predicted non-flood class (user’s accuracy = 92%) compared to the predicted flood class (user’s accuracy = 78%) thanks to the utilisation of the HAND index. The majority of the reference non-flooded areas are effectively identified as non-flood-prone regions through the HAND thresholding (producer’s accuracy = 81%).
3.2. Application for Large-Scale Area
The processing chain is applied to identify flooded areas across the entire island of Madagascar, covering an extensive area of 587,041 square kilometres for the 12 days following the passage of Cyclone Batsirai on 5 and 6 February 2022 (
Figure 5). We utilised both VV and VH polarisations with a spatial resolution of 20 metres and applied a refined Lee filter to the images. We obtained 30 scenes covering Madagascar in its entirety.
For reference Sentinel-1 images, we used a series of images acquired annually during the same 12 days period in previous years. Six or seven reference images were accessible for each scene. By combining the series of flood detection by majority vote, each pixel was considered flooded if it emerged in more than three of the reference images. Frequent submersions are thus excluded from the flood detection results.
To efficiently process the 30 scenes, we simultaneously submitted requests to Google Earth Engine (GEE) from the Google Colab session executing our Python code. GEE, equipped with automated resource allocation, managed concurrent processing seamlessly. Remarkably, all requests were completed in under an hour. The entire processing chain, from data processing to result visualisation, was implemented within a single Colab session [
53].
3.3. Comparison with Other Flood-Mapping Products
Figure 6 overlays the results obtained with the processing chain proposed here on the map supplied by Copernicus emrs564. This map shows the southeast region of Madagascar, which was hardest hit by Cyclone Batsirai. The images used for this study were acquired on 9 February 2022, i.e., three days after the floods peaked, potentially explaining why the flood areas identified using the processing chain appear smaller compared to the Copernicus emsr564 product. The Copernicus emrs564 product was generated from a TerraSAR-X image acquired on 6 February 2022. Specifically, the flood area detected by the Copernicus emsr564 product covers approximately 3776 hectares, while the processing chain identifies around 582 hectares of flooded area. There is an overlap of approximately 424 hectares detected by both processes. These numbers demonstrate that a large portion of the water has receded by the time our processing chain was applied, resulting in a reduction in the identified flooded area when compared to the Copernicus product.
The results again identified persistent flooding that represents a long-term vulnerability, especially where crop fields are affected. Such information can be of value during the post-flood recovery phase. Availability of Sentinel-1 imagery is an issue that may preclude the timely application of this methodology, even more so now that Sentinel-1B is no longer in service. As Sentinel-1A is not retaskable, images may take several days to arrive (up to 16 days). The results are also compared with those obtained by the S1Chain (
Figure 7). They are in close agreement, with a kappa value of 0.78. However, differences are observed in several small flooded areas marked by scattered red areas in our results. These anomalies are more likely noise and are likely due to filtering effects, as the two chains apply speckle filtering at different times. In the S1Chain, this step is performed before terrain correction, whereas in GEE, images have already been corrected for terrain effects before being posted online. These anomalies further underscore the importance of filtering methods in the flood detection process and their impact on the interpretation of smaller flooded regions. Indeed, these anomalies occupy 7993 Ha if the flood stably detected by the two chains is about 50,700 ha.
4. Discussion
In this study, the use of GEE has proven to be particularly relevant and effective in addressing the needs of this research. GEE provided easy access to preprocessed SAR data and computational resources, facilitating a two-fold study. Firstly, characterising the spatiotemporal distribution of water resources in Madagascar, including seasonal and inter-annual dynamics of water bodies, and secondly, assessing the impacts of flood events resulting from cyclones in operational mode to enhance decision making using Earth observation products.
In this methodology, an overall accuracy of 85% is achieved, which is similar to the accuracy attained by more advanced approaches, such as [
54], using neural networks. Higher accuracy can be attained by employing more recent techniques such as automatic thresholding used by [
34,
55] or deep learning used by [
56], who respectively reached overall accuracies of 96.4%, 98.68% and 99.1%. Automatic thresholding requires a minimum portion of each class [
42], necessitating image division into patches before thresholding. Deep learning involves deploying a model, which is a paid service on Google Earth Engine. However, the methodological developments of this flood detection tool, using Google Earth Engine and Sentinel-1 radar imagery, aim to meet operational needs during crises. This approach prioritises the speed of impact map production and precision suitable for emergency situations rather than extreme accuracy. In a crisis situation, speed is crucial, and the goal is to obtain an overview of flooded areas for effective crisis management. Thus, the methodology relies on relatively straightforward techniques. This approach strikes balances between operational speed and level precision required for informed decision making.
The HAND index can play a crucial role in supporting the flood detection process [
57]. We demonstrate the significance of utilising the existing global HAND dataset on GEE, emphasising its time-saving benefits in the flood detection process in addition to the accuracy improvement.
The results show that several locations affected by flooding during the passage of Cyclone Batsirai were not mapped by traditional emergency services, thus demonstrating the value of this new processing chain able to systematically generate flood maps for cyclone events on the scale of an entire country. The maps used by national emergency management agencies, obtained from various sources, including through activation of the International Charter Space and Major Disasters, currently remain very limited in space and time. New information provided by our processing chain can help to improve disaster management and response.
To swiftly provide practical information to risk managers, we can enhance our analysis by integrating data from the European Space Agency (ESA) World Cover, which offers a global land cover map for 2021 at a 10-metre resolution, derived from Sentinel-1 and Sentinel-2 data. We can also utilise OpenStreetMap (OSM), a global open-source mapping platform that crowdsources geographic data, providing comprehensive, free maps for various applications. Additionally, Google Open Buildings can be used to incorporate building footprints using advanced deep learning algorithms and very high-resolution imagery.
However, it is worth noting that while GEE offers data availability and processing resources, including computational power and dedicated codes, which is particularly beneficial for territories like Madagascar with vast expanses and limited resources, certain limitations need to be considered. Sentinel-1 data come preprocessed with limited flexibility for making specific adjustments. Additionally, there are restrictions on the volume of data that can be processed freely without subscribing. Ownership issues of developments can also be a concern, especially when collaborating with government agencies. Furthermore, the number of image processing tools and classification algorithms is limited to what is available in the API.
The differences observed between the products compared in
Figure 6 and
Figure 7 can be explained in several ways. One of the main reasons lies in the temporal variations of image data, with each method using images acquired at different times. This temporal difference influences the characterisation of floods, with the processing chain detecting floods at a specific time, while Copernicus EMS relies on older data, which impacts the results. Furthermore, the specific mapping methods and algorithms of each method are major sources of divergence. These divergences highlight the need for contextual analysis for accurate interpretation. The temporal complementarity between the approach focused on speed and extensive spatial coverage and official products, such as those from Copernicus, allows for a better understanding of flood evolution.
The approach developed stands out for its responsiveness and capacity to map the entire territory of Madagascar, whether for research purposes or operational applications in times of emergencies. This responsiveness holds considerable potential for improving flood response and disaster management.
The contribution of our approach to flood management relies on the complementarity among various approaches, including those of Copernicus and the International Charter Space and Major Disasters. Sentinel-1 images are used for their ability to provide valuable information, even in unfavourable weather conditions. Our approach stands out for its speed, providing near-real-time data complementary to Copernicus products. The involvement of local stakeholders in data production and risk management enhances the capacity of communities to respond appropriately to floods. This collaboration contributes to more efficient flood management and rapid response in times of disaster. Furthermore, the utilisation of Google Colab significantly eases collaboration. The processing chain is easily shareable, requiring no installation, and the Python notebook contains both code and formatted text, facilitating comprehension. This seamless integration of collaborative tools enhances the accessibility of our approach, promoting wider engagement and cooperation among stakeholders in addressing flood-related challenges.
5. Conclusions
This study developed a processing chain to identify flooded areas using radar imagery in Google Earth Engine. The chain was developed in Google Colab in the form of a Python notebook. We have shown that our processing chain is effective in detecting flooded areas throughout Madagascar. This processing over large areas was possible thanks to the computing power and the rapid access to the data offered by Google Earth Engine. The GEE platform is a real opportunity for work on large volumes of data, particularly for countries like Madagascar where bandwidth and the Internet network can be quite inconsistent.
The results show that several locations affected by flooding during the passage of Cyclone Batsirai were not mapped by traditional emergency mapping services, thus demonstrating the value of systematically generating national flood maps for cyclone events. The maps used by national emergency management agencies, obtained from various sources including through activation of the International Charter Space and Major Disasters, currently remain very limited. New information provided by our processing chain can help to improve disaster management and response.
Cyclonic seasons give rise to clouds and atmospheric disturbances. Less affected than optical imagery, we have shown that radar Sentinel-1 data are a reliable solution for detecting flooding during these periods. It makes sense to continue working on these data, since ESA has announced the launch of Sentinel-1-C this year, and the rest of the programme is already planned. Building processing chains and operational tools based on Sentinel-1 data is part of a long-term vision.
Code from the processing chain could easily be adapted to use other radar images from different satellite constellations and to complete or replace Sentinel-1 imagery when it is not available. The use of several sources of radar images in parallel could even make it possible to improve the overall precision of the method, through a greater temporal density of images, making it possible, for example, to capture critical periods for detecting the peak of flooding (a few hours to few days after the passage of the cyclones). Cross-referencing data from various sources (different sensors, trajectories or angles of incidence) could also make it possible to refine the algorithms to complete flooded areas, or mask noise and poor detections. As shown by the validation of the results with Sentinel-2 data, the use of optical images could also be considered in addition, especially since the number of constellations of Earth observation satellites of this type is constantly increasing (Planet, etc.). The algorithms will also need to be adapted to process these types of data.
The chain currently runs on Google Earth Engine. Adapting the script to work with multiple backends such as Digital Earth Africa [
58] or Microsoft Planetary Computer [
59] or other proposals like the ESA’s [
60] would be very interesting. The use of these different platforms could also provide access to different data sources important for rapid detection of all flooded areas.
The good results obtained for the detection of areas under water and the replicable nature of the method raise the question of its use at an operational level. To this end, we have launched the SCO (Space Climate Observatory) Cimopolée project, a research and operational application project involving our teams and the Bureau National de Gestion des Risques et des Catastrophes à Madagascar (BNGRC). The aim of this project is to continue improving the results of the processing chain, but above all, to integrate the results and provide operational information for decision makers and people in charge of risk management in Madagascar.
Author Contributions
Conceptualisation, R.J., C.R. and S.R. (Solofo Rakotondraompiana); methodology, R.J., T.C., S.R. (Solofoarisoa Rakotoniaina) and S.R. (Solofo Rakotondraompiana); software, R.J., T.C. and P.M.; validation, R.J., C.R. and T.C.; formal analysis, R.J.; investigation, R.J.; resources, R.J.; data curation, R.J.; writing—original draft preparation, R.J.; writing—review and editing, R.J., C.R., C.A., T.C., P.M., G.P. and S.R. (Solofo Rakotondraompiana); visualisation, R.J.; supervision, G.P., S.R. (Solofo Rakotondraompiana) and S.R. (Solofoarisoa Rakotoniaina); project administration, G.P.; funding acquisition, C.R. and G.P. All authors have read and agreed to the published version of the manuscript.
Funding
This work is supported by the EU Interreg project Renovrisk-Impact funded by the European Union, the IRD, and Reunion Regional Council.
Data Availability Statement
Conflicts of Interest
The authors declare no conflict of interest.
Abbreviations
| API | Application Programming Interface |
| CEMS | Copernicus Emergency Management Service |
| DEM | Digital Elevation Model |
| EO | Earth Observation |
| ESA | European Space Agency |
| FAO | Food and Agricultural Organisation |
| GEE | Google Earth Engine |
| HAND | Height Above Nearest Drainage |
| NDR | Normalised Difference Ratio |
| NDWI | Normalised Difference |
| OSM | Open Street Map |
| SAR | Synthetic Aperture Radar |
| SRTM | Shuttle Radar Topography Mission |
References
- IPCC Climate Change 2021: The Physical Basis. Available online: https://www.ipcc.ch/report/ar6/wg1/ (accessed on 1 August 2022).
- Guha-Sapir, D.; Hargitt, D.; Hoyois, P. Thirty Years of Natural Disasters 1974–2003: The Number; UCL Presses Universitaires de Louvain: Louvain, Belgium, 2004; ISBN 978-2-930344-71-3. [Google Scholar]
- McDermott, T.K.J. Global Exposure to Flood Risk and Poverty. Nat. Commun. 2022, 13, 3529. [Google Scholar] [CrossRef] [PubMed]
- Otto, F.E.L.; Zachariah, M.; Wolski, P.; Pinto, I.; Nhamtumbo, B.; Bonnet, R.; Vautard, R.; Philip, S.; Kew, S.; Luu, L.N.; et al. Climate Change Increased Rainfall Associated with Tropical Cyclones Hitting Highly Vulnerable Communities in Madagascar, Mozambique & Malawi. 2022. p. 41. Available online: http://www.indiaenvironmentportal.org.in/files/file/climate_change_rainfall_madagascar.pdf (accessed on 13 November 2023).
- Fitchett, J.M. Recent Emergence of CAT5 Tropical Cyclones in the South Indian Ocean. S. Afr. J. Sci. 2018, 114. [Google Scholar] [CrossRef] [PubMed]
- Ramiaramanana, F.N.; Teller, J. Urbanization and Floods in Sub-Saharan Africa: Spatiotemporal Study and Analysis of Vulnerability Factors—Case of Antananarivo Agglomeration (Madagascar). Water 2021, 13, 149. [Google Scholar] [CrossRef]
- Ajmar, A.; Boccardo, P.; Broglia, M.; Kucera, J.; Giulio-Tonolo, F.; Wania, A. Response to Flood Events: The Role of Satellite-Based Emergency Mapping and the Experience of the Copernicus Emergency Management Service. Available online: https://publications.jrc.ec.europa.eu/repository/handle/JRC98837 (accessed on 13 July 2023).
- Wania, A.; Joubert-Boitat, I.; Dottori, F.; Kalas, M.; Salamon, P. Increasing Timeliness of Satellite-Based Flood Mapping Using Early Warning Systems in the Copernicus Emergency Management Service. Remote Sens. 2021, 13, 2114. [Google Scholar] [CrossRef]
- Home—International Disasters Charter. Available online: https://disasterscharter.org/en/web/guest/home (accessed on 2 June 2023).
- FAO. Madagascar: Évaluation des Dommages et des Pertes Causés par les Cyclones Batsirai et Emnati sur le Secteur Agricole dans le Grand Sud-Est de Madagascar: Rapport DIEM-Impact, Juin 2022; FAO: Rome, Italy, 2022; ISBN 978-92-5-136561-8. [Google Scholar]
- Biggin, D.S.; Blyth, K. A Comparison of ERS-1 Satellite Radar and Aerial Photography for River Flood Mapping. Water Environ. J. 1996, 10, 59–64. [Google Scholar] [CrossRef]
- Rochon, G.; Bonn, F. Précis de Télédétection Volume 1: Principes et Méthodes; Presses de l’Université du Québec/AUPELF: Québec, QC, Canada, 1992. [Google Scholar]
- Carreño Conde, F.; De Mata Muñoz, M. Flood Monitoring Based on the Study of Sentinel-1 SAR Images: The Ebro River Case Study. Water 2019, 11, 2454. [Google Scholar] [CrossRef]
- Clement, M.A.; Kilsby, C.G.; Moore, P. Multi-Temporal Synthetic Aperture Radar Flood Mapping Using Change Detection: Multi-Temporal SAR Flood Mapping Using Change Detection. J. Flood Risk Manag. 2018, 11, 152–168. [Google Scholar] [CrossRef]
- Rahman, M.R.; Thakur, P.K. Detecting, Mapping and Analysing of Flood Water Propagation Using Synthetic Aperture Radar (SAR) Satellite Data and GIS: A Case Study from the Kendrapara District of Orissa State of India. Egypt. J. Remote Sens. Space Sci. 2018, 21, S37–S41. [Google Scholar] [CrossRef]
- Baghdadi, N.; King, C.; Bourguignon, A.; Remond, A. Potential of ERS and Radarsat Data for Surface Roughness Monitoring over Bare Agricultural Fields: Application to Catchments in Northern France. Int. J. Remote Sens. 2002, 23, 3427–3442. [Google Scholar] [CrossRef]
- Amitrano, D.; Martino, G.D.; Iodice, A.; Ruello, G. Unsupervised Rapid Flood Mapping Using Sentinel-1 GRD SAR Images. IEEE Trans. Geosci. Remote Sens. 2018, 56, 3290–3299. [Google Scholar] [CrossRef]
- Li, Y.; Martinis, S.; Plank, S.; Ludwig, R. An Automatic Change Detection Approach for Rapid Flood Mapping in Sentinel-1 SAR Data. Int. J. Appl. Earth Obs. Geoinf. 2018, 73, 123–135. [Google Scholar] [CrossRef]
- Lu, D.; Mausel, P.; Brondízio, E.; Moran, E. Change Detection Techniques. Int. J. Remote Sens. 2004, 25, 2365–2401. [Google Scholar] [CrossRef]
- Singh, A. Review Article Digital Change Detection Techniques Using Remotely-Sensed Data. Int. J. Remote Sens. 1989, 10, 989–1003. [Google Scholar] [CrossRef]
- Moser, G. Unsupervised Change-Detection Methods for Remote-Sensing Images. Opt. Eng. 2002, 41, 3288. [Google Scholar] [CrossRef]
- Ouled Sghaier, M.; Hammami, I.; Foucher, S.; Lepage, R. Flood Extent Mapping from Time-Series SAR Images Based on Texture Analysis and Data Fusion. Remote Sens. 2018, 10, 237. [Google Scholar] [CrossRef]
- Wan, L.; Zhang, T.; You, H. Object-Based Multiscale Method for SAR Image Change Detection. JARS 2018, 12, 025004. [Google Scholar] [CrossRef]
- Rignot, E.J.M.; van Zyl, J.J. Change Detection Techniques for ERS-1 SAR Data. IEEE Trans. Geosci. Remote Sens. 1993, 31, 896–906. [Google Scholar] [CrossRef]
- Bayik, C.; Abdikan, S.; Ozbulak, G.; Alasag, T.; Aydemir, S.; Balik Sanli, F. Exploiting Multi-Temporal Sentinel-1 SAR Data for Flood Extend Mapping. Int. Arch. Photogramm. Remote Sens. Spat. Inf. Sci. 2018, XLII-3/W4, 109–113. [Google Scholar] [CrossRef]
- Chini, M.; Pelich, R.; Pulvirenti, L.; Pierdicca, N.; Hostache, R.; Matgen, P. Sentinel-1 InSAR Coherence to Detect Floodwater in Urban Areas: Houston and Hurricane Harvey as A Test Case. Remote Sens. 2019, 11, 107. [Google Scholar] [CrossRef]
- Samela, C.; Troy, T.J.; Manfreda, S. Geomorphic Classifiers for Flood-Prone Areas Delineation for Data-Scarce Environments. Adv. Water Resour. 2017, 102, 13–28. [Google Scholar] [CrossRef]
- Rennó, C.D.; Nobre, A.D.; Cuartas, L.A.; Soares, J.V.; Hodnett, M.G.; Tomasella, J.; Waterloo, M.J. HAND, a New Terrain Descriptor Using SRTM-DEM: Mapping Terra-Firme Rainforest Environments in Amazonia. Remote Sens. Environ. 2008, 112, 3469–3481. [Google Scholar] [CrossRef]
- Razafipahatelo, D.; Rakotoniaina, S.; Rakotondraompiana, S. Automatic Floods Detection with a Kernel K-Means Approach. In Proceedings of the 2014 IEEE Canada International Humanitarian Technology Conference—(IHTC), Montreal, QC, Canada, 1–4 June 2014; pp. 1–4. [Google Scholar]
- Gorelick, N.; Hancher, M.; Dixon, M.; Ilyushchenko, S.; Thau, D.; Moore, R. Google Earth Engine: Planetary-Scale Geospatial Analysis for Everyone. Remote Sens. Environ. 2017, 202, 18–27. [Google Scholar] [CrossRef]
- Mutanga, O.; Kumar, L. Google Earth Engine Applications. Remote Sens. 2019, 11, 591. [Google Scholar] [CrossRef]
- Zurqani, H.A.; Allen, J.S.; Post, C.J.; Pellett, C.A.; Walker, T.C. Mapping and Quantifying Agricultural Irrigation in Heterogeneous Landscapes Using Google Earth Engine. Remote Sens. Appl. Soc. Environ. 2021, 23, 100590. [Google Scholar] [CrossRef]
- DeVries, B.; Huang, C.; Armston, J.; Huang, W.; Jones, J.W.; Lang, M.W. Rapid and Robust Monitoring of Flood Events Using Sentinel-1 and Landsat Data on the Google Earth Engine. Remote Sens. Environ. 2020, 240, 111664. [Google Scholar] [CrossRef]
- Moharrami, M.; Javanbakht, M.; Attarchi, S. Automatic Flood Detection Using Sentinel-1 Images on the Google Earth Engine. Environ. Monit. Assess. 2021, 193, 248. [Google Scholar] [CrossRef]
- National Centers for Environmental Information (NCEI). Available online: https://www.ncei.noaa.gov/ (accessed on 13 July 2023).
- Stathopoulos, N.; Kalogeropoulos, K.; Polykretis, C.; Skrimizeas, P.; Louka, P.; Karymbalis, E.; Chalkias, C. Introducing Flood Susceptibility Index Using Remote-Sensing Data and Geographic Information Systems: Empirical Analysis in Sperchios River Basin, Greece. In Remote Sensing of Hydrometeorological Hazards; CRC Press: Boca Raton, FL, USA, 2017; ISBN 978-1-315-15494-7. [Google Scholar]
- Donchyts, G.; Winsemius, H.; Schellekens, J.; Erickson, T.; Gao, H.; Savenije, H.; van de Giesen, N. Global 30m Height Above the Nearest Drainage. In Proceedings of the European Geosciences Union 2016, Vienna, Austria, 19 April 2016. [Google Scholar]
- Digital Elevation Data-with SRTM Voids Filled Using Accurate Topographic Mapping. Available online: http://viewfinderpanoramas.org/dem3.html#ant (accessed on 13 November 2023).
- Sentinel-1—Missions—Sentinel Online. Available online: https://copernicus.eu/missions/sentinel-1 (accessed on 1 June 2023).
- Sentinel-1 SAR GRD: C-Band Synthetic Aperture Radar Ground Range Detected, Log Scaling|Earth Engine Data Catalog|Google for Developers. Available online: https://developers.google.com/earth-engine/datasets/catalog/COPERNICUS_S1_GRD (accessed on 31 May 2023).
- Scale | Google Earth Engine. Available online: https://developers.google.com/earth-engine/guides/scale (accessed on 18 November 2022).
- Otsu, N. A Threshold Selection Method from Gray-Level Histograms. IEEE Trans. Syst. Man Cybern. 1979, 9, 62–66. [Google Scholar] [CrossRef]
- Mullissa, A.; Vollrath, A.; Odongo-Braun, C.; Slagter, B.; Balling, J.; Gou, Y.; Gorelick, N.; Reiche, J. Sentinel-1 SAR Backscatter Analysis Ready Data Preparation in Google Earth Engine. Remote Sens. 2021, 13, 1954. [Google Scholar] [CrossRef]
- Mascarenhas, N.D.A. An Overview of Speckle Noise Filtering in SAR Images. In Image Processing Techniques, First Latino-American Seminar on Radar Remote Sensing: Proceedings of a Conference Held 2–4 December, 1996, Buenos Aires, Argentina; Guyenne, T.D., Ed.; European Space Agency: Paris, France, 1997; Volume 407, p. 71. [Google Scholar]
- Lopes, A.; Nezry, E.; Touzi, R.; Laur, H. Maximum a Posteriori Speckle Filtering and First Order Texture Models in Sar Images. In Proceedings of the 10th Annual International Symposium on Geoscience and Remote Sensing, College Park, MD, USA, 20–24 May 1990; pp. 2409–2412. [Google Scholar]
- Lee, J.-S. Digital Image Enhancement and Noise Filtering by Use of Local Statistics. IEEE Trans. Pattern Anal. Mach. Intell. 1980, PAMI-2, 165–168. [Google Scholar] [CrossRef]
- Lee, J.-S.; Wen, J.-H.; Ainsworth, T.L.; Chen, K.-S.; Chen, A.J. Improved Sigma Filter for Speckle Filtering of SAR Imagery. IEEE Trans. Geosci. Remote Sens. 2009, 47, 202–213. [Google Scholar] [CrossRef]
- Lee, J.-S.; Grunes, M.R.; de Grandi, G. Polarimetric SAR Speckle Filtering and Its Implication for Classification. IEEE Trans. Geosci. Remote Sens. 1999, 37, 2363–2373. [Google Scholar] [CrossRef]
- Quegan, S.; Le Toan, T.; Yu, J.J.; Ribbes, F.; Floury, N. Multitemporal ERS SAR Analysis Applied to Forest Mapping. IEEE Trans. Geosci. Remote Sens. 2000, 38, 741–753. [Google Scholar] [CrossRef]
- Coppin, P.R.; Bauer, M.E. Processing of Multitemporal Landsat TM Imagery to Optimize Extraction of Forest Cover Change Features. IEEE Trans. Geosci. Remote Sens. 1994, 32, 918–927. [Google Scholar] [CrossRef]
- Gianinetto, M.; Villa, P. Mapping Hurricane Katrina’s Widespread Destruction in New Orleans Using Multisensor Data and the Normalized Difference Change Detection (NDCD) Technique. Int. J. Remote Sens. 2011, 32, 1961–1982. [Google Scholar] [CrossRef]
- Alexandre, C.; Johary, R.; Catry, T.; Mouquet, P.; Révillion, C.; Rakotondraompiana, S.; Pennober, G. A Sentinel-1 Based Processing Chain for Detection of Cyclonic Flood Impacts. Remote Sens. 2020, 12, 252. [Google Scholar] [CrossRef]
- Google Colab. Available online: https://research.google.com/colaboratory/faq.html#resource-limits (accessed on 31 May 2023).
- Neagoe, V.-E.; Stoica, R.-M. A New Neural Approach of Supervised Change Detection in SAR Images Using Training Data Generation with Concurrent Self-Organizing Maps. In Proceedings of the IGARSS 2018–2018 IEEE International Geoscience and Remote Sensing Symposium, Valencia, Spain, 22–27 July 2018; pp. 4792–4795. [Google Scholar]
- Bioresita, F.; Puissant, A.; Stumpf, A.; Malet, J.-P. A Method for Automatic and Rapid Mapping of Water Surfaces from Sentinel-1 Imagery. Remote Sens. 2018, 10, 217. [Google Scholar] [CrossRef]
- Wu, X.; Zhang, Z.; Xiong, S.; Zhang, W.; Tang, J.; Li, Z.; An, B.; Li, R. A Near-Real-Time Flood Detection Method Based on Deep Learning and SAR Images. Remote Sens. 2023, 15, 2046. [Google Scholar] [CrossRef]
- Scriven, B.W.G.; McGrath, H.; Stefanakis, E. GIS Derived Synthetic Rating Curves and HAND Model to Support On-the-Fly Flood Mapping. Nat. Hazards 2021, 109, 1629–1653. [Google Scholar] [CrossRef]
- Welcome to Digital Earth Africa | Digital Earth Africa. Available online: https://www.digitalearthafrica.org/ (accessed on 31 May 2023).
- Microsoft Planetary Computer. Available online: https://planetarycomputer.microsoft.com/ (accessed on 31 May 2023).
- Network of Resources. Available online: https://eo4society.esa.int/network-of-resources/ (accessed on 31 May 2023).
| Disclaimer/Publisher’s Note: The statements, opinions and data contained in all publications are solely those of the individual author(s) and contributor(s) and not of MDPI and/or the editor(s). MDPI and/or the editor(s) disclaim responsibility for any injury to people or property resulting from any ideas, methods, instructions or products referred to in the content. |
© 2023 by the authors. Licensee MDPI, Basel, Switzerland. This article is an open access article distributed under the terms and conditions of the Creative Commons Attribution (CC BY) license (https://creativecommons.org/licenses/by/4.0/).


 ,
, 


