Article

Above Ground Level Estimation of Airborne Synthetic Aperture Radar Altimeter by a Fully Supervised Altimetry Enhancement Network

1
Graduate School of China Academy of Engineering Physics, Institute of Electronic Engineering, Mianyang 621900, China
2
The Institute of Electronic Engineering, China Academy of Engineering Physics, Mianyang 621900, China
*
Author to whom correspondence should be addressed.
Remote Sens. 2023, 15(22), 5404; https://doi.org/10.3390/rs15225404
Submission received: 9 September 2023 / Revised: 5 November 2023 / Accepted: 11 November 2023 / Published: 17 November 2023
(This article belongs to the Special Issue Advances in Radar Imaging with Deep Learning Algorithms)

Abstract

:
Due to the lack of accurate labels for the airborne synthetic aperture radar altimeter (SARAL), the use of deep learning methods is limited for estimating the above ground level (AGL) of complicated landforms. In addition, the inherent additive and speckle noise definitely influences the intended delay/Doppler map (DDM); accurate AGL estimation becomes more challenging when using the feature extraction approach. In this paper, a generalized AGL estimation algorithm is proposed, based on a fully supervised altimetry enhancement network (FuSAE-net), where accurate labels are generated by a novel semi-analytical model. In such a case, there is no need to have a fully analytical DDM model, and accurate labels are achieved without additive noises and speckles. Therefore, deep learning supervision is easy and accurate. Next, to further decrease the computational complexity for various landforms on the airborne platform, the network architecture is designed in a lightweight manner. Knowledge distillation has proven to be an effective and intuitive lightweight paradigm. To significantly improve the performance of the compact student network, both the encoder and decoder of the teacher network are utilized during knowledge distillation under the supervision of labels. In the experiments, airborne raw radar altimeter data were applied to examine the performance of the proposed algorithm. Comparisons with conventional methods in terms of both qualitative and quantitative aspects demonstrate the superiority of the proposed algorithm.

1. Introduction

The radar altimeter is an essential telemetry technology. Generally, in the remote sensing community, radar altimeters can be divided into conventional altimeters (CAs) and synthetic aperture radar altimeters (SARALs) [1], according to the working principle. Firstly, the CA adopts the real aperture operating mode of a pulse limited system. Secondly, the SARAL employs Doppler beam-sharpened (DBS), delay-compensation, and multi-look processing to utilize the coherent correlation between pulses. Compared with the CA, the SARAL owns higher along-track resolution and lower measurement noise. Consequently, the SARAL has higher accuracy in height measurement than the CA. According to the operating platform, there are spaceborne SARALs and airborne SARALs. The airborne SARAL is flexible in design and convenient in application. Consequently, it has great potential for practical altimetry applications. The key task of the radar altimeter is the estimation of the above ground level (AGL), which is commonly obtained by radiating pulses to the ground in a nearly vertical direction. Accurate AGL estimation is of great significance for terrain detection and tracking. During conventional estimation, the input is the range-compressed waveform [2,3], and the output is the AGL estimate. According to the principle of this paper, the AGL estimation is obtained through the delay/Doppler map (DDM).
Accurate AGL estimation is achieved through retracking methods, i.e., parameter estimation strategies [2]. According to whether a physical model is required during the estimation, the retracking can be categorized into two classes: physics-driven approaches and feature-driven approaches. Physics-driven approaches fit the input waveform using analytical models [3,4] to figure out the estimated value of the parameter of interest. The performance of the approach depends on two points: accommodation of the model and the principle of the estimator. For SARAL, the power of each beam can be mathematically expressed as the convolution of three terms based on the Brown model [5], which are the flat surface impulse response (FSIR), the probability density function (PDF) of the sea surface wave height, and the time/frequency point target response (PTR). Using the Brown model to match the echoes, the parameter can be estimated based on the model template. Currently, the majority of these models are designed for spaceborne SARAL when the observation target is the sea or the coast [6,7,8]. Regarding the estimators, conventional methods include the maximum likelihood (ML) algorithm [9] and the least square (LS) algorithm [2]. When the echoes encounter additive noise, the estimators are prone to be overfitted. To this end, statistics-based parameter estimation achieves the AGL estimations by incorporating prior knowledge under Bayesian inference. When the prior and the likelihood are not conjugate, hierarchical Bayesian algorithms are employed. Accordingly, two solutions can be used, including Markov Chain Monte Carlo (MCMC) class sampling methods [10] and variational inference methods [11,12]. These algorithms achieve the noise reduction effect and successfully prevent overfitting by introducing the statistical priors of the echo. The accuracy of physics-driven methods strongly depends on the adaptability of the models. Due to the complicated fluctuations in various landforms, Brown models may be unaccommodating. As a result, the absence of the corresponding models inevitably leads to decreased accuracy.
Feature-driven approaches achieve waveform retracking by extracting parameters from the echo based on experience. They are often applied to landscapes [13]. In [14], the geometrical offset center of gravity (OCOG) algorithm is introduced. The OCOG finds the center of gravity of each waveform through a rectangle with the same center of gravity and area as the waveform itself. Then the amplitude of the waveform, the position of the center of gravity and the width of the rectangle are obtained. Based on these three parameters, the AGL estimate of the wavefront is determined. For waveforms over mixed surfaces, the Davis threshold method [15] and its variants [16,17] were developed, which obtain the AGL through the preset threshold level of the maximum echo power. Due to the inherent additive noise and speckle noise, the extraction of the wavefront is often heavily hampered. Consequently, a series of retracking approaches based on denoising were developed [18,19,20,21]. However, these methods are only for the specified scenarios. There is no specific feature-driven retracking approach for landforms. To enhance the performance of the AGL estimation algorithm in complicated landscapes, it is necessary for feature-driven methods to consider and accommodate additive and speckle noises.
Deep learning is capable of solving complicated nonlinear problems, and the generalization ability makes it possible to adapt to various scenarios. Following the development of deep learning, convolutional neural networks (CNN) have been widely used in remote sensing image processing, such as super-resolution [22], reconstruction [23], and SAR image denoising [24,25,26]. Based on whether they have clean images as the labels during the training stage, SAR image denoising approaches can be divided into supervised networks and unsupervised networks. Supervised networks optimize the weights by minimizing the Euclidean loss between the prior clean input and the noisy input [25], and there are different SAR denoising approaches under the framework. Zhang et al. [26] devised the SAR dilated residual network (SAR-DRN), which combines dilated convolutions with residual learning. The encoder–decoder architecture is also applied to capture the statistical characteristics of the noise [27]. More recently, attention modules have been added to the encoder–decoder CNN network for higher performance [28,29]. These supervised denoising approaches realize supervision by resorting to synthetic optical images, which exhibit a domain gap with true SAR images. The other way to obtain clean images for supervision is through averaging multitemporal SAR images [30], which are difficult to acquire. Therefore, the absence of clean SAR images leads to the unsatisfactory performance of SAR image denoising for supervised networks. Unsupervised networks are supposed to be trained with only raw images aiming to approach the effect close to fully supervised networks [31,32]. Molini et al. [33] presented Speckle2Void (S2V) based on the blind-spot CNN [34] architecture. The network achieves better performance on real SAR images compared with the conventional supervised methods. In [35], an end-to-end self-supervised SAR denoising network, entitled enhanced Noise2Noise (EN2N), restores special details while denoising.
A fully supervised network avoids the divergence of training data from reality, and the denoising performance of the network is superior. So far, the power of CNNs has been fully proven. However, SAR denoising faces the challenge of realization of the fully supervised networks. Unlike the holographic SAR image, a DDM is formed via the nonlinear mapping of the targets. Fortunately, instead of the details of the objects on the surface which are often included in SAR images, altimetry features are more focused on the structure in DDM. This characteristic allows for the conceivable creation of completely clean DDMs containing altimetry features without any domain gaps. Therefore, it is necessary to obtain accurate DDM labels for fully supervised learning.
In this paper, in order to solve the problems of AGL estimation of the airborne SARAL in complicated landforms, a lightweight fully supervised altimetry enhancement network (FuSAE-net) is proposed. The inputs of the FuSAE-net are raw DDMs. By extracting features from the enhanced and stable DDMs, the AGL estimates are obtained. The proposed algorithm achieves both superior accuracy and computational efficiency compared with conventional methods. With the aim of full supervision during the network training, a novel label generation algorithm based on a semi-analytical model is suggested: airborne SARAL encounters with dynamic detection scenarios. Therefore, the network must be lightweight. The FuSAE-net is compressed by knowledge distillation to be sufficient for the processing restrictions of the edge devices of airborne SARAL. Both the suggested accurate labels and the middle layer information of the complicated teacher network are used to guide the training of the lightweight student network. The main contributions of this paper include:
  • The proposition of a novel label generation algorithm based on a semi-analytical model to implement a fully supervised network for parameter estimation, so that clean and accurate DDMs can be produced by discretizing landforms in the domain of range and Doppler together with empirical scattering theory;
  • Accordingly, the estimation is designed by a novel, fully supervised network, which is capable of accessing the AGL parameters for airborne SARAL on complicated landforms;
  • The raw data of landscapes are employed in this paper to validate the generalizability and accuracy of the proposed approach.
This paper is organized as follows: Section 2 presents the background, i.e., the geometry of airborne SARAL and the signal model. The proposed algorithm is thoroughly introduced in Section 3, including the label-generation algorithm based on a semi-analytical model and the designation of FuSAE-net. Section 4 shows the experiments and provides raw data results to evaluate the performance of the proposed algorithm. The conclusions are drawn in Section 5.

2. Airborne SARAL Geometry and Signal Model

2.1. Airborne SARAL Geometry

The airborne SARAL geometry is shown in Figure 1. SARAL is proposed to make use of the Doppler beams to improve along-track resolution. As shown in Figure 1a, within the beam footprint, SARAL not only observes the target at position B, which is near vertical, but also at a number of other points along its course, including positions A and C. Through DBS, SARAL can fully utilize the along-track Doppler frequency and divide the footprint of each beam. Figure 1b presents the concentric circle footprint from a moment in position B, which is divided by the Doppler frequency. The red circle represents the footprint of the latest arrival pulse, and the dark red portion means the footprint of the central beam. The footprint of each beam represents a pulse signal. But only the signal of the nadir point can be directly used for AGL estimation.

2.2. Airborne SARAL Signal Model

As shown in Figure 1a, the constant speed of airborne SARAL is V s which is along the X-axis at altitude h s , and the coordinate of target T is set as ( x , y , z ) . The goal of airborne SARAL is to obtain h = | h s z | , i.e., the AGL between SARAL and the target. The airborne SARAL transmits a signal when it is above the target T , then receives the echo after a certain delay as
s r ( t ^ , t s ) = A exp ( j 2 π f c t ^ 2 r ( t s ) c ) exp [ j π K r ( t ^ 2 r ( t s ) c ) 2 ]
where t ^ , t s are, respectively, range fast time and azimuth slow time; A is the constant in the airborne SARAL system. In Equation (1), r = h r e f 2 + ( V s t s ) 2 represents the distance between SARAL and T , and h r e f is the rough estimation of the AGL h . In addition, f c is the carrier frequency, c is the speed of light, and K r is the modulation frequency. The received echo after the dechirp and decoupling process can be expressed as [4]
s ( t ^ , t s ) = A exp [ j 4 π c K r ( r h r e f ) t ^ ] exp [ j 4 π c ( f c + K r t ^ ) x V s t s r ]
After along-track Fourier transform and approximation processing, the DDM after DBS processing can be obtained as
s ( t ^ , f n ) = A exp [ j 4 π c K r ( r h r e f ) t ^ ] sinc [ T s ( f n 2 V s λ x r ) ]
where f n means the n th Doppler frequency.
In practical application, the m th raw DDM y m is corrupted by the multiplicative speckle noise h m and the additive Gaussian noise n m as
y m ( τ , f n ) = s m ( τ , f n ) h m ( τ , f n ) + n m
where s m ( τ ) represents the clean DDM, and τ is the parameter to be estimated. Under the assumption that the speckle noise h m is element-wise independent and identically distributed (i.i.d), it is complicated to introduce it as a priori in the hierarchical Bayesian algorithms. For such a complicated nonlinear problem, a fully supervised deep learning approach is proposed to obtain the AGL in this paper. The generation of clean labels is tackled by a novel algorithm based on a semi-analytical model.

3. Methodology

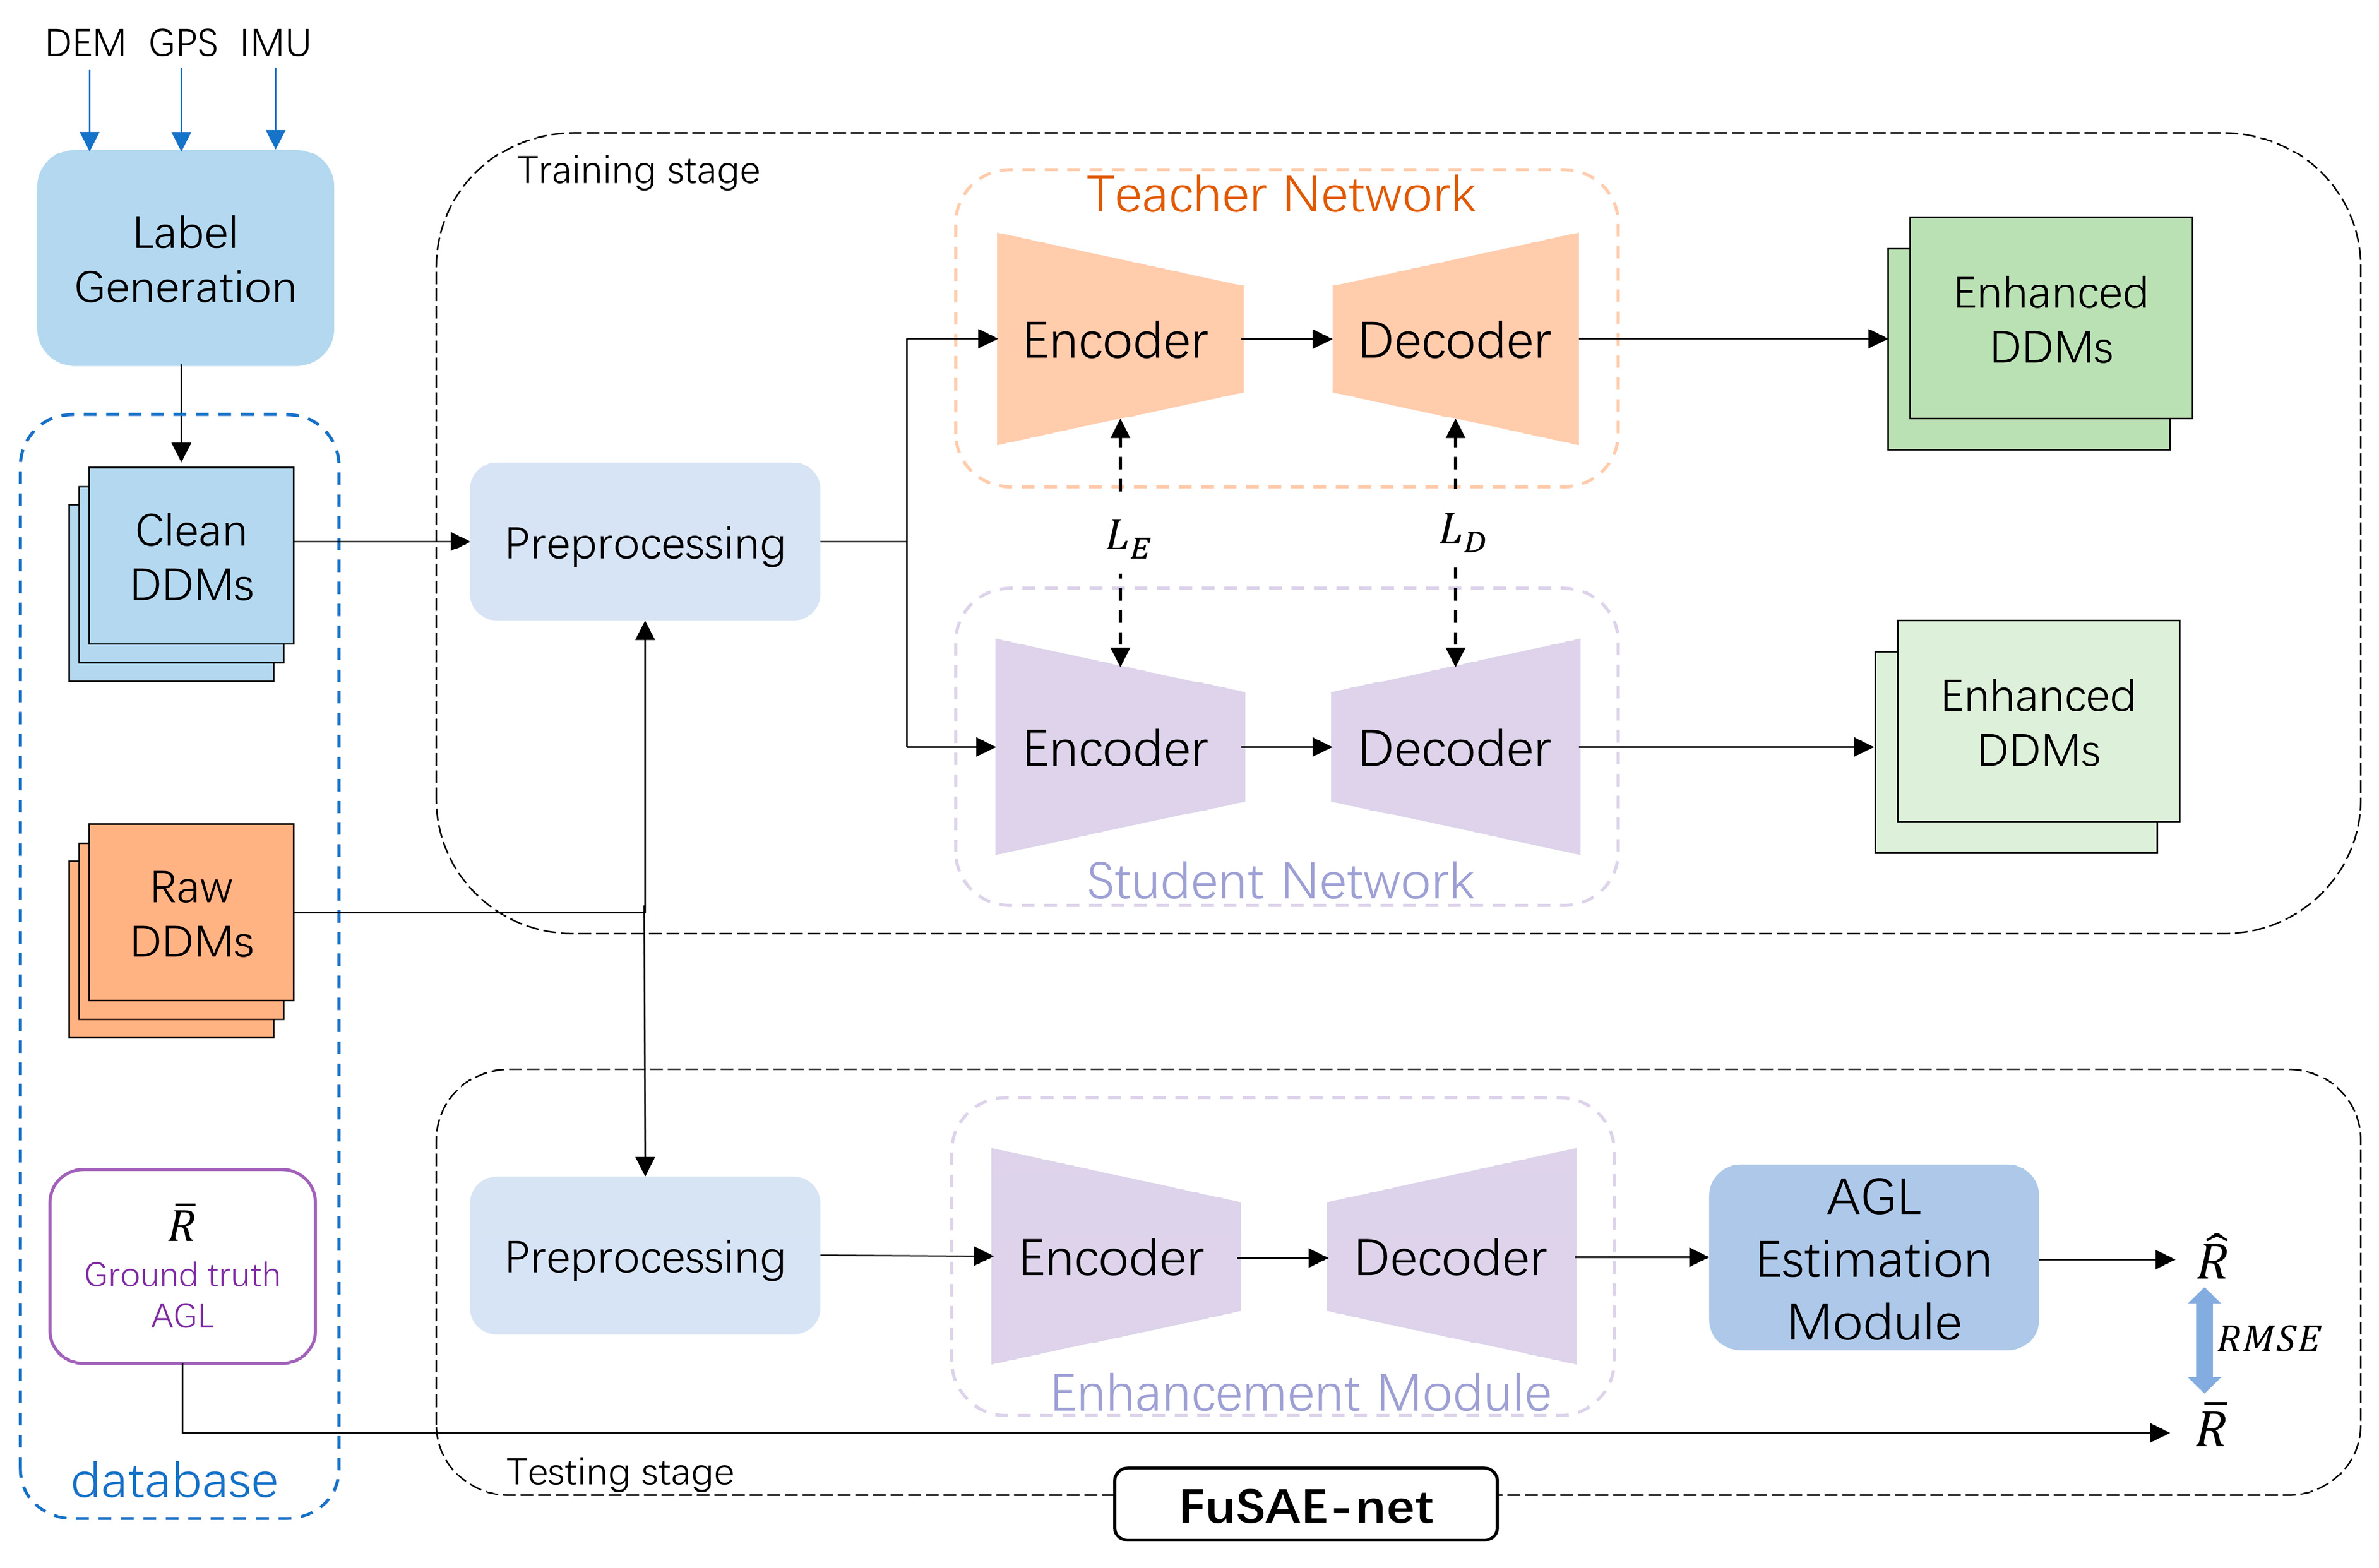
Due to the influences of speckle noise and Gaussian noise, the feature-driven AGL estimation for airborne SARAL in landscapes is always a significant challenge. Therefore, the FuSAE-net was suggested to provide accurate altimetry for airborne SARAL at low altitudes over complicated landforms. Furthermore, in order to achieve full supervision, the generation of labels is an essential part of the proposed algorithm. Figure 2 illustrates the processing flowchart in detail, which is divided into three parts: database, training stage, and testing stage. The database consists of raw DDMs, clean DDMs, and the corresponding AGL ground truth. The FuSAE-net consists of two modules: a lightweight DDM enhancement module and an AGL estimation module. The accurate AGL estimation is based on the feature enhancement, and it can be understood as a downstream application of the enhancement module.
In Figure 2, the entire process starts with the proposed label generation requiring the input of data from the digital elevation model (DEM), the global positioning system (GPS), and the inertial measurement unit (IMU). During the training stage, the performance of the enhancement of DDMs is focused. The training process contains the pre-training of the complicated teacher network and the training of the compact student network through knowledge distillation, which is represented by the dotted line between the teacher network and the student network. L E and L D indicate that knowledge distillation is carried out on the encoder and decoder simultaneously. After knowledge distillation, the trained lightweight student network is applied as the enhancement module. In the tests, after preprocessing of raw DDM, the data is enhanced by the enhancement module, and the AGL estimate R ^ is ultimately achieved via the AGL estimation module.

3.1. Clean Label Generation

The CNN-based networks have a strong ability to solve nonlinear problems, but their effectiveness relies heavily on massive data during the supervised training, especially the labels applied in full supervision. To achieve a fully supervised network, it is important to obtain clean DDMs as accurate labels. Due to the non-homogeneous landforms and the angle-dependent scatter coefficients, when the airborne SARAL is in land observation mode, the majority of parametric echo models are insufficient. To this end, a novel approach based on a semi-analytical model is proposed to generate clean DDMs for the training stage of the FuSAE-net.
The label-generating procedure is described in Algorithm 1. The DEM with high precision is the foundation for the AGL ground truth. According to DEM, the coordinates p S i of each scatter are obtained. The data of the GPS and the IMU are used to identify the current location p 0 and velocity v 0 of the platform. During echo generation, we concentrate on the physical scattering mechanism; therefore, the algorithm is based on a semi-analytical model. In [36], Moore and Williams point out that with occasional exceptions, radar return from the ground is largely due to area scatter, even at angles of incidence near vertical. Therefore, although SARAL observes the ground target located at the nadir point, the power is still largely based on scattering. The Ulaby model [37] is an empirical model that can describe the backscattering coefficient of common landform-covering media and is widely used in radar altimeter research [38,39]. Consequently, the backscatter property of each scatter is described as (8) using the Ulaby. During the calculation of the reflection of individual scatter, the amplitude items do not contain the phase information according to (5) and (9). Finally, the range–Doppler information of each scattering point is calculated through its corresponding index in DDM using the geometric relationship as in (10). In this way, a clean DDM without additive and speckle noises is obtained as the accurate label for pre-training and training during knowledge distillation. Even though the label generation algorithm proposed here ignores details about the objects on the surface, the main features about altitude remain, which is adequate for the full supervision of FuSAE-net.
Algorithm 1: Generation process of the clean label.
Input: The coordinates of each scatter: p S i = x i , y i , z i T , i S , where S is the total set of scatters. Current location and velocity of the platform: p 0 = x 0 , y 0 , z 0 T and v 0 = x ˙ 0 , y ˙ 0 , z ˙ 0 T . The wavelength of radar is λ . The resolution of range gates and Doppler channels as Δ r and Δ d , respectively.
1.
Substitute p S i , p 0 and v 0 into the following equations to calculate the relative ranges R i , location vectors r i and Doppler frequency D i of each scatter.
R i = p S i p 0 2
r i = p S i p 0 / p S i p 0 2
D i = 2 v 0 T r i / λ
2.
Compute the scatter coefficients as
σ i = p 1 + p 2 exp p 3 θ i + p 4 cos p 5 θ i + p 6
where θ = arccos z i z 0 and p 1 ~ p 6 depend on the type of land cover medium.
3.
Calculate the reflection of individual scatter as
s i = λ 2 4 π 3 σ i 1 R i 4
4.
Accumulate each element of the DDM matrix according to the sets of range and Doppler indexes as
D m n = i R m D n s i
where R m and D n are the index sets with respect to the mth range gate, and nth Doppler channels, correspondingly.
Output: A clean DDM power matrix as D M × N , where M is the number of pulses and N is the number of range gates.

3.2. FuSAE-Net

To obtain an accurate AGL estimation of complicated landforms, a general method is proposed for airborne SARAL. The FuSAE-net implements the estimation mainly via two modules: the lightweight DDM enhancement module and the AGL estimation module.

3.2.1. A Lightweight DDM Enhancement Module

  • A. Architecture Designation
The basic framework of the DDM enhancement module derives from the encoder–decoder architecture [40]. The encoder–decoder-like architecture has been extensively employed in image processing and prediction [41,42]. The U-net encoder–decoder architecture [35] is a successful symmetrical image generator because of its long-skip connections. With the residual connections, some key properties that could be lost during encoding can be retrieved by the decoder. It has demonstrated its ability to outperform with just a few samples [42]. This structure can achieve a consistent size for input and output. The encoder ( f E N ) extracts the feature maps E from the input DDM y m of size H M × W M by a sequence of convolutions and downsampling.
E = f E N ( y m , L a b e l ; θ E N ) , E C E × H E × W E
where the L a b e l has H M × W M cells, θ E N means the parameters of the encoder, the size of E is C E × H E × W E , and C E represents the number of channels. During the encoding, the receptive field is increased by downsampling, so that convolutions of the same size can perform feature extraction on a larger range than before.
The decoder is used to reconstruct a DDM that is the same size as the input. The feature maps E are extended by upsampling. The decoder ( f D E ) upsamples the feature maps symmetrically to obtain the reconstructed DDM s ^ m as follows:
s ^ m = f D E ( E ; θ D E ) , s ^ m H M × W M
where θ D E represents the decoder parameters.
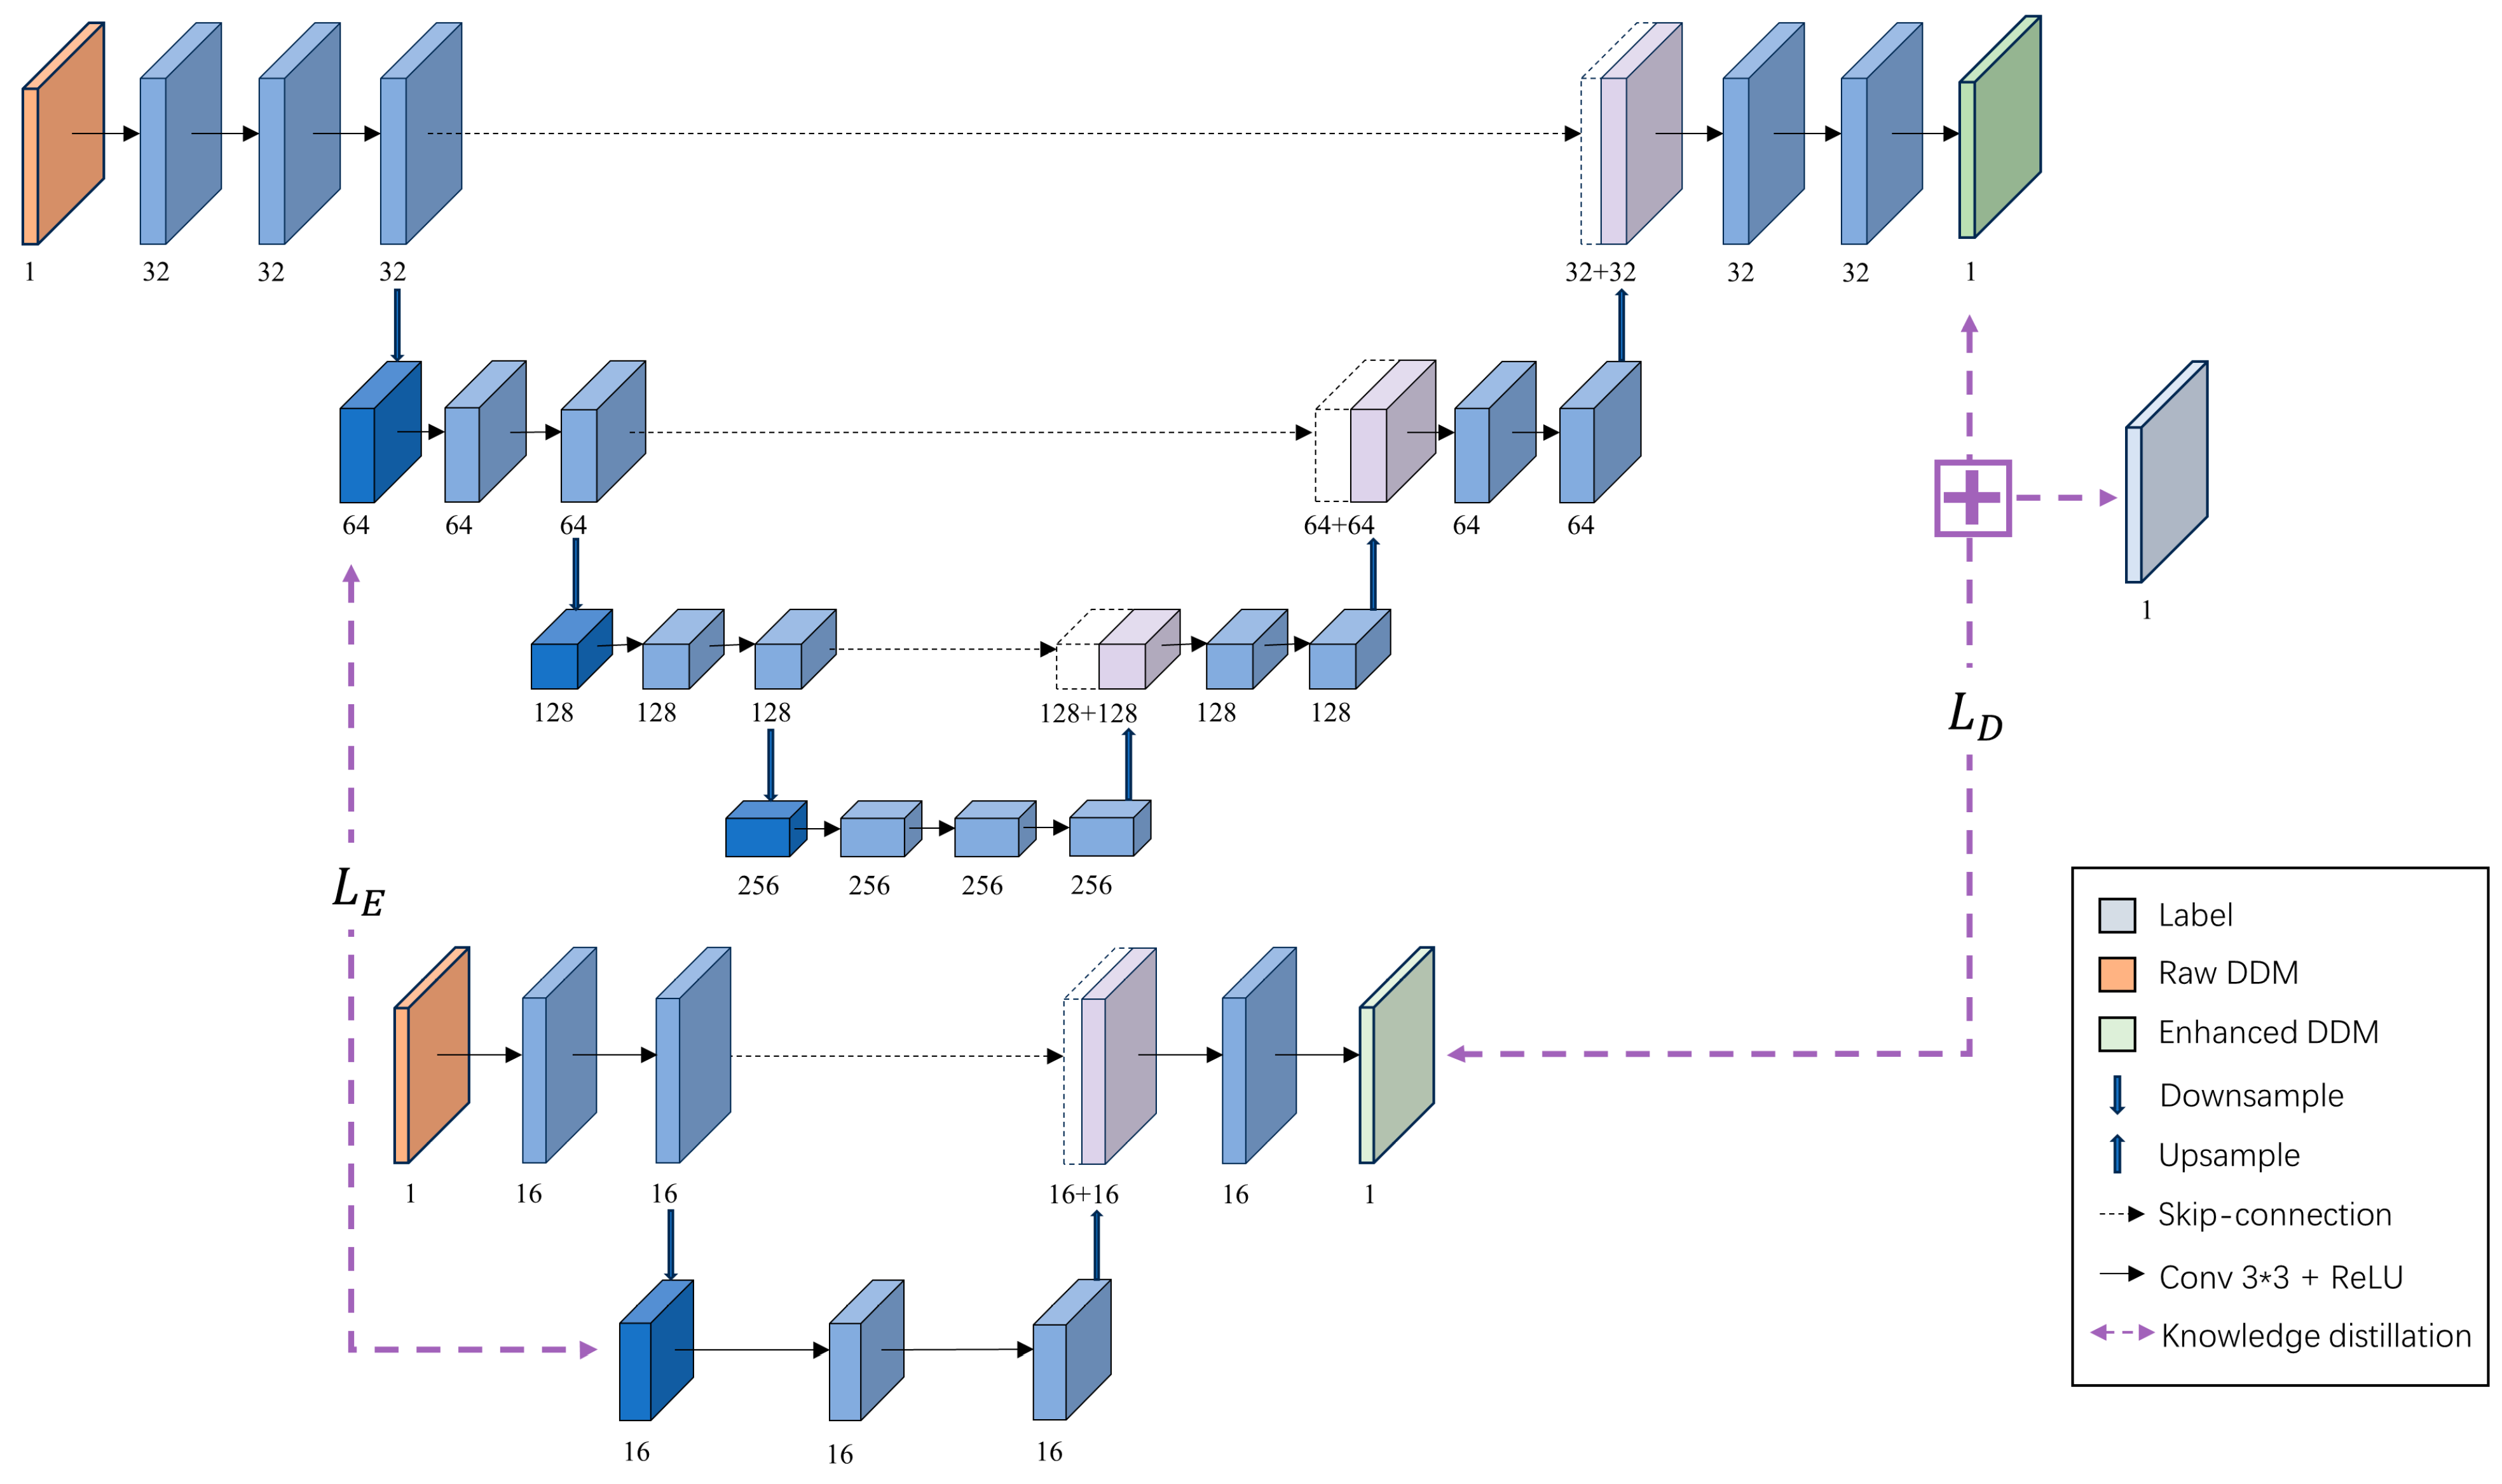
For the airborne SARAL, the network should have both high efficiency and minimal storage requirements. In such a case, the network should work in a light manner. Knowledge distillation is a well-known training paradigm to achieve a lightweight structure without modifications to existing networks [43]. The conventional model of knowledge distillation can be divided into two parts: an effective teacher network and a compact student network. Under the guidance of the teacher network through knowledge distillation, the computation of the student network can be efficient without a significant performance decrease. To overcome the performance limitations of conventional knowledge distillation which only utilizes the output of the teacher network to guide the student network, the proposed approach makes use of both encoder and decoder, i.e., the reconstructed DDM s ^ m and the feature maps E of the teacher network. During knowledge distillation, the clean DDM label plays the role of full supervision. Figure 3 depicts the framework of the proposed knowledge distillation. The top network in the figure is the architecture of the teacher network, the bottom represents the student network. In Figure 3, the number under each input/output indicates the numbers of its channels. The raw DDM as the initial input of the network, the DDM of the final output, and the label have been annotated in the figure as each having one channel. The blue cuboid represents the feature map output after convolution, the dark blue cuboid is the feature map after downsampling, and the purple cuboid is the feature map after upsampling. L E and L D are defined in (17) and (20), respectively. The downsampling operation consists of a 2*2 convolution with stride 2 and the ReLU. Accordingly, the upsampling operation consists of a 2*2 deconvolution with stride 2 and the ReLU. The skip connection means
E D E l = E E N l U p s a m p l e ( E D E l 1 )
where E E N and E D E represent the feature maps of the encoder and decoder, respectively. l and l 1 are the indexes of the layers, and is the connection operator.
Commonly, in knowledge distillation, the performance upper bound of the teacher network typically determines the performance upper bound of the student network. Therefore, the architectural design of the effective teacher network is important. What is more, the training process of the teacher network is carried out under the supervision of the accurate label. It has been proven that the depth of the network is related to the final performance [44]. Since the input of raw DDM is impaired by additive and speckle noises, the teacher network is designed with three downsampling layers considering the size of input DDM after preprocessing. The teacher’s encoder compresses the information at different scales by downsampling, thus providing feature maps at different levels of abstraction. The shallow feature maps concentrate on the texture features, whereas the deep feature maps reflect the essential features. To ensure that the size of the output is the same as the input, three upsampling layers are set. The features of different layers are fused at multiple scales by skip connections so that they can extract useful information and prevent the loss of accurate echo edges simultaneously. To reflect the computational complexity of the network in terms of its spatial complexity, the total number of trainable parameters in the teacher network is 2,890,625.
To achieve low computational complexity, the student network only uses one downsampling layer and one upsampling layer. The feature map from the initial downsampling of the teacher network serves as the encoder’s guide for the student network. The output of the teacher network and the accurate labels are used to guide the decoder as the soft labels and hard labels, respectively. Additionally, the student network has 11,665 trainable parameters in total, which is around 0.4% of the instructor network.
  • B. Training
During knowledge distillation, the training of the student network is carried out under the guidance of the pre-trained teacher. For the pre-training of the teacher network, the loss function is the root mean square error (RMSE) between the accurate label H i L and the enhanced DDM H i P , which is obtained from the output of the teacher network. The RMSE is defined as
L T = 1 m i = 1 m ( H i L H i P ) 2
where m is the total number of the outputs.
The training of the student network is achieved by simultaneous knowledge distillation at the encoder and decoder. For the encoder, the norm distance loss function is replaced with a structural loss [43] to capture the additional spatial features of the student and teacher networks. Assume C T × H × W feature maps F T as the output from the first downsampling in the teacher network, and D T is the distillation feature map of F T whose size is H × W . The features from the first downsampling in the student network are F S of size C S × H × W . D S is the distillation feature map of F S with H × W cells. D T and D S are operated as
D i , j T = k = 1 C T F k , i , j T C T
D i , j S = k = 1 C S F k , i , j S C S
Based on Equations (15) and (16), the loss function of the encoder of the student network is
L E = i = 1 H j = 1 W D i , j T log D i , j T D i , j S
For the knowledge distillation of the decoder, assuming that the output of the teacher network is P T of size H M × W M , the output of the student network is P S of size H M × W M , and the accurate label is L a b e l . The supervision of the student decoder consists of two components: First, it should be near the accurate label which is produced by our label generation algorithm, and this part of the loss is recorded as L h a r d . Second, due to the limited layers of the student network, it frequently cannot be optimized to a location that is extremely close to the label, hence the necessity for teacher network supervision. The loss between P T and P S is recorded as L s o f t . The loss L D of the decoder of the student network is obtained as follows:
L h a r d = ( p = 1 H M q = 1 W M ( P p , q S L a b e l p , q ) 2 ) 1 2
L s o f t = p = 1 H M q = 1 W M P p , q T log P p , q T P p , q S
L D = ω * L h a r d + ( 1 ω ) * L s o f t
where L h a r d is the mean square error loss function, L s o f t is the Kullback–Leibler divergence between P T and P S , and ω means the weight.
The Adam is used as the optimizer during pretraining and training, where lr = 0.001, beta_1 = 0.9, beta_2 = 0.999, and weight_decay = 1 × 10⁻⁴. The lr means learning rate. The network was developed using Python 3.9, and the network was tested and trained using Pytorch.

3.2.2. AGL Estimation Module

The FuSAE-net derives the AGL estimates from the DDM in contrast to conventional estimation methods, which are based on the one-dimensional waveform. During the estimation, the AGL is determined by the point that scatters the most strongly in the vertical direction. The IMU is used to gather information about the flying attitude of the SARAL.
With a flat trajectory, the desired point from the enhanced DDM is the one that has the maximum value when the Doppler dimension equals zero. When the angle between the flight speed and the ground is θ , the offset of the target point in the Doppler dimension is
Δ = [ H ( 1 cos θ ) ]
where [ · ] means the rounding operation, H represents the size of the Doppler dimension of DDM. The predicted AGL R ^ is calculated as follows:
R ^ = ( l 1 ) T S c 2
where l is the distance dimension index of the obtained points and T S is the sampling interval. It can be noted from (22) that the AGL is obtained from R ^ .

4. Experiments

In order to verify the effectiveness of the proposed method in practical application, the raw data of an airborne SARAL over complicated landforms were applied. To evaluate the superiority of FuSAE-net, comparative experiments with conventional methods, including the LS algorithm, the smooth MAP estimation [11], and the mutant MAP estimation [12], were designed. To demonstrate the repeatability of the results, several experiments were conducted, where the training set and testing set for each experiment were random.

4.1. Data Set Description

4.1.1. Flight Route

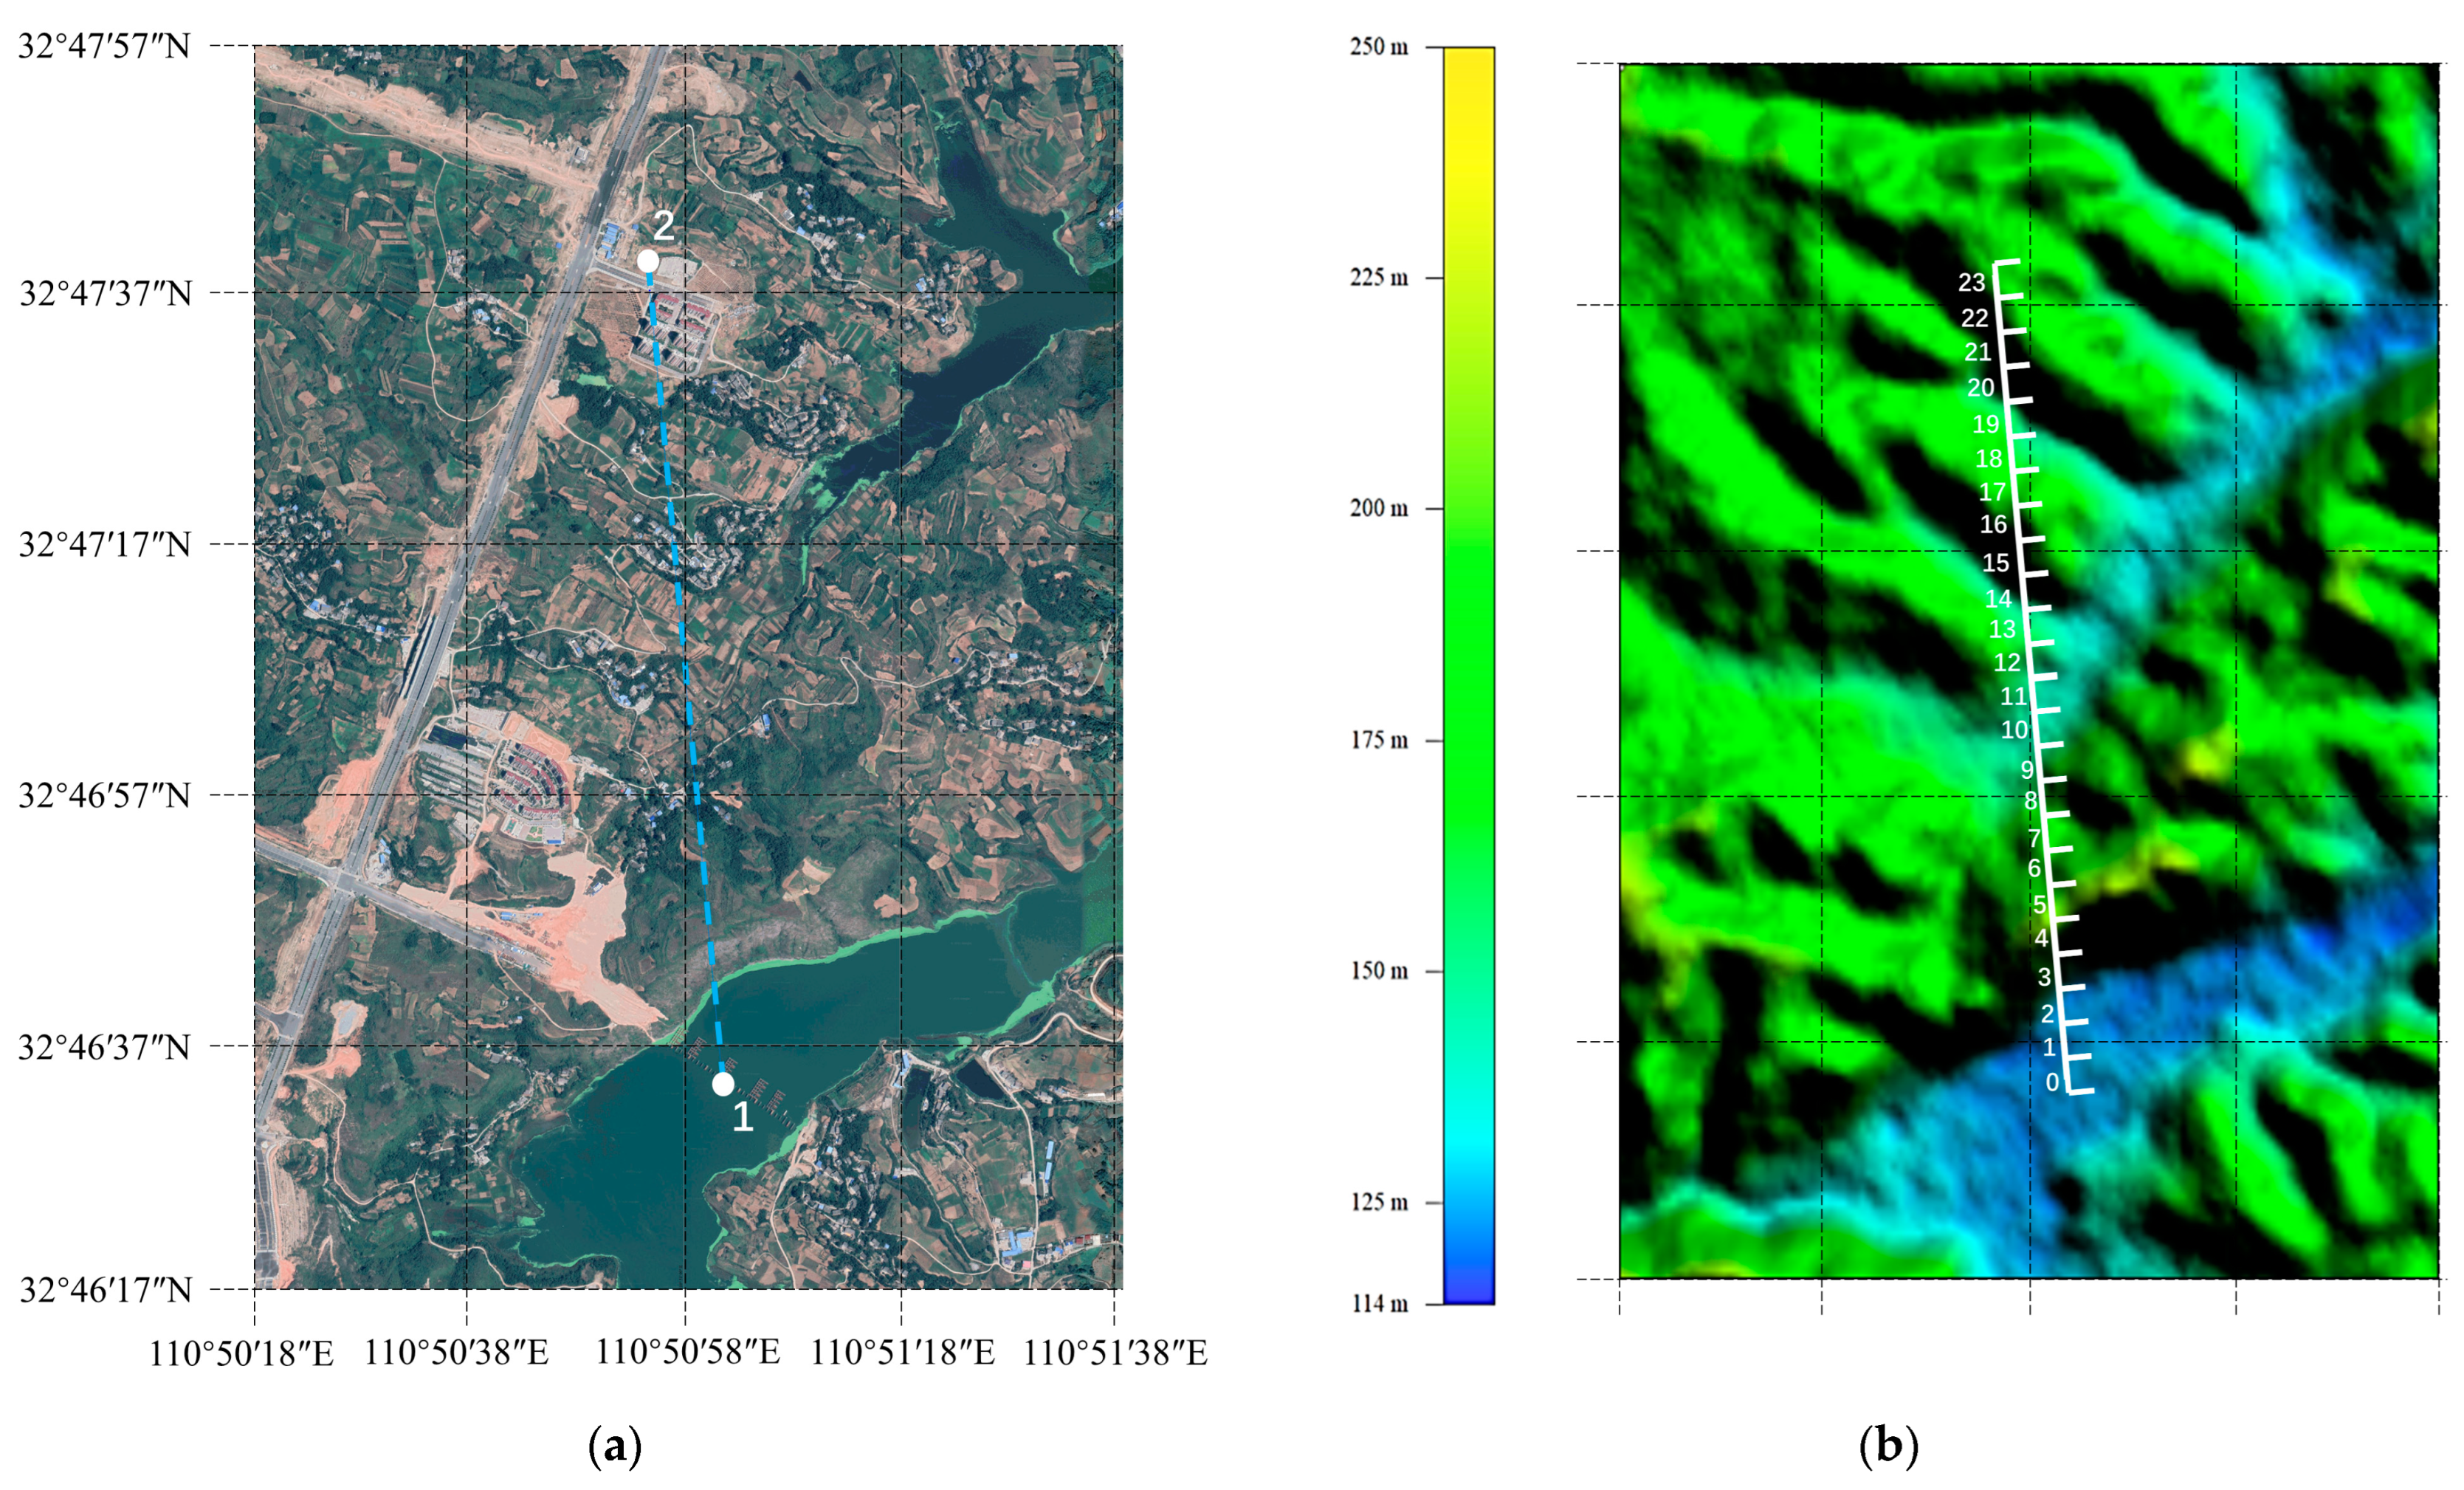
The experiments were carried out in a region of Hubei Province, China. The flight route is shown in both the satellite image and the DEM in Figure 4. The track of the airborne SARAL was from position 1 to position 2, whose total length is around 2.1 km. The locations of the origin and the destination are (32°46′33.48″N, 110°51′01.64″E) and (32°47′37.16″N, 110°50′55.47″E). During the flight, various landforms were observed.
Some typical landforms and their corresponding enlarged raw DDMs are both shown in Figure 5. Through Figure 5, the characteristics of DDM in different landforms are visually displayed. Compared with inland, the echo of the river was less impaired by speckle noise, and the target was distinguishable. The shape of the raw DDM from the coast was obviously discontinuous because of the small fluctuation between the bank and the river. The location of forest is close to the mountain (see Figure 4). Thus, it is not as flat as the field. Consequently, the shape of its DDM was different from that of the field. The DDM of the building was distinctive, with a cluster of individual scattering points detached from the main part.

4.1.2. Data Collection and Preprocessing

In this paper, we mainly consider DDMs for AGL estimation. Compared with the conventional preprocessing of the echoes, delay correction and multi-look are not performed. Therefore, the time spent in prepossessing received signals is reduced. In the experiments, the preprocessing time by conventional methods of each echo is 4.0279 s, while the time spent in preprocessing each echo by the proposed method is 3.7098 s. The parameters of the airborne SARAL during the experiments are shown in Table 1.
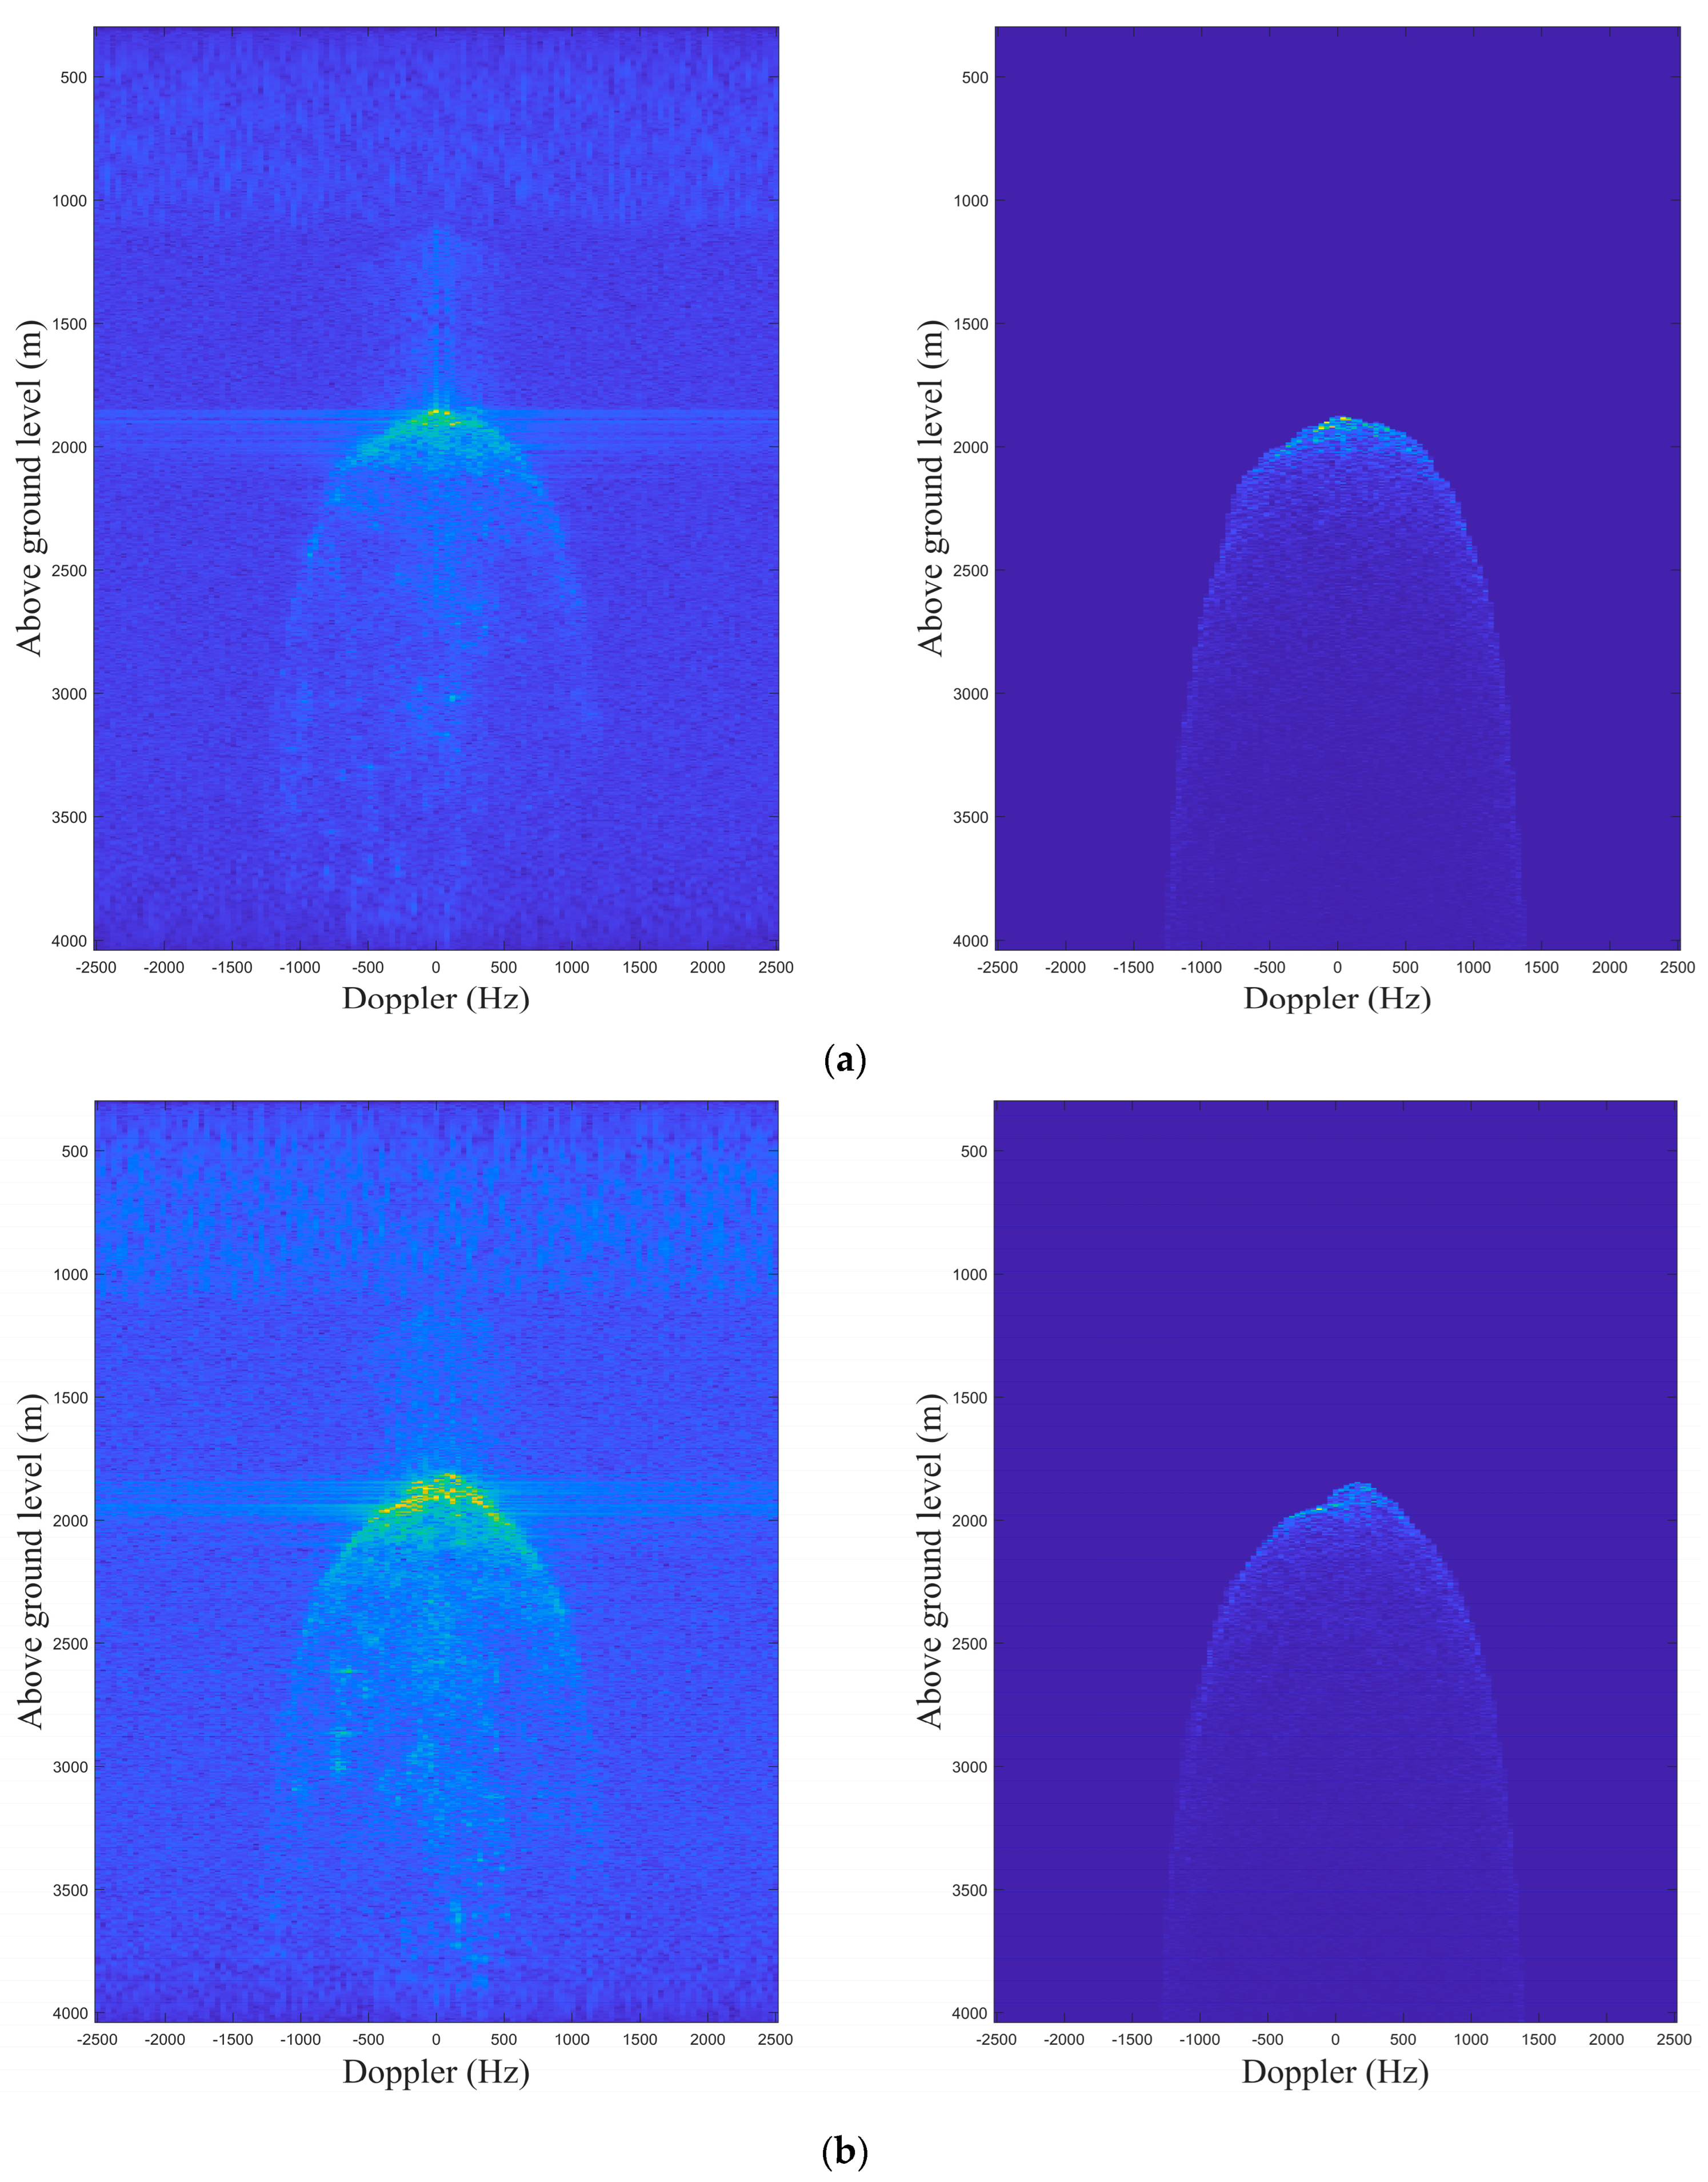
There were 2400 raw DDMs, each with a corresponding clean DDM and AGL ground truth, which were divided into 24 groups, each containing 100 pairs. The index range was from group 0 to group 23, specifically indicated in Figure 4b. After the labels were obtained, the data needed preprocessing. The preprocessing step involves two tasks. The first is the alignment of raw DDMs and labels; the second is data cropping. The alignment is achieved by utilizing the velocity and position coordinates of the airborne SARAL. Two typical pairs of aligned DDMs with 125*624 cells are shown in Figure 6. Figure 6a shows paired DDMs of flat terrain with smooth upper forms. In contrast, the upper shapes of DDMs in Figure 6b are unsmooth. To improve the efficiency of the network, the raw DDMs and the label are processed as 125*50 cells, which contain the important parts of the DDMs. After random shuffle, the dataset was divided into training and testing sets in 2:1.

4.2. Evaluation Indicators

The performance of the proposed approach was assessed using the MAE, RMSE, and the processing time of each echo. The MAE and RMSE are defined as
M A E = 1 N i = 1 N | R ^ i R ¯ i |
R M S E = 1 N i = 1 N ( R ^ i R ¯ i ) 2
where the R ^ means the predicted AGL and the R ¯ is the AGL ground truth. N represents the number of samples. To illustrate the low computational complexity of the proposed method, the processing time is for each single echo. The time complexity of the LS algorithm, the smooth MAP estimation, the teacher network, and the student network are 62.400 billion FLOPs, 17.232 billion FLOPs, 1.036 billion FLOPs, and 46.166 million FLOPs, respectively. Among them, the time complexity of the LS algorithm is the mean value under specified parameter settings when calling the lsqnonlin function in MATLAB.

4.3. Performance Analysis and Discussion

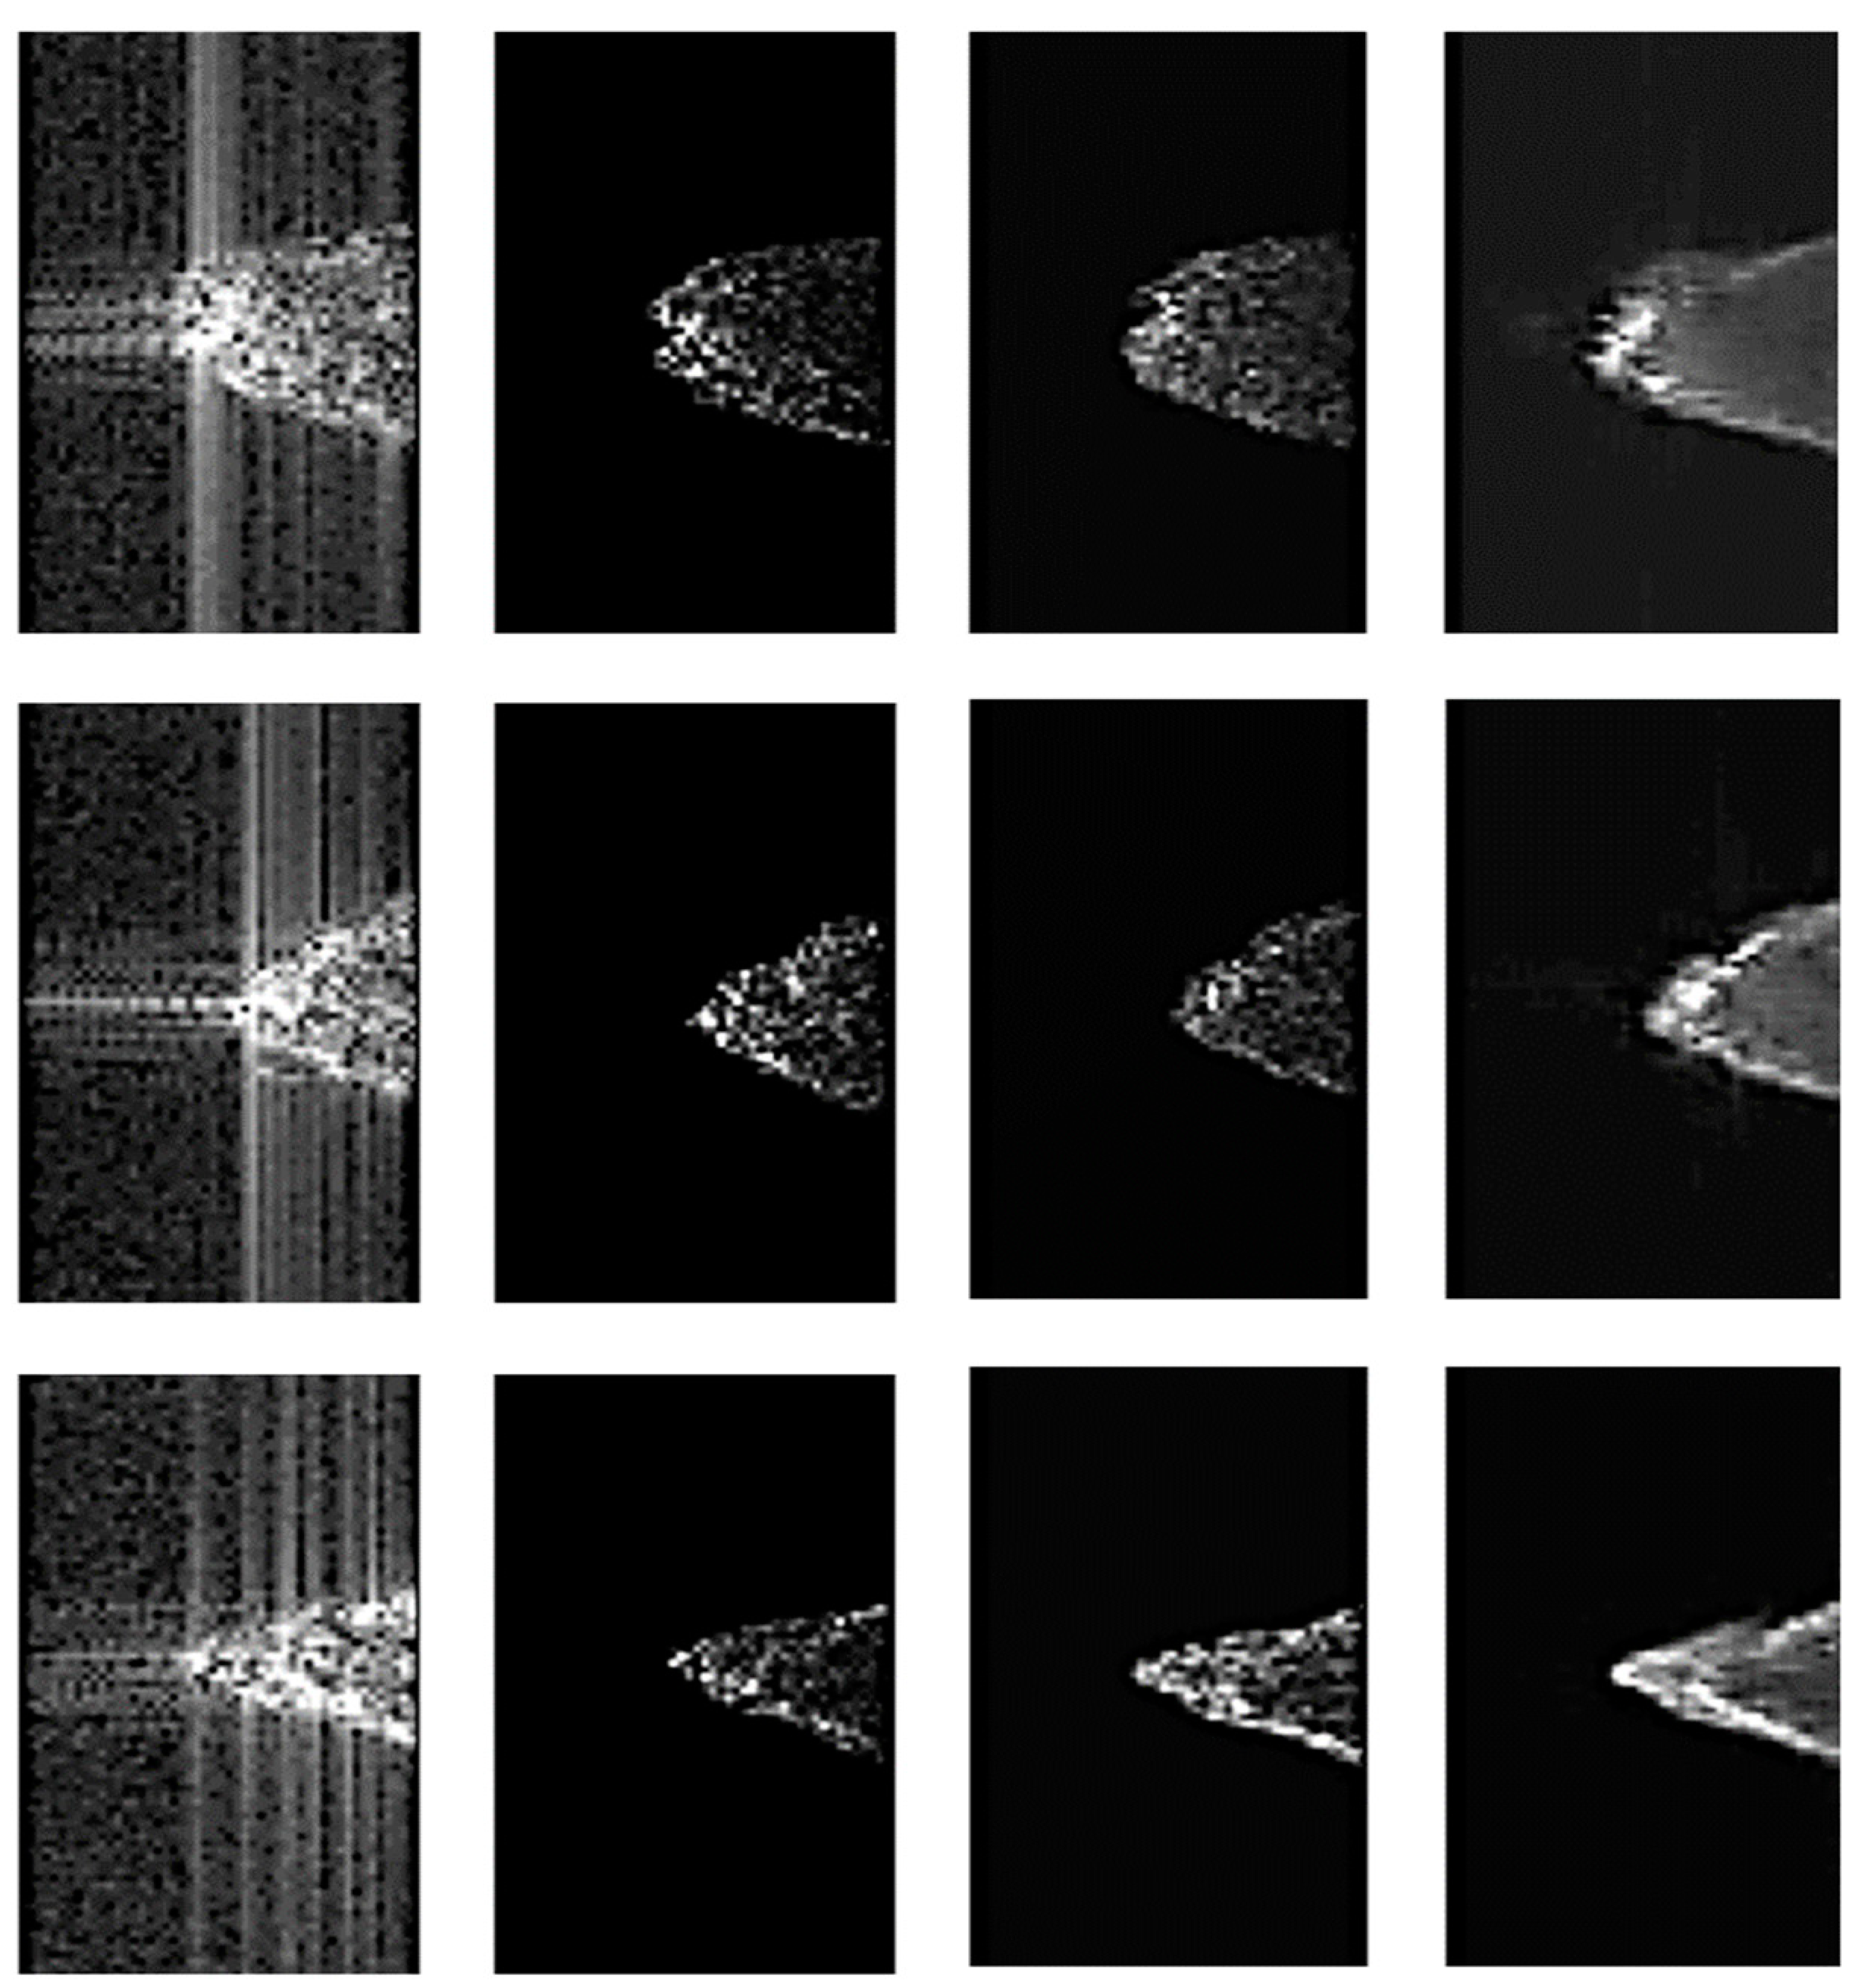
The ablation experiments were performed to assess the role of the components of FuSAE-net and the impact of knowledge distillation. To evaluate the denoising capability of the enhancement module in FuSAE-net, the peak signal to noise ratio (PSNR) was used, which is a quantitative evaluation metric of the degree of noise corruption. Table 2 shows the results of the comparison. In Table 2, the AGL-E-M means the results obtained via the AGL estimation module. Teacher represents the raw DDMs enhanced by the teacher network. KD means the raw DDMs enhanced by the lightweight student network through knowledge distillation. Figure 7 shows several images that were chosen at random to represent the differences between raw DDMs, accurate labels, and the outputs under full supervision. Combining the images and the PSNR in Table 2, it is obvious that the capability of the enhancement of the teacher network is strong under the full supervision of clean DDMs. What’s more, due to knowledge distillation, the proposed approach only takes 52% of the processing time of the teacher network to achieve a nearly identical outcome in the testing stage. Therefore, with the guidance of the encoder and decoder of the teacher network, the student network can effectively suppress the noise and keep the echo information for different landforms with only one downsampling layer and one upsampling layer.
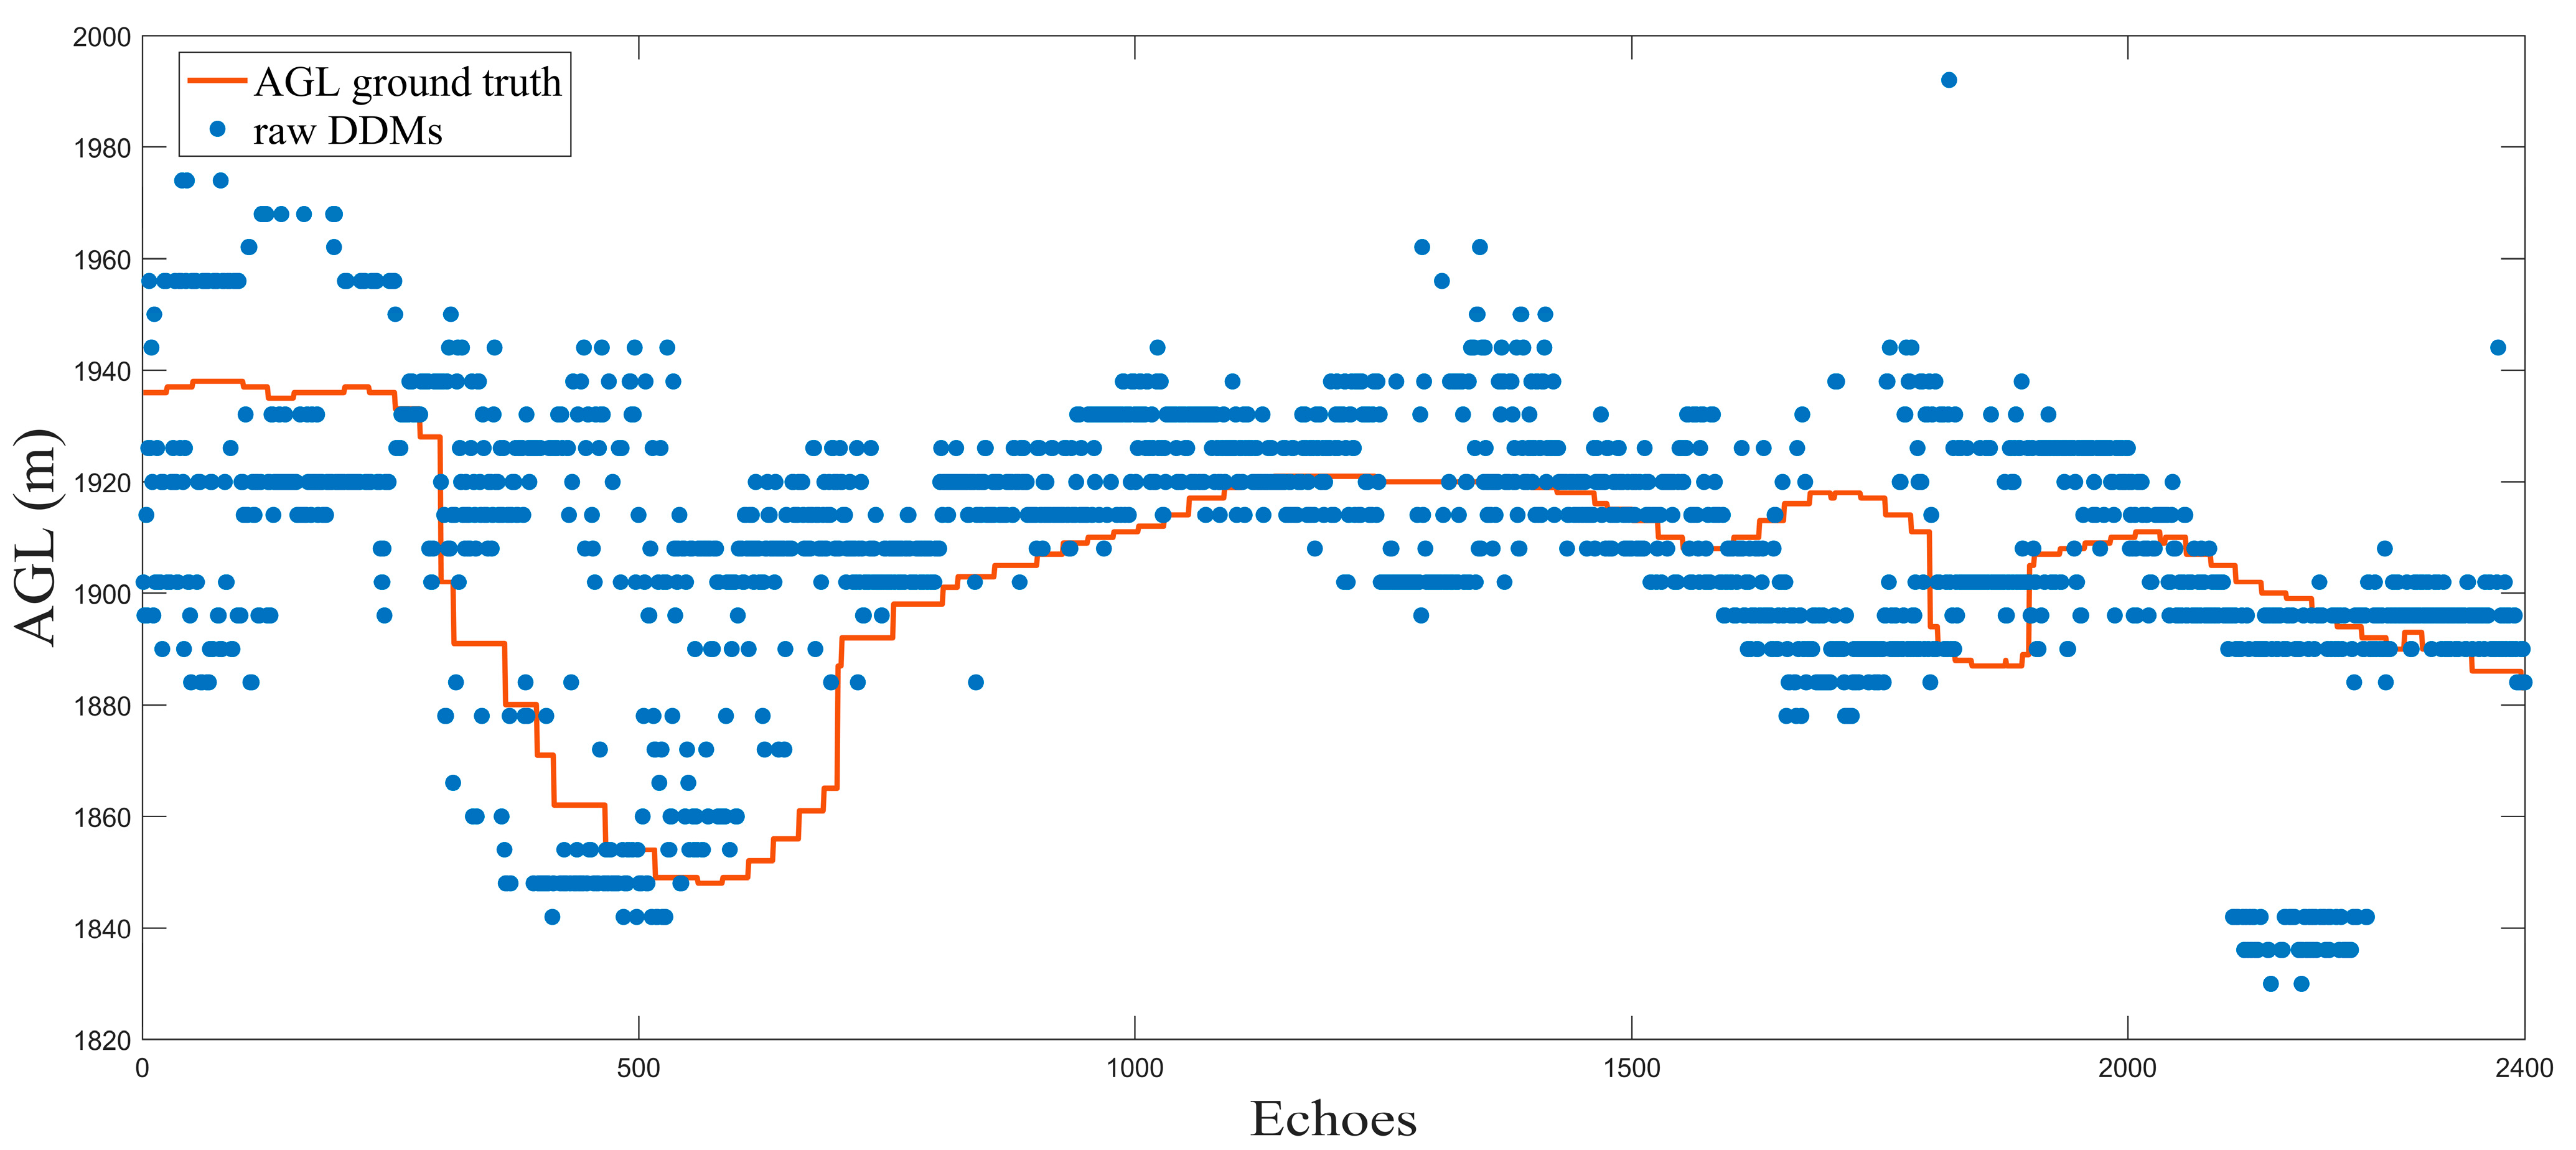
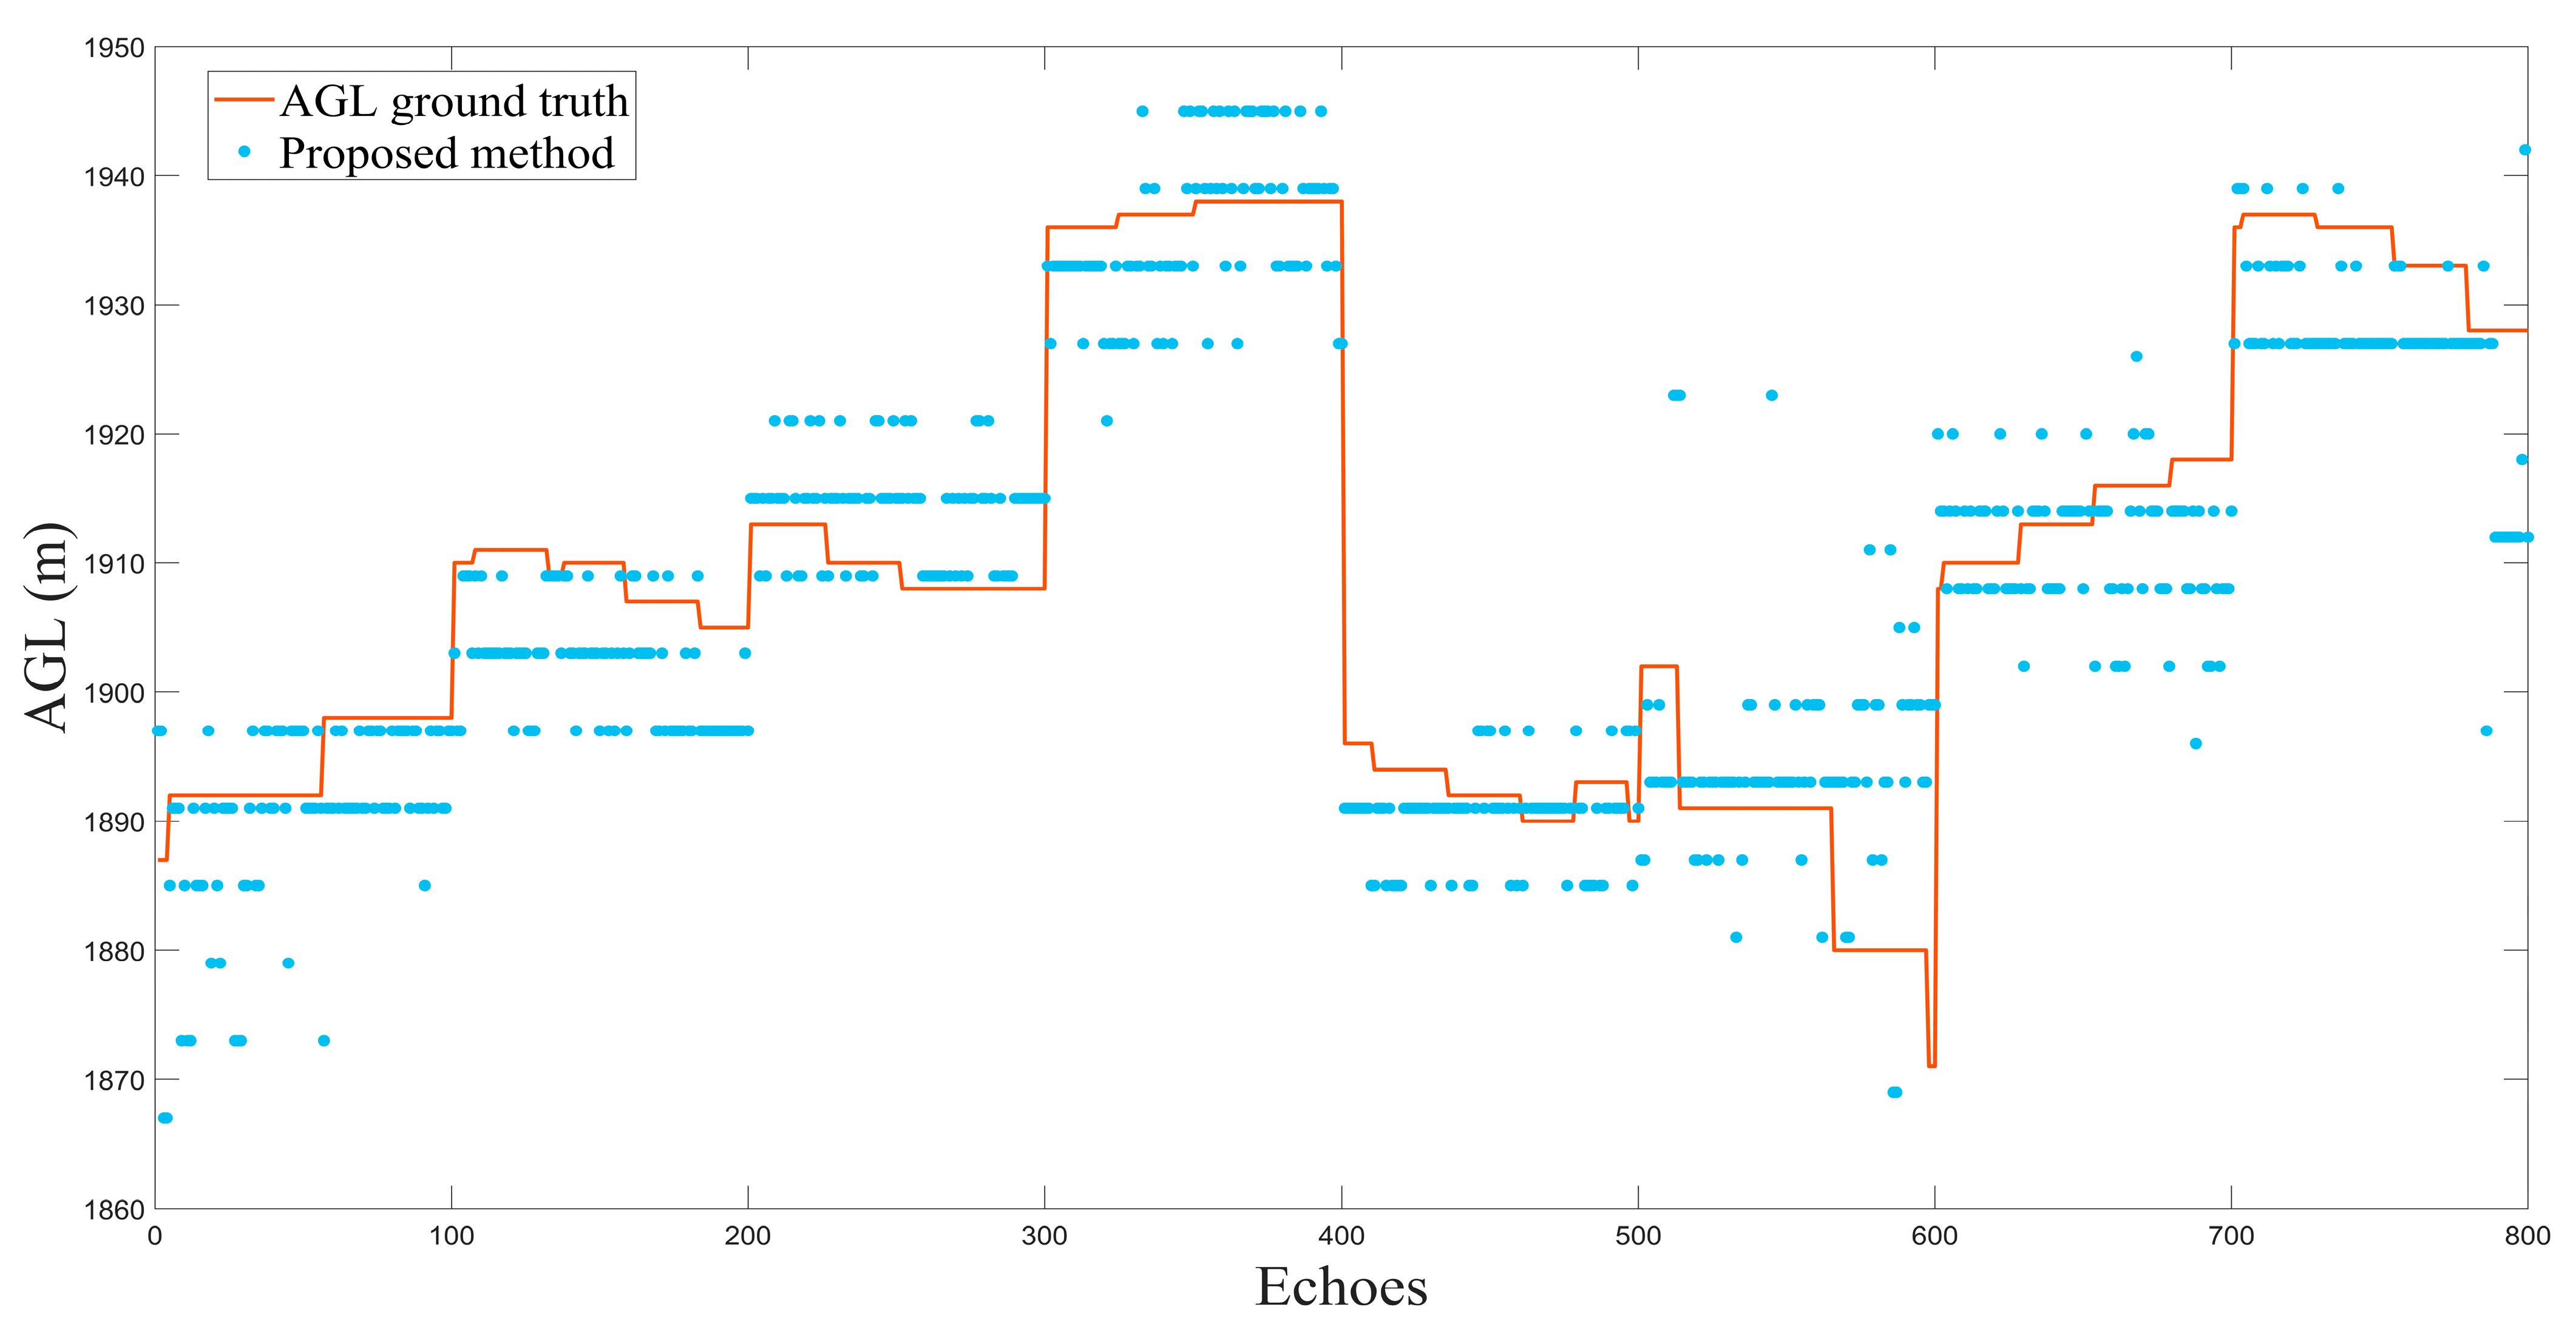
Figure 8 visually shows the AGL estimates from the 2400 raw DDMs via the estimation module, which directly represents the severe decrease in the estimation accuracy under the influence of additive and speckle noises. Figure 9 displays the AGL estimates by the proposed method from one of the experiments at random. There were 800 echoes in the test, and the indexes of the 8 groups of AGL estimates in Figure 9 were: group 7, group 20, group 15, group 0, group 22, group 3, group 16, and group 2. The data of group 0 corresponded to the river, and the AGL estimates were the highest (echo 301 to 400) in Figure 9. Group 22 corresponded to the high terrain in Figure 4b. Consequently, the AGL estimates were lower (echo 401 to 500) compared to the previous group, resulting in a sudden relief in Figure 9. Due to the random shuffle, the terrain of testing sets in Figure 9 was not as smooth as the original data in Figure 8, which may prove the robustness of FuSAE-net. The MAE and RMSE of the proposed method in Figure 9 were 6.2300 m and 8.1308 m, which verifies the effectiveness of the proposed approach.
The performance comparison between the proposed estimation approach and conventional methods is shown in Table 3. The values in Table 3 are the average results of all conducted experiments. Comparing the results of LS and the results in the second line of Table 2, it is clear that the AGL estimation module is available even for raw DDMs, and it is equally effective with the LS algorithm. This indicates that the parameter estimation approach based on DDM is feasible. In Table 3, the MAE and RMSE of the FuSAE-net were the lowest, which demonstrates the superiority of the proposed estimation approach in accuracy. Additionally, it is clear from the table that the proposed approach is more computationally efficient than the three conventional methods with the minimum processing time. Due to the necessity to regenerate a new waveform based on the convolution of three terms for each iteration, the computational complexity of conventional methods is high. Furthermore, the proposed method is designed for GPU and multithread running. Figure 10 shows the AGL estimation results of another one of the experiments, chosen at random, and the testing data contained are: group 11, group 15, group 10, group 5, group 9, group 21, group 1, and group 19. In Figure 10, the RMSE of LS, smooth MAP, and mutant MAP were 29.9736, 24.5521, and 25.3475 m, respectively. The MAE of the three conventional methods were 21.4457, 13.7643, and 13.3706 m, in order, while the MAE and RMSE of the proposed method were 7.7025 and 11.7328 m, respectively. It was found that neither the LS nor the smooth MAP could adequately describe the abrupt changes in the terrain for raw echoes. Due to the influence of various noises, the LS algorithm overfits, and the smooth MAP estimation smooths the terrain changes by its assigned priors. Furthermore, because of the additive and speckle noises, the mutant MAP may be ineffective for the mutants and less effective than smooth MAP in non-mutated regions. Since the enhancement module excludes the effect of the noises and no model fitting is required during the AGL estimation, the proposed approach was able to adjust to the given circumstances.
With the comparison of the three conventional methods, the results revealed that the FuSAE-net performs better in complicated landforms than the conventional parameter estimation methods. Whether the terrain is flat or has sudden mutants, it has a strong ability to adapt. Currently, altimetry algorithms for airborne SARAL with high accuracy are mostly physics-driven approaches. However the provided parametric model limits this class of algorithms, and there are no models for complicated terrestrial environments. The FuSAE-net achieves both superior accuracy and computational efficiency. Finally, our experiments focused on the influence of surface media on different landforms. Although some terrain cases involving small fluctuations were resolved, the mountainous areas with large fluctuations have not been validated.

5. Conclusions

In this paper, a novel approach for airborne SARAL altimetry in complicated landforms is presented. We believe this is the first instance in which deep learning has been used to obtain an airborne SARAL parameter from DDMs. A novel algorithm based on a semi-analytical model was proposed to generate clean DDMs as accurate labels for effective supervision during pre-training and training. Additionally, in order to improve the efficiency of knowledge distillation, the information of the encoder and decoder was distilled simultaneously. The FuSAE-net eliminated the parametric model’s limitations and the influence of different noises via a fully supervised lightweight altimetry enhancement network. We believe the proposed algorithm can provide a reference in airborne SARAL parameter estimation with deep learning. We aim to deepen our understanding of these parameter estimation techniques based on DDMs and better integrate them with deep learning in future research of airborne SARAL in land altimetry missions.

Author Contributions

Conceptualization, Y.L.; methodology, M.D. and Y.G.; software, Y.L., M.D. and Y.G.; validation, Y.W., F.L., G.L., L.T. and G.J.; writing—original draft preparation, M.D.; writing—review and editing, Y.L. All authors have read and agreed to the published version of the manuscript.

Funding

This research received no external funding.

Data Availability Statement

The data presented in this study are available on request from the corresponding author. The data are not publicly available due to privacy.

Conflicts of Interest

The authors declare no conflict of interest.

References

  1. Raney, R.K. The delay/Doppler radar altimeter. IEEE Trans. Geosci. Remote Sens. 1998, 36, 1578–1588. [Google Scholar] [CrossRef]
  2. Halimi, A. From conventional to delay/doppler altimetry. Ph.D. dissertation, INP Toulouse, Toulouse, France, 2013. [Google Scholar]
  3. Ray, C.; Martin-Puig, C.; Clarizia, M.P.; Ruffini, G.; Dinardo, S.; Gommenginger, C.; Benveniste, J. SAR altimeter backscattered waveform model. IEEE Trans. Geosci. Remote Sens. 2015, 53, 911–919. [Google Scholar] [CrossRef]
  4. Yang, S.; Zhai, Z.; Xu, K.; Zhisen, W.; Lingwei, S.; Lei, W. The ground process segment of SAR altimeter. Remote Sens. Technol. Appl. 2017, 32, 1083–1092. [Google Scholar]
  5. Brown, G.S. The average impulse response of a rough surface and its applications. IEEE Trans. Antennas Propag. 1977, 25, 67–74. [Google Scholar] [CrossRef]
  6. Dinardo, S.; Fenoglio-Marc, L.; Buchhaupt, C.; Becker, M.; Scharroo, R.; Fernandes, M.J.; Benveniste, J. Coastal SAR and PLRM altimetry in German Bight and West Baltic Sea. Adv. Space Res. 2018, 62, 1371–1404. [Google Scholar] [CrossRef]
  7. Buchhaupt, C.; Fenoglio-Marc, L.; Dinardo, S.; Scharroo, S.; Becker, M. A fast convolution based waveform model for conventional and unfocused SAR altimetry. Adv. Space Res. 2018, 62, 1445–1463. [Google Scholar] [CrossRef]
  8. Idris, N.H.; Vignudelli, S.; Deng, X. Assessment of retracked sea levels from Sentinel-3A Synthetic Aperture Radar (SAR) mode altimetry over the marginal seas at Southeast Asia. Int. J. Remote Sens. 2021, 42, 1535–1555. [Google Scholar] [CrossRef]
  9. Dumont, J.P. Estimation optimale des paramètres altimétriques des signaux radar Poséidon. Ph.D. dissertation, INP Toulouse, Toulouse, France, 1985. [Google Scholar]
  10. Yang, L.; Zhou, H.; Huang, B.; Liao, X.; Xia, Y. Elevation Estimation for Airborne Synthetic Aperture Radar Altimetry Based on Parameterized Bayesian Learning. J. Electron. Inf. Technol. 2023, 45, 1254–1264. [Google Scholar]
  11. Halimi, A.; Mailhes, C.; Tourneret, J.Y.; Snoussi, H. Bayesian Estimation of Smooth Altimetric Parameters: Application to Conventional and Delay/Doppler Altimetry. IEEE Trans. Geosci. Remote Sens. 2016, 54, 2207–2219. [Google Scholar] [CrossRef]
  12. Liao, X.; Zhang, Z.; Jiang, G. Mutant Altimetric Parameter Estimation Using a Gradient-Based Bayesian Method. IEEE Geosci. Remote Sens. Lett. 2022, 19, 1–5. [Google Scholar] [CrossRef]
  13. Zhan, Y. Study on the Coastal Echo Processing Method for Satellite Radar Altimeter. Master’s Thesis, University of Chinese Academy of Sciences, Beijing, China, 2021. [Google Scholar]
  14. Wingham, D.J.; Rapley, C.G.; Griffiths, H. New techniques in satellite altimeter tracking systems. In Proceedings of the IEEE International Geoscience and Remote Sensing Symposium, Zurich, Switzerland, 8–11 September 1986. [Google Scholar]
  15. Davis, C.H. Growth of the Greenland ice sheet: A performance assessment of altimeter retracking algorithms. IEEE Trans. Geosci. Remote Sens. 1995, 33, 1108–1116. [Google Scholar] [CrossRef]
  16. Hwang, C.; Guo, J.; Deng, X.; Hsu, H.Y.; Liu, Y. Coastal gravity anomalies from retracked Geosat/GM altimetry: Improvement, limitation and the role of airborne gravity data. J. Geodesy. 2006, 80, 204–216. [Google Scholar] [CrossRef]
  17. Lee, H.; Shum, C.K.; Emery, W.; Calmant, S.; Deng, X.; Kuo, C.; Roesler, C.; Yi, Y. Validation of Jason-2 altimeter data by waveform retracking over California coastal ocean. Mar. Geodesy. 2010, 33, 304–316. [Google Scholar] [CrossRef]
  18. Huang, Z.; Wang, H.; Luo, Z.; Shum, C.K.; Tseng, K.-H.; Zhong, B. Improving Jason-2 Sea Surface Heights within 10 km Offshore by Retracking Decontaminated Waveforms. Remote Sens. 2017, 9, 1077. [Google Scholar] [CrossRef]
  19. Wang, H.; Huang, Z. Waveform Decontamination for Improving Satellite Radar Altimeter Data Over Nearshore Area: Upgraded Algorithm and Validation. Front. Earth Sci. 2021, 9, 748401. [Google Scholar] [CrossRef]
  20. Shu, S.; Liu, H.; Beck, R.A.; Frappart, F.; Korhonen, J.; Xu, M.; Yu, B.; Hinkel, K.M.; Huang, Y.; Yu, B. Analysis of Sentinel-3 SAR altimetry waveform retracking algorithms for deriving temporally consistent water levels over ice-covered lakes. Remote Sens. Environ. 2020, 239, 111643. [Google Scholar] [CrossRef]
  21. Agar, P.; Roohi, S.; Voosoghi, B.; Amini, A.; Poreh, D. Sea Surface Height Estimation from Improved Modified, and Decontaminated Sub-Waveform Retracking Methods over Coastal Areas. Remote Sens. 2023, 15, 804. [Google Scholar] [CrossRef]
  22. Molini, A.B.; Valsesia, D.; Fracastoro, G.; Magli, E. DeepSUM: Deep Neural Network for Super-Resolution of Unregistered Multitemporal Images. IEEE Trans. Geosci. Remote Sens. 2020, 58, 3644–3656. [Google Scholar] [CrossRef]
  23. Xing, D.; Hou, J.; Huang, C.; Zhang, W. Spatiotemporal Reconstruction of MODIS Normalized Difference Snow Index Products Using U-Net with Partial Convolutions. Remote Sens. 2022, 14, 1795. [Google Scholar] [CrossRef]
  24. Perera, M.V.; Bandara, W.G.C.; Valanarasu, J.M.J.; Patel, V.M. SAR Despeckling Using Overcomplete Convolutional Networks. In Proceedings of the IGARSS 2022 - 2022 IEEE International Geoscience and Remote Sensing Symposium, Kuala Lumpur, Malaysia, 17–22 July 2022. [Google Scholar]
  25. Wang, P.; Zhang, H.; Patel, V.M. SAR Image Despeckling Using a Convolutional Neural Network. IEEE Signal Process. Lett. 2017, 24, 1763–1767. [Google Scholar] [CrossRef]
  26. Zhang, Q.; Yuan, Q.; Li, J.; Yang, Z.; Ma, X. Learning a Dilated Residual Network for SAR Image Despeckling. Remote Sens. 2018, 10, 196. [Google Scholar] [CrossRef]
  27. Lattari, F.; Leon, B.G.; Asaro, F.; Rucci, A.; Prati, C.; Matteucci, M. Deep Learning for SAR Image Despeckling. Remote Sens. 2019, 11, 1532. [Google Scholar] [CrossRef]
  28. Ko, J.; Lee, S. SAR Image Despeckling Using Continuous Attention Module. IEEE J. Sel. Top. Appl. Earth Obs. Remote Sens. 2022, 15, 3–19. [Google Scholar] [CrossRef]
  29. Pongrac, B.; Gleich, D. Despeckling of SAR Images Using Residual Twin CNN and Multi-Resolution Attention Mechanism. Remote Sens. 2023, 15, 3698. [Google Scholar] [CrossRef]
  30. Chierchia, G.; Gheche, M.E.; Scarpa, G.; Verdoliva, L. Multitemporal SAR Image Despeckling Based on Block-Matching and Collaborative Filtering. IEEE Trans. Geosci. Remote Sens. 2017, 55, 5467–5480. [Google Scholar] [CrossRef]
  31. Lehtinen, J.; Munkberg, J.; Hasselgren, J.; Laine, S.; Karras, T.; Aittala, M.; Aila, T. Noise2Noise: Learning Image Restoration without Clean Data. arXiv 2018, arXiv:1803.04189. [Google Scholar]
  32. Lin, H.; Zhuang, Y.; Huang, Y.; Ding, X. Unpaired Speckle Extraction for SAR Despeckling. IEEE Trans. Geosci. Remote Sens. 2023, 60, 1–14. [Google Scholar] [CrossRef]
  33. Molini, A.B.; Valsesia, D.; Fracastoro, G.; Magli, E. Speckle2Void: Deep Self-Supervised SAR Despeckling With Blind-Spot Convolutional Neural Networks. IEEE Trans. Geosci. Remote Sens. 2022, 60, 1–17. [Google Scholar] [CrossRef]
  34. Laine, S.; Karras, T.; Lehtinen, J.; Aila, T. High-Quality Self-Supervised Deep Image Denoising. arXiv 2019, arXiv:1901.10277. [Google Scholar]
  35. Tan, S.; Zhang, X.; Wang, H.; Yu, L.; Du, Y.; Yin, J.; Wu, B. A CNN-Based Self-Supervised Synthetic Aperture Radar Image Denoising Approach. IEEE Trans. Geosci. Remote Sens. 2022, 60, 1–15. [Google Scholar] [CrossRef]
  36. Moore, R.K.; Williams, C.S. Radar Terrain Return at Near-Vertical Incidence. Proc. IRE 1957, 45, 228–238. [Google Scholar] [CrossRef]
  37. Dobson, M.C.; Ulaby, F.T.; Hallikainen, M.T.; El-rayes, M.A. Microwave Dielectric Behavior of Wet Soil-Part II: Dielectric Mixing Models. IEEE Trans. Geosci. Remote Sens. 1985, GE-23, 35–46. [Google Scholar] [CrossRef]
  38. Landy, J.C.; Tsamados, M.; Scharien, R.K. A Facet-Based Numerical Model for Simulating SAR Altimeter Echoes From Heterogeneous Sea Ice Surfaces. IEEE Trans. Geosci. Remote Sens. 2019, 57, 4164–4180. [Google Scholar] [CrossRef]
  39. Zhu, Z.; Zhang, H.; Xu, F. Raw signal simulation of synthetic aperture radar altimeter over complex terrain surfaces. Radio Sci. 2020, 55, 1–17. [Google Scholar] [CrossRef]
  40. Geng, X.; Wang, L.; Wang, X.; Qin, B.; Liu, T.; Tu, Z. Learning to Refine Source Representations for Neural Machine Translation. arXiv 2018, arXiv:1812.10230. [Google Scholar] [CrossRef]
  41. Tewari, A.; Zollhoefer, M.; Bernard, F.; Garrido, P.; Kim, H.; Perez, P.; Theobalt, C. High-Fidelity Monocular Face Reconstruction Based on an Unsupervised Model-Based Face Autoencoder. IEEE. Trans. Pattern Anal. Mach. Intell. 2020, 42, 357–370. [Google Scholar] [CrossRef] [PubMed]
  42. Etten, A.V.; Lindenbaum, D.; Bacastow, T.M. SpaceNet: A remote sensing dataset and challenge series. arXiv 2018, arXiv:1807.01232. [Google Scholar]
  43. de Rijk, P.; Schneider, L.; Cordts, M.; Gavrila, D.M. Structural Knowledge Distillation for Object Detection. arXiv 2022, arXiv:2211.13133. [Google Scholar]
  44. He, K.; Zhang, X.; Ren, S.; Sun, J. Deep residual learning for image recognition. In Proceedings of the 2016 IEEE Conference on Computer Vision and Pattern Recognition (CVPR), Las Vegas, NV, USA, 27–30 June 2016. [Google Scholar]
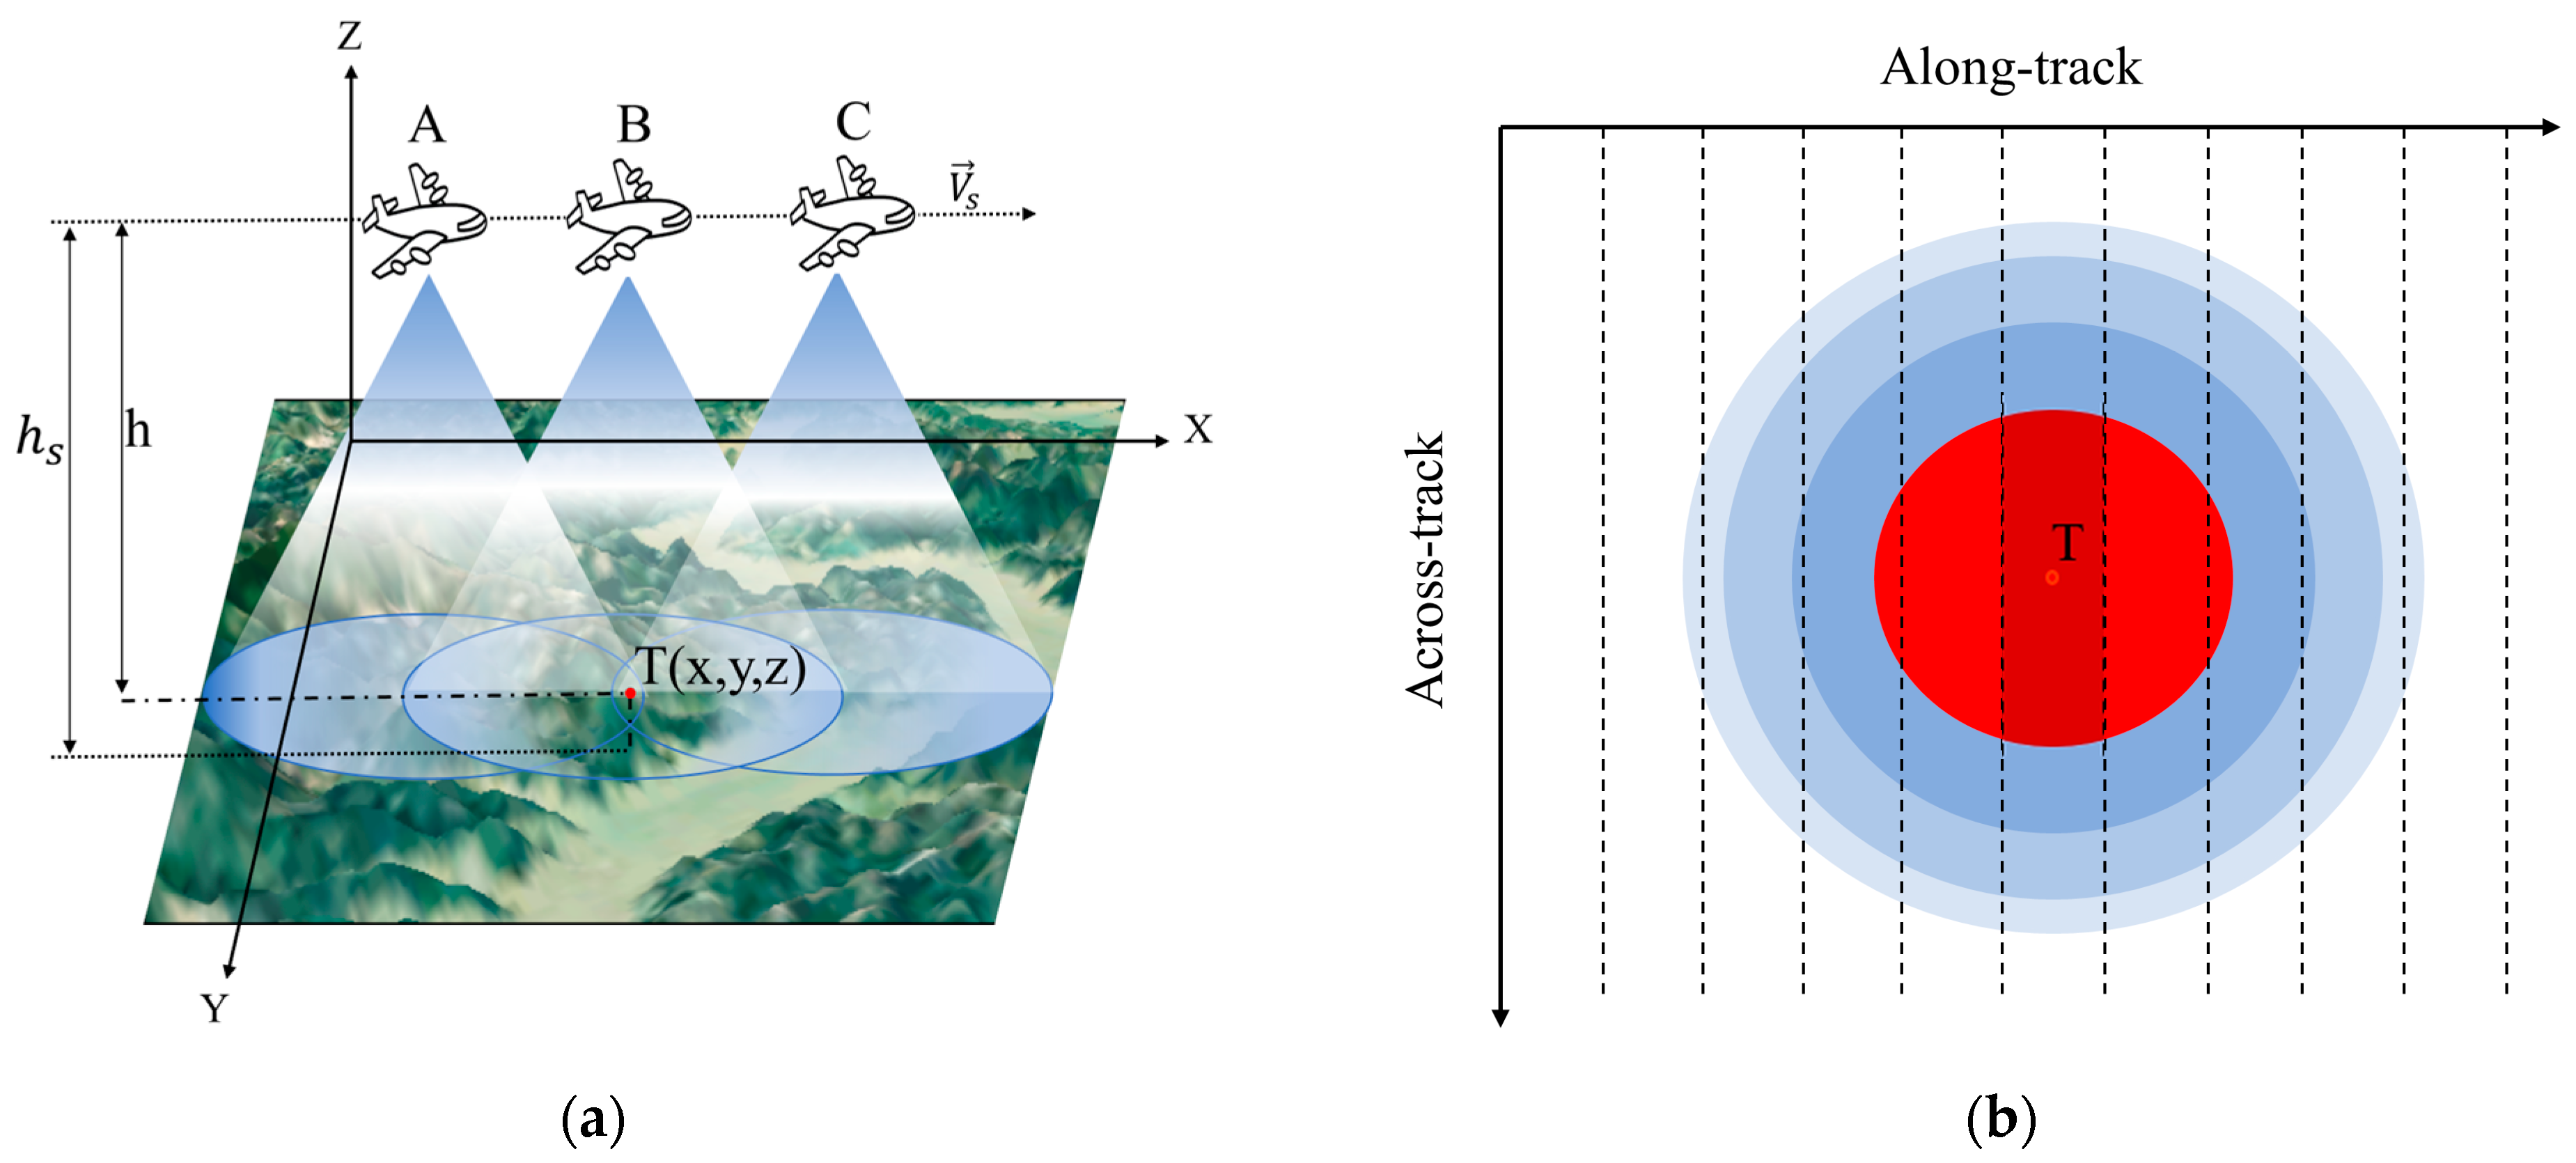
Figure 1. Schematic diagrams of the working principle of SARAL: (a) airborne SARAL geometry; (b) footprint of the pulse signals.
Remotesensing 15 05404 g001
Figure 2. Processing flowchart of the proposed algorithm.
Remotesensing 15 05404 g002
Figure 3. The framework of the proposed knowledge distillation.
Remotesensing 15 05404 g003
Figure 4. The route of airborne SARAL: (a) satellite image, (b) DEM.
Remotesensing 15 05404 g004
Figure 5. Typical landforms encountered along the track.
Remotesensing 15 05404 g005aRemotesensing 15 05404 g005b
Figure 6. Pairs of aligned DDMs: (a) flat terrain; (b) terrain with a small fluctuation.
Remotesensing 15 05404 g006
Figure 7. From (left) to (right): raw DDMs, labels, enhanced DDMs by teacher network, enhanced DDMs by student network.
Remotesensing 15 05404 g007
Figure 8. AGL estimates by estimation module of raw DDMs.
Remotesensing 15 05404 g008
Figure 9. AGL estimation results by proposed method.
Remotesensing 15 05404 g009
Figure 10. AGL estimation results by different altimetry methods.
Remotesensing 15 05404 g010
Table 1. Parameters of the airborne SARAL.
ParameterValueParameterValue
Altitude2.06 kmBandwidth20 MHz
Speed20 m/sPRT200 μs
BandXPulses of each burst125
Table 2. Results of the ablation experiments.
ComponentPSNR (dB)MAE (m)RMSE (m)Time (ms)
AGL-E-M (Raw data)12.735630.138325.77650.4883
Teacher + AGL-E-M24.35856.63389.221511.4566
KD + AGL-E-M
(Proposed method)
21.83686.916310.33786.0065
Table 3. Comparison of altimetry results of different methods.
MethodMAE (m)RMSE (m)Time (ms)
LS23.359129.369256,968.2
MAP-smooth12.581123.293237,782.0
MAP-mutant11.030621.811236,144.3
Proposed method6.916310.33786.0065
Disclaimer/Publisher’s Note: The statements, opinions and data contained in all publications are solely those of the individual author(s) and contributor(s) and not of MDPI and/or the editor(s). MDPI and/or the editor(s) disclaim responsibility for any injury to people or property resulting from any ideas, methods, instructions or products referred to in the content.