Abstract
As urban greenery improves and the ecological environment is continuously optimized, road facilities are also impacted to varying degrees. For example, as vegetation grows, it causes varying degrees of obstruction to the lighting facilities on the roads. This article is based on vehicle-mounted LiDAR data and focuses on the point cloud data characteristics of different objects. Using appropriate modeling techniques, it accurately models road surfaces, green belts, streetlights, and other objects. On the Lumion platform, this system creates a 3D visualization of road scenes and examines the interplay between objects and lighting space, analyzing lit areas. Leveraging the precise 3D spatial relationships found in point clouds, it determines the effective illumination area on the ground from streetlights after object obstruction, comparing it to the theoretical illumination area. This not only visualizes the road scene but also quantifies the lighting obstruction rate. Furthermore, it assesses the lighting conditions in road scenes based on illuminance distribution, offering scientific insights and suggestions for enhancing road lighting.
1. Introduction
Nighttime road illumination is closely related to people’s lives. Factors such as the layout of streetlights, light intensity, and road surface illuminance can all impact the safety of people’s nighttime travel. The International Commission on Illumination (CIE) has explicitly standardized safety issues in road lighting []. Overly bright lights can lead to light pollution, discomforting pedestrians and compromising travel safety. Conversely, inadequate lighting diminishes visibility, hinders effective environment assessment, instills psychological insecurity, and heightens the risk of traffic accidents [,,,]. Moreover, unsuitable lighting can adversely affect vegetation growth and wildlife habitats [,,,]. Hence, a balanced lighting analysis is crucial for energy conservation, environmental protection, road safety, and ensuring nighttime travel comfort.
Regarding road lighting analysis, researchers have conducted a substantial amount of research work:
- By conducting field measurements and surveying data related to streetlights and street trees, combined with streetlight parameters and brightness information, they analyze the impact of the distribution, size, and configuration of street trees on nighttime road lighting [,]. This method is the most direct and simple, but it relies mainly on subjective judgment, lacks quantification of actual obstruction conditions, is inefficient, and is subject to environmental limitations;
- Combining software simulation and modeling to reconstruct road lighting and comparing it with real road lighting data to assess and analyze road surface illumination [,,]. This method is based on certain assumptions and simplified conditions that cannot fully reflect various factors in the actual environment;
- Under special weather conditions (rain, snow, haze, etc.), different light intensities are set, and changes in the visibility of multiple drivers are collected to assess the impact of weather on road lighting []. This method effectively assesses the effect of weather on streetlights but does not effectively evaluate the surrounding environment;
- Under different lighting conditions, data on participants’ perceived safety during passing are collected. A spatial physical model is constructed based on streetlight parameters, with a focus on analyzing the comfort and safety of nighttime travel due to lighting []. Poor road lighting at night is due to the influence of surrounding objects (Figure 1). Additionally, accident rates are analyzed, and the degree of injury in two-lane intersection accidents is examined with regard to the impact of lighting [].
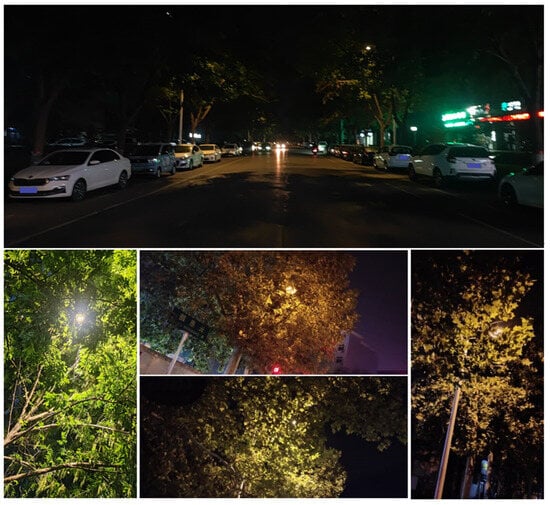
Figure 1.
Examples of illuminated road conditions and shading at night.
In summary, the following issues remain to be resolved: (1) The manual collection of data on the impact of physical objects on streetlights is inefficient and carries certain safety risks. (2) When analyzing streetlight illuminance, there is a lack of quantitative and qualitative analysis of obstructions. (3) There is no intuitive and effective assessment of the road environment.
The main reason for the above-mentioned issues is the difficulty in rapidly and effectively obtaining three-dimensional spatial information about various objects in road scenes and accurately determining the spatial relationships between streetlights and other objects. Vehicle-mounted Light Detection And Ranging (LiDAR) systems can rapidly acquire detailed three-dimensional point cloud data of various objects in road scenes during normal vehicle operation. Various objects can be accurately represented in the point cloud, and the spatial relationships between objects can also be accurately determined [,,]. This technology provides powerful technical support for solving the above-mentioned problems.
In the study of road scene models, the extraction of geometric information from objects and the use of Revit2023 software to construct road components are used to build road scenes [], but they may not comprehensively describe irregular objects like street trees. In terms of tree modeling, numerous scholars have conducted research. For example, tree models can be reconstructed based on the skeleton of individual trees, grading the skeleton based on morphological characteristics, or using the shortest path measure based on the natural growth characteristics of trees [,]. Fine modeling of street tree point clouds can be achieved using the Delaunay triangulation method [].
The focus of this study lies in the analysis of streetlight occlusion by objects. It relies on point cloud data for an accurate spatial representation, enabling three-dimensional visualization of road scenes to intuitively and effectively analyze the relationships between various objects. In conclusion, this article proposes an effective road scene streetlight illumination analysis method based on vehicle-mounted LiDAR point cloud data, achieving a refined simulation and analysis of road scene streetlight illumination.
2. Materials and Methods
This article uses Lumion12.0 software as a visualization tool to create a road scene by modeling the road surface, streetlights, street trees, and other elements. Based on the relevant parameters of streetlights and lighting, it achieves spatial three-dimensional visualization and lighting simulation. It determines the occlusion relationships between objects and streetlights, assesses the parameters of the streetlights, simulates road illumination distribution, quantifies streetlight occlusion data, and combines streetlight illumination with occlusion data to analyze and evaluate road occlusion conditions. The visualization process for analyzing streetlight illumination and occlusion is depicted in Figure 2.
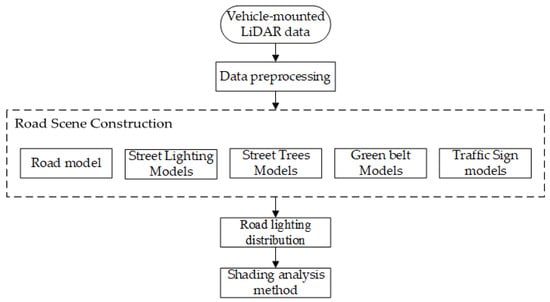
Figure 2.
The visualization process diagram for analyzing streetlight illumination and occlusion.
2.1. Vehicle-Mounted LiDAR Data
The experiment uses the SSW-3 type vehicle-mounted laser scanning system to acquire road point cloud data. This system highly integrates the laser scanner, laser gyroscope, high-precision GNSS receiver, panoramic camera, and odometer, boasting advantages such as high acquisition precision and fast speed. The test area is located on a section of Yuxi Road in Jiaozuo City, Henan Province, with a total length of 500 m, 23 streetlights, and several street trees. The trees on both sides of the road are tall and dense, with large crowns. Some of the trees severely obstruct the streetlights, significantly affecting their illumination, posing safety risks for pedestrians and vehicles traveling at night. The point cloud data of the experimental area roads are as shown in Figure 3.
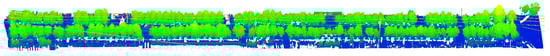
Figure 3.
Original point cloud in the test area.
2.2. Road Scene Modeling
In road scenes, there are numerous types and quantities of features, but the shading of street trees is the primary factor affecting streetlight illumination, especially when streetlights intersect with the branches and leaves of street trees, severely impacting the lighting effect. Some taller shrubs in the green belts can also affect the lighting to some extent, while other features such as traffic signs have a limited impact on streetlight illumination. In order to more accurately reflect the streetlight illumination conditions in road scenes, this study is based on vehicle-mounted LiDAR point clouds to finely model the road surface, streetlights, street trees, green belts, and traffic signs, thereby establishing a realistic road scene as the foundation for accurate streetlight illumination analysis.
2.2.1. Road Surface Modeling
The road surface is the most basic part of the road scene. The projection area and distribution of light on the road surface are the main indicators reflecting road illumination. Road models are constructed by extracting parameters such as road boundary lines and lane traffic markings []. However, due to various factors affecting the road, the parameters cannot fully represent it. This paper adopts the following approach: in terms of elevation, the road surface is at the lowest end of all objects. Based on the cloth simulation algorithm, the segmentation of road surface point clouds can be achieved []. The segmented road surface point cloud has a large and uneven density, far exceeding the needs for constructing a road model. This paper uses voxel down sampling to simplify the road surface point cloud [], maintaining a point cloud density of 0.1m. Due to the impact of factors such as pedestrians and vehicle obstructions, there are void areas on the road surface. Point-based mathematical morphology is used to repair the void areas of the road surface []. A TIN model is constructed for the repaired road surface, and the road model is colored through colored point clouds, resulting in a road surface model in the OBJ data format (Figure 4). This model is constructed based on geometry and real colors, without representing the actual physical material properties of the road.
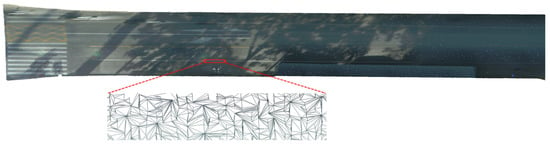
Figure 4.
Road model based on triangular network method.
2.2.2. Street Lighting Modeling
The authors’ research team has constructed an a priori sample set of street lighting; the streetlight models in the sample set include various parameters of streetlights (bottom center point of the streetlight, streetlight height, lamp head overhang length, lamp head structural line, etc.). Under the constraints of streetlight models and semantic rules, candidate streetlights are obtained from the rod-shaped object point clouds, and candidate samples are screened from the sample set. The matching algorithm based on the least squares theory is then used for matching and screening. A dual buffer zone constructed based on the streetlight skeleton line information is used to conduct discriminant analysis on the candidate streetlights, thereby realizing the extraction and type recognition of streetlights []. Since the streetlight specifications within a certain area are the same, the fine three-dimensional model library of streetlights in the format of skp is constructed using the SketchUp2020 software based on the various types of streetlight parameter models in the sample set. The streetlight model consistent with the area is selected from the model library. The model is optimized in terms of material and color according to the real streetlight images. The experimental area streetlight model is then constructed by combining the bottom center of the streetlight with point cloud data (Figure 5a,b).
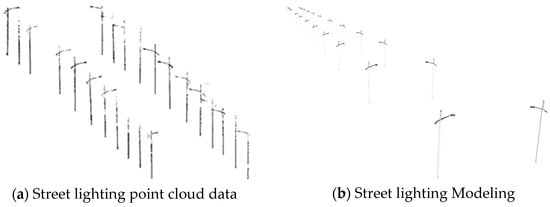
Figure 5.
Street lamp model construction.
2.2.3. Street Trees Modeling
A vehicle-mounted LiDAR system can obtain a relatively dense point cloud of street trees, and these point clouds accurately reflect the spatial position and shape of the tree branches and leaves. Although the density of points to some extent reflects the distribution of branches and leaves, each point is merely a concept of spatial three-dimensional coordinates and does not have a specific size. While it is possible to assign a certain granularity value to each point to reflect the space it represents, excessive repetition in occlusion analysis can significantly increase computational complexity. Therefore, to ensure the representation of each point’s spatial area, an appropriate point cloud simplification is applied. Ensuring the representation of each point’s spatial area, a triangular mesh model is constructed for street trees. Emphasizing the real contours and details of the trees, the Delaunay triangulation method is selected for street tree modeling []. The Delaunay triangulation method follows the criteria of the circumcircle being empty and maximizing the minimum internal angle [], avoiding the generation of elongated triangles. The resulting street tree model not only significantly reduces data volume but also has better versatility in the standard obj model format. Figure 6a shows the street tree point cloud and Figure 6b shows the corresponding Delaunay model, which contains a total of 56,000 points and 81,619 triangles.
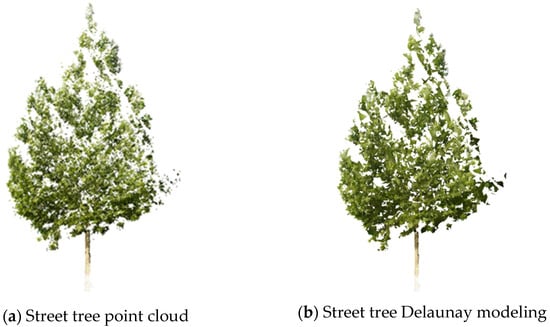
Figure 6.
Street tree model construction.
2.2.4. Green Belt Modeling
Greenbelts provide space for streetlights, traffic signs, vegetation, and play a significant role in the division of urban road space. During data collection, there may be partial data gaps in the point cloud of the greenbelt due to occlusion from parked vehicles on both sides of the road (Figure 7a). Before constructing the model, the greenbelt data are repaired and improved to match real road data. Since the main vegetation in the greenbelt consists of low shrubs, and neighboring areas exhibit similarity, nearby area data are used to fill in the missing regions in the data (Figure 7b). To improve efficiency, a radius filter is applied to the repaired point cloud to remove duplicate data while retaining the surface status. This results in a streamlined point cloud data that are used to construct a Delaunay triangulated surface model (Figure 7c).
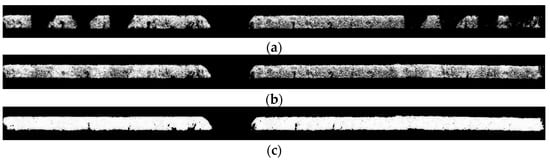
Figure 7.
Green belt surface model construction ((a) the original point cloud data; (b) the patched point cloud data; (c) Delaunay triangulated surface model).
2.2.5. Traffic Sign Modeling
Traffic signs have a certain height and area, which have a certain degree of impact on streetlight illumination. However, compared to street trees and streetlights, the impact of traffic signs on streetlight illumination is limited. In this article, the author uses an algorithm proposed by their team: constructing pole-like object samples to train an SVM classification model, and extracting traffic sign parameters (position, length, width, height, radius) []. Considering that some signs are severely missing, manual data collection is performed, and SketchUp software is used to construct traffic sign models. When necessary, image information obtained from vehicle-mounted cameras (Figure 8b) can be combined to create a colored and labeled basic model (Figure 8c). The model format is in *.skp.
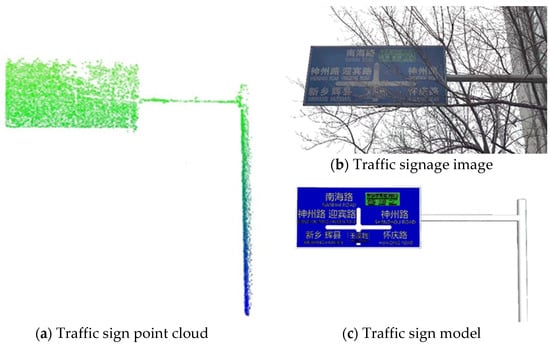
Figure 8.
Traffic sign modeling.
2.2.6. Scenario Building
This paper employed the Lumion platform to construct a three-dimensional visual scene for road lighting. The constructed models were imported into a database, and the road scene was built following the sequence of the road surface, streetlights, traffic signs, greenery zones, and street trees, as depicted in Figure 9. Since each model was constructed based on point cloud data that had undergone zero-normalization, this ensured the consistency of the spatial relationships between the models. By using the parameter information from the streetlight models, streetlight sources were added, allowing for the realistic representation of the road lighting scene, as shown in Figure 10.
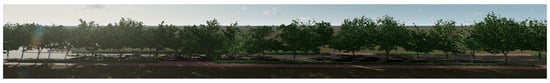
Figure 9.
Experiment with a scenario section model.
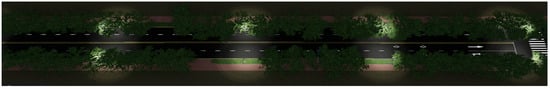
Figure 10.
Road night scene section model.
2.3. Street Lighting Distribution
To ensure nighttime safety for travel, the installation and design of urban road streetlights, including factors such as lamppost quality, streetlight types, lamppost height, average road surface illumination, glare, etc., should comply with CJJ45-2015 “Urban Road Lighting Design Standards” []. The relationship between luminaire distribution type, spacing, installation height, and arrangement method is shown in Table 1, with all units in meters.

Table 1.
The relationship between light distribution type, spacing, installation height, and arrangement mode of lamps.
Before analyzing the obstruction relationship between roadside trees and streetlights, it is essential to first determine the layout of the streetlights, the illuminated area, and the light distribution. This assessment, in conjunction with relevant regulations, is necessary to determine compliance. The author simulated individual streetlight illuminance values on the road surface without obstruction based on streetlight and road parameters using DIALux []. By considering parameters such as the spacing and layout of streetlights in the road, the overall maximum, minimum, and average illuminance approximate values on the road surface are calculated. These approximate illuminance values are then compared with the prescribed road lighting standards, serving as one of the criteria for evaluating road lighting. According to the quality standards for streetlights, when illuminating on one side, H = L, and when illuminating on both sides, H = L/2, where H is the installation height of the streetlight, and L is the width of the road surface to be illuminated. The elevation angle of the streetlight source is determined by the width of the road and the luminaire’s photometric curve (Figure 11a) and should place the center of the light source within 1/3 to 1/2 of the road width.
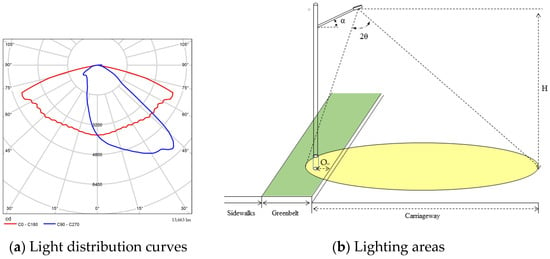
Figure 11.
Street lighting areas and light distribution curves.
And based on the lamp post height, streetlight spacing, and light source intensity, calculate the divergence angle of the streetlight beam. Due to differences in lampshades and lenses, streetlights have two types of effective illumination range: square and circular. The schematic diagram of the illuminated area takes the circular illumination area as an example (Figure 11b). Here, OH represents the distance from the bottom of the streetlight to the edge of the road, α represents the tilt angle of the streetlight, H is the height of the light source above the ground, and 2θ is the divergence angle of the streetlight beam. The yellow portion represents the illuminated area on the ground by the light source.
When simulating the distribution of road illuminance, the luminaire’s utilization factor and maintenance factor should be referenced from the “Urban Road Lighting Design Standards.” In this context, the distance from the luminaire head’s projection point to the roadside curb, denoted as “OH”, needs to be calculated as follows:
where: W is the width of the road; H is the height of the street lamp; l is the length of the street lamp overhang.
By calculating the approximate values of illuminance and comparing them with relevant regulations, the formula for the approximate calculation of road surface illuminance is as follows:
where Φ is the total luminous flux of the light source; U is the utilization factor of the luminaire; K is the maintenance coefficient; W is the width of the road; S is the distance between adjacent lamps on the same side; N is the alignment coefficient; N = 1 for unilateral or staggered alignment, and N = 2 for relative alignment.
2.4. Shading Analysis Method
Based on the road scene point cloud data and streetlight parameters, calculate the theoretical illuminated area of streetlights and the road surface shadow area formed by object occlusion. Figure 12 is the flowchart of occlusion calculation.
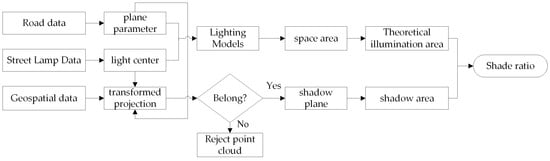
Figure 12.
Flowchart of occlusion calculation.
Due to various factors, the road is not entirely on the same plane. To ensure that the illuminated area of the streetlight matches the actual road, the road area is narrowed down. First, the road plane with a side length of L × L (where L should be less than half of the road width) is automatically selected based on the center of the streetlight.
Using the Random Sample Consensus algorithm (RANSAC) to fit the parameters of the plane in this region, initially, three random points are selected to construct a plane. The distances from all other points to this plane are calculated, and if a point’s distance is less than a threshold T, it is considered to be on the same plane. If there are more than n points on the same plane, the parameters of that plane are saved, and the points on that plane are marked as matched. After iterating N times and not finding three unmarked points, the equation for the road plane under this streetlight is determined:
where A, B, C, D are the model parameters of the road plane under the streetlight.
Constructing the streetlight parameter model based on the spotlight principle, project the road surface plane model below the streetlight with the streetlight as the center. Generate the theoretical light projection of the streetlight on the ground, define the projection spatial area, and fit the light edge to generate a point cloud set Q. Calculate the theoretical illuminated area ST of the streetlight in an unobstructed situation.
By applying the projection principle, project the point cloud of objects under the streetlight onto the plane of the road. First, calculate the vector between the center point of the streetlight, Plight, and any point Pi on the objects. The formula is as follows:
Solve the combined road surface parameter Equation (4) to calculate the transformation factor t for the projection of Pi onto the plane.
where , , are the vectors of the point P and the point Pi in the direction of x, y, and z, which are computed to obtain the projection point of Pi in the plane Pi.p:
Based on the plane region determined by the point cloud set Q, the projection points of the occlusions in the theoretical illumination area are indexed. Calculate the side length threshold T based on the point cloud granularity value and projection ratio. The spatial region-growing algorithm based on Delaunay (Figure 13) selects a sample triangle as the initial surface. It continuously expands the boundary of the triangulated mesh until no triangles are generated with an edge length below the threshold Tshadow. All points within the triangulated mesh are marked. Then, in the unmarked point cloud, the process is repeated until there are no triangles formed by three points in the projected points that meet the edge length threshold Tshadow. Finally, all the generated triangular mesh planes represent the shadowed area of streetlights obscured by roadside trees.
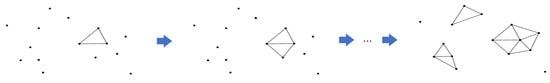
Figure 13.
Delaunay’s spatial region growth algorithm.
Based on the generated triangular mesh, establish topological connections between various points. Choose a triangle as the initial surface, calculate the area of the triangle, and mark it. Subsequently, perform a neighboring search for triangles that have not been marked, mark the next triangle, and cumulatively calculate the area. Repeat this process until all triangles are marked. The sum of these areas represents the shadowed area Sshadow of the streetlight due to obstructing objects on the ground (Figure 14).
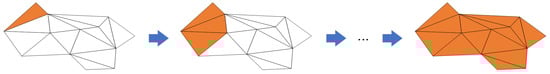
Figure 14.
The process of calculating the shaded area.
In the end, the author determines the occlusion rate of objects to the lighting by comparing the approximate value of the shadowed area of objects with the theoretical illuminated area. The calculations and comparisons are conducted to identify the primary factors contributing to occlusion under different object conditions.
3. Results
3.1. Streetlight Layout Parameters and Road Surface Illuminance
Through the analysis of point cloud data and calculations, the relevant parameters for the streetlights are as follows: the streetlight height is 10 m, the distance between adjacent streetlights on the same side is 40–50 m, and the streetlights are symmetrically arranged on both sides. In the experimental area of this study, the streetlight beam angle is 110°, and the zenith angle of the streetlights is 15°. The center point of the light source is calculated to be 5–6 m away from the road edge.
By using DIALux to simulate the illuminance distribution on the road surface, the distribution of illuminance without obstruction from objects on the road can be obtained. Taking two symmetrical street lamps as an example (Figure 15), the approximate values of road surface illuminance are as follows: the maximum illuminance is 18.92 lx, the minimum illuminance is 5.93 lx, and the average illuminance is 8.73 lx.
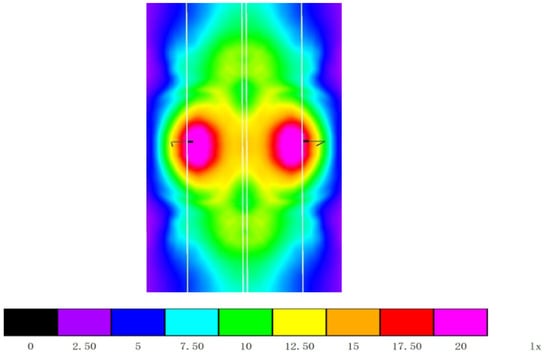
Figure 15.
Simulation of road illumination distribution.
3.2. Streetlight Obstruction Results
The author aims to analyze the occlusion relationship between street trees and streetlights in road scenes based on vehicle-mounted LiDAR technology. First, we assigned numbers to the streetlight point cloud data, as shown in Figure 16. We conducted simulations using relevant parameters, such as the height of streetlights, zenith angle, and beam angle, considering streetlights, street trees, ground point cloud data. We calculated the illuminated area on the ground in the absence of obstructions by streetlights and the shadow areas of various objects within the coverage of streetlight illumination. A single street lamp projected onto a plane appears as a circular light spot. Processing the data from all street lamps in the current experimental area produces a light spot map under each street lamp (Figure 17), visualizing how the illumination from street lamps is affected by the degree of obstruction from objects such as roadside trees, green belts, and traffic signs.
Figure 16.
Street lamp numbering diagram.
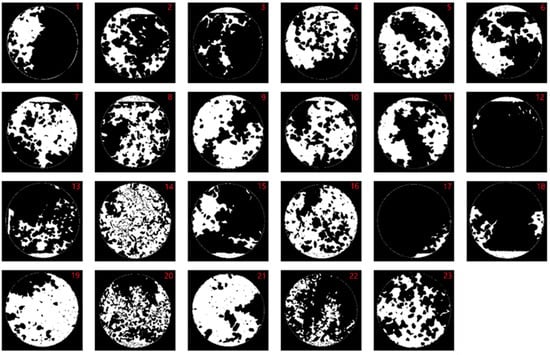
Figure 17.
Shaded map of feature shading (the red number in the upper right corner corresponds to the streetlight number).
This article utilizes the theoretical illumination area of streetlights and the shadow areas formed by various objects on the road obstructing the light. It calculates data such as the effective illuminated area on the road under the streetlight, and the degree to which the light is obstructed, and uses this obstruction rate to reflect how the light is affected by objects. Through the analysis of the constructed road scenes, it is concluded that street trees are the main influencing factor for obstructing streetlight illumination. To quantify the extent of obstruction caused by street trees, an analysis is conducted. Greenery zones, traffic signs, and similar point cloud data are excluded, and the shadow areas produced by street trees are calculated (Figure 18), along with the proportion of these shadow areas to the total shadow area. Relevant data on streetlight obstruction can be found in Table 2.
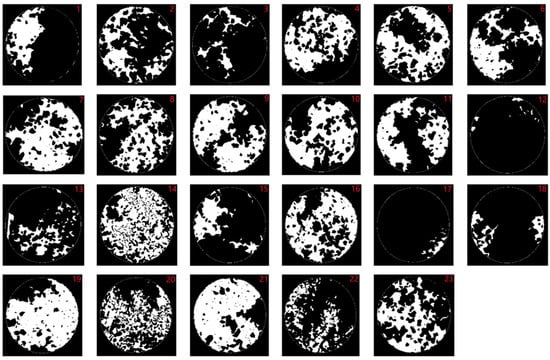
Figure 18.
Shading of street trees (the red number in the upper right corner corresponds to the streetlight number).
Table 2.
Parameters related to occlusion analysis.
4. Discussion
4.1. Analysis of Streetlight Installation and Road Surface Lighting Effective Area
The roads in the experimental area are considered minor roads with a width of 15 m. National road lighting design standards and industry regulations specify different streetlight beam angles ranging from 60° to 150°. According to the national road lighting standards, the zenith angle of the light source stipulates that the centerline of a single-side light source should fall within 1/3 to 1/2 of the road width. The placement parameters of streetlights in the experimental area are in compliance with national standards.
In this study, the average road surface illuminance under unobstructed conditions for the single-side streetlights in the experimental area is 8.73 lux. This result aligns with the requirements of “Urban Road Lighting Design Standard CJJ45-2015”, which specifies an average illuminance of 8–10 lux for minor urban roads. Please refer to Table 3 for streetlight placement and road surface illuminance assessment. The current road scene’s streetlight illumination complies with the regulations when there are no obstructions. If streetlights are not installed according to the predetermined plan or are placed incorrectly, it can lead to overall road illumination that does not comply with relevant standards. This failure may result in an uncomfortable and unsafe road environment for pedestrians and vehicles at night. Additionally, when streetlights are obstructed by roadside trees, green belts, and other objects, it can cause uneven road brightness, which does not meet road lighting requirements and may adversely affect traffic safety.
Table 3.
Evaluation of street lighting parameters.
4.2. Analysis of Street Lighting Obstruction
The algorithm is written in C++ and runs on a personal computer with an Intel(R) Core(TM) i5-12400 CPU at 2.5 GHz and 32.0 GB of RAM. When processing approximately 500 m of road data with 23 street lamps in the experimental area described in this paper, the total time for a single run is 51.28 min. The average duration for calculating relevant obstruction data for each street lamp is approximately 2.23 min. The algorithm includes some redundant data in the data processing phase. Better handling of this redundant data in later stages will significantly reduce data processing time.
Based on the analysis of the obstruction calculations and the distribution of illuminance under unobstructed conditions as mentioned above, Figure 19 shows that the obstruction rates for streetlights numbered 9, 14, 16, 19, and 21 exceed 60%. The obstruction severely affects the effective illumination area of these streetlights, leading to a dark and uneven road surface. This significantly impairs the lighting effectiveness of these streetlights and poses safety hazards for pedestrians and vehicles traveling at night.
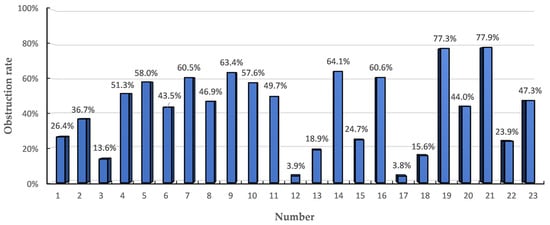
Figure 19.
The obstruction rate of streetlight illumination affected by surrounding objects.
In particular, the obstruction conditions for streetlights 19 and 21 are notably severe, reaching 77.3% and 77.9%, respectively. Upon closer examination, it is observed that these streetlights are tightly enveloped by street trees, preventing the light beams from reaching the ground. The environment around streetlight 19 is depicted in Figure 20. To prevent potential traffic accidents, timely repair and maintenance are required in such situations.
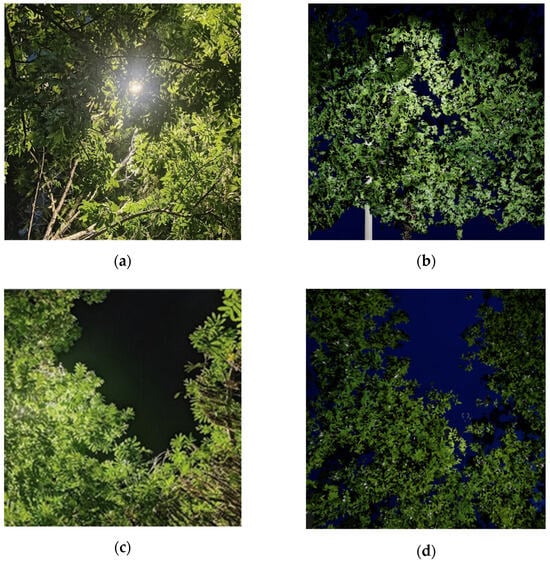
Figure 20.
Street lighting occlusion conditions ((a,b) site photos and scenario simulation photos for streetlight 19, and (c,d) site photos and scenario simulation photos for streetlight 21, respectively).
4.3. Analysis of the Primary Obstruction Factors
Through the analysis of streetlight obstruction data, street tree parameters, and shadow effect images, it is determined that the trees in the experimental area are primarily concentrated at a height of 12 m or above, with crown diameters of 10 m. Due to the 10 m height of the streetlights, the lush foliage and substantial leaf thickness of these trees at this height are the primary factors leading to uneven road surface illuminance, mainly due to streetlight obstruction. Combining the proportions of tree shadows under different streetlights, as shown in Figure 21, it is found that for 87.0% of the streetlights, the shadows cast by street trees account for more than 80% of the total shadow below those streetlights.
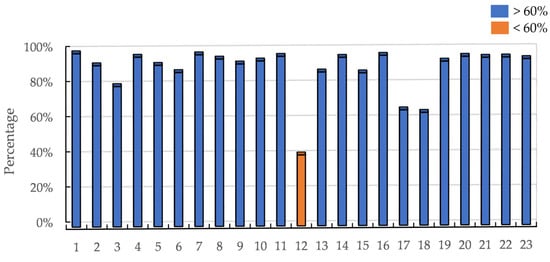
Figure 21.
Shading of street trees as a percentage of total shaded area.
Among the streetlights numbered 12, 17, and 18, only streetlight 12 has a tree shadow proportion below 60.0%. The reason for this is that the trees around streetlight 12 are positioned at a greater distance, resulting in only minor obstruction (Figure 22). The total shadow area influenced by surrounding objects is 2.535 square meters, with an obstruction rate of 3.9%, and the tree shadow covers 1.02 square meters. In conclusion, street trees are the primary obstruction factor for streetlight illumination in road scenes.
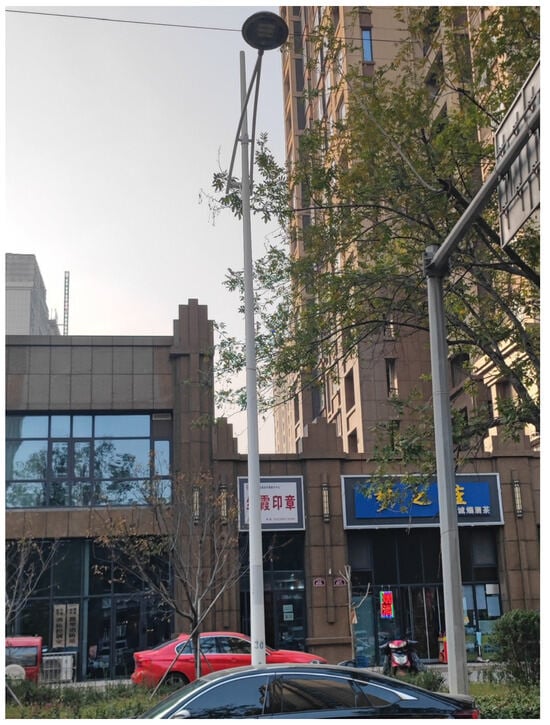
Figure 22.
Image of streetlight number 12 in the real environment.
4.4. Analysis of Road Shelter Conditions
Based on the data, the occlusion of streetlights is categorized into three levels:
- Mild occlusion with an occlusion rate of less than 20%;
- Moderate occlusion with an occlusion rate between 20% and less than 60%;
- Severe occlusion with an occlusion rate of 60% or more.
In this study, the average obstruction rate for streetlights in the research area due to objects is 42.1%. Among these obstructions, 48% fall into the category of moderate obstruction, while 28% are categorized as severe obstruction, as shown in Figure 23. Following on-site surveys and the collection of image data (Figure 24), it was observed that this section of the road experiences significant obstruction from street trees. This leads to an uneven distribution of road brightness, making the road overall relatively dark. The visibility is limited, and in some areas, nighttime blind spots are formed. This affects nighttime vehicles and pedestrians to varying degrees, and failing to address this issue promptly can result in significant safety hazards.
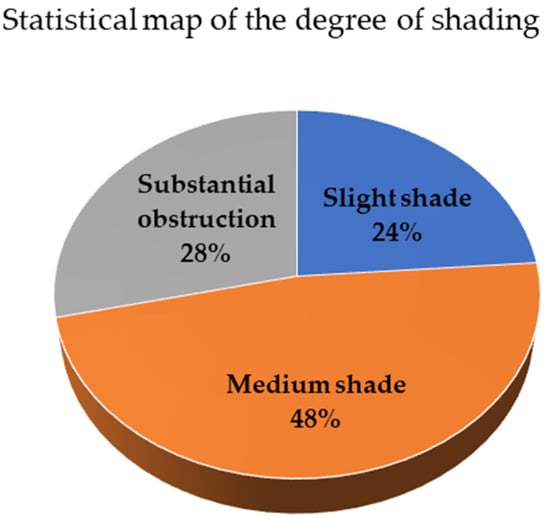
Figure 23.
Statistical map of the degree of shading.
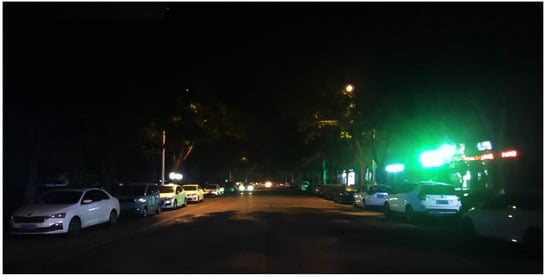
Figure 24.
Nighttime road conditions.
Based on the above experimental analysis results, the following suggestions are proposed for the management of street trees and streetlights:
- For occlusion rates of less than 20% and where street trees cause slight obstructions, the obstructing branches and leaves should be pruned;
- For streetlights with occlusion rates between 20% and 60% and which are moderately obstructed by street trees, the corresponding branches of the street trees should be pruned, with targeted regular monitoring and maintenance;
- For streetlights with an occlusion rate greater than 60% and which are severely obstructed, such as lights No. 9, 14, 16, 19, and 21, the position and lighting method of the streetlights should be promptly adjusted. Additional lighting fixtures should be added around these streetlights to ensure adequate road lighting conditions.
5. Conclusions
In discussion, based on the completed point cloud data classification, this study precisely modeled three-dimensional objects such as roads, streetlights, and street trees. Using the three-dimensional visualization software Lumion12.0 as the platform, the construction and virtual expression of the road scene were completed, and illumination was added to the streetlights in the scene. By simulating the distribution of illuminance on the road surface without obstructions and the irregular shadow area on the ground when there are obstructions, in relation to the effective illumination area of the streetlights, a quantitative analysis of the lighting conditions of the research area road was carried out. Scientific guiding suggestions were provided for the optimized regulation of the relationship between objects in the road scene and streetlights. In terms of the virtual reality expression of road scenes, using the constructed scene, an analysis of the obstruction of streetlights by street trees was achieved, which is of great significance for safe night driving. This provides scientific decision-making support for the scientific placement and operational status monitoring of objects in road scenes, urban morphology analysis, urban planning, and more.
The article has some limitations that require further research. Using a three-dimensional road scene as an example, this study analyzed a lush road scene during the summer. This paper primarily focuses on the spatial relationship between roadside trees and streetlights. In future research, illuminance will be considered as one of the criteria for further investigation. MLS (Mobile Laser Scanning) struggles to capture internal or deep point cloud information within trees, resulting in a lack of data for certain parts of the trees. The constructed scene models were not systematically evaluated, leading to subjective judgments in some models without a theoretical basis. Additionally, the physical properties of the models themselves were not considered. The experimental area featured deciduous trees, which are significantly affected by seasonal changes. In the summer, the branches and leaves are dense, while in the spring and winter, only branches remain. This seasonal variation greatly influences the data and models of roadside trees. When analyzing occlusion in road scenes, the focus was solely on the relationship between objects and streetlights, neglecting the influence of the surrounding environment on road illumination. In future research, exploring data fusion methods to enhance tree data and conducting further in-depth studies on the impact of ambient light on road surface brightness, the growth and seasonal variations of roadside trees, and the uniformity of light spots in light obstruction is recommended.
Author Contributions
Conceptualization, J.R.; Methodology, Y.L.; Software, J.R.; Validation, H.L.; Formal analysis, J.R.; Investigation, K.L. and D.H.; Resources, Y.L.; Data curation, Z.W.; Writing—original draft, J.R.; Writing—review & editing, Y.L.; Project administration, H.L. All authors have read and agreed to the published version of the manuscript.
Funding
This research was funded by the National Natural Science Foundation of China, grant number 41771491.
Data Availability Statement
The data that supports the findings of this study are available within the article.
Conflicts of Interest
The authors declare no conflict of interest.
References
- CIE. Guide on the Limitation of the Effects of Obtrusive Light from Outdoor Lighting Installations, 2nd ed.; CIE: Vienna, Austria, 2017; Volume 150. [Google Scholar] [CrossRef]
- Yan, Y.; Ye, Z.; Yu, K.; Li, N.; Zhang, B. Research on landscaplizalion of municipal road lighting facilities on road tralic salely. China Salely Sci. J. 2022, 32, 154–161. [Google Scholar]
- Markvica, K.; Richter, G.; Lenz, G. Impact of urban street lighting on road users’ perception of public space and mobility behavior. Build. Environ. 2019, 154, 32–43. [Google Scholar] [CrossRef]
- Liang, F.F. Study on the Influence Factors of Lighting Environment of Urban Roadway Lighting Based on Glare and Occlusion. Master’s Thesis, Chongqing University, Chongqing, China, 2018. [Google Scholar]
- He, Y.; Zhang, X.; Quan, L.; Mi, R.; Cui, Y.; Xu, J.; Tian, Z. Influence of coloured light projected from night-time excessive luminance outdoor LED display screens on vehicle driving safety along urban roads. Build. Environ. 2021, 188, 107488. [Google Scholar] [CrossRef]
- Chen, F.; Peng, S.L. Effects of light pollution on street trees at night in urban areas. Ecol. Environ. Sci. 2013, 22, 1193–1198. [Google Scholar]
- Péter, Á.; Seress, G.; Sándor, K.; Vincze, E.; Klucsik, K.P.; Liker, A. The effect of artificial light at night on the biomass of caterpillars feeding in urban tree canopies. Urban Ecosyst. 2020, 23, 1311–1319. [Google Scholar] [CrossRef]
- Yao, X.C.; Tu, H.Q.; Wang, X.L.; Wang, J. The effect of supplemental LED night lighting on the growth and physiology of the Para rubber tree. J. Rubber Res. 2021, 24, 321–326. [Google Scholar] [CrossRef]
- Czaja, M.; Anna, K. How light pollution can affect spring development of urban trees and shrubs. Urban For. Urban Green. 2022, 77, 127753. [Google Scholar] [CrossRef]
- Lu, Q.; Han, S.; Ding, Y.F.; Chi, Z.; Feng, Y.; Liu, S.; Liu, P. Research on the influence of street trees on the lighting effect of LED street lights. China Light Light. 2016, 2, 4–8. [Google Scholar]
- Wang, X.D.; Wu, Y.; Wu, W.Z.; Han, X.; Cui, S.X.; Lu, W.N. Survey on Light Environment of Urban Roads and the Impacts of Street Trees—A Case Study of Ping’an Avenue in Zhengzhou City; Chinese Society of Landscape Architecture, Ed.; Chinese Society of Landscape Architecture: Beijing, China, 2020; pp. 430–435. [Google Scholar]
- Mi, X.X.; Yang, B.S.; Dong, Z. Rapid computation and application of vehicle-mounted laser point cloud road scene visual field. J. Wuhan Univ. (Inf. Sci. Ed.) 2020, 45, 258–264. [Google Scholar]
- Leccese, F.; Lista, D.; Salvadori, G.; Beccali, M.; Bonomolo, M. Space syntax analysis applied to urban street lighting: Relations between spatial properties and lighting levels. Appl. Sci. 2019, 9, 3331. [Google Scholar] [CrossRef]
- Yao, Q.; Wang, H.; Uttley, J.; Zhuang, X. Illuminance reconstruction of road lighting in urban areas for efficient and healthy lighting performance evaluation. Appl. Sci. 2018, 8, 1646. [Google Scholar] [CrossRef]
- Hu, J.; Sun, S.; Wang, R. Research on the influence of light source characteristics on traffic visual distance in foggy areas at night. Build. Environ. 2022, 212, 108818. [Google Scholar] [CrossRef]
- Haans, A.; de Kort, Y.A.W. Light distribution in dynamic street lighting: Two experimental studies on its effects on perceived safety, prospect, concealment, and escape. J. Environ. Psychol. 2012, 31, 342–352. [Google Scholar] [CrossRef]
- Anarkooli, A.J.; Hosseinlou, M.H. Analysis of the injury severity of crashes by considering different lighting conditions on two-lane rural roads. J. Saf. Res. 2016, 56, 57–65. [Google Scholar] [CrossRef] [PubMed]
- Wang, Q.; Kim, M. Applications of 3D point cloud data in the construction industry: A fifteen-year review from 2004 to 2018. Adv. Eng. Inform. 2019, 39, 306–319. [Google Scholar] [CrossRef]
- Xu, Y.; Stilla, U. Toward building and civil infrastructure reconstruction from point clouds: A review on data and key techniques. IEEE J. Sel. Top. Appl. Earth Obs. Remote Sens. 2021, 14, 2857–2885. [Google Scholar] [CrossRef]
- Xu, Y.; Tong, X.; Stilla, U. Voxel-based representation of 3D point clouds: Methods, applications, and its potential use in the construction industry. Autom. Constr. 2021, 126, 103675. [Google Scholar] [CrossRef]
- Wang, Y.; Wang, W.; Liu, J.; Chen, T.; Wang, S.; Yu, B.; Qin, X. Framework for geometric information extraction and digital modeling from LiDAR data of road scenarios. Remote Sens. 2023, 15, 576. [Google Scholar] [CrossRef]
- Xu, J.; Shan, J.; Wang, G. Hierarchical modeling of street trees using mobile laser scanning. Remote Sens. 2020, 12, 2321. [Google Scholar] [CrossRef]
- Li, J.; Wu, H.; Xiao, Z.; Lu, H. 3D modeling of laser-scanned trees based on skeleton refined extraction. Int. J. Appl. Earth Obs. Geoinf. 2022, 112, 102943. [Google Scholar] [CrossRef]
- Li, Y.; Wang, P.; Sun, J.; Gan, X. Simulation of tree point cloud based on the ray-tracing algorithm and three-dimensional tree model. Biosyst. Eng. 2020, 200, 259–271. [Google Scholar] [CrossRef]
- Chen, D.; He, X. Fast automatic three-dimensional road model reconstruction based on mobile laser scanning system. Optik 2015, 126, 725–730. [Google Scholar] [CrossRef]
- Zhang, W.; Qi, J.; Wan, P.; Wang, H.; Xie, D.; Wang, X.; Yan, G. An easy-to-use airborne LiDAR data filtering method based on cloth simulation. Remote Sens. 2016, 8, 501. [Google Scholar] [CrossRef]
- Zhou, Y.; Tuzel, O. Voxelnet: End-to-end learning for point cloud based 3d object detection. In Proceedings of the IEEE Conference on Computer Vision and Pattern Recognition, Salt Lake City, UT, USA, 18–22 June 2018; pp. 4490–4499. [Google Scholar]
- Liu, Z.; van Oosterom, P.; Balado, J.; Swart, A.; Beers, B. Detection and reconstruction of static vehicle-related ground occlusions in point clouds from mobile laser scanning. Autom. Constr. 2022, 141, 104461. [Google Scholar] [CrossRef]
- Li, Y.; Dong, Y.; Zhang, X.; Li, P. Vehicle-mounted LiDAR point cloud street light extraction method. Acta Geod. Cartogr. Sin. 2018, 47, 247–259. [Google Scholar]
- Yang, Y.Z.; Lin, W.S. Tree branch segmentation and 3D reconstruction based on laser point cloud data. J. Northwest For. Univ. 2020, 35, 171–176. [Google Scholar]
- Whebell, R.M.; Moroney, T.J.; Turner, I.W.; Pethiyagoda, R.; McCue, S.W. Implicit reconstructions of thin leaf surfaces from large, noisy point clouds. Appl. Math. Model. 2021; prepublish. [Google Scholar]
- Li, Y.Q.; Li, P.P.; Dong, Y.H.; Fan, H.L. Automatic extraction and classification of pole-like features in vehicle-mounted LiDAR point cloud data. Acta Geod. Cartogr. Sin. 2020, 49, 724–735. [Google Scholar]
- CJJ 45-2015; Standard for Lighting Design of Urban Road. China Architecture & Building Press: Beijing, China, 2015.
- Guerry, E.; Gălățanu, C.D.; Canale, L.; Zissis, G. Optimizing the luminous environment using DiaLUX software at “Constantin and Elena” Elderly House—Study Case. Procedia Manuf. 2019, 32, 466–473. [Google Scholar] [CrossRef]
Disclaimer/Publisher’s Note: The statements, opinions and data contained in all publications are solely those of the individual author(s) and contributor(s) and not of MDPI and/or the editor(s). MDPI and/or the editor(s) disclaim responsibility for any injury to people or property resulting from any ideas, methods, instructions or products referred to in the content. |
© 2023 by the authors. Licensee MDPI, Basel, Switzerland. This article is an open access article distributed under the terms and conditions of the Creative Commons Attribution (CC BY) license (https://creativecommons.org/licenses/by/4.0/).