Article

Construction of an Ecological Security Pattern in Rapidly Urbanizing Areas Based on Ecosystem Sustainability, Stability, and Integrity

1
School of Geography and Environment, Jiangxi Normal University, Nanchang 330022, China
2
Key Laboratory of Poyang Lake Wetland and Watershed Research, Ministry of Education, Jiangxi Normal University, Nanchang 330022, China
*
Author to whom correspondence should be addressed.
Remote Sens. 2023, 15(24), 5728; https://doi.org/10.3390/rs15245728
Submission received: 18 October 2023 / Revised: 2 December 2023 / Accepted: 6 December 2023 / Published: 14 December 2023
(This article belongs to the Special Issue GeoAI and EO Big Data Driven Advances in Earth Environmental Science)

Abstract

:
The escalating pace of urbanization and human activities presents formidable challenges to landuse patterns and ecological environments. Achieving a harmonious coexistence between humans and nature of high quality has emerged as a global imperative. Constructing an ecological security pattern has become an essential approach to mitigating the adverse ecological impacts of urban sprawl, safeguarding human well-being, and promoting the healthy development of ecosystems. Focusing on ecosystem sustainability, stability, and integrity, this study constructed the ecological security pattern in rapidly urbanizing areas, emphasizing achieving a well-balanced integration of urban expansion and ecological preservation. Ecological sources were identified by an evaluation system of “ecosystem service function–ecological sensitivity–landscape connectivity”. Resistance surfaces were constructed by integrating natural and human factors. Ecological corridors and nodes were extracted by methods such as the minimum cumulative resistance and gravity models. Taking Nanchang City as an example, the results show that there were 15 ecological sources, primarily woodland, displaying a distinct “island” phenomenon. Additionally, there were 41 ecological corridors with a combined length of 2170.54 km, exhibiting a dense distribution in the southwest and a sparse distribution in the northeast. The city was found to encompass 122 ecological nodes, predominantly situated along the corridors near the ecological sources, indicating a strong spatial aggregation pattern. An optimized ecological security pattern of “one ring, two belts, three zones, and multiple nodes” was proposed for synergizing ecological protection, restoration, and rapid urbanizing.

1. Introduction

Since the 21st century, the ecological problems stemming from rapid urbanization and ongoing development processes have become a global challenge that requires collective efforts to resolve [1,2]. The unregulated development processes and unregulated human activities have also caused irreparable harm to the ecological environment [3]. These harms can directly or indirectly affect the patterns of landuse, the structure of “ecology–living–production”, and the systematic of the ecological environment, leading to a constant decline in ecosystem services’ functionality and disrupting social-development sustainability [4,5]. Under such unplanned development conditions, ecological issues frequently arise, including overexploiting natural resources, fragmentation of species habitats, and lack of integrity in ecosystems [6,7]. Therefore, enhancing ecological security becomes a crucial issue in the face of this indiscriminate urbanization process worldwide [8,9,10]. Restoring ecological balance, maintaining high-quality ecosystem services, optimizing ecosystem management, and striking a delicate balance between conservation and development have become hot topics of discussion within the government and academic communities [11,12].
As the safe operation of the ecosystem is an essential part of national security and sustainable development for all people, how to scientifically and efficiently balance the ecological security system’s structural stability and cities’ sustainable growth has become a research hotspot [13,14]. Therefore, the study of the ecological security pattern (ESP), which connects the integrity and stability of ecosystems, has gradually gained attention. Constructing an ESP has emerged as a significant and practical measure to effectively address regional ecological security issues and mitigate conflicts between ecological preservation and economic progress [15,16]. With the integration of multidisciplinary cross-platform learning and emerging technologies, the research direction has evolved from initial quantitative analysis, including ecological pattern and landscape planning, to introducing emerging ecological theories and models, such as spatiotemporal pattern scenario simulation, decision making, and trend analysis. Research methods have also evolved from initially relying on a single landuse indicator to incorporating diverse scenario simulation and decision analysis methods, such as landscape pattern indices, minimum cumulative resistance (MCR) model, circuit theory landscape model, and the Future Landuse Simulation [17,18,19]. These advancements have improved the reliability of construction methods and territorial spatial decision making, contributing to the development of ecological security [20]. Huang et al. (2007) employed geographic information system technology in conjunction with the spatial structure and positional relationships of landscape types to develop an ESP specific to Xinjiang’s distinctive modern oasis landscapes [21]. Wei et al. (2020) integrated the MCR model and morphological spatial pattern analysis method to establish an ESP within the highly urbanized Loess Plateau region [22]. Peng et al. (2018) based on ecosystem services and circuit theory to identify ecological corridors and nodes, constructing the municipal-scale ESP [23]. Yu et al. (2022) employed the ordered weighted averaging (OWA) method based on multi-criteria decision making to create the spatial pattern of ecosystem services under different scenarios, thereby constructing the provincial-scale ESP for Anhui Province [24]. Liu et al. (2023) comprehensively considered ecosystem service functions, an ecological sensitivity evaluation system, and the OWA algorithm to develop the ESP for the Shenzhen metropolitan area [15]. Cui et al. (2022) comprehensively integrated the perspective of social equity needs, utilizing ecological sensitivity evaluation, the MCR model, and buffer analysis to construct and optimize the municipal-scale ESP for Wuhan City [25]. Jin et al. (2022) proposed a method that integrates the CVOR-GWLR-Circuit model and incorporates local correction variables derived from natural background data into the evaluation model of ESP, thus establishing the provincial-scale ESP for Yunnan Province [26]. In summary, ESP has evolved from simple species protection to multidimensional protection encompassing ecology, environment, and human activities [27,28]. This paradigm shift provides a more detailed, comprehensive, scientific, and systematic understanding of ecosystem functioning and sustainable development [29]. The research scope encompasses regional characteristics, enabling the construction of ESP at various scales. Furthermore, the scientifically established ESP offers a vital reference for regional integration, systematic ecological restoration, policy formulation, engineering layout, and sustainable human development [30,31,32].
The spatial configuration of an ESP is designed to protect and preserve ecosystem health by considering the structure, functions, and relationships of ecosystems [33]. ESP represents ecological health, dynamic changes, and interactions with human activities [34]. The fundamental framework of ESP consists of ecological sources (Ecosources), ecological corridors (Ecocorridors), and ecological nodes (Econodes), having gradually become one of the mainstream research methods in this field [22]. As crucial hubs of energy supply within a region, Ecosources hold a central position in ESP and are of paramount importance in establishing ecological security. There are some limitations in the extraction of Ecosources in constructing ESP. Current domestic and international studies focus on single indicators when selecting Ecosources, resulting in an incomplete understanding of their long-term development and insufficient stability of the identified Ecosources. Moreover, the emphasis on the ecological characteristics of patches themselves has led to insufficient attention to the overall functional structure of patches and their impact on the landscape [35]. As transporters in the ESP, Ecocorridors play a crucial role in transmitting energy and facilitating information flow. They are critical ecological passageways that ensure the connectivity of ecological processes and the integrity of ecological functions [11]. Various methods exist for extracting Ecocorridors, among which circuit theory and the MCR model are commonly used [36]. The MCR model is preferred over other models because of its simplicity, computational efficiency, excellent visualization capabilities, and ability to effectively analyze movement characteristics at the spatial scale as well as landscape patterns at the patch level [37]. Nevertheless, the limitation of the MCR model is that it outputs an excess of Ecocorridors that is directly proportional to the square of the Ecosources, resulting in an excessive amount. Therefore, it is necessary to further evaluate and refine the extracted Ecocorridors by incorporating landscape connectivity and other indicators, providing a basis for the subsequent construction of the ESP [38]. In summary, the scientific construction of an ESP is essential to maintaining ecological service functions and guaranteeing the bottom line of ecological security [20,22,39]. ESP also significantly contributes to optimizing the country’s spatial development, protection pattern, and regulation of urbanized regions’ uncontrolled expansion. Moreover, it provides reference and decision support for ecological restoration planning of the national territory and delineation of ecological protection redlines [40,41]. Therefore, the scientific and comprehensive identification of Ecosources, quantitative measurement of Ecocorridors, and the rational construction of regional ESP play a significant theoretical and practical role in regional sustainable development [41,42,43].
Nanchang, serving as the provincial capital and the most economically developed region in Jiangxi Province, is a role model for developing and integrating the ecological economy, leading the way for other regions to follow. Nanchang is confronted with a worldwide imperative to achieve a harmonious equilibrium between economic advancement and environmental preservation, necessitating the effective management of the inherent paradox between these two objectives [34]. Nanchang’s rapid urban expansion has led to detrimental impacts on regional landuse patterns and ecological sustainability [44,45]. Specifically, the central urban area has experienced rapid expansion, disrupting ecological connections between the eastern and western ends, as well as posing a significant threat to the ESP. Concurrently, the compromised ecological environment has posed formidable challenges to urban development trends. Therefore, it becomes imperative for Nanchang to consider holistic human development, encompassing the ecological environment’s sustainability and preserving biodiversity alongside rapid economic growth. As China enters the “14th Five-Year Plan” period, it faces a critical juncture of expediting economic transformation and advancing the construction of ecological civilization [46]. In this context, Nanchang urgently needs to optimize the new framework for land-space development and preservation, thereby strengthening the capacity for regional sustainable development and serving as a model for development in the new era.
In view of the background described above, this study focused on constructing ESP in rapidly urbanizing areas based on ecosystem sustainability, stability, and integrity, taking Nanchang as the case. Firstly, the landuse dynamics in Nanchang from 1990 to 2020 were analyzed. Secondly, an evaluation system comprising “ecosystem service function-ecological sensitivity-landscape connectivity” (EEL) was established to identify Ecosources. Subsequently, ecological resistance was constructed using natural factors and then adjusted using nighttime light data to indicate human activities. The Ecocorridors were extracted and categorized using the MCR and gravity model. Furthermore, the Econodes were identified using circuit theory. Building upon the “Ecosource–Ecocorridor–Econode” framework, the ESP of Nanchang was constructed, and an optimized pattern was proposed based on the ESP. This provides a favorable basis for the urban development and ecological construction of Nanchang. This study aimed to offer significant insights and suggestions on the development of urban ESP.

2. Materials and Methods
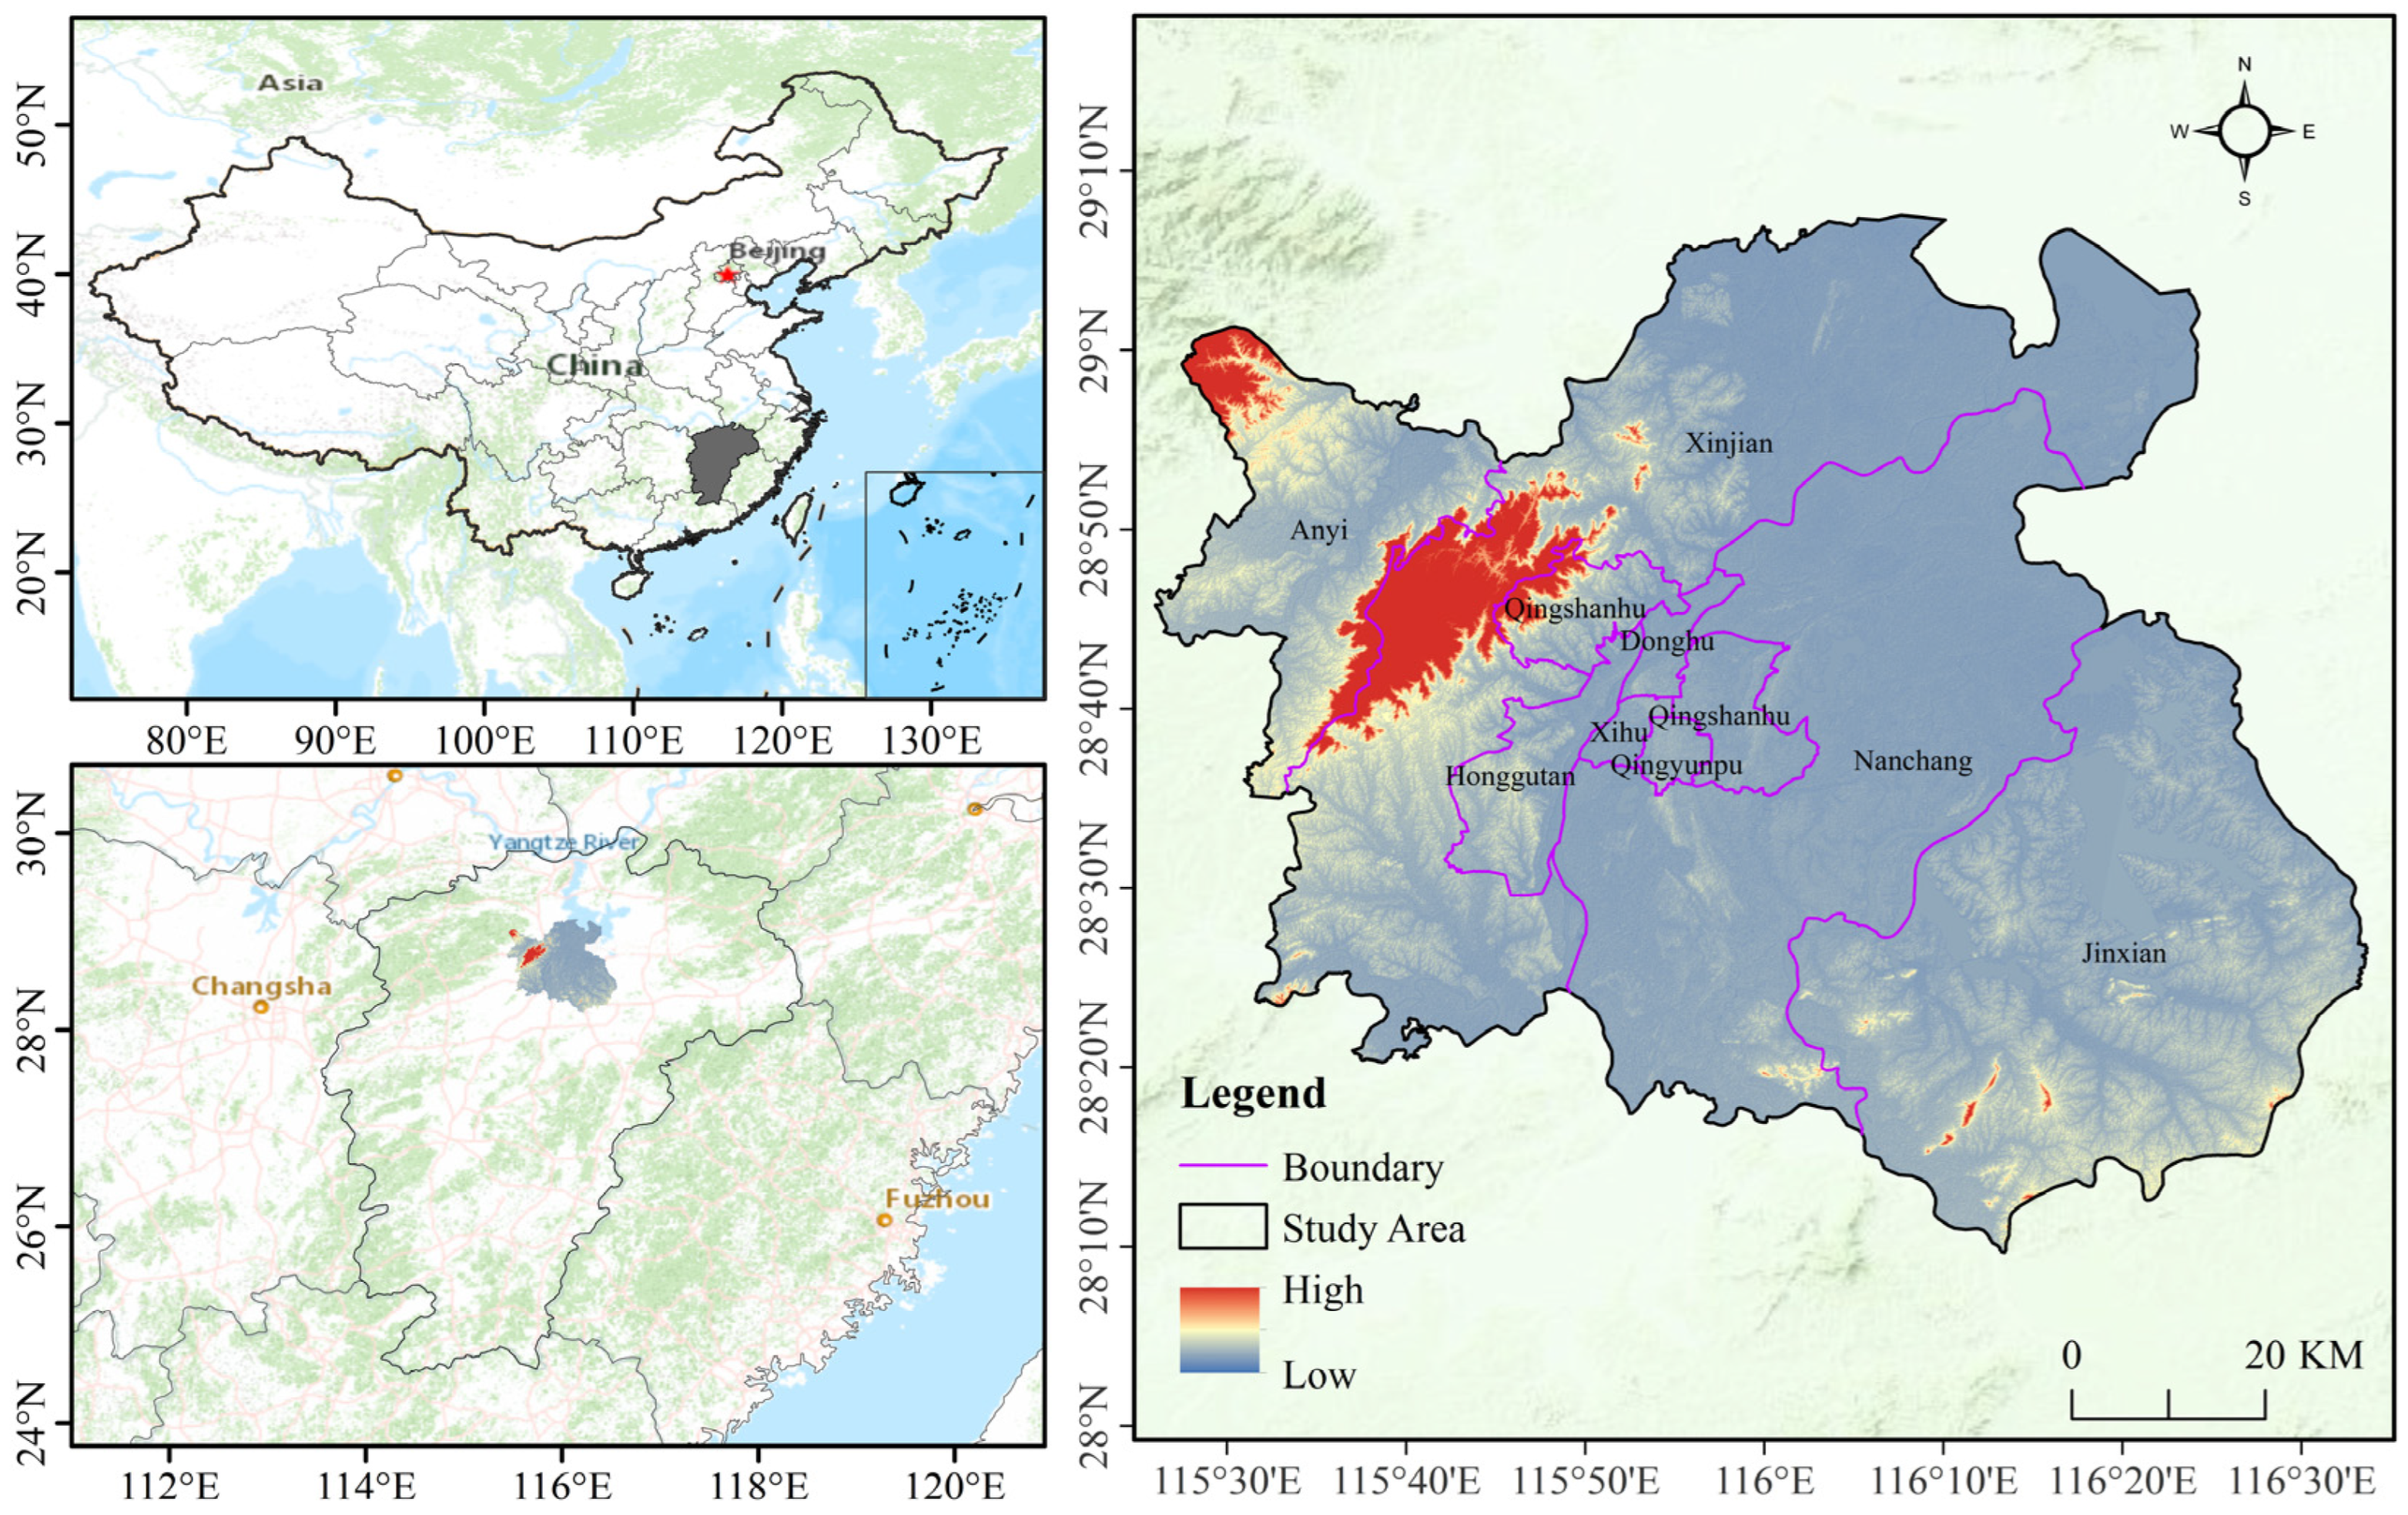
2.1. Study Area

As the provincial capital, Nanchang is the most economically developed region in Jiangxi Province. It is situated on the lower reaches of the Gan River and Fu River and the southwest shore of Poyang Lake (Figure 1). It falls within a subtropical monsoon climate zone. Nanchang has diverse topographical characteristics, characterized by elevated terrain in the northern region and comparatively lower terrain in the southern region. Nanchang holds significant importance as an economic hub in central China, serving as a distinguished historical and cultural center. Presently, Nanchang encompasses six districts and two counties, with a population exceeding 8 million. As the reform and opening-up process continues to progress, Nanchang has been experiencing significant advancements in its economy, society, culture, and other aspects. The urbanization process has also progressed swiftly, making Nanchang an important regional center. Nevertheless, the accompanying ecological and environmental challenges cannot be ignored. Urban pollution and ecological degradation have become significant barriers to Nanchang’s sustainable development [47,48]. Therefore, Nanchang must strengthen environmental protection, scientifically plan and manage ecological resources, and achieve sustainable urban development during urbanization.

2.2. Data Sources

All the data used and their sources are presented in Table 1, including natural factors data and socio-economic factors data. The DEM data describe the terrain conditions and were obtained from the Geographic Spatial Data Cloud (https://www.gscloud.cn, accessed on 23 April 2023. High-precision landuse data, sourced from CLCD (https://www.globallandcover.com, accessed on 23 April 2023), were employed for long-term analysis of landscape patterns. We classified the landuse types into six distinct landscape categories, including farmland, grassland, woodland, construction land, barren, and water. The basic road geographic information in 2020 was obtained from OpenStreetMap (https://openstreetmap.org, accessed on 23 April 2023). The nighttime light data for 2020 originated from NOAA (https://www.ngdc.noaa.gov, accessed on 23 April 2023). The comprehensive soil information, including thickness and structure, was obtained from the Web (http://www.cnern.org.cn, accessed on 23 April 2023). The fractional vegetation cover (FVC) was calculated using the pixel dichotomy model and the Normalized Difference Vegetation Index based on Landsat satellite data. Finally, we resampled all the data to 30 m to achieve spatial scale consistency and ensure data availability.

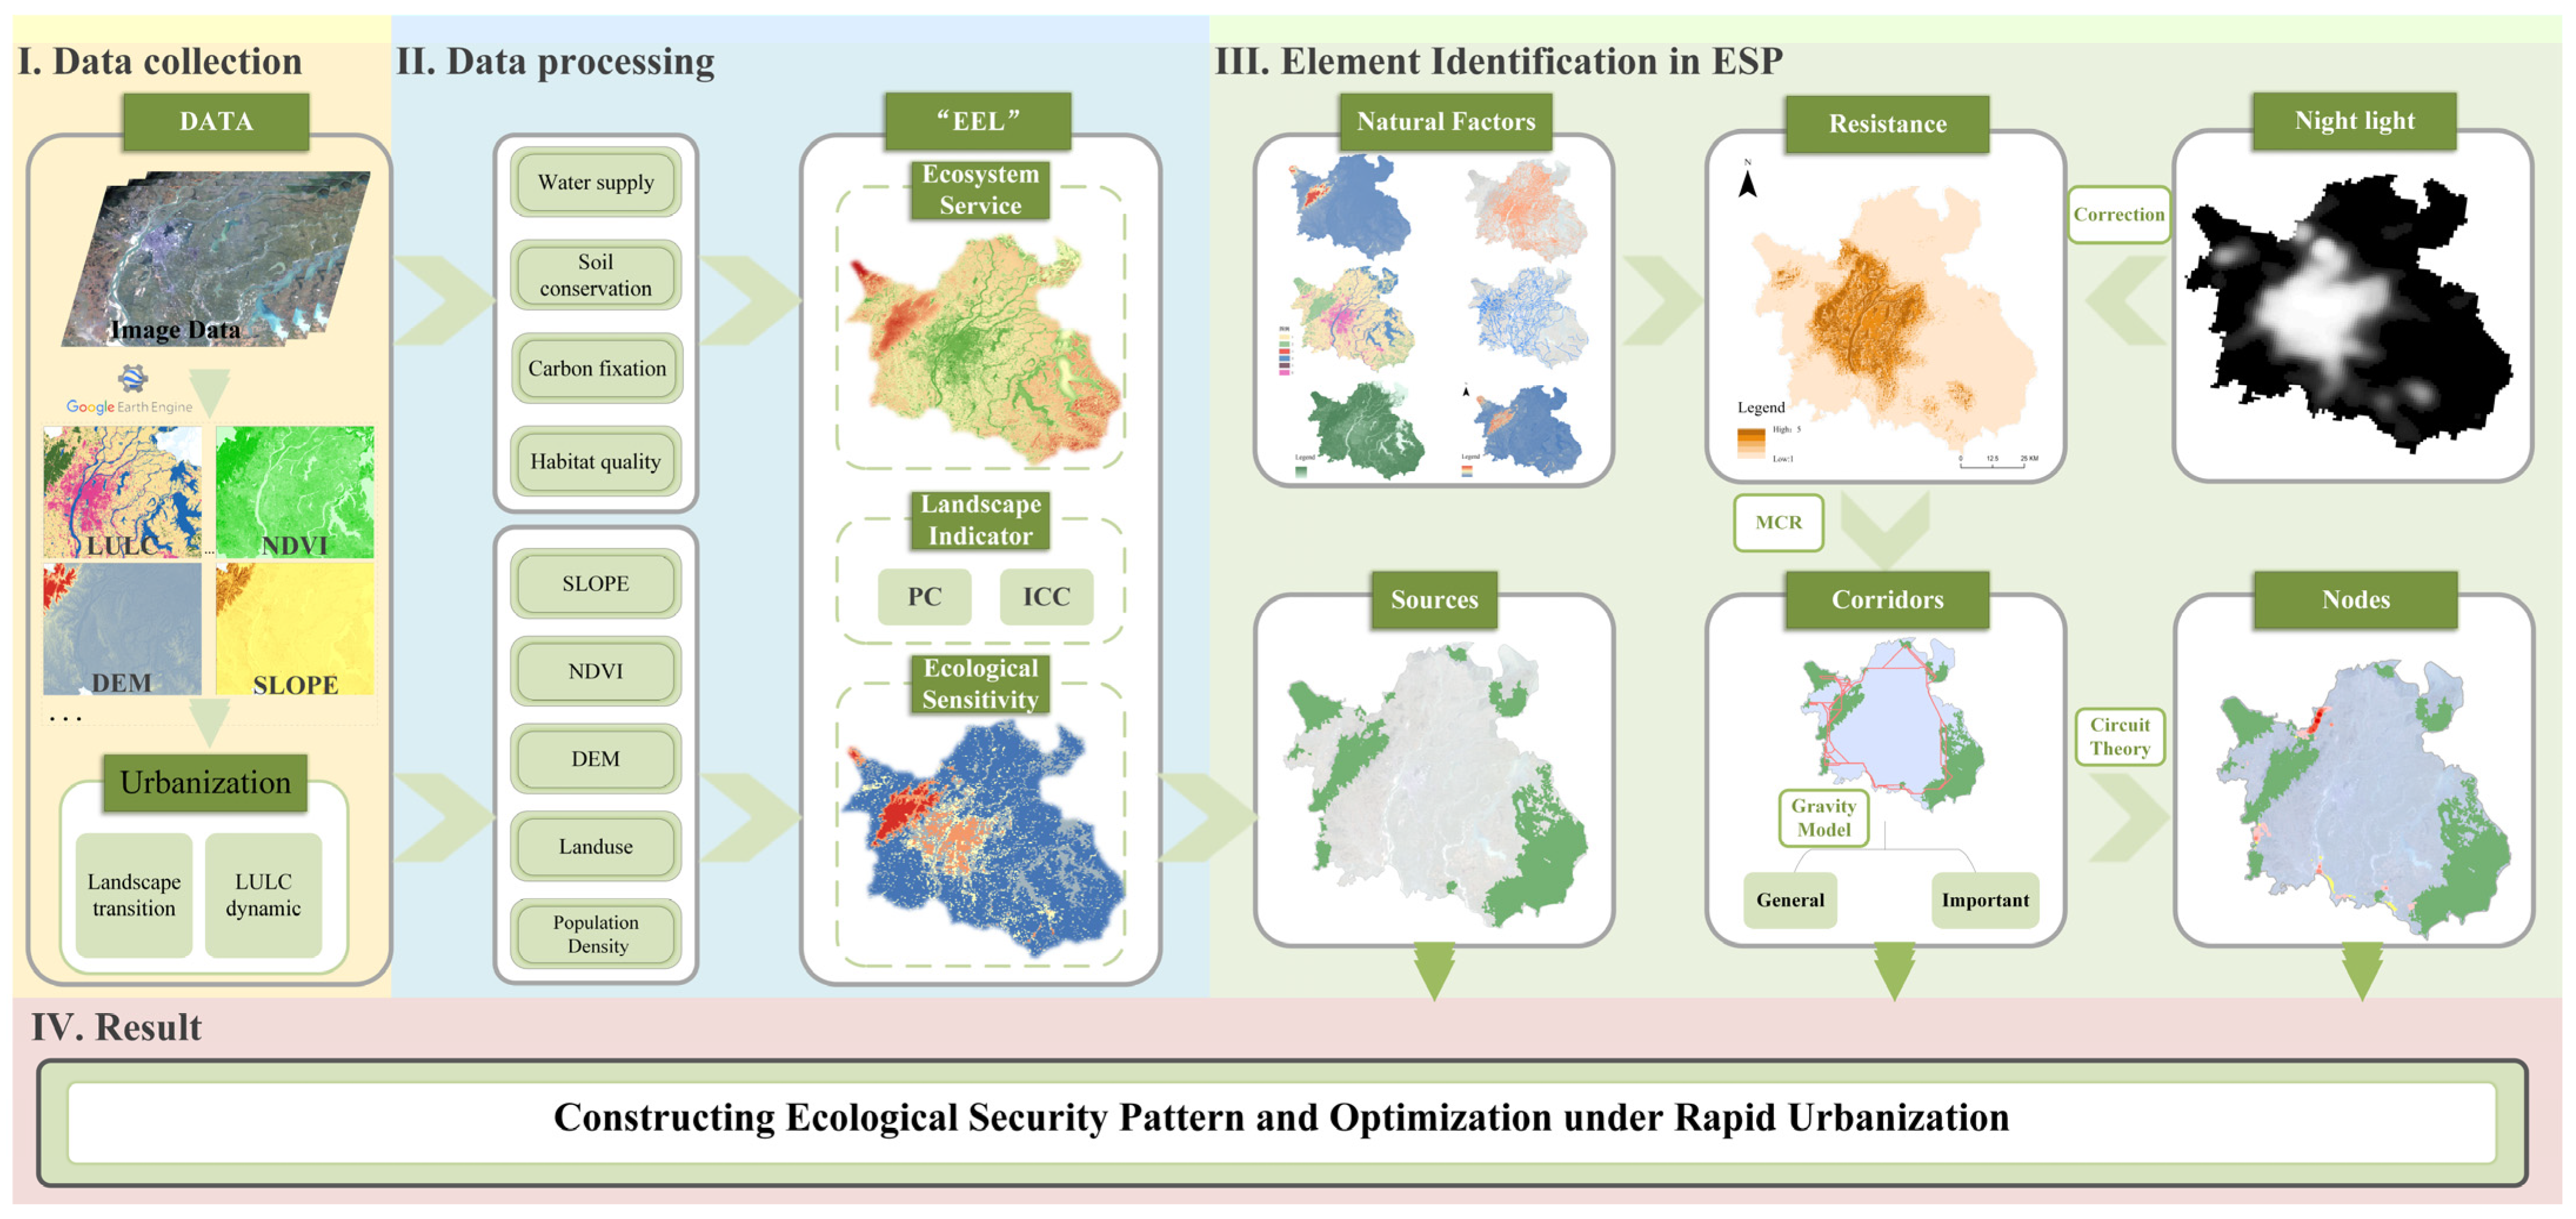
3. Research Framework and Methods

3.1. Research Framework

The study’s comprehensive procedure is depicted in Figure 2. Firstly, the landuse dynamics in Nanchang from 1990 to 2020 were analyzed in ArcMap 10.8.1 software. Secondly, we conducted a quantitative analysis of the ecosystem service function (ESF) of Nanchang City, including water supply, soil conservation, carbon fixation, and habitat quality, using different modules of the InVEST 3.14.0 software, considering natural factors and ecological conditions. Subsequently, the ArcMap software was utilized for overlay analysis to determine the ecological sensitivity of the study area. Based on these factors, we constructed an evaluation system of “EEL” to identify Ecosources. The objective was to recognize important regions from multiple perspectives, including ecosystem sustainability, stability, and integrity. Additionally, a natural resistance was constructed by integrating six available natural factors in ArcMap software, incorporating human activities using nighttime light data. On this basis and in ArcMap software, Ecocorridors were extracted via the MCR model and selected and prioritized using the gravity model, and Econodes were identified using circuit theory. Ultimately, the ESP of Nanchang was established to propose a comprehensive set of measures encompassing ecological protection, restoration, and spatial optimization.

3.2. Methods

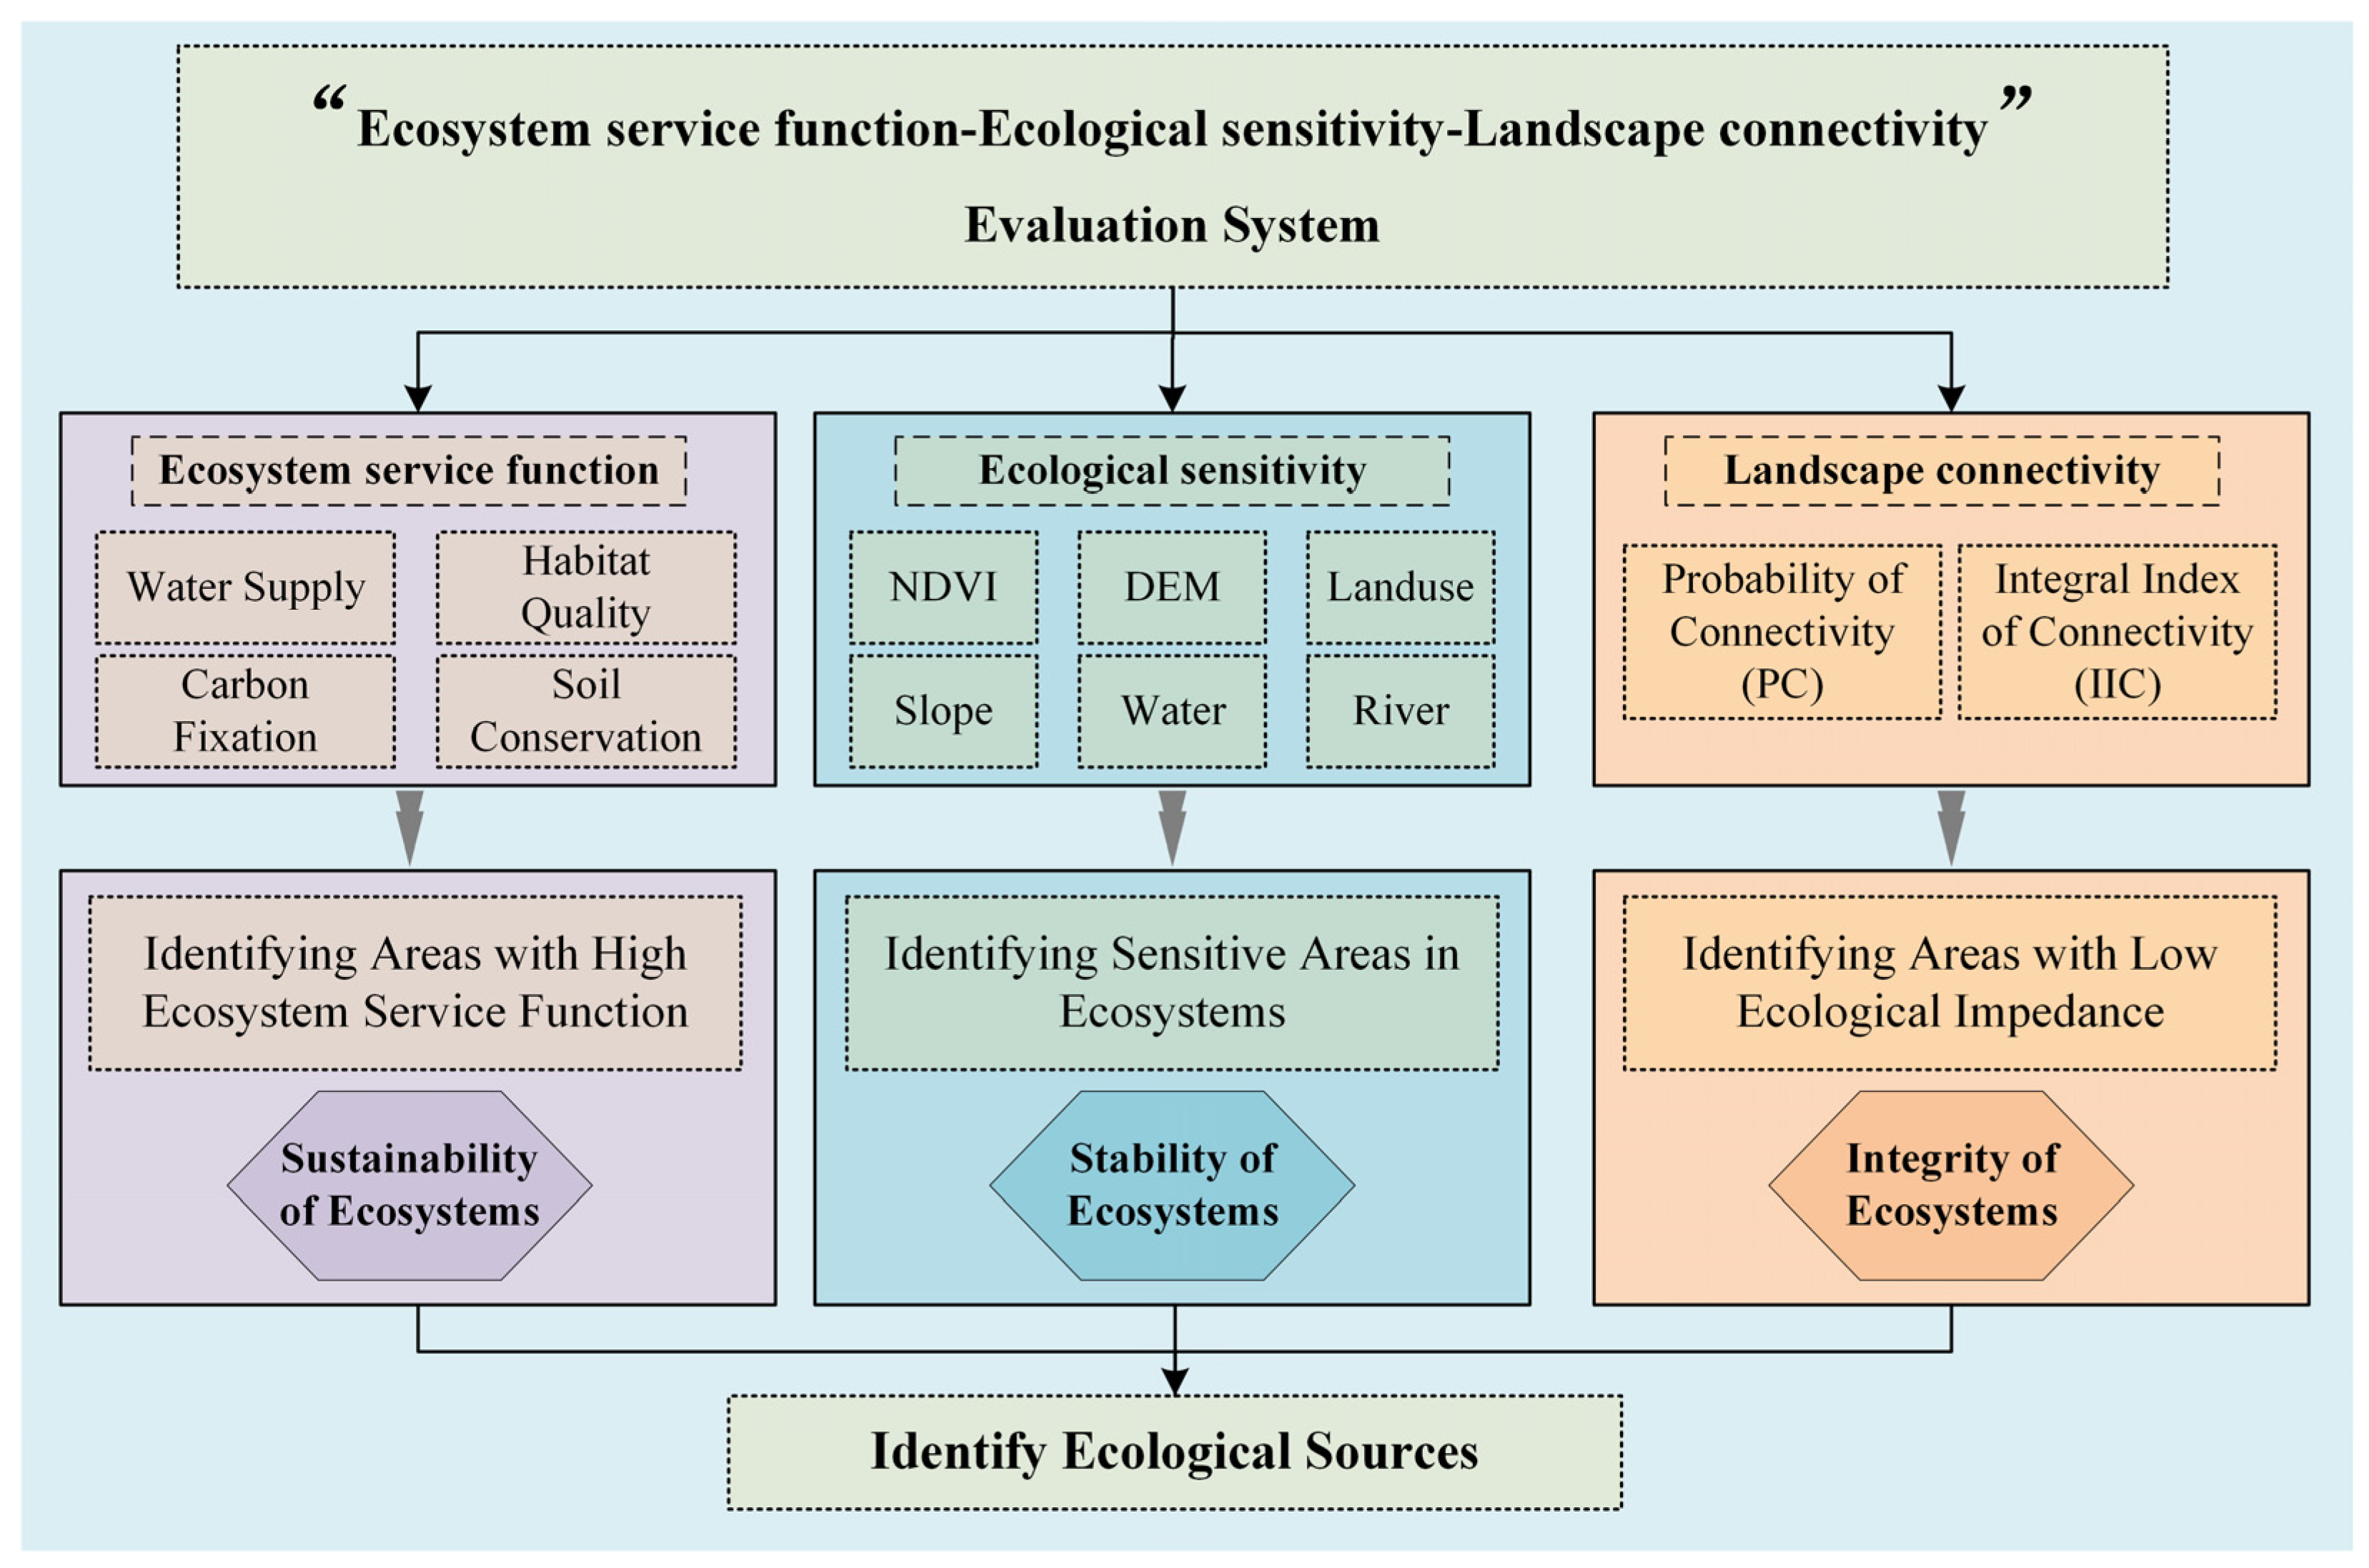
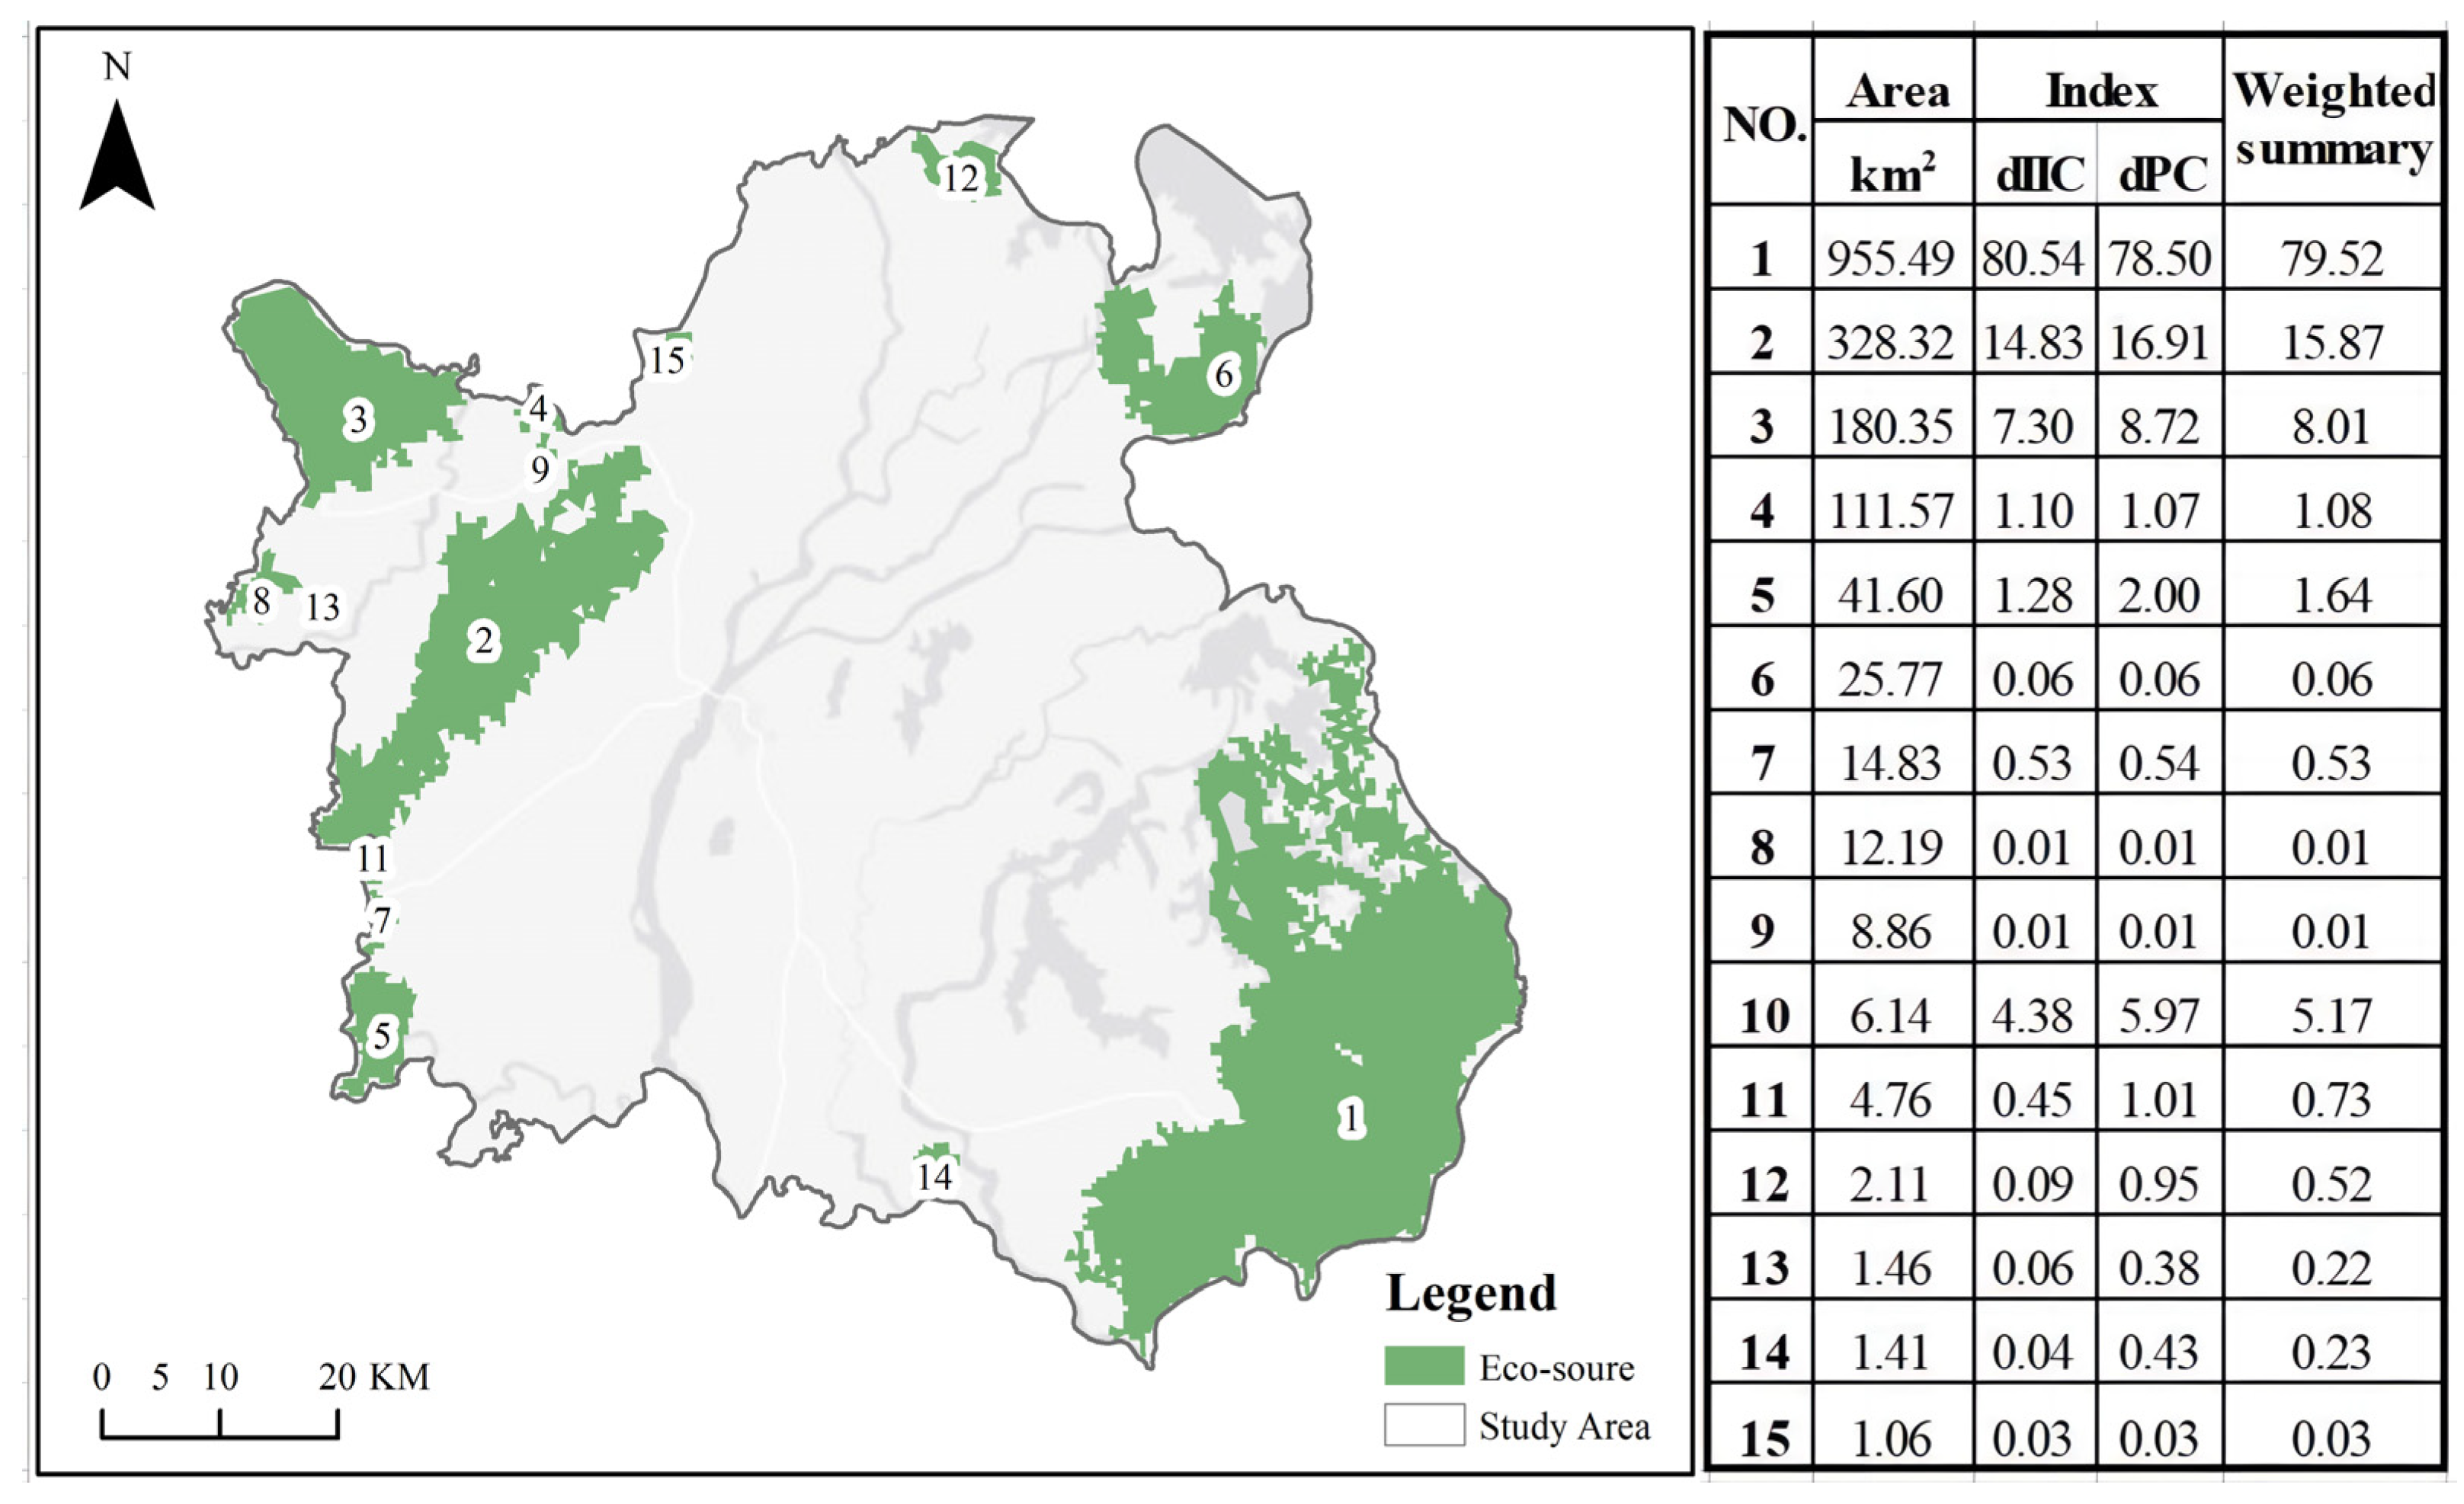
3.2.1. Identification of Ecosources

Ecosources refers to an ecologically stable and extensible patch encompassing an ecological landscape. The evaluation system of an “EEL” is applied to identify Ecosources. Ecosystem services’ spatial differentiation patterns are evaluated to determine the importance of ecosystem services, identifying patches possessing significant ecological value. Assessing ecological sensitivity involves analyzing the response of ecological processes to alterations in the environment, with a particular emphasis on particularly susceptible regions. Furthermore, the ecosystem’s structure’s composition guides the assessment of landscape connectivity to pinpoint landuse types that facilitate the ecosystem’s structural integrity. This study comprehensively considered patch area and connectivity, set thresholds for patch connectivity and connectivity probabilities, evaluated core area patch landscape connectivity and integrity, and identified Ecosources within the study area [16]. This method avoids solely considering the size of patches while neglecting the critical role of patches with significant connectivity, ensuring the rationality of Ecosource selection based on the theory of sustainability, stability, and integrity of ecosystems (Figure 3).

3.2.2. Extraction of Ecocorridors

As important hubs that maintain connections between Ecosources, Ecocorridors can facilitate species migration and gene flow, thereby promoting the sustainability of the ecological environment. The extraction of Ecocorridors through rational and scientific planning is essential to ecological planning. MCR mode is a model that characterizes or forecasts mobility involving items or humans within space, formalizing spatial problems into mathematical problems [49]. In the construction of ESP, this model is widely applied in determining the paths and landscape patterns of Ecocorridors, which can identify paths with the least cumulative resistance. This study employed the Linkage Mapper toolkit, an extension integrated inside the ArcMap platform, to extract Ecocorridors [50]. This extraction process was based on the MCR model, utilizing circuit theory. The fundamental formula as shown in follows:
MCR = min j = n i = m D ij     R i
where MCR is the minimum cumulative resistance to diffusion from source point j to a point in the space; i is the landscape unit; j is the source; D ij is the distance from the source point j to i ; and R i is the resistance to diffusion.

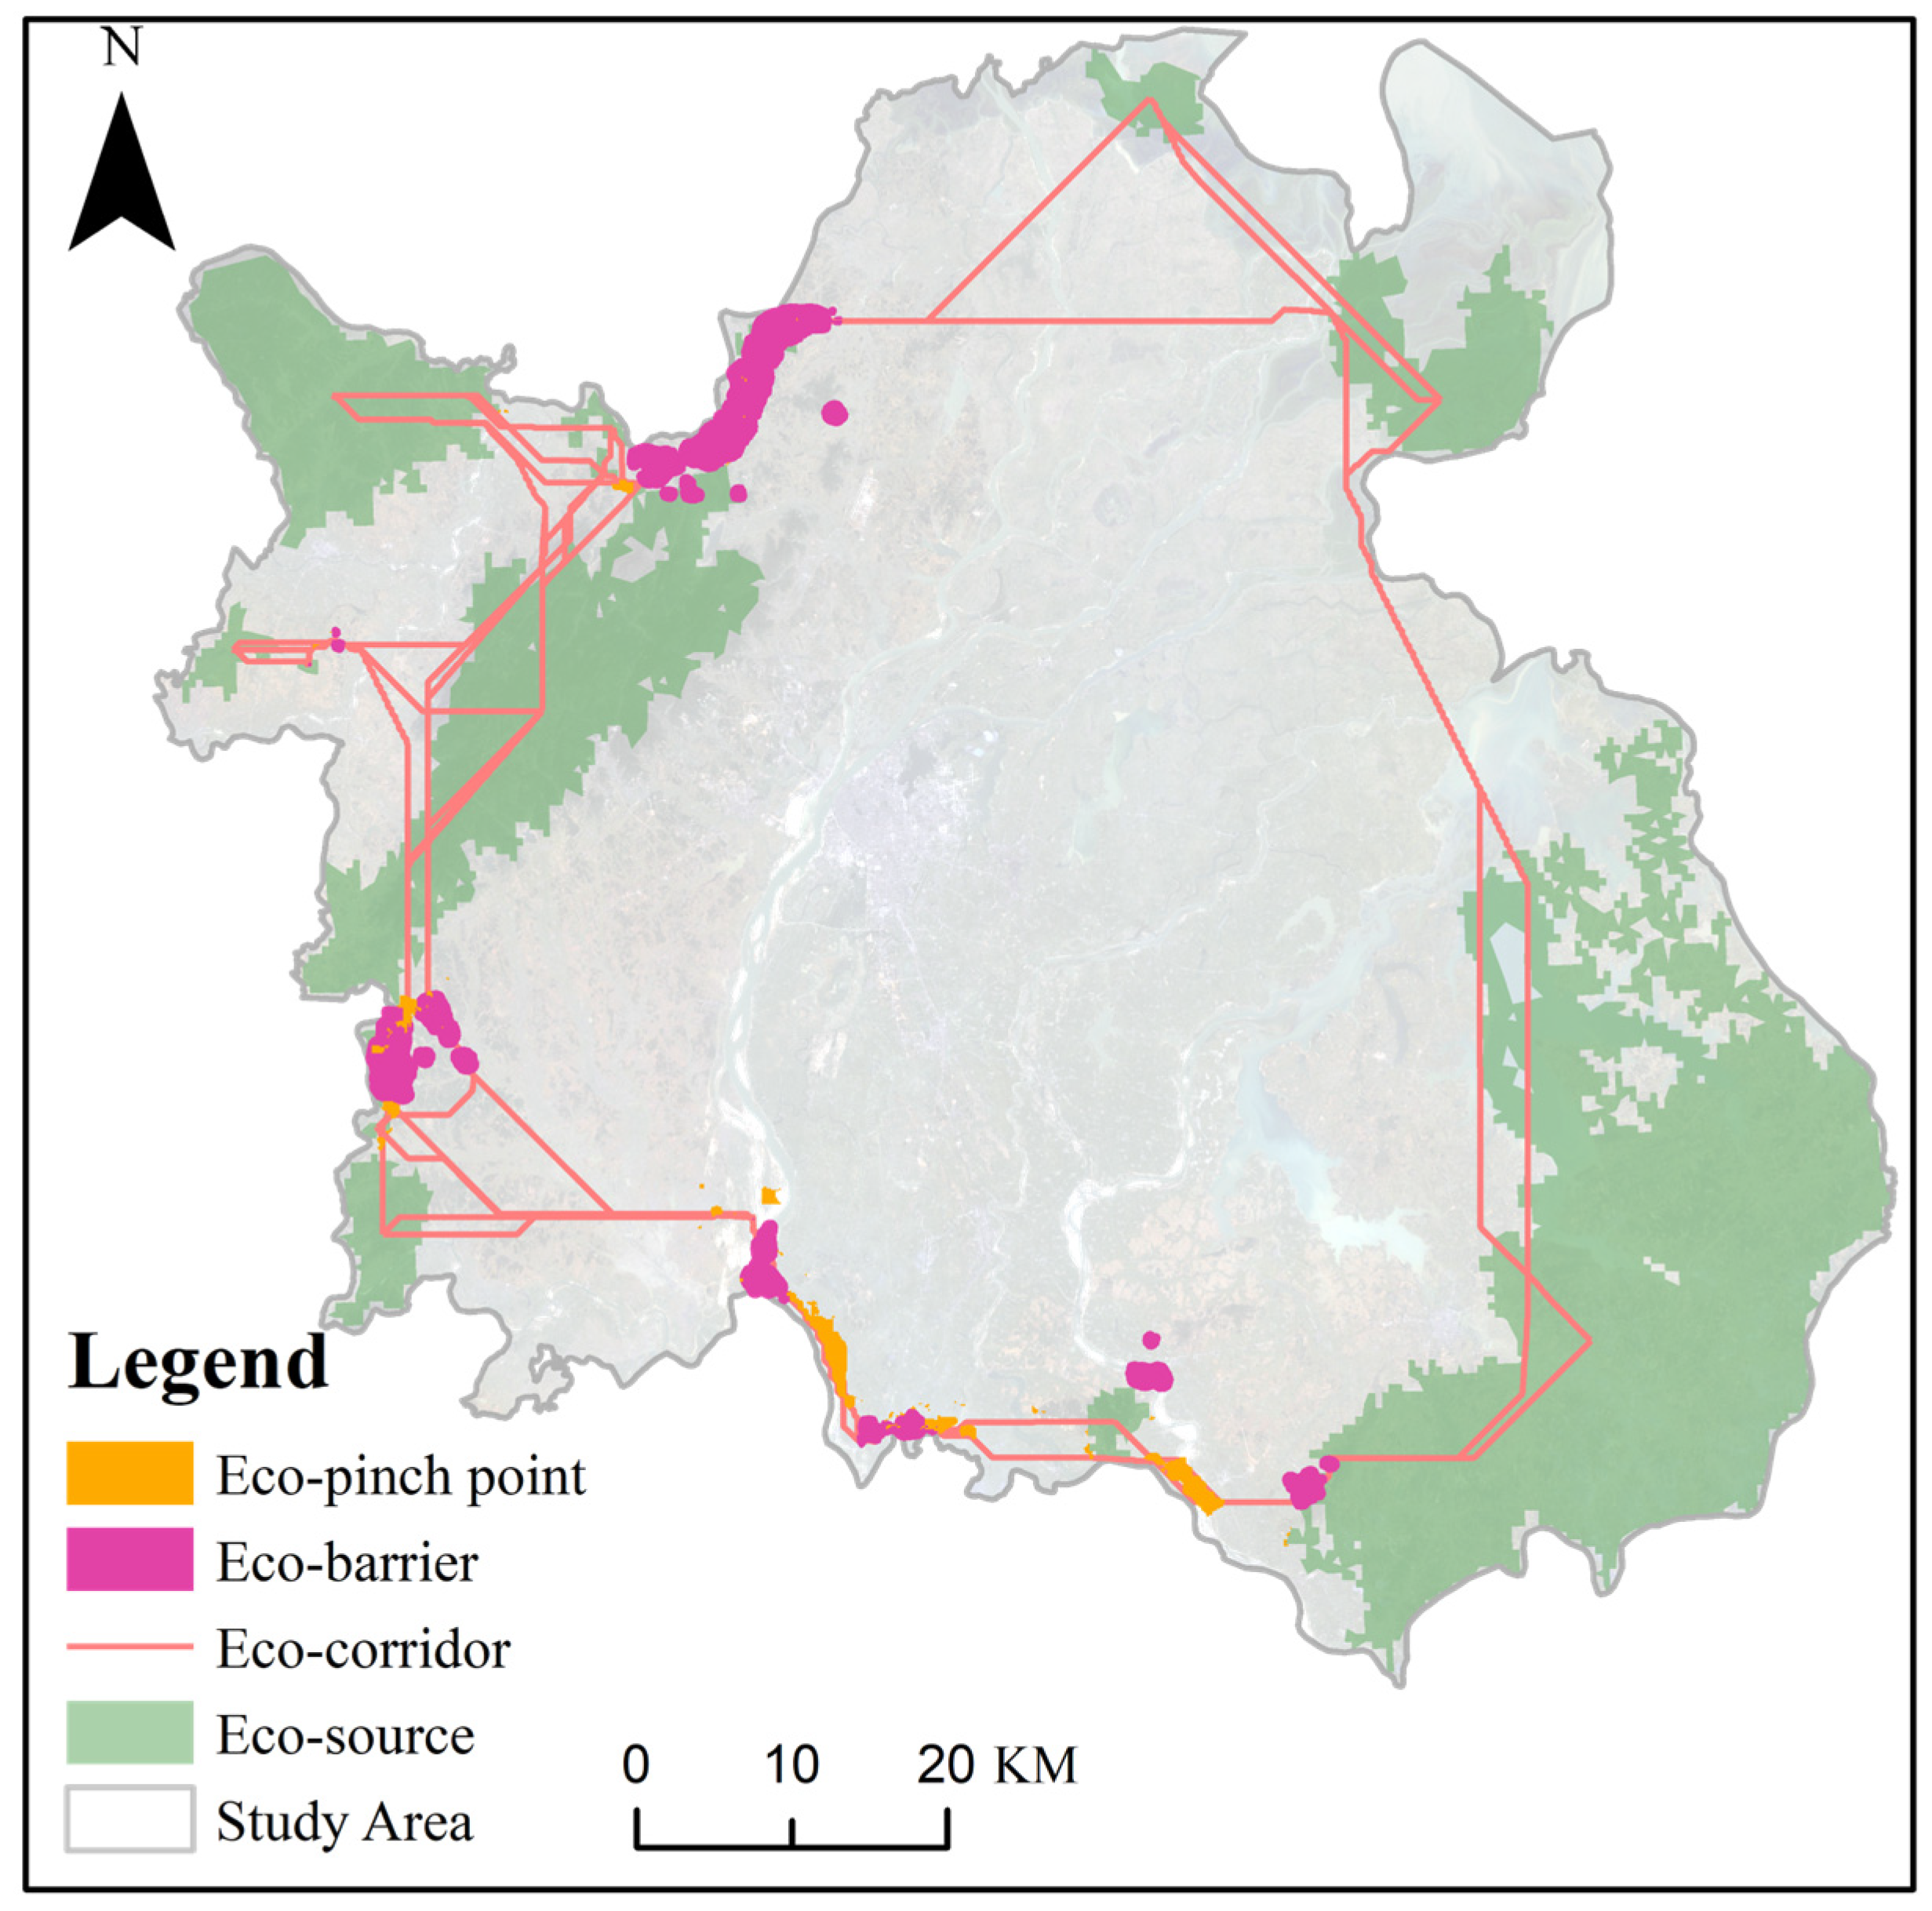
3.2.3. Identification of Econodes

Econodes refer to the areas within an ecosystem that connect adjacent Ecosources, playing a crucial role in facilitating the migration and dispersal of organisms. The primary objective of these nodes is to maintain the ecosystem’s stability and connectivity, facilitate species migration and dispersal, and preserve biodiversity and ecosystem stability. The Pinch Point Mapper tool was utilized in this study to identify ecological pinch points and obstacles [51].

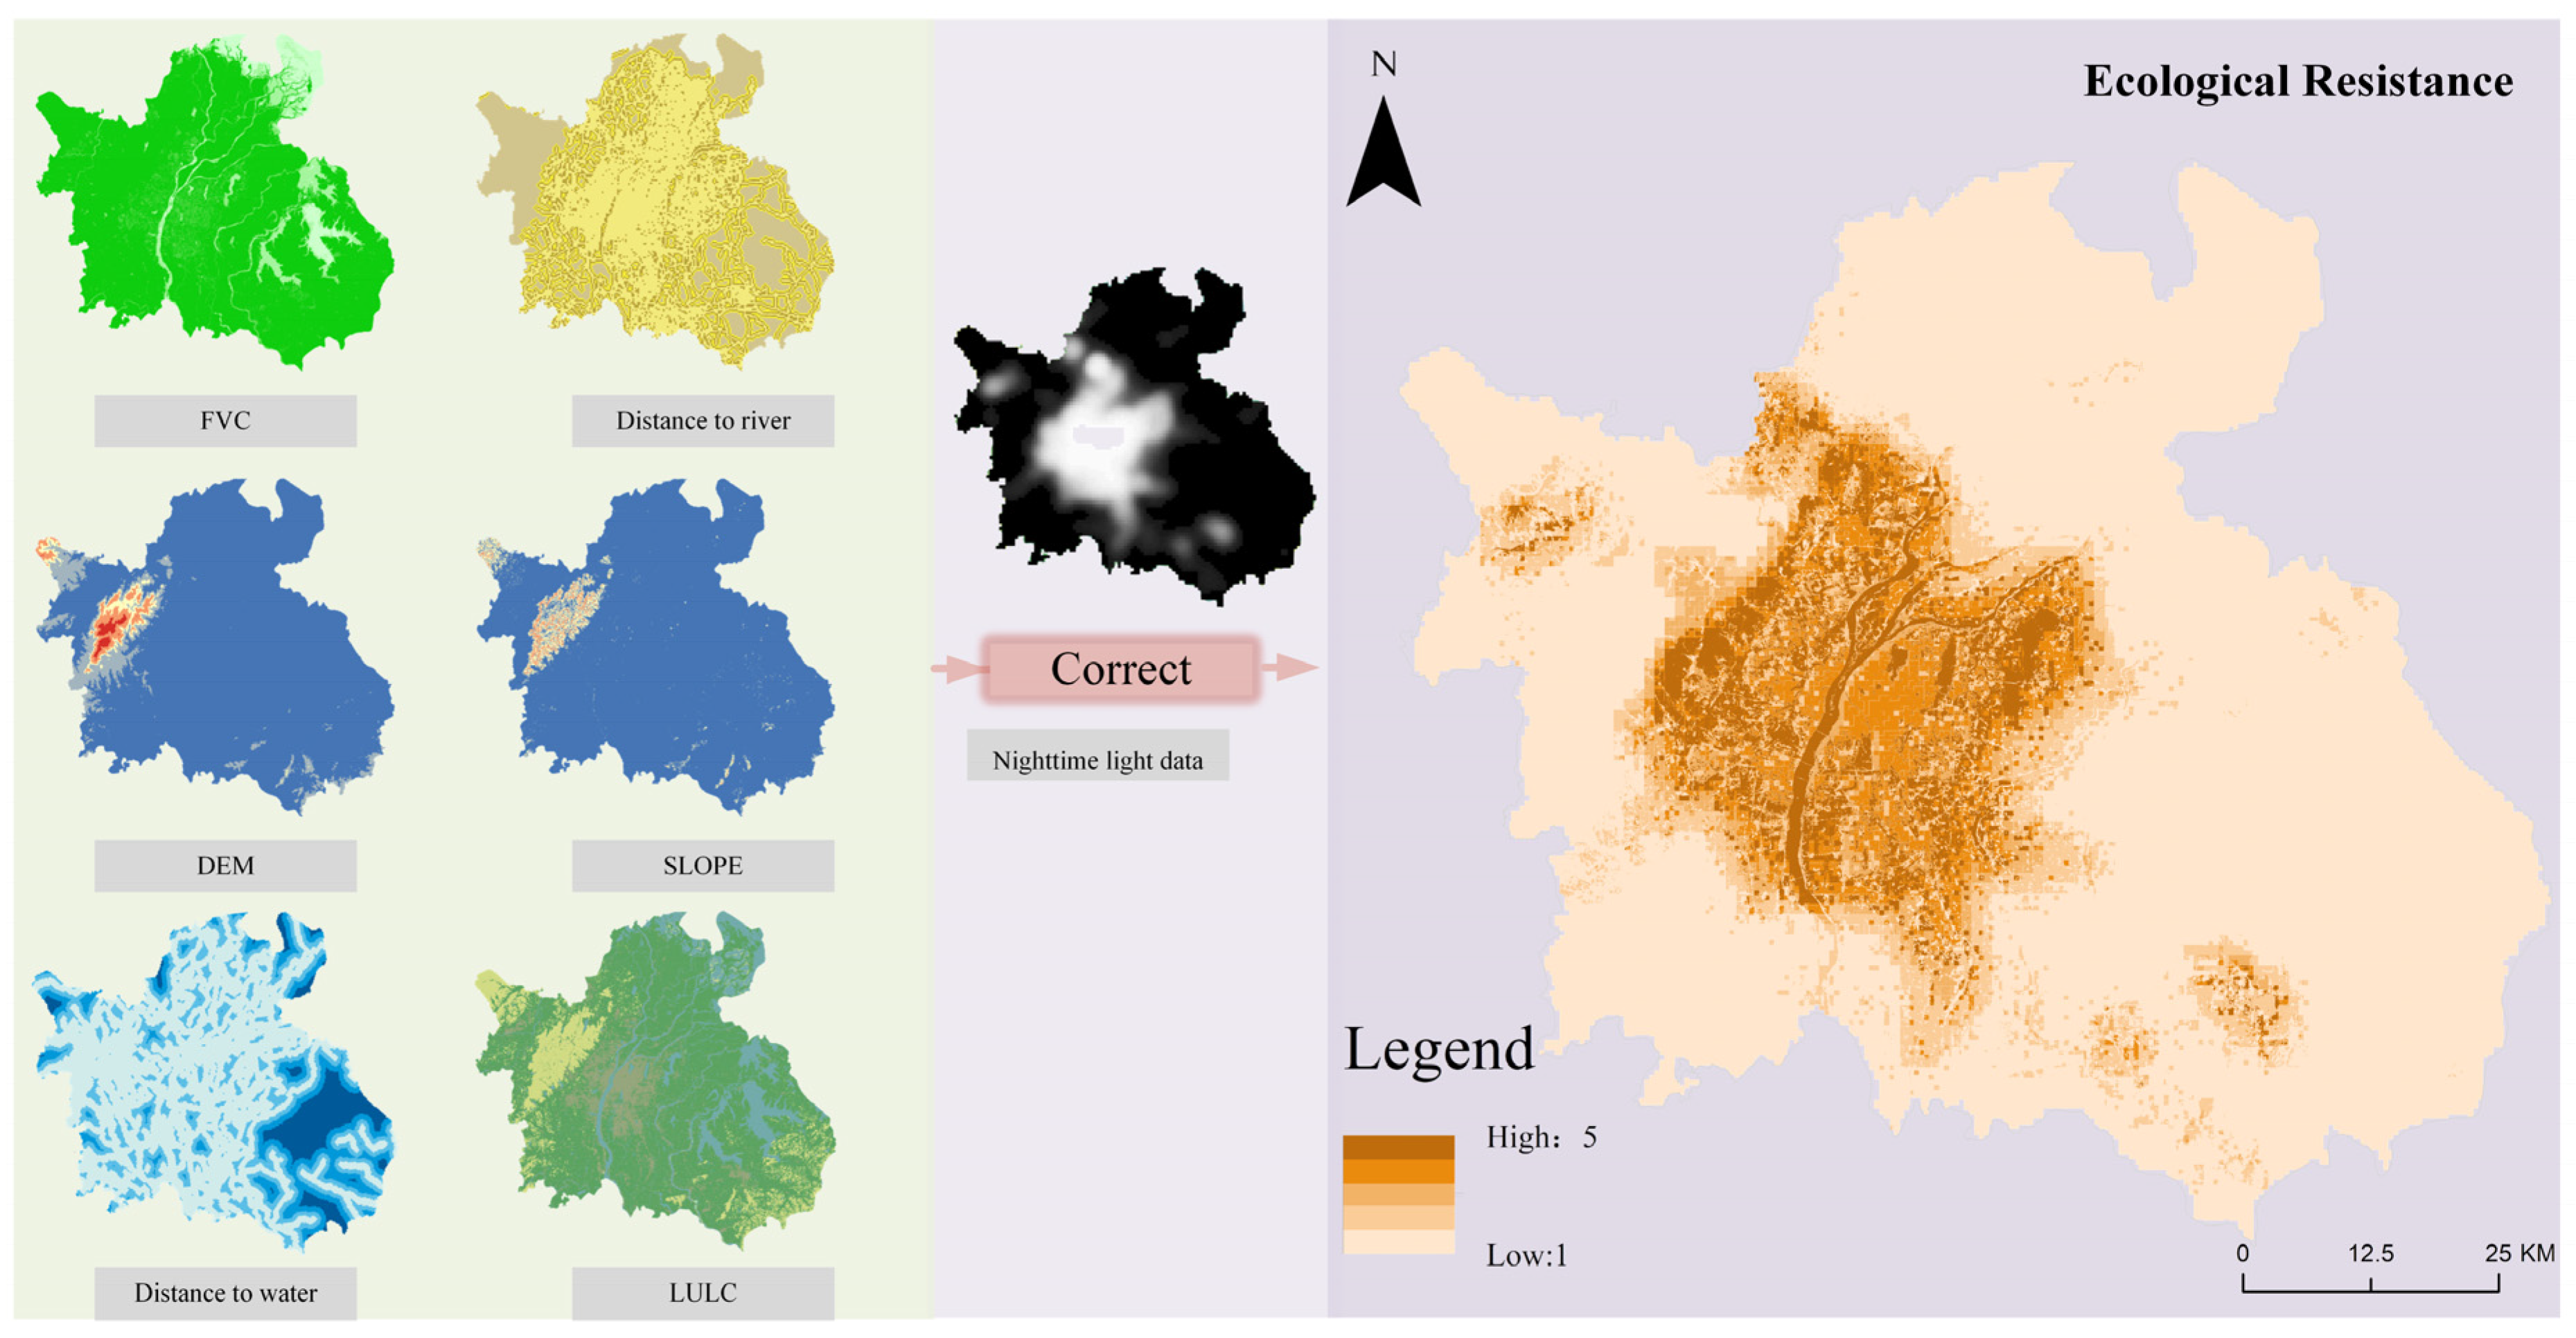
3.2.4. Construction of Ecological Resistance

Ecological resistance refers to the isolation among different patches within an ecosystem and its influence on species intermingling and spatial mobility. A higher resistance value indicates that organisms face more significant challenges in migrating and moving between patches. In this study, resistance factors were chosen based on references from relevant studies and considering the current conditions of the study region [4,28,29]. These factors encompass natural elements as well as human activities. The resistance factors chosen for analysis were elevation, slope, FVC, distance to river, distance to water, and landuse types. Furthermore, the weight of each resistance factor (Table 2) was determined using the AHP through yaahp 12.5 software regarding relevant studies [52]. The primary determinants that shape ecosystem habitats are natural influencing factors; however, human actions provide a discernible influence on the connectedness of Ecosources. Consequently, nighttime light data, indicating human activity intensity, were employed as a correction factor for constructing resistance. They were applied to adjust the natural influencing factors, as shown in Formula (2), ultimately obtaining the final ecological resistance surface.
R ϑ = TLI i TLI a × R
where  R ϑ represents the modified raster ecological resistance coefficient; TLI i represents the light index of position i in the raster data; TLI a represents the mean light index corresponding to various degrees of resistance at point i within the raster data; and R stands for the fundamental resistance coefficient associated with the raster landscape type.

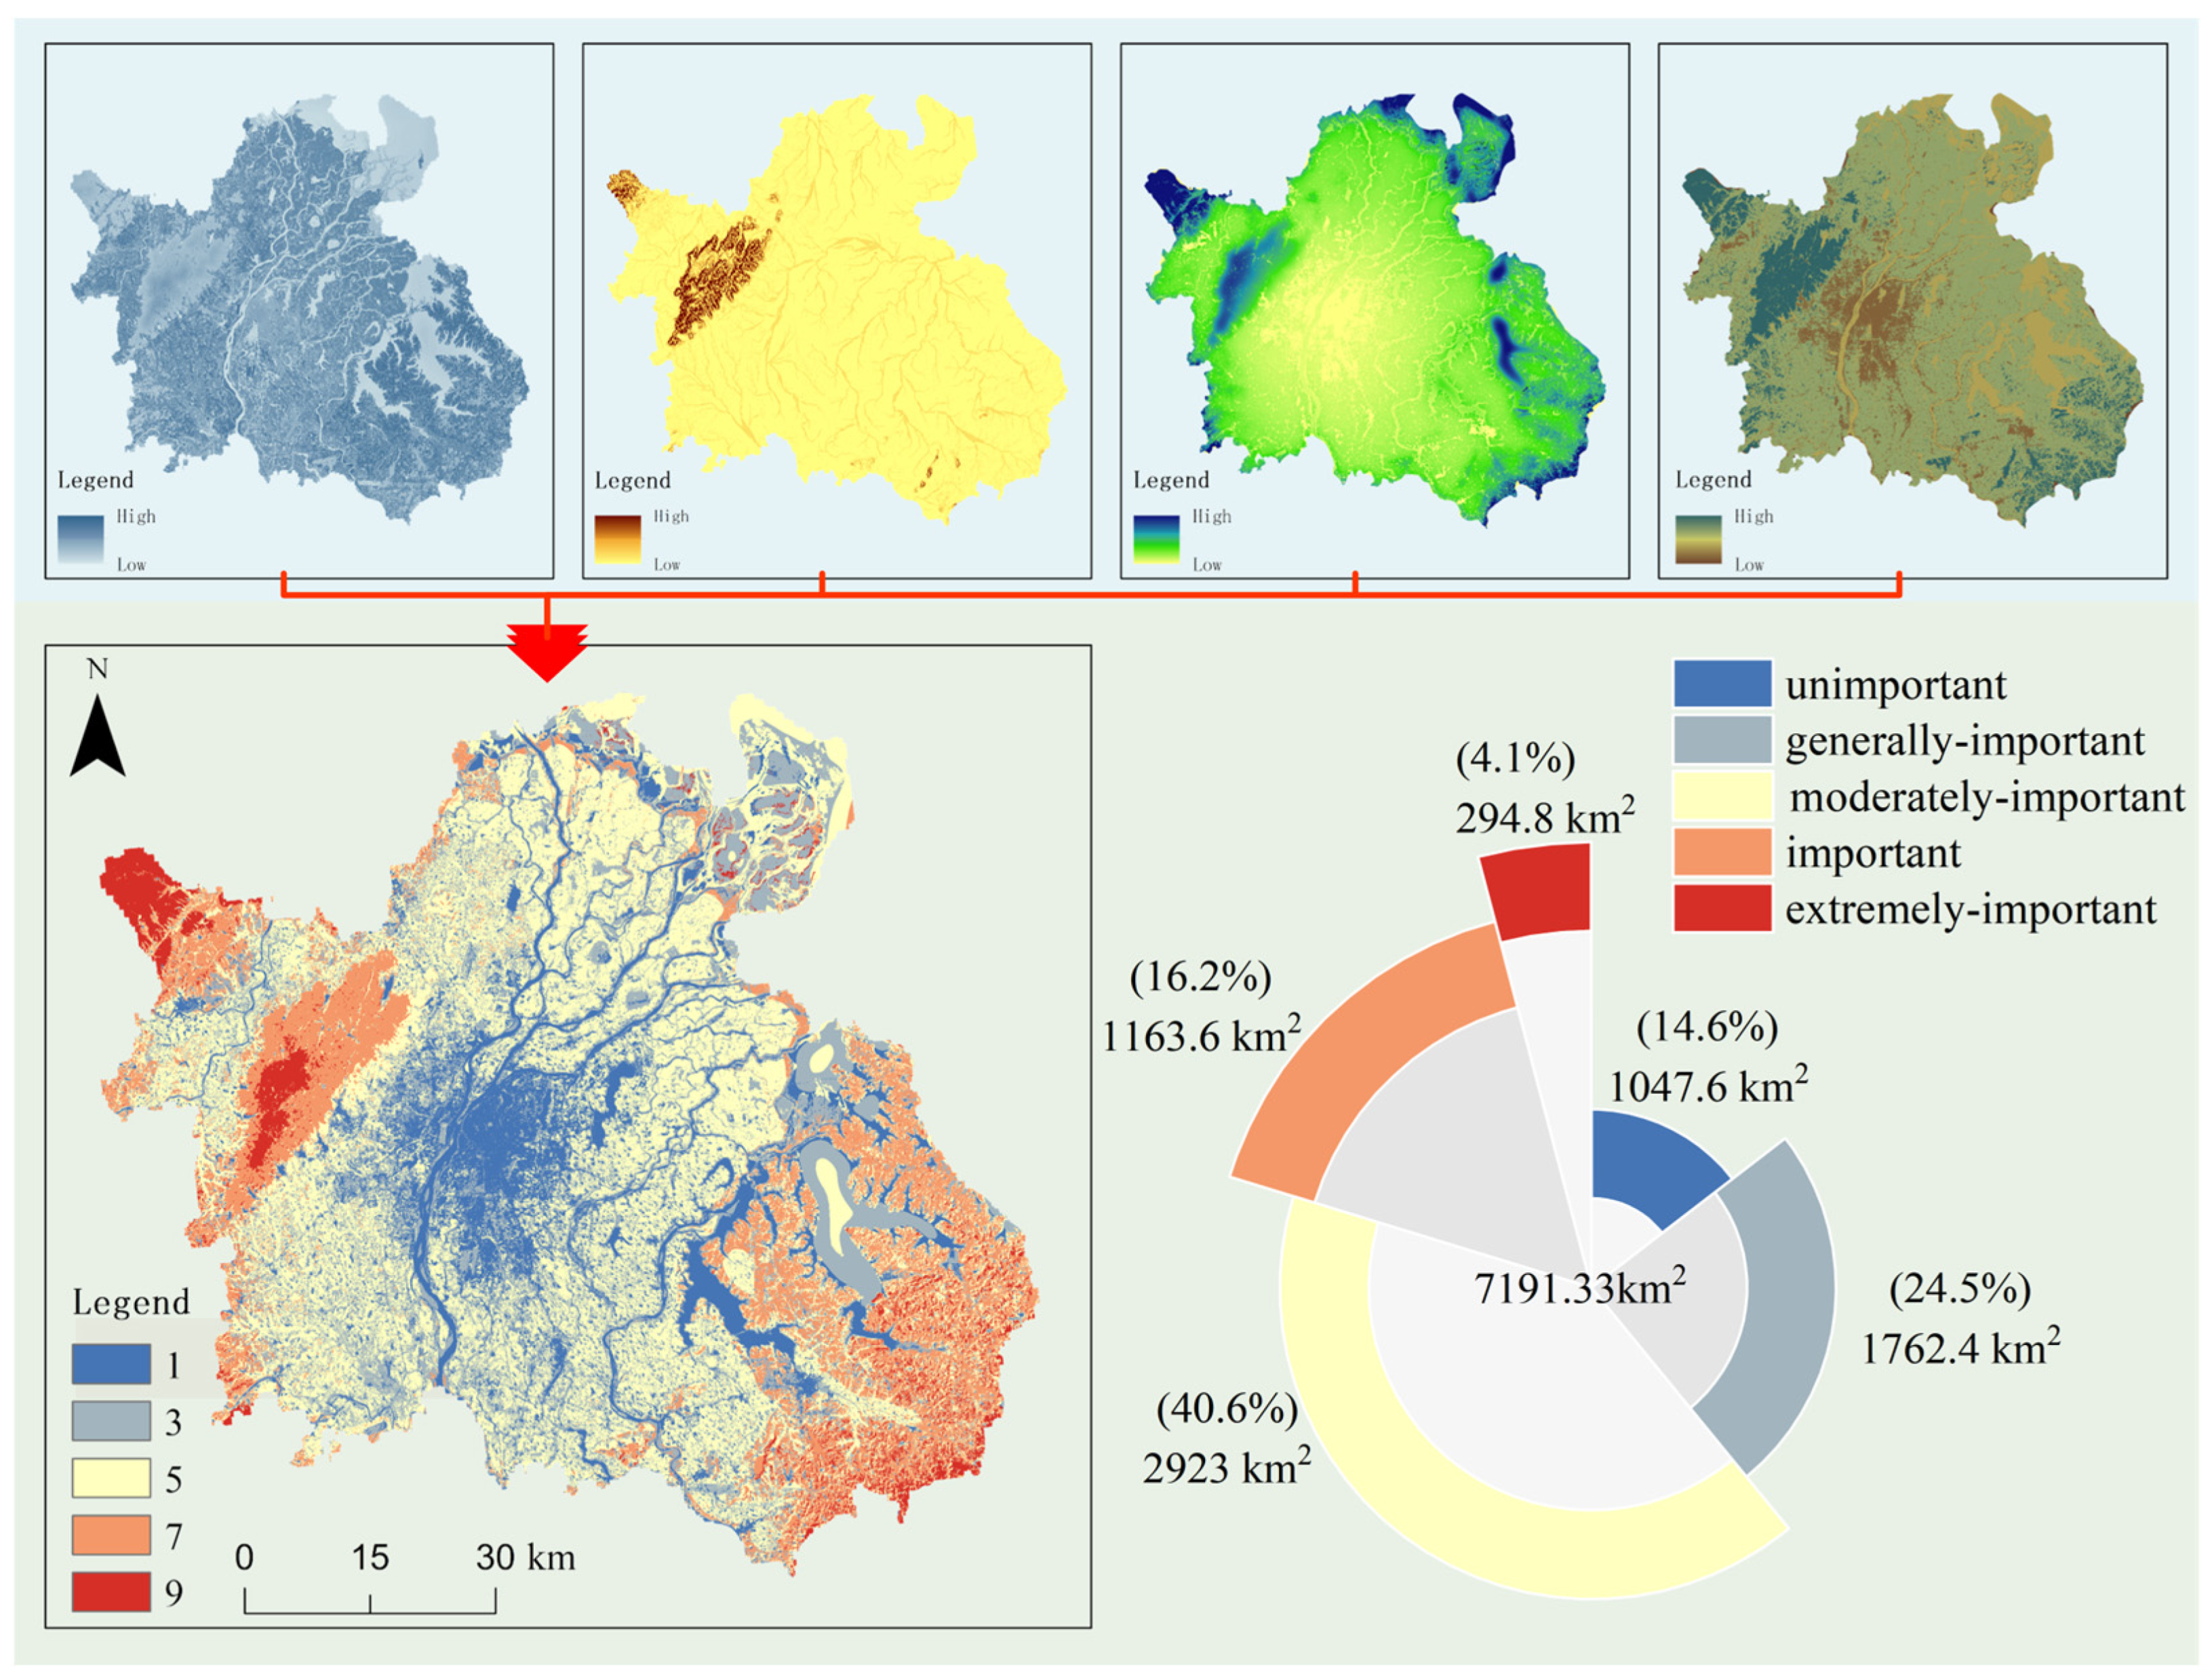
3.2.5. Ecosystem Service Function

Ecosystems are extra significant in maintaining biodiversity, regulating the environment, supporting human livelihood, promoting cultural and spiritual values, and driving economic development through their effects and ecological processes. In this study, considering the characteristics of the study area, the following indicators were selected as assessment criteria for the importance of ESF in Nanchang City: water supply, soil conservation, carbon fixation, and habitat quality. Water supply refers to ecosystems’ capacity to intercept or store water resources derived from precipitation. Soil conservation relates to the many functions offered by ecosystems, such as erosion control, sediment interception, and others. Habitat quality refers to ecosystems’ capacity to ensure species’ survival, reproduction, and interaction. Carbon fixation refers to ecosystems’ capacity to sequester and retain atmospheric carbon dioxide [53]. To conduct a quantitative analysis, we employed various modules of the InVEST model [54]. Specifically, the habitat quality module [26], carbon storage and sequestration module [27], annual water yield module [28], and sediment delivery ratio module [27] were used to evaluate water supply, soil conservation, carbon fixation, and habitat quality (Table 3). Finally, we categorized the indicators into five levels using the geometric interval method.

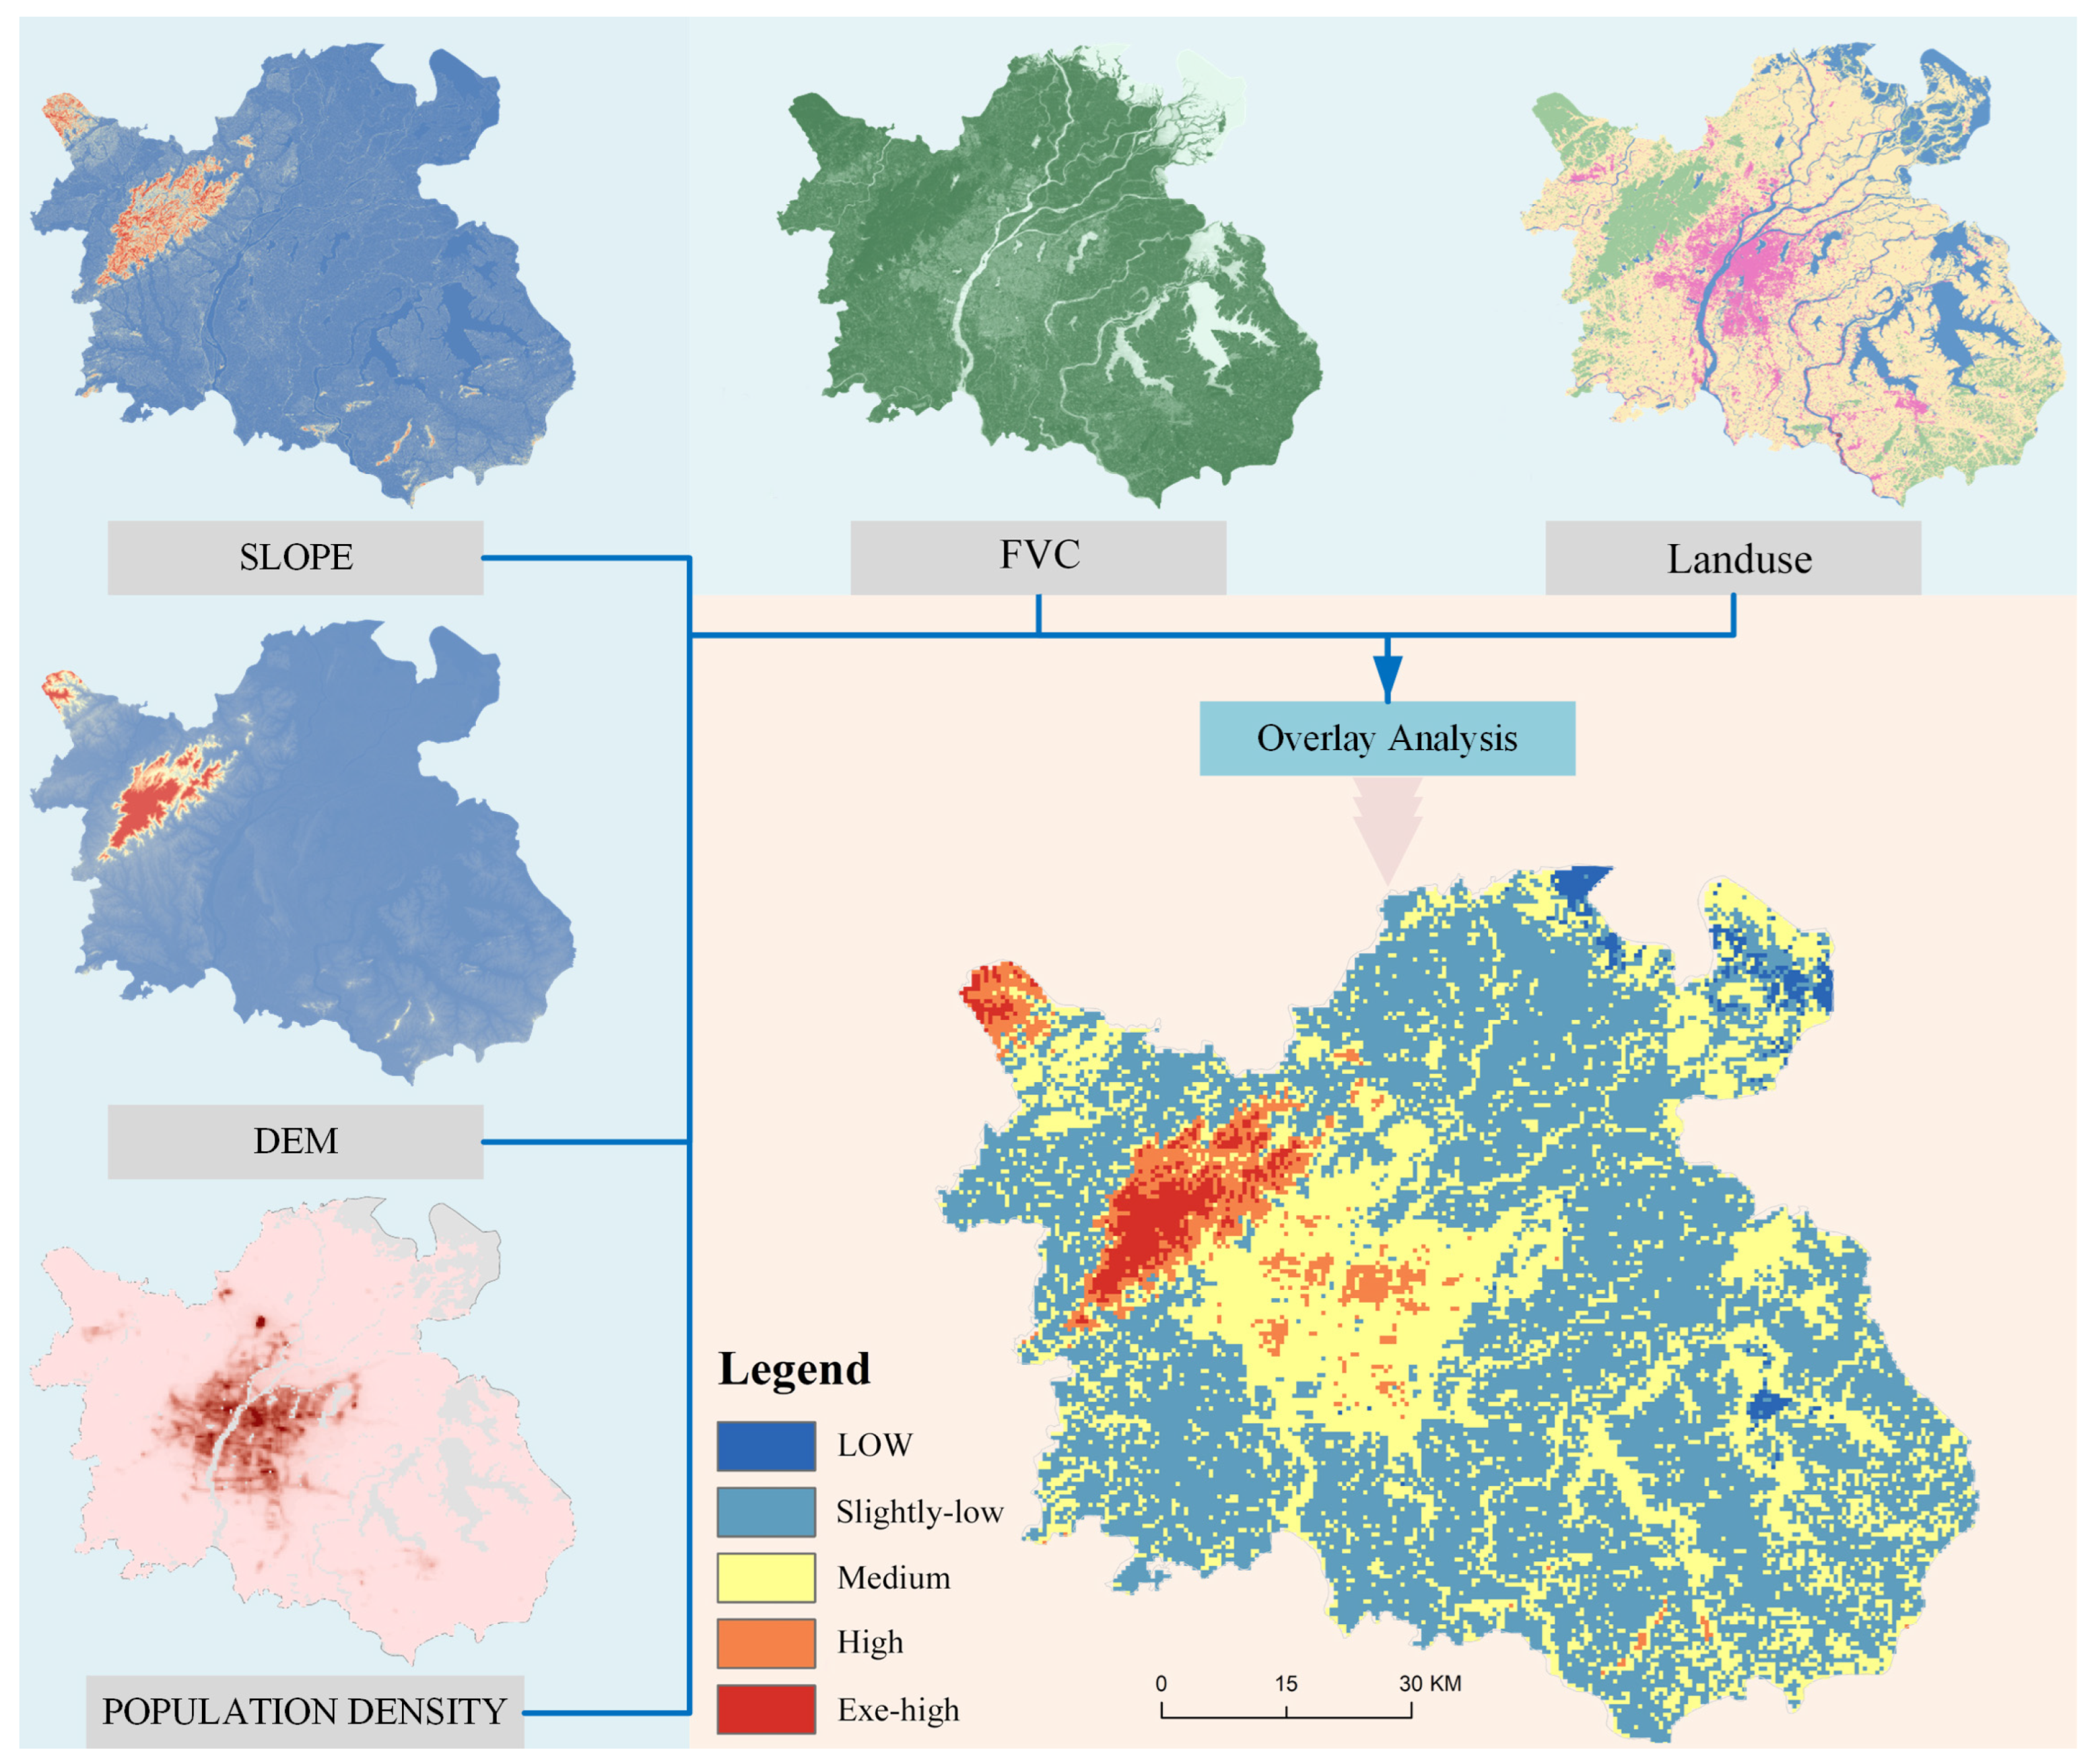
3.2.6. Ecological Sensitivity

Ecological sensitivity pertains to the degree of sensitivity that demonstrates an ecosystem toward both human-induced disturbances and natural-environmental fluctuations. Ecological sensitivity assessment can identify areas that are highly sensitive and face challenges in terms of restoration following disturbances. In this study, we synthesized existing scholarly work and integrated it with the distinctive characteristics of Nanchang’s natural environment to construct an evaluation factor system for assessing ecological sensitivity. This system incorporates various factors (Table 4), including FVC, elevation, slope, population density, and landuse types. The weights of the evaluation factors were assigned by referring to relevant literature and through the AHP method by the yaahp software to determine the importance of these factors. Subsequently, ecological sensitivity was assessed and categorized into five levels using the geometrical interval method [39].

3.2.7. Landscape Connectivity

Landscape connectivity is crucial in understanding the facilitation or hindrance of ecological flows within a given landscape, serving as a fundamental indicator of landscape ecological processes. The connectivity of natural habitats assumes a pivotal role in supporting ecological processes, and strong connectivity can maintain biodiversity as well as the health and integrity of ecosystems. The landscape connectivity assessment was conducted by utilizing the confer module within ArcMap. This study used Conefor 2.6 software to provide a more accurate assessment of the importance of the Ecosources’ significance by calculating the probability of connectivity (PC) and integral index of connectivity (IIC) [22]. Furthermore, the average of these indices was computed employing the subsequent Formulas (3) and (4):
PC = i = 1 n j = 1 n a i × a j × P ij * A 2    
ICC = i 1 n j 1 n [ ( a i × a j ) / ( 1 + nl ij ) ] A L 2      
where i and j are the areas of patch i and j, respectively; A is the total area of the landscape; and n represents the number of patches. nl ij represents the maximum possibility of diffusion between patch i and patch j . Higher PC and ICC values suggest higher connectivity between patches.

3.2.8. Landuse Dynamic Degree

Landuse dynamics refers to the extent of dynamic changes occurring among various landuse types and finds widespread application in land monitoring and management [3]. Due to the impact of human activities, landuse types are subject to significant transformations across various regions and periods. Investigating landuse dynamics assists in comprehending the trends, spatiotemporal distribution, and influencing factors underlying landuse changes [55]. As a result, it offers a scientific foundation for the prudent planning and management of land resources. These statements can be elucidated through Formulas (5) and (6).
K = U b U a U a × 1 T × 100 %  
where K represents the annual rate of change; U a and U b represent the landuse area at the commencement and conclusion of the research period, respectively; and  T represents the span of time.
LC = i = 1 n | u bi u ai | / 2 i = 1 n u ai  
where LC represents the comprehensive landuse dynamic; n represents the total number of landuse types in the study area; u ai represents the area of the beginning landuse types; u bi u ai represents the area of conversion of landuse types; and T represents the duration of the study period.

4. Results

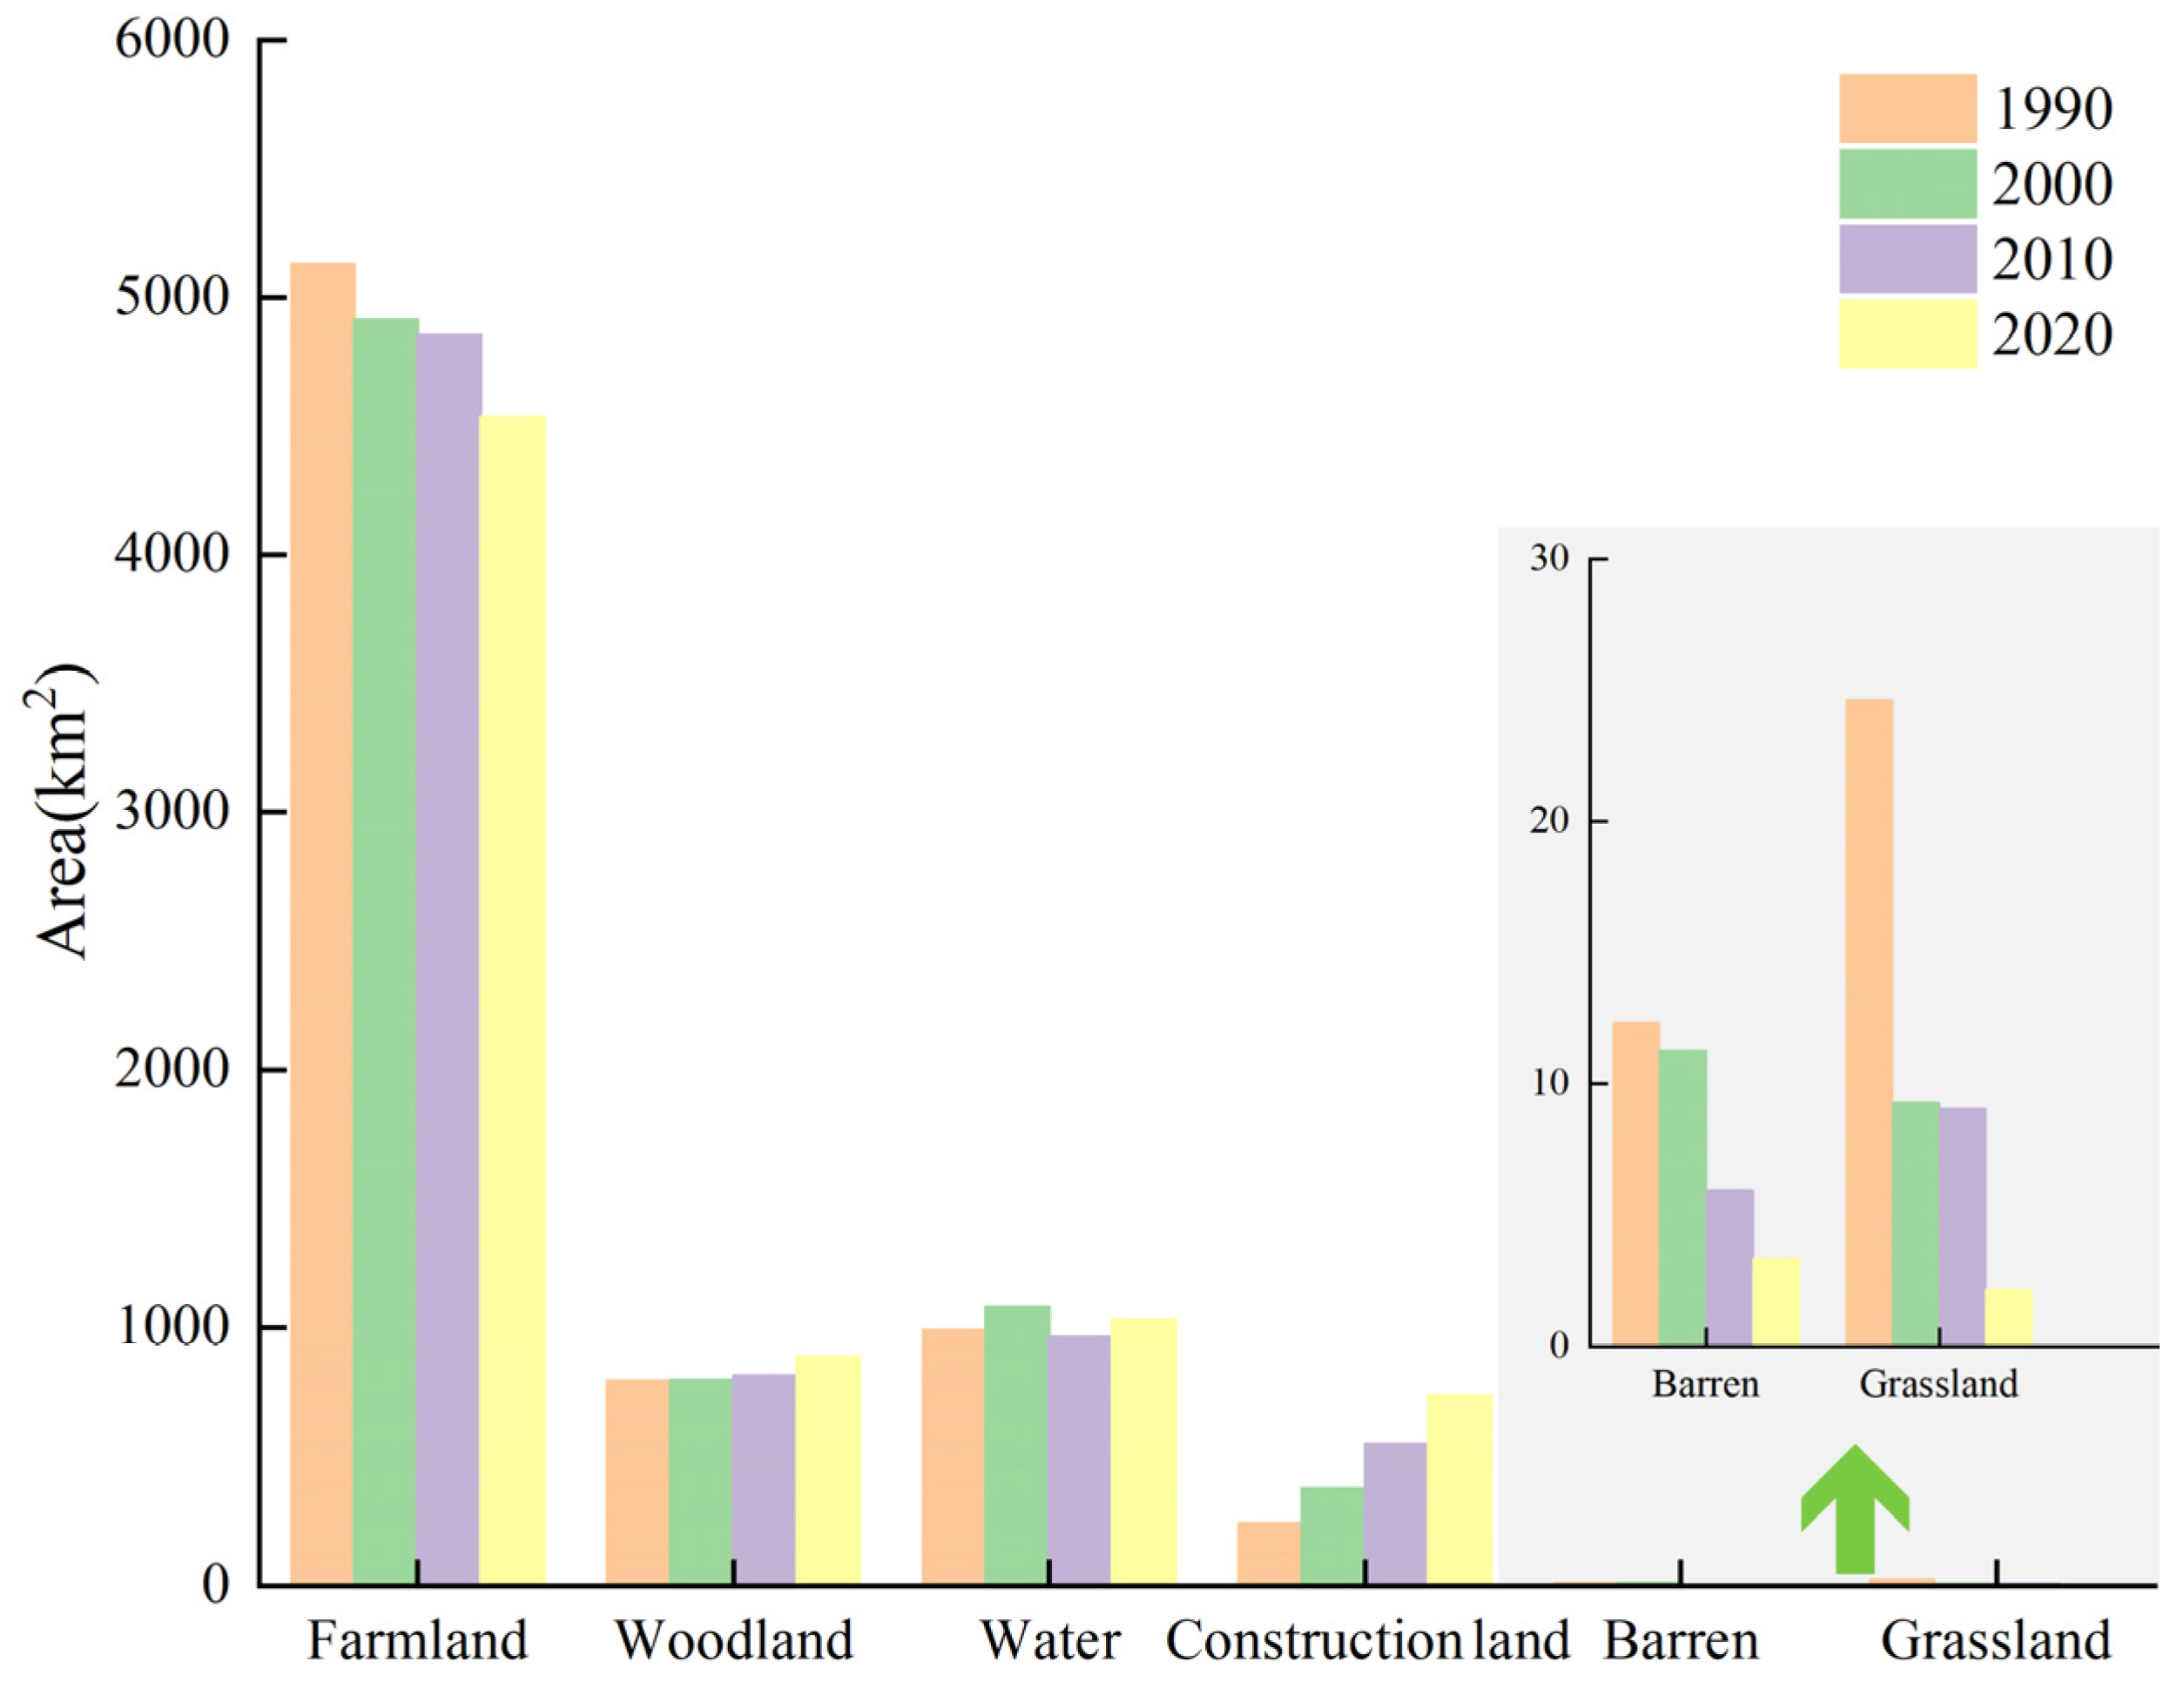
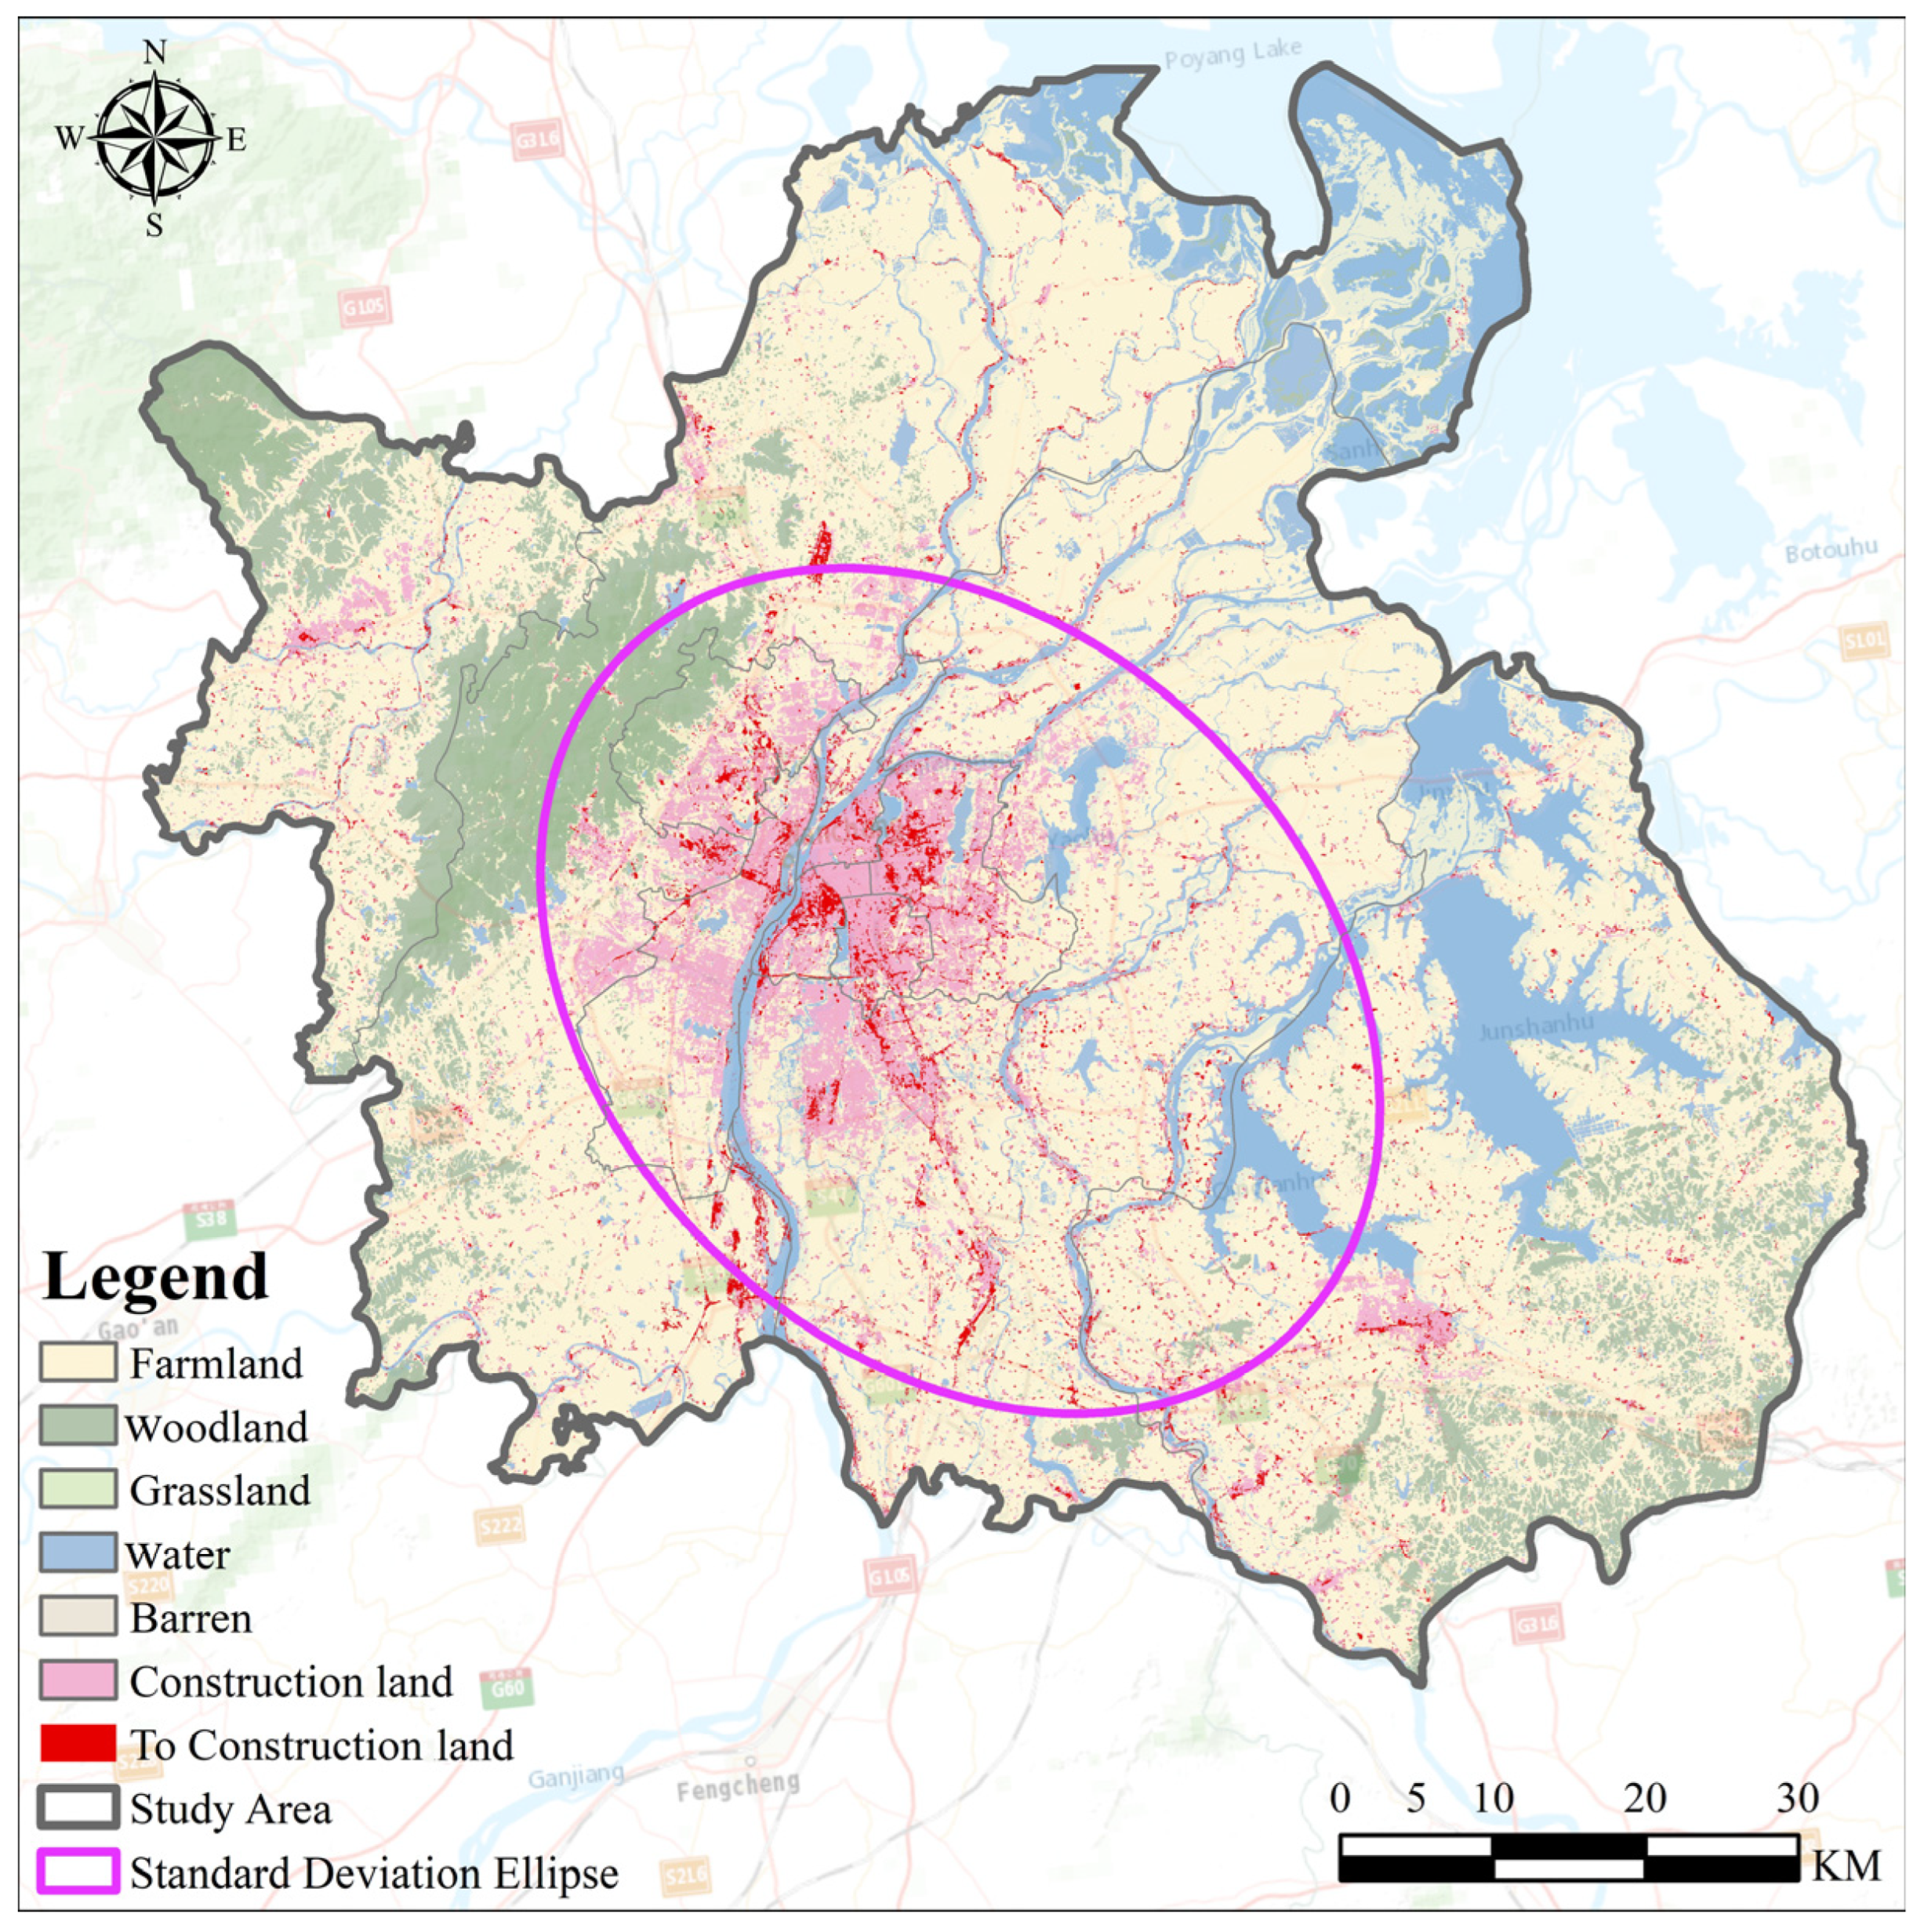
4.1. Landuse Dynamics in Nanchang

The landscape pattern in Nanchang City has undergone spatial-temporal changes of varying degrees as a result of human activity and natural development. The dominant landuse types in the city consist of farmland and water, followed by woodland and construction land, while grassland and barren occupy small proportions. Figure 4 and Figure 5 reveal notable changes in the spatial organization of Nanchang’s landuse from 1990 to 2020. Construction land is primarily concentrated in Nanchang’s central part, exhibiting a continuous and substantial increasing trend, with an expansion of 494.26 km2. Woodland is mainly distributed in the eastern and western regions, showing a continuous upward trend with an increase of 91.54 km2. Water is predominantly located in the northeastern part of Nanchang, exhibiting a fluctuating trend with an increment of 38.49 km2. Farmland shows a relatively uniform spatial distribution, indicating a continuous and significant decrease of 592.87 km2. Grassland decreased by 22.46 km2, while barren decreased by 9.01 km2. In summary, Nanchang City experienced rapid urbanization and development from 1990 to 2020, increasing utilization of previously barren. The significant expansion of construction land in the central region was accompanied by a decline in farmland.
The long-term changes in landuse types were analyzed over three ten-year periods, namely, 1990–2000, 2000–2010, and 2010–2020, as presented in Table 5. From 1990 to 2000, grassland decreased significantly, with the highest annual rate of change recorded at −16.56%. Conversely, construction land experienced substantial growth, with a rate of change at 3.59%. The barren area decreased, with a lower rate of change at −0.96%. The water exhibited an increase with a rate of change at 0.83%. Farmland also declined but was at a slower rate of change of −0.43%. Woodland showed minimal change, with the smallest rate of change at 0.06%. In the subsequent period from 2000 to 2010, there was a significant reduction in barren land, with the highest annual rate of change recorded at −8.86%. Construction land continued to expand, with a rate of change at 3.13%. Water experienced a decrease with a rate of change at −1.23%, while grassland decreased at a lower rate of change at −0.24%. Farmland increased slightly with a rate of change at 0.16%. The decline in woodland was minimal, with a rate of change at −0.13%. From 2010 to 2020, there was a notable decrease in grassland, with the highest annual rate of change observed at −31.66%. Barren land also experienced a significant reduction, with a rate of change at −7.83%. Construction land continued to expand, although at a slower pace, with a rate of change at 2.54%. Woodland increased with a rate of change at 0.83%. Farmland declined, albeit at a slightly higher rate of change at −0.70%. Water exhibited the smallest increase, with a rate of change at 0.65%. The findings indicate a substantial urbanization process in Nanchang City, characterized by a continuous expansion of construction land, though at a decreasing rate. Moreover, farmland and grassland consistently declined, particularly from 2010 to 2020. The conversion of barren into other landuse types has intensified, resulting in its dwindling extent.
In addition, the evaluation of dynamic changes in landuse types within the study area from 1990 to 2020 employed land transfer matrix calculations using ArcMap software, as shown in Table 6. During the specified period, 234.24 km2 of farmland was converted into woodland and 452.62 km2 into construction land. Woodland converted 131.66 km2 into farmland and 15.42 km2 into construction land. Grassland converted 7.66 km2 into water and 11.05 km2 into construction land. Water converted 144.08 km2 into farmland and 29.74 km2 into construction land.
Nanchang has experienced rapid urbanization, encroaching upon natural ecosystems and expanding urban and agricultural lands. Consequently, significant losses and degradation have been observed across natural landscapes, biodiversity, and ecological functionalities. These transformations pose a challenge to ESP in Nanchang, necessitating effective measures to balance urbanization and ecological conservation.

4.2. ESF Importance and Ecological Sensitivity

Ecosystem services are critical in supporting biodiversity, ensuring environmental regulation, providing human livelihoods, preserving cultural and spiritual values, and driving economic development via their existence or ecological processes. This study was to standardize and categorize the significance of varied ESF and classify it into five distinct categories. This categorization was carried out using the mean superimposition approach and the natural breakpoint method, as shown in Figure 6. Overall, the pattern exhibited a “medium-low surrounding high” trajectory, where the central region of Nanchang’s ESF mainly fell into unimportant and generally-important categories. Conversely, the categories of important and extremely-important ESF were primarily concentrated in Anyi County, Xinjian District, and the western part of Jinxian County, where the ecological environment demonstrated exceptional performance and the overall capability of ESF is high. These areas serve as the primary energy supply for the entire regional ecosystem, furnishing indispensable support for its normal functioning. In contrast to other regions, the central region displayed diminished importance in ESF due to its extensive urbanization process. During development, a substantial portion of land is converted into construction land, leading to diminished vegetation coverage and an elevated ratio of cultivated land and construction land. This sheds light on the fact that an excessive emphasis and intensive construction land in the region, primarily driven by rapid socio-economic growth, will inevitably undermine the stability of the regional ecosystem and diminish its capacity to provide vital ecosystem services.
The ecological sensitivity analysis revealed the distribution of different sensitivity levels within Nanchang, which are presented in Figure 7 and Table 7. The largest portion of the study area, approximately 83.70%, fell under low and slightly low sensitivity categories. This is primarily distributed beyond the confines of Nanchang’s built-up areas. Medium sensitive regions covered 7.41% of Nanchang and were primarily found in the urban–rural transition zones surrounding the built-up areas. On the other hand, high-sensitivity regions were found to be concentrated within the built-up areas. Additionally, the exe-high regions, occupying 185.82 km2 and constituting 2.58% of the total area, were primarily concentrated within the Meiling Mountain range located in Xinjian District. Notably, these high sensitive regions demonstrated an aggregated spatial distribution pattern, which can be primarily attributed to significant variations in terrain, rendering them susceptible to geological hazards and possessing lower soil erodibility factors.

4.3. Nanchang’s Ecosources

The integrated assessment system “EEL” was employed to identify Ecosources within Nanchang City, as shown in Figure 8. A total of 15 Ecosources were identified, encompassing an area of 1695.90 km2. These sources were mainly distributed in the eastern and western parts of the study area, with a smaller portion located in the north. Farmland and woodland were the dominant land types within these Ecosources, while no Ecosources were found in Nanchang’s central area. Among the identified sources, four Ecosources exceeded an area of 100 km2, totaling 1575.72 km2, which constituted 21.91% of Nanchang and 92.91% of the total Ecosources. The largest Ecosource covered 955.49 km2, which constituted 13.29% of Nanchang and 56.34% of the total Ecosources area. This source was situated in Jinxian County and was characterized by abundant vegetation cover, high levels of natural conservation, and minimal human disturbance. The second largest Ecosource encompassed an area of 328.32 km2, which constituted 4.57% of Nanchang and 19.36% of the total Ecosource area. It was in Xinjian County, known as the Meiling National Forest Park, boasting rich vegetation and significant protection efforts. The third largest Ecosource spanned an area of 180.35 km2 and was situated in Anyi County, which constituted 2.51% of Nanchang and 10.06% of the total Ecosource area. The remaining Ecosources were primarily mountainous areas and forests, providing favorable habitats for biodiversity and offering abundant ecosystem services. In summary, the selected Ecosources were predominantly characterized by forest landuse types and exhibited high ESF. Regions such as the Meiling Mountain range and Jinxian County are notable for their extensive vegetation cover, limited human disturbance, and substantial governmental protection, indicating the reliability of the extracted Ecosources. Therefore, when undertaking ecological conservation and environmental planning, it is reasonable to prioritize these areas with significant ecological value as Ecosources. This approach enhances ecosystem stability; promotes the sustainable utilization of natural resources; and provides diverse ecosystem services, including safeguarding water supplies, conserving soil, and regulating climate.

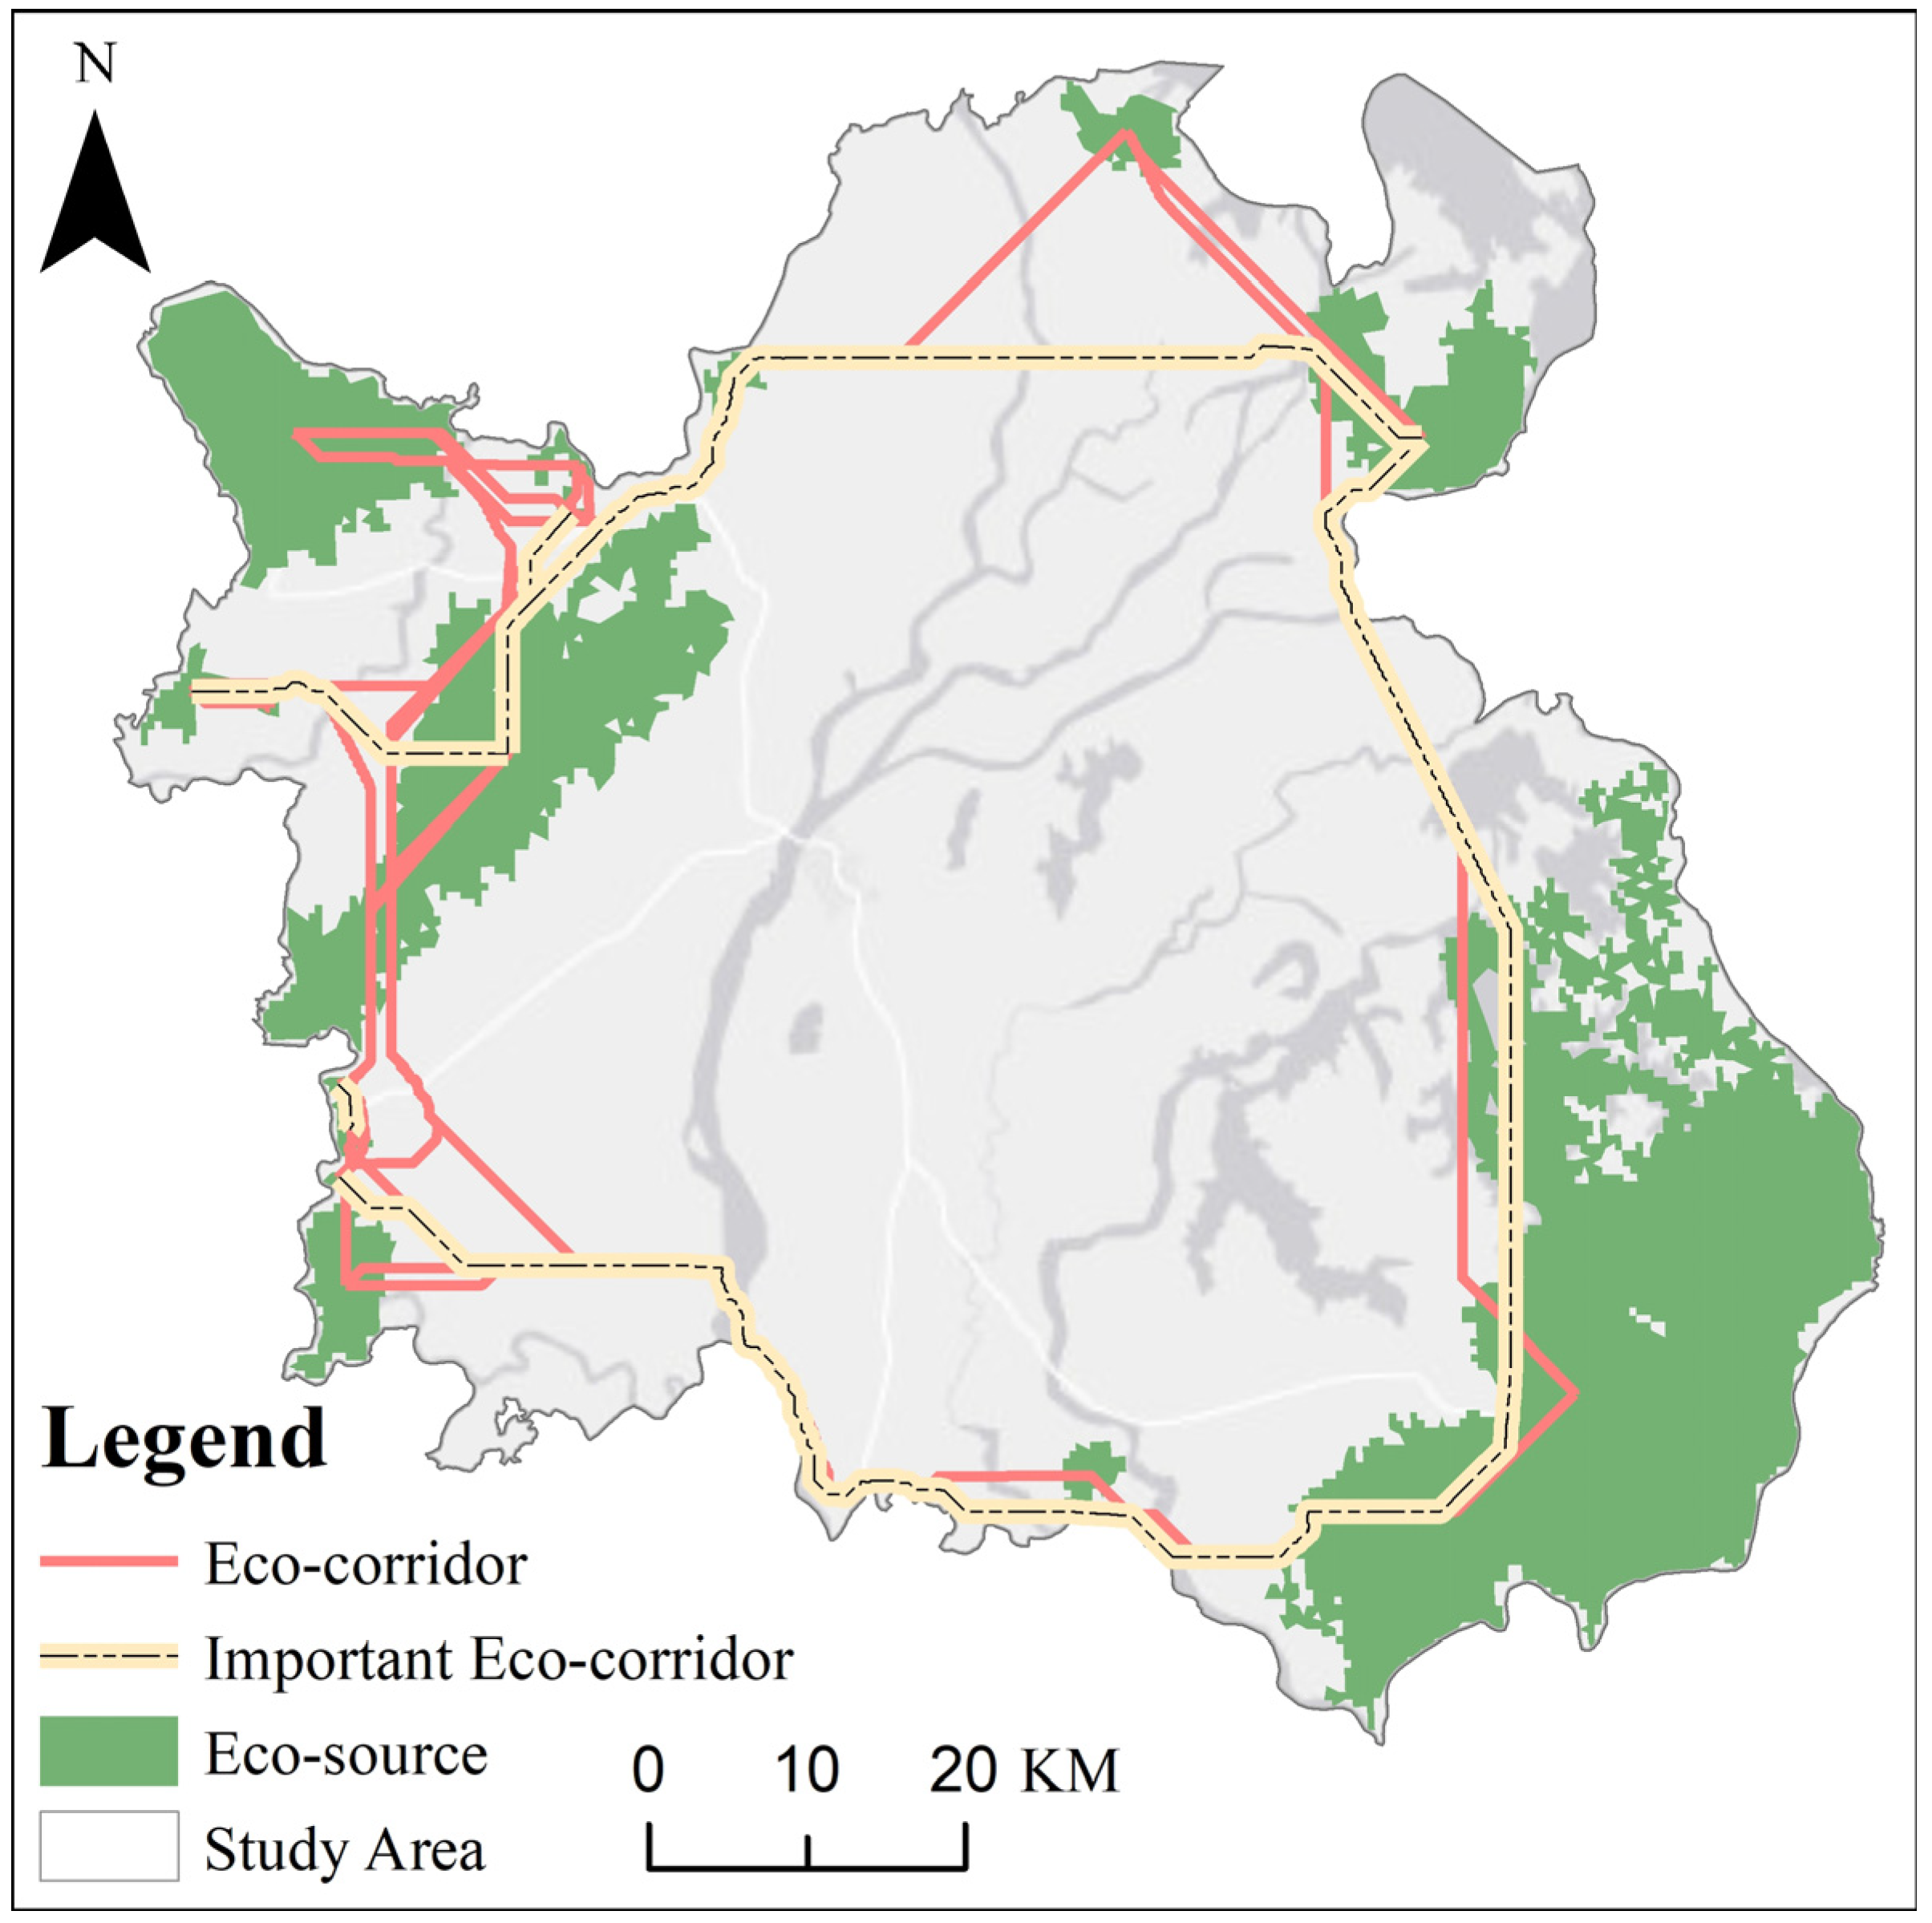
4.4. Nanchang’s Ecocorridors
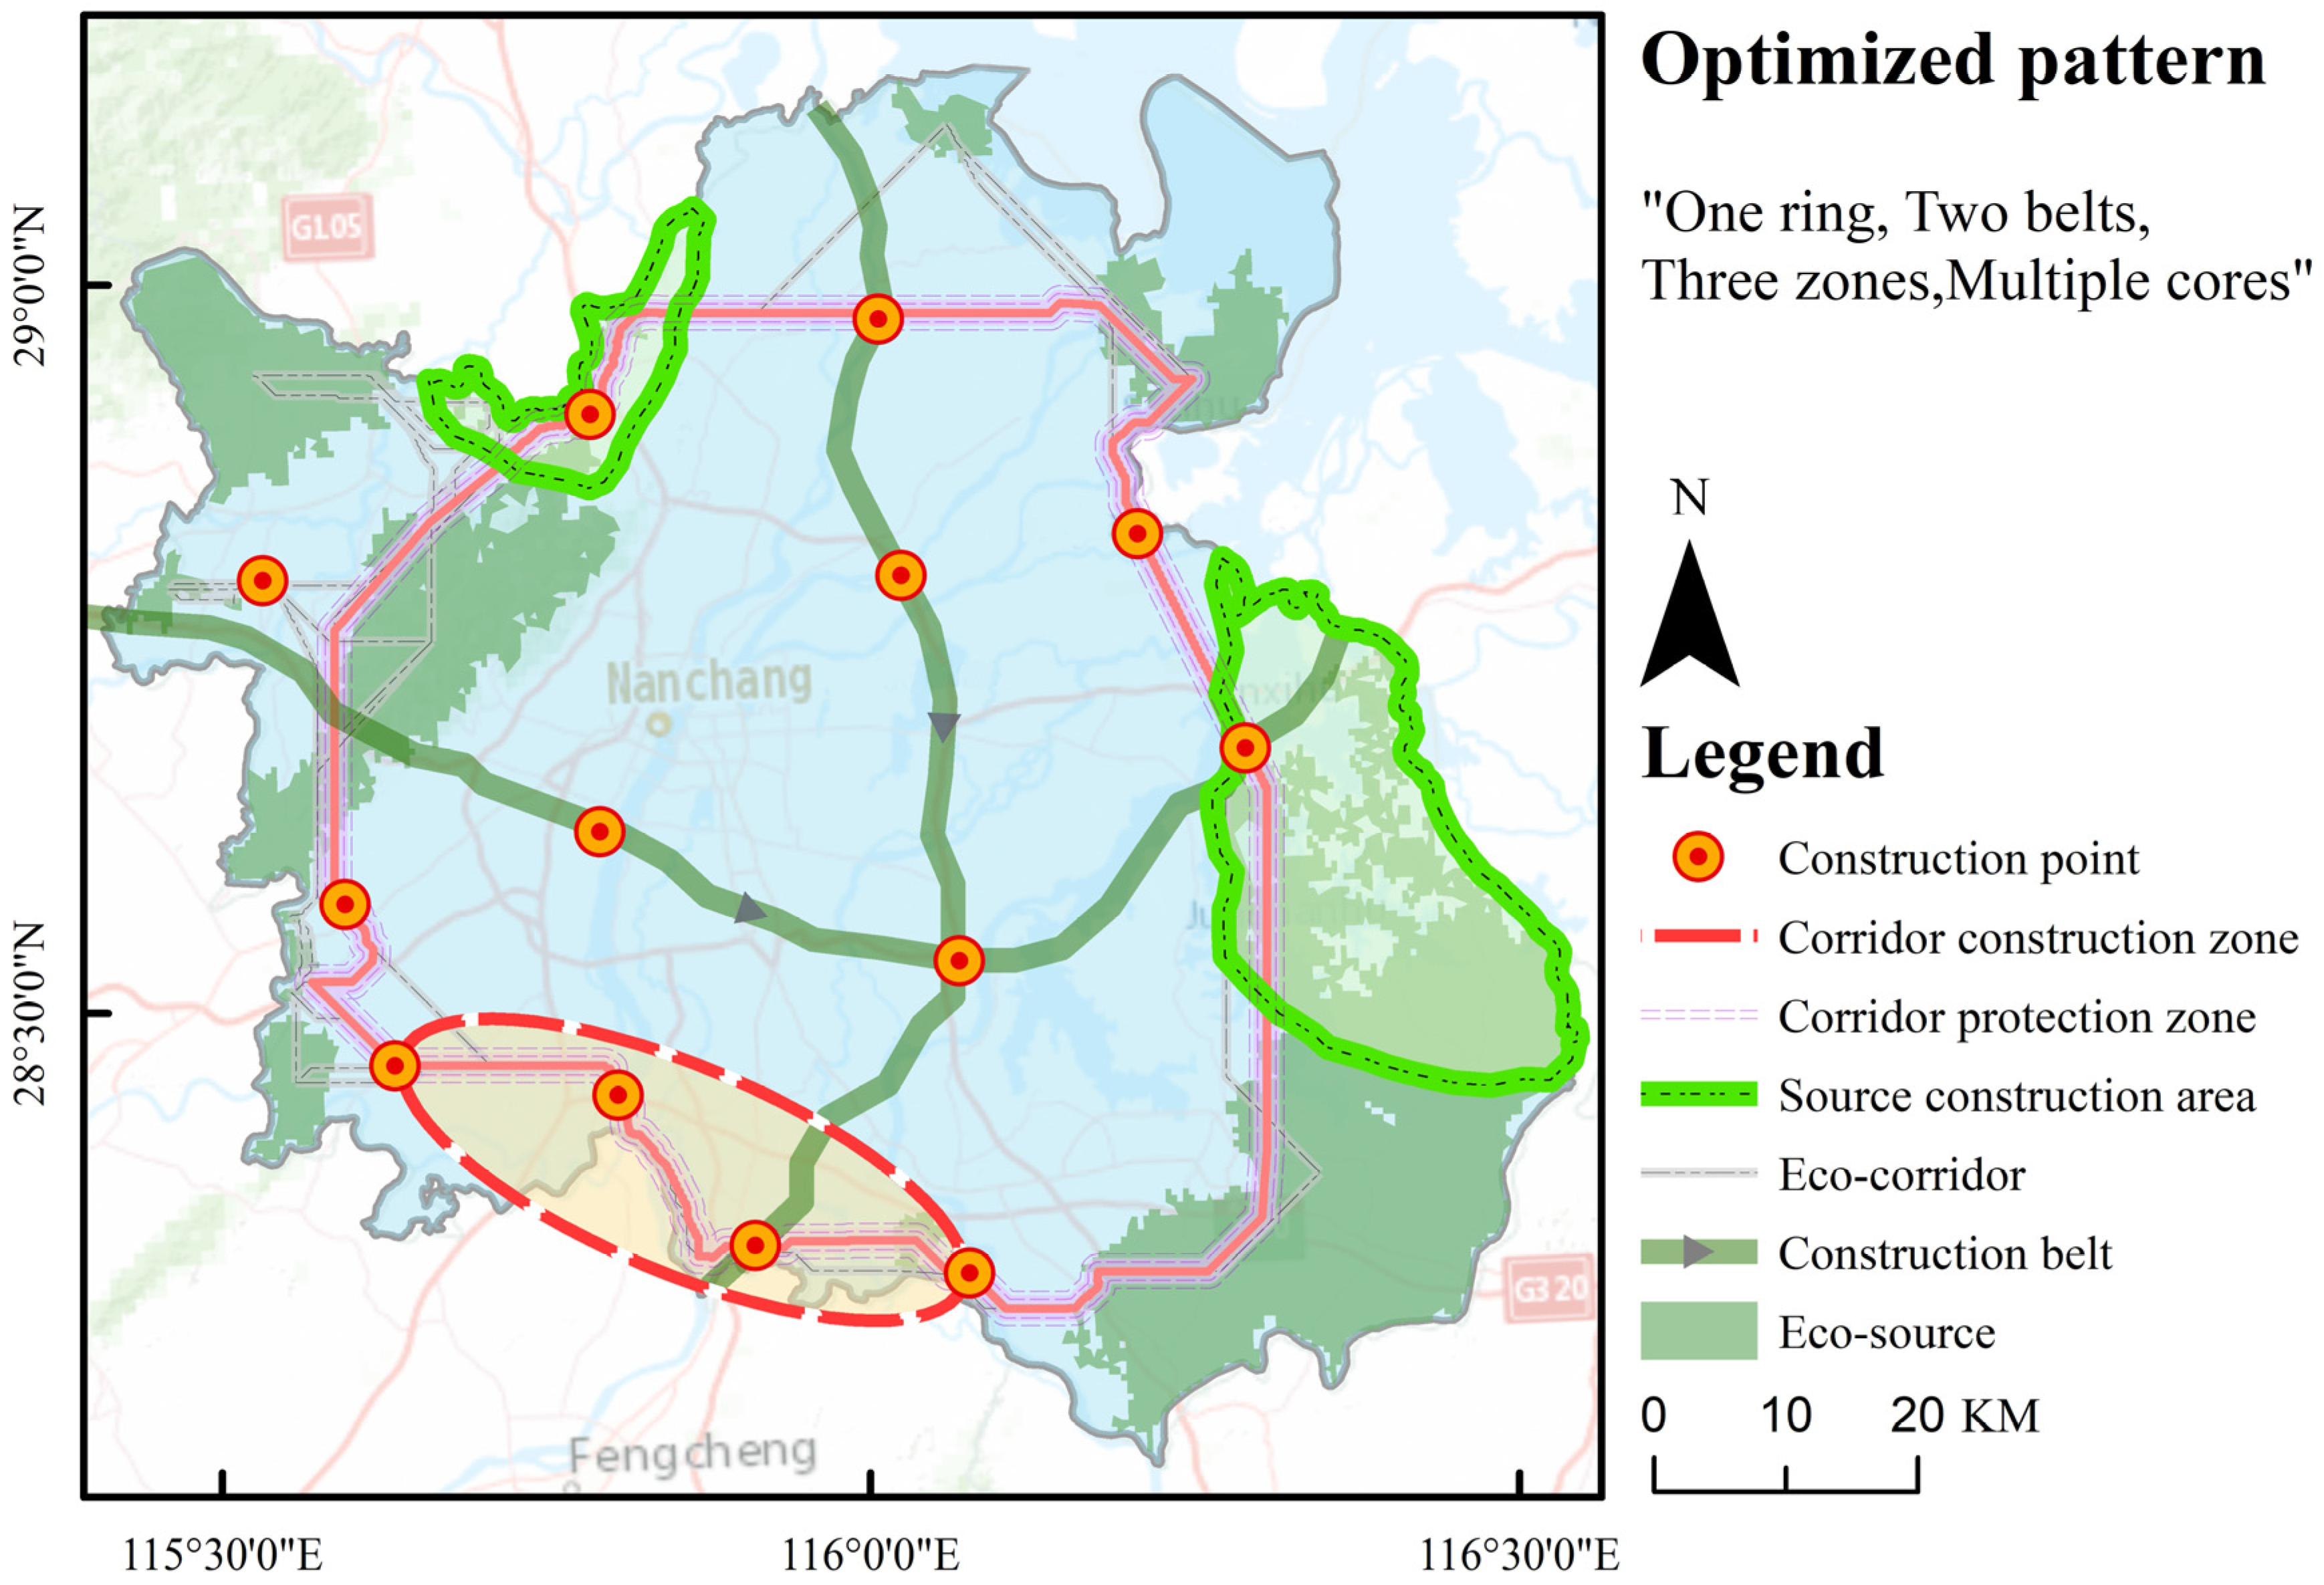
The expansion of ecological connectivity between identified Ecosources can be facilitated by a range of natural factors, including higher vegetation coverage, more complex terrain, greater distance from roads, and proximity to water. While natural factors play a fundamental role in establishing Ecosources, human activities influence connectivity among these sources. The resulting ecological resistance was categorized into five levels using a natural breaks classification in Figure 9. The larger the value of ecological resistance, the greater the obstacles encountered by species during migration between different landscape units. Areas with high ecological resistance value may encounter problems such as habitat fragmentation and barriers to species migration within the ecosystem, necessitating the implementation of corresponding conservation and restoration measures to alleviate ecological pressure and ensure ecological security. The findings demonstrated a clear pattern of ecological resistance clustering within Nanchang City, with the higher ecological resistance value concentrated in the central area, while the surrounding regions exhibited a lower ecological resistance value.
The longer the length of an Ecocorridor, the more it generally signifies enhanced ecological connectivity and a healthier ecosystem, contributing to the maintenance of a stable ESP. A total of 41 Ecocorridors, spanning 2170.54 km, were extracted within Nanchang City (Figure 10). The distribution of these corridors exhibited distinct patterns of “islands” and spatial heterogeneity. They were predominantly situated in suburban areas, distanced from urban developed regions, mainly concentrated in the border areas of Xinjian County, Anyi County, and Poyang Lake. Woodland and grassland served as the dominant landuse types within these corridors, characterized by landscape continuity. “Islands” refers to the absence of Ecocorridors, particularly evident in economically prosperous and heavily urbanized regions. On the one hand, rapid urbanization processes have resulted in diminished ESF and reduced landscape connectivity in these regions, leading to the loss of Ecosources. On the other hand, the “island” areas predominantly consisted of construction land characterized by high population density and low vegetation coverage, resulting in a concentration of comprehensive resistance that inhibits the formation of Ecocorridors. Furthermore, an analysis of corridor lengths revealed the identification of six corridors spanning 100 km or more, with the top three corridors measuring 227.25 km, 205.78 km, and 188.96 km, in that order. Given that organisms face challenges in undertaking prolonged migrations along extensive corridors, it becomes imperative to establish temporary resting points within these longer Ecocorridors to support the ecosystem’s sustainable development. The notable absence of Ecocorridors in economically developed and highly urbanized regions in the study area underscores the significance of protecting and restoring these corridors during planning and construction, creating suitable migration pathways for organisms. Establishing appropriate resting points along extended Ecocorridors also contributes to preserving biodiversity and fosters the healthy development of the ecosystem.

4.5. Nanchang’s ESP

In this study, we utilized circuit theory to extract 122 Econodes, which included ecological pinch points and barrier points. A total of 64 ecological pinch points were extracted, totaling 23.71 km2, with the largest area measuring 7.65 km2. The landuse types of these pinch points were predominantly characterized by farmland, construction land, and water. In terms of spatial distribution, they were mostly situated at the junctions of corridors, particularly concentrated in the southern region of Nanchang, forming a corridor-like structure. The formation of these pinch points can be attributed to the high incidence of biological movement in this area, coupled with the presence of high-resistance landscapes such as farmland in the surrounding areas, resulting in their compression into narrow areas. Moreover, we extracted 58 ecological barrier points, totaling 111.73 km2, with the largest area measuring 15.25 km2. The dominant landuse types within these barrier points included farmland, woodland, and water. These ecological barrier points were mostly located at overlapping sections of corridors, primarily in Nanchang’s western region, forming a belt-like structure.
Based on the “Ecosources–Ecocorridors–Econodes” structure, the ESP was formed as shown in Figure 11. There were 15 Ecosources, 41 corridors, and 122 Econodes. The spatial distribution of Ecosources showed that they were mostly concentrated in the eastern and western regions of Nanchang. Ecocorridors were found to be mainly located near the boundaries of Nanchang, covering Xinjian County, Anyi County, and the border of Poyang Lake, which are geographically far from the metropolitan centers. The distribution of Ecocorridors can connect these suburbs’ natural resources and ecological functions to form a complete and sustainable ecological network. An interesting pattern is evident from the spatial distribution of Econodes, with most nodes clustered in the overlapping areas of Ecocorridors, specifically in the southern and western parts of Nanchang. This band-shaped distribution pattern and the highly aggregated characteristics are vital for maintaining the connectivity and functionality of the ecosystem. By selecting Econodes concentrated at the overlapping areas of Ecocorridors, migration and communication among species can be maximized. This enables species to move more conveniently between different habitats, enhancing the resilience and adaptability of the ecosystem. Additionally, the evaluation of “EEL” identified an obvious phenomenon in Nanchang City’s Ecosource network. The central area of the city is undergoing significant urbanization, resulting in low ESF, high ecological sensitivity, and low landscape connectivity, with no Ecosources or corridors, forming “islands”. This phenomenon poses a challenge to Nanchang City’s Ecosource network. Due to the significant urbanization in the central area, human activities have put a heightened strain on the ecological environment, damaging and weakening the ecosystem’s functions. This situation has resulted in a depletion of ecosystem services, heightened ecological vulnerability, and diminished connectedness within the regional environment. The absence of Ecosources and Ecocorridors restricts species’ migration and disturbs ecological processes, influencing the ecosystem’s stability and health.

5. Discussion

5.1. Process of Urbanization

The rapid and unplanned expansion of cities presents a global challenge, leading to various ecological issues such as excessive natural resource exploitation, ecological land fragmentation, and declining ecological functions [56,57]. This phenomenon diminishes the supply of ecosystem services in urban areas and disrupts energy flow and connectivity in surrounding ecosystems [58]. From 1990 to 2020, Nanchang underwent rapid and unprecedented economic development, resulting in significant urbanization [59]. As depicted in Figure 12, the construction land area increased by 494.26 km2, which constituted 6.87% of Nanchang. Natural ecosystems like farmland, woodland, and wetlands were extensively converted for urban construction, reducing land resources and fragmented ecosystems. Land scarcity further challenges food security and sustainable agricultural development, ultimately causing ecological disequilibrium and undermining human well-being. The primary emphasis of urbanization was mostly centered on the urban regions of Nanchang City and Nanchang County [60]. This preference stems from Nanchang County’s favorable flat terrain and natural advantages compared to Xinjian County in the western part of Nanchang. Xinjian County covers an area of 143.58 km2 with high vegetation coverage and substantial development. However, due to the lack of consideration for ecological sustainability during the development process, the ESF of Xinjian County is significantly lower than that of neighboring areas, as shown in Figure 5. The key issues arising from urbanization include converting natural ecosystems, reducing land resources, and declining ecosystem services’ value [59]. Most of the urbanization occurs in the urban regions of Nanchang’s center and Nanchang County. At the same time, the ecosystem value in Xinjian County was found to be notably lower than that in the surrounding areas due to its topographic advantages and high development level. The introduction of the major strategic initiative of “vigorous promotion of ecological civilization construction” emphasizes the need to control the intensity of urban development and prevent uncontrolled expansion resembling a “pancake effect” in cities. Therefore, researching urban expansion and heterogeneous changes in the ecological landscape has significant practical implications for understanding the negative impacts of urban expansion and proposing decisions to promote sustainable development [61]. That also indicates that long-term city development should be a comprehensive process, considering the impact of development on natural ecosystems, to ensure sustainable urban development.

5.2. Evaluation of ESP

The construction of an ESP in Nanchang City significantly contributes to identifying and preserving crucial ecological spaces. The ESP plays an instrumental part in facilitating the coordinated development of social systems and ecosystems by improving the service function of the regional ecosystem and safeguarding biodiversity conservation [25,34]. To construct a scientifically sound ESP, we improved the methodology in identifying Ecosources, correcting resistance surface, and extracting important corridors. Prior studies conducted by some researchers have mostly concentrated on extracting Ecosources. And these studies used several methodologies, including the MCR model, morphological spatial pattern analysis, ESF evaluation, and ecological sensitivity assessment [15,62]. This enables the selection of sources that maintain ecosystem service functions and exhibit high resistance to external disturbances. Also, to address the issue of fragmentation and small patches in the landscape, this study combined landscape patterns with indices to quantitatively identify large high-value aggregation areas [63]. Unlike subjective threshold settings commonly used in previous studies, this method protects significant spatial areas for ecosystem services and highly sensitive ecological environments. Consequently, it dramatically enhances overall stability and integrity. In constructing ecological resistance surface, most studies have used empirical allocation based on landuse types or modifying resistance values using natural environmental data. Nevertheless, these approaches lack consideration of the dynamic impacts of species migration characteristics and the intensity of human activities. This study employed multiple static factors such as landuse types, elevation, and FVC to establish initial natural resistance surface. We then incorporated nighttime light data to represent large-scale human dynamic activities and made necessary corrections. It overcomes the limitations associated with traditional data and provides a more accurate distribution of resistance values by ensuring that the spatial expression of human activities is concrete and objective. Numerous potential corridors were simulated using the MCR model, resulting in an intertwined spatial distribution pattern. To reduce redundancy and future construction costs, we adopted the gravity model to quantitatively calculate the interaction intensity between Ecosources. The process involves classifying corridors into two categories by considering their level of interaction intensity and removing those that are redundant or have limited potential. Overall, this study proposes a robust and comprehensive approach to constructing an ESP in urban areas, which can effectively integrate ESF, ecological sensitivity, and landscape connectivity into urban planning and decision making.

5.3. Optimization of ESP

Optimizing the ESP plays a macro-control role in the regional ecological environment and economic development, which is conducive to regional coordinated and sustainable development. In March 2021, the “optimize the spatial structure within urban agglomerations and build them into multi-center, multi-level, and multi-node networks for improving ecological security barriers” was proposed by China. Enhancing ecological functions in urban clusters and metropolitan areas guides the construction of green ecological city clusters and high-quality ecological modern metropolitan areas. It is evident that scientifically and comprehensively optimizing the ESP has significant implications.
Nanchang has had significant and quick development in several domains, encompassing the realms of economics, society, and culture. The advancement may be attributed to the ongoing and extensive implementation of the reform and opening-up policies. However, it is essential to acknowledge the environmental issues that have arisen with urbanization. These include landscape continuity and ecological damage, which have become major obstacles to the sustainable development of Nanchang. The central region has experienced “negative” phenomena in ecosystem services, severe landscape fragmentation, and poor connectivity [34,39,55,64]. Therefore, Nanchang urgently needs to strengthen ecological environmental protection, optimize the regional ESP, scientifically plan and manage ecological resources, and achieve sustainable urban development. Considering the current situation facing Nanchang, the strategy of “one ring, two belts, three zones, and multiple nodes” is proposed for protection and restoration, as shown in Figure 13. Specialty, the “one ring” refers to the circular Ecocorridor surrounding the study area, which connects different ecosystems and maintains ecological processes. It should maintain as complete landscape connectivity as possible, avoiding fragmentation caused by human activities or infrastructure. The original vegetation and natural landscapes of the “one ring” should be protected and restored to provide suitable animal habitats and food resources. The “one ring” mainly consists of agricultural landuse types. Measures such as crop rotation, restrictions on fertilizers and pesticides, and ecological urban planning should be implemented to reduce the negative impact on the Ecocorridor and promote the ecologicalization and sustainable development of surrounding land. Meanwhile, destructive human activities that disturb the Ecocorridor, such as mining, construction, and agricultural expansion, should be restricted. For Nanchang’s central area, where urbanization is evident but lacks Ecosources, the “two belts” restoration policy is proposed to restore and rebuild Ecocorridors. Considering construction costs and other factors, the “two belts” are mainly located near rivers and are characterized by barren landscapes, which have the advantages of low restoration costs and high feasibility. Restoration work in the “two belts” region includes vegetation restoration, soil remediation, and water resource management. By introducing suitable plant species, controlling invasive species, and improving soil quality, the ecological function of the corridors can be rebuilt. In addition, it is necessary to establish effective management institutions and monitoring systems to inspect and assess the Ecocorridors regularly, promptly identify and solve problems, and ensure the continuous functioning of their ecological functions. Addressing the fragmentation and loss of Ecosources in the southern “one zone”, mainly farmland requires balancing agricultural production and the ecological environment. By implementing crop rotation and fallow systems, farmland use and fallow cycles should be reasonably arranged. This allows some farmland time to recover its ecological functions, reduce the pressure of continuous cultivation on the land, and improve the ecological quality of agricultural land. Introducing a network structure into farmland planting trees, such as deciduous shrubs and fruit trees, can create transitional areas between farmland and Ecosources. This way promotes the complementary relationship between farmland and natural ecosystems and enhances ecological functions and connectivity. Then, the “multiple nodes” represent particular areas within the ecosystem with high ecological sensitivity, are in the middle or intersection of corridors, and may be habitat barriers. These nodes are crucial in maintaining ecological balance, protecting species diversity, and sustaining ecological functions. As key ecosystem components, they are vulnerable to human activities, natural disasters, and climate change. Therefore, effective protection and management measures should be taken to ensure the ecosystem’s sustainable development, including establishing protected areas, building Ecocorridors, limiting human interference, and enhancing international cooperation and coordination to jointly protect these important Econodes and maintain their ecological functions effectively. The strategy of “one ring, two belts, three zones, and multiple nodes” for protection and restoration is tailored to the topography and environmental characteristics of the study area, taking into consideration reconstruction costs. This strategy provides policy directions for the existing ESP of Nanchang. Gaining a comprehensive comprehension of ecological security and advocating for the harmonious development of urbanization and ecological preservation has immense importance.

5.4. Limitations and Future Work

This study employed an integrated approach that combines ESF, ecological sensitivity, and landscape indicators to identify Ecosources. Furthermore, the natural resistance surface was modified to incorporate human activities, allowing for the extraction of Ecocorridors. A scientifically sound and reasonable ESP was constructed for Nanchang City, providing essential spatial guidance for shaping the national land spatial pattern at a macro scale and ensuring regional ecological protection. Nonetheless, this study has several limitations. First, due to data availability and modeling techniques, only four types of ecosystem services that are significant and spatially feasible in Nanchang City were considered in our work. Considering the context of rapid urbanization and global climate change, it may be possible to include the assessment of climate-responsive services and human recreational service systems in future works. Additionally, the ecosystem has a characteristic of regional complexity and cross-scale dynamics, leading to unclear boundaries in ecosystems. Thus, future studies could focus on the following aspects. (1) Overall optimization and refinement of ecosystem service indicators would be conducted by assessing ecosystem balance and interdependence. (2) Improvements could be made to the existing InVEST model; despite its maturity, specific parameters still possess subjectivity. In addition, it is essential to strengthen field testing and refine the evaluation model accordingly. (3) This study primarily focused on constructing an ESP within the study area. Future work would adopt a more comprehensive approach, considering ecological security from local and cross-regional perspectives. In summary, further work would employ a regional coordination perspective to enhance the overall understanding of environmental security. By addressing these aspects in future work, researchers can develop a more comprehensive and robust understanding of ecological patterns and processes can be achieved, facilitating effective environmental management and decision making.

6. Conclusions

In this study, we constructed an evaluation system by incorporating the “ecosystem service function–ecological sensitivity–landscape connectivity” based on the theory of sustainability, stability, and integrity of ecosystems. On this basis, we focused on constructing the ecosystem service system of Nanchang City in the process of rapid urbanization by applying the MCR model and other related theories and methods. The main conclusions are as follows:
(1) From 1990 to 2020, Nanchang City underwent significant urbanization, resulting in a considerable increase of 494.26 km2 in construction. Conversely, farmland decreased by 592.87 km2. Additionally, grassland and barren experienced a reduction of 22.46 km2 and 9.01 km2, respectively. The period from 2000 to 2010 exhibited the most rapid development in the past 30 years.
(2) A distinct spatial differentiation pattern in ecosystem services was observed across Nanchang City, displaying an overall trend of “medium-low surrounding high”. The ecological sensitivity rating for the study area was found to be predominantly low or slightly low sensitivity. However, high and exe-high sensitive areas were primarily concentrated in the Meiling Mountains, demonstrating an aggregated spatial distribution.
(3) By constructing the ESP of Nanchang, 15 Ecosources were identified, covering an area of 1695.90 km2. In addition, 41 Ecocorridors with a length of 2170.54 km were extracted. These Ecosources and Ecocorridors were clearly “islands”. In addition, 122 Econodes were extracted in our study. These nodes were mainly distributed on the corridors near the Ecosources and had the spatial distribution characteristics of strong aggregation.
(4) By considering both conservation and modification costs, we integrated Ecosources, corridors, and nodes to establish Nanchang’s ESP. We proposed a management pattern of “one ring, two belts, three zones, and multiple nodes”. In addition, we also incorporated the Gan River shoreline in our corridor protection efforts, where it was designated as an essential river Ecocorridor. This study provides critical theoretical support for decision-makers as they formulate the development plan for Nanchang City, balancing economic capacity with green ecological development.

Author Contributions

D.G.: writing—original draft, data curation, formal analysis, investigation, methodology, software, conceptualization, and visualization. M.H.: writing—original draft, investigation, methodology, conceptualization, and funding acquisition. H.L.: writing—review and editing. All authors have read and agreed to the published version of the manuscript.

Funding

This work was supported by the National Nature Science Foundation of China (NSFC) program (No. 42201438), the Youth Program of Major Discipline Academic and Technical Leaders Training Program of Jiangxi Talents Supporting Project (No. 20232BCJ23086), and the Opening Fund of Key Laboratory of Poyang Lake Wetland and Watershed Research (Jiangxi Normal University), Ministry of Education (No. PK2022001).

Data Availability Statement

The data presented in this study are cited within the article.

Acknowledgments

We appreciate the constructive suggestions and comments from the editor and anonymous reviewers.

Conflicts of Interest

The authors declare no conflict of interest.

References

  1. Vaz, S.; Manes, S.; Khattar, G.; Mendes, M.; Silveira, L.; Mendes, E.; Rodrigues, E.D.; Gama-Maia, D.; Lorini, M.L.; Macedo, M.; et al. Global meta-analysis of urbanization stressors on insect abundance, richness, and traits. Sci. Total Environ. 2023, 903, 165967. [Google Scholar] [CrossRef]
  2. Gao, Y.Y.; Wang, S.T.; Zhang, C.X.; Xing, C.Z.; Tan, W.; Wu, H.Y.; Niu, X.H.; Liu, C. Assessing the impact of urban form and urbanization process on tropospheric nitrogen dioxide pollution in the Yangtze River Delta, China. Environ. Pollut. 2023, 336, 122436. [Google Scholar] [CrossRef]
  3. Yu, G.T.; Liu, T.W.; Wang, Q.; Li, T.; Li, X.J.; Song, G.H.; Feng, Y.G. Impact of Land Use/Land Cover Change on Ecological Quality during Urbanization in the Lower Yellow River Basin: A Case Study of Jinan City. Remote Sens. 2022, 14, 6273. [Google Scholar] [CrossRef]
  4. Li, Z.Z.; Hu, B.A.; Ren, Y.F. The Supply-Demand Budgets of Ecosystem Service Response to Urbanization: Insights from Urban-Rural Gradient and Major Function-Oriented Areas. Remote Sens. 2022, 14, 5670. [Google Scholar] [CrossRef]
  5. Qiao, W.Y.; Huang, X.J. The impact of land urbanization on ecosystem health in the Yangtze River Delta urban agglomerations, China. Cities 2022, 130, 103981. [Google Scholar] [CrossRef]
  6. Hahs, A.K.; Fournier, B.; Aronson, M.F.J.; Nilon, C.H.; Herrera-Montes, A.; Salisbury, A.B.; Threlfall, C.G.; Rega-Brodsky, C.C.; Lepczyk, C.A.; La Sorte, F.A.; et al. Urbanisation generates multiple trait syndromes for terrestrial animal taxa worldwide. Nat. Commun. 2023, 14, 4751. [Google Scholar] [CrossRef] [PubMed]
  7. Grossman, D. We are killing this ecosystem’: The scientists tracking the Amazon’s fading health. Nature 2023, 620, 712–716. [Google Scholar] [CrossRef] [PubMed]
  8. Zhang, R.; Wang, C.L.; Xiong, Y.C. Ecological security assessment of China based on the Pressure-State-Response framework. Ecol. Indic. 2023, 154, 110647. [Google Scholar] [CrossRef]
  9. Liu, B.; Zhang, F.L.; Qin, X.S.; Wu, Z.; Wang, X.L.; He, Y.Y. Spatiotemporal assessment of water security in China: An integrated supply-demand coupling model. J. Clean. Prod. 2021, 321, 128955. [Google Scholar] [CrossRef]
  10. Yi, D.; Guo, X.; Han, Y.; Guo, J.; Ou, M.H.; Zhao, X.M. Coupling Ecological Security Pattern Establishment and Construction Land Expansion Simulation for Urban Growth Boundary Delineation: Framework and Application. Land 2022, 11, 359. [Google Scholar] [CrossRef]
  11. Gao, M.H.; Li, C.; Zhao, J.; Zhao, H. Identification of ecological security pattern based on ecosystem service supply and demand in the Yangtze River Delta, China. Geocarto Int. 2023, 38, 2252787. [Google Scholar] [CrossRef]
  12. Mathys, A.S.; van Vianen, J.; Rowland, D.; Narulita, S.; Palomo, I.; Pascual, U.; Sutherland, I.J.; Ahammad, R.; Sunderland, T. Participatory mapping of ecosystem services across a gradient of agricultural intensification in West Kalimantan, Indonesia. Ecosyst. People 2023, 19, 2174685. [Google Scholar] [CrossRef]
  13. Sadeghi, S.H.; Silabi, M.Z.; Sadrabad, H.S.; Riahi, M.; Tabatabaei, S.M. Watershed health and ecological security modeling using anthropogenic, hydrologic, and climatic factors. Nat. Resour. Model. 2023, 36, e12371. [Google Scholar] [CrossRef]
  14. Tang, H.J.; Hou, K.; Wu, S.Q.; Liu, J.W.; Ma, L.X.; Li, X.X. Interpretation of the coupling mechanism of ecological security and urbanization based on a Computation-Verification-Coupling framework: Quantitative analysis of sustainable development. Ecotoxicol. Environ. Saf. 2023, 263, 115294. [Google Scholar] [CrossRef] [PubMed]
  15. Liu, X.Y.; Su, Y.; Li, Z.G.; Zhang, S. Constructing ecological security patterns based on ecosystem services trade-offs and ecological sensitivity: A case study of Shenzhen metropolitan area, China. Ecol. Indic. 2023, 154, 110626. [Google Scholar] [CrossRef]
  16. Li, Y.M.; Zhao, J.Z.; Yuan, J.; Ji, P.K.; Deng, X.L.; Yang, Y.M. Constructing the Ecological Security Pattern of Nujiang Prefecture Based on the Framework of “Importance-Sensitivity-Connectivity”. Int. J. Environ. Res. Public Health 2022, 19, 10869. [Google Scholar] [CrossRef] [PubMed]
  17. Nie, W.B.; Xu, B.; Yang, F.; Shi, Y.; Liu, B.T.; Wu, R.W.; Lin, W.; Pei, H.; Bao, Z.Y. Simulating future land use by coupling ecological security patterns and multiple scenarios. Sci. Total Environ. 2023, 859, 160262. [Google Scholar] [CrossRef] [PubMed]
  18. Cao, X.F.; Liu, Z.S.; Li, S.J.; Gao, Z.J. Integrating the Ecological Security Pattern and the PLUS Model to Assess the Effects of Regional Ecological Restoration: A Case Study of Hefei City, Anhui Province. Int. J. Environ. Res. Public Health 2022, 19, 6640. [Google Scholar] [CrossRef] [PubMed]
  19. Chen, Z.Z.; Huang, M.; Zhu, D.Y.; Altan, O. Integrating Remote Sensing and a Markov-FLUS Model to Simulate Future Land Use Changes in Hokkaido, Japan. Remote Sens. 2021, 13, 2621. [Google Scholar] [CrossRef]
  20. Kang, J.M.; Zhang, X.; Zhu, X.W.; Zhang, B.L. Ecological security pattern: A new idea for balancing regional development and ecological protection. A case study of the Jiaodong Peninsula, China. Glob. Ecol. Conserv. 2021, 26, e01472. [Google Scholar] [CrossRef]
  21. Huang, J.F.; Wang, R.H.; Zhang, H.Z. Analysis of patterns and ecological security trend of modern oasis landscapes in Xinjiang, China. Environ. Monit. Assess. 2007, 134, 411–419. [Google Scholar] [CrossRef] [PubMed]
  22. Wei, H.; Zhu, H.; Chen, J.; Jiao, H.Y.; Li, P.H.; Xiong, L.Y. Construction and Optimization of Ecological Security Pattern in the Loess Plateau of China Based on the Minimum Cumulative Resistance (MCR) Model. Remote Sens. 2022, 14, 5906. [Google Scholar] [CrossRef]
  23. Peng, J.; Yang, Y.; Liu, Y.X.; Hu, Y.N.; Du, Y.Y.; Meersmans, J.; Qiu, S.J. Linking ecosystem services and circuit theory to identify ecological security patterns. Sci. Total Environ. 2018, 644, 781–790. [Google Scholar] [CrossRef] [PubMed]
  24. Yu, H.R.; Gu, X.C.; Liu, G.H.; Fan, X.; Zhao, Q.; Zhang, Q. Construction of Regional Ecological Security Patterns Based on Multi-Criteria Decision Making and Circuit Theory. Remote Sens. 2022, 14, 527. [Google Scholar] [CrossRef]
  25. Cui, X.F.; Deng, W.; Yang, J.X.; Huang, W.; de Vries, W.T. Construction and optimization of ecological security patterns based on social equity perspective: A case study in Wuhan, China. Ecol. Indic. 2022, 136, 108714. [Google Scholar] [CrossRef]
  26. Jin, L.J.; Xu, Q.L.; Yi, J.H.; Zhong, X.C. Integrating CVOR-GWLR-Circuit model into construction of ecological security pattern in Yunnan Province, China. Environ. Sci. Pollut. Res. 2022, 29, 81520–81545. [Google Scholar] [CrossRef]
  27. Tang, B.T.; Wang, H.; Peng, L.X.; Wang, Z.Z.; Liu, J.M.; Zhang, L.W.; Jiao, L. Integrating ecosystem organization, quality and services indicators in the ecological security assessment. Land Degrad. Dev. 2023, 34, 4561–4574. [Google Scholar] [CrossRef]
  28. Wang, L.; Chang, J.X.; He, B.; Guo, A.J.; Wang, Y.M. Analysis of oasis land ecological security and influencing factors in arid areas. Land Degrad. Dev. 2023, 34, 3550–3567. [Google Scholar] [CrossRef]
  29. Liang, Y.Q.; Liu, H.Y.; Chiaka, J.C.; Jiang, C.T.; Wei, N.N.; Liang, Y.H. Spatiotemporal patterns and driving mechanism of tourism ecological security in Guangxi, China. Front. Ecol. Evol. 2023, 11, 1163498. [Google Scholar] [CrossRef]
  30. Zhang, Z.; Hu, B.Q.; Jiang, W.G.; Qiu, H.H. Construction of ecological security pattern based on ecological carrying capacity assessment 1990–2040: A case study of the Southwest Guangxi Karst- Beibu Gulf. Ecol. Model. 2023, 479, 110322. [Google Scholar] [CrossRef]
  31. Zeng, Y.F.; Meng, S.H.; Wu, Q.; Mei, A.S.; Bu, W.Y. Ecological water security impact of large coal base development and its protection. J. Hydrol. 2023, 619, 129319. [Google Scholar] [CrossRef]
  32. Zhang, Y.X.; Ma, Y.G.; Xu, Z.L. Construction of ecological security patterns based on multi-scenario simulations in arid and semi-arid areas in Northwest China. Int. J. Sust. Dev. World 2023, 30, 699–712. [Google Scholar] [CrossRef]
  33. Jia, Q.Q.; Jiao, L.M.; Lian, X.H.; Wang, W.L. Linking supply-demand balance of ecosystem services to identify ecological security patterns in urban agglomerations. Sustain. Cities Soc. 2023, 92, 104497. [Google Scholar] [CrossRef]
  34. Wang, C.X.; Yu, C.Y.; Chen, T.Q.; Feng, Z.; Hu, Y.C.; Wu, K.N. Can the establishment of ecological security patterns improve ecological protection? An example of Nanchang, China. Sci. Total Environ. 2020, 740, 140051. [Google Scholar] [CrossRef] [PubMed]
  35. Lai, X.Y.; Yu, H.R.; Liu, G.H.; Zhang, X.X.; Feng, Y.; Ji, Y.W.; Zhao, Q.; Jiang, J.Y.; Gu, X.C. Construction and Analysis of Ecological Security Patterns in the Southern Anhui Region of China from a Circuit Theory Perspective. Remote Sens. 2023, 15, 1385. [Google Scholar] [CrossRef]
  36. Lu, T.; Li, C.J.; Zhou, W.X.; Liu, Y.X. Fuzzy Assessment of Ecological Security on the Qinghai-Tibet Plateau Based on Pressure-State-Response Framework. Remote Sens. 2023, 15, 1293. [Google Scholar] [CrossRef]
  37. Wang, S.R.; Song, Q.; Zhao, J.Y.; Lu, Z.B.; Zhang, H.X. Identification of Key Areas and Early-Warning Points for Ecological Protection and Restoration in the Yellow River Source Area Based on Ecological Security Pattern. Land 2023, 12, 1643. [Google Scholar] [CrossRef]
  38. Zhang, H.B.; Yan, Q.Q.; Xie, F.F.; Ma, S.C. Evaluation and Prediction of Landscape Ecological Security Based on a CA-Markov Model in Overlapped Area of Crop and Coal Production. Land 2023, 12, 207. [Google Scholar] [CrossRef]
  39. Yang, X.F.; Cai, H.S.; Zhang, X.L.; Zuo, T.Y.; Chen, L.T. Spatial-temporal evolution of ecosystem service value and its driving factors in the Great Nanchang Metropolitan Area. Chin. J. Ecol. 2023, 1–13. Available online: https://kns.cnki.net/kcms2/detail/21.1148.Q.20230606.1534.008.html (accessed on 23 April 2023).
  40. Hu, C.G.; Wang, Z.Y.; Huang, G.L.; Ding, Y.C. Construction, Evaluation, and Optimization of a Regional Ecological Security Pattern Based on MSPA-Circuit Theory Approach. Int. J. Environ. Res. Public Health 2022, 19, 16184. [Google Scholar] [CrossRef]
  41. Wu, Y.D.; Han, Z.Y.; Meng, J.J.; Zhu, L.K. Circuit theory-based ecological security pattern could promote ecological protection in the Heihe River Basin of China. Environ. Sci. Pollut. Res. 2023, 30, 27340–27356. [Google Scholar] [CrossRef] [PubMed]
  42. Wang, S.; Wu, M.Q.; Hu, M.M.; Xia, B.C. Integrating ecosystem services and landscape connectivity into the optimization of ecological security pattern: A case study of the Pearl River Delta, China. Environ. Sci. Pollut. Res. 2022, 29, 76051–76065. [Google Scholar] [CrossRef] [PubMed]
  43. Zhang, Y.L.; Zhao, Z.Y.; Yang, Y.Y.; Fu, B.J.; Ma, R.M.; Lue, Y.H.; Wu, X. Identifying ecological security patterns based on the supply, demand and sensitivity of ecosystem service: A case study in the Yellow River Basin, China. J. Environ. Manag. 2022, 315, 115158. [Google Scholar] [CrossRef] [PubMed]
  44. Hu, Q.; Huang, H.P.; Kung, C.C. Ecological impact assessment of land use in eco-industrial park based on life cycle assessment: A case study of Nanchang High-tech development zone in China. J. Clean. Prod. 2021, 300, 126816. [Google Scholar] [CrossRef]
  45. Huang, M.; Gong, D.H.; Lin, H.; Hu, B.S.; Chen, J.H.; Xiao, C.J.; Luo, J.; Qi, S.H.; Altan, O. Does COVID-19 Affect the Accessibility of Outdoor Sports Venues? A Case Study in Nanchang, China. Land 2023, 12, 158. [Google Scholar] [CrossRef]
  46. Wang, W.Q.; Xu, Q.Q.; Xia, G.L.; Dong, X.; Bao, C.K. Constructing a paradigm of environmental impact assessment under the new era of ecological civilization in China. Environ. Impact Assess. Rev. 2023, 99, 107021. [Google Scholar] [CrossRef]
  47. Cai, C.Y.M.; Huang, F.; Yang, Y.Y.; Yu, S.Q.; Wang, S.J.; Fan, Y.L.; Wang, Q.; Liu, W. Effects of Glomalin-Related Soil Protein Driven by Root on Forest Soil Aggregate Stability and Carbon Sequestration during Urbanization in Nanchang, China. Plants 2023, 12, 1847. [Google Scholar] [CrossRef]
  48. Meng, B.; Wang, X.X.; Zhang, Z.F.; Huang, P. Spatio-Temporal Pattern and Driving Force Evolution of Cultivated Land Occupied by Urban Expansion in the Chengdu Metropolitan Area. Land 2022, 11, 1458. [Google Scholar] [CrossRef]
  49. Jian, Y.K. Landscape ecological security patterns in biological conservation. Acta Ecol. Sin. 1999, 19, 8–15. [Google Scholar]
  50. Lv, L.; Zhang, S.H.; Zhu, J.; Wang, Z.M.; Wang, Z.; Li, G.Q.; Yang, C. Ecological Restoration Strategies for Mountainous Cities Based on Ecological Security Patterns and Circuit Theory: A Case of Central Urban Areas in Chongqing, China. Int. J. Environ. Res. Public Health 2022, 19, 16505. [Google Scholar] [CrossRef]
  51. Zhang, Y.L.; Cao, Y.R.; Huang, Y.T.; Wu, J.Y. Integrating ecosystem services and complex network theory to construct and optimize ecological security patterns: A case study of Guangdong-Hong Kong-Macao Greater Bay Area, China. Environ. Sci. Pollut. Res. 2023, 30, 76891–76910. [Google Scholar] [CrossRef] [PubMed]
  52. Lai, S.H.; Sha, J.M.; Eladawy, A.; Li, X.M.; Wang, J.L.; Kurbanov, E.; Lin, Z.J.; Wu, L.B.; Han, R.; Su, Y.C. Evaluation of ecological security and ecological maintenance based on pressure-state-response (PSR) model, case study: Fuzhou city, China. Hum. Ecol. Risk Assess. 2022, 28, 734–761. [Google Scholar] [CrossRef]
  53. Fu, Y.H.; Huang, M.; Gong, D.H.; Lin, H.; Fan, Y.W.; Du, W.Y. Dynamic Simulation and Prediction of Carbon Storage Based on Land Use/Land Cover Change from 2000 to 2040: A Case Study of the Nanchang Urban Agglomeration. Remote Sens. 2023, 15, 4645. [Google Scholar] [CrossRef]
  54. Zhang, H.; Ye, C. Around Poyang Lake importance Evaluation of Ecological Protection and Spatial Pattern of Urban Agglomeration. Bull. Soil Water Conserv. 2023, 43, 224–234. [Google Scholar] [CrossRef]
  55. Zhao, L.; Wei, X.J.; Cheng, P.G.; Xie, M.R.; Wang, H.M. Analysis of landscape fragmentation and driving factors in greater Nanchang metropolitan area. Sci. Surv. Mapp. 2022, 47, 181–191, 223. [Google Scholar] [CrossRef]
  56. Li, Y.; Mi, W.J.; Ji, L.; He, Q.S.; Yang, P.H.; Xie, S.L.; Bi, Y.H. Urbanization and agriculture intensification jointly enlarge the spatial inequality of river water quality. Sci. Total Environ. 2023, 878, 162559. [Google Scholar] [CrossRef] [PubMed]
  57. Bindajam, A.A.; Mallick, J.; Hang, H.T. Assessing landscape fragmentation due to urbanization in English Bazar Municipality, Malda, India, using landscape metrics. Environ. Sci. Pollut. Res. 2023, 30, 68716–68731. [Google Scholar] [CrossRef]
  58. Cumming, G.S.; Buerkert, A.; Hoffmann, E.M.; Schlecht, E.; von Cramon-Taubadel, S.; Tscharntke, T. Implications of agricultural transitions and urbanization for ecosystem services. Nature 2014, 515, 50–57. [Google Scholar] [CrossRef]
  59. Hu, Y.C.; Liu, Y.; Yan, Z.Y. Research Regarding the Coupling and Coordination Relationship between New Urbanization and Ecosystem Services in Nanchang. Sustainability 2022, 14, 15041. [Google Scholar] [CrossRef]
  60. Michishita, R.; Jiang, Z.B.; Xu, B. Monitoring two decades of urbanization in the Poyang Lake area, China through spectral unmixing. Remote Sens. Environ. 2012, 117, 3–18. [Google Scholar] [CrossRef]
  61. Wang, Z.F. Evolving landscape-urbanization relationships in contemporary China. Landsc. Urban Plan. 2018, 171, 30–41. [Google Scholar] [CrossRef]
  62. Xiang, H.X.; Zhang, J.; Mao, D.H.; Wang, M.; Yu, F.D.; Wang, Z.M.; Li, H.Y. Optimizing ecological security patterns considering zonal vegetation distribution for regional sustainability. Ecol. Eng. 2023, 194, 107055. [Google Scholar] [CrossRef]
  63. Wu, W.J.; Zhao, S.; Guo, J.; Ou, M.H.; Ding, G.Q. Construction and optimization of ecological security pattern based on the circuit theory: A case study of Hohhot City. Environ. Sci. Pollut. Res. 2023, 30, 89597–89615. [Google Scholar] [CrossRef] [PubMed]
  64. Hu, X.; Fu, C. Dynamic Analysis of Ecological Service Function Value for Urban Green Space in Nanchang. Acta Agric. Univ. Jiangxiensis 2014, 36, 230–237. [Google Scholar] [CrossRef]
Figure 1. Location and topography of Nanchang.
Remotesensing 15 05728 g001
Figure 2. Research framework.
Remotesensing 15 05728 g002
Figure 3. The evaluation system of Ecosources.
Remotesensing 15 05728 g003
Figure 4. Landuse in Nanchang from 1990 to 2020.
Remotesensing 15 05728 g004
Figure 5. Variations in landuse area in Nanchang from 1990 to 2020.
Remotesensing 15 05728 g005
Figure 6. The Importance of ecosystem service function in Nanchang. The numbers in the figure indicate the different levels: 1 stands for unimportant, 3 stands for generally-important, 5 stands for moderately-important, 7 stands for important, and 9 stands for extremely-important.
Remotesensing 15 05728 g006
Figure 7. Ecological sensitivity evaluation in Nanchang.
Remotesensing 15 05728 g007
Figure 8. Ecosources in Nanchang City.
Remotesensing 15 05728 g008
Figure 9. The ecological resistance of Nanchang City.
Remotesensing 15 05728 g009
Figure 10. Ecocorridors in Nanchang City.
Remotesensing 15 05728 g010
Figure 11. The ESP of Nanchang City.
Remotesensing 15 05728 g011
Figure 12. The urbanization process of Nanchang City from 1990 to 2020.
Remotesensing 15 05728 g012
Figure 13. Optimization of ESP in Nanchang City.
Remotesensing 15 05728 g013
Table 1. Description of data used in this study.
TypeDataTimeDate TypeData Source
LanduseCLCD1990–2020Raster
(30 m)
https://www.globallandcover.com, accessed on 23 April 2023
Natural
factors
Elevation2020Raster
(30 m)
https://www.gscloud.cn,
accessed on 23 April 2023
Slope
Fractional vegetation coverLandsat satellite data,
accessed on 23 April 2023
Water system dataVectorhttps://www.tianditu.gov.cn,
accessed on 23 April 2023
River system data
Soil thickness and
soil structure
Raster
(1 km)
http://www.cnern.org.cn,
accessed on 23 April 2023
Potential
evapotranspiration
http://www.cnern.org.cn,
accessed on 23 April 2023
Administrative
boundary
Vectorhttps://www.resdc.cn,
accessed on 23 April 2023
Socio-economic
factors
Basic road geographic
information
2020Vectorhttps://openstreetmap.org,
accessed on 23 April 2023
Nighttime light dataRaster
(1 km)
https://www.ngdc.noaa.gov,
accessed on 23 April 2023
Table 2. Resistance factors assignment and entropy weight.
FactorResistance ValueWeights
Level-1Level-2Level-3Level-4Level-5
Elevation (m)<5050–150150–250250–500>5000.142
Slope (°)<55–1515–2525–35>350.167
FVC (%)>6550–6535–5015–35<150.046
Landuse typesWoodland
Grassland
WaterFarmlandBarrenConstruction land0.467
Distance to river (m)>1000500–1000200–500100–200<1000.121
Distance to water (km)>105–102–51–2<10.057
Table 3. Ecosystem service indicators.
TypeFormula
Water supply Y xj = ( 1 AET xj P x ) , where Y xj is the annual water volume of the type j land grid x ; AET xj is the average annual evapotranspiration; and P x is the average annual precipitation.
Carbon fixation C xj = C s + C a + C b + C d , where C xj is the annual carbon holding capacity of land grid × of type j; C s , C a , C b , and C d are soil organic carbon, aboveground organic carbon, underground organic carbon, and dead organic carbon densities of type j land. This study only considered the other three carbon reserves because dead organic carbon data are challenging to obtain.
Habitat quality Q xj = H j [ 1 ( D xj Z D xj Z + k z ) ] , where Q xj is the habitat quality index of grid  x in landues type j ; H j is the habitat suitability of landuese type j ; D xj is the habitat degradation degree of grid × in landuse type j ; k is the semi-saturation constant; and Z is the default parameter of the model.
Soil conservation SC = RKLS USLE   = R × K × LS R × K × LS × C × P , where SC represents soil retention, R represents rainfall erosion, K represents soil erodibility, L represents slope length, S represents slope coefficient, C represents plant coverage, and P represents water and soil conservation.
Table 4. Ecological sensitivity factors classification standard.
Evaluation
Factor
Resistance ValueWeights
MildlyLowModeratelyHighly
Elevation (m)>500250–500100–250<1000.42
Slope (°)<55–1515–25>250.06
FVC (%)<00–1212–25>250.30
Landuse typesConstruction land/
Barren
FarmlandGrasslandWater/
Woodland
0.14
Population
density
>2010–205–10<50.08
Table 5. Annual rate of change in Nanchang.
Landuse TypesArea/km2Annual Rate of Change
19902000201020201990–20002000–20102010–2020
Farmland5127.774914.434853.254534.90−0.43%−0.13%−0.70%
Woodland794.17798.75811.97885.710.06%0.16%0.83%
Grassland24.639.279.062.17−16.56%−0.24%−31.66%
Water990.281080.06961.571028.770.83%−1.23%0.65%
Barren12.3611.285.983.35−0.96%−8.86%−7.83%
Construction land242.12377.54549.46736.383.59%3.13%2.54%
LC****−0.14%−0.07%−0.36%
Where * represents no results.
Table 6. 1990–2020 landuse transfer matrix for Nanchang.
Landuse Types
Year FarmlandWoodlandGrasslandWaterBarrenConstruction Land
1990–2000Farmland4750.29115.981.15135.260.13124.68
Woodland110.70681.470.020.940.000.96
Grassland3.120.715.893.022.609.29
Water43.150.320.74933.681.0511.28
Barren0.310.001.402.017.441.20
Construction land6.620.190.085.070.04230.10
2000–2010Farmland4549.40105.872.3196.080.16160.39
Woodland111.31681.890.241.060.004.17
Grassland1.360.112.742.110.562.39
Water183.0523.781.64850.691.5719.11
Barren0.430.001.953.633.631.63
Construction land7.450.220.187.880.05361.76
2010–2020Farmland4342.94167.280.16159.900.05182.61
Woodland78.93717.020.0112.680.003.24
Grassland2.400.200.982.010.482.99
Water100.460.710.29841.650.7817.57
Barren0.480.000.671.781.961.08
Construction land9.450.370.0510.600.08528.89
Table 7. Results of ecological sensitivity evaluation.
Sensitivity EvaluationArea/km2Proportion/%
Low4817.7066.99%
Slightly low1201.5416.71%
Medium532.897.41%
High453.386.30%
Exe-high185.822.58%
Sum7191.33100.00%
Disclaimer/Publisher’s Note: The statements, opinions and data contained in all publications are solely those of the individual author(s) and contributor(s) and not of MDPI and/or the editor(s). MDPI and/or the editor(s) disclaim responsibility for any injury to people or property resulting from any ideas, methods, instructions or products referred to in the content.

