Abstract
Dust plays a very important role in the Earth’s climate system by its direct and indirect effects. Deserts in northwestern China contribute a large amount of dust particles, both inland and outside, while the vertical distribution and transport mechanism of dust still have many uncertainties. Using Level 3 cloud-free monthly aerosol products of the Cloud–Aerosol Lidar and Infrared Pathfinder Satellite Observations (CALIPSO) system from 2007 to 2020, we analyzed the spatial and temporal variations and transport features for dust and polluted dust aerosols over China and the surrounding areas. The results show that the Taklimakan Desert (TD) and the Thar Desert (TRD) always act as the high-value centers of dust optical depth (DOD), while the centers of polluted dust optical depth (PDOD) are located in eastern China, the Sichuan Basin and the Indian subcontinent. The DOD shows an increasing trend in most areas, while the PDOD presents a significant decrease and increase in eastern China and central India, respectively. The largest DOD appears in spring over the TD and the Gobi Desert (GD), while the largest DOD in summer is over the TRD. Although most dusts in the TD and TRD are concentrated below 4 km, they may be higher over the TD. Most of the polluted dusts are confined to under 2 km. The dust input to the Tibetan Plateau (TP) could come from both the TD and TRD and occurs mostly in spring and summer, respectively. The polluted dusts of South Asia and the Indian subcontinent are mostly contained in the boundary layer in winter, but they could extend much higher in spring and summer, which favors their transport into southwestern China. The dust layer shows apparent seasonality. Its top reaches a higher level in spring and summer, while the base stays at a similar height in all seasons. The dust layer appears to be the thickest in spring over most areas, while the thickest layer in summer is over the TD and TRD. The polluted dust layer is thickest in the Indian subcontinent in spring. The overlapping of dust and polluted dust layers present different patterns in different regions, which suggests diverse mixture processes of dusts and pollutants. Finally, we compared and found different influences of meteorological factors, such as wind field, boundary layer height and precipitation, on the variations in DOD and PDOD over dust sources and other areas.
1. Introduction
Atmospheric aerosols have a large influence on the Earth’s climate system and can affect the radiation balance of the earth directly by absorbing and scattering solar radiation, as well as indirectly by changing the macroscopic and microscopic properties of clouds [1,2]. The uncertainty of aerosol radiative forcing (both direct and indirect) is one of the significant sources of uncertainty in climate research [3]. Aerosol type is one of the important factors in the evaluation of radiative forcing, since the radiative efficiency of aerosols differs considerably from one type to another [4]. Because of the different types of aerosols, many studies have been carried out on their microphysical and radiological properties [5,6,7].
Dust aerosols, holding half of the aerosol loading, play a very important role in the radiation balance and ecology over the Earth [8]. As the second largest dust source [9,10,11] over the world, Asia possesses many deserts, located in Kazakhstan, northwestern China, Mongolia and India. Large amounts of dust particles from these deserts are ejected into the atmosphere and transported remotely to vast downstream areas [12]. Multiple studies have indicated that dust from the Sahara and Thar Deserts has the capability to cross the Himalayas, thereby influencing the weather and climate in the Qinghai–Tibetan Plateau and parts of the Yangtze River region [13,14,15]. It has been proven that 800 Tg·yr−1 of dust particles is injected into the atmosphere from Chinese deserts, with 30% redeposited locally and 20% transported and widely distributed in the Chinese mainland [16,17]. Due to the important influence of dust, many studies have been conducted to reveal the characteristics of dust transport processes and their climatic effects [9,11,18,19,20]. The effect of dust radiative forcing also weakens the Asian summer monsoon [21]. Perlwitz et al. [22] suggested that the radiative forcing of dust usually leads to a reduction in atmospheric dust load, affecting regional atmospheric temperature structure and regional climate, and thus feeding back into the dust cycle [23]. Changes in dust emissions are highly synchronized with solar radiation intensity, surface temperature and thermodynamic efficiency [24]. Dust aerosols are usually present in the boundary layer, in and near the dust source region [25], while they can be lifted into the upper air and sometimes even reach the free troposphere under unstable conditions [26]. Long-range transported Asian dust influences not only northern China and the Japan–Korea region, but also further southern regions of China, as reported by [27,28,29,30,31], and even the eastern part of North America, after a longer-range ocean-crossing transport [32,33].
Satellite observations have a wide spatial coverage and effective temporal continuity [34], which can not only describe the local distribution of aerosols, but also monitor the inter-regional transportation of air pollutants. Cloud–Aerosol Lidar with Orthogonal Polarization (CALIOP), loaded on the Cloud–Aerosol Lidar and Infrared Pathfinder Satellite Observations (CALIPSO) system, is widely used in studies of the vertical structure and inter-regional transport of aerosols [35]. Using CALIPSO observations, Huang et al. [36] analyzed the long-range transport of dust originating from the Taklamakan Desert (TD), which went through the Gobi Desert and arrived at the Pacific Ocean. Yang et al. [37] described a unique seasonal variation feature of dust aerosol over the Tibetan Plateau (TP). Dust aerosol can mix with other atmospheric pollutants on its transport path and affect vast areas downstream [38]. Although there have been a lot of valuable studies on the spatial and temporal variation of dust, the climatological features of vertical distribution and transport mechanism of dust aerosols over China and the whole of East Asia still have many uncertainties, due to lack of unified long-term observations. For example, there is a lack of exploration regarding the vertical overlapping of dust and polluted dust layers and the different correlations between meteorological factors and the dust optical depth (DOD) and polluted dust optical depth (PDOD). In this study, we present the climatological characteristics of vertical distribution and transport of dust and polluted dust aerosols over China and the surrounding areas using CALIPSO Level 3 products from 2007 to 2020. This provides a new perspective on the significant role of dust and polluted dust aerosols in China and the surrounding regions.
2. Materials and Methods
2.1. CALIOP Level 3 Aerosol Product
The CALIOP/CALIPSO Level 3 (L3) cloud-free aerosol dataset from 2007 to 2020 was used in this study. The CALIPSO L3 aerosol product, designed to provide climatology of the global aerosol distribution, including seasonal and interannual variability, has been widely used in aerosol research [39]. It offers vertical distributions of extinction coefficients and types of aerosols during daytime and nighttime. The seven aerosol types, including clean marine, polluted dust, dust, clean continental, polluted continental/smoke, dusty marine and elevated smoke, are retrieved in Level 2 products, while only three types (dust, polluted dust and elevated smoke) are provided in Level 3 products. Its grid resolution is 2° × 5° latitude/longitude in the horizontal direction and 60 m in the vertical. The cloud-free sky product with the highest quality [40] was selected to be analyzed in this study. The selected parameters are of monthly mean values of aerosol extinction coefficient and optical depth at 532 nm for dust and polluted dust. Irregular mineral dusts are classified as “dust” (nominally pure dust) by CALIOP, while “polluted dust” means dust mixed with smoke or other non-polarized aerosols [41,42].
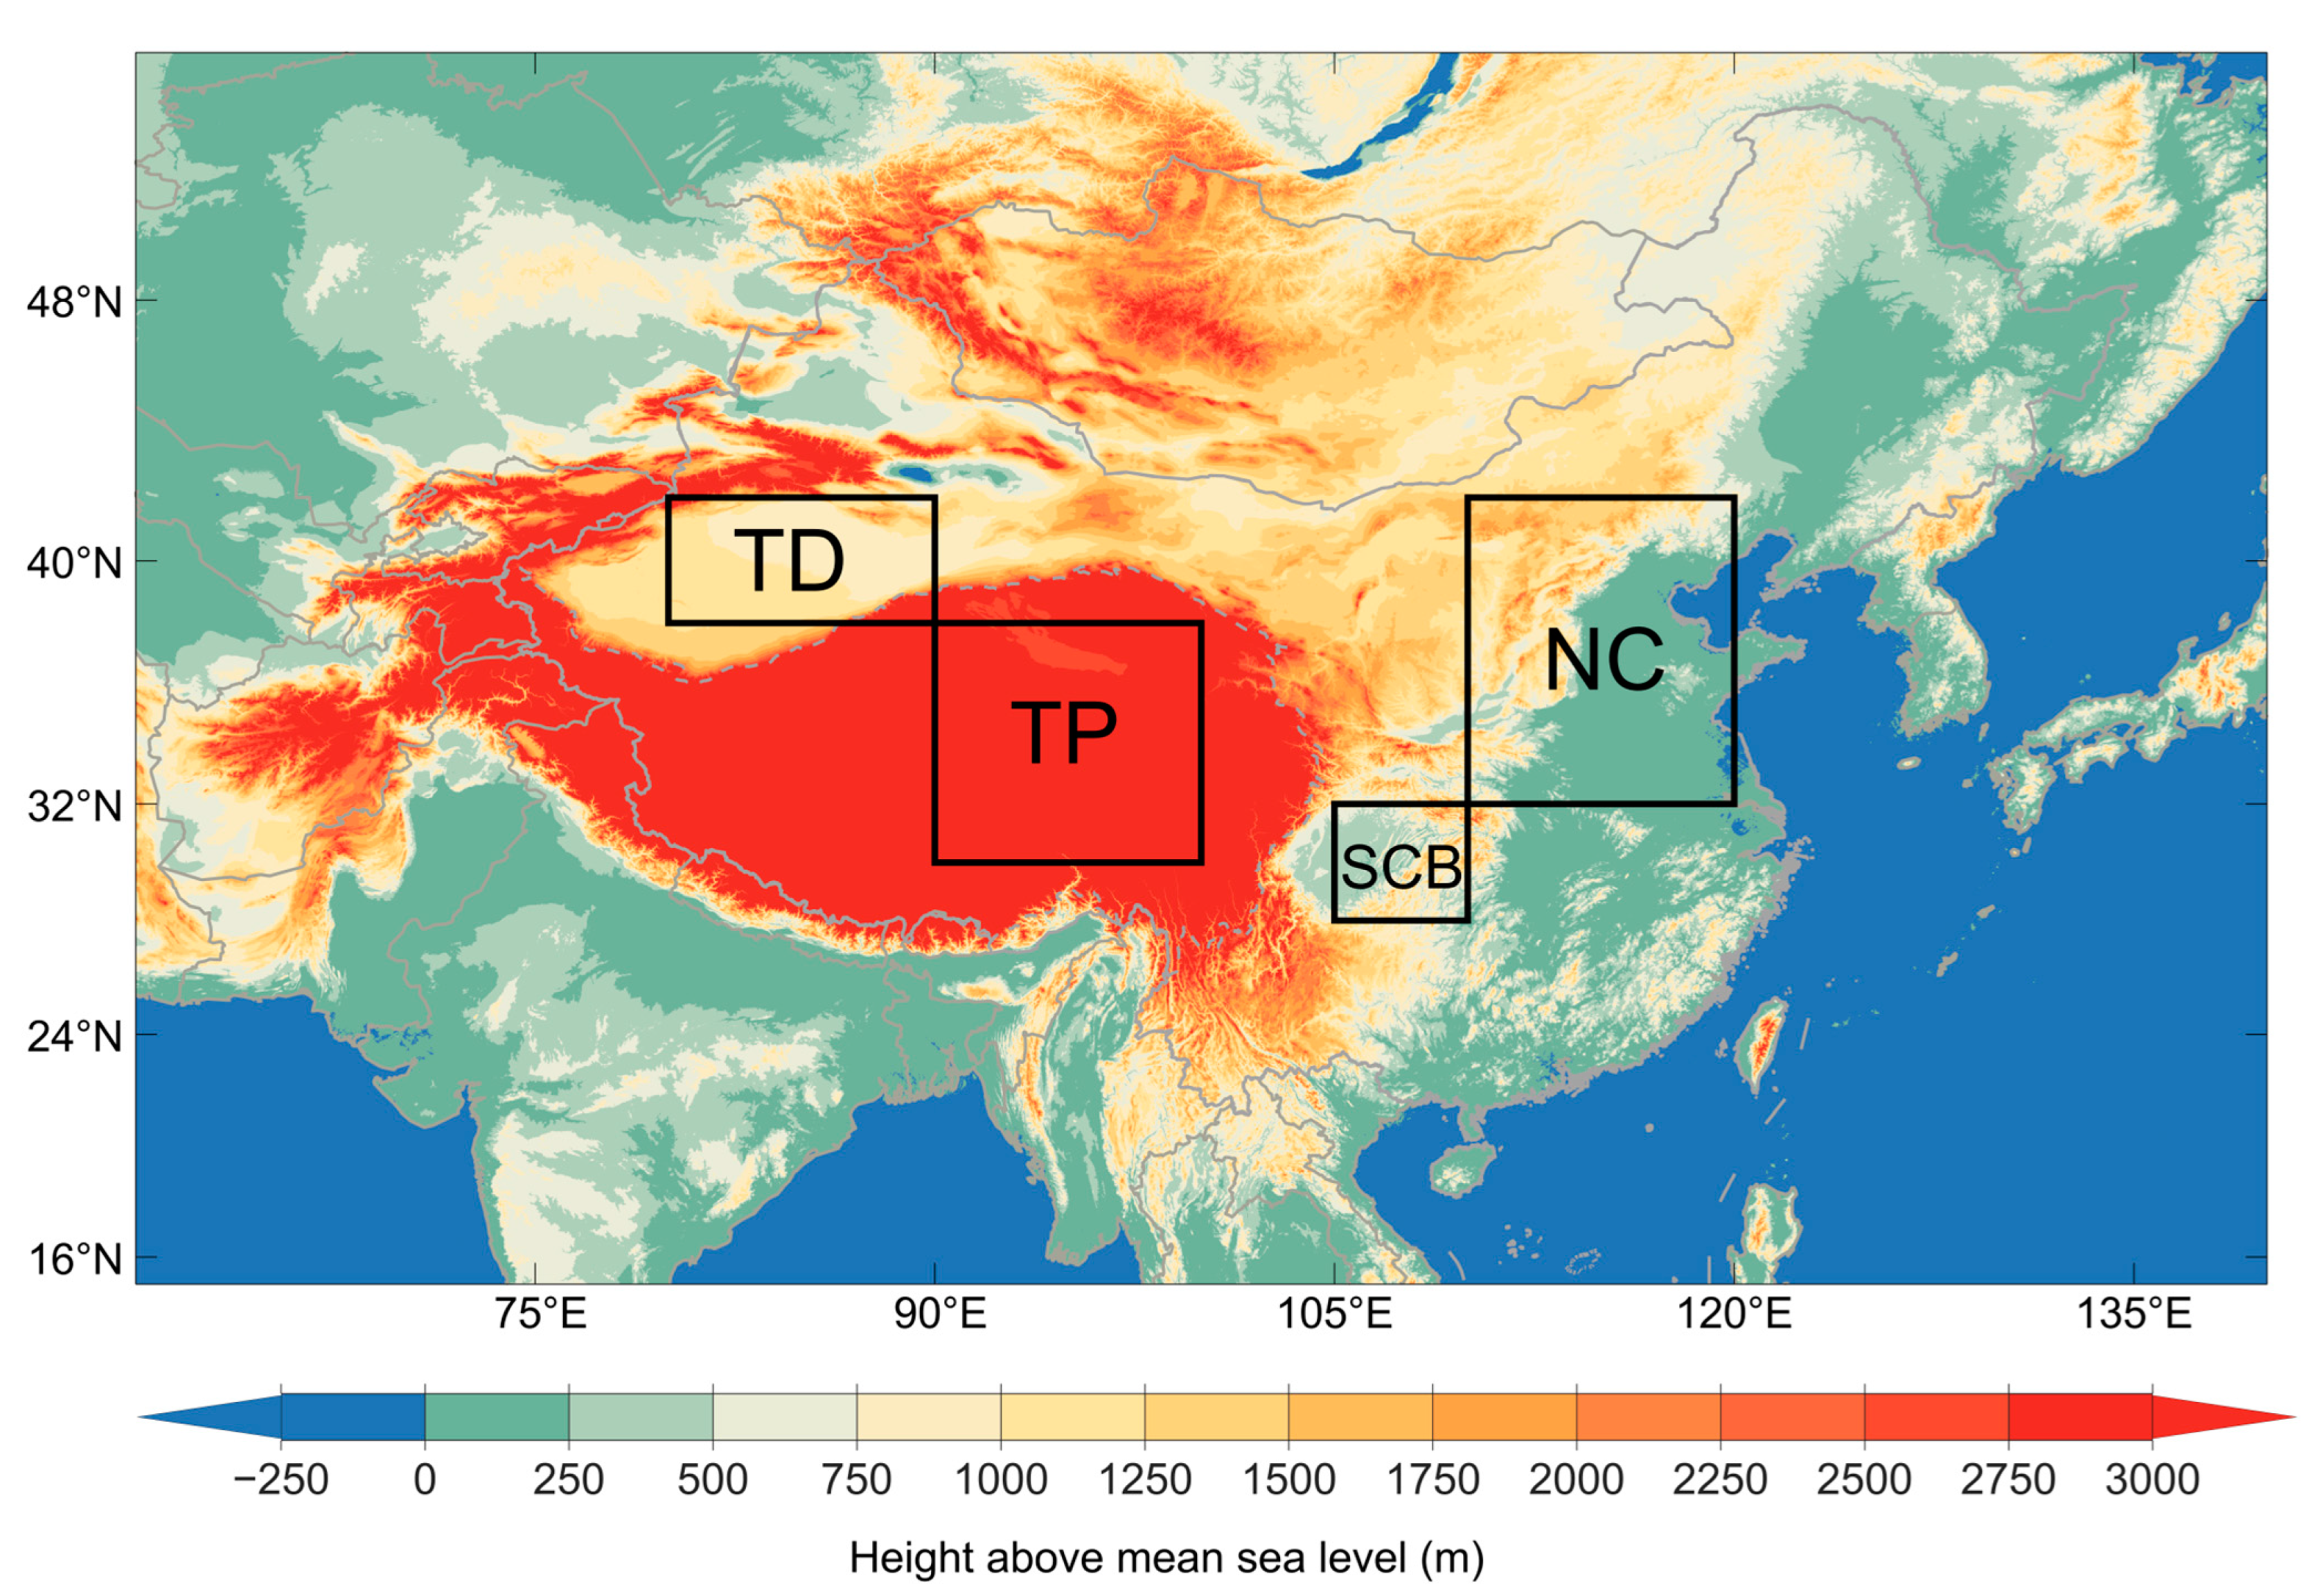
Figure 1 shows the study area, in which four black boxes are the selected areas for analysis, namely, the Taklimakan Desert region (TD; 80~90°E, 38~42°N), Tibetan Plateau (TP; 90~100°E, 30~38°N), Sichuan Basin (SCB; 105~110°E, 28~32°N) and northern China region (NC; 110~120°E, 32~42°N).
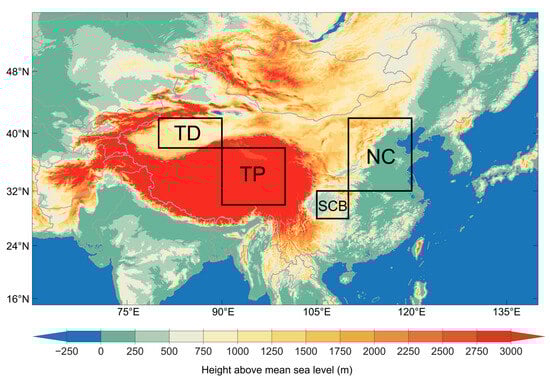
Figure 1.
Study areas and the four selected subregions (TD: Taklimakan Desert; TP: Tibetan Plateau; SCB: Sichuan Basin; NC: Northern China).
2.2. ERA-5 Reanalysis
The monthly datasets of ECMWF Reanalysis V5 (ERA-5) reanalysis during 2007–2020 were used to give the meteorological fields in this study. These have a spatial resolution of 0.25° × 0.25° and 37 pressure layers, from 1000 to 1 hPa. Additionally, the four seasons of spring (3~5), summer (6~8), autumn (9~11) and winter (12~2) are simplified using the acronyms of March–April–May (MAM), June–July–August (JJA), September–October–November (SON) and December–January–February (DJF), respectively.
3. Results
3.1. Optical Depths of Dust and Polluted Dust
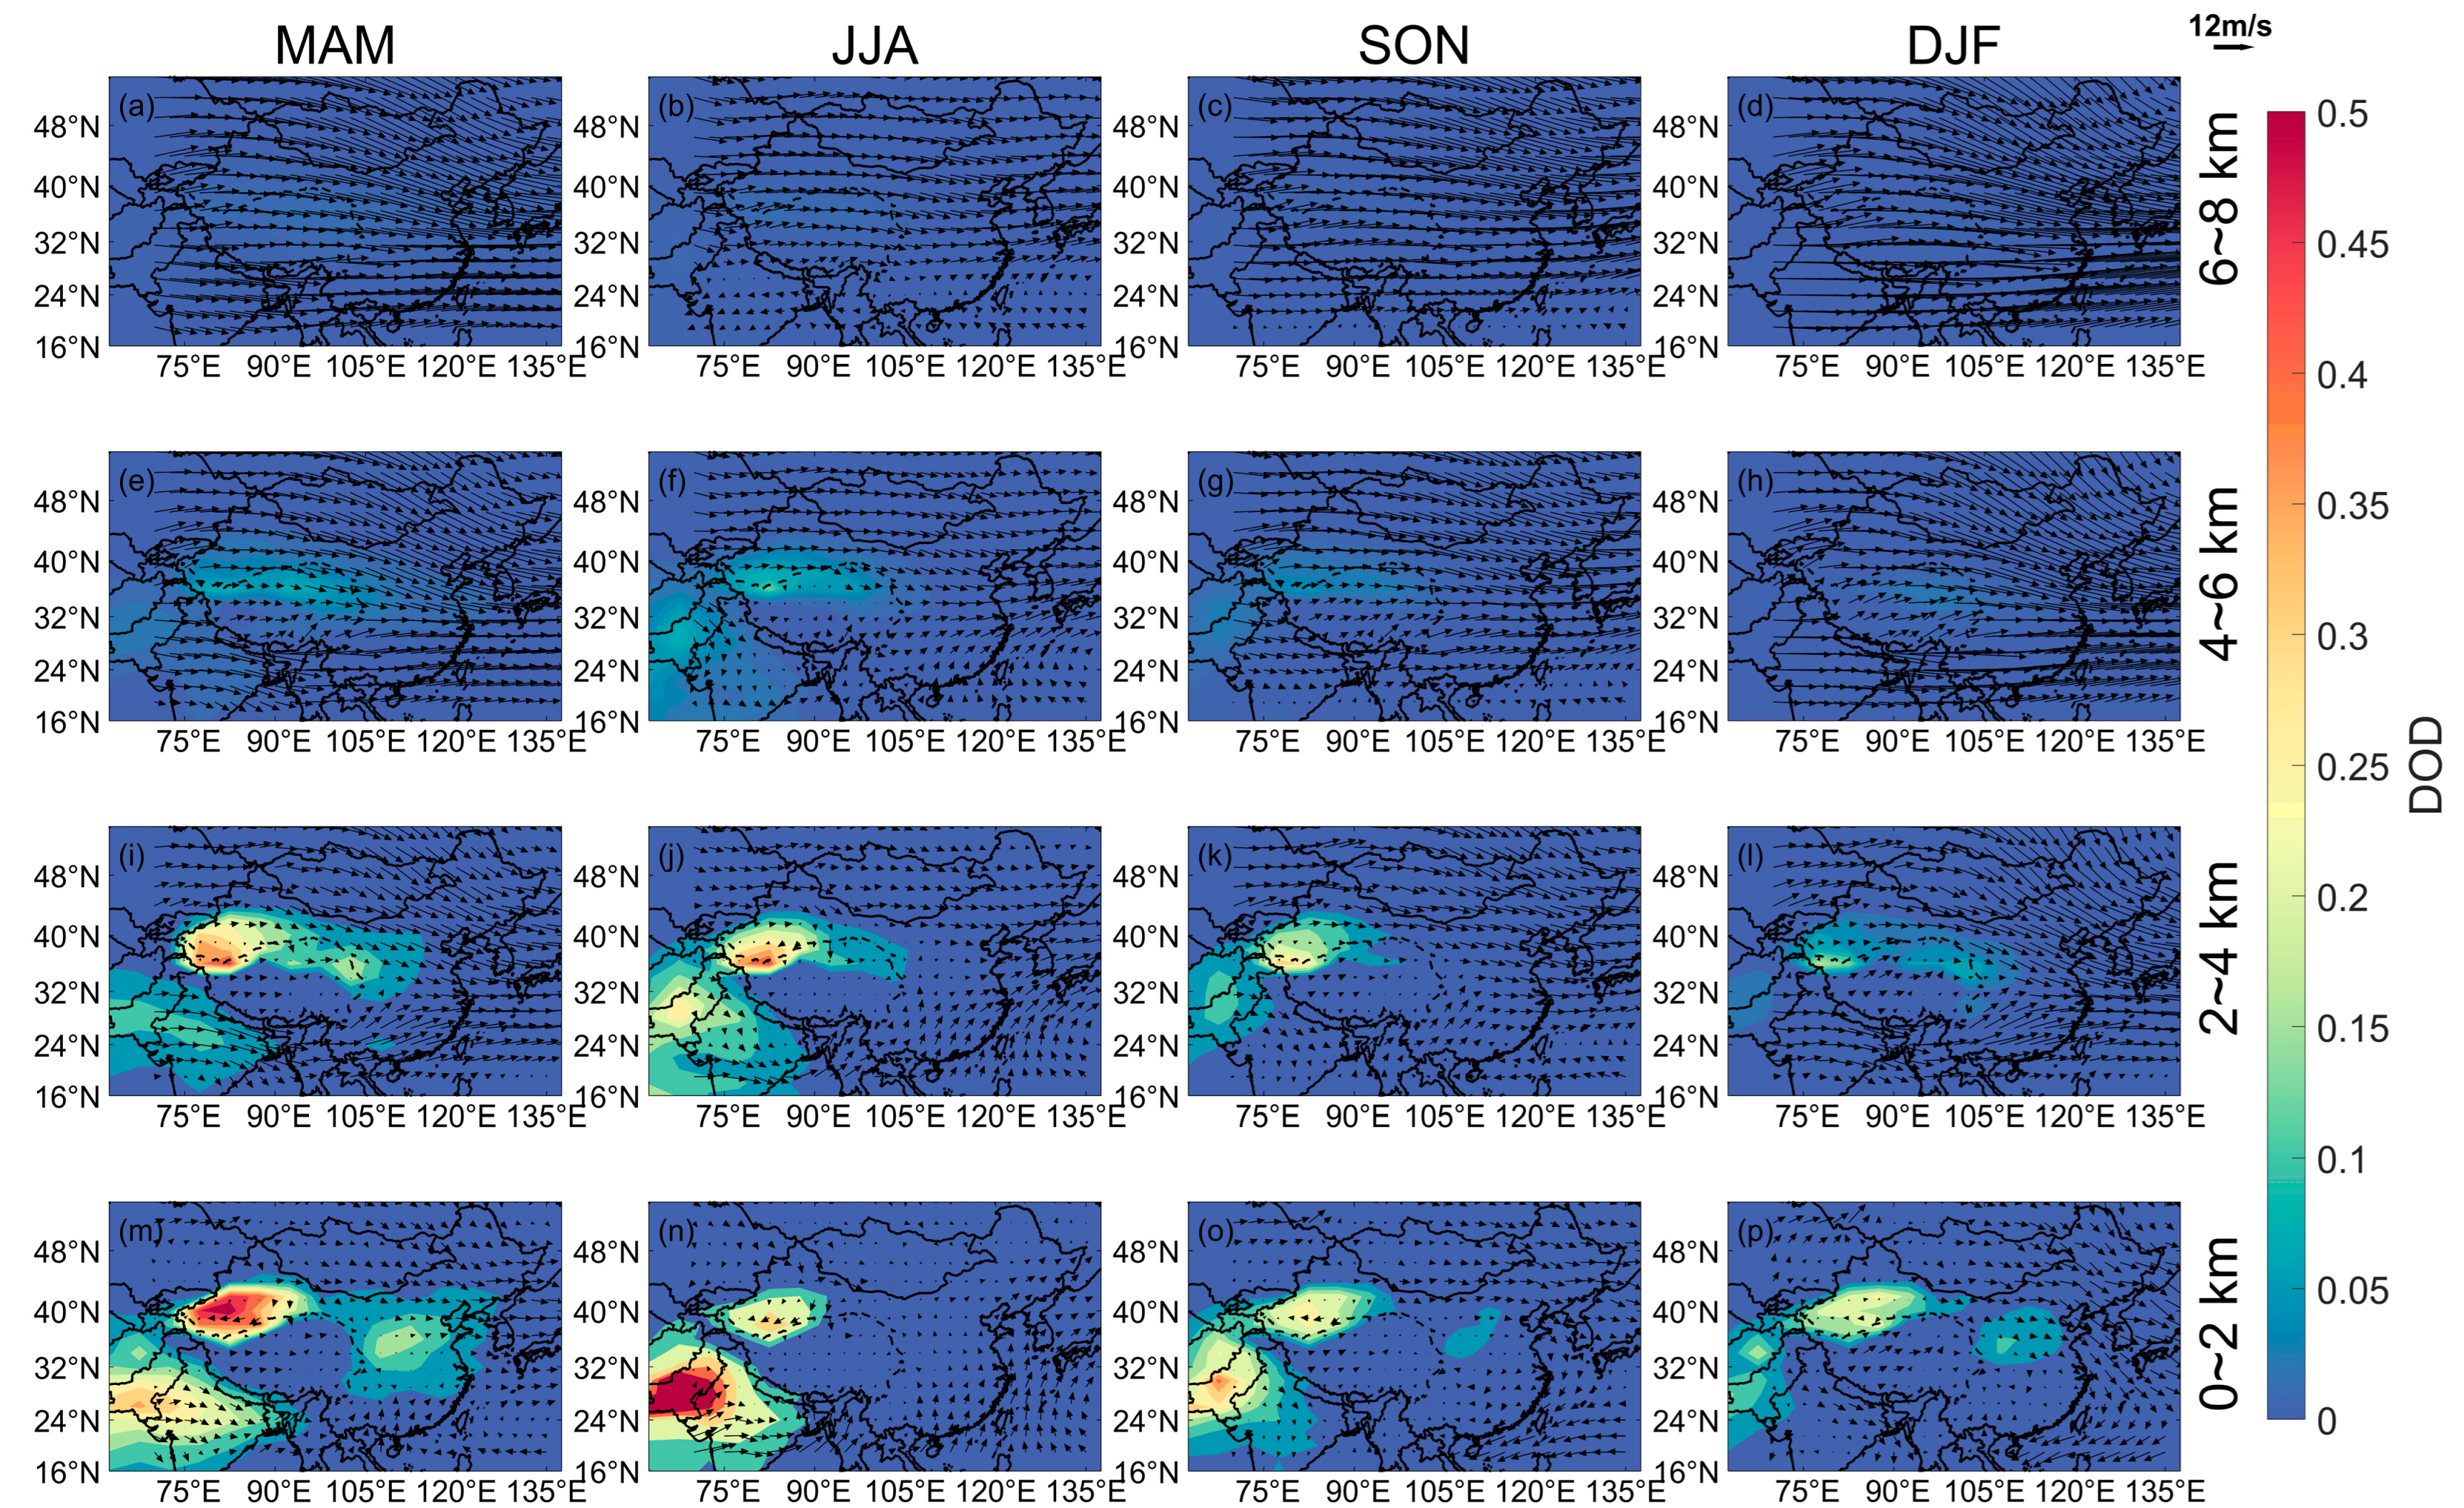
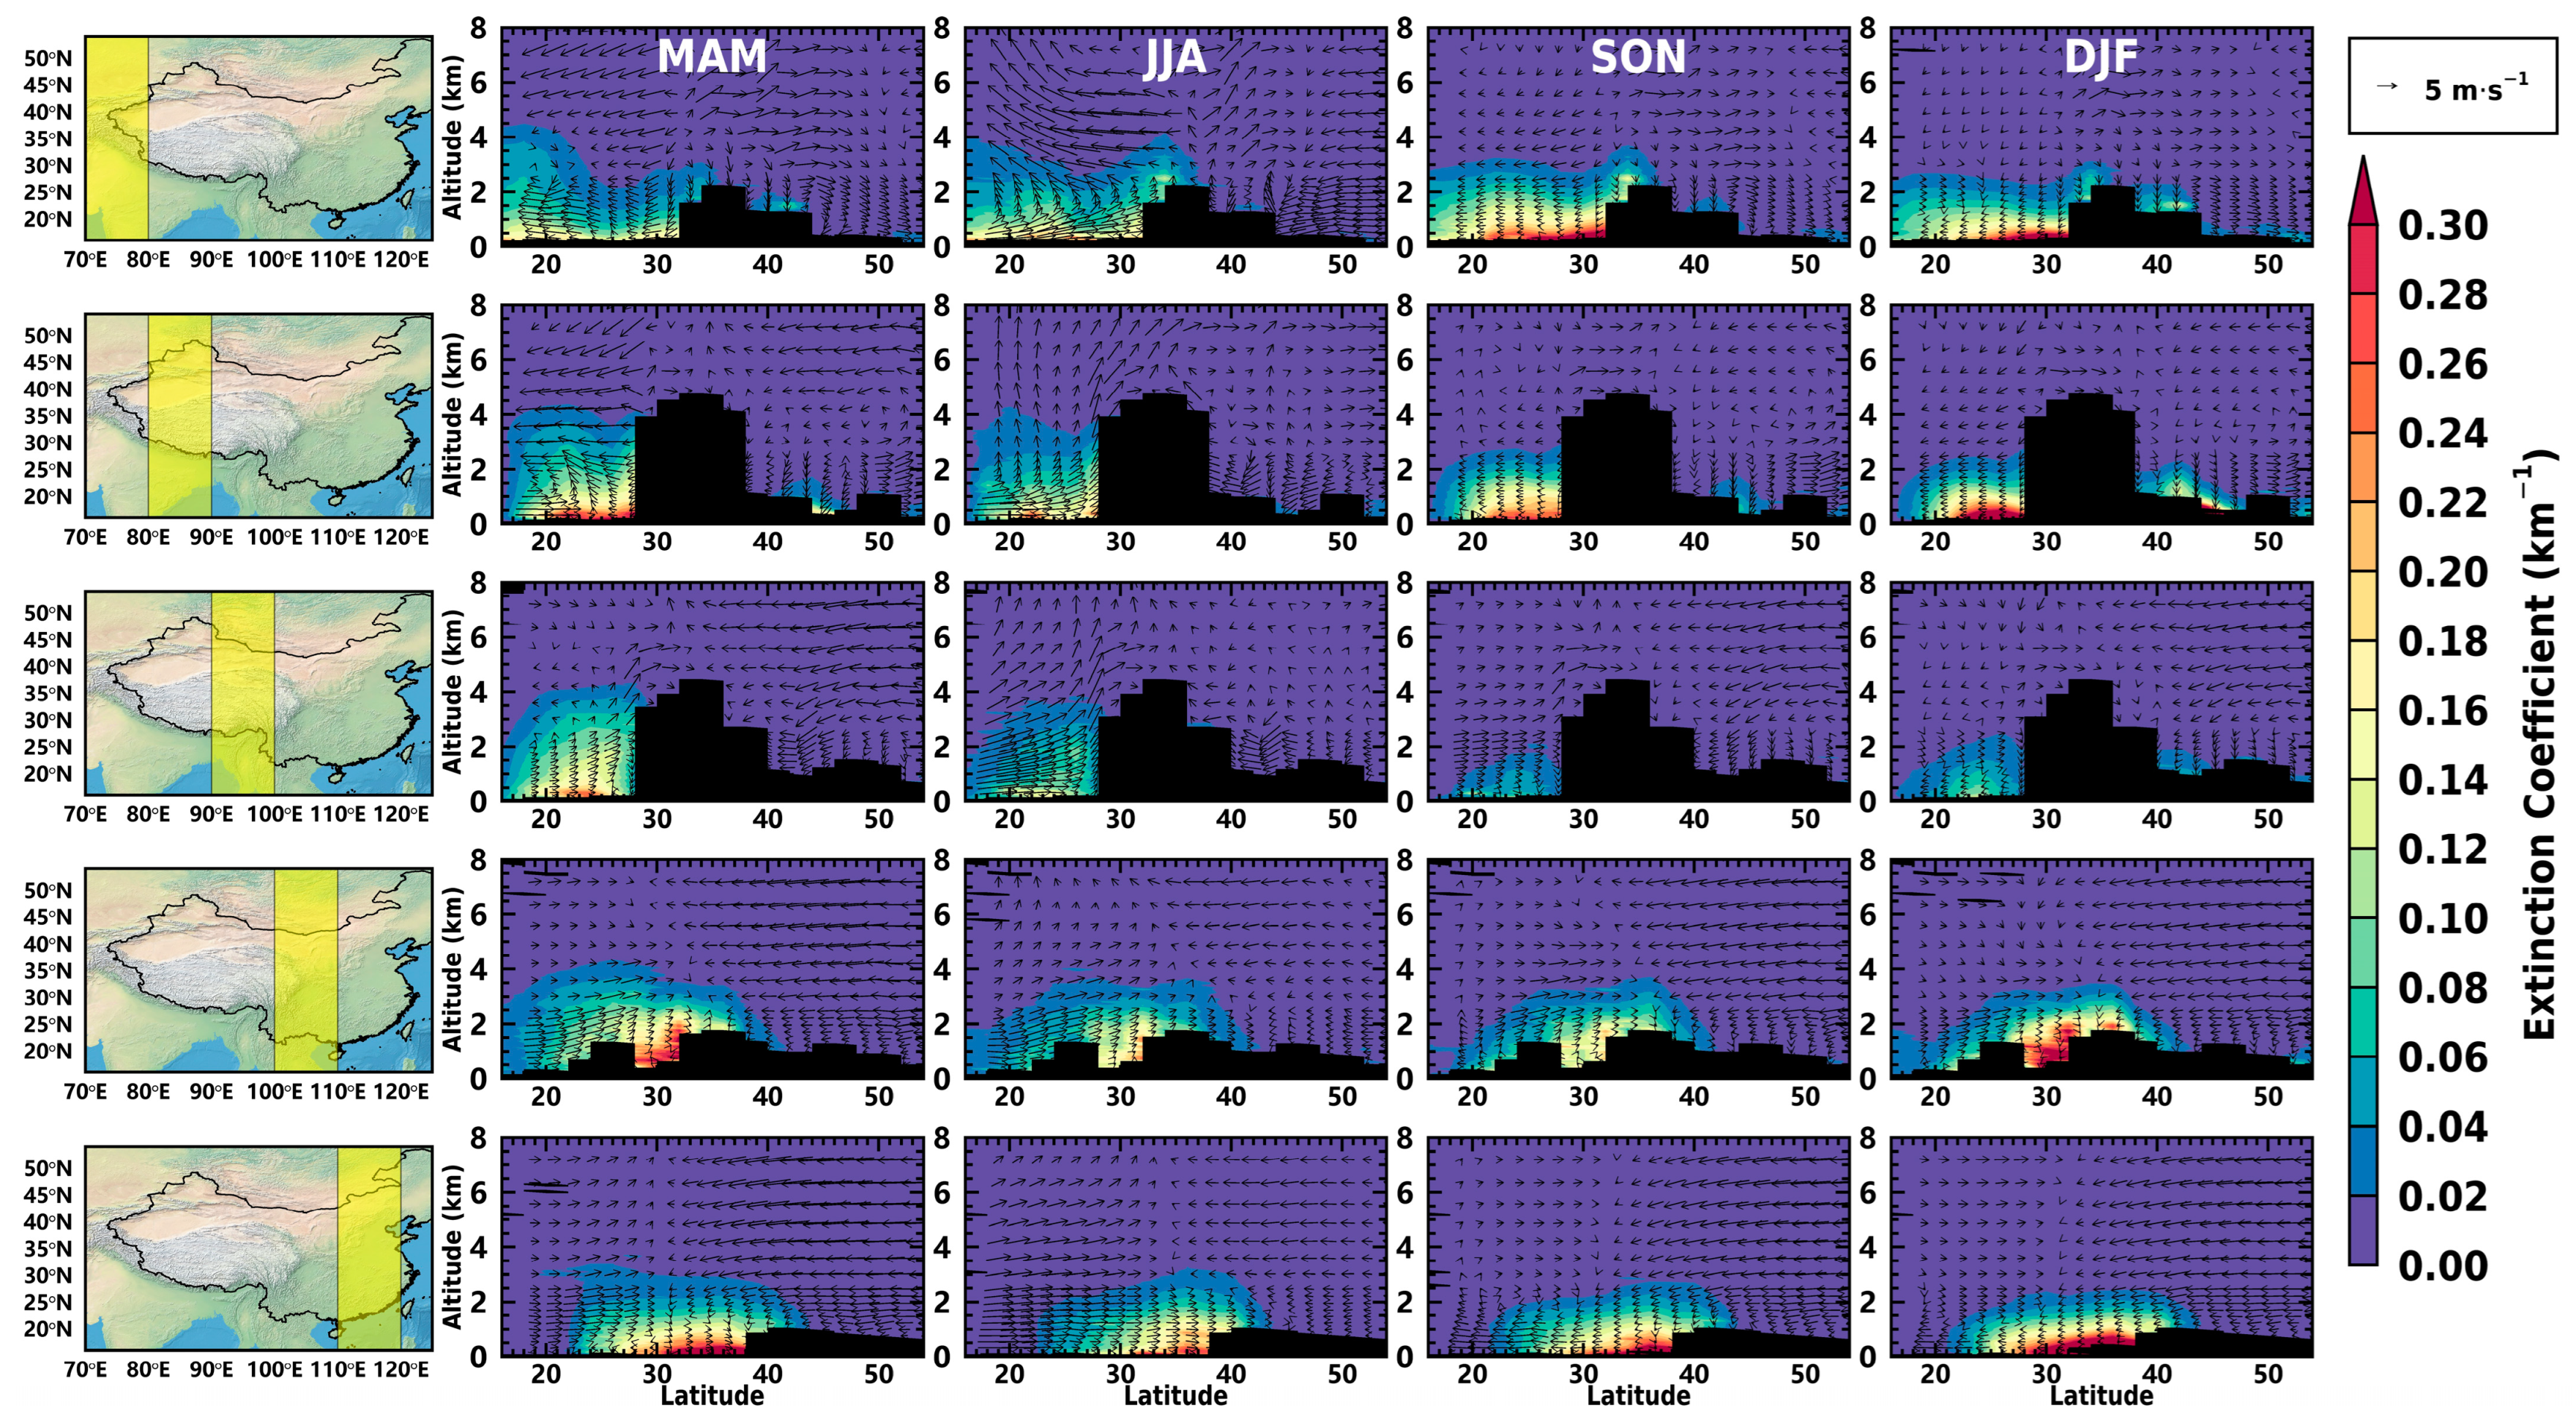
For ease of displaying the aerosol transport in the study area, the atmosphere under 8 km was divided into four layers with the interval of 2 km, which were the layers of 0–2, 2–4, 4–6 and 6–8 km, respectively. Figure 2 shows the seasonal distributions of dust optical depth (DOD) within the four layers. There are two heavy-loading dust areas in the study domain, which are the area from the TD to central Inner Mongolia and the region from the Thar Desert (TRD) to the Indian subcontinent. The dust in TD can be lifted up to 6 km in both spring and summer, while the dust in the TRD can climb up to such altitude only in summer. The DOD and coverage of the TD and TP achieved their maxima in spring, as while the DOD of the TRD was highest in summer. The dust-affected area covers the most in spring, ranging from the TD and Inner Mongolia to eastern China. The dust in the TD mostly concentrated under 4 km, and some could be uplifted to 4–6 km, where was the major channel of dust transported to the TP. Dust settled as it traveled east, which made a high dust loading in the lowest layer over most areas of eastern China. Combining external input with local emission, a second heaviest dust loading area appeared over the Loess Plateau and the surrounding areas in the spring. In the layer of 2–4 km, a relatively smaller area holding high dust loading appeared over Tengri Desert. At the layer of 4–6 km, a continuous dust belt stretched across the TD to the Qaidam Basin in the TP. Blocked by the TP, the dust aerosol from the TRD stagnated under the southern slope of the TP.
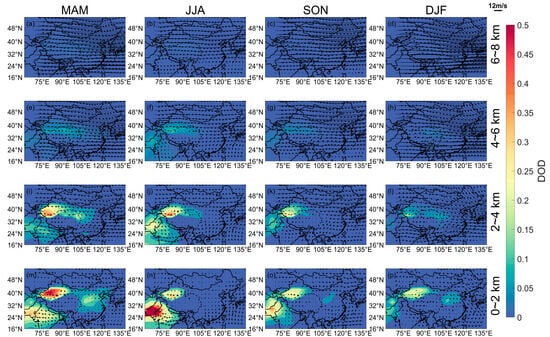
Figure 2.
Distributions of seasonal mean DOD in the four altitude layers during 2007–2020 (Arrows represent the wind field. The subplots of (a–d), (e–h), (i–l) and (m–p) represent the results of 0–2, 2–4, 4–6 and 6–8 km, respectively).
In summer, TD dust can be lifted to higher altitudes due to stronger convections, resulting in the DOD in the layer of 2–4 km being higher than that in 0–2 km. Moreover, the DOD in 4–6 km was larger in summer than in spring. With the decline of the westly wind, the intensity of eastward dust transport was obviously weaker than that in spring and the most dusts were limited to the west of 105°E. For the Thar Desert and the deserts in the Middle East, they could transport dust into the TP under unique dynamic and thermal effects. Under the effect of the “heat pump” of the TP, the convergent updrafts and topographic lifting are strengthened, which makes the transport of dust aerosols to the TP more convenient from the southern and western boundaries. As shown in Figure 2, there is an apparent channel above 2 km conveying dust across the western boundary of the TP. From autumn to winter, the dust concentration declined significantly in all layers over most areas of the study region, while an increase appeared in the lowest layer over the Loess Plateau and the Qaidam Basin. In winter, the dust of the TD could rarely climb up to the layer of 4–6 km, while the dust from the Qaidam Basin appeared as the major dust source in the TP. Generally, both the TD and the Thar Desert showed the minimum DOD and dust transport flux in winter.
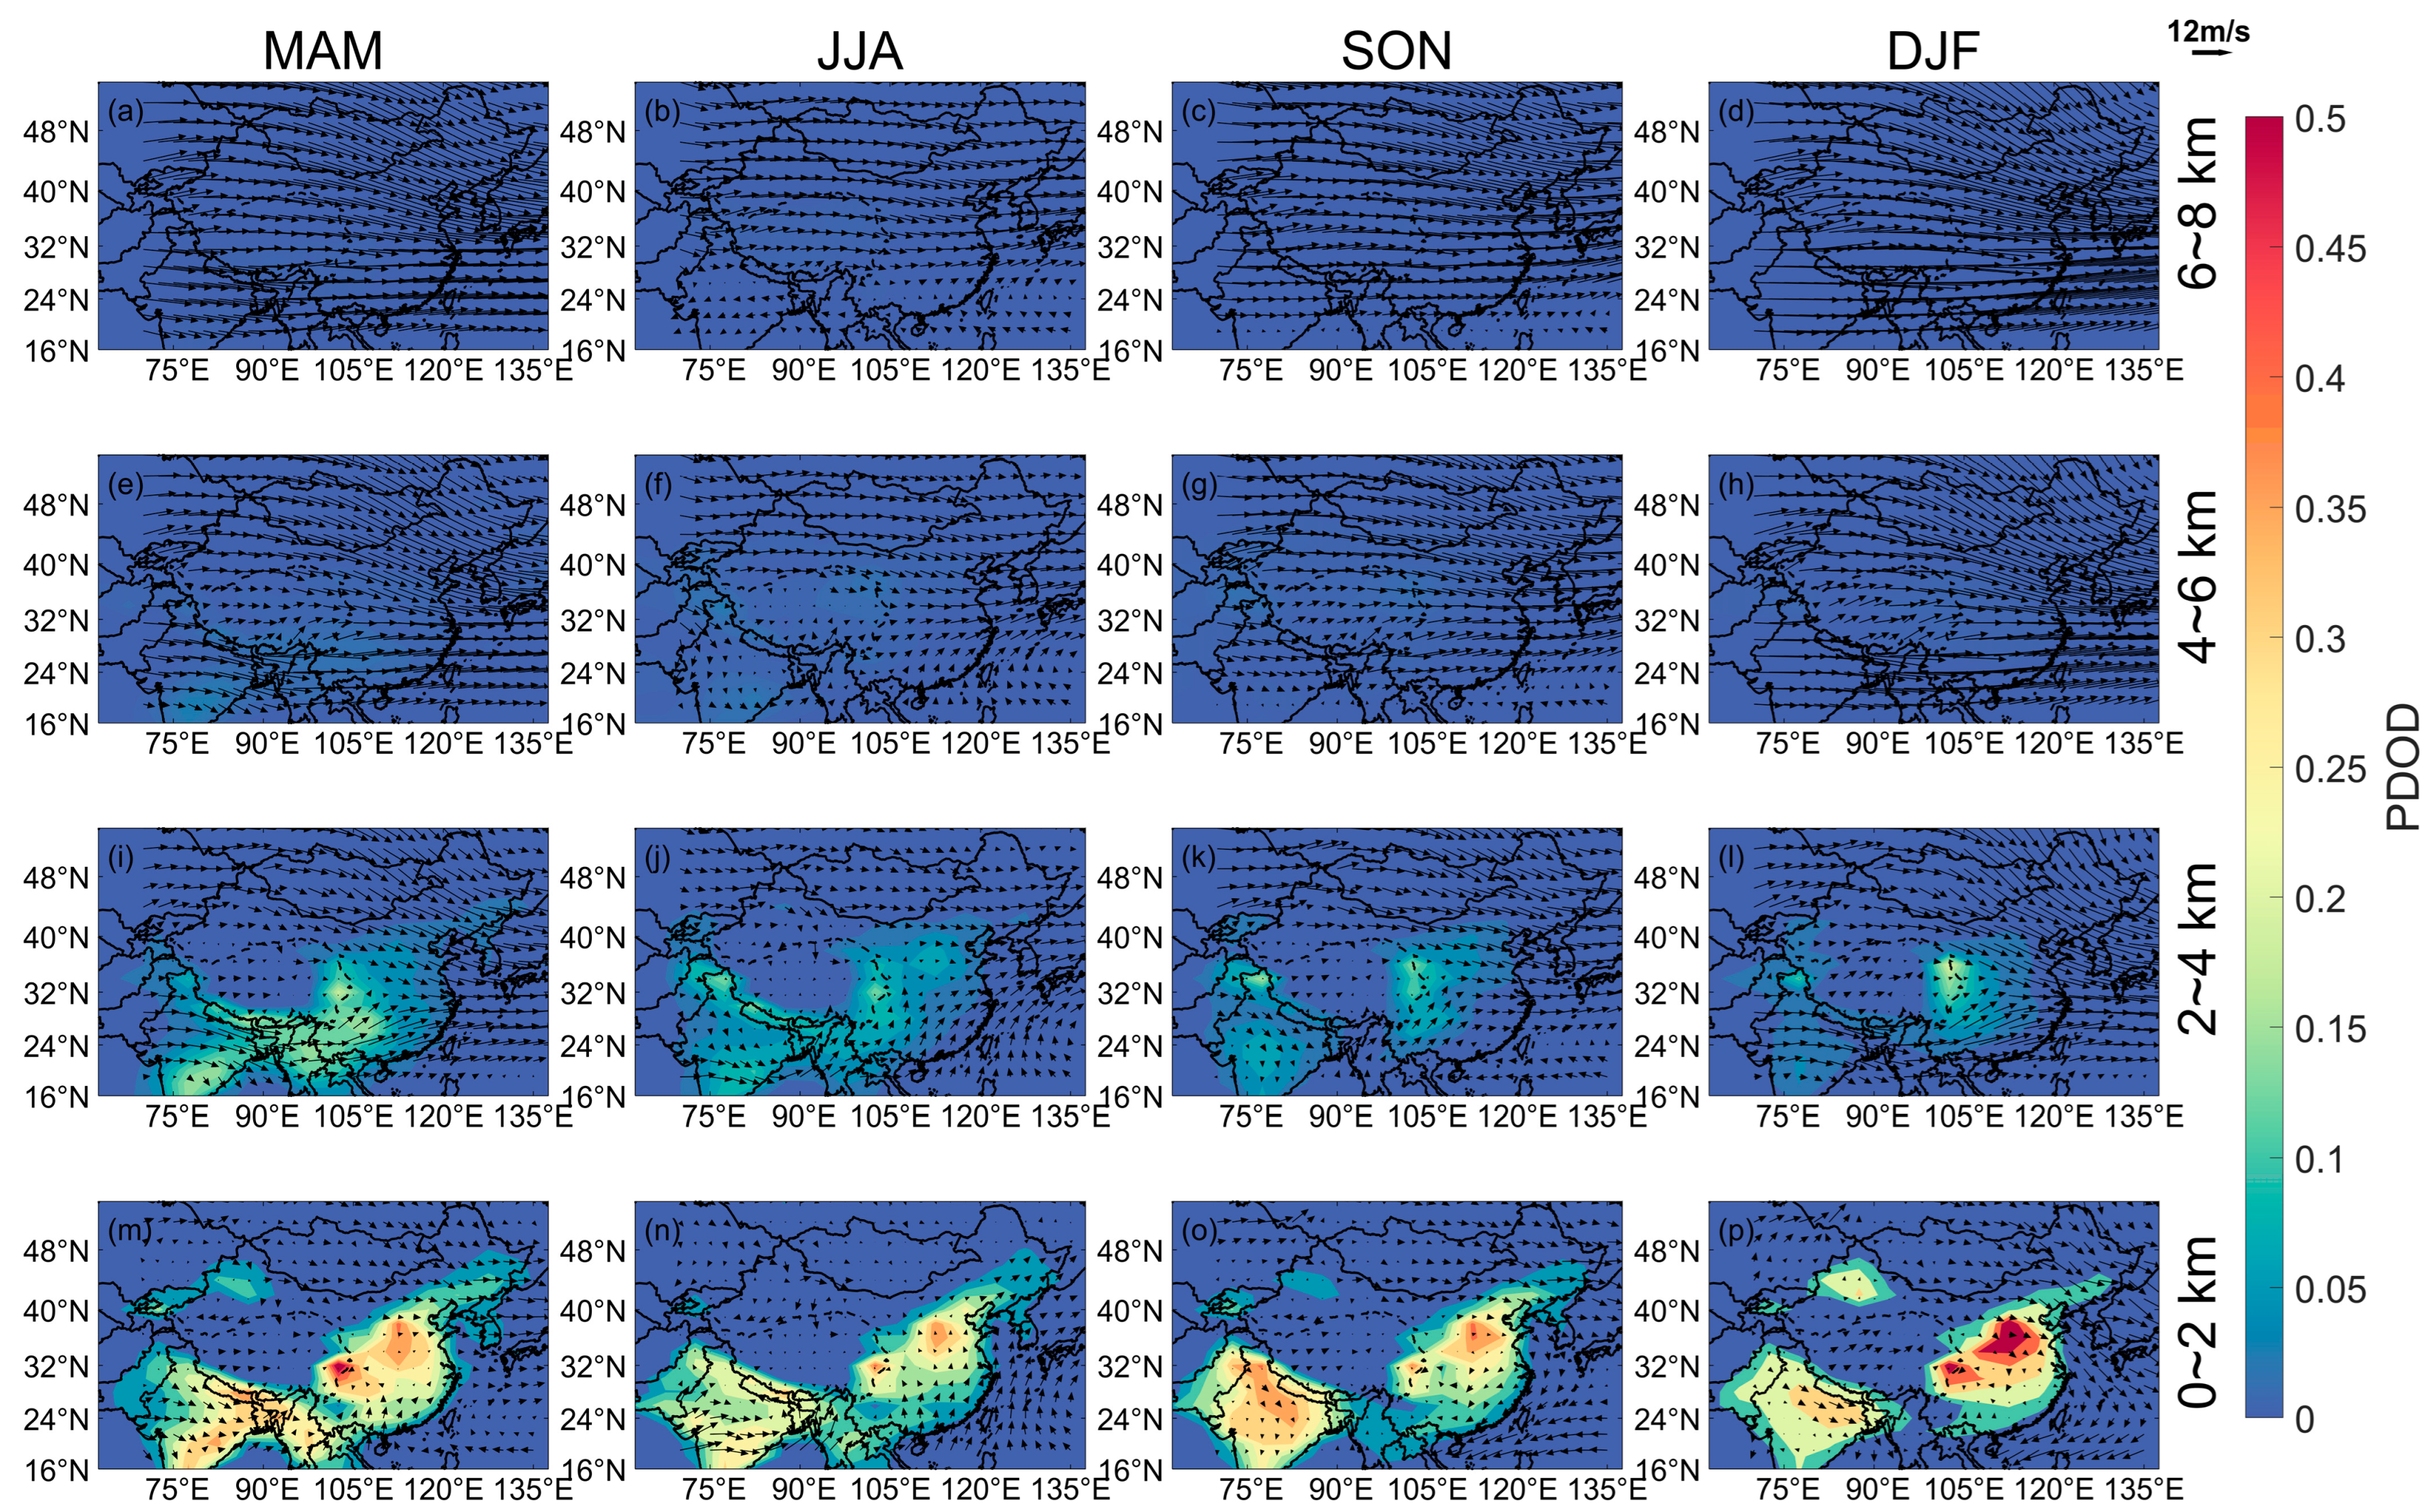
While traveling, pure dust can mix with other constituents, producing a more complicated compound named polluted dust in CALIPSO aerosol nomenclature. Figure 3 presents the distributions of polluted dust over the study region. Differently from the pure dust, the polluted dust was mainly concentrated in 0–2 km, which accounted for about 75% of the polluted dust optical depth (PDOD). The Sichuan Basin, North China and Indo-Gangetic Plain were the three main high-value centers of PDOD in the study region, and the Junggar Basin in northwestern China appeared as a secondary regional high-value center from autumn to spring. The favorable conditions of lower boundary layer heights and frequent occurred thermal inversions helped the accumulation of local pollutants, which resulted in the heaviest loading of polluted dust in winter. Rainfall activities in the study area occurred mainly in summer, which scrubbed a lot of the floating pollutants [43] and created the lowest PDOD in summer.
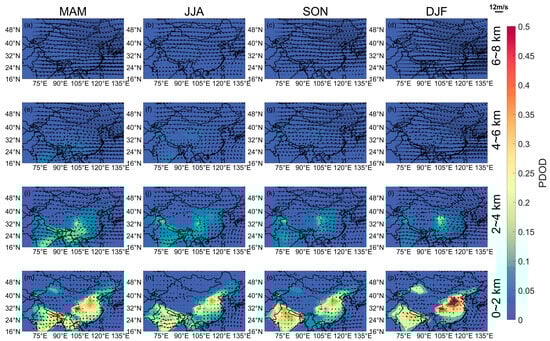
Figure 3.
Distributions of seasonal mean PDOD in the four altitude layers during 2007–2020 (Arrows represent the wind field. The subplots of (a–d), (e–h), (i–l) and (m–p) represent the results of 0–2, 2–4, 4–6 and 6–8 km, respectively).
In 0–2 km, the high-value center of PDOD over the Indian subcontinent showed a distinct seasonal movement. From autumn to spring, the high-value center obviously moved eastward under the dominant effect of the westerly winds [44]. In China, the PDOD in the 0–2 km layer reached the maximum and minimum in winter and summer, respectively. In the layer of 2–4 km, it always appeared as a high-value zone from the eastern TP to the Sichuan Basin throughout the year. The aerosols are confined to local area due to the special terrain of the Sichuan Basin, which makes the aerosols difficult to disperse. In the layer of 4–6 km, polluted dust could cover a large area from the southern Asia to inland China [45]. Although the transport flux of dust during winter is less than that in spring, the dust emissions from the TD and GD in winter reach about 24 Tg·yr−1 and 38 Tg·yr−1, accounting for 26% and 40% of the annual emissions [46], respectively. Additionally, the dust transport flux from Central Asia to East Asia during winter is ~11 Tg·yr−1 [47], which is another important input. Dust incoming from other source regions, such as North Africa and the Arabian Peninsula, could further increase the dust loading in East Asia during winter [48,49]. With mixing during long-range transport and the lower boundary layer height in winter, the input dusts are more likely to suspend and blend in the lower atmosphere where most polluted aerosols linger. These combined effects enhance the synthesis of pollutant-laden dust during winter. Under the effect of the prevailing wind, south and southwest China are affected by both the imported aerosols from South Asia and the local emissions in spring and summer, while the local aerosols are the main pollutants in autumn and winter. In addition, there is also a relatively high-value center in the layer of 4–6 km in North China in summer, which is contributed by the strong vertical convection.
3.2. Transport and Mean Profiles of Dust and Polluted Dust
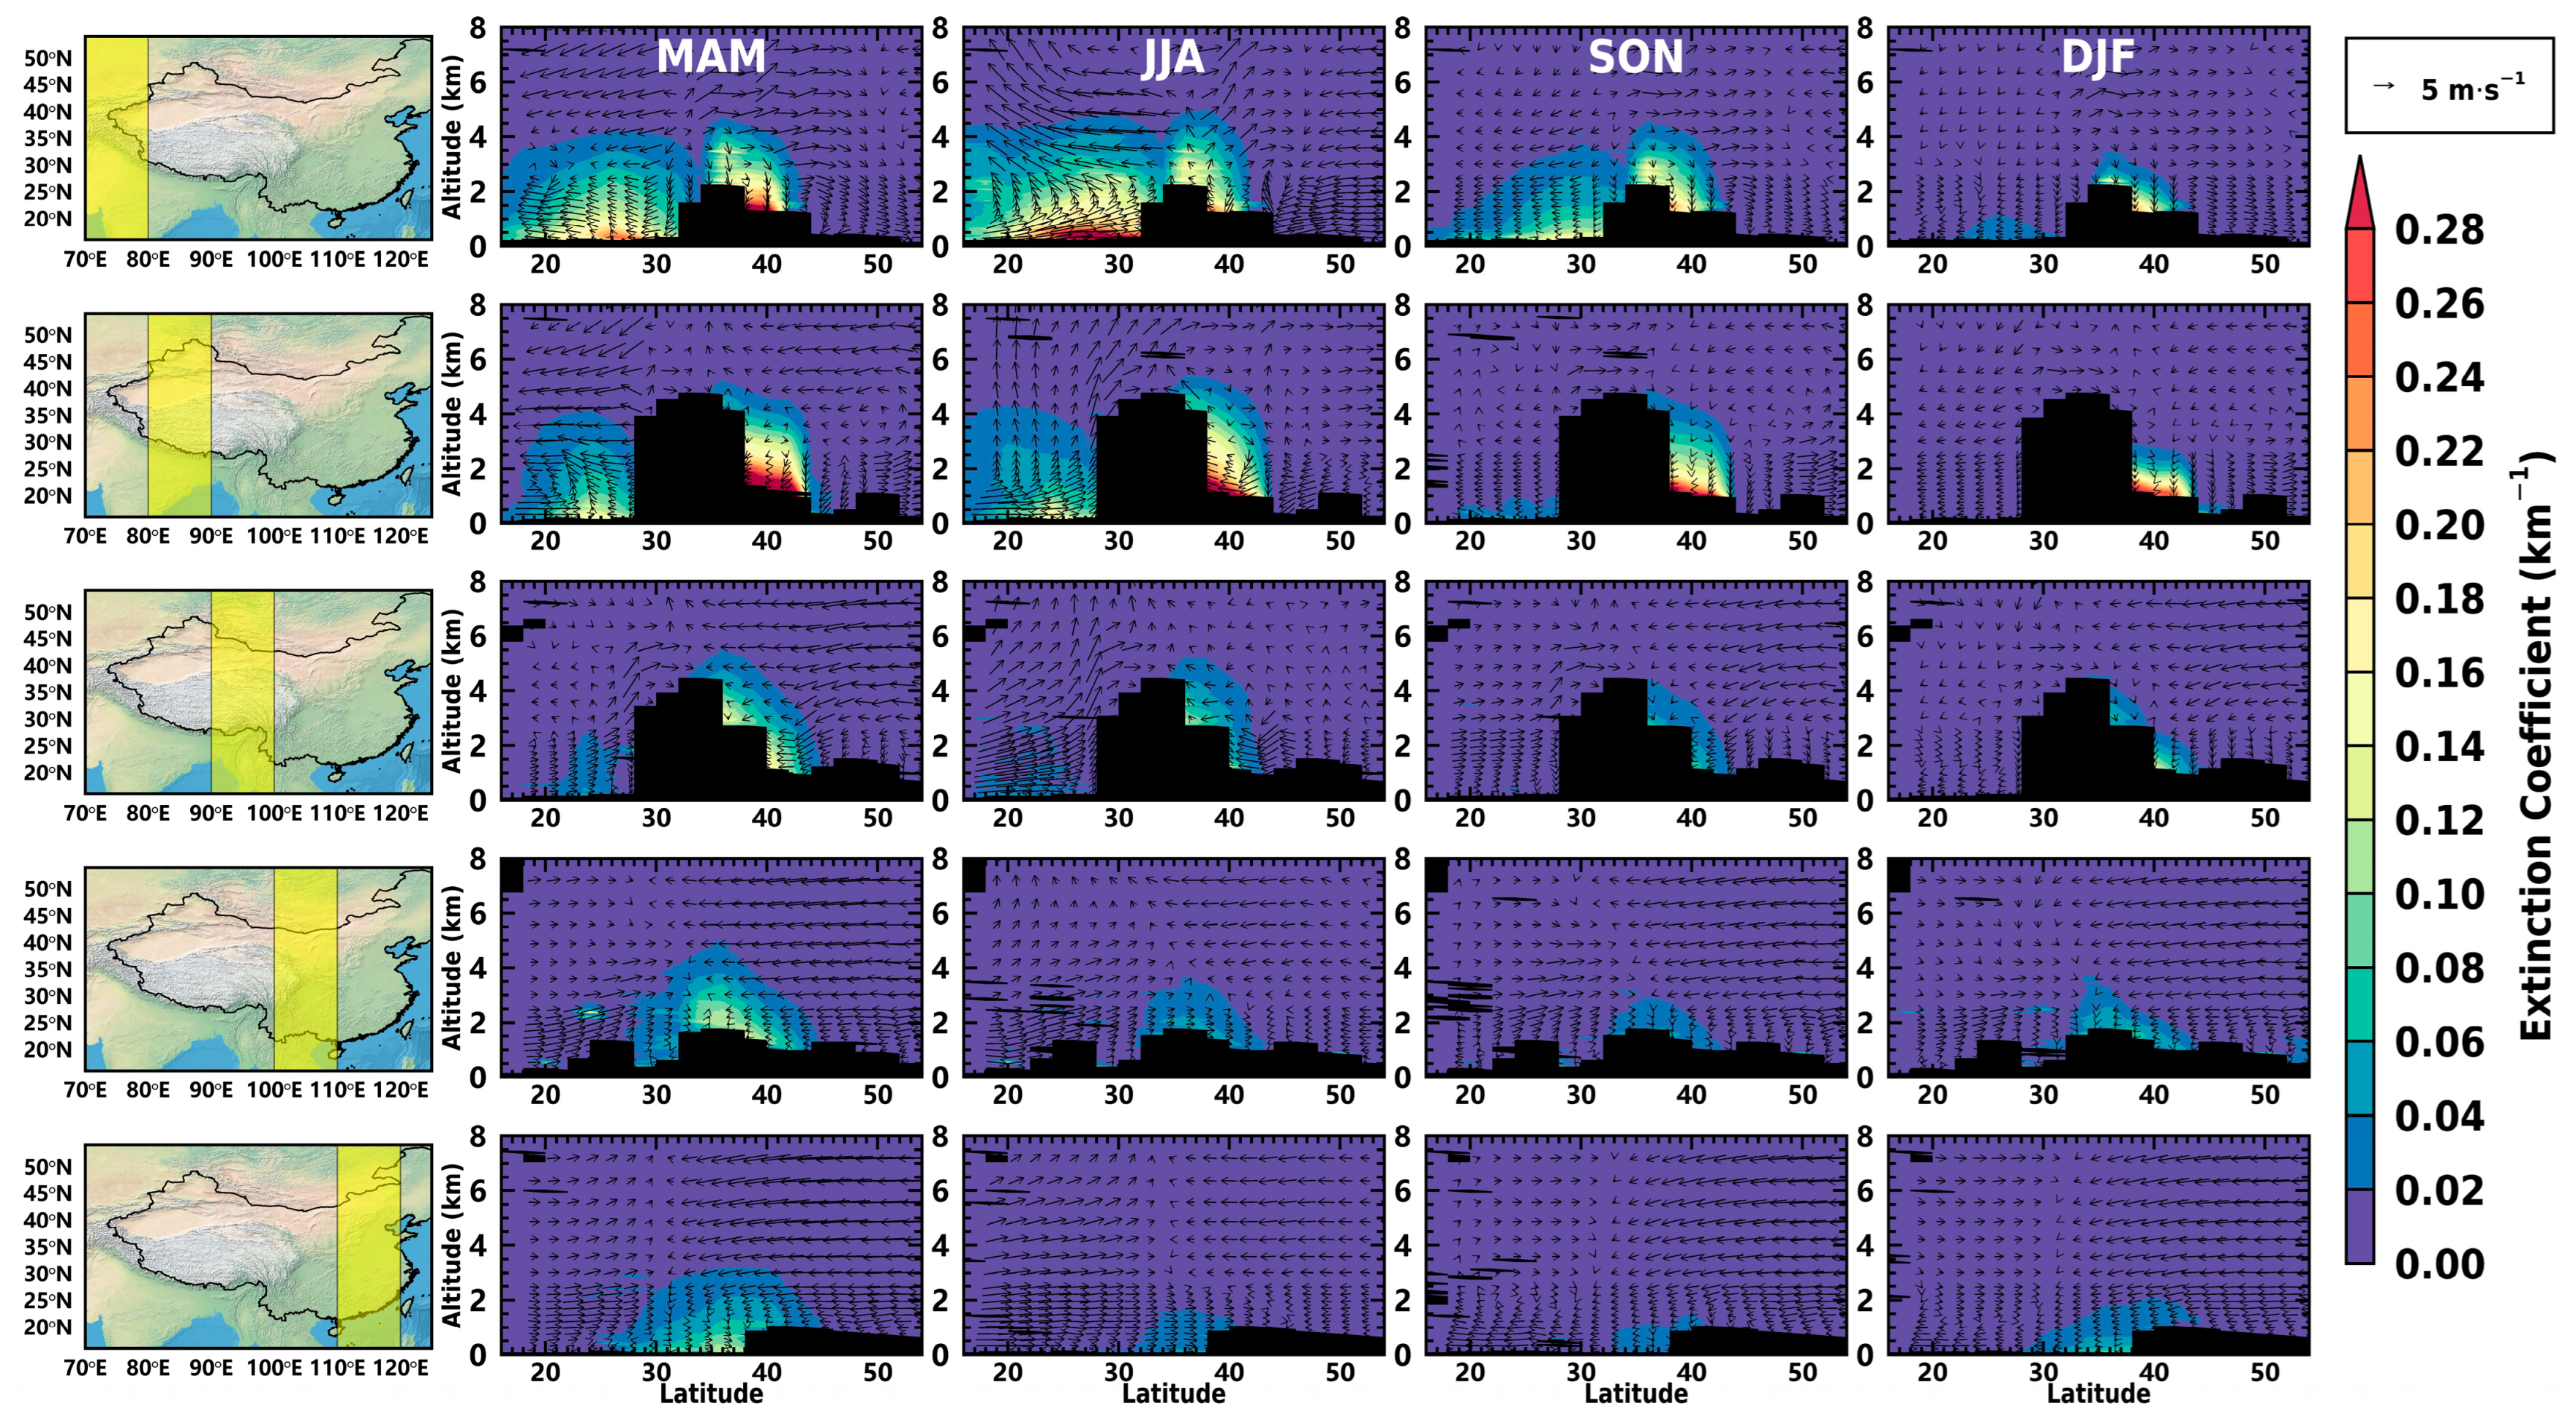
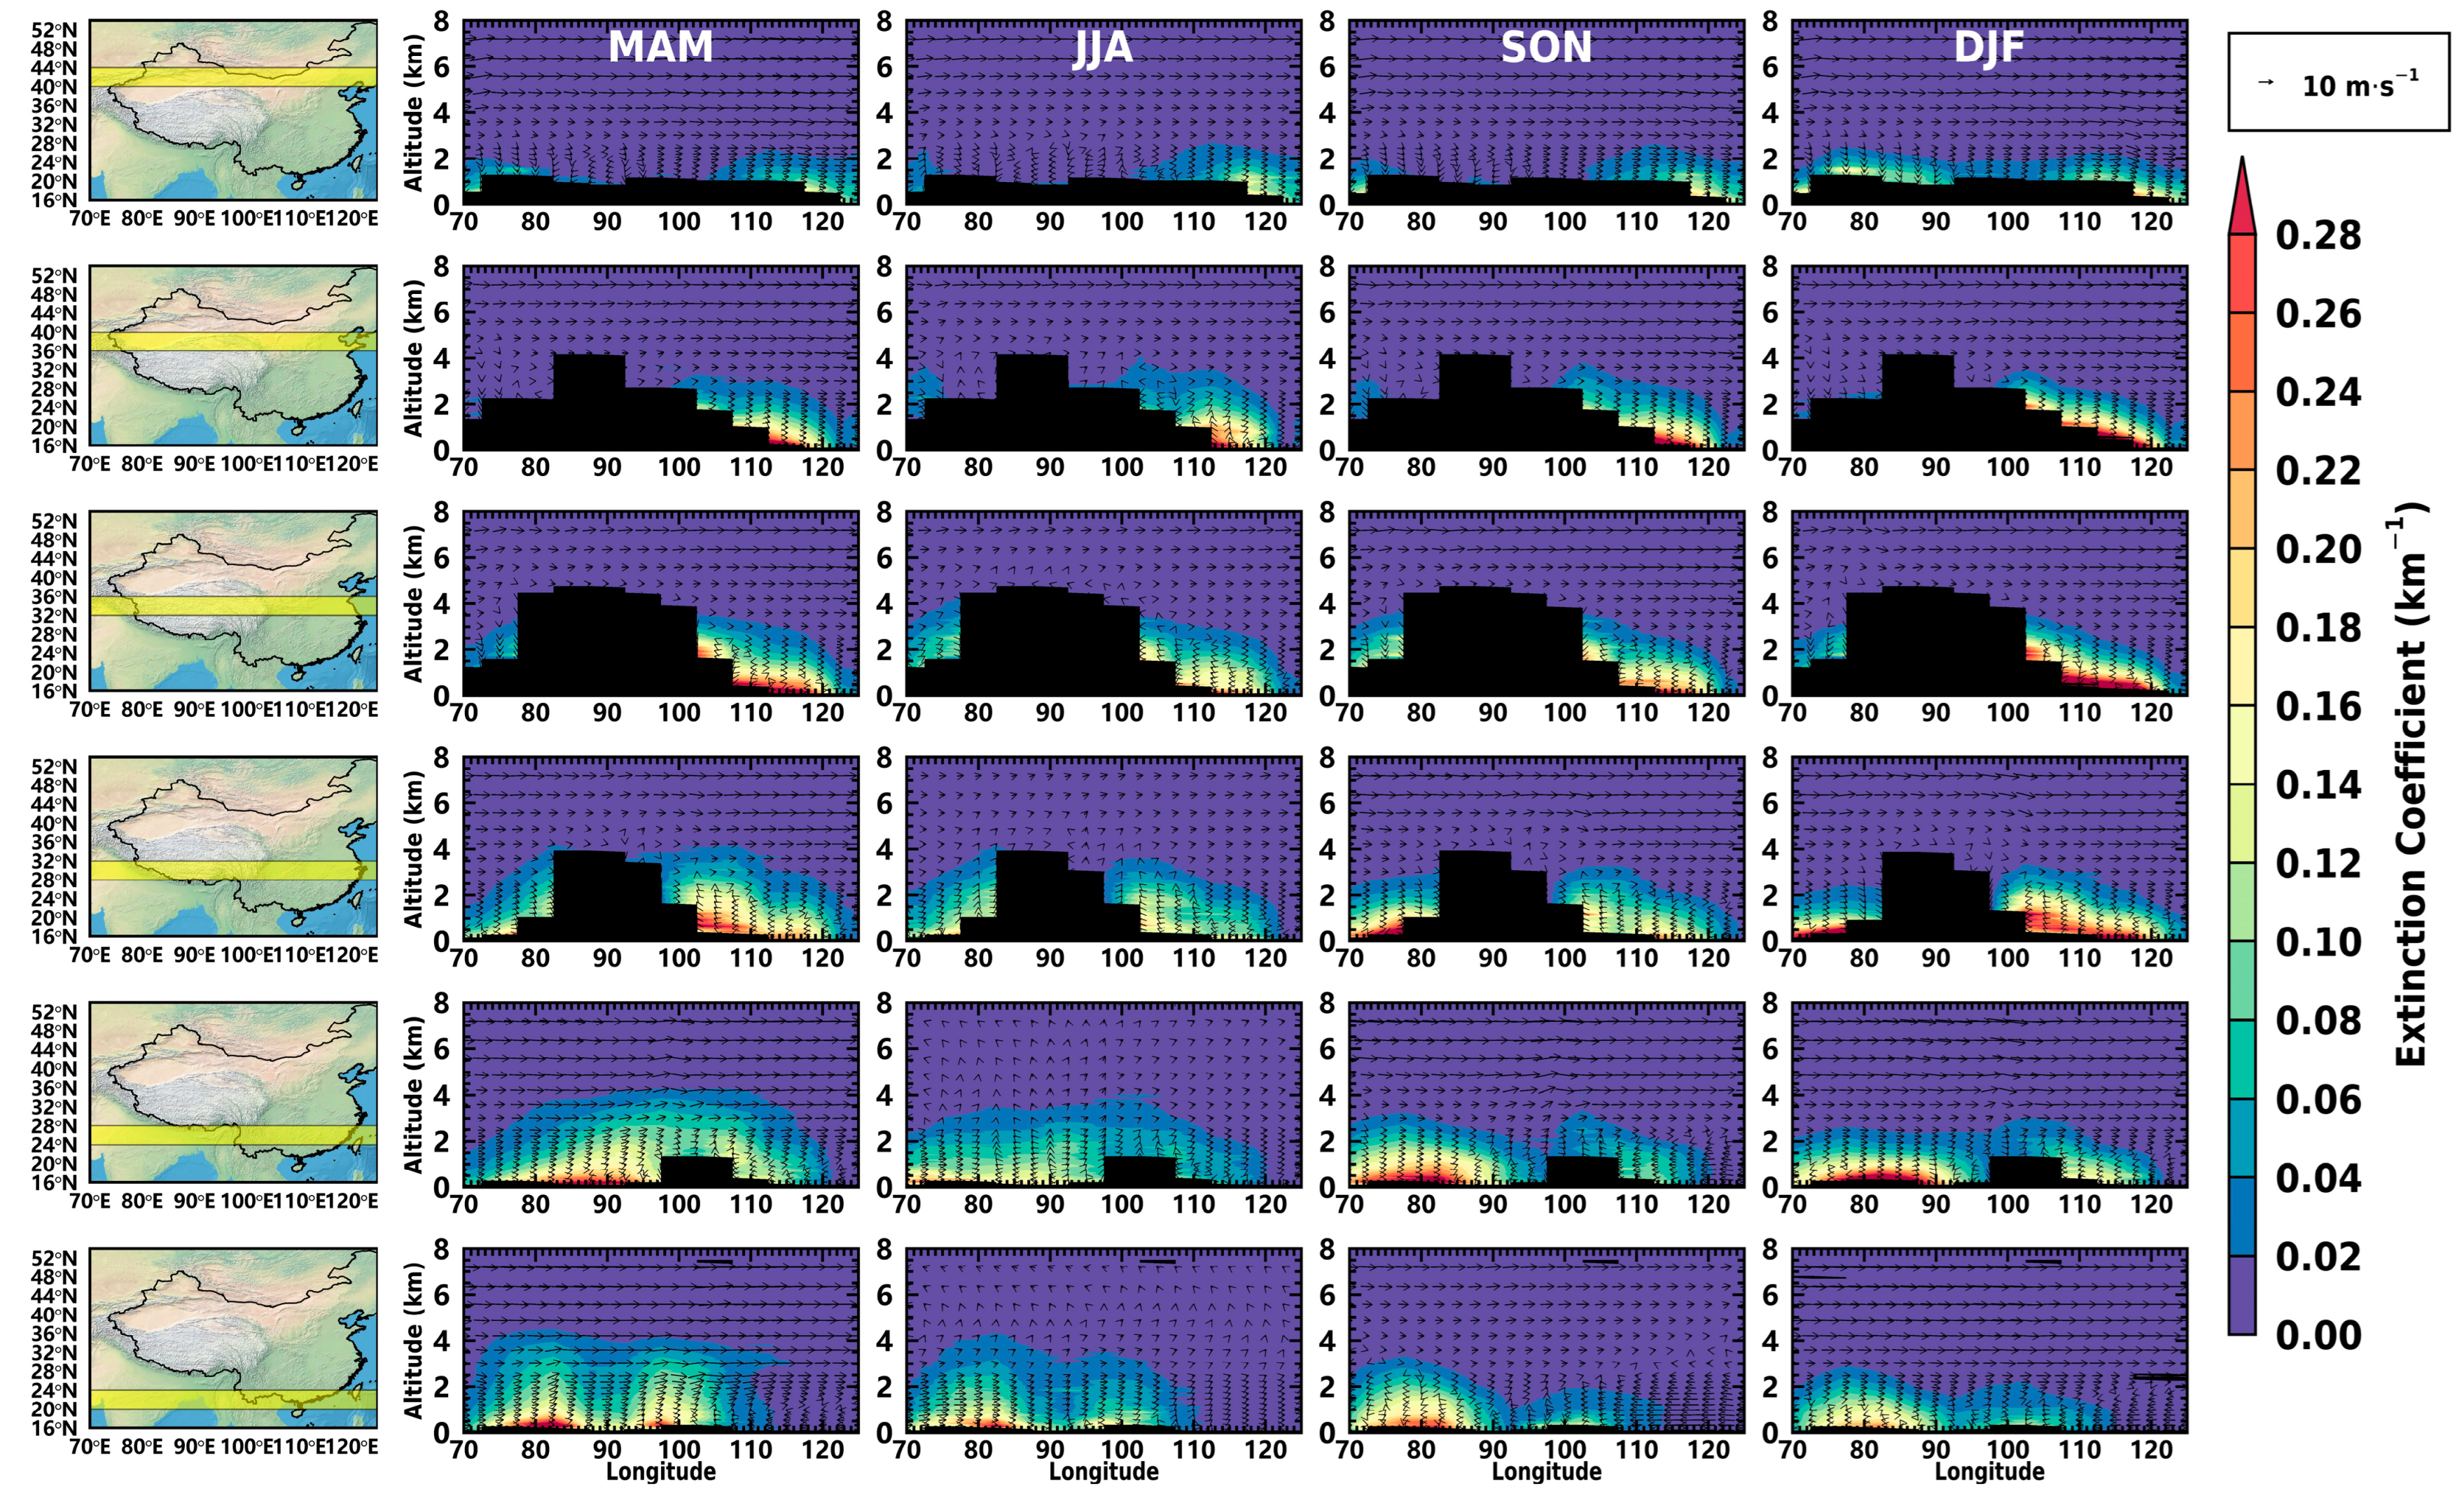
In order to show the regional transport of dust aerosols more clearly, we divided the study area into several latitudinal and longitudinal belts in the east–west and north–south directions, respectively. The vertical distributions of the dust extinction coefficient (σD) in the north–south and east–west belts are shown in Figure 4 and Figure 5, respectively. The five north–south and six east–west belts are partitioned by intervals of 10° and 4° within 70–120°E and 20–44°N, respectively. Three major dust sources, e.g., the Thar Desert (TRD), the Taklimakan Desert (TD) and the Gobi Desert (GD), show distinctive seasonal features. The heaviest dust loading over the TRD appeared in summer, while it appeared in spring over the TD and GD. The dust layer top was highest in summer in the TD and TRD, while that was in spring in the GD. Dust aerosols over the TP were mainly from the TD with the largest transport in spring, and partly from the TRD with the most occurrence in summer [50]. In the Qaidam Basin, the σD was highest in spring followed by that in summer and the weakest was in autumn. The Loess Plateau and the nearby deserts are very important dust sources in spring due to low vegetation cover, a dry and loose soil surface and frequent cyclones [51]. The dust particles of the Loess Plateau could exceed 3 km in height with σD > 0.1 km−1, which facilitated long-range transport. In winter, its dust also could be uplifted to 2 km. The dust layer over east and north China could achieved 2 km in spring, then reduced significantly from summer to autumn and began to increase again from winter.
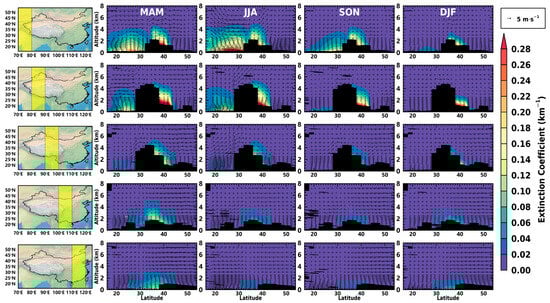
Figure 4.
Seasonal vertical distributions of dust extinction coefficient (σD) over five longitudinal belts (70–80, 80–90, 90–100, 100–110 and 110–120°E) during 2007–2020 (The black block indicates the mean elevation. The arrows represent the wind field).
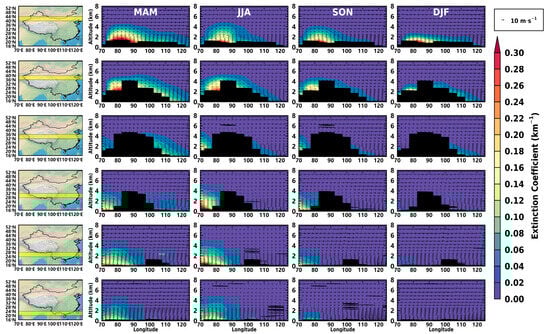
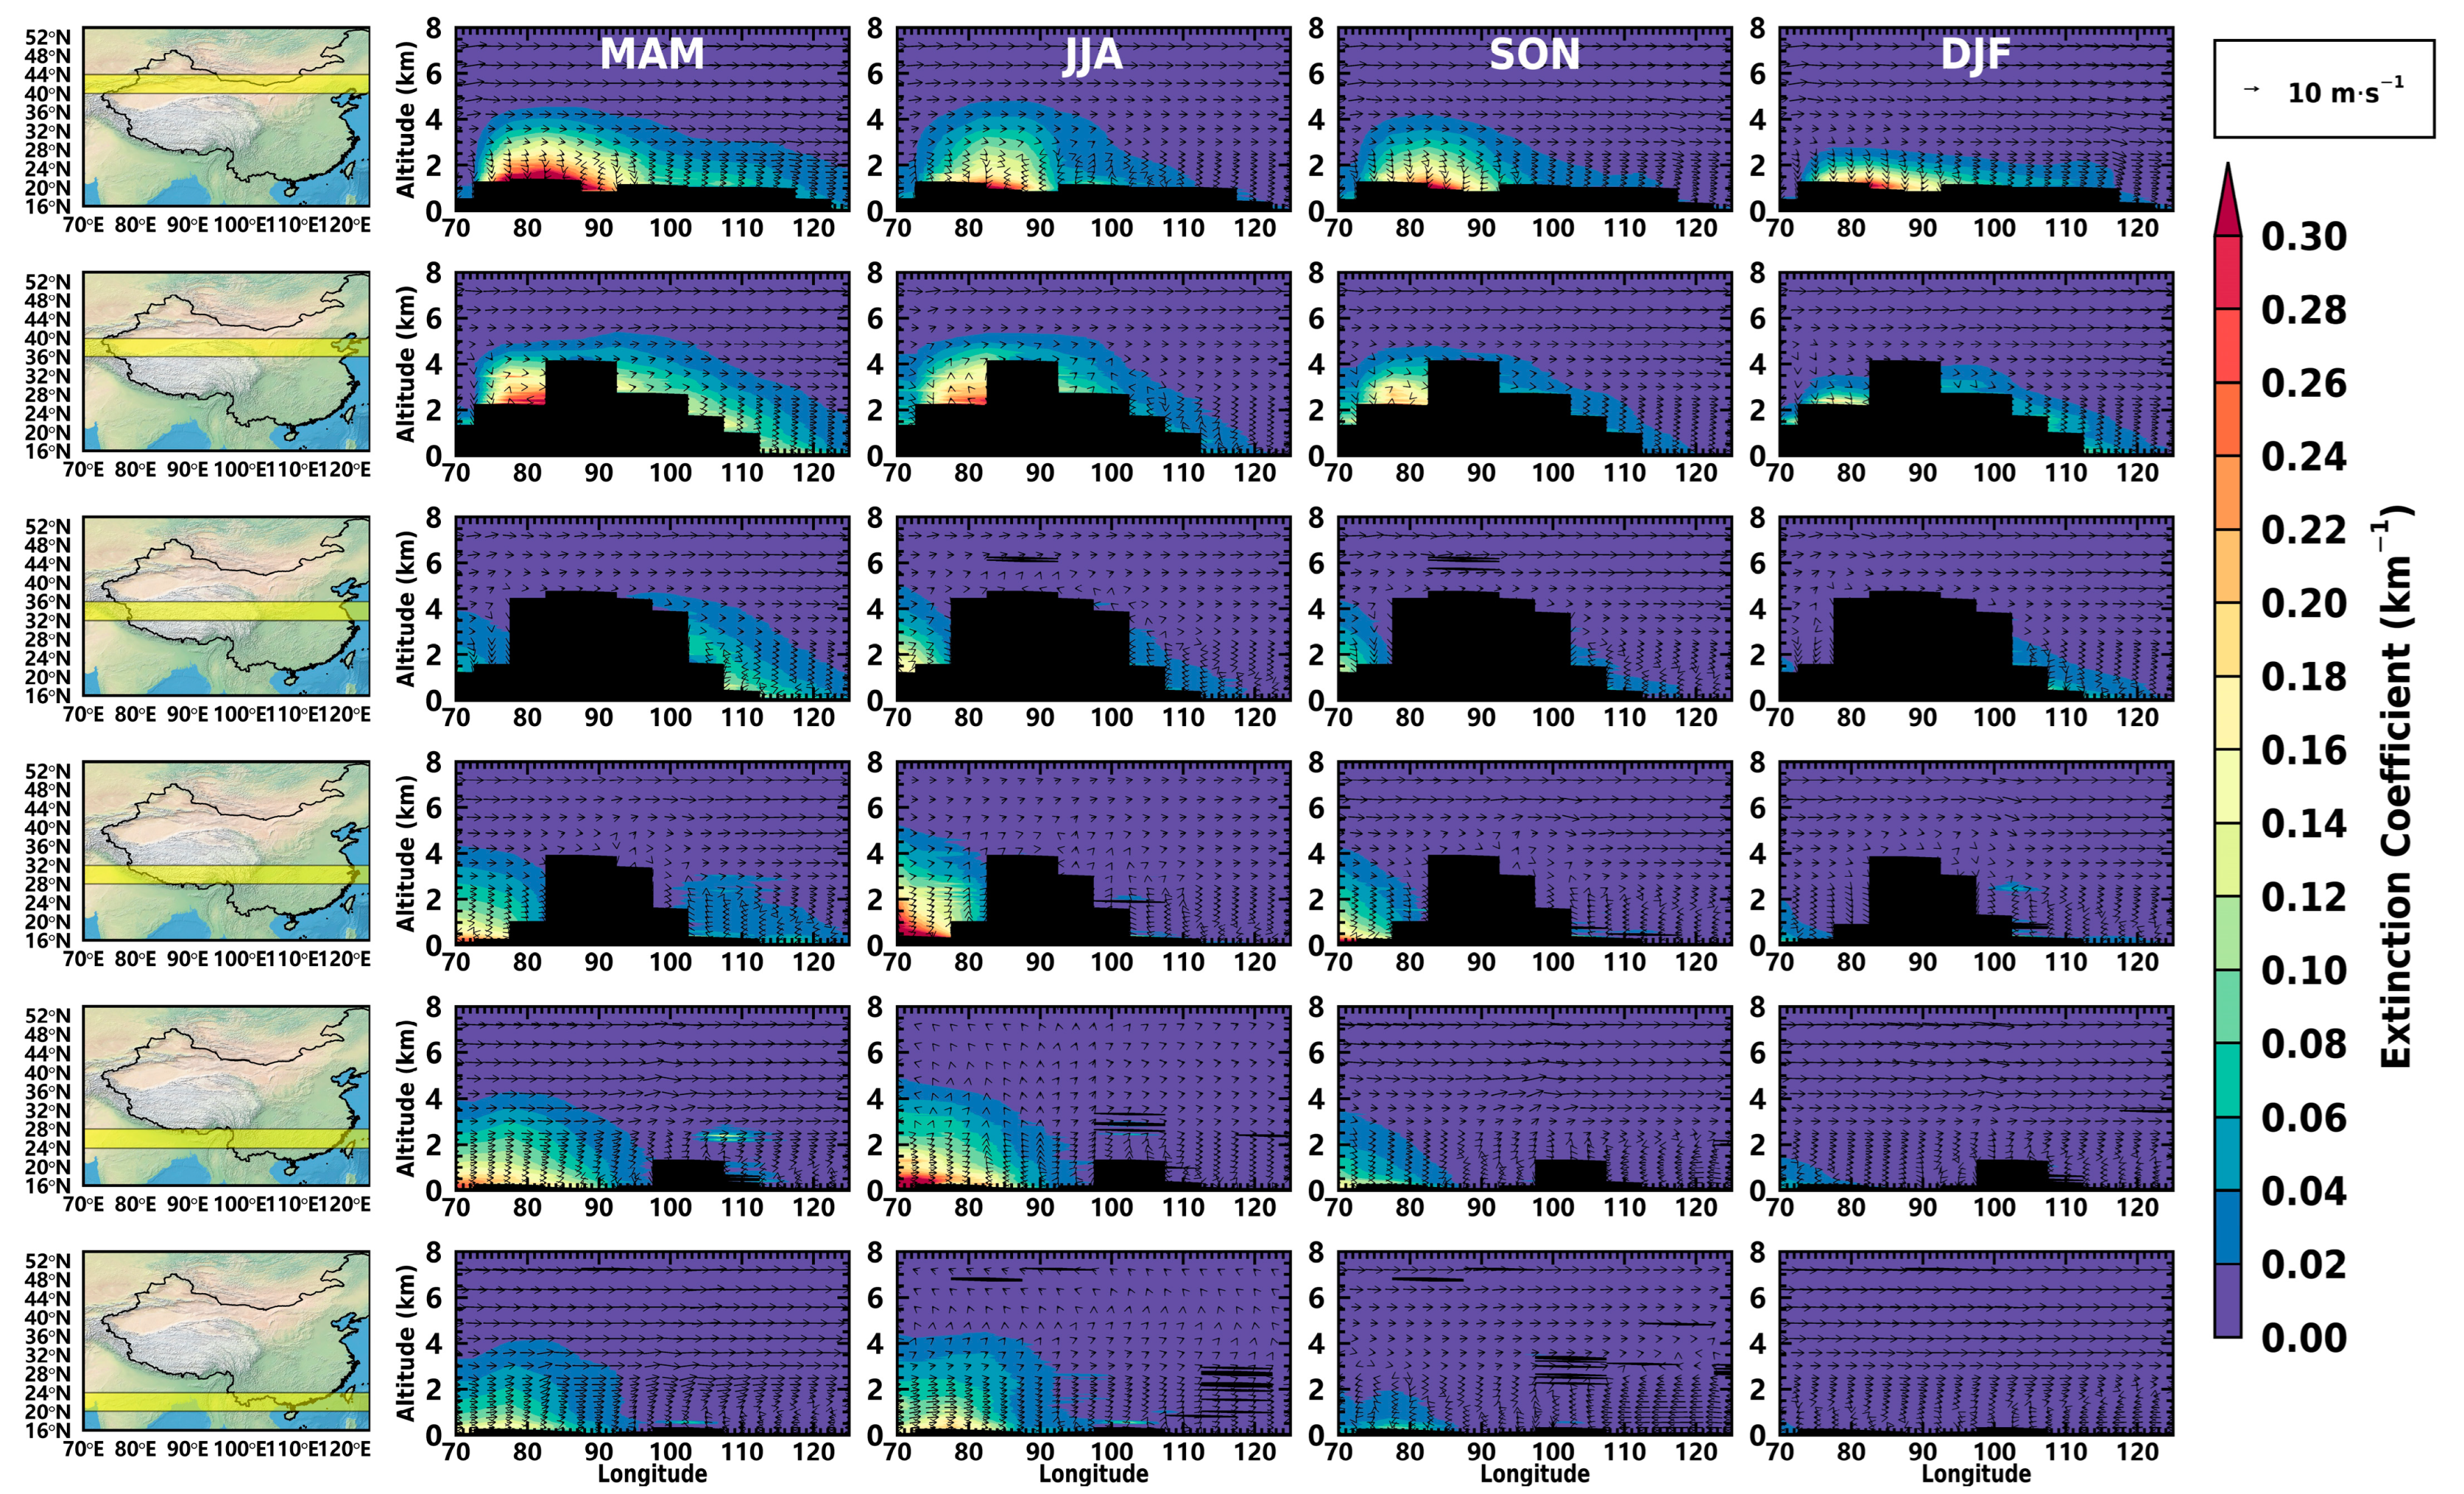
Figure 5.
Seasonal vertical distributions of σD over six latitudinal belts (20–24, 24–28, 28–32, 32–36, 36–40 and 40–44°N) during 2007–2020 (The black block indicates the mean elevation. The arrows represent the wind field).
Figure 5 shows the vertical distributions of σD in six east–west belts. Obviously, the belts of 36–44°N are the most important channels of conveying dust from west to east. On the way east, most of the TD dusts were blocked by the TP in the belt of 36–40°N, but the stronger vertical convection in spring and summer favored the transport of dust across the TP to the east regions, especially in summer, which is consistent with the findings by Liu et al. [52]. Although more dusts were stagnated on the southern slope of the TP as seen from the belt of 28–32°N, some dust from the TRD can climb up to the TP in summer under the favorable conditions of vertical convection and topography, such as the plateau “pump” effect [53]. In spring and summer, the dust from the TRD covered almost the entire Indian subcontinent, but it can barely reach the south part of China due to the blockage of the Yunnan-Guizhou Plateau.
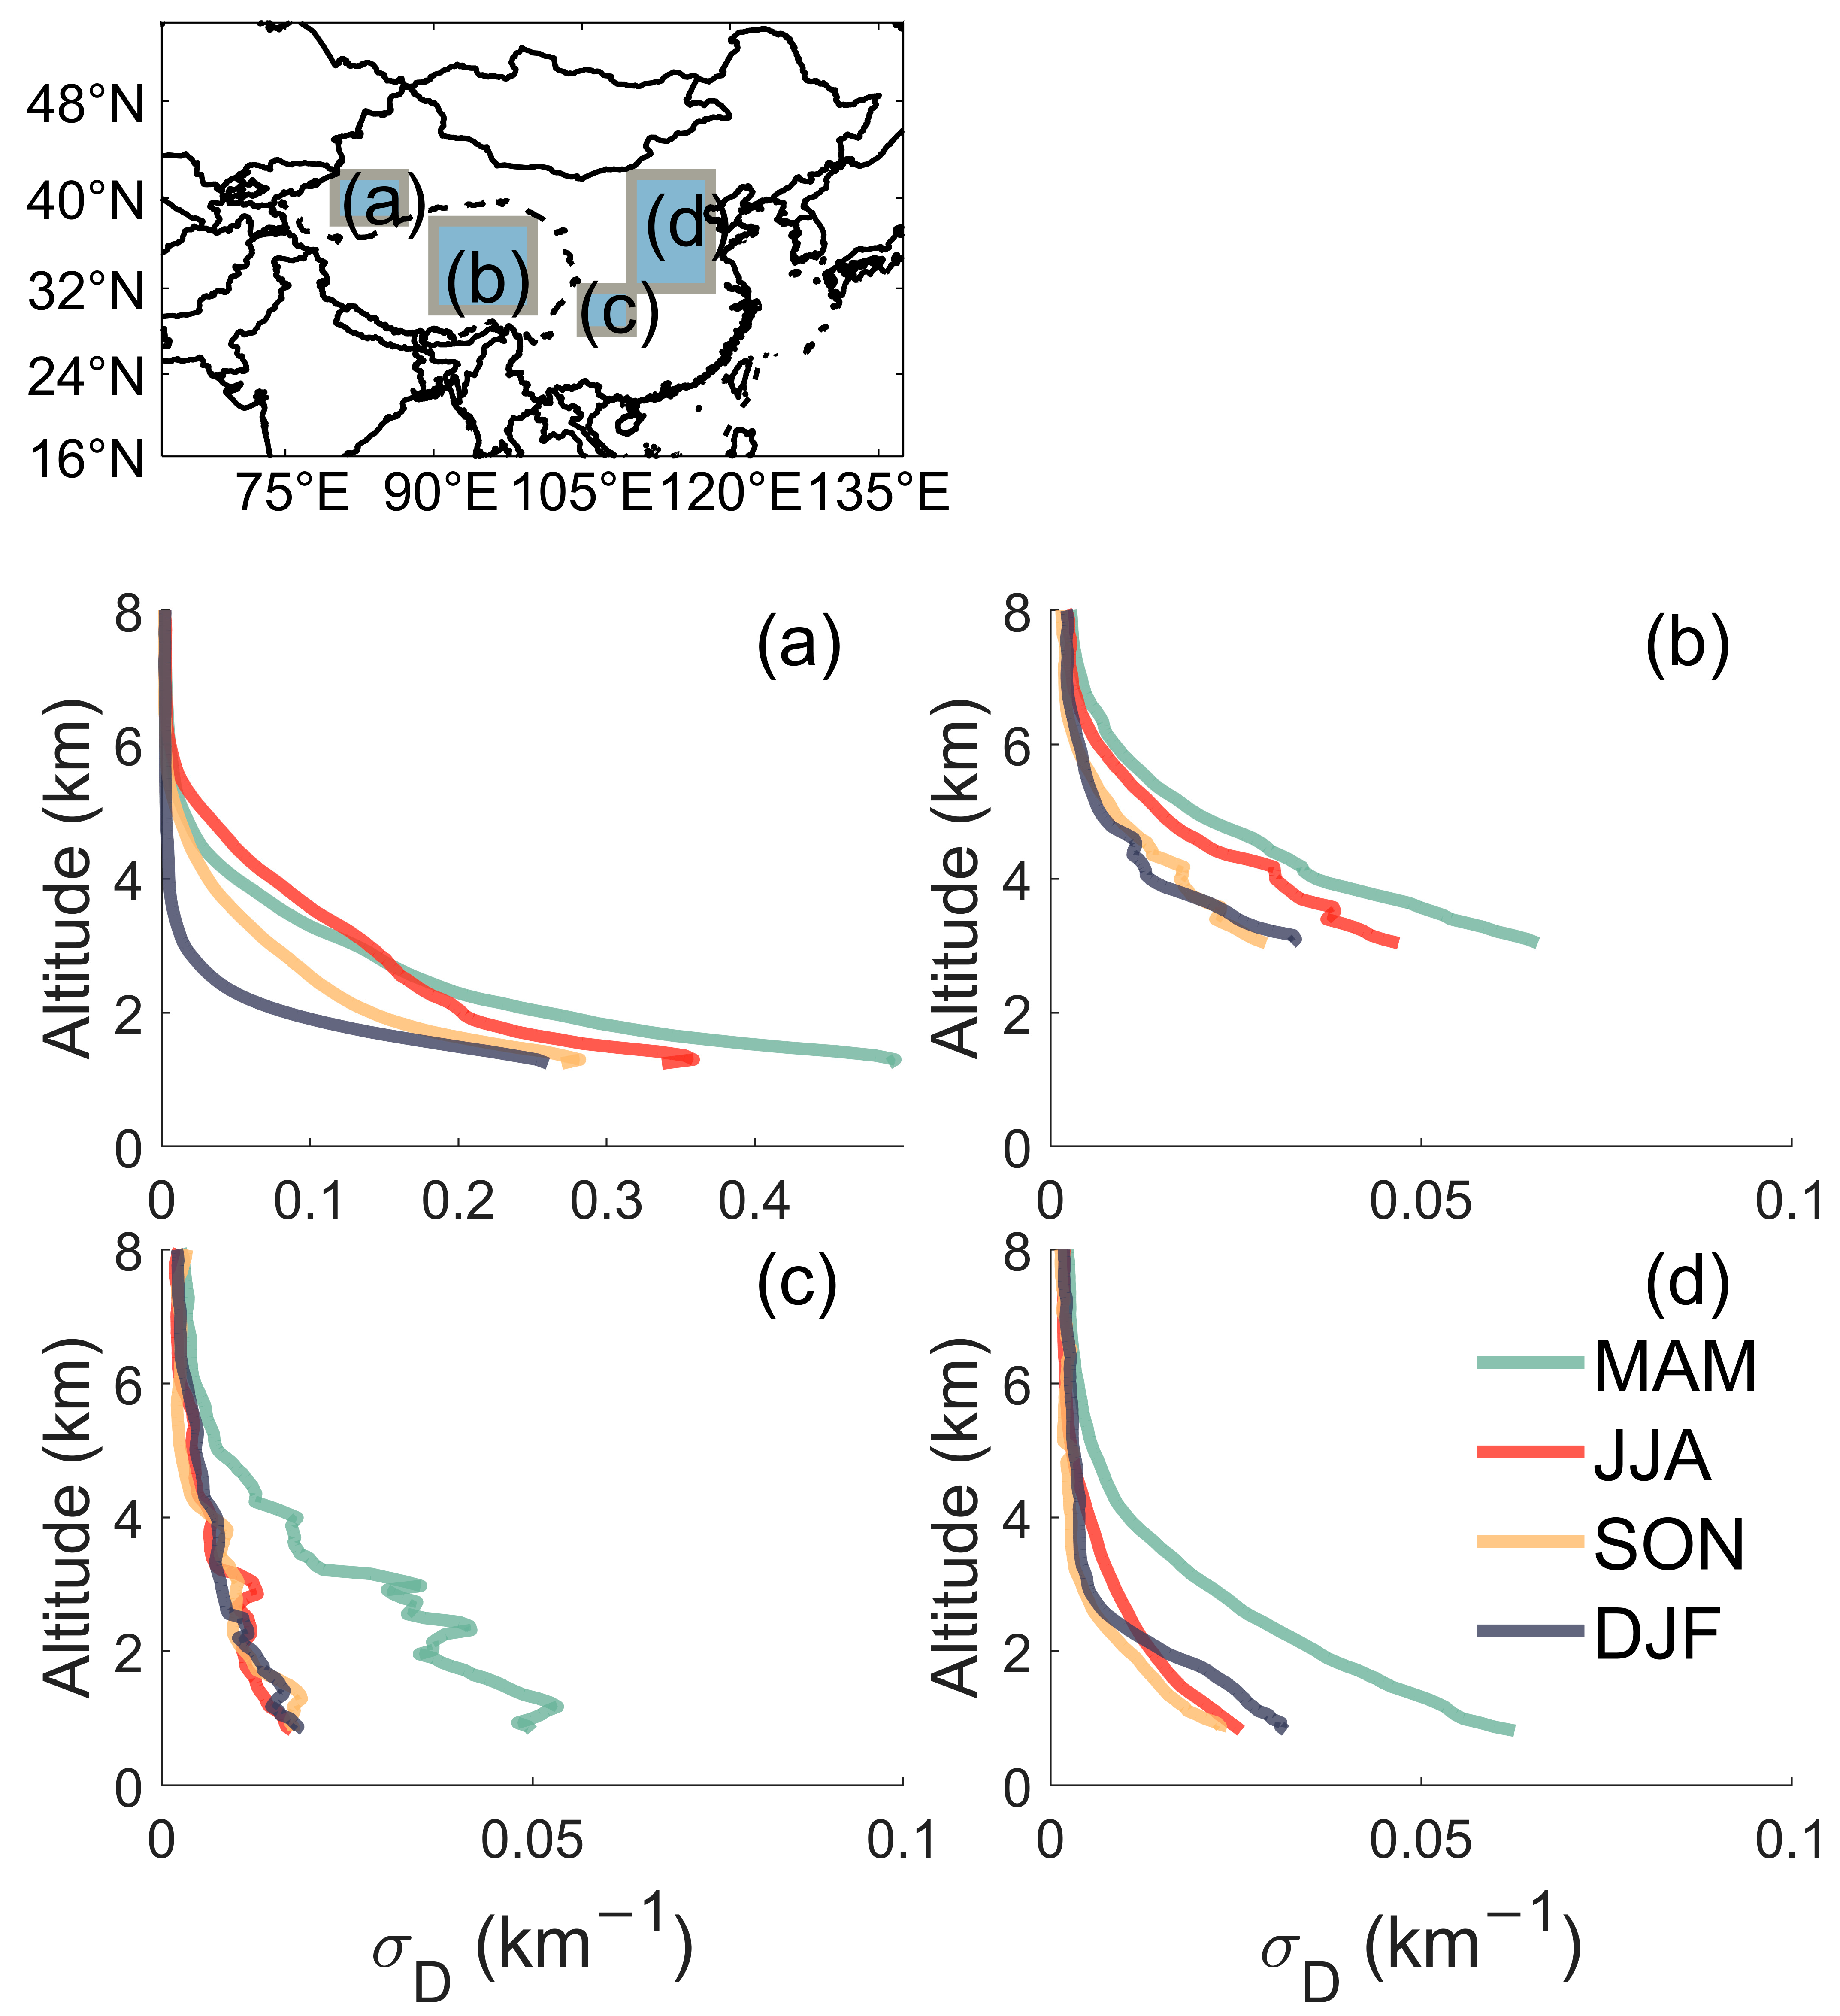
Figure 6 shows the seasonal average profiles of σD in four selected regions, which are the TD, the central TP, the Sichuan Basin (SCB), and north China, respectively. Over TD (Figure 6a), the maximal σD appeared in spring, followed by that in summer and autumn, while the minimum was in winter. Although the surface σD in spring was 1.5 times of that in summer, the summer σD appeared as the maximum above 3 km by virtue of the stronger convection. Despite the surface σD in spring being 1.5 times that in summer, the summer σD appeared as the maximum above 3 km by virtue of the stronger convection [11]. Although the surface values of σD were similar in autumn and winter, the σD declined much faster in winter due to the lower boundary layer height and the frequenter thermal inversions [50]. Over the central TP (Figure 6b), the σD in spring appeared as the largest one at all heights, followed by that of summer, and reduced to nearly half in autumn and winter. In the Sichuan Basin (Figure 6c), the σD below 4 km in spring was more than two times of that in the other seasons. In North China (Figure 6d), the σD of spring was 2–3 times higher than that in the other seasons, with the smallest one was in autumn. The σD below 2 km in summer was smaller than that of winter, while higher above that height this pattern was reversed, which was contributed by the higher mixing layer height in summer. Generally, the σD of spring appeared as the maximum at most altitudes over the four sub-regions, while it was significantly smaller in autumn and winter.
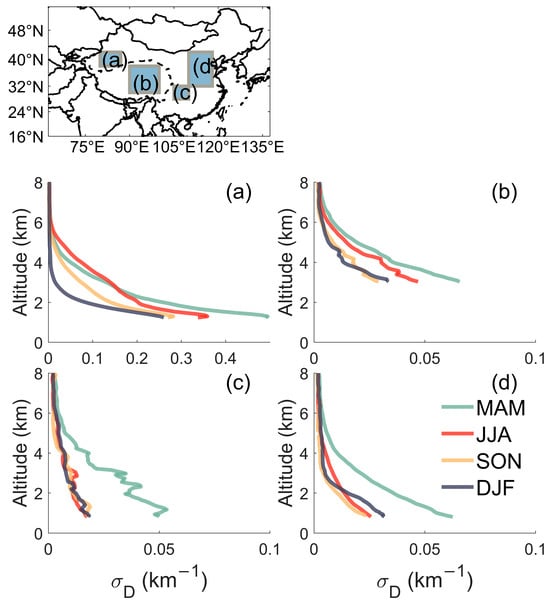
Figure 6.
Seasonal profiles of σD over (a) the Taklamakan Desert, (b) the central Tibetan Plateau, (c) the Sichuan Basin and (d) north China.
As the dusts travel east and south, they can combine with local aerosols to form the so-called polluted dusts. Figure 7 and Figure 8 show the distributions of the polluted dust extinction coefficient (σPD) in several latitudinal and longitudinal belts. It clearly shows that there were two major areas with high concentrations of polluted dust, which were the Indo-Gangetic Plain and eastern China. Although the σPD was larger in winter and autumn, it was restricted to a lower height compared with that in spring and summer. The largest value of σPD appeared in winter in four of the five belts (Figure 7), but the top with σPD > 0.05 km−1 was 1–2 km higher in spring and summer. In the belt of 90–100°E, it can be clearly seen that the polluted dust could be uplifted high enough and transported to the TP along the south slope of the TP in spring and summer. In the belt of 100–110°E, with the conducive topography, the Sichuan Basin (28–32°N) held the highest concentration of polluted dust all year-round. The maximum of σPD near the surface was in winter, followed by that in spring. The prevailing southerly and northerly winds on the southern and northern sides of the Sichuan Basin facilitated the accumulation of pollutants in the basin. In 110–120°E, the high-value center of σPD was located in the North China Plain (32–40°N), which is a highly populated and industrial area in China. Although it was raised higher in spring and summer, the polluted dust could be transported further south in autumn and winter under the more consistent prevailing northerly wind, which could reach the furthest of ~20°N in winter. Additionally, some polluted dusts from the Indian subcontinent could climb up the TP from the west side of the TP (in 70–80°E) with the help of a southerly wind in summer.
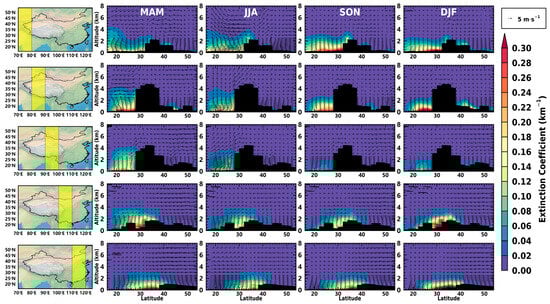
Figure 7.
Seasonal vertical distributions of polluted dust extinction coefficient (σPD) over five longitudinal belts (70–80, 80–90, 90–100, 100–110 and 110–120°E) during 2007–2020 (The black block indicates the mean elevation. The arrows represent the wind field).
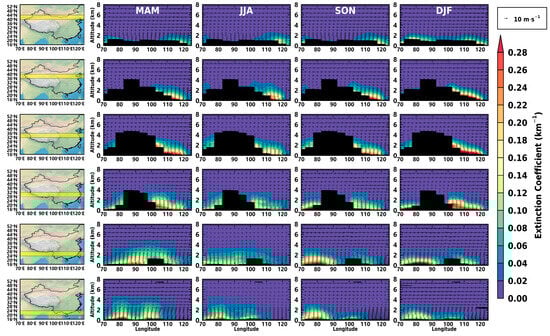
Figure 8.
Seasonal vertical distributions of σPD over six latitudinal belts (20–24, 24–28, 28–32, 32–36, 36–40 and 40–44°N) during 2007–2020 (The black block indicates the mean elevation. The arrows represent the wind field).
Figure 8 shows the vertical distributions of σPD at six east–west belts with the interval of 4 degrees from 20 to 44°N. Over the northern part of China (the northernmost belt), a polluted dust layer (~1 km thick) covered the whole areas from west to east in winter, while a thicker layer existed to the east of 100°E in the other seasons. In the belt of 36–40°N (the second row), the largest σPD always existed over the North China Plain (114–120°E) in all seasons. A large σPD also appeared near the surface over areas with higher altitude in winter. In eastern China (28–36°N, 110–120°E), there always existed a widely covered layer of polluted dust during winter and spring; it reduced to the minimum in summer partly due to the washing effect of precipitation. In the belt of 24–28°N, we see a distinct transport of polluted dust from the Indo-Gangetic Plain to southwest China in spring and summer under the favorable southwest monsoon. Huang et al. [54] pointed out that the particles could even be transported to Taiwan. Under the combined effect of the winter monsoon and the blocking of the Yunnan-Guizhou Plateau, the pollutants were confined to the local area in autumn and winter. Due to the lower planetary boundary layer height and slower wind speed, the near-surface σPD in the Indo-Gangetic Plain increased to the maximum in winter. In the southernmost belt, two high-σPD centers existed apparently in the Central India and Central Myanmar Basin, both of which showed maxima in spring and minima in winter.
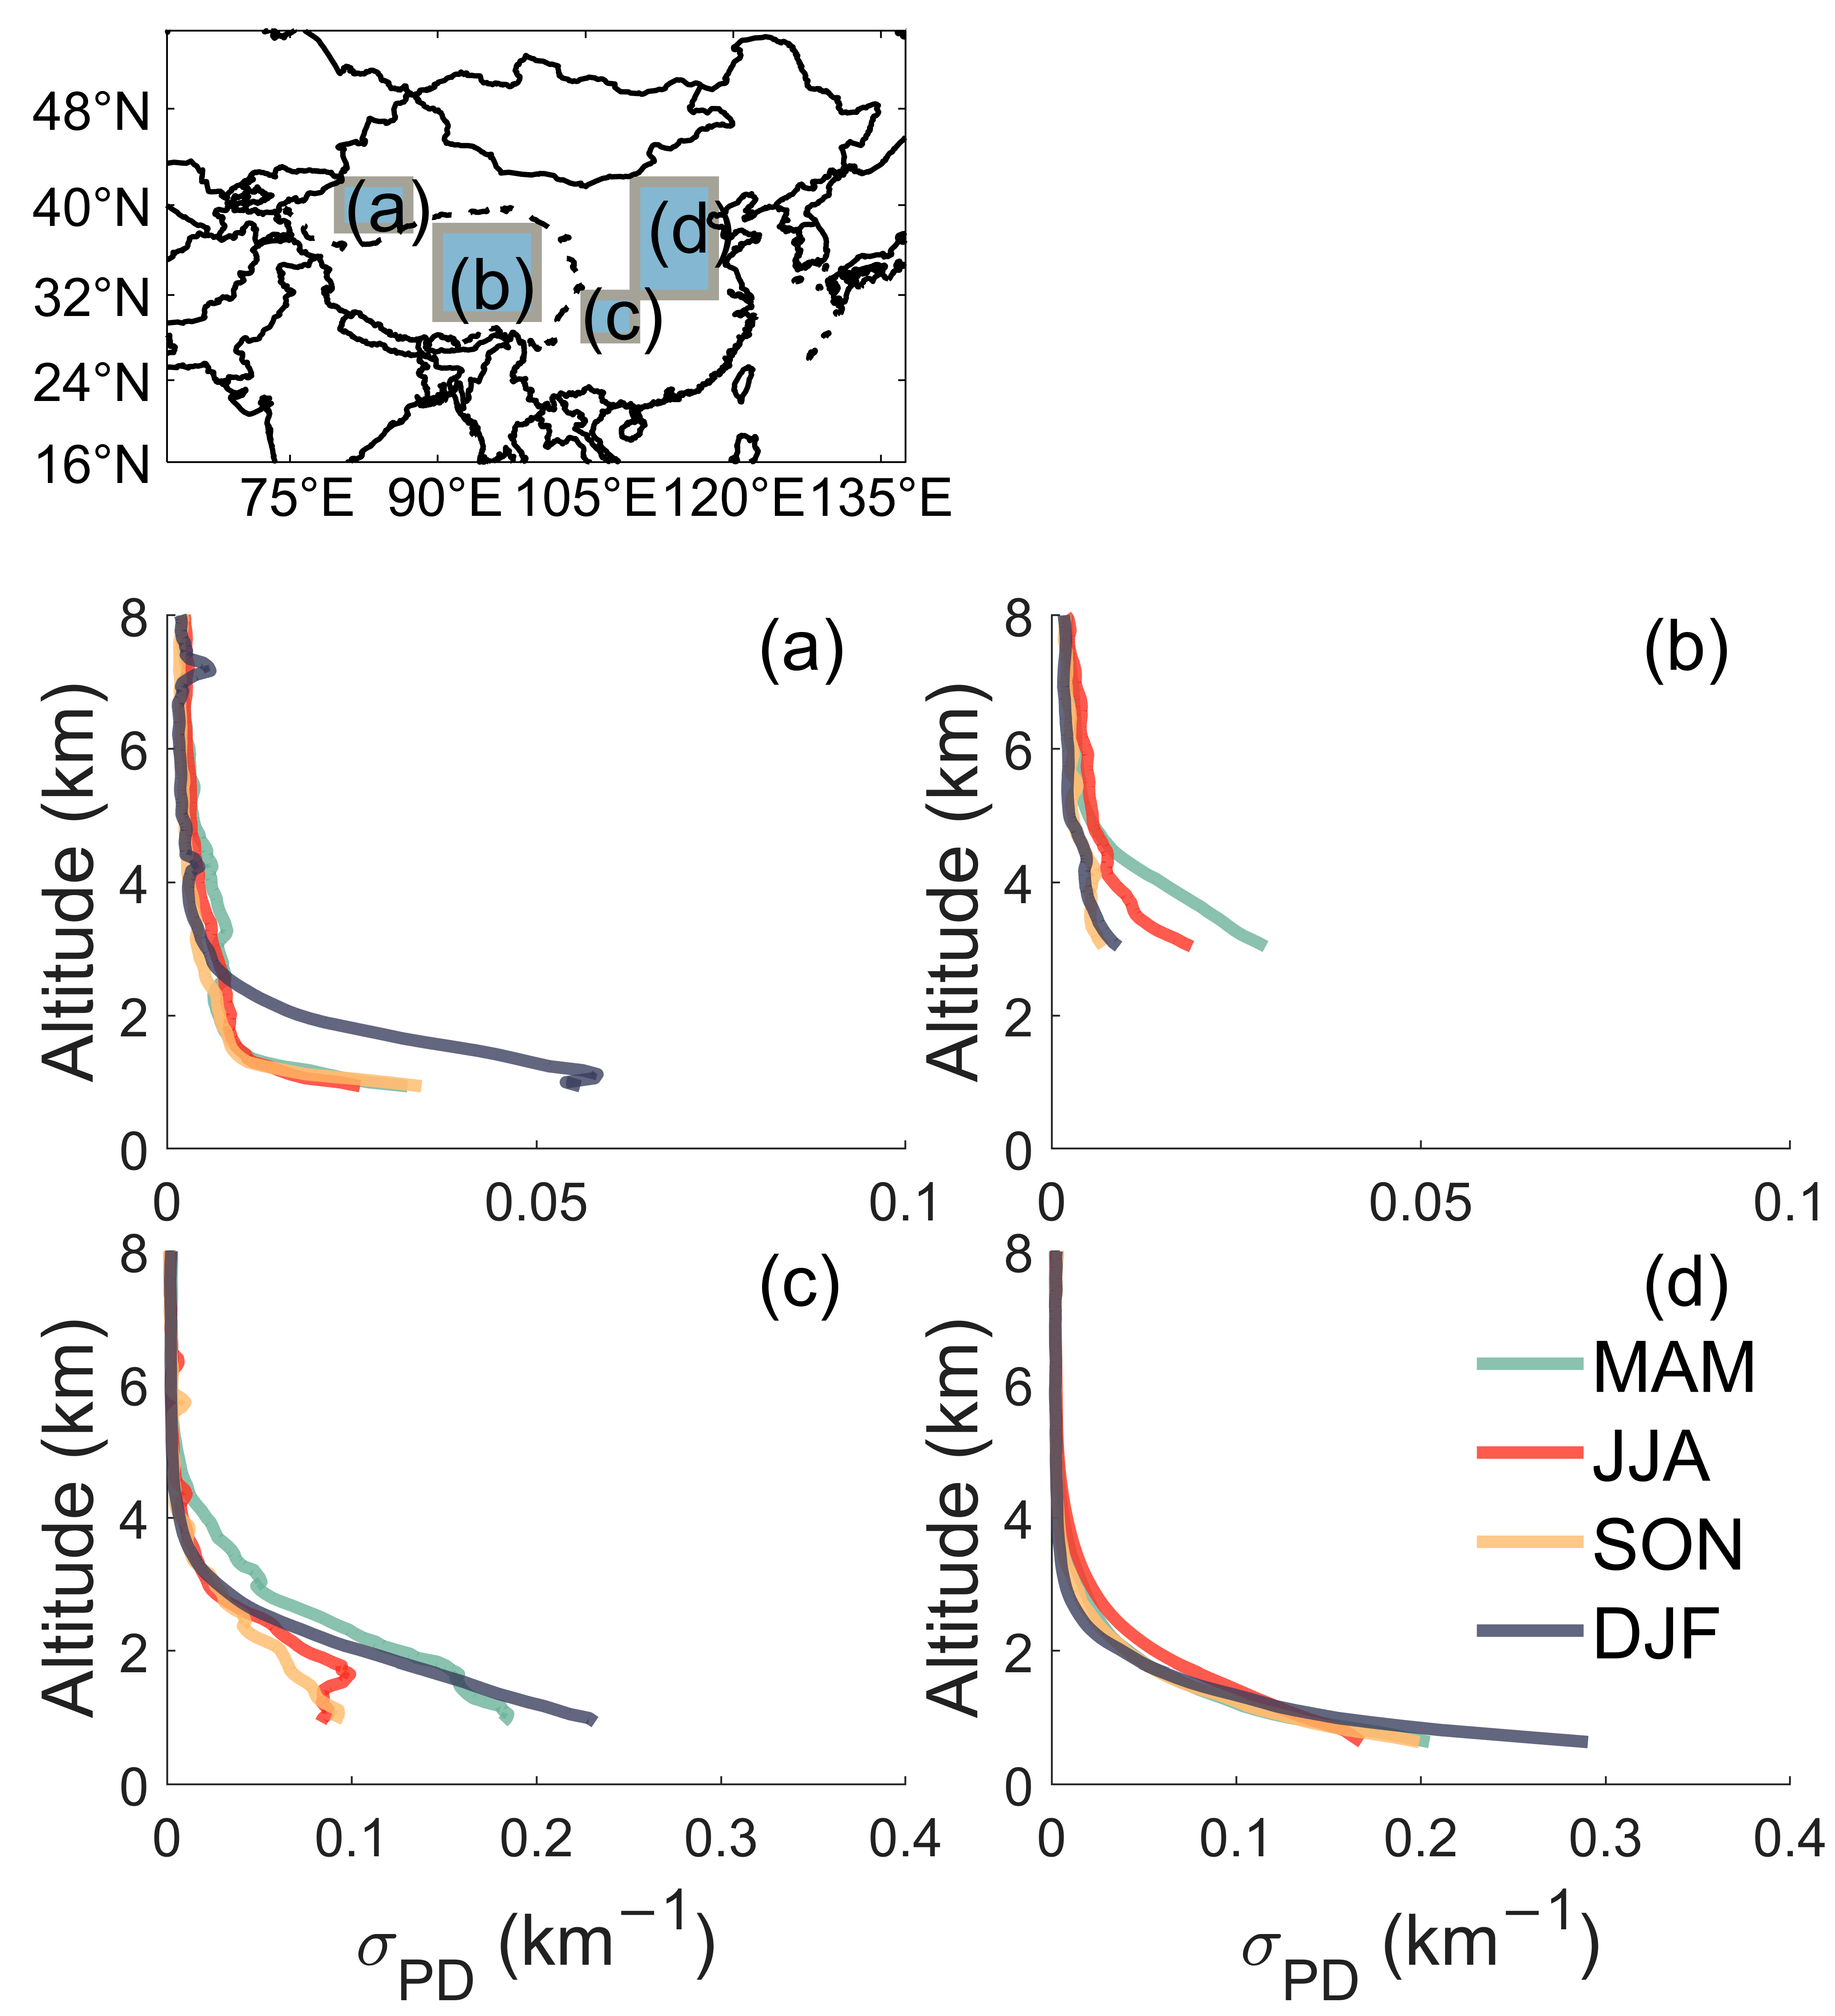
Figure 9 gives the seasonal mean profiles of σPD in four selected subregions. In the lower layer, the maximum of σPD appeared in winter in all regions except TP, whose maximum was in spring. The minimum of σPD was generally in summer in most regions, while that was in autumn on the TP, which is similar to the results found by Hu et al. [9]. The conditions of temperature inversion and lower boundary layer height in winter helped the accumulation of pollutants in the boundary layer, which confined the vertical development of pollutants and resulted in the fast decline of σPD with heights. In SCB, the σPD above 2 km reached its maximum in spring, while that happened in summer in north China. This may relate to the combined effect of the long-range transmission and local convection.
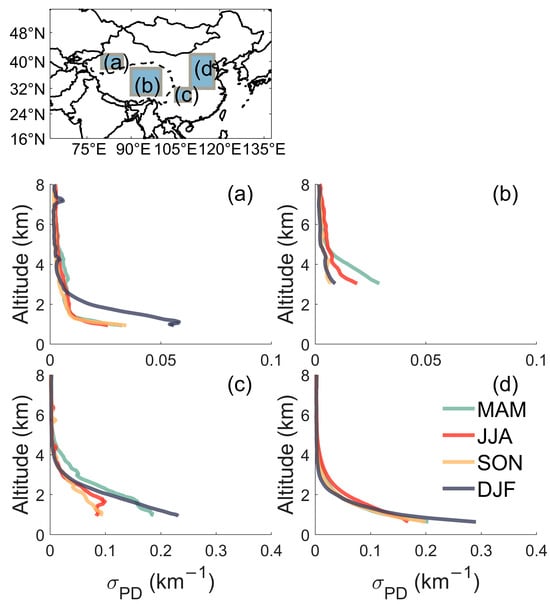
Figure 9.
Seasonal profiles of σPD over (a) the Taklamakan Desert, (b) the central Tibetan Plateau, (c) the Sichuan Basin, and (d) north China.
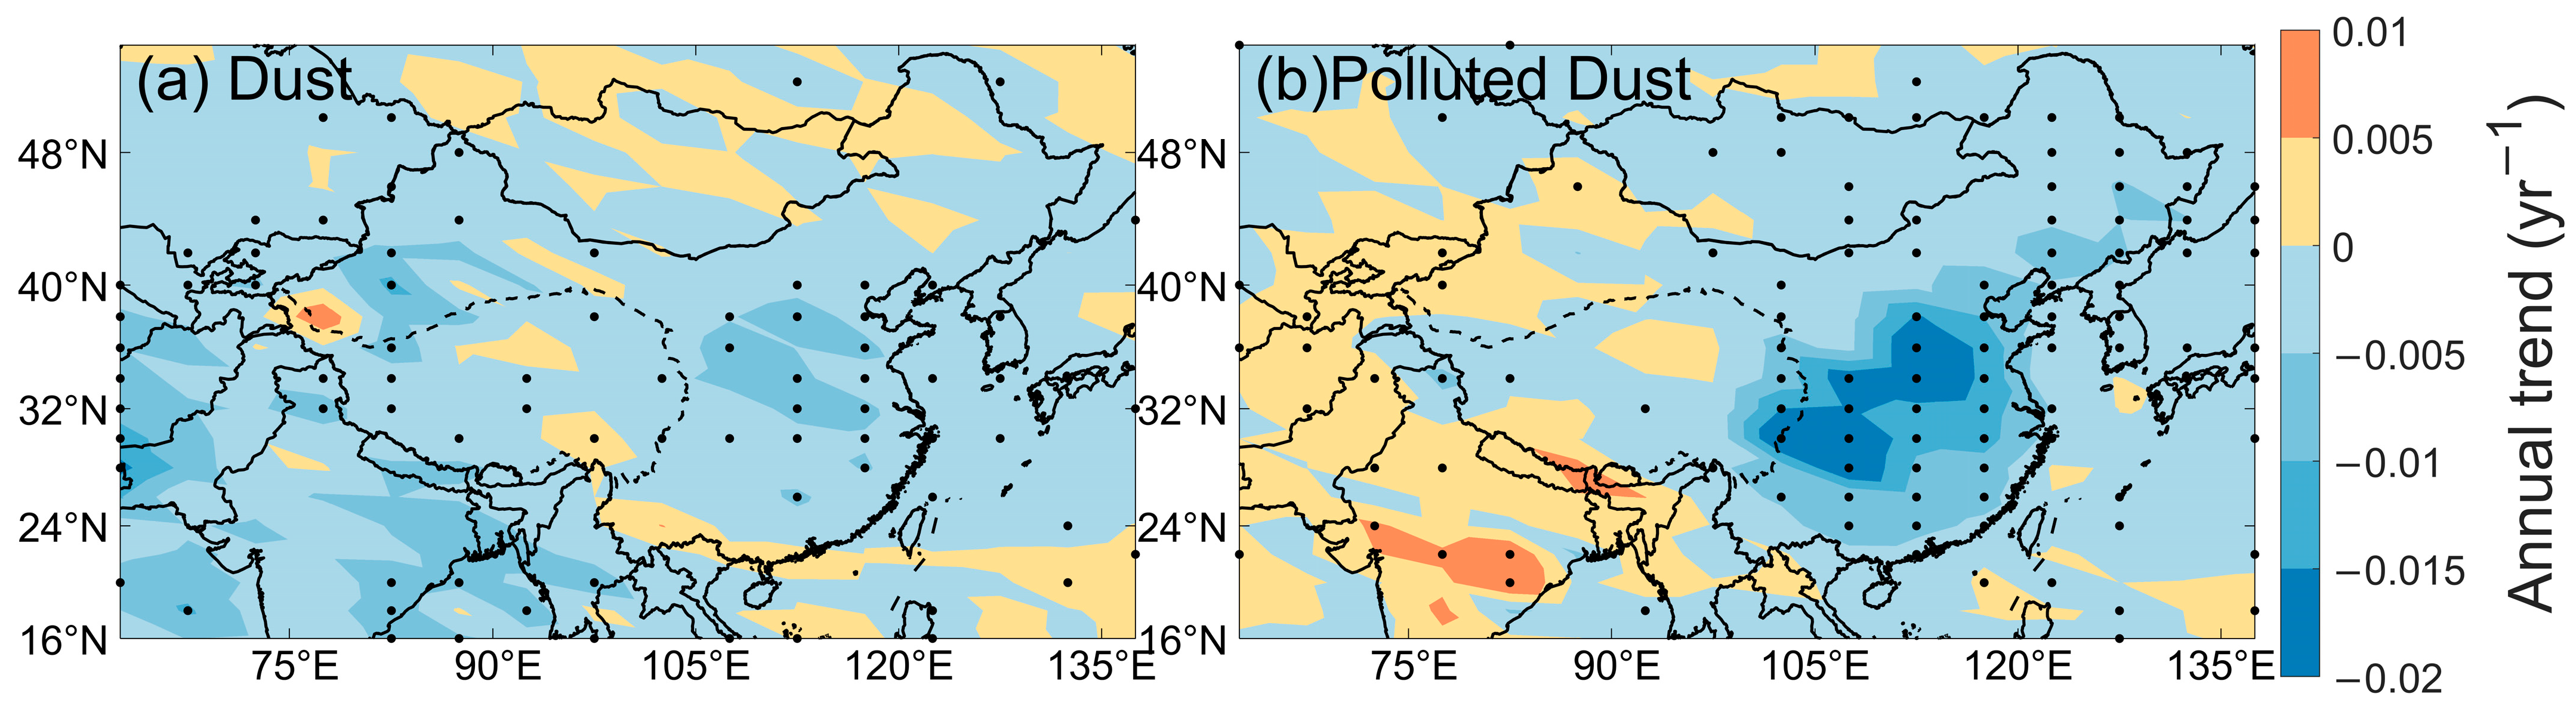
Figure 10a,b show the annual trends of DOD and PDOD during 2007 to 2020, respectively. They show distinct different distributions between the two aerosols. Both DOD and PDOD presented a decreasing trend in most areas, while PDOD showed some regional discrepancies. Although the DOD decreased in most areas of TD, it increased in the Hotan area below the northern slope of the TP. The PDOD mainly presented a decreasing trend in most China except in some areas of northwest China, where its increasing might be related to intensified human activities [55]. The most obvious decrease appeared from the Sichuan Basin to Henan Province. Differently, a significant increasing trend appeared in the Indian subcontinent, with the fastest increase in the central region. Additionally, a fast increment in PDOD also appeared in the eastern region of Nepal.

Figure 10.
Annual trends of (a) DOD and (b) PDOD during 2007–2020 (The dots represent the trend is significant at the confidence level of 0.05).
3.3. The Correlations between Meteorological Factors and DOD/PDOD
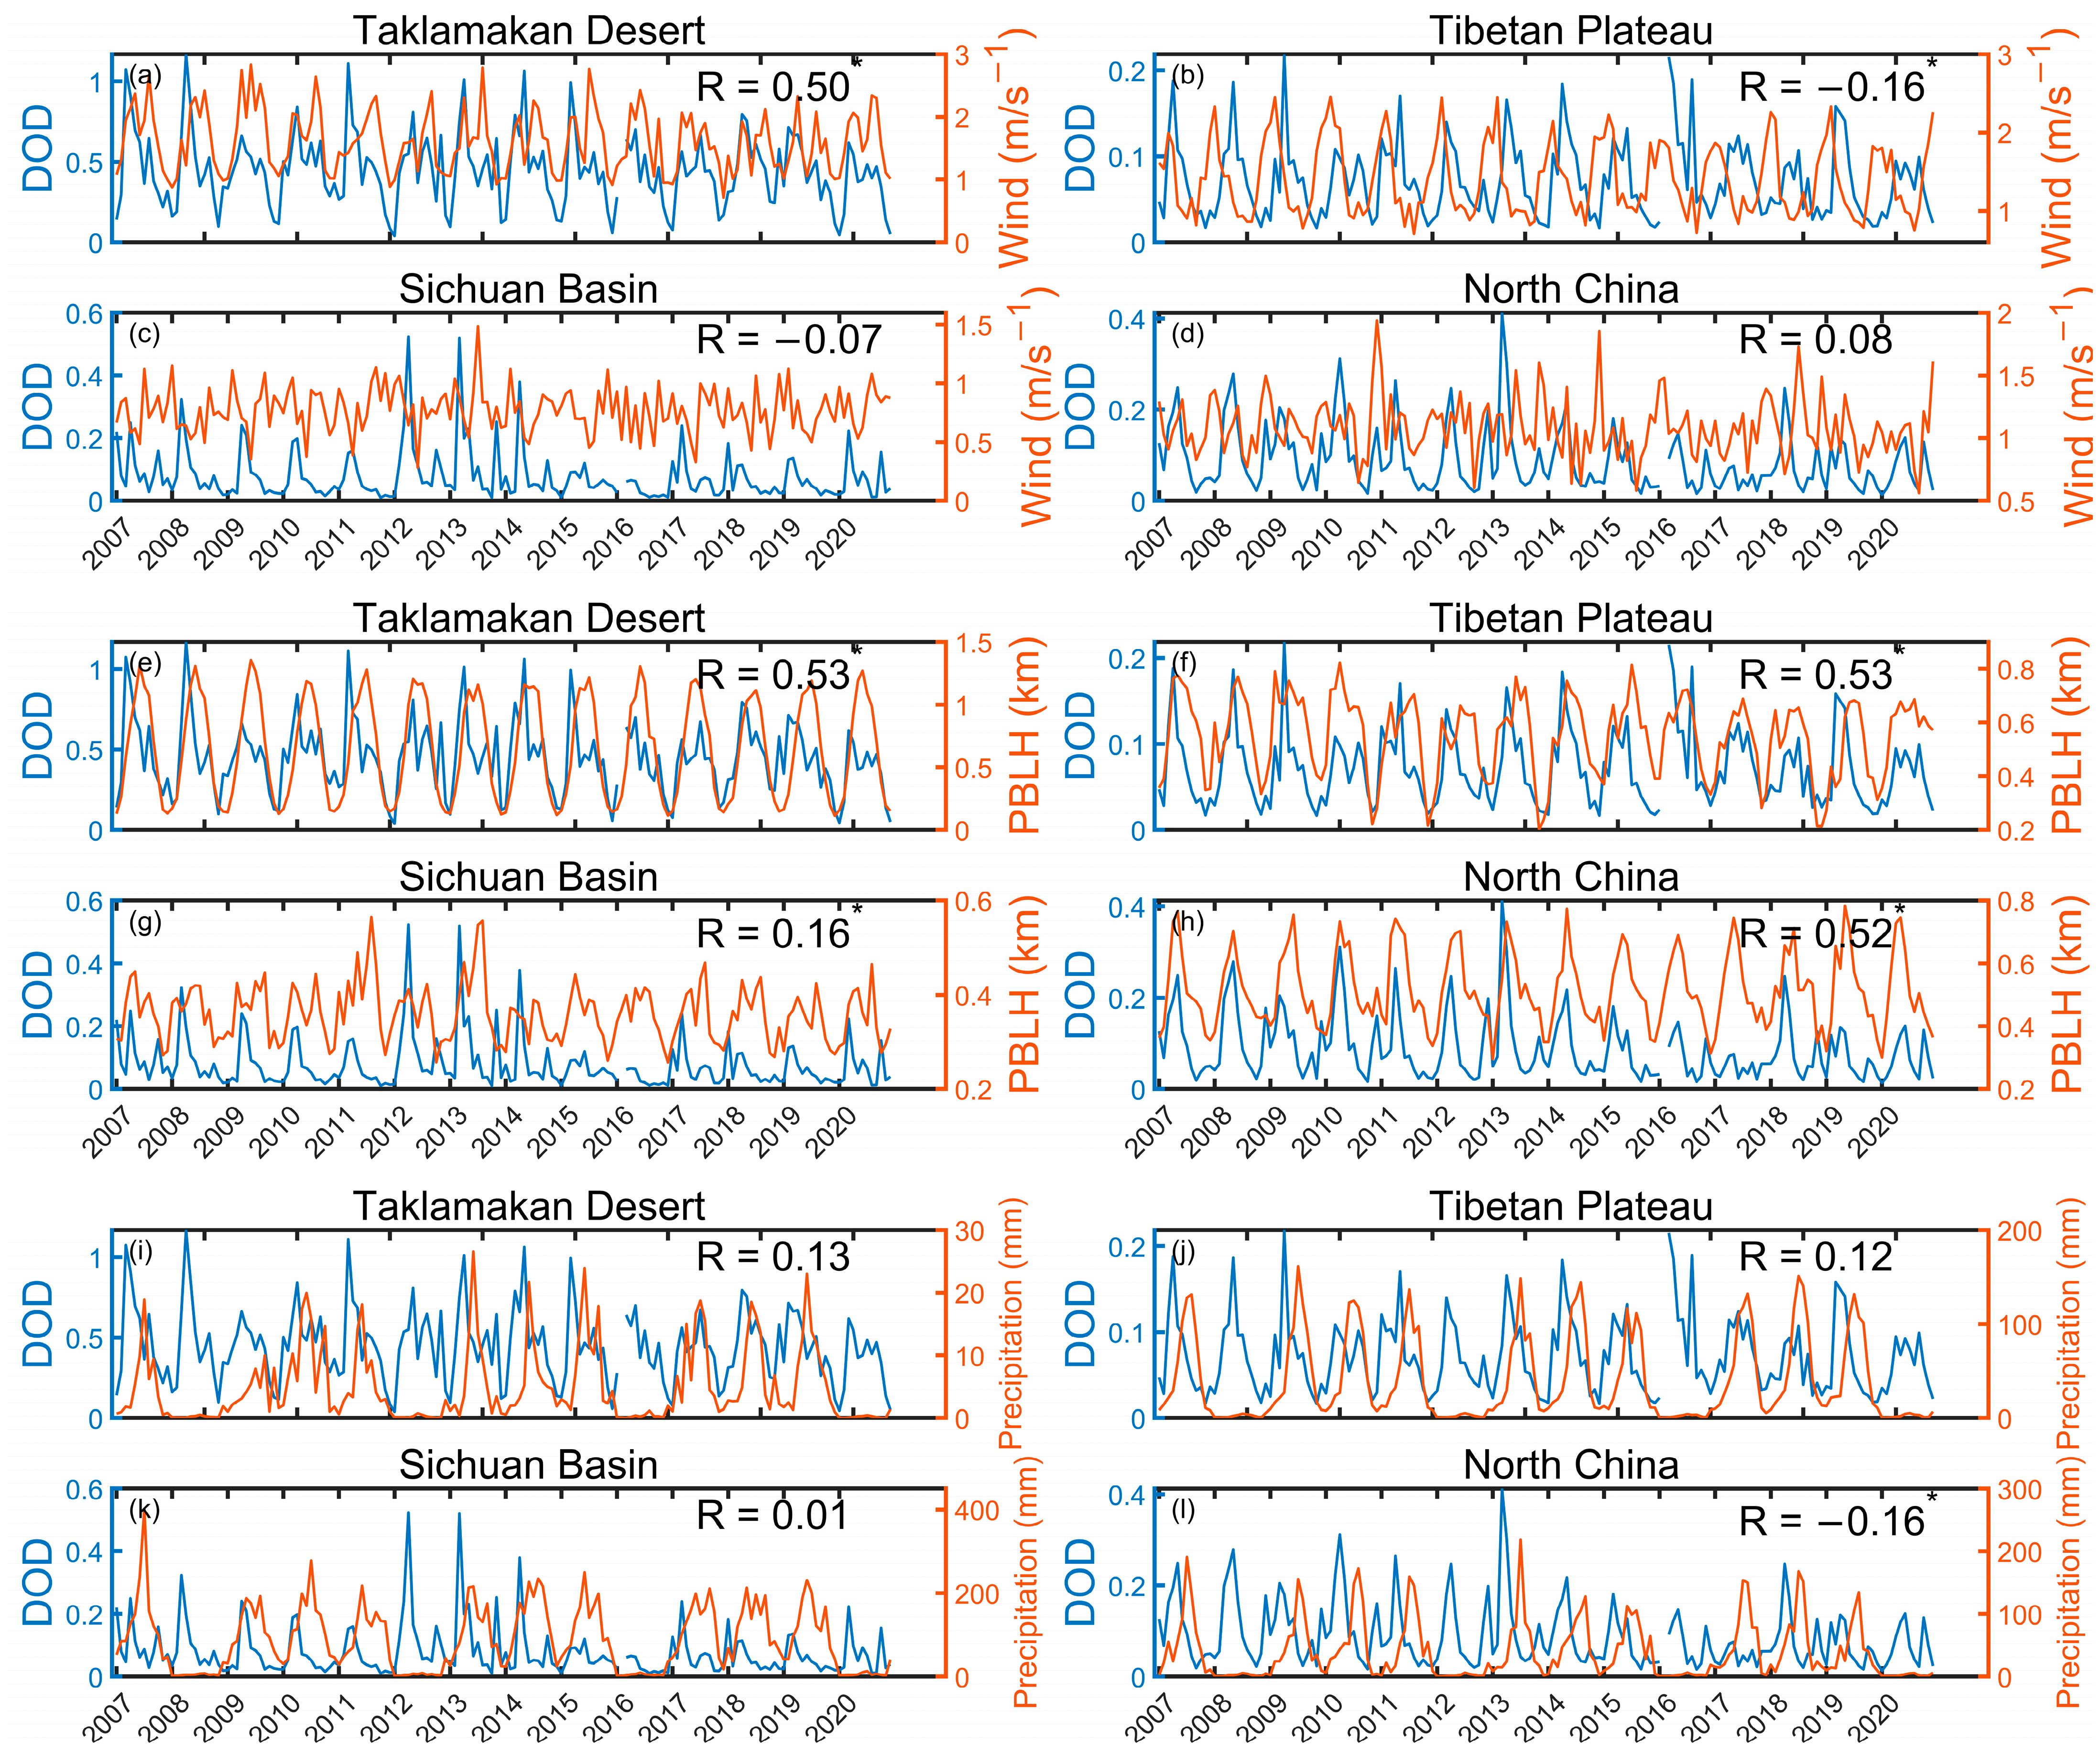
Surface winds exert an important influence on both the emission and transport of dust in the source regions. The planetary boundary layer height (PBLH) plays a pivotal role in regulating the vertical mixing and transport of aerosols. Precipitation is another crucial factor affecting the temporal and spatial distribution of dust aerosols, which can alter the wind speed threshold for dust emission through the process of soil moisture enhancement [56]. To explore the relationships between monthly mean DOD and surface wind speed, PBLH and total precipitation, Figure 11 presents the monthly variations of these parameters in the four regions during 2007~2020. In TD, the correlation of DOD and surface wind speed exceeds 0.5, which highlights the driving force effect of wind for the suspension and transport of dust particles. A low but significant negative correlation between DOD and wind speed is observed in the TP, which is consistent with the findings of Ge et al. [57], who suggested that weaker winds over the TP favor dust accumulation. DOD and PBLH exhibit positive correlations in all four regions. In the lower atmosphere, dust has an obvious heating effect, which could alter the vertical structure of the atmosphere and promote the development of PBLH. The correlations between precipitation and DOD are relatively weak and insignificant in three of the four regions, except for a negative correlation in NC. The insignificant positive correlation between precipitation and DOD in TP and TD might be related to the heterogeneous ice nucleation effect of dust [58]. In NC, except for the scavenging effect, the additional heating due to the increasing dust burden would suppress precipitation [36]. Dust is typically removed from the atmosphere through deposition processes such as gravitational settling and rainwater scavenging. During its stay in the air, dust interacts with the hydrometeors in the atmosphere and can either suppress or enhance precipitation, depending on various factors such as the vertical distribution of dust aerosols, humidity profiles and cloud types [36,58,59]. Therefore, more work is needed to assess the interaction between dust aerosols and precipitation.
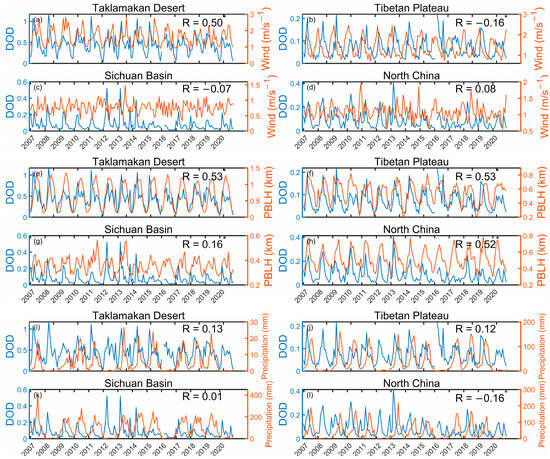
Figure 11.
Monthly varitions in DOD and three meteorological factors ((a–d) surface wind speed, (e–h) PBLH and (i–l) precipitation) over four sub-regions from 2007 to 2020 (The blue and orange lines represent the DOD and the variables for the right axes, respectively. The superscript asterisk means the correlation is significant at the level of 0.05).
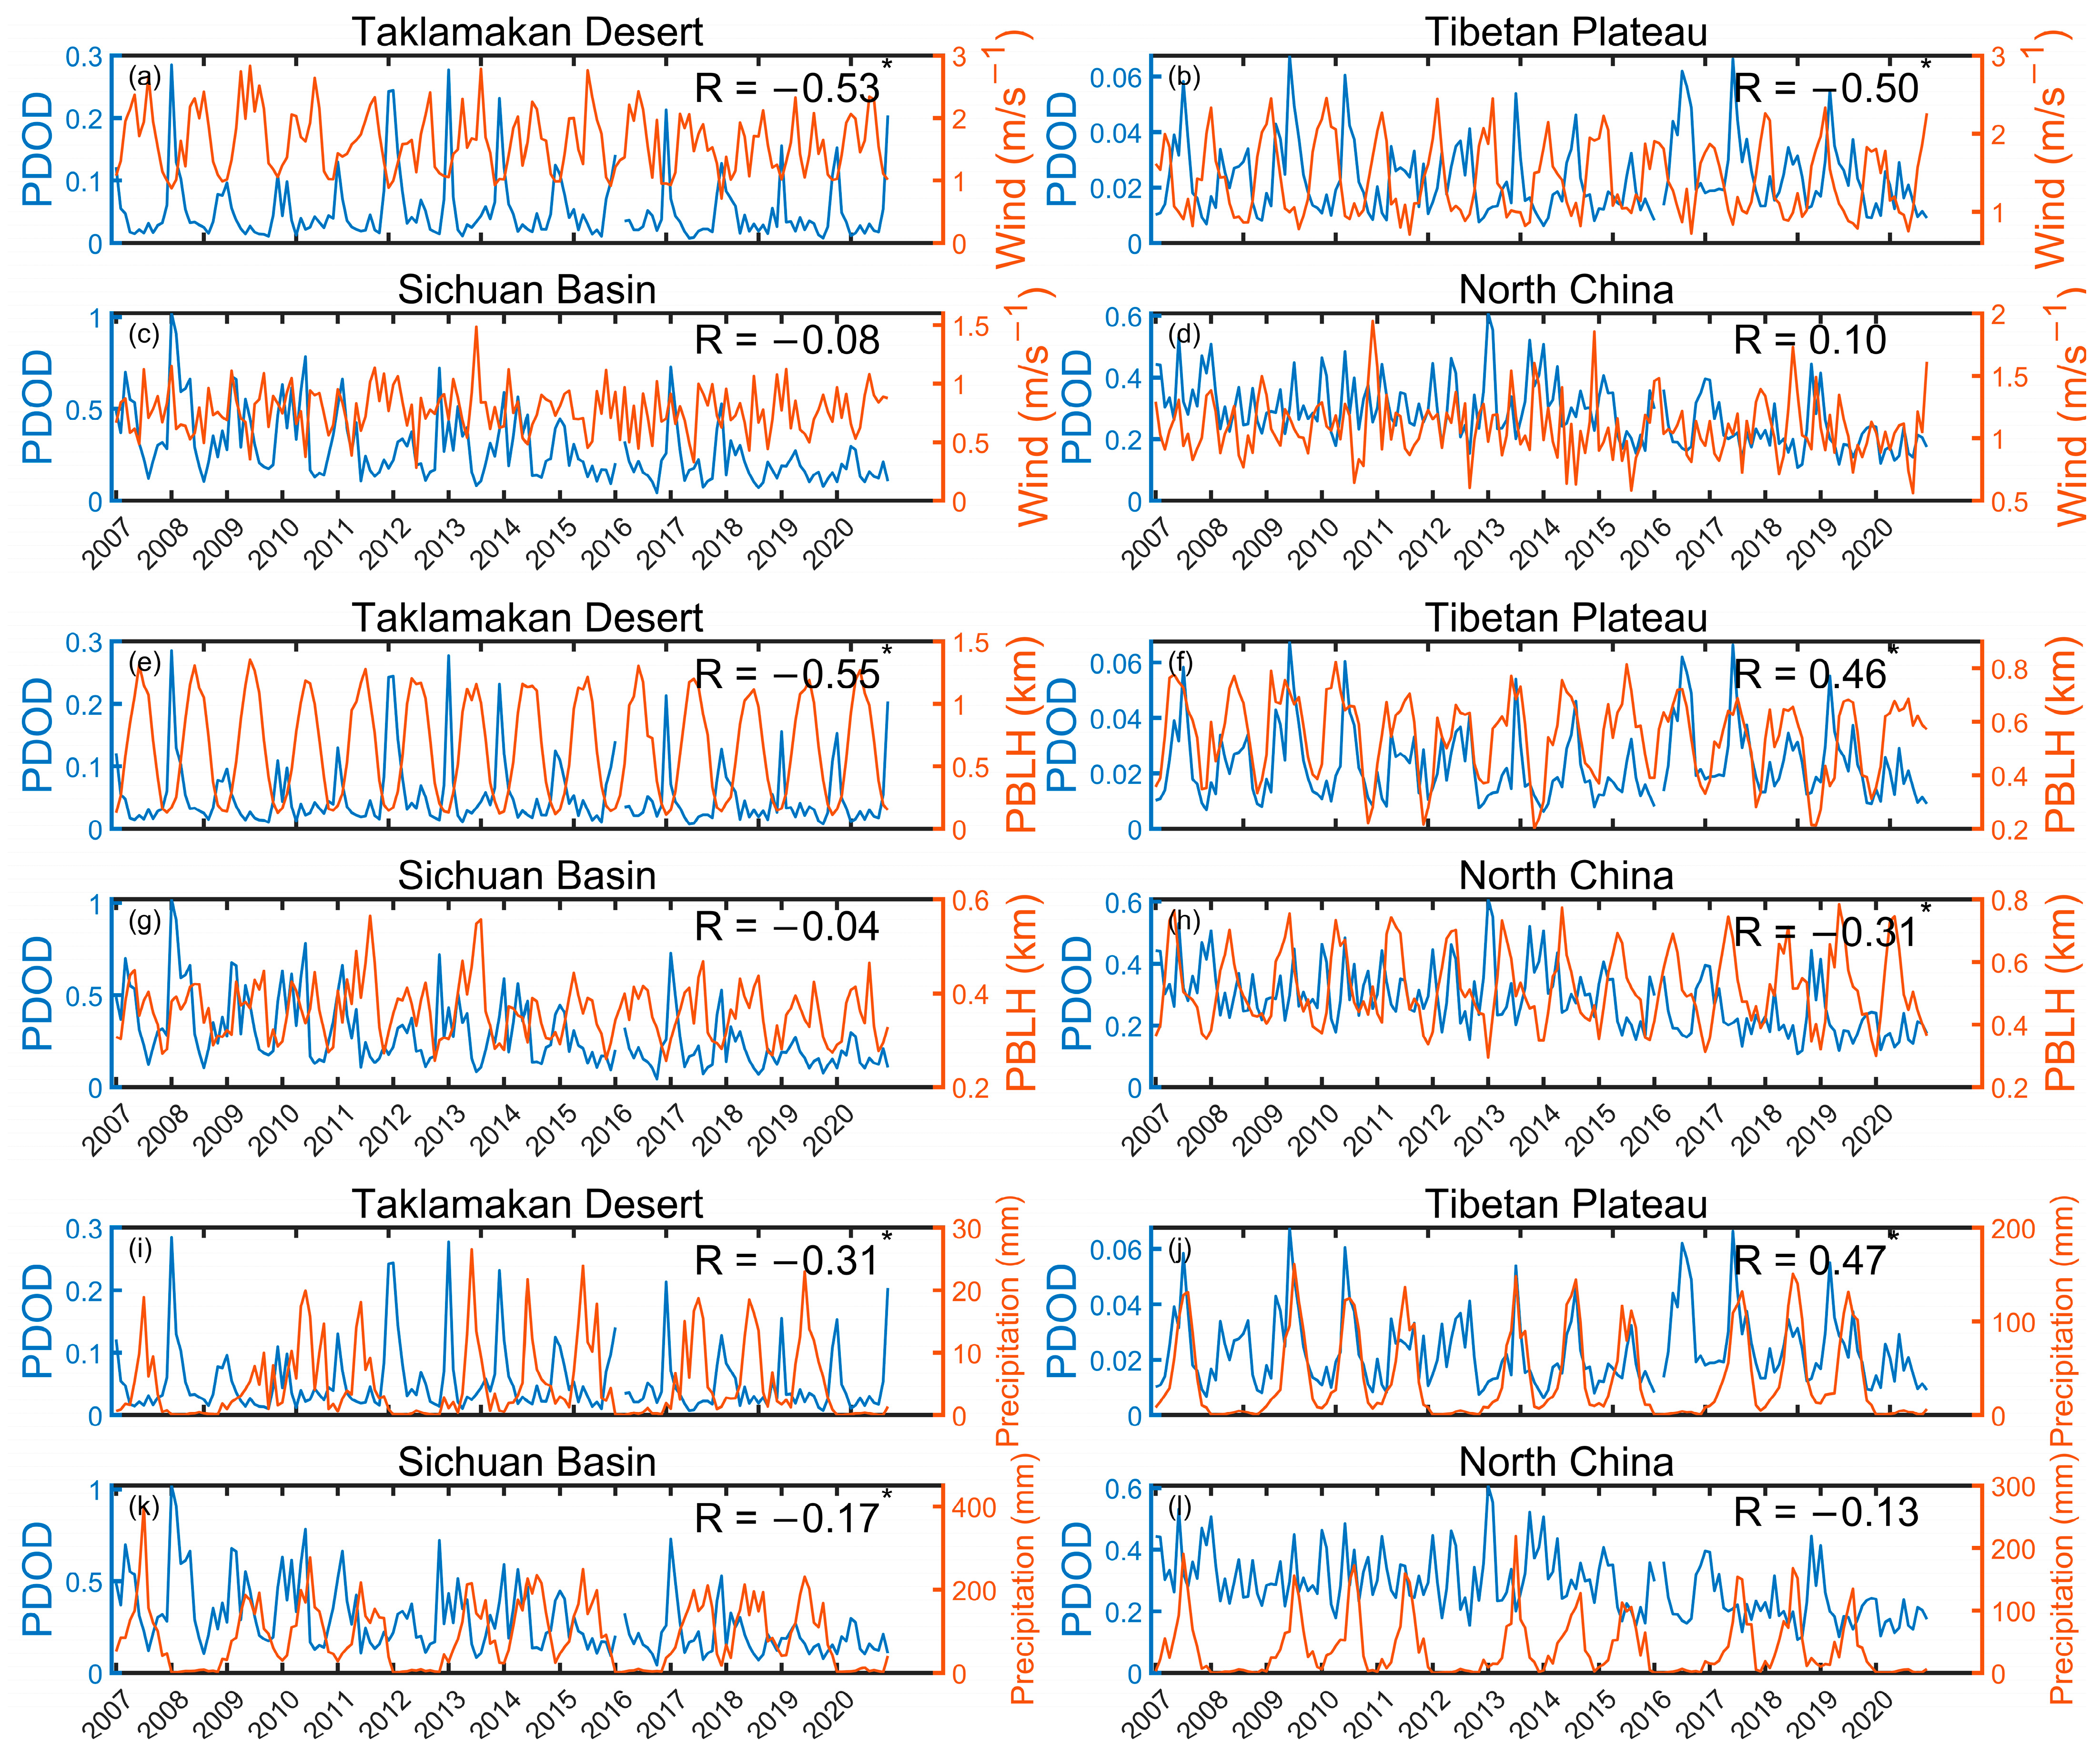
Figure 12 displays the monthly variations of PDOD and three meteorological factors over four sub-regions. In the TP and TD, PDOD exhibits a significant negative correlation coefficient (R) of exceeding 0.5 with wind speed, which indicates a clear dispersion effect of higher wind speed on pollutants. In the SCB and NC, it shows a lower R between PDOD and the wind speed. This may partly be attributed to the combined influence of geographical factors and human activities. The special terrain in the SCB and NC may obstruct and change airflows locally [60,61,62], and the denser human activities in these areas may cause stronger emission of pollutants, both of which may lower the correlation between the wind speed and PDOD. A significant negative correlation between PDOD and PBLH appeared in the TP and NC, while a positive one is shown in the TP. Elevated PBLH facilitates the lifting of local pollutants to higher altitudes, consequently leads to an increase in PDOD over the TP. In the TD, the rising PBLH under stronger turbulence promotes the lifting of local dust and meanwhile inhibits the input of external pollutants, then reduces the mixing of local dust and external pollutants [63]. In NC and the SCB, the higher PBLH facilitates the dispersion of local pollutants [64]. Precipitation primarily acts as a wet scavenging process for pollutants [65] in most regions, but it exhibits a robust positive correlation between PDOD and precipitation in TP. Studies indicate that under a clean atmosphere, an increasing aerosol concentration could strengthen the updraft within cumulus and enhance the probability of precipitation [66].
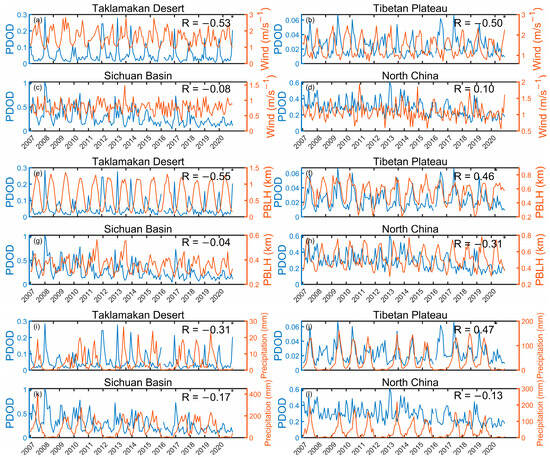
Figure 12.
Monthly varitions in PDOD and three meteorological factors ((a–d) surface wind speed, (e–h) PBLH and (i–l) precipitation) over four sub-regions from 2007 to 2020 (The blue and orange lines represent the PDOD and the variables for the right axes, respectively. The superscript asterisk means the correlation is significant at the level of 0.05).
3.4. Variations of Dust and Polluted Dust Layers
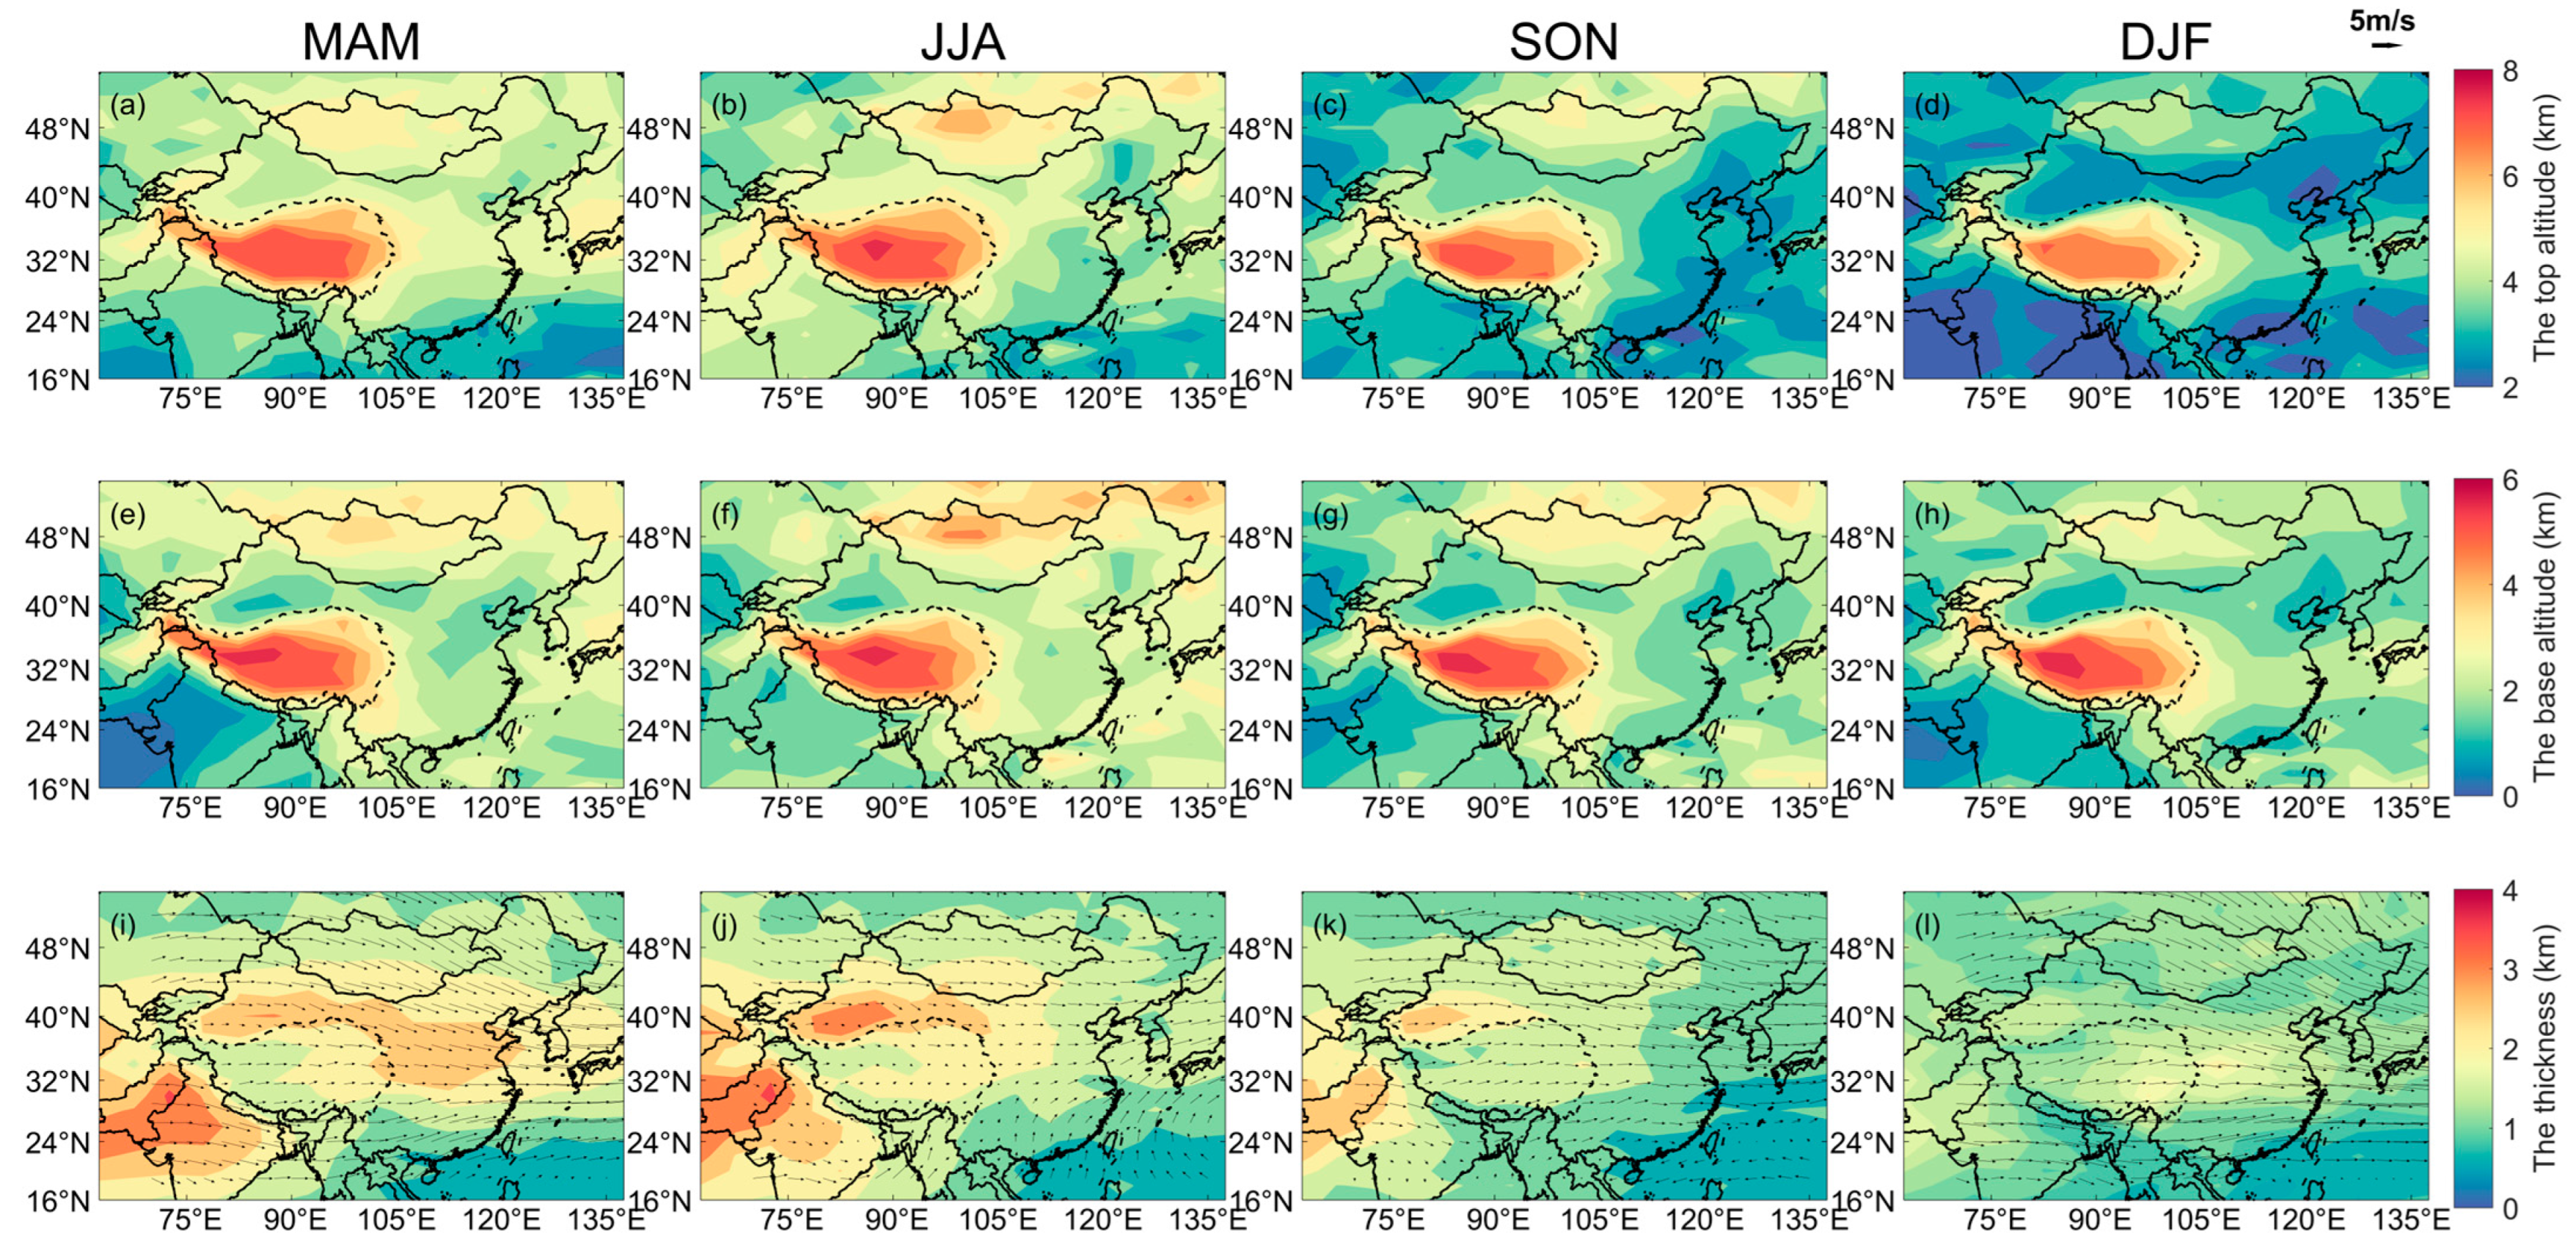
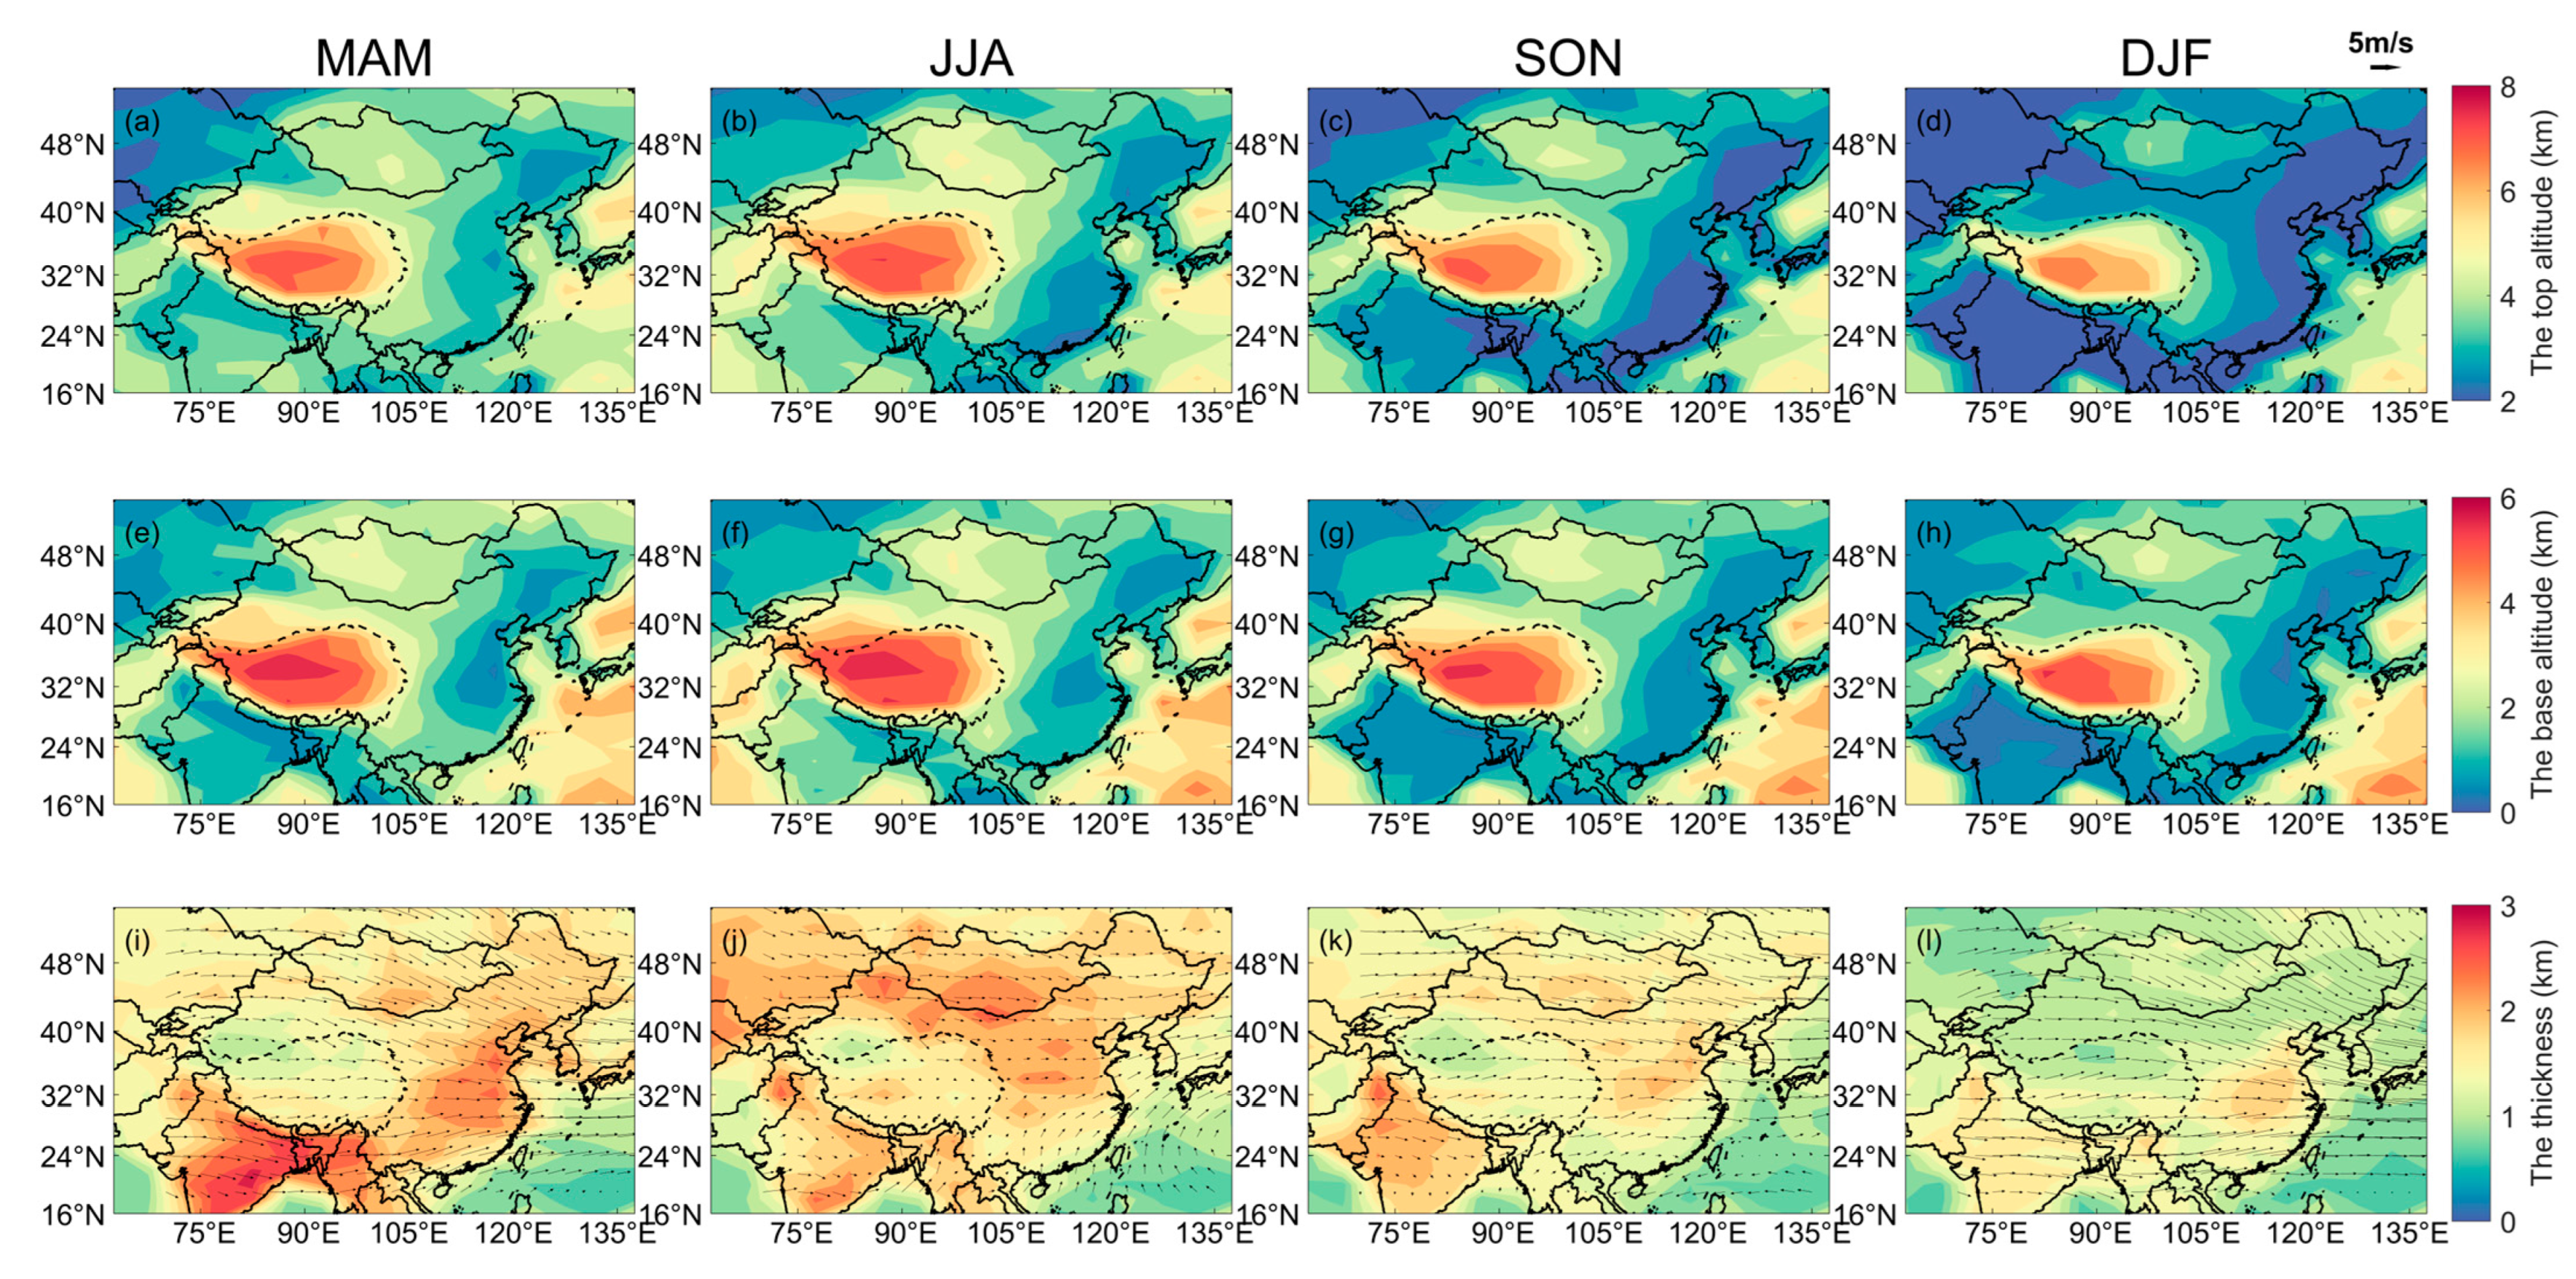
Using the CALIPSO layer product, Figure 13 shows the spatial distributions of seasonal dust layer structure during 2007–2020, including the top altitude, base altitude and thickness. The dust layer top showed obviously seasonal changes. A much higher top appeared in spring and summer than in autumn, while the lowest was in winter. The base altitude presented a similar pattern in all seasons, with a relatively lower base in autumn and winter. In terms of thickness, the thickest layer and widest coverage were in spring, while the opposite situation was in winter. The dust layer top exceeded 5 km in spring and summer over the TD and the Gobi Desert. It was higher than the dust layer base of the TP, which favored the transport of dust from the TD to the TP [50]. Over the Thar Desert (TRD), both the top and the thickness of dust layer reached their maxima in summer, showing values larger than 5 km and 3.5 km, respectively. This is beneficial to transport dust to the TP via the pumping effect under specific meteorological conditions [13]. Additionally, the dust layer is thicker in the western TD than in the eastern TD, which partly contributed to the stronger convection there. The distribution of the dust layer in spring clearly shows that most of the dust particles were not transported directly from the TD to eastern China, but instead climbed upon the TP and then headed eastward through the Qaidam Basin and the Sichuan Basin. In winter, the dust layer thickness over the Qaidam Basin and the Sichuan Basin ranged from 1.5 to 2.5 km, which was apparently thicker than that in the surrounding areas. Additionally, a widespread dust layer of more than 2 km thick covered almost the whole Indian subcontinent from spring to summer. Under the stronger prevailing westerly wind, these dust particles could be carried further and showed a thicker layer in spring in India.
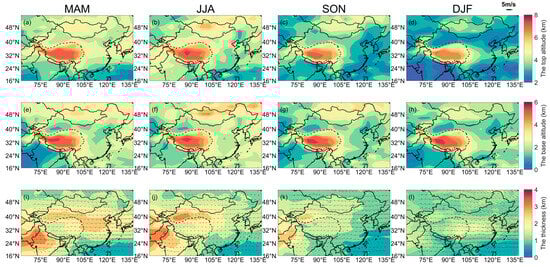
Figure 13.
The (a–d) top altitude, (e–h) base altitude and (i–l) thickness of dust layer in each season during 2007–2020 (Three rows of subplots represent the top, base and thickness, respectively. The arrows represent the surface wind. The dashed line means the boundary of TP).
Figure 14 shows the seasonal distributions of the top, base and thickness for the polluted dust layer. Due to the sedimentation effect, the top and base altitudes of polluted dust are lower than those of dust in most areas in all seasons. Similar to the dust layer, the polluted dust layer was thickest in spring, and the largest loading was located in eastern India and the Ganges Plain area. The polluted dust can be transported from the Ganges Plain to southwestern China under the prevailing wind. It can further climb across the Hengduan Mountains and the Yunnan-Guizhou Plateau to eastern China, even to the Pacific Ocean in spring [12]. A large area and thick layer of polluted dust always stayed in the Indian subcontinent and eastern China in spring, while it was in the north and northwest part of China in summer and in the west part of the Indian subcontinent in autumn.
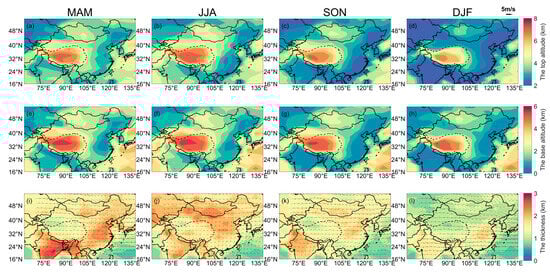
Figure 14.
The (a–d) top altitude, (e–h) base altitude and (i–l) thickness of polluted dust layer in each season during 2007–2020 (Three rows of subplots represent the top, base and thickness, respectively. The arrows represent the surface wind. The dashed line means the boundary of TP).
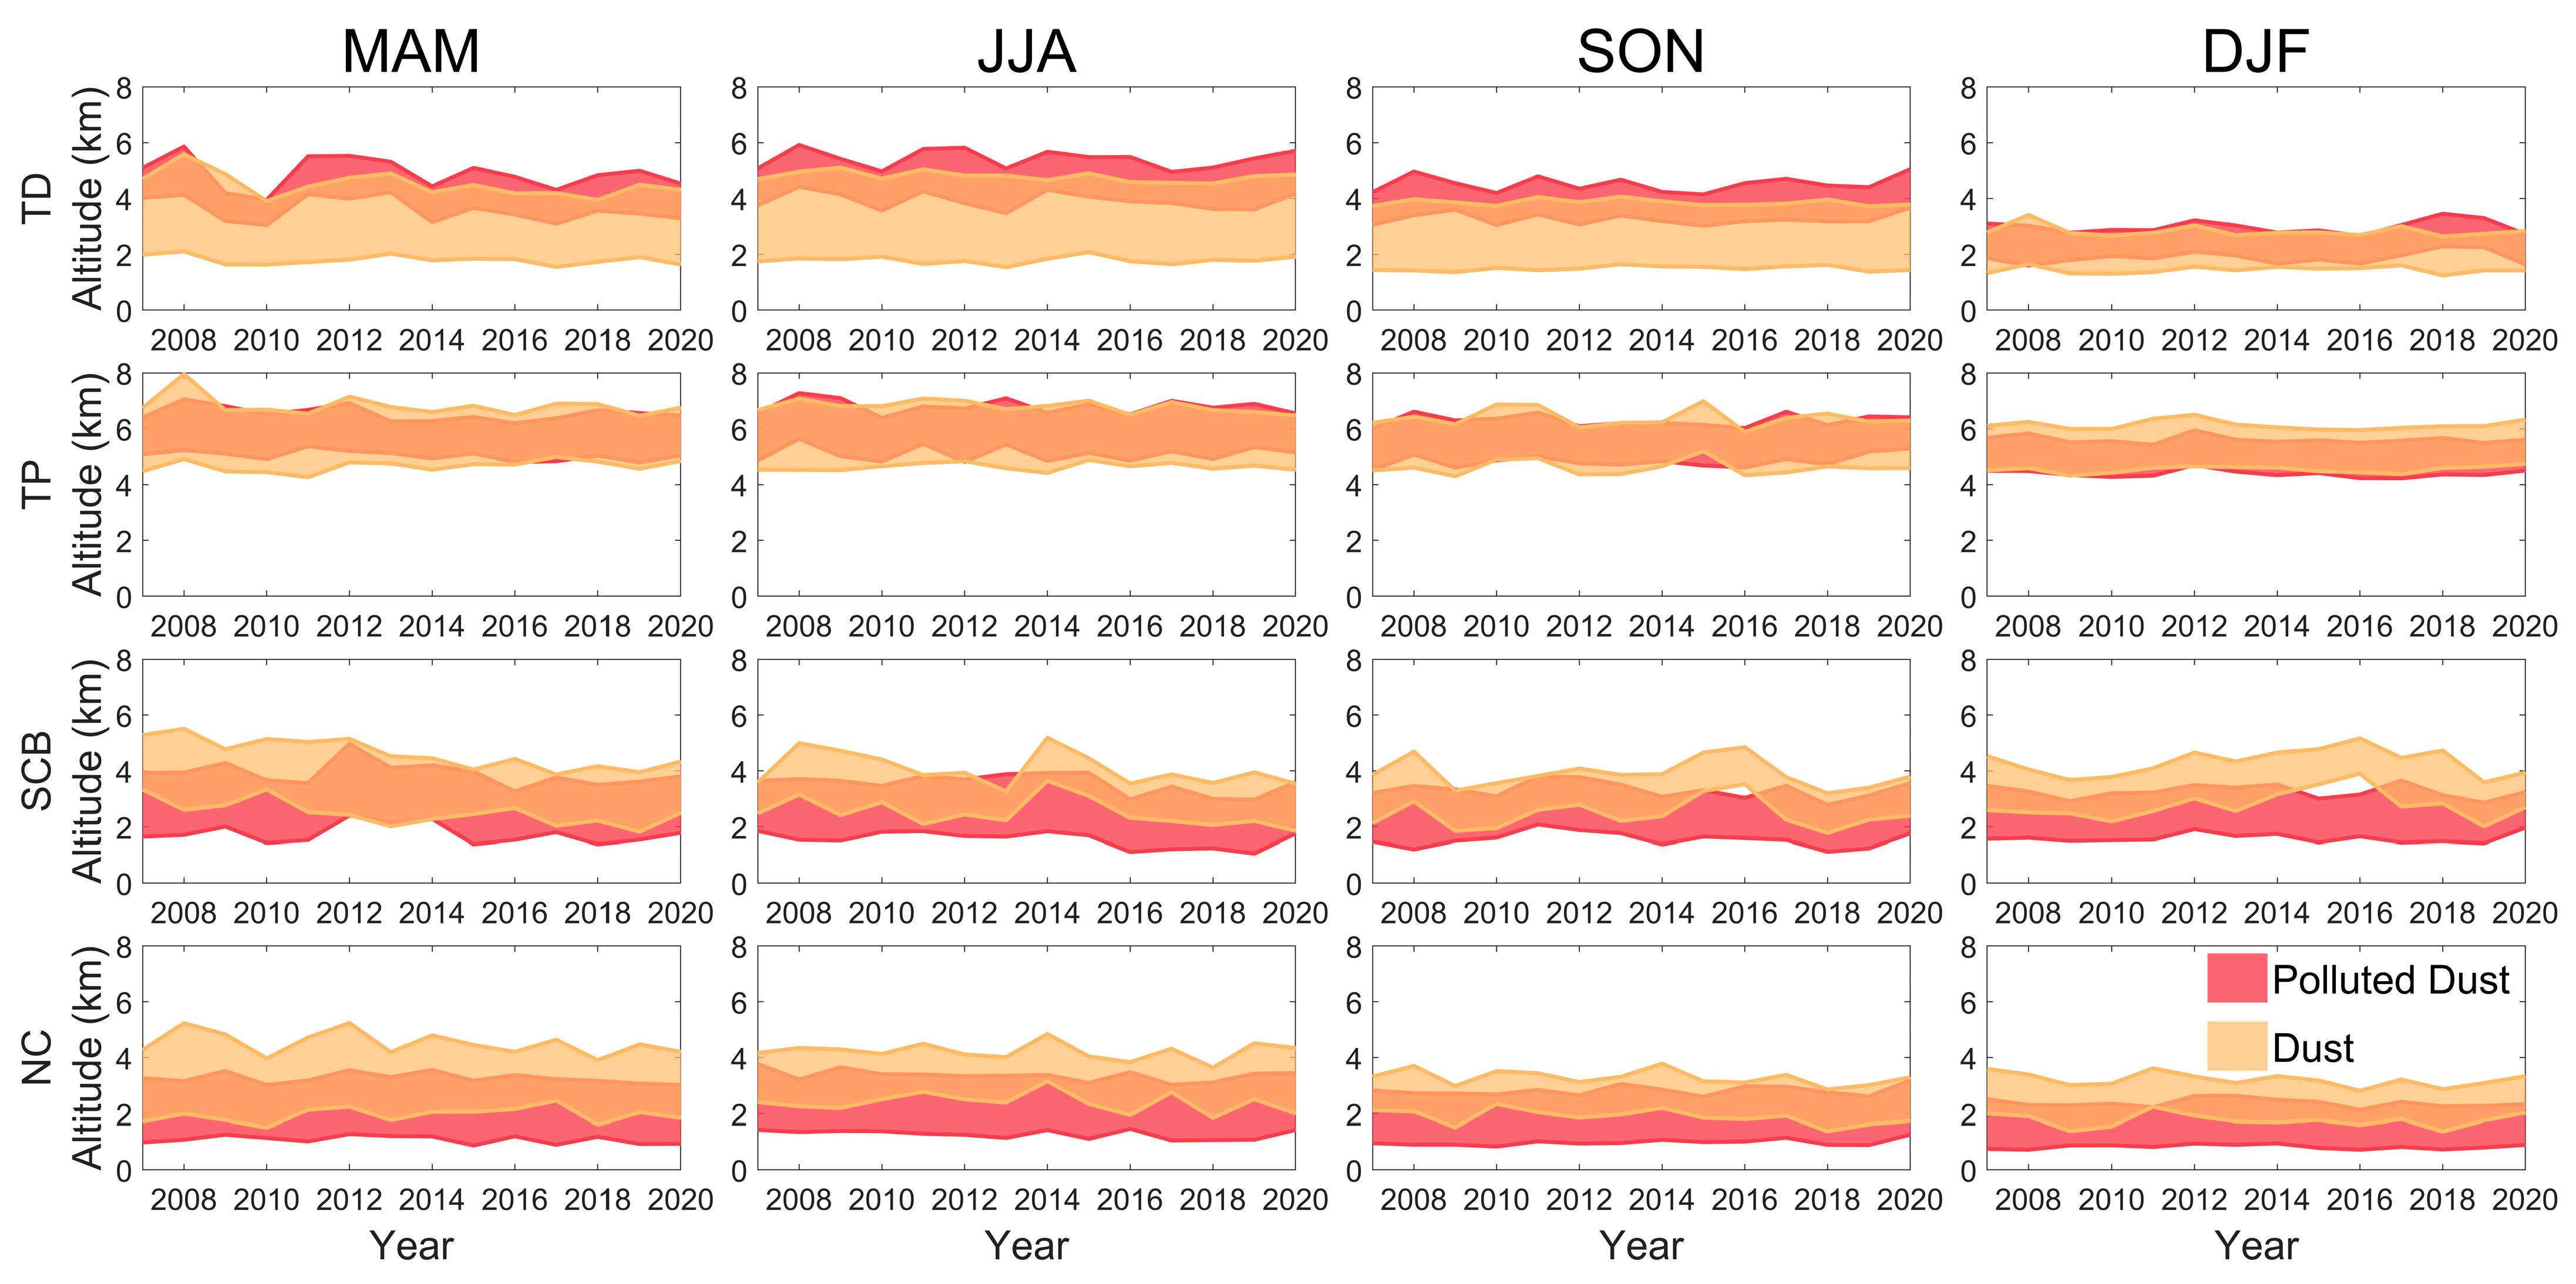
Figure 15 presents the variations of seasonal mean layers of dust and polluted dust over the Taklamakan Desert (TD), the Tibetan Plateau (TP), the Sichuan Basin (SCB) and north China (NC) during 2007–2020. Both the dust and polluted dust layers were thicker in spring and summer, while the dust layer appeared to experience greater seasonal variation. For the multiyear average, the thickest dust layer was that of ~3.0 km in summer over the TD, while the thickest polluted dust layer was that of ~2.2 km in spring over north China. The seasonal polluted dust layers over the TD ranged from 1.1 to 1.5 km, which was thinner than that in the other regions. The overlapping of the dust layer and the polluted dust layer showed different patterns among the four regions. The layer top of polluted dust over the TD was higher than that of dust, which suggests the pollutants were transported from the upper air. Over the Sichuan Basin and north China, the layer base of polluted dust was much lower than that of dust in all seasons, which implies a mixture of local pollutants and input dust. Over the TP, the layers of dust and polluted dust always coincided, suggesting a good mixing of them. Although the dust layer thickness showed no significant trend in most seasons, significant decreasing trends were presented in some seasons and areas, including the winter and spring ones in north China, the autumn one in the Sichuan Basin, and the spring and summer ones in the TP. The polluted dust layer thickness showed a significant decreasing trend in autumn in the TP, while there was no significant trend in the other seasons and regions.
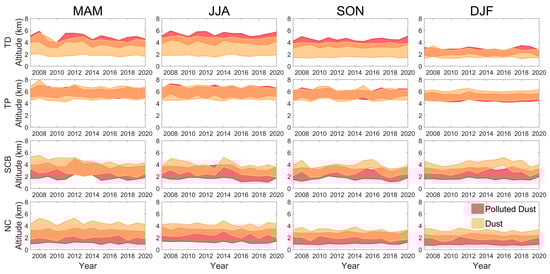
Figure 15.
Variations in seasonal mean layers of dust and polluted dust in four sub regions (TD, TP, SCB and NC represent Taklamakan Desert, Tibetan Plateau, Sichuan Basin and north China, respectively).
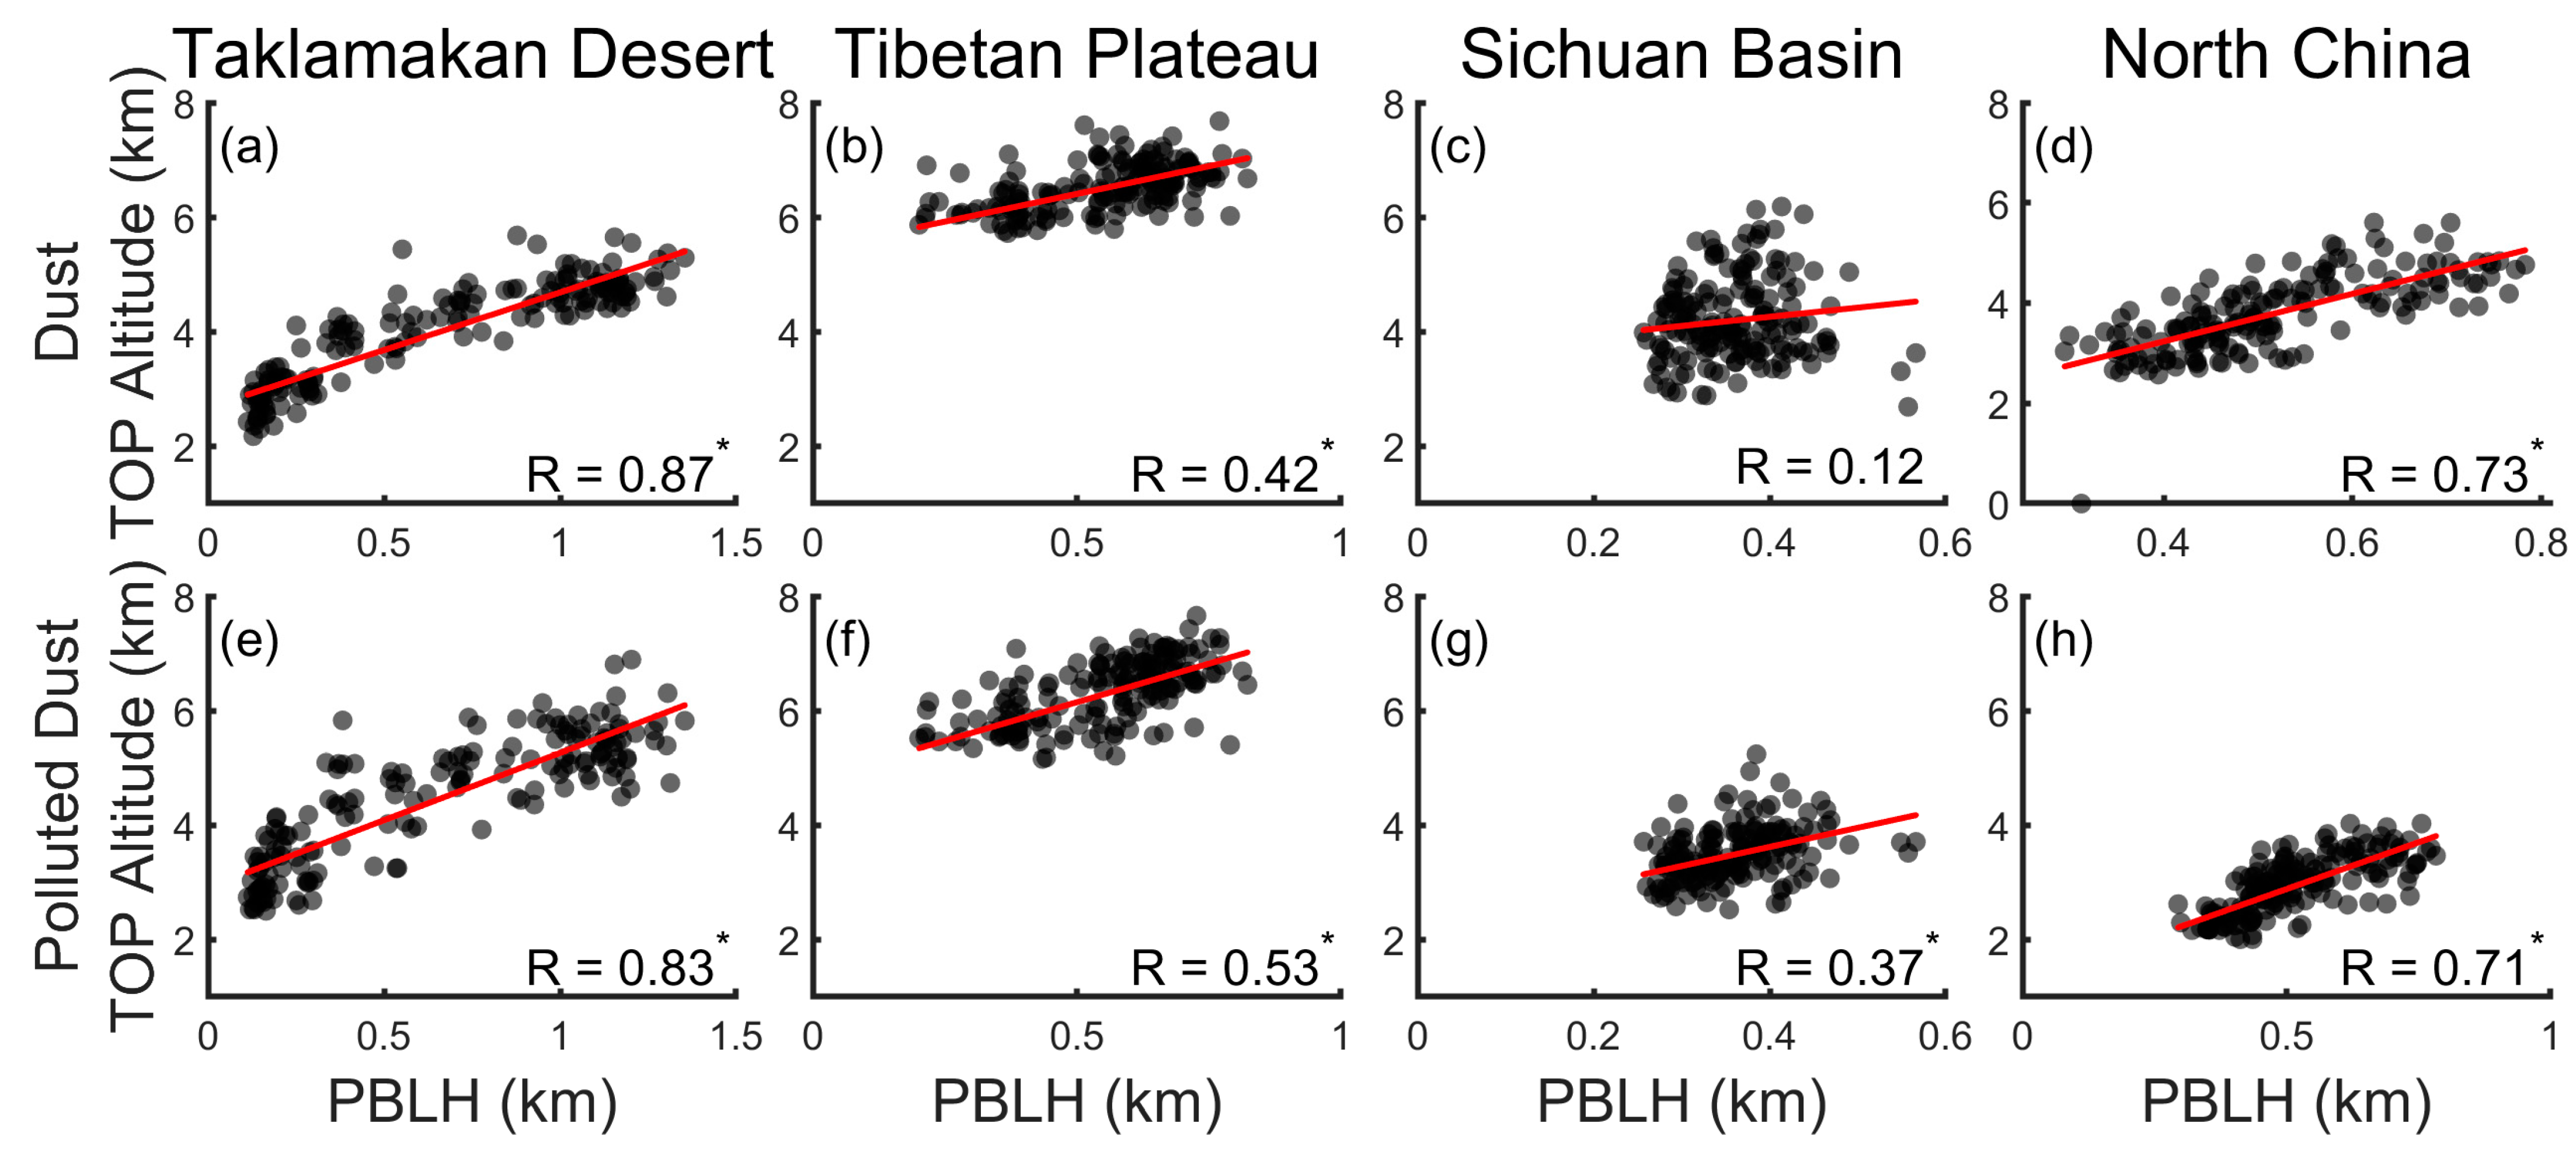
The variation in the planetary boundary layer height (PBLH) plays an important role in the vertical developing of aerosols [67]. Figure 16 shows the correlations of monthly mean PBLHs and layer tops of dust and polluted dust in the four sub-regions during 2007–2020. It shows a significant positive correlation in most regions except the dust top in the Sichuan Basin. The correlation coefficients (R) in the TD were the highest both for dust and polluted dust, both of which were more than 0.8. The second highest R of more than 0.7 was in north China, while the lowest was in the Sichuan Basin. The complex terrain of the SCB may lead to intensification of the influence of topographic blocking, and results in a relatively weak correlation between PBLH and the dust top [61,68,69]. Zhang et al. [70] also found that the release and uplift of dust in the TD are closely related to the development process of the boundary layer. An unsignificant small positive R was appeared between PBLH and the dust top in the Sichuan Basin, while a significant positive one was found between PBLH and the polluted dust top. The polluted dusts formed by the incoming dusts and the local emitted aerosols enhanced the lower tropospheric inversions, and then influenced the development of PBLH in the Sichuan Basin [71], which made the PBLH more related to the temperature profile [72]. In north China, local aerosols mixed well with remotely input dusts [73], which resulted in a consistent development with PBLH. When dust is transported over long distances, its behavior is not only related to the lifting height at the source but also influenced by the transportation process [33,74]. When reaching the local area, it is further affected by the local PBLH.
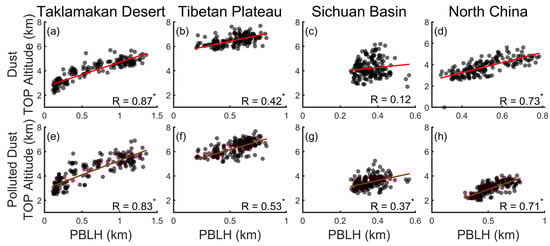
Figure 16.
Correlations between monthly mean layer top heights of (a–d) dust and (e–h) polluted dust and planetary boundary layer heights in the four selected regions from 2007 to 2020 (The red lines represent the results of linear fit. The superscript asterisk represents the correlation is siginicant at the confidence level of 0.05).
4. Conclusions
The vertical profiles and transport features of dust and polluted dust aerosols over China and the surrounding areas are presented based on the CALIPSO Level 3 cloud-free aerosol products. The Taklimakan Desert (TD) and the Thar Desert (TRD) were the two high-value centers of dust optical depth (DOD), with a higher dust top over TD. The largest DOD was in spring over the TD and the Gobi Desert (GD), while that was in summer over the TRD. The dust layer top was generally higher in spring and summer, and the highest top was in summer over the TD and TRD and in spring over the GD. The thickest dust layer was generally in spring, while that was in summer over the TD and TRD. The dust layers over the Qaidam Basin and the Sichuan Basin were apparently thicker than those of the surroundings in winter. The Indian subcontinent was always covered by a thick dust layer from spring to summer. The dust transported to the TP were mainly from two channels: one was from the TRD in summer, and the other was from the TD in spring and summer.
The Sichuan Basin, eastern China and the Indian subcontinent were the three main areas with high polluted dust optical depth (PDOD). Most of the polluted dust was suspended in the layer lower than 2 km. The largest polluted dust extinction coefficient was in winter over most areas, while this was the case in spring over the TP. The relatively thicker polluted dust layer mainly lay in eastern China and the Indian subcontinent in spring and in northern and northwestern China in summer. The polluted dust could go across the Indian subcontinent and South Asia to southwestern China in spring and summer. The PDOD showed a significant decreasing trend in eastern China, while it presented a significant increasing over central India.
The overlapping of dust and polluted dust layers showed different patterns in the four sub-regions over China, which indicates different sources of dust and pollutants. The layer top of polluted dust was higher than that of dust over TD, which indicates a foreign input source of pollutants. The opposite status appeared over the Sichuan Basin and north China, which indicates a mixture of input dusts with local pollutants. Additionally, it showed a significant positive correlation between PBLH and the tops of dust and polluted dust in the high aerosol loading regions.
The correlations between three meteorological factors (wind, PBLH and precipitation) and DOD or PDOD were obviously different in terms of the dust sources and the regions. A higher wind speed favored the lifting and accumulation of local dusts and inhibited the stagnation of external input pollutants in the TD, while it played mainly a dispersion effect in other regions. The PBLH showed a positive correlation with DOD in the four regions and a negative one with PDOD in most regions. Precipitation mainly acted as a scavenger for pollutants in most regions except the TP.
Author Contributions
Conceptualization, X.X.; methodology, X.X. and Y.Y.; software (Python 3.11), X.X., T.L. and Y.Y.; validation, Z.X. and J.G.; formal analysis, X.X. and Y.Y.; investigation, X.X., Y.Y. and Z.X.; resources, X.X.; data curation, Y.Y.; writing—original draft preparation, X.X. and Y.Y.; writing—review and editing, X.X.; visualization, Y.Y. and X.X.; supervision, X.X.; project administration, X.X.; funding acquisition, X.X. All authors have read and agreed to the published version of the manuscript.
Funding
This research was funded by the National Natural Science Foundation of China (grant number: 42030612). Additionally, the APC was funded by the National Natural Science Foundation of China (grant number: 42030612).
Data Availability Statement
The CALIPSO dataset was retrieved from the website of https://search.earthdata.nasa.gov/portal/idn/search?q=CALIOP. The ERA5 dataset was retrieved from the website of https://www.ecmwf.int/en/forecasts/datasets/reanalysis-datasets/era5. The AERONET dataset was retrieved from the website of https://aeronet.gsfc.nasa.gov.
Acknowledgments
The authors are grateful to the websites of NASA Earthdata, AERONET and ECMWF for the datasets used in this work. We are also very grateful to the anonymous reviewers for their very valuable comments.
Conflicts of Interest
The authors declare no conflict of interest.
References
- Ramanathan, V.; Crutzen, P.J.; Kiehl, J.T.; Rosenfeld, D. Aerosols, Climate, and the Hydrological Cycle. Science 2001, 294, 2119–2124. [Google Scholar] [CrossRef] [PubMed]
- Wang, Y.; Li, J.; Zhao, Y.; Li, Y.; Zhao, Y.; Wu, X. Distinct Diurnal Cycle of Supercooled Water Cloud Fraction Dominated by Dust Extinction Coefficient. Geophys. Res. Lett. 2022, 49, e2021GL097006. [Google Scholar] [CrossRef]
- Ramachandran, S.; Ghosh, S.; Verma, A.; Panigrahi, P.K. Multiscale Periodicities in Aerosol Optical Depth over India. Environ. Res. Lett. 2013, 8, 014034. [Google Scholar] [CrossRef]
- Higurashi, A.; Nakajima, T. Detection of Aerosol Types over the East China Sea near Japan from Four-Channel Satellite Data. Geophys. Res. Lett. 2002, 29, 17. [Google Scholar] [CrossRef]
- Omar, A.H. Development of Global Aerosol Models Using Cluster Analysis of Aerosol Robotic Network (AERONET) Measurements. J. Geophys. Res. 2005, 110, D10S14. [Google Scholar] [CrossRef]
- Singh, A.; Anchule, A.; Banerjee, T.; Aditi, K.; Mhawish, A. Three-Dimensional Nature of Summertime Aerosols over South Asia. Sci. Total Environ. 2022, 842, 156834. [Google Scholar] [CrossRef]
- Burton, S.P.; Ferrare, R.A.; Hostetler, C.A.; Hair, J.W.; Rogers, R.R.; Obland, M.D.; Butler, C.F.; Cook, A.L.; Harper, D.B.; Froyd, K.D. Aerosol Classification Using Airborne High Spectral Resolution Lidar Measurements—Methodology and Examples. Atmos. Meas. Tech. 2012, 5, 73–98. [Google Scholar] [CrossRef]
- Guo, J.; Lou, M.; Miao, Y.; Wang, Y.; Zeng, Z.; Liu, H.; He, J.; Xu, H.; Wang, F.; Min, M.; et al. Trans-Pacific Transport of Dust Aerosols from East Asia: Insights Gained from Multiple Observations and Modeling. Environ. Pollut. 2017, 230, 1030–1039. [Google Scholar] [CrossRef]
- Hu, Q.; Wang, H.; Goloub, P.; Li, Z.; Veselovskii, I.; Podvin, T.; Li, K.; Korenskiy, M. The Characterization of Taklamakan Dust Properties Using a Multiwavelength Raman Polarization Lidar in Kashi, China. Atmos. Chem. Phys. 2020, 20, 13817–13834. [Google Scholar] [CrossRef]
- Hofer, J.; Althausen, D.; Abdullaev, S.F.; Makhmudov, A.N.; Nazarov, B.I.; Schettler, G.; Engelmann, R.; Baars, H.; Fomba, K.W.; Müller, K.; et al. Long-Term Profiling of Mineral Dust and Pollution Aerosol with Multiwavelength Polarization Raman Lidar at the Central Asian Site of Dushanbe, Tajikistan: Case Studies. Atmos. Chem. Phys. 2017, 17, 14559–14577. [Google Scholar] [CrossRef]
- Hofer, J.; Ansmann, A.; Althausen, D.; Engelmann, R.; Baars, H.; Abdullaev, S.F.; Makhmudov, A.N. Long-Term Profiling of Aerosol Light Extinction, Particle Mass, Cloud Condensation Nuclei, and Ice-Nucleating Particle Concentration over Dushanbe, Tajikistan, in Central Asia. Atmos. Chem. Phys. 2020, 20, 4695–4711. [Google Scholar] [CrossRef]
- Han, Y.; Wang, T.; Tang, J.; Wang, C.; Jian, B.; Huang, Z.; Huang, J. New Insights into the Asian Dust Cycle Derived from CALIPSO Lidar Measurements. Remote Sens. Environ. 2022, 272, 112906. [Google Scholar] [CrossRef]
- Wang, T.; Tang, J.; Sun, M.; Liu, X.; Huang, Y.; Huang, J.; Han, Y.; Cheng, Y.; Huang, Z.; Li, J. Identifying a Transport Mechanism of Dust Aerosols over South Asia to the Tibetan Plateau: A Case Study. Sci. Total Environ. 2021, 758, 143714. [Google Scholar] [CrossRef] [PubMed]
- Xiong, Z.; Xu, X.; Yang, Y.; Luo, T. Diurnal Vertical Distribution and Transport of Dust Aerosol over and around Tibetan Plateau from Lidar on International Space Station. Atmos. Res. 2023, 294, 106939. [Google Scholar] [CrossRef]
- Zhao, Z.; Cao, J.; Shen, Z.; Xu, B.; Zhu, C.; Chen, L.-W.A.; Su, X.; Liu, S.; Han, Y.; Wang, G.; et al. Aerosol Particles at a High-Altitude Site on the Southeast Tibetan Plateau, China. J. Geophys. Res. Atmos. 2013, 118, 11360–11375. [Google Scholar] [CrossRef]
- Zhang, X.Y.; Arimoto, R.; An, Z.S. Dust Emission from Chinese Desert Sources Linked to Variations in Atmospheric Circulation. J. Geophys. Res. 1997, 102, 28041–28047. [Google Scholar] [CrossRef]
- Laurent, B.; Marticorena, B.; Bergametti, G.; Mei, F. Modeling Mineral Dust Emissions from Chinese and Mongolian Deserts. Glob. Planet. Chang. 2006, 52, 121–141. [Google Scholar] [CrossRef]
- Chen, S.-P.; Lu, C.-H.; McQueen, J.; Lee, P. Application of Satellite Observations in Conjunction with Aerosol Reanalysis to Characterize Long-Range Transport of African and Asian Dust on Air Quality in the Contiguous U.S. Atmos. Environ. 2018, 187, 174–195. [Google Scholar] [CrossRef]
- Xu, C.; Ma, Y.M.; You, C.; Zhu, Z.K. The Regional Distribution Characteristics of Aerosol Optical Depth over the Tibetan Plateau. Atmos. Chem. Phys. 2015, 15, 12065–12078. [Google Scholar] [CrossRef]
- Liang, L.; Han, Z.; Li, J.; Xia, X.; Sun, Y.; Liao, H.; Liu, R.; Liang, M.; Gao, Y.; Zhang, R. Emission, Transport, Deposition, Chemical and Radiative Impacts of Mineral Dust during Severe Dust Storm Periods in March 2021 over East Asia. Sci. Total Environ. 2022, 852, 158459. [Google Scholar] [CrossRef]
- Sun, H.; Pan, Z.; Liu, X. Numerical Simulation of Spatial-temporal Distribution of Dust Aerosol and Its Direct Radiative Effects on East Asian Climate. J. Geophys. Res. 2012, 117, D13. [Google Scholar] [CrossRef]
- Perlwitz, J.; Tegen, I.; Miller, R.L. Interactive Soil Dust Aerosol Model in the GISS GCM: 1. Sensitivity of the Soil Dust Cycle to Radiative Properties of Soil Dust Aerosols. J. Geophys. Res. 2001, 106, 18167–18192. [Google Scholar] [CrossRef]
- Ahn, H.-J.; Park, S.-U.; Chang, L.-S. Effect of Direct Radiative Forcing of Asian Dust on the Meteorological Fields in East Asia during an Asian Dust Event Period. J. Appl. Meteorol. Climatol. 2007, 46, 1655–1681. [Google Scholar] [CrossRef]
- Ma, M.; Yang, X.; He, Q.; Zhou, C.; Mamtimin, A.; Huo, W.; Yang, F. Characteristics of Dust Devil and Its Dust Emission in Northern Margin of the Taklimakan Desert. Aeolian Res. 2020, 44, 100579. [Google Scholar] [CrossRef]
- Kai, K.; Tsunematsu, N.; Matsumoto, T.; Zhou, H.; Hu, S.; Nagai, T.; Matsumura, T.; Abo, M. Vertical Structure of the Dust Layer and Middle-Level Clouds over the Taklamakan Desert by LIDAR. In Proceedings of the 22nd Internation Laser Radar Conference (ILRC 2004), Matera, Italy, 12–16 July 2004; Volume 561, p. 895. [Google Scholar]
- Huang, J.; Minnis, P.; Chen, B.; Huang, Z.; Liu, Z.; Zhao, Q.; Yi, Y.; Ayers, J.K. Long-Range Transport and Vertical Structure of Asian Dust from CALIPSO and Surface Measurements during PACDEX. J. Geophys. Res. 2008, 113, D23212. [Google Scholar] [CrossRef]
- Iwasaka, Y.; Minoura, H.; Nagaya, K. The Transport and Spacial Scale of Asian Dust-Storm Clouds: A Case Study of the Dust-Storm Event of April 1979. Tellus B 1983, 35, 189–196. [Google Scholar] [CrossRef]
- Zhang, T.; Zheng, M.; Sun, X.; Chen, H.; Wang, Y.; Fan, X.; Pan, Y.; Quan, J.; Liu, J.; Wang, Y.; et al. Environmental Impacts of Three Asian Dust Events in the Northern China and the Northwestern Pacific in Spring 2021. Sci. Total Environ. 2023, 859, 160230. [Google Scholar] [CrossRef]
- Nee, J.B.; Chiang, C.; Hu, H.; Hu, S.; Yu, J. Lidar Measurements of Asian Dust Storms and Dust Cloud Interactions. J. Geophys. Res. 2007, 112, 2007JD008476. [Google Scholar] [CrossRef]
- Han, Y.; Wu, Y.; Wang, T.; Xie, C.; Zhao, K.; Zhuang, B.; Li, S. Characterizing a Persistent Asian Dust Transport Event: Optical Properties and Impact on Air Quality through the Ground-Based and Satellite Measurements over Nanjing, China. Atmos. Environ. 2015, 115, 304–316. [Google Scholar] [CrossRef]
- He, Y.; Yi, F.; Yin, Z.; Liu, F.; Yi, Y.; Zhou, J. Mega Asian Dust Event over China on 27–31 March 2021 Observed with Space-Borne Instruments and Ground-Based Polarization Lidar. Atmos. Environ. 2022, 285, 119238. [Google Scholar] [CrossRef]
- Sassen, K. Indirect Climate Forcing over the Western US from Asian Dust Storms. Geophys. Res. Lett. 2002, 29, 103–1-103–104. [Google Scholar] [CrossRef]
- Uno, I.; Eguchi, K.; Yumimoto, K.; Takemura, T.; Shimizu, A.; Uematsu, M.; Liu, Z.; Wang, Z.; Hara, Y.; Sugimoto, N. Asian Dust Transported One Full Circuit around the Globe. Nat. Geosci 2009, 2, 557–560. [Google Scholar] [CrossRef]
- Winker, D.M.; Pelon, J.; Coakley, J.A., Jr.; Ackerman, S.A.; Charlson, R.J.; Colarco, P.R.; Flamant, P.; Fu, Q.; Hoff, R.M.; Kittaka, C.; et al. The CALIPSO Mission: A Global 3D View of Aerosols and Clouds. Bull. Am. Meteorol. Soc. 2010, 91, 1211–1230. [Google Scholar] [CrossRef]
- Winker, D.M.; Hunt, W.H.; Hostetler, C.A. Status and Performance of the CALIOP Lidar. In Proceedings of the Laser Radar Techniques for Atmospheric Sensing, Maspalomas, Canary Islands, Spain, 4 September 2004; Volume 5575, pp. 8–15. [Google Scholar]
- Huang, J.; Wang, T.; Wang, W.; Li, Z.; Yan, H. Climate Effects of Dust Aerosols over East Asian Arid and Semiarid Regions. J. Geophys. Res. Atmos. 2014, 119, 11398–11416. [Google Scholar] [CrossRef]
- Yang, Y.; Zhao, C.; Wang, Q.; Cong, Z.; Yang, X.; Fan, H. Aerosol Characteristics at the Three Poles of the Earth as Characterized by Cloud–Aerosol Lidar and Infrared Pathfinder Satellite Observations. Atmos. Chem. Phys. 2021, 21, 4849–4868. [Google Scholar] [CrossRef]
- Huang, K.; Zhuang, G.; Li, J.; Wang, Q.; Sun, Y.; Lin, Y.; Fu, J.S. Mixing of Asian Dust with Pollution Aerosol and the Transformation of Aerosol Components during the Dust Storm over China in Spring 2007. J. Geophys. Res. 2010, 115, D7. [Google Scholar] [CrossRef]
- Huang, L.; Jiang, J.H.; Tackett, J.L.; Su, H.; Fu, R. Seasonal and Diurnal Variations of Aerosol Extinction Profile and Type Distribution from CALIPSO 5-year Observations. J. Geophys. Res. Atmos. 2013, 118, 4572–4596. [Google Scholar] [CrossRef]
- Tackett, J.L.; Winker, D.M.; Getzewich, B.J.; Vaughan, M.A.; Young, S.A.; Kar, J. CALIPSO Lidar Level 3 Aerosol Profile Product: Version 3 Algorithm Design. Atmos. Meas. Tech. 2018, 11, 4129–4152. [Google Scholar] [CrossRef] [PubMed]
- Winker, D.M.; Tackett, J.L.; Getzewich, B.J.; Liu, Z.; Vaughan, M.A.; Rogers, R.R. The Global 3-D Distribution of Tropospheric Aerosols as Characterized by CALIOP. Atmos. Chem. Phys. 2013, 13, 3345–3361. [Google Scholar] [CrossRef]
- Pan, H.; Huang, J.; Kumar, K.R.; An, L.; Zhang, J. The CALIPSO Retrieved Spatiotemporal and Vertical Distributions of AOD and Extinction Coefficient for Different Aerosol Types during 2007–2019: A Recent Perspective over Global and Regional Scales. Atmos. Environ. 2022, 274, 118986. [Google Scholar] [CrossRef]
- Ouyang, W.; Guo, B.; Cai, G.; Li, Q.; Han, S.; Liu, B.; Liu, X. The Washing Effect of Precipitation on Particulate Matter and the Pollution Dynamics of Rainwater in Downtown Beijing. Sci. Total Environ. 2015, 505, 306–314. [Google Scholar] [CrossRef]
- Sen, A.; Abdelmaksoud, A.S.; Nazeer Ahammed, Y.; Alghamdi, M.A.; Banerjee, T.; Bhat, M.A.; Chatterjee, A.; Choudhuri, A.K.; Das, T.; Dhir, A.; et al. Variations in Particulate Matter over Indo-Gangetic Plains and Indo-Himalayan Range during Four Field Campaigns in Winter Monsoon and Summer Monsoon: Role of Pollution Pathways. Atmos. Environ. 2017, 154, 200–224. [Google Scholar] [CrossRef]
- Huang, K.; Fu, J.S.; Hsu, N.C.; Gao, Y.; Dong, X.; Tsay, S.-C.; Lam, Y.F. Impact Assessment of Biomass Burning on Air Quality in Southeast and East Asia during BASE-ASIA. Atmos. Environ. 2013, 78, 291–302. [Google Scholar] [CrossRef]
- Chen, S.; Huang, J.; Li, J.; Jia, R.; Jiang, N.; Kang, L.; Ma, X.; Xie, T. Comparison of Dust Emissions, Transport, and Deposition between the Taklimakan Desert and Gobi Desert from 2007 to 2011. Sci. China Earth Sci. 2017, 60, 1338–1355. [Google Scholar] [CrossRef]
- Han, Y.; Wang, T.; Tan, R.; Tang, J.; Wang, C.; He, S.; Dong, Y.; Huang, Z.; Bi, J. CALIOP-Based Quantification of Central Asian Dust Transport. Remote Sens. 2022, 14, 1416. [Google Scholar] [CrossRef]
- Kok, J.F.; Adebiyi, A.A.; Albani, S.; Balkanski, Y.; Checa-Garcia, R.; Chin, M.; Colarco, P.R.; Hamilton, D.S.; Huang, Y.; Ito, A.; et al. Contribution of the World’s Main Dust Source Regions to the Global Cycle of Desert Dust. Atmos. Chem. Phys. 2021, 21, 8169–8193. [Google Scholar] [CrossRef]
- Lamancusa, C.; Wagstrom, K. Global Transport of Dust Emitted from Different Regions of the Sahara. Atmos. Environ. 2019, 214, 116734. [Google Scholar] [CrossRef]
- Xu, X.; Wu, H.; Yang, X.; Xie, L. Distribution and Transport Characteristics of Dust Aerosol over Tibetan Plateau and Taklimakan Desert in China Using MERRA-2 and CALIPSO Data. Atmos. Environ. 2020, 237, 117670. [Google Scholar] [CrossRef]
- Gui, K.; Yao, W.; Che, H.; An, L.; Zheng, Y.; Li, L.; Zhao, H.; Zhang, L.; Zhong, J.; Wang, Y.; et al. Record-Breaking Dust Loading during Two Mega Dust Storm Events over Northern China in March 2021: Aerosol Optical and Radiative Properties and Meteorological Drivers. Atmos. Chem. Phys. 2022, 22, 7905–7932. [Google Scholar] [CrossRef]
- Liu, Z.; Omar, A.; Vaughan, M.; Hair, J.; Kittaka, C.; Hu, Y.; Powell, K.; Trepte, C.; Winker, D.; Hostetler, C.; et al. CALIPSO Lidar Observations of the Optical Properties of Saharan Dust: A Case Study of Long-Range Transport. J. Geophys. Res. 2008, 113, D07207. [Google Scholar] [CrossRef]
- Wonsick, M.M.; Pinker, R.T.; Ma, Y. Investigation of the “Elevated Heat Pump” Hypothesis of the Asian Monsoon Using Satellite Observations. Atmos. Chem. Phys. 2014, 14, 8749–8761. [Google Scholar] [CrossRef]
- Huang, K.; Fu, J.S.; Lin, N.; Wang, S.; Dong, X.; Wang, G. Superposition of Gobi Dust and Southeast Asian Biomass Burning: The Effect of Multisource Long-Range Transport on Aerosol Optical Properties and Regional Meteorology Modification. J. Geophys. Res. Atmos. 2019, 124, 9464–9483. [Google Scholar] [CrossRef]
- Cheng, Y.; Liu, H.; Chen, D.; Liu, H. Human Activity Intensity and Its Spatial-Temporal Evolution in China’s Border Areas. Land 2022, 11, 1089. [Google Scholar] [CrossRef]
- Tindan, J.Z.; Jin, Q.; Pu, B. Understanding Day–Night Differences in Dust Aerosols over the Dust Belt of North Africa, the Middle East, and Asia. Atmos. Chem. Phys. 2023, 23, 5435–5466. [Google Scholar] [CrossRef]
- Ge, J.M.; Huang, J.P.; Xu, C.P.; Qi, Y.L.; Liu, H.Y. Characteristics of Taklimakan Dust Emission and Distribution: A Satellite and Reanalysis Field Perspective. J. Geophys. Res. Atmos. 2014, 119, 11772–11783. [Google Scholar] [CrossRef]
- Zhu, H.; Li, R.; Yang, S.; Zhao, C.; Jiang, Z.; Huang, C. The Impacts of Dust Aerosol and Convective Available Potential Energy on Precipitation Vertical Structure in Southeastern China as Seen from Multisource Observations. Atmos. Chem. Phys. 2023, 23, 2421–2437. [Google Scholar] [CrossRef]
- Schepanski, K. Transport of Mineral Dust and Its Impact on Climate. Geosciences 2018, 8, 151. [Google Scholar] [CrossRef]
- Chang, L.; Zou, T. Spatio-Temporal Analysis of Air Pollution in North China Plain. Env. Ecol. Stat. 2022, 29, 271–293. [Google Scholar] [CrossRef]
- Ning, G.; Yim, S.H.L.; Wang, S.; Duan, B.; Nie, C.; Yang, X.; Wang, J.; Shang, K. Synergistic Effects of Synoptic Weather Patterns and Topography on Air Quality: A Case of the Sichuan Basin of China. Clim. Dyn. 2019, 53, 6729–6744. [Google Scholar] [CrossRef]
- Liao, T.; Gui, K.; Li, Y.; Wang, X.; Sun, Y. Seasonal Distribution and Vertical Structure of Different Types of Aerosols in Southwest China Observed from CALIOP. Atmos. Environ. 2021, 246, 118145. [Google Scholar] [CrossRef]
- Sun, T.; Che, H.; Qi, B.; Wang, Y.; Dong, Y.; Xia, X.; Wang, H.; Gui, K.; Zheng, Y.; Zhao, H.; et al. Aerosol Optical Characteristics and Their Vertical Distributions under Enhanced Haze Pollution Events: Effect of the Regional Transport of Different Aerosol Types over Eastern China. Atmos. Chem. Phys. 2018, 18, 2949–2971. [Google Scholar] [CrossRef]
- Zheng, Y.; Che, H.; Xia, X.; Wang, Y.; Wang, H.; Wu, Y.; Tao, J.; Zhao, H.; An, L.; Li, L.; et al. Five-Year Observation of Aerosol Optical Properties and Its Radiative Effects to Planetary Boundary Layer during Air Pollution Episodes in North China: Intercomparison of a Plain Site and a Mountainous Site in Beijing. Sci. Total Environ. 2019, 674, 140–158. [Google Scholar] [CrossRef]
- Liu, S.; Xing, J.; Zhao, B.; Wang, J.; Wang, S.; Zhang, X.; Ding, A. Understanding of Aerosol–Climate Interactions in China: Aerosol Impacts on Solar Radiation, Temperature, Cloud, and Precipitation and Its Changes Under Future Climate and Emission Scenarios. Curr. Pollut. Rep 2019, 5, 36–51. [Google Scholar] [CrossRef]
- Liu, Y.; Huang, J.; Wang, T.; Li, J.; Yan, H.; He, Y. Aerosol-Cloud Interactions over the Tibetan Plateau: An Overview. Earth-Sci. Rev. 2022, 234, 104216. [Google Scholar] [CrossRef]
- Miao, Y.; Liu, S. Linkages between Aerosol Pollution and Planetary Boundary Layer Structure in China. Sci. Total Environ. 2019, 650, 288–296. [Google Scholar] [CrossRef]
- Feng, X.; Wang, S.; Guo, J. Temperature Inversions in the Lower Troposphere over the Sichuan Basin, China: Seasonal Feature and Relation with Regional Atmospheric Circulations. Atmos. Res. 2022, 271, 106097. [Google Scholar] [CrossRef]
- Zhang, L.; Guo, X.; Zhao, T.; Gong, S.; Xu, X.; Li, Y.; Luo, L.; Gui, K.; Wang, H.; Zheng, Y.; et al. A Modelling Study of the Terrain Effects on Haze Pollution in the Sichuan Basin. Atmos. Environ. 2019, 196, 77–85. [Google Scholar] [CrossRef]
- Zhang, L.; Li, Q.; Meng, L.; Zhang, Q.; Zhang, H.; He, Q.; Zhao, T. Research on the Development of the Deep Atmospheric Boundary Layer, Turbulent Motion, and Dust Stagnation. Adv. Earth Sci. 2022, 37, 991–1004. [Google Scholar] [CrossRef]
- Ma, Y.; Xin, J.; Wang, Z.; Tian, Y.; Wu, L.; Tang, G.; Zhang, W.; De Arellano, J.V.-G.; Zhao, D.; Jia, D.; et al. How Do Aerosols above the Residual Layer Affect the Planetary Boundary Layer Height? Sci. Total Environ. 2022, 814, 151953. [Google Scholar] [CrossRef]
- Zhao, S.; Feng, T.; Tie, X.; Wang, Z. The Warming Tibetan Plateau Improves Winter Air Quality in the Sichuan Basin, China. Atmos. Chem. Phys. 2020, 20, 14873–14887. [Google Scholar] [CrossRef]
- Xin, J.; Ma, Y.; Zhao, D.; Gong, C.; Ren, X.; Tang, G.; Xia, X.; Wang, Z.; Cao, J.; De Arellano, J.V.-G.; et al. The Feedback Effects of Aerosols from Different Sources on the Urban Boundary Layer in Beijing China. Environ. Pollut. 2023, 325, 121440. [Google Scholar] [CrossRef] [PubMed]
- Liu, J.; Wu, D.; Wang, T.; Ji, M.; Wang, X. Interannual Variability of Dust Height and the Dynamics of Its Formation over East Asia. Sci. Total Environ. 2021, 751, 142288. [Google Scholar] [CrossRef] [PubMed]
Disclaimer/Publisher’s Note: The statements, opinions and data contained in all publications are solely those of the individual author(s) and contributor(s) and not of MDPI and/or the editor(s). MDPI and/or the editor(s) disclaim responsibility for any injury to people or property resulting from any ideas, methods, instructions or products referred to in the content. |
© 2023 by the authors. Licensee MDPI, Basel, Switzerland. This article is an open access article distributed under the terms and conditions of the Creative Commons Attribution (CC BY) license (https://creativecommons.org/licenses/by/4.0/).