Article

An Information Extraction Method for Industrial and Commercial Rooftop Photovoltaics Based on GaoFen-7 Remote Sensing Images

1
Aerospace Information Research Institute, Chinese Academy of Sciences, Beijing 100094, China
2
University of Chinese Academy of Sciences, Beijing 100049, China
*
Author to whom correspondence should be addressed.
Remote Sens. 2023, 15(24), 5744; https://doi.org/10.3390/rs15245744
Submission received: 13 October 2023 / Revised: 7 December 2023 / Accepted: 8 December 2023 / Published: 15 December 2023

Abstract

:
With the increasing global focus on renewable energy, distributed rooftop photovoltaics (PVs) are gradually becoming an important form of energy generation. Effective monitoring of rooftop PV information can obtain their spatial distribution and installed capacity, which is the basis used by management departments to formulate regulatory policies. Due to the time-consuming and labor-intensive problems involved in manual monitoring, remote-sensing-based monitoring methods are getting more attention. Currently, remote-sensing-based distributed rooftop PV monitoring methods are mainly used as household rooftop PVs, and most of them use aerial or satellite images with a resolution higher than 0.3 m; there is no research on industrial and commercial rooftop PVs. This study focuses on the distributed industrial and commercial rooftop PV information extraction method based on the Gaofen-7 satellite with a resolution of 0.65 m. First, the distributed industrial and commercial rooftop PV dataset based on Gaofen-7 satellite and the optimized public PV datasets were constructed. Second, an advanced MANet model was proposed. Compared to MANet, the proposed model removed the downsample operation in the first stage of the encoder and added an auxiliary branch containing the Atrous Spatial Pyramid Pooling (ASPP) module in the decoder. Comparative experiments were conducted between the advanced MANet and state-of-the-art semantic segmentation models. In the Gaofen-7 satellite PV dataset, the Intersection over Union (IoU) of the advanced MANet in the test set was improved by 13.5%, 8.96%, 2.67%, 0.63%, and 0.75% over Deeplabv3+, U2net-lite, U2net-full, Unet, and MANet. In order to further verify the performance of the proposed model, experiments were conducted on optimized public PV datasets. The IoU was improved by 3.18%, 3.78%, 3.29%, 4.98%, and 0.42%, demonstrating that it outperformed the other models.

1. Introduction

Global problems, such as the greenhouse effect, ecological damage, and climate change, that have been caused by the over-consumption of fossil energy have posed a serious threat to the sustainable development of humankind. In this context, the establishment of a clean, low-carbon energy system has become a global trend. With significant environmental, economic, and social benefits, solar PVs provide a highly promising avenue for sustainable energy conversion [1,2,3].
Centralized PV construction requires a large amount of land resources [4]. On the one hand, land resources in urban areas are small, making them not suitable for centralized PV installation. On the other hand, urban areas are densely populated and have a high demand for electricity. This results in a mismatch between the construction of centralized PVs and power energy demand [5]. Compared with centralized PVs, distributed rooftop PVs are generally built on the surface of buildings and can be flexibly installed according to the characteristics of the building, significantly improving land utilization. At the same time, distributed rooftop PVs are located on the user side, and users can generate and consume electricity nearby, which greatly reduces the power loss during the transmission process of the grids. Therefore, distributed rooftop PVs have become the main form of utilizing solar energy in urban areas and have made rapid development in recent years.
The installed capacity and spatial distribution information of PVs are important basis for management departments to formulate regulatory policies, which not only support the dynamic updating of PV construction planning paths, but also provide a working basis for tasks such as power generation assessment. With the increase in distributed rooftop PVs, their spatial distribution is characterized by the scattered layout that includes many PVs. Therefore, traditional approaches to obtain information on installed capacity and spatial distribution of distributed rooftop PVs, like surveys and utility company interconnection files, are both inefficient and costly in terms of time and labor [6].
Remote sensing, as a means of non-contact measurement, is capable of acquiring a wide range of data in a short period of time. With the development and progress of remote sensing technology, the resolution of satellite is also improving [7]. Multi-source, high-resolution remote sensing images undoubtedly provide low-cost, high-efficiency data support for the acquisition of PV information. PV information extraction based on remote sensing has become the most widely used monitoring means. Acquiring PV information based on remote sensing visual interpretation can achieve high accuracy, but it also requires high time and labor costs. Therefore, more and more studies have been paying attention to extracting PV information by means of computer vision. Xia et al. used a combination of NDBI index and random forest to extract PV power plants in five provinces of Northwest China [2]. Chen et al. used a combination of raw spectral features, PV extraction features, terrain features, and classifiers, such as XGBoost, random forest, and support vector machines to extract PV power plants in the Golmud region of China [8]. Wang et al. proposed a method of extracting PV power plants based on multi-invariant feature combination using Landsat 8 OLI remote sensing images [9].
The above studies are based on traditional machine learning methods. These methods are usually two-stage, with feature extraction followed by classification [10]. In this case, the feature extraction stage requires human-designed features [11], while the classifier also requires human selection and design. Traditional machine learning methods have limited nonlinear mapping capabilities and have good results in dealing with targets with relatively homogeneous backgrounds, such as centralized PVs [8,12]. However, when transferred to deal with targets with complex backgrounds, such as distributed rooftop PVs, these methods often fail to achieve better results.
Compared with traditional machine learning methods, deep learning methods integrate feature extraction and classification into one stage [10]. Meanwhile, deep neural networks have stronger nonlinear mapping ability [13], which is more suitable for target extraction in complex backgrounds. Due to the wide application of deep learning in the field of natural images, many researchers started to use deep learning methods in the field of remote sensing and made breakthroughs in PV information extraction. In the centralized PV information extraction study, Du et al. used the Deeplabv3+ model with ResNeSt-50 as the backbone to extract centralized PV power stations within China [14]. Ge et al. combined the EfficientNet-B5 scene classification and U2net semantic segmentation models to extracted centralized PV power stations in Qinghai, Xinjiang, and Gansu provinces [15]. Wang et al. proposed the PVNet model for the extraction of regularly shaped PV panels in centralized PV systems [16]. In the distributed rooftop PV information extraction study, Jurakuziev et al. designed a network combining Unet and EfficientNetB7 [17] for information extraction and power generation capacity estimation of distributed rooftop PVs in Gangnam District, Seoul, South Korea [6]. Zhu et al. designed a modified Deeplabv3+ model based on the German Heilbronn remote sensing data. Attention and ASPP modules were added on the basis of the Deeplabv3+ model, and the PointRend Network [18] was integrated to optimize the prediction boundary [19]. Camilo et al. used SegNet [20] to extract distributed rooftop PVs based on remote sensing data from Fresno, California, USA [21]. Wani et al. designed a lightweight distributed PV information extraction model based on Duke California Solar array (DCSA). The model combined the structure of Mobilenet [22] and Unet, which improved the extraction speed and ensured the accuracy of the extraction [23]. In addition, since most of the distributed PVs are on the surface of buildings, the study of extracting buildings is also useful for distributed PV extraction. Guo et al. proposed SG-EPUNet to automatically update the existing building databases to their current status with minimal manual intervention. In SG-EPUNet framework, EPUNet was designed to extract building features robustly [24]. Liu et al. proposed MS-GeoNet for building footprint extraction. The proposed architecture focused on multi-scale nested characteristics and the spatial correlation between buildings and backgrounds, which outperformed the Fully Convolutional DenseNets [25].
Currently, studies using deep learning to extract distributed rooftop PV information focus on household rooftop PVs. Li et al. conducted experiments on the resolution selection problem of remote sensing images for distributed rooftop PV information extraction [26]. Experimental results showed that 0.3 m was the threshold resolution for a PV segmentation issue, and 1.2 m was the lowest limitation for PV segmentation. Actually, distributed rooftop PV information can be divided into two categories, i.e., household rooftop PV information and industrial and commercial rooftop PV information.
In recent years, the high demand for energy use and the large total roof areas have made industrial and commercial rooftop PVs an important form for realizing the comprehensive utilization of PVs and accelerating the transformation of green energy development. In contrast to household rooftop PVs, the larger area of industrial and commercial rooftop PVs allows relatively accurate information to be extracted without the use of ultra-high resolution remote sensing images. In addition, the operation mode of industrial and commercial rooftop PVs has great flexibility. Together with the characteristic of large scale, industrial and commercial rooftop PVs can achieve higher economic benefit than household PVs. Therefore, the study of industrial and commercial rooftop PV information extraction methods based on remote sensing images has an important value for application, and it is also realistic in terms of the need to promote green energy strategies. However, current researches on industrial and commercial PVs focus on economic benefit analysis [27,28] and power generation prediction [29], and do not use remote sensing technology. There are no studies on industrial and commercial rooftop PV extraction using remote sensing images with a resolution lower than 0.3 m.
This paper focuses on the distributed industrial and commercial rooftop PV information extraction method based on Gaofen-7 satellite with a resolution of 0.65 m. First, two industrial and commercial rooftop PV datasets were constructed using Gaofen-7 satellite images and the publicly available PV dataset, which provided data input for the training of deep learning models; Second, we optimized the MANet model and proposed an advanced MANet. Compared to MANet, the advanced model removed the downsample operation in the first stage of the encoder, which improved the model’s ability to extract low-level spatial information [30]. The introduction of the ASPP-based auxiliary branch improved the model’s ability to extract multi-scale information. In addition, the attention mechanism ensured the model’s ability to extract high-level semantic information [30]. We conducted comparative experiments and the results showed that the advanced MANet model outperformed state-of-the-art models.

2. Materials and Methods

2.1. Materials

2.1.1. Study Area

Jiangsu Province was chosen for this study. Jiangsu Province has a land area of 107,200 square kilometers [31], accounting for 1.12 percent of the total area of China. Figure 1 shows the geographical spatial location of Jiangsu Province. The total annual solar radiation in Jiangsu Province ranges from 4245 to 5017 MJ/m2, with more distribute in the north and less in the south. The annual sunshine hours in the province range from 1816 to 2503 h, and its distribution also decreases from north to south [32]. In recent years, due to the rapid growth of energy demand in Jiangsu Province, the government has committed to realizing energy transformation by improving energy efficiency and promoting the use of clean and renewable energy [33]. At present, Jiangsu Province ranks among the highest in China in terms of the installed capacity of distributed PVs [34,35]. Figure 2 shows the distributed PVs grid-connected data in Jiangsu Province. According to the statistics from the National Energy Administration, the cumulative grid-connected capacity of Jiangsu Province reached 27.652 MW, including 17.763 MW of new grid-connected capacity from the distributed rooftop PVs. The data for the first quarter of 2023 showed that the new grid-connected capacity of distributed rooftop PVs in Jiangsu Province reached 2.211 MW, including 1.43 MW from the new grid-connected capacity of industrial and commercial rooftop PVs. Therefore, distributed industrial and commercial rooftop PVs in Jiangsu Province are well-developed and can provide rich data resources.

2.1.2. Data Sources

The data used in this study were obtained from the Gaofen-7 satellite. Gaofen-7 is China’s first civil optical stereo mapping satellite with sub-meter resolution; it was successfully launched on 3 November 2019. The Gaofen-7 satellite operates in a sun-synchronous orbit with an orbital altitude of about 505 km [37] and a revisit cycle of 41 days. It can effectively acquire 20 km wide front-view panchromatic stereoscopic images with a 0.8 m resolution, rear-view panchromatic stereoscopic images with a 0.65 m resolution, and multi-spectral images with a 2.6 m resolution [38]. Currently, the Gaofen-7 satellite is mainly used for natural resource survey monitoring and global geo-information resource construction [39]. It also provides high-precision satellite remote sensing images for the fields of urban and rural development as well as national survey statistics.

2.1.3. Datasets

Two datasets were used in this study. The first dataset was constructed based on Gaofen-7 satellite images. The data sources were from the China Remote Sensing Satellite Ground Station. Cloud-free Gaofen-7 images in Jiangsu Province were selected for orthometric correction, and rear-view panchromatic stereoscopic images and multispectral images were fused to obtain the basic data for model training. In this study, images were acquired from April to October 2022. A total of 14 satellite images in the region of Jiangsu Province were selected as data sources. The dataset consists of two parts. One part includes the samples sized 256 × 256 pixels cropped from the GaoFen-7 satellite images, and the other is the labels for the industrial and commercial rooftop PVs. QGIS was used to label a total of 4109 industrial and commercial rooftop PVs. Since the obtained elements could not be directly used as input to the model, this experiment used the sliding window to generate the dataset. The sliding window size in this study was 256 × 256 pixels. Samples and labels sized at 256 × 256 pixels were obtained through sliding on the GaoFen-7 images and the corresponding annotations. Based on these elements, 6263 sample label pairs were created. Since the dataset used in this study was not very large (below the 10,000 level), the ratio of training, validation, and test sets for this study was 6:2:2. Figure 3 shows some examples of sample label pairs in the dataset.
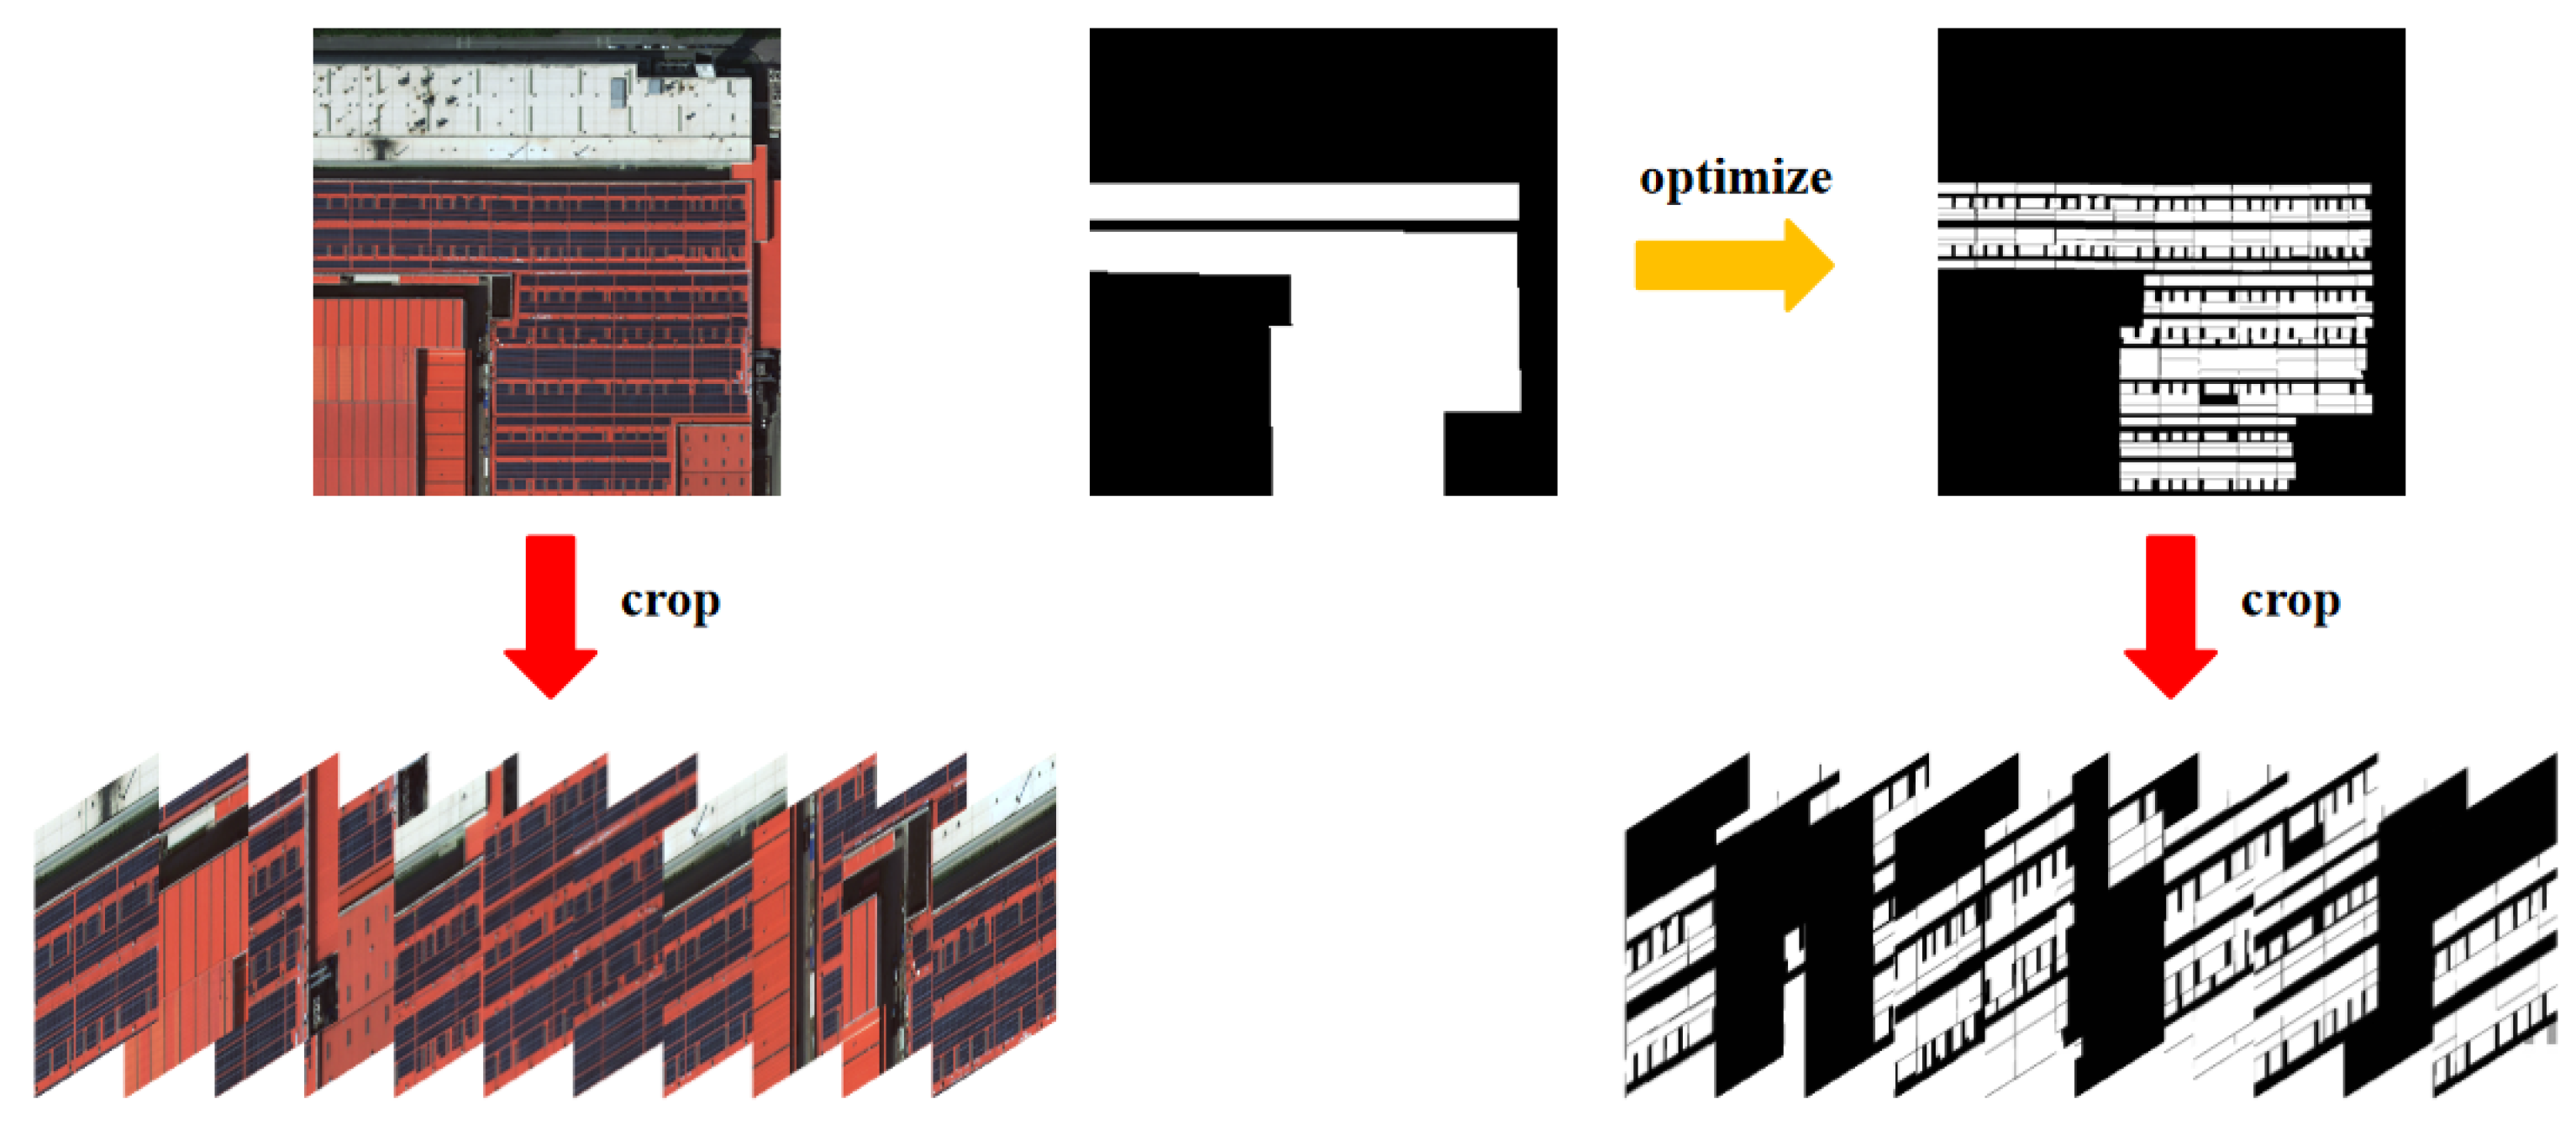
The second dataset was constructed based on the publicly available PV dataset [40]. This dataset contains satellite and aerial images with spatial resolutions of 0.8, 0.3, and 0.1 m. The data sources used in this public dataset include Gaofen-2 images, Beijing-2 images, and Unmanned Aerial Vehicle (UAV) images. Since this dataset was not fine enough to label images of 1024 × 1024 pixels size, this study optimized the labels. In addition, in order to increase the samples in the dataset, the 1024 × 1024 pixels images were cropped into 256 × 256 pixels images. Figure 4 shows the optimization process for the public dataset. Finally, samples containing industrial and commercial PVs in the public dataset were selected. A total of 1096 sample label pairs were finally obtained.

2.2. Methods

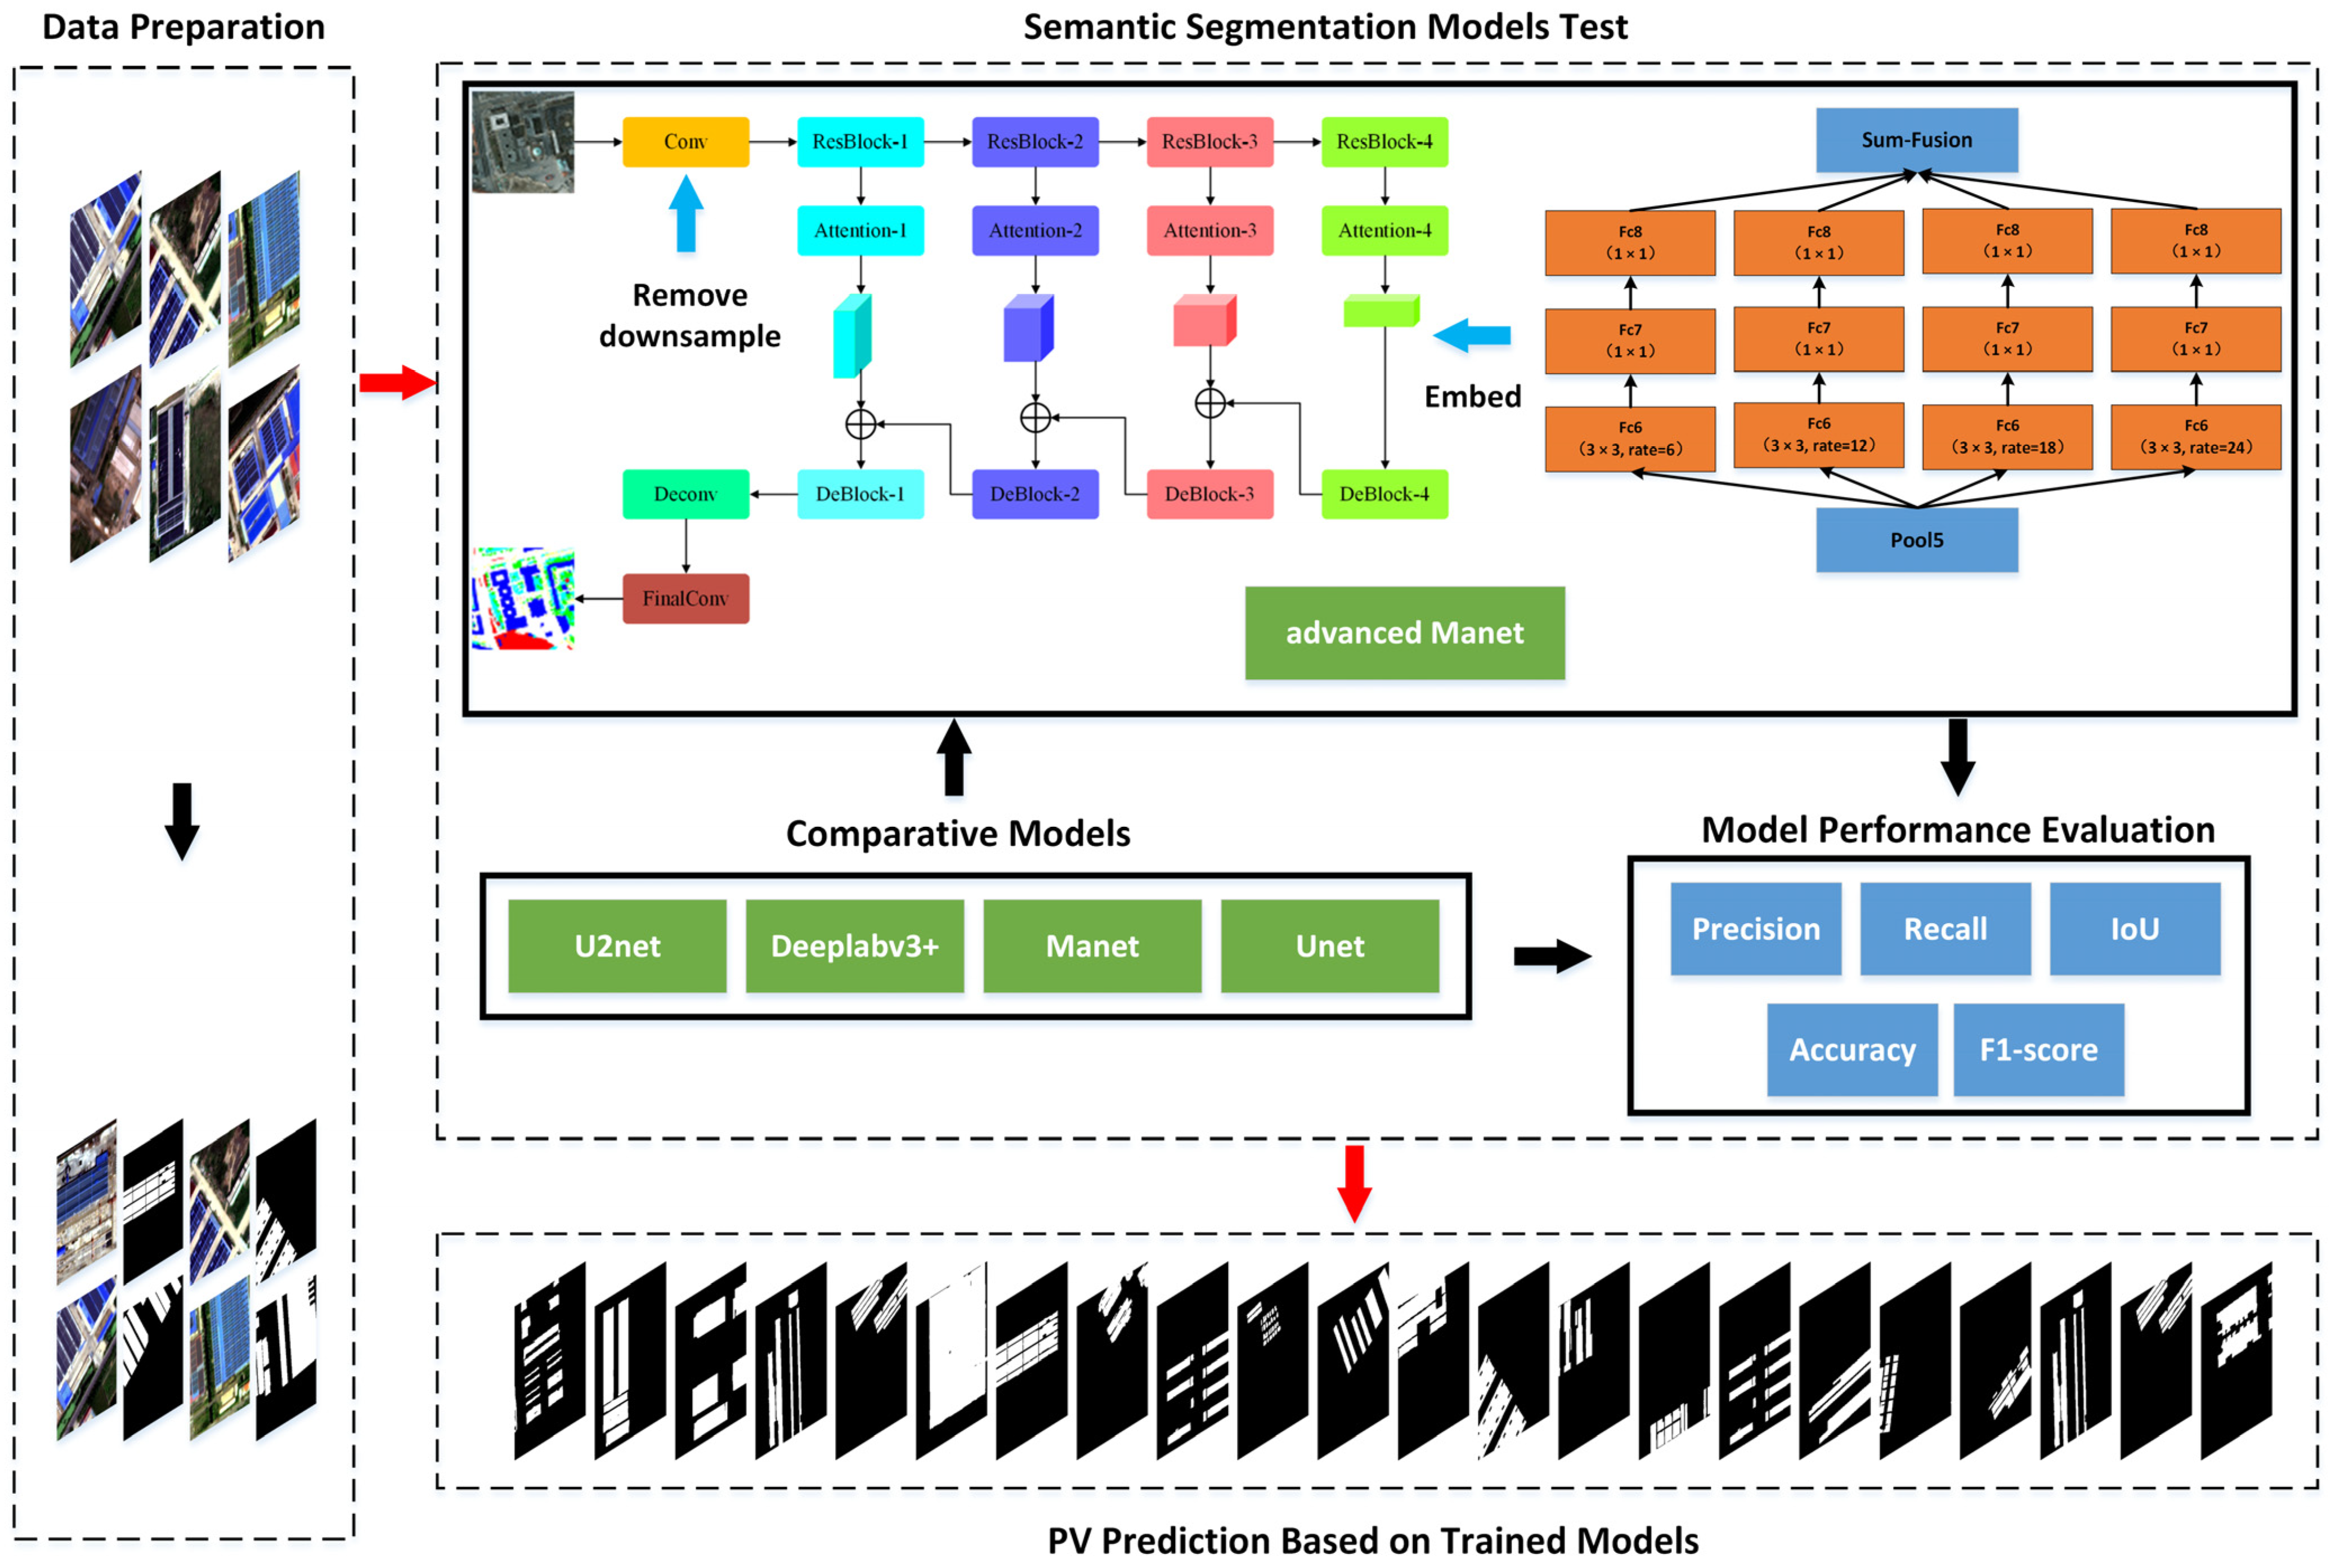
The technical framework of this study is shown in Figure 5. The study can be divided into three parts, i.e., data preparation, semantic segmentation models test, and industrial and commercial rooftop PV prediction based on trained models.
In the semantic segmentation models test stage, the state-of-the-art semantic segmentation models, such as Unet, U2net, Deeplabv3+ and MANet, were used in the experiments. By introducing the ASPP module as an auxiliary branch and removing the downsample operation in the first stage of the encoder, we proposed an advanced MANet model. The advanced MANet model was compared with state-of-the-art methods. The performance of the models was evaluated by accuracy, recall, precision, F1-Score, and IoU metrics.

2.2.1. MANet

MANet is an encoder–decoder structured semantic segmentation network. The encoder part of this network uses a residual module to extract multi-scale features, and the decoder part uses a deconvolution module to upsample the features. Meanwhile, MANet adds spatial attention and channel attention modules to the skip connection part. Through skip connection, the outputs of the encoder and decoder can be fused to obtain features containing multi-scale information and attention information, which enables the network to capture long-distance dependencies. For the spatial attention module, the memory complexity of the traditional dot product operation is O(N2), which has a large amount of calculation. MANet introduces the kernel attention mechanism. The memory complexity of kernel attention is O(N), which reduces the computational complexity significantly. In addition, the attention module in MANet also achieves better performance than Squeeze-and-Excitation Networks (SENet) [41], Convolutional Block Attention Module (CBAM) [42].

2.2.2. Atrous Spatial Pyramid Pooling

Atrous Spatial Pyramid Pooling (ASPP) is a module proposed in Deeplabv2 [43]. The core of ASPP is dilated convolution. Expanding the receptive field by traditional convolution leads to a significant loss of feature detail information. Dilated convolution expands the receptive field while ensuring that there will be minimal loss of the boundary details of the feature, which has been widely used in computer vision filed. By setting different dilation rates, dilated convolutions with different receptive fields can be constructed. ASPP uses multiple parallel dilated convolutional layers with different dilation rates to extract feature information of different receptive fields, then fuses the features of each branch to obtain multi-scale feature information.

2.2.3. Advanced MANet

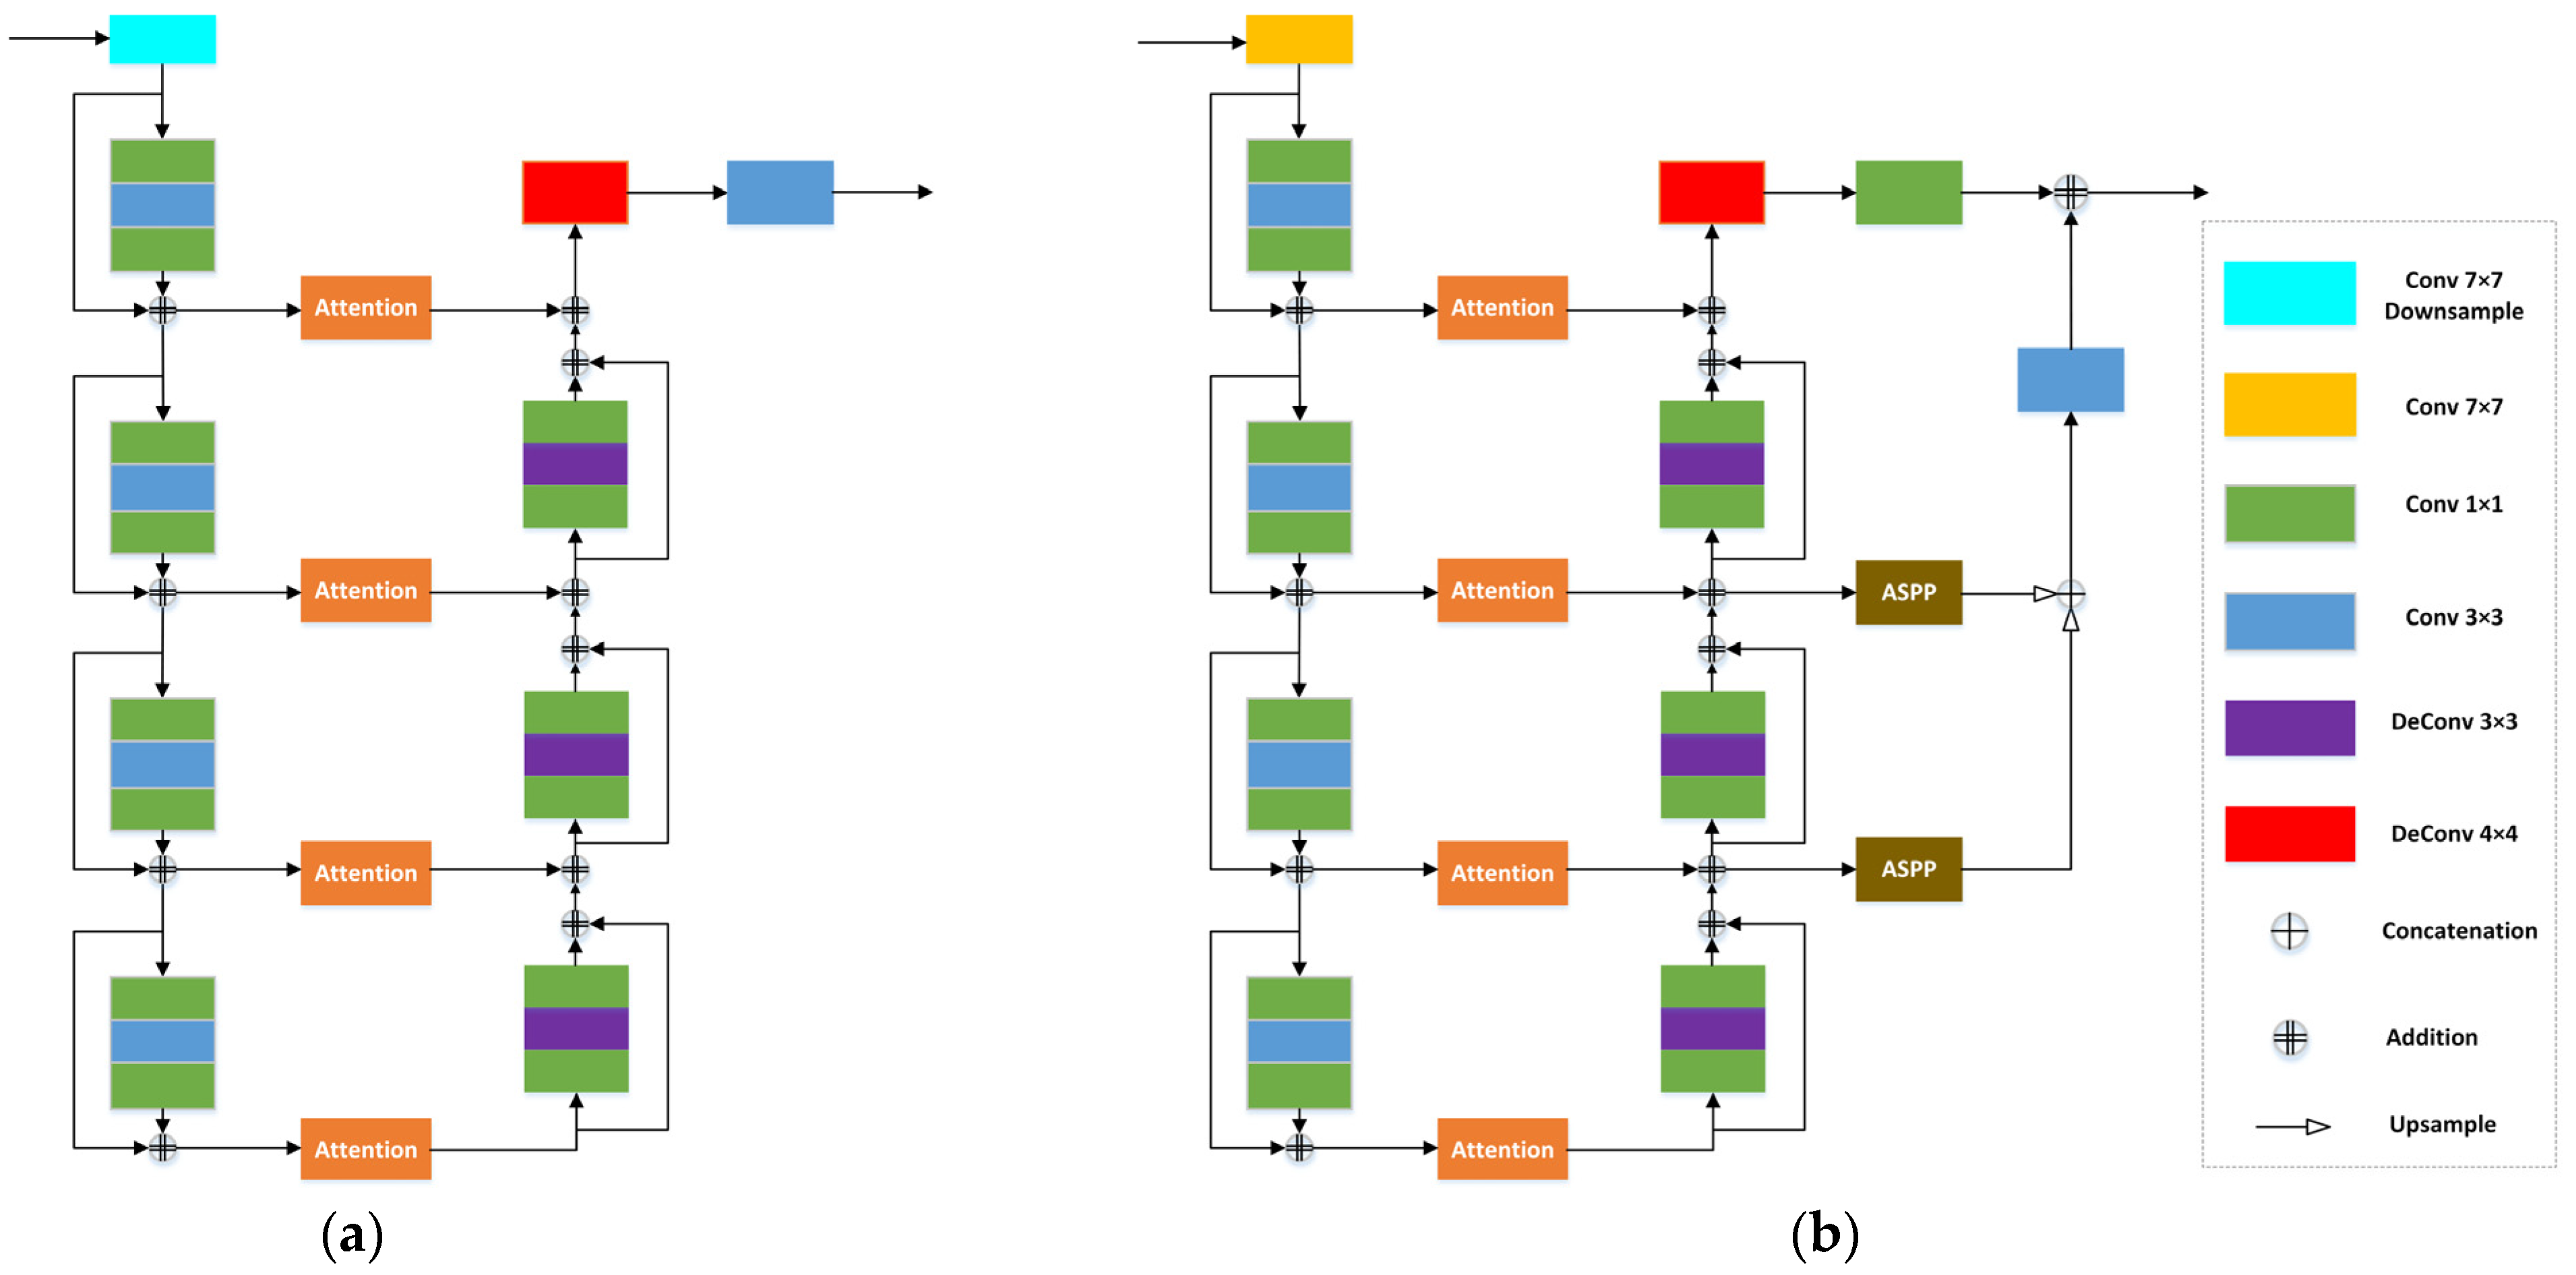
MANet acquires output with the help of the last layer of decoder, which may cause it to suffer from poor detail recognition. This study proposed an advanced MANet by introducing the ASPP module and removing downsample operation in the first stage of the encoder to deal with this problem. Compared to MANet, the innovation of this model is that introducing an auxiliary decoding branch based on ASPP improves the model’s ability to extract multi-scale information, and removing the downsample operation in the first stage of the encoder improves the model’s ability to extract low-level spatial features. The difference between the structure of MANet and advanced MANet are shown in Figure 6.
The backbone of the advanced MANet uses Resnet50 [44]. Skip connection adopts a parallel structure of spatial attention and channel attention. The auxiliary decoder branch takes the reconstructed features at different stages through the ASPP module, upsamples the output features and performs concatenation to obtain the auxiliary multi-scale reconstructed features that are fused with the multi-scale features of the main decoder branch to get the final output. To verify the effectiveness of the proposed model, this study carried out ablation experiments, which are shown in the Discussion section.

2.2.4. Performance Evaluation

This study conducted comparative experiments between the proposed model and state-of-the-art models. All models were trained based on the cross-entropy loss function. The trained models made predictions based on the test set of the constructed dataset. The results of the training models were validated by accuracy, recall, precision, F1-Score, and IoU, which were all calculated based on the confusion matrix.
Table 1 shows the basic information of the confusion matrix. In the confusion matrix, TP indicates that the ground truth is industrial and commercial rooftop PVs and the predicted result is also industrial and commercial rooftop PVs; FP indicates that the ground truth is background, while the predicted result is industrial and commercial rooftop PVs; FN indicates that the ground truth is industrial and commercial rooftop PVs, while the predicted result is background; TN indicates that the ground truth is background and the predicted result is also background.
Accuracy is a metric that generally describes how the model performs across all classes. It is calculated as the ratio between the number of correct predictions to the total number of predictions.
A c c u r a c y = T P + T N T P + T N + F P + F N
Recall measures how many of the positive class samples present in the dataset are correctly identified by the model.
R e c a l l = T P T P + F N
Precision measures how many of the positive predictions made by the model are correct.
P r e c i s i o n = T P T P + F P
F1 score is a metric that combines precision and recall scores using their harmonic mean.
F 1   S c o r e = 2 × P r e c i s i o n × R e c a l l P r e c i s i o n + R e c a l l = T P T P + 1 2 ( F P + F N )
IoU is calculated by dividing the overlap between the predicted and ground truth annotation by their union.
I o U = t a r g e t p r e d i c t i o n t a r g e t p r e d i c t i o n = T P T P + F P + F N
Since this study is a binary classification task, i.e., it distinguishes between the areas of the image that belong to industrial and commercial rooftop PVs and those which belong to the background, the cross-entropy loss function is formulated as follows.
L = 1 N i L i = 1 N i ( y i log ( p i ) + ( 1 y i ) log ( 1 p i ) )
y i denotes the label of the pixels, where 1 represents the industrial and commercial rooftop PVs and 0 represents the background. p i denotes the probability that pixels i are predicted to be industrial and commercial rooftop PVs.

2.2.5. Experimental Settings

In this study, the Pytorch framework was used to build the semantic segmentation models. We trained the models on a server with one NVIDIA Tesla V100 graphics processing unit (GPU) with 32 GB of GPU memory. In this experiment, we used Adam as the optimizer and cross-entropy as the loss function. We set the initial learning rate to 0.01 and the weight decay to 1 × 10⁻⁴. The input batch size was set to eight. The number workers was set to eight and the epochs were set to 100.

3. Results and Discussion

3.1. Results and Analysis

Different models were trained based on the above experimental configurations and hyperparameters. The optimal model weights were selected based on the validation set evaluation results and loaded into the corresponding models. The images in the test set were predicted using the models loaded with training weights, and the prediction results of different models on the test set were analyzed and discussed.
Table 2 shows the test results of different models based on the GaoFen-7 satellite PV dataset. The bold number represents the maximum value of the indicator in the comparison model. The results show that the advanced MANet model performed best in the test set. The IoU, accuracy, F1-score, precision, and recall of the advanced MANet model are 91.67%, 99.53%, 0.9504, 95.41%, and 95.13%. The IoU is improved by 13.5%, 8.96%, 2.67%, 0.63%, and 0.75% over Deeplabv3+, U2net-lite, U2net-full, Unet, and MANet. The Recall is improved by 7.86%, 5.51%, 1.31%, 0.72%, and 0.56%.
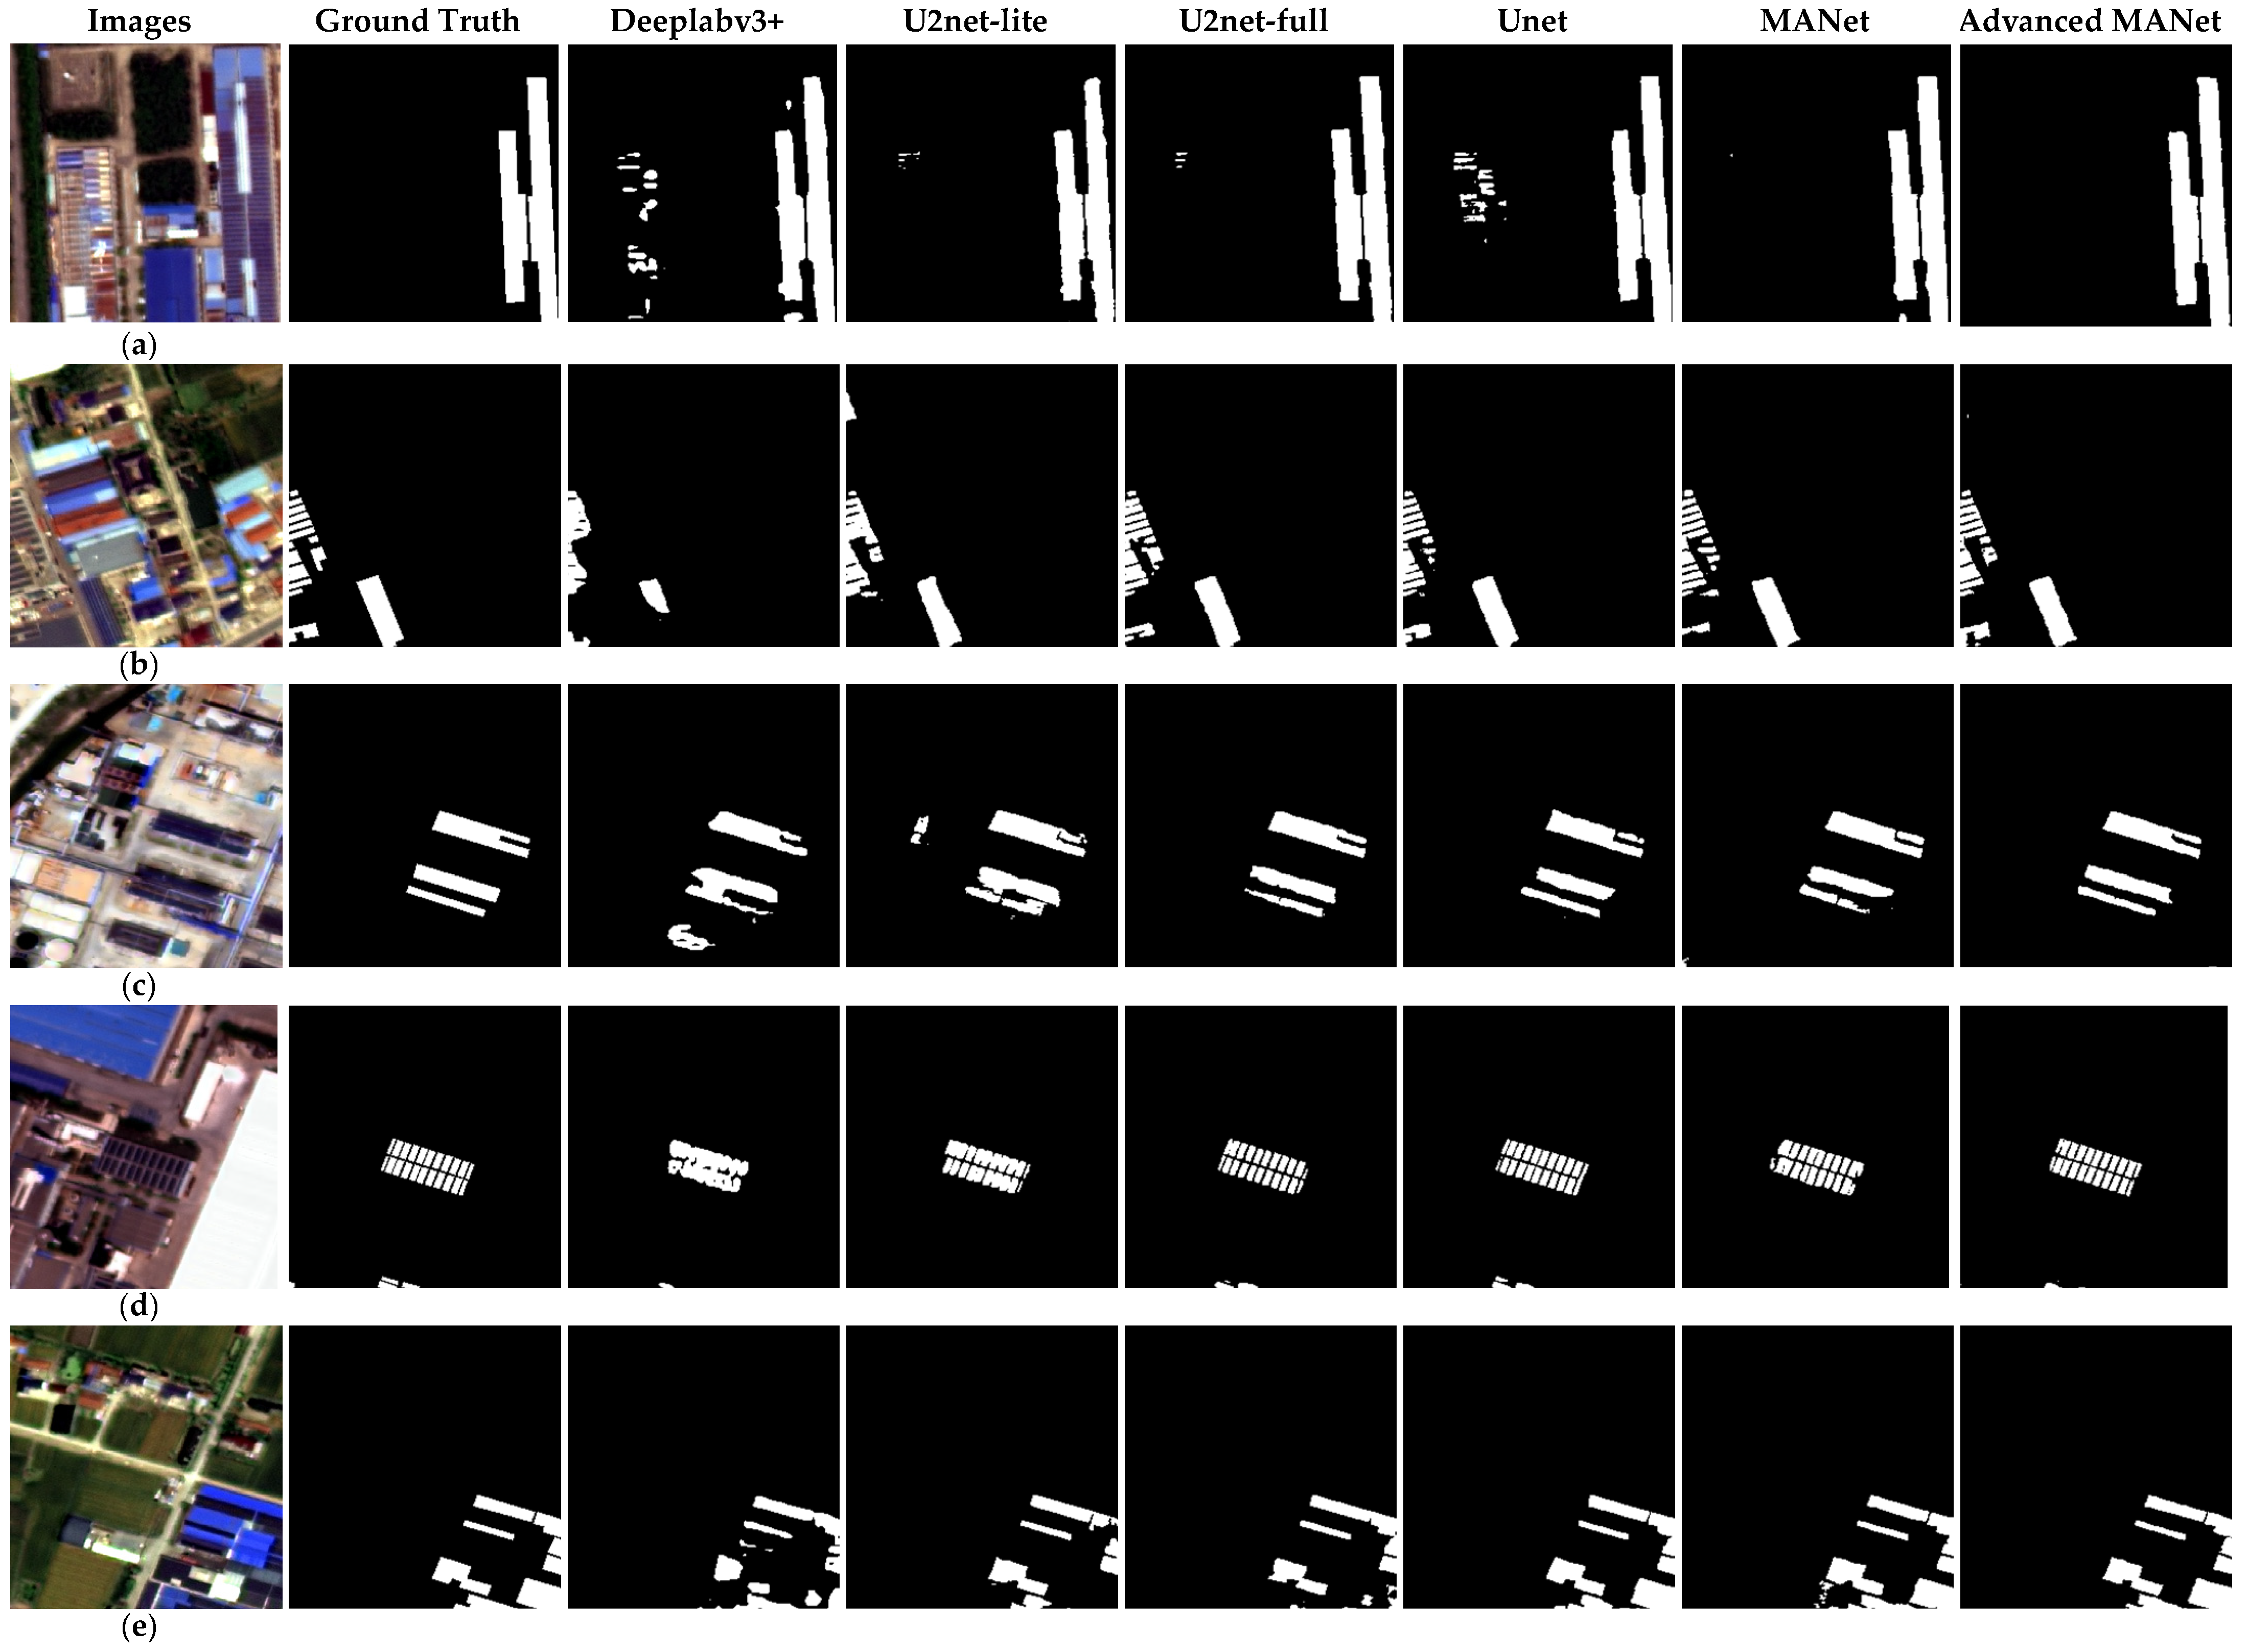
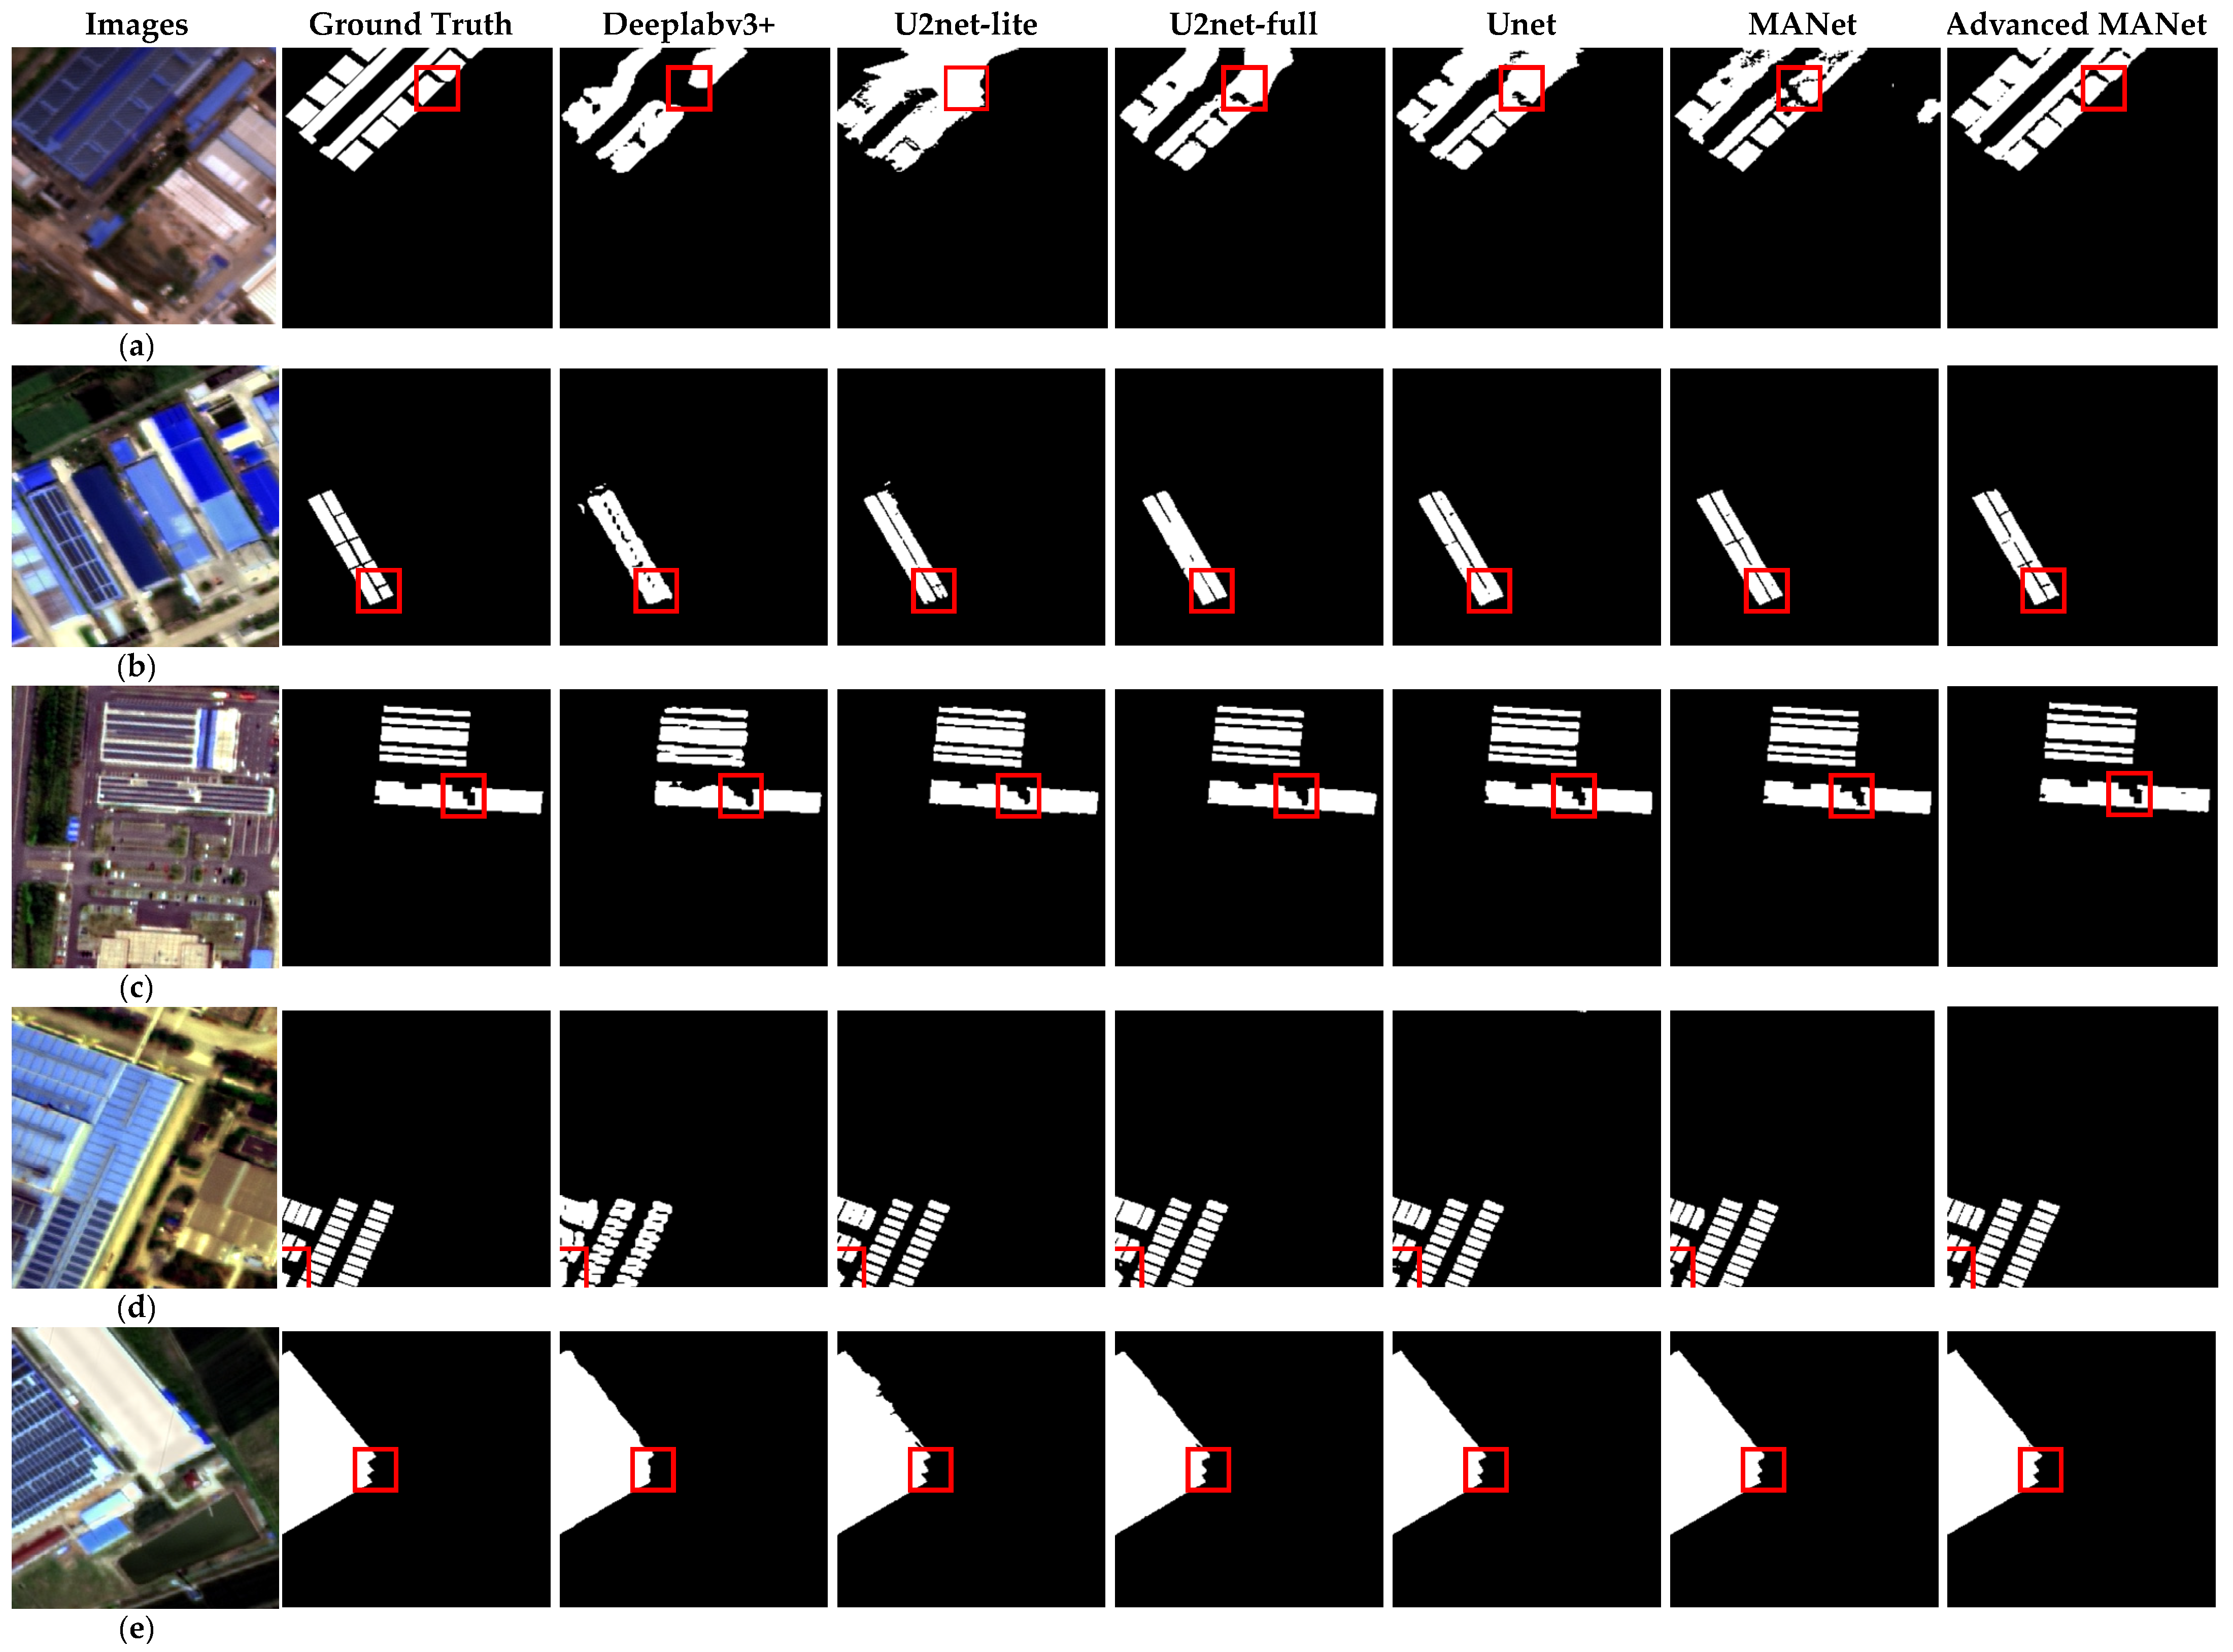
Figure 7 shows the prediction results of the different models on the part of the data in the test set. The results show that the boundaries of the advanced MANet predictions are more complete and clearer, and the prediction results contain relatively less noise. This reflects the fact that the advanced MANet extracts better features than the other models.
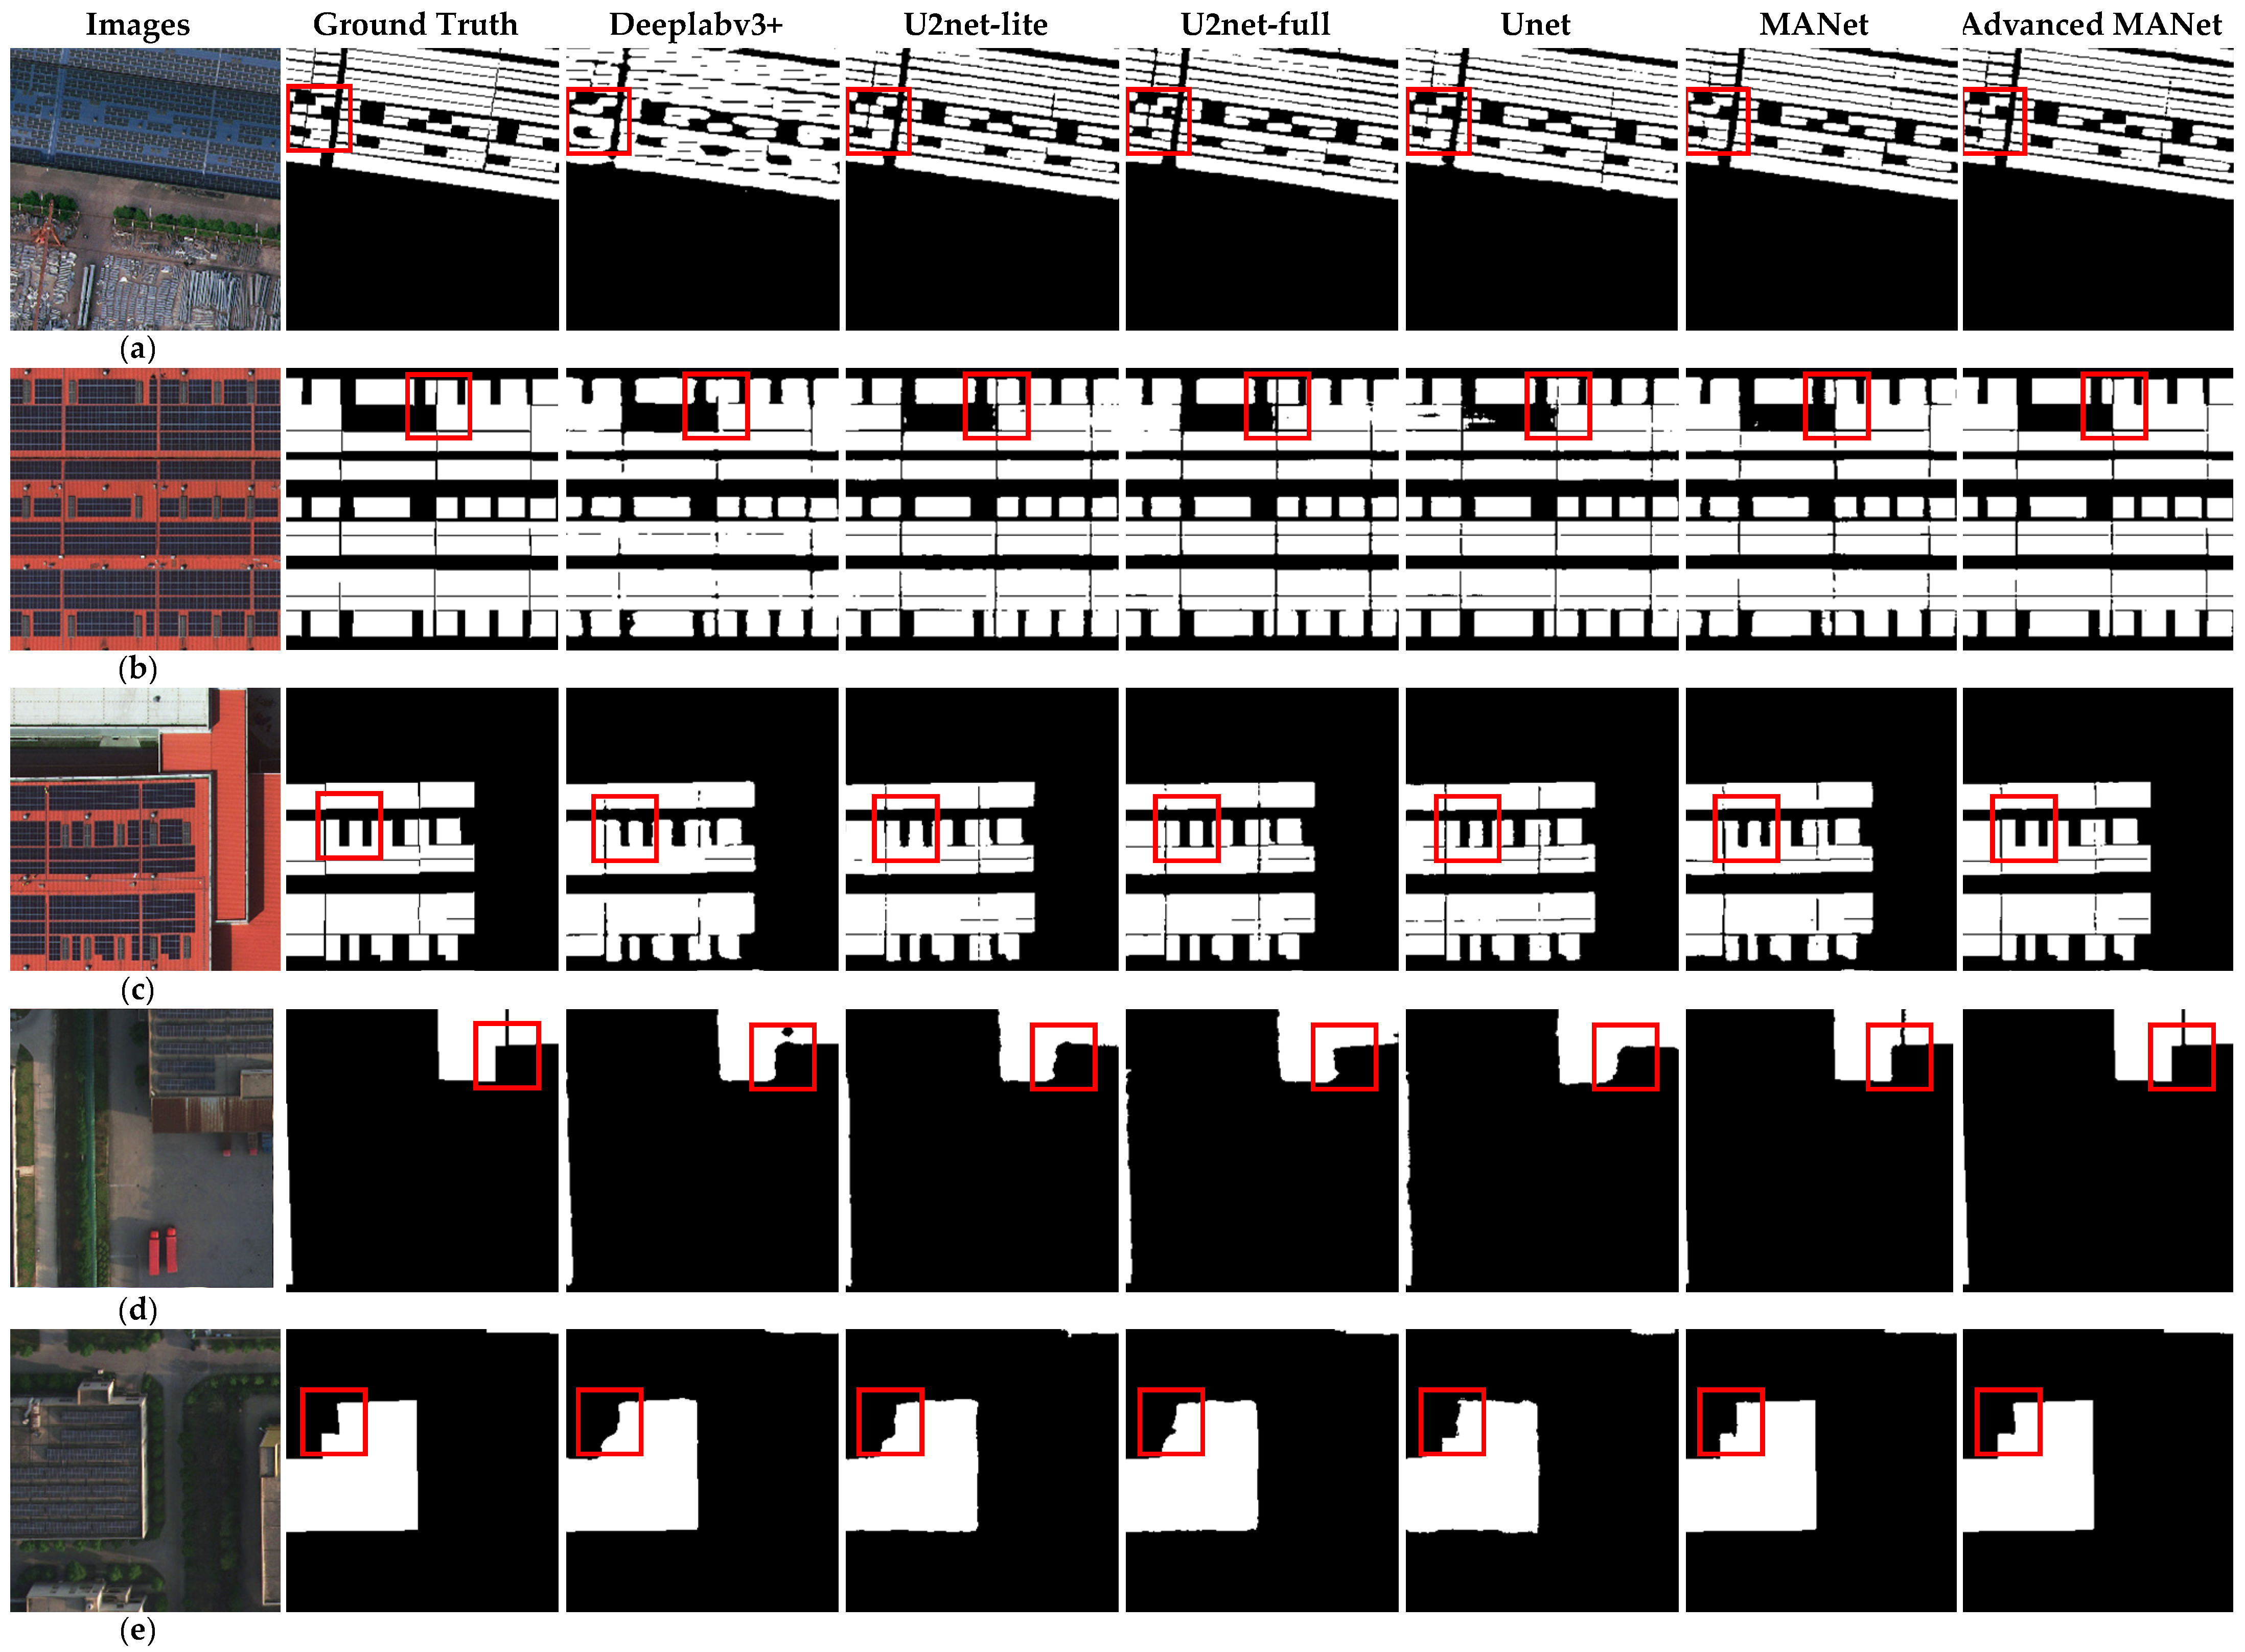
In order to further verify the superiority of the advanced MANet, experiments analyzed the capabilities of different models in detail processing based on the GaoFen-7 satellite PV dataset. Figure 8 shows the results of different models predicting detailed information on the part of the data in the test set. The red box shows the predictions of different models in local areas. The results show that the advanced MANet model is more accurate and complete in extracting the detail information of industrial and commercial rooftop PVs. This is because the first stage of encoder in the advanced MANet does not use the operation of downsampling, which enhances its ability to extract low-level spatial features. Moreover, low-level spatial features contain more detailed information, which makes the advanced MANet better at handling detailed information [32].
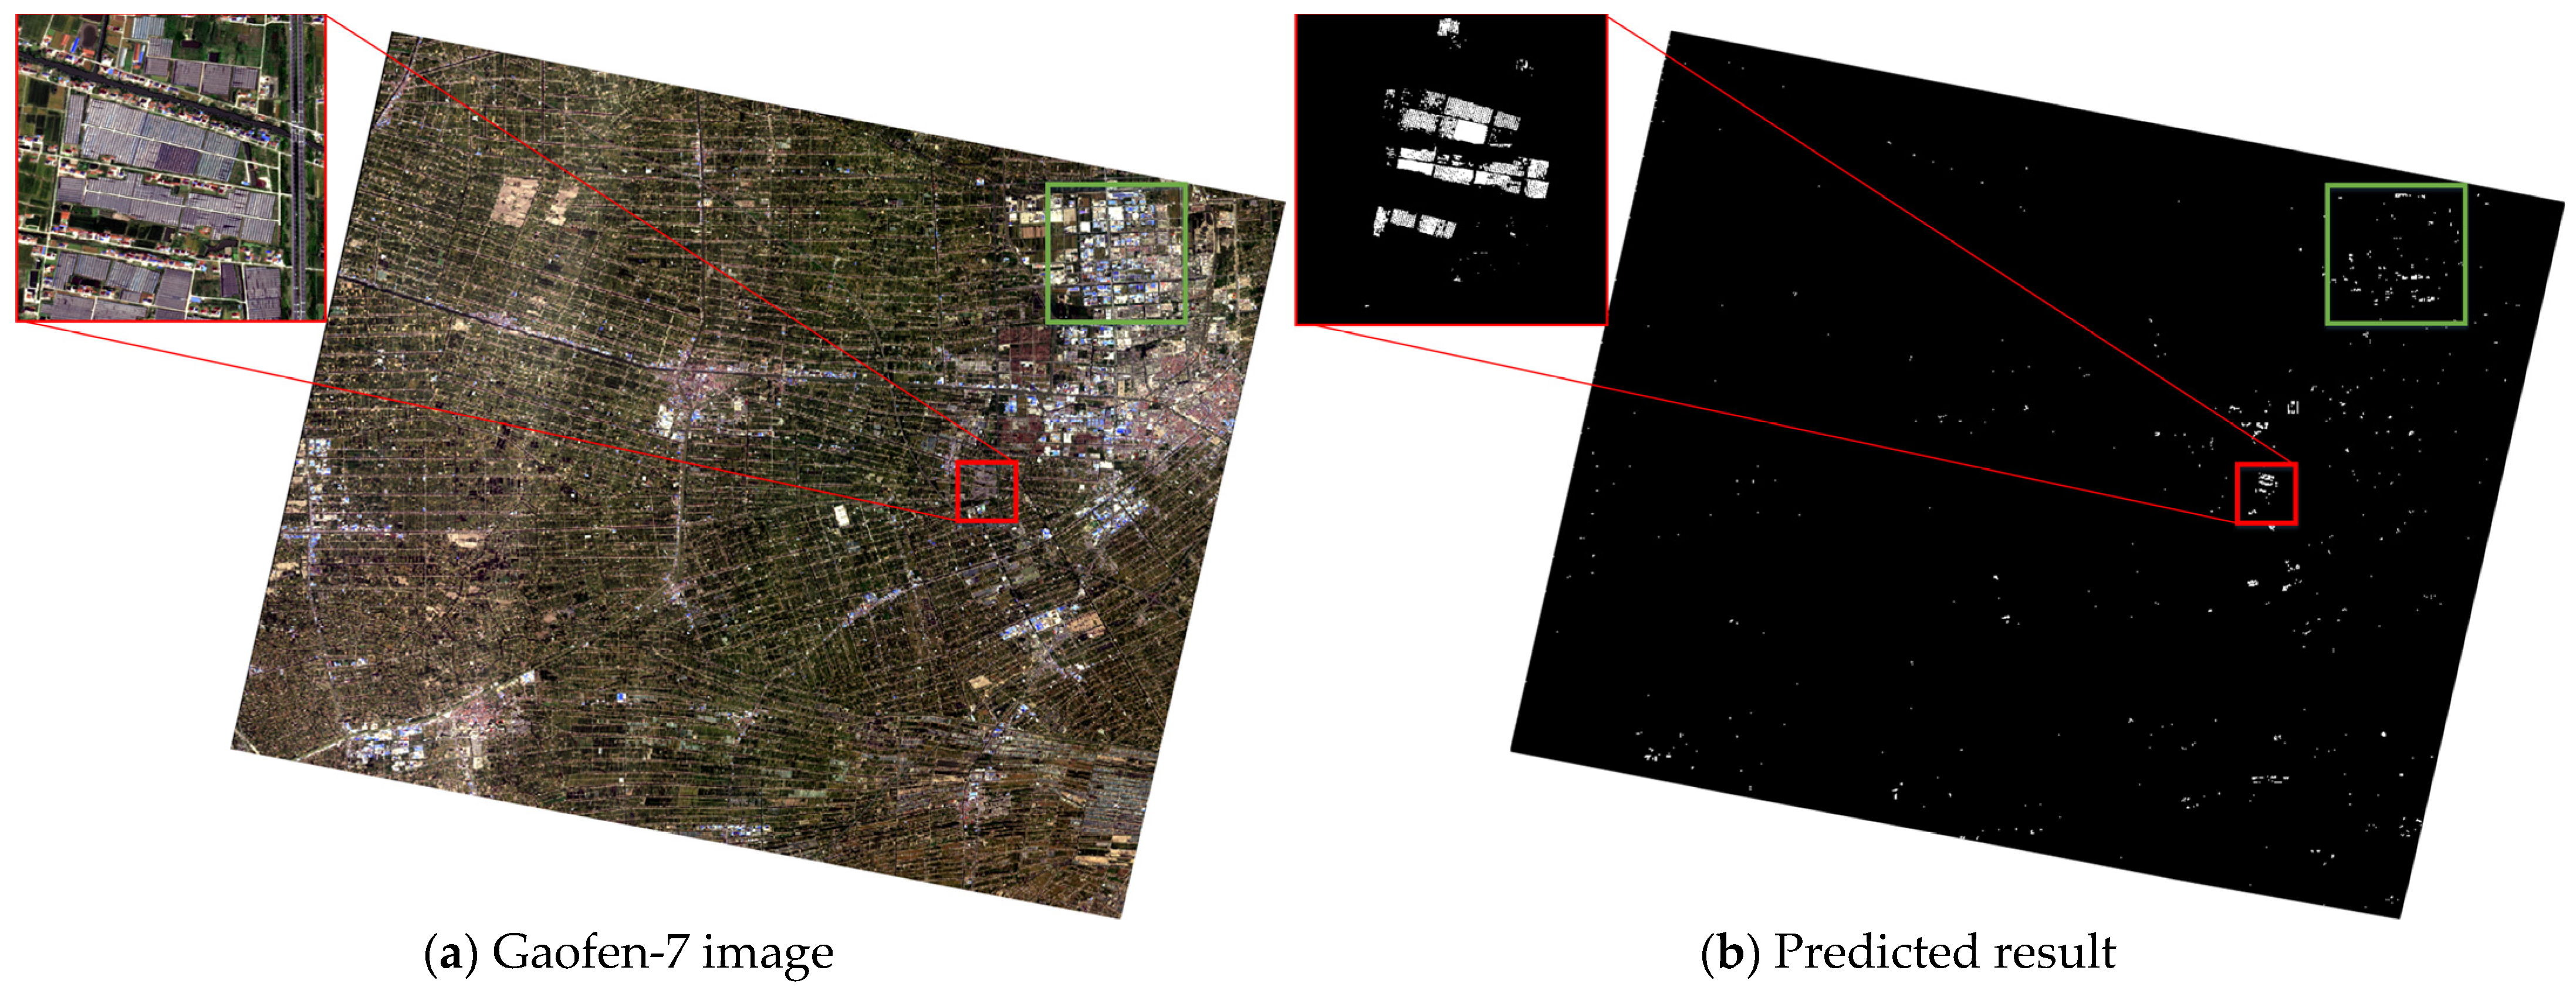
Using the advanced MANet model, this study carried out the extraction of industrial and commercial rooftop PVs in a large area. Figure 9 shows the results of extraction of industrial and commercial rooftop PVs in a large area based on the advanced MANet model. Green boxes indicate better recognized areas, in which small area misclassification exists. Red boxes indicate poorly identified areas, in which large area misclassification exists. The location of the red box is the area of agricultural greenhouses, which were misidentified due to the similarity of the spectral characteristics between agricultural greenhouses and industrial and commercial rooftop PVs.
Based on the advanced MANet, this study also conducted experiment on the optimized public PV dataset. Table 3 shows the test results of different models based on optimized public PV dataset. The bold number represents the maximum value of the indicator in the comparison model. The results show that the advanced MANet model performs best in the test set. The IoU, accuracy, F1-score, precision, and recall of the advanced MANet model are 99.16%, 99.80%, 0.9958, 99.57%, and 99.58%. The IoU is improved by 3.18%, 3.78%, 3.29%, 4.98%, and 0.42% over Deeplabv3+, U2net-lite, U2net-full, Unet, and MANet. Recall is improved by 1.54%, 2.12%, 1.96%, 2.6%, and 0.23%. Figure 10 shows the prediction results of the different models on the part of the data in the test set. The results show that the boundaries of the advanced MANet predictions are more complete and clearer.

3.2. Discussion

To validate the effectiveness of the advanced MANet, ablation experiments were conducted in this study. Table 4 shows the results of the ablation experiments based on the GaoFen-7 satellite PV dataset. The bold number represents the maximum value of the indicator in the comparison model. ND indicates that no downsample operation was performed in the first stage of the encoder. The results of the ablation experiments show that the model performance improved with the addition of ASPP compared to MANet. After removing the downsample operation in the first stage of the encoder based on the model with ASPP branch, the model performance also improved.
To demonstrate the probability of achieving superior results with the advanced MANet, hypothesis testing was conducted. A total of 1140 samples was randomly selected from the Gaofen-7 industrial and commercial rooftop PV dataset. MANet and advanced MANet were used to predict these 1140 samples, and the IoU, F1-score, precision, accuracy, and recall were calculated respectively. Table 5 shows the group statistical results.
The independent sample t-test was conducted based on the group statistical results. Table 6 shows the results of the independent samples t-test. It can be seen that the two-tailed significance of IoU, F1-score, precision, and recall are all less than 0.05, but the two-tailed significance of accuracy is greater than 0.05. Therefore, MANet and Advance MANet are significantly different in IoU, F1-Score, precision, and recall, but the difference in accuracy is not significant. This might occur because the background class is also participating in the calculation of accuracy. A large proportion of images are the background classes, and the model has a high accuracy for identifying background class. Therefore, accuracy is generally relatively high, which results in relatively small differences in accuracy among MANet and advanced MANet.
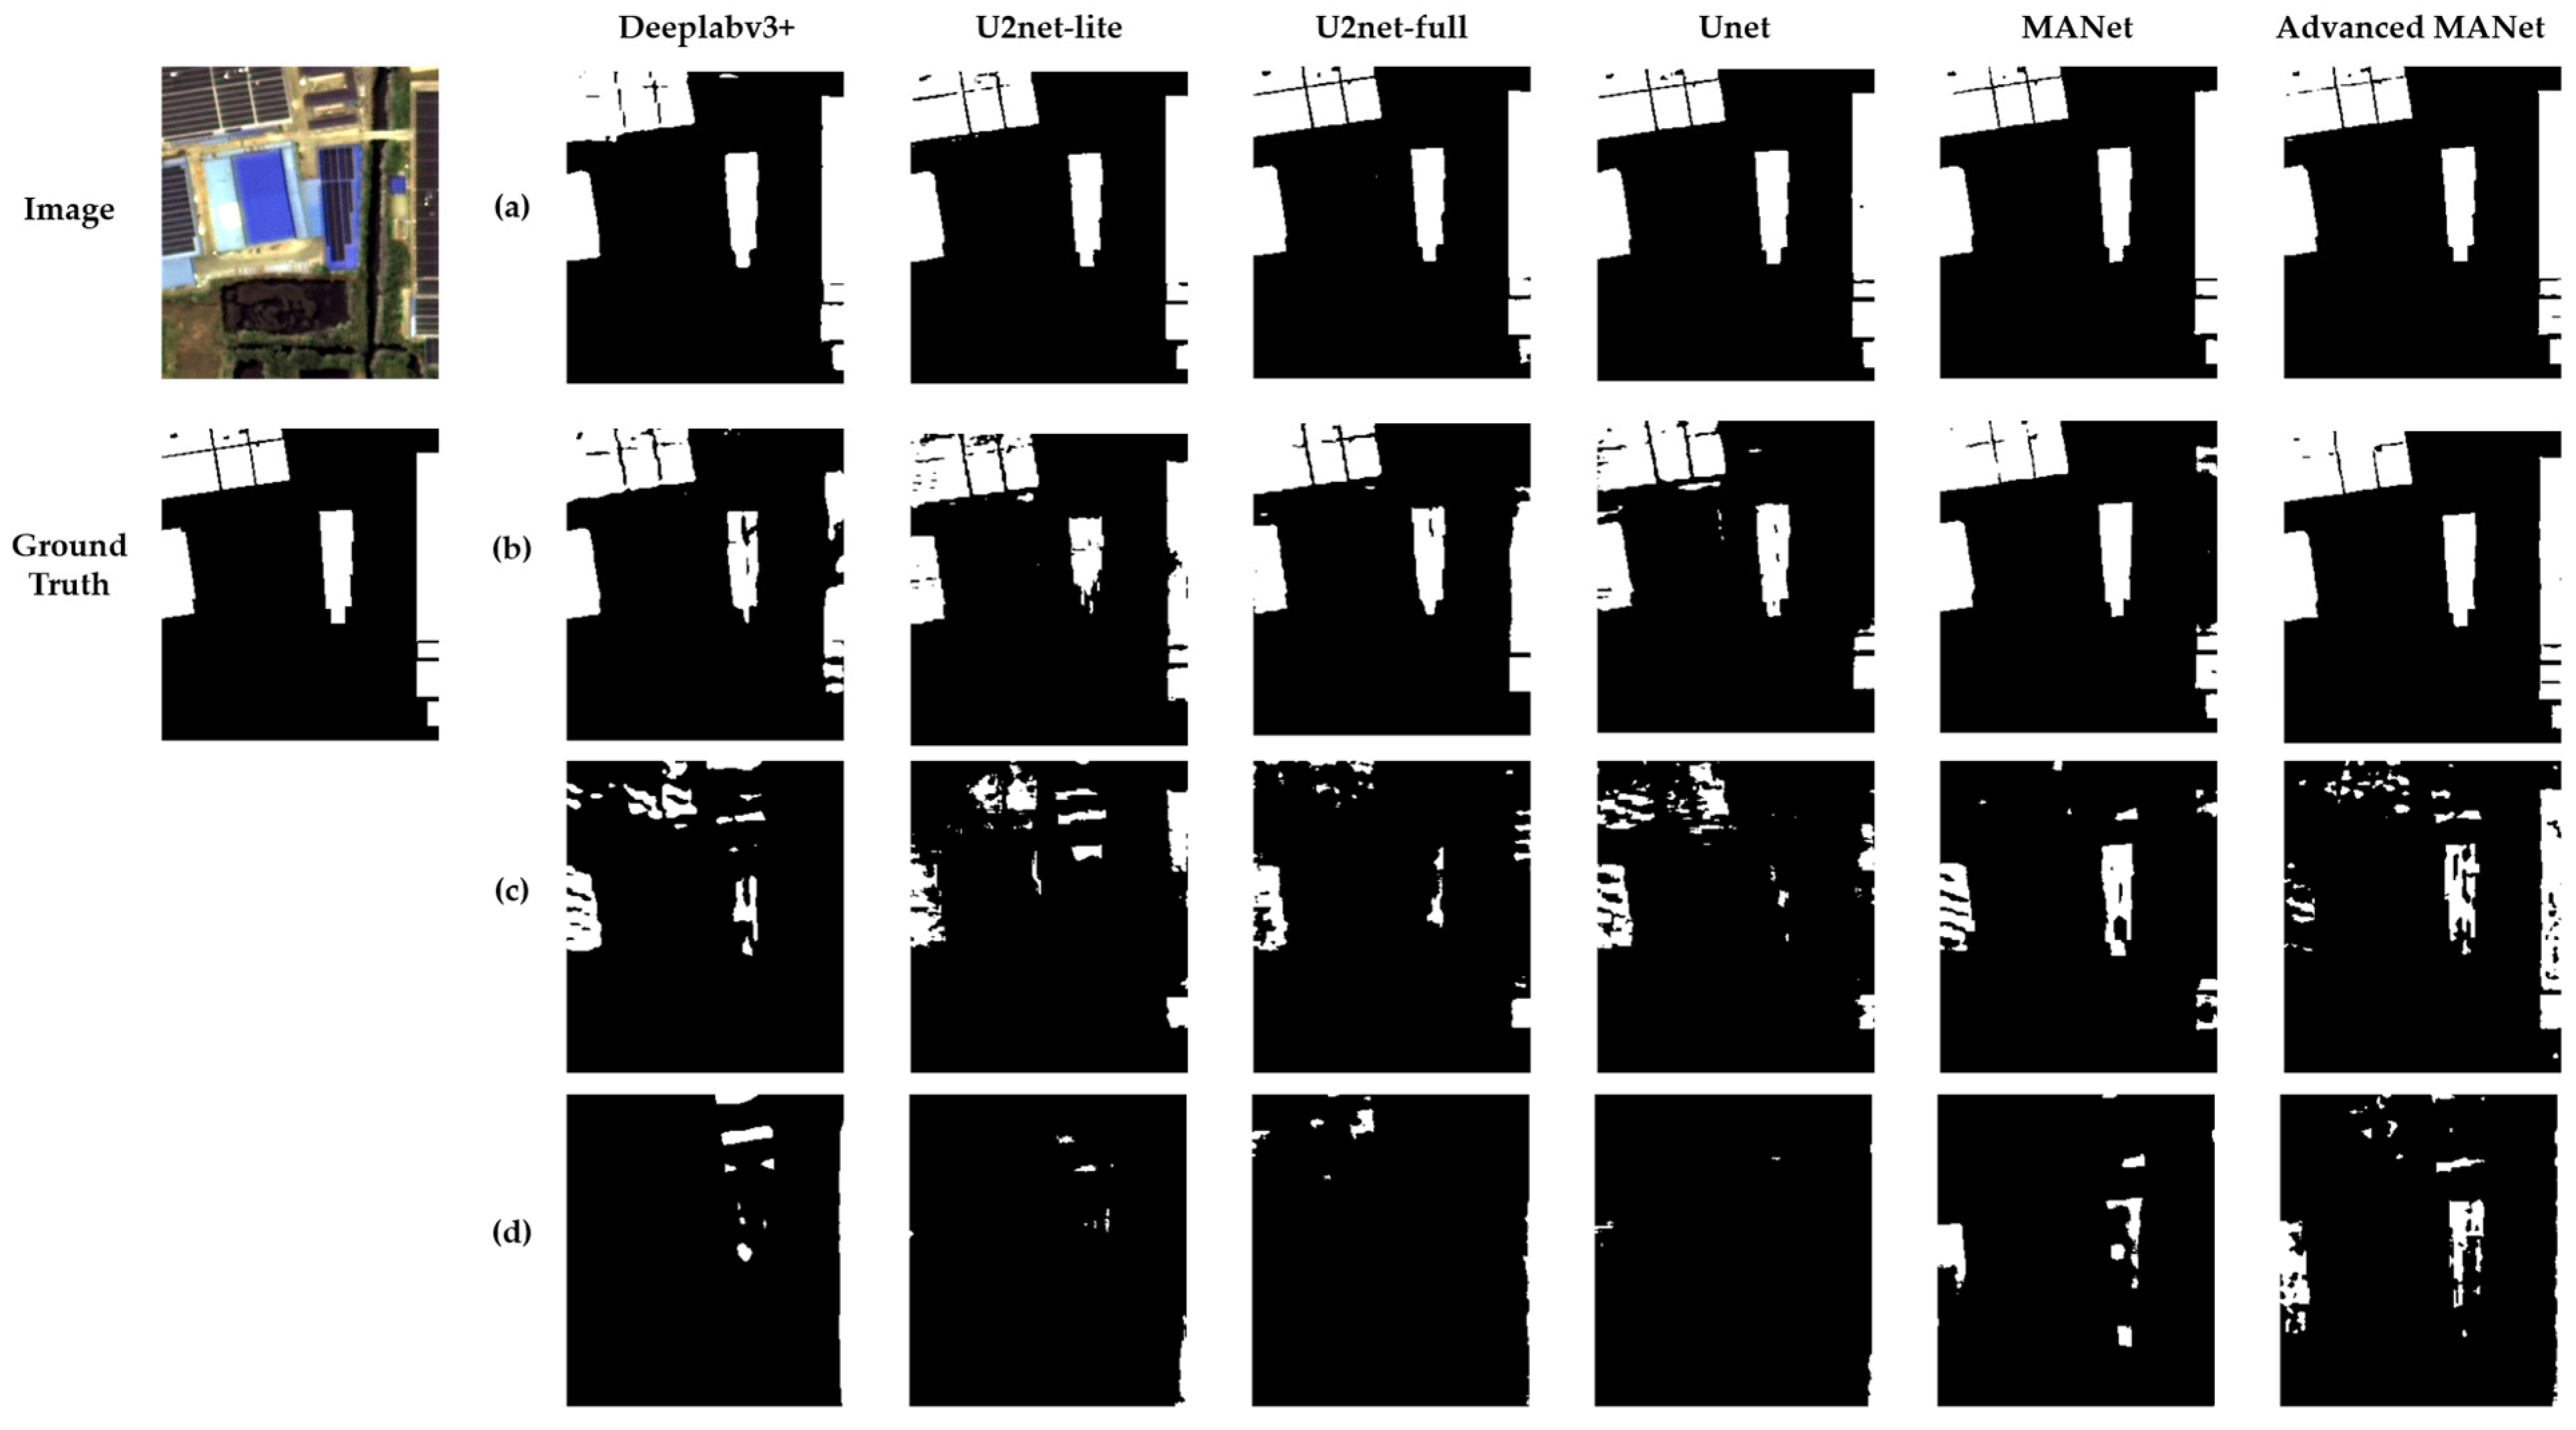
In addition, an experiment was conducted to analyze the applicability of the model at different resolutions. A downsample operation was performed on the 0.65 m resolution Gaofen-7 images of the test set to obtain data from 1.3 m resolution and 2.6 m resolution images. The 2.6 m resolution multi-spectral image data before sharpening fusion was also used in the experiment. The different models obtained from the training based on 0.65 m resolution Gaofen-7 images were predicted for 1.3 m and 2.6 m resolution image data. Figure 11 shows the predicted results at different resolutions with trained models based on 0.65 m resolution Gaofen-7 satellite dataset. The results show that, when the resolution is reduced from 0.65 m to 1.3 m, the difference in the prediction is not very obvious. However, when the resolution is reduced to 2.6 m, the prediction will become very poor, especially for multi-spectral images. Compared to other models, the advanced MANet is still able to identify a relatively large number of PV regions after the resolution is reduced to 2.6 m, proving the superiority of the proposed model.

4. Conclusions

In the context of the rapid development of distributed PVs, the shortcomings of traditional PV monitoring methods have become increasingly apparent. As a result, there is increased interest in remote-sensing-based means of monitoring PVs. Currently, distributed rooftop PV monitoring methods are based on satellite or aerial images with resolution higher than 0.3 m. As an important part of distributed rooftop PVs, industrial and commercial rooftop PVs have a great potential for development. Therefore, this paper studies the industrial and commercial rooftop PV information extraction method based on 0.65 m Gaofen-7 satellite images. This study constructed two distributed industrial and commercial rooftop PV datasets based on Gaofen-7 images and the publicly available PV dataset. The advanced MANet model was proposed by removing the downsample operation in the first stage of the encoder and adding an auxiliary branch containing the ASPP module in the decoder. Based on the constructed datasets, comparative experiments were conducted between the advanced MANet model and state-of-the-art semantic segmentation models, such as Unet, Deeplabv3+, U2net, and MANet. The experimental results show that the advanced MANet model has better performance for industrial and commercial rooftop PV information extraction. The following aspects of the study need to be improved. First, the dataset based on the Gaofen-7 satellite uses only the RGB three-band, which does not fully utilize the data from the Gaofen-7 RGB and near-infrared four-band. In the future, four-band data will be introduced for experiments. Second, due to the similarity of the spectral characteristics of industrial and commercial rooftop PVs and agricultural greenhouses, the model can easily misidentify agricultural greenhouses as industrial and commercial rooftop PVs. This may be caused by the small size of the training dataset. In the future, the commercial and industrial rooftop PV dataset can be expanded to enhance the model’s ability to extract PV features. Third, the use of the advanced MANet has only been studied in some areas of Jiangsu Province to date. In the future, the examination can be extended to the whole province.

Author Contributions

Methodology, H.T. and G.H.; datasets, H.T., G.W. and R.Y. (Ranyu Yin); experiments, H.T., R.Y. (Ruiqing Yang), X.P. and R.Y. (Ranyu Yin); mapping the experimental results, H.T., R.Y. (Ruiqing Yang); results analysis, H.T., G.H. and R.Y. (Ruiqing Yang); data curation, H.T.; writing—original draft preparation, H.T.; writing—review and editing, H.T., G.H. and R.Y. (Ruiqing Yang); project administration, G.H. and G.W. All authors have read and agreed to the published version of the manuscript.

Funding

This research was funded by the program of the National Natural Science Foundation of China, grant number 61860206004, 61731022; the Strategic Priority Research Program of the Chinese Academy of Sciences, grant number XDA19090300; and Chinese Academy of Sciences Network Security and Informatization Special Project, grant number CAS-WX2021PY-0107-01.

Institutional Review Board Statement

Not applicable.

Informed Consent Statement

Not applicable.

Data Availability Statement

The data are available from the corresponding author upon request.

Acknowledgments

The authors thank the anonymous reviewers and the editors for their valuable comments to improve our manuscript.

Conflicts of Interest

The authors declare no conflict of interest.

References

  1. Wei, J.; Zhao, Z.; Guo, Y.; Ai, L.; Qiu, C. China’s Photovoltaic Power Generation Development Status and Prospects in 2021. Water Power 2022, 48, 4–8. [Google Scholar]
  2. Xia, Z.; Li, Y.; Chen, R.; Sengupta, D.; Guo, X.; Xiong, B.; Niu, Y. Mapping the Rapid Development of Photovoltaic Power Stations in Northwestern China Using Remote Sensing. Energy Rep. 2022, 8, 4117–4127. [Google Scholar] [CrossRef]
  3. Parida, B.; Iniyan, S.; Goic, R. A Review of Solar Photovoltaic Technologies. Renew. Sustain. Energy Rev. 2011, 15, 1625–1636. [Google Scholar] [CrossRef]
  4. Jiang, H.; Yao, L.; Lu, N.; Qin, J.; Liu, T.; Liu, Y.; Zhou, C. Geospatial Assessment of Rooftop Solar Photovoltaic Potential Using Multi-Source Remote Sensing Data. Energy AI 2022, 10, 100185. [Google Scholar] [CrossRef]
  5. Mao, H.; Chen, X.; Luo, Y.; Deng, J.; Tian, Z.; Yu, J.; Xiao, Y.; Fan, J. Advances and Prospects on Estimating Solar Photovoltaic Installation Capacity and Potential Based on Satellite and Aerial Images. Renew. Sustain. Energy Rev. 2023, 179, 113276. [Google Scholar] [CrossRef]
  6. Jurakuziev, D.; Jumaboev, S.; Lee, M. A Framework to Estimate Generating Capacities of PV Systems Using Satellite Imagery Segmentation. Eng. Appl. Artif. Intell. 2023, 123, 106186. [Google Scholar] [CrossRef]
  7. Zhang, B.; Wu, Y.; Zhao, B.; Chanussot, J.; Hong, D.; Yao, J.; Gao, L. Progress and Challenges in Intelligent Remote Sensing Satellite Systems. IEEE J. Sel. Top. Appl. Earth Obs. Remote Sens. 2022, 15, 1814–1822. [Google Scholar] [CrossRef]
  8. Chen, Z.; Kang, Y.; Sun, Z.; Wu, F.; Zhang, Q. Extraction of Photovoltaic Plants Using Machine Learning Methods: A Case Study of the Pilot Energy City of Golmud, China. Remote Sens. 2022, 14, 2697. [Google Scholar] [CrossRef]
  9. Wang, S.; Zhang, L.; Zhu, S.; Ji, L.; Cai, Q.; Shen, Y.; Zhang, R. Multi-Invariant Feature Combined Photovoltaic Power Plants Extraction Using Multi-Temporal Landsat 8 OLI Imagery. Bull. Surv. Mapp. 2018, 11, 46. [Google Scholar] [CrossRef]
  10. Khan, S.; Sajjad, M.; Hussain, T.; Ullah, A.; Imran, A.S. A Review on Traditional Machine Learning and Deep Learning Models for WBCs Classification in Blood Smear Images. IEEE Access 2021, 9, 10657–10673. [Google Scholar] [CrossRef]
  11. Çayir, A.; Yenidoğan, I.; Dağ, H. Feature Extraction Based on Deep Learning for Some Traditional Machine Learning Methods. In Proceedings of the 2018 3rd International Conference on Computer Science and Engineering (UBMK), Sarajevo, Bosnia and Herzegovina, 20–23 September 2018; pp. 494–497. [Google Scholar]
  12. Li, Y. Robust Analysis of Photovoltaic Power Plants Information Extraction Based on High-Resolution Images and Research on Thermal Environment Effects. Master’s Thesis, Lanzhou University, Lanzhou, China, 2016. [Google Scholar]
  13. Wang, S.; Zhang, F.; Zhu, P.; Zhan, H.; Zhang, Y.; Xi, G. Photovoltaic roof extraction from material and angle attribute filtered method. Bull. Surv. Mapp. 2021, 3, 96–99+151. [Google Scholar] [CrossRef]
  14. Du, L.; Han, X.; Wang, Z.; Luo, Z.; Liu, A.; You, S.; Gan, Y.; Liu, L. Photovoltaic Power Station Extraction from High-Resolution Satellite Images Based on Deep Learning Method. In Proceedings of the IGARSS 2022—2022 IEEE International Geoscience and Remote Sensing Symposium, Kuala Lumpur, Malaysia, 17–22 July 2022; pp. 3351–3354. [Google Scholar]
  15. Ge, F.; Wang, G.; He, G.; Zhou, D.; Yin, R.; Tong, L. A Hierarchical Information Extraction Method for Large-Scale Centralized Photovoltaic Power Plants Based on Multi-Source Remote Sensing Images. Remote Sens. 2022, 14, 4211. [Google Scholar] [CrossRef]
  16. Wang, J.; Chen, X.; Jiang, W.; Hua, L.; Liu, J.; Sui, H. PVNet: A Novel Semantic Segmentation Model for Extracting High-Quality Photovoltaic Panels in Large-Scale Systems from High-Resolution Remote Sensing Imagery. Int. J. Appl. Earth Obs. Geoinf. 2023, 119, 103309. [Google Scholar] [CrossRef]
  17. Tan, M.; Le, Q.V. EfficientNet: Rethinking Model Scaling for Convolutional Neural Networks. In Proceedings of the 36th International Conference on Machine Learning, Long Beach, CA, USA, 10–15 June 2019. [Google Scholar]
  18. Kirillov, A.; Wu, Y.; He, K.; Girshick, R. PointRend: Image Segmentation as Rendering. In Proceedings of the IEEE/CVF Conference on Computer Vision and Pattern Recognition, Seattle, WA, USA, 13–19 June 2020; pp. 9799–9808. [Google Scholar]
  19. Zhu, R.; Guo, D.; Wong, M.S.; Qian, Z.; Chen, M.; Yang, B.; Chen, B.; Zhang, H.; You, L.; Heo, J.; et al. Deep Solar PV Refiner: A Detail-Oriented Deep Learning Network for Refined Segmentation of Photovoltaic Areas from Satellite Imagery. Int. J. Appl. Earth Obs. Geoinf. 2023, 116, 103134. [Google Scholar] [CrossRef]
  20. Badrinarayanan, V.; Kendall, A.; Cipolla, R. SegNet: A Deep Convolutional Encoder-Decoder Architecture for Image Segmentation. IEEE Trans. Pattern Anal. Mach. Intell. 2017, 39, 2481–2495. [Google Scholar] [CrossRef]
  21. Camilo, J.; Wang, R.; Collins, L.M.; Bradbury, K.; Malof, J.M. Application of a Semantic Segmentation Convolutional Neural Network for Accurate Automatic Detection and Mapping of Solar Photovoltaic Arrays in Aerial Imagery. arXiv 2018, arXiv:1801.04018. [Google Scholar]
  22. Howard, A.G.; Zhu, M.; Chen, B.; Kalenichenko, D.; Wang, W.; Weyand, T.; Andreetto, M.; Adam, H. MobileNets: Efficient Convolutional Neural Networks for Mobile Vision Applications. arXiv 2017, arXiv:1704.04861. [Google Scholar]
  23. Wani, M.A.; Mujtaba, T. Segmentation of Satellite Images of Solar Panels Using Fast Deep Learning Model. Int. J. Renew. Energy Res. 2021, 11, 31–45. [Google Scholar]
  24. Guo, H.; Shi, Q.; Marinoni, A.; Du, B.; Zhang, L. Deep Building Footprint Update Network: A Semi-Supervised Method for Updating Existing Building Footprint from Bi-Temporal Remote Sensing Images. Remote Sens. Environ. 2021, 264, 112589. [Google Scholar] [CrossRef]
  25. Liu, T.; Yao, L.; Qin, J.; Lu, N.; Jiang, H.; Zhang, F.; Zhou, C. Multi-Scale Attention Integrated Hierarchical Networks for High-Resolution Building Footprint Extraction. Int. J. Appl. Earth Obs. Geoinf. 2022, 109, 102768. [Google Scholar] [CrossRef]
  26. Li, P.; Zhang, H.; Guo, Z.; Lyu, S.; Chen, J.; Li, W.; Song, X.; Shibasaki, R.; Yan, J. Understanding Rooftop PV Panel Semantic Segmentation of Satellite and Aerial Images for Better Using Machine Learning. Adv. Appl. Energy 2021, 4, 100057. [Google Scholar] [CrossRef]
  27. Zhao, X.; Xie, Y. The Economic Performance of Industrial and Commercial Rooftop Photovoltaic in China. Energy 2019, 187, 115961. [Google Scholar] [CrossRef]
  28. Beuse, M.; Dirksmeier, M.; Steffen, B.; Schmidt, T.S. Profitability of Commercial and Industrial Photovoltaics and Battery Projects in South-East-Asia. Appl. Energy 2020, 271, 115218. [Google Scholar] [CrossRef]
  29. Chandel, S.S.; Gupta, A.; Chandel, R.; Tajjour, S. Review of Deep Learning Techniques for Power Generation Prediction of Industrial Solar Photovoltaic Plants. Sol. Compass 2023, 8, 100061. [Google Scholar] [CrossRef]
  30. Li, L.; Lu, N.; Jiang, H.; Qin, J. Impact of Deep Convolutional Neural Network Structure on Photovoltaic Array Extraction from High Spatial Resolution Remote Sensing Images. Remote Sens. 2023, 15, 4554. [Google Scholar] [CrossRef]
  31. Li, X.; Jin, G.; Yang, J.; Li, Y.; Wei, P.; Zhang, L. Epidemiological Characteristics of Leprosy during the Period 2005–2020: A Retrospective Study Based on the Chinese Surveillance System. Front. Public Health 2023, 10, 991828. [Google Scholar] [CrossRef] [PubMed]
  32. China Weather Network Jiangsu Station. Climate Profile of Jiangsu Province. Available online: http://www.weather.com.cn/jiangsu/jsqh/jsqhgk/08/910774.shtml (accessed on 8 November 2023).
  33. Cao, W. Study on the Development Path to Achieve a High Percentage of Photovoltaic Power Generation in Jiangsu Province. Pet. New Energy 2022, 34, 1–7. [Google Scholar]
  34. Liu, L.; Zhu, W.; Yang, X. Research on Operation Mode of New Distribution System with Integrating Large Scales of Distributed Photovoltaic. In Proceedings of the 2022 IEEE International Conference on Power Systems and Electrical Technology (PSET), Aalborg, Denmark, 13–15 October 2022; pp. 347–352. [Google Scholar]
  35. Jiangsu’s Distributed Photovoltaic Installed Capacity Ranks among the Top in the Country. Available online: http://paper.people.com.cn/zgnyb/html/2022-04/25/content_25915183.htm (accessed on 12 October 2023).
  36. International Energy Network. Jiangsu Photovoltaic Industry Analysis. Available online: https://www.in-en.com/article/html/energy-2325200.shtml (accessed on 3 November 2023).
  37. Chen, L.; Letu, H.; Fan, M.; Shang, H.; Tao, J.; Wu, L.; Zhang, Y.; Yu, C.; Gu, J.; Zhang, N.; et al. An Introduction to the Chinese High-Resolution Earth Observation System: Gaofen-1~7 Civilian Satellites. J. Remote Sens. 2022, 2022, 9769536. [Google Scholar] [CrossRef]
  38. Zhu, X.; Ren, Z.; Nie, S.; Bao, G.; Ha, G.; Bai, M.; Liang, P. DEM Generation from GF-7 Satellite Stereo Imagery Assisted by Space-Borne LiDAR and Its Application to Active Tectonics. Remote Sens. 2023, 15, 1480. [Google Scholar] [CrossRef]
  39. Tian, J.; Zhuo, X.; Yuan, X.; Henry, C.; d’Angelo, P.; Krauss, T. Application oriented quality evaluation of Gaofen-7 optical stereo satellite imagery. ISPRS Ann. Photogramm. Remote Sens. Spat. Inf. Sci. 2022, 1, 145–152. [Google Scholar] [CrossRef]
  40. Jiang, H.; Yao, L.; Lu, N.; Qin, J.; Liu, T.; Liu, Y.; Zhou, C. Multi-Resolution Dataset for Photovoltaic Panel Segmentation from Satellite and Aerial Imagery. Earth Syst. Sci. Data 2021, 13, 5389–5401. [Google Scholar] [CrossRef]
  41. Hu, J.; Shen, L.; Sun, G. Squeeze-and-Excitation Networks. In Proceedings of the IEEE Conference on Computer Vision and Pattern Recognition, Salt Lake City, UT, USA, 18–23 June 2018; pp. 7132–7141. [Google Scholar]
  42. Woo, S.; Park, J.; Lee, J.-Y.; Kweon, I.S. CBAM: Convolutional Block Attention Module. In Proceedings of the European Conference on Computer Vision (ECCV), Munich, Germany, 8–14 September 2018; pp. 3–19. [Google Scholar]
  43. Chen, L.-C.; Papandreou, G.; Kokkinos, I.; Murphy, K.; Yuille, A.L. DeepLab: Semantic Image Segmentation with Deep Convolutional Nets, Atrous Convolution, and Fully Connected CRFs. IEEE Trans. Pattern Anal. Mach. Intell. 2018, 40, 834–848. [Google Scholar] [CrossRef] [PubMed]
  44. He, K.; Zhang, X.; Ren, S.; Sun, J. Deep Residual Learning for Image Recognition. In Proceedings of the IEEE Conference on Computer Vision and Pattern Recognition, Las Vegas, NV, USA, 27–30 June 2015. [Google Scholar]
  45. Chen, L.-C.; Papandreou, G.; Schroff, F.; Adam, H. Rethinking Atrous Convolution for Semantic Image Segmentation. arXiv 2017, arXiv:1706.05587. [Google Scholar]
  46. Qin, X.; Zhang, Z.; Huang, C.; Dehghan, M.; Zaiane, O.R.; Jagersand, M. U2-Net: Going Deeper with Nested U-Structure for Salient Object Detection. Pattern Recognit. 2020, 106, 107404. [Google Scholar] [CrossRef]
  47. Ronneberger, O.; Fischer, P.; Brox, T. U-Net: Convolutional Networks for Biomedical Image Segmentation. In Proceedings of the 18th International Conference, Munich, Germany, 5–9 October 2015. [Google Scholar]
  48. Li, R.; Zheng, S.; Zhang, C.; Duan, C.; Su, J.; Wang, L.; Atkinson, P.M. Multiattention Network for Semantic Segmentation of Fine-Resolution Remote Sensing Images. IEEE Trans. Geosci. Remote Sens. 2022, 60, 5607713. [Google Scholar] [CrossRef]
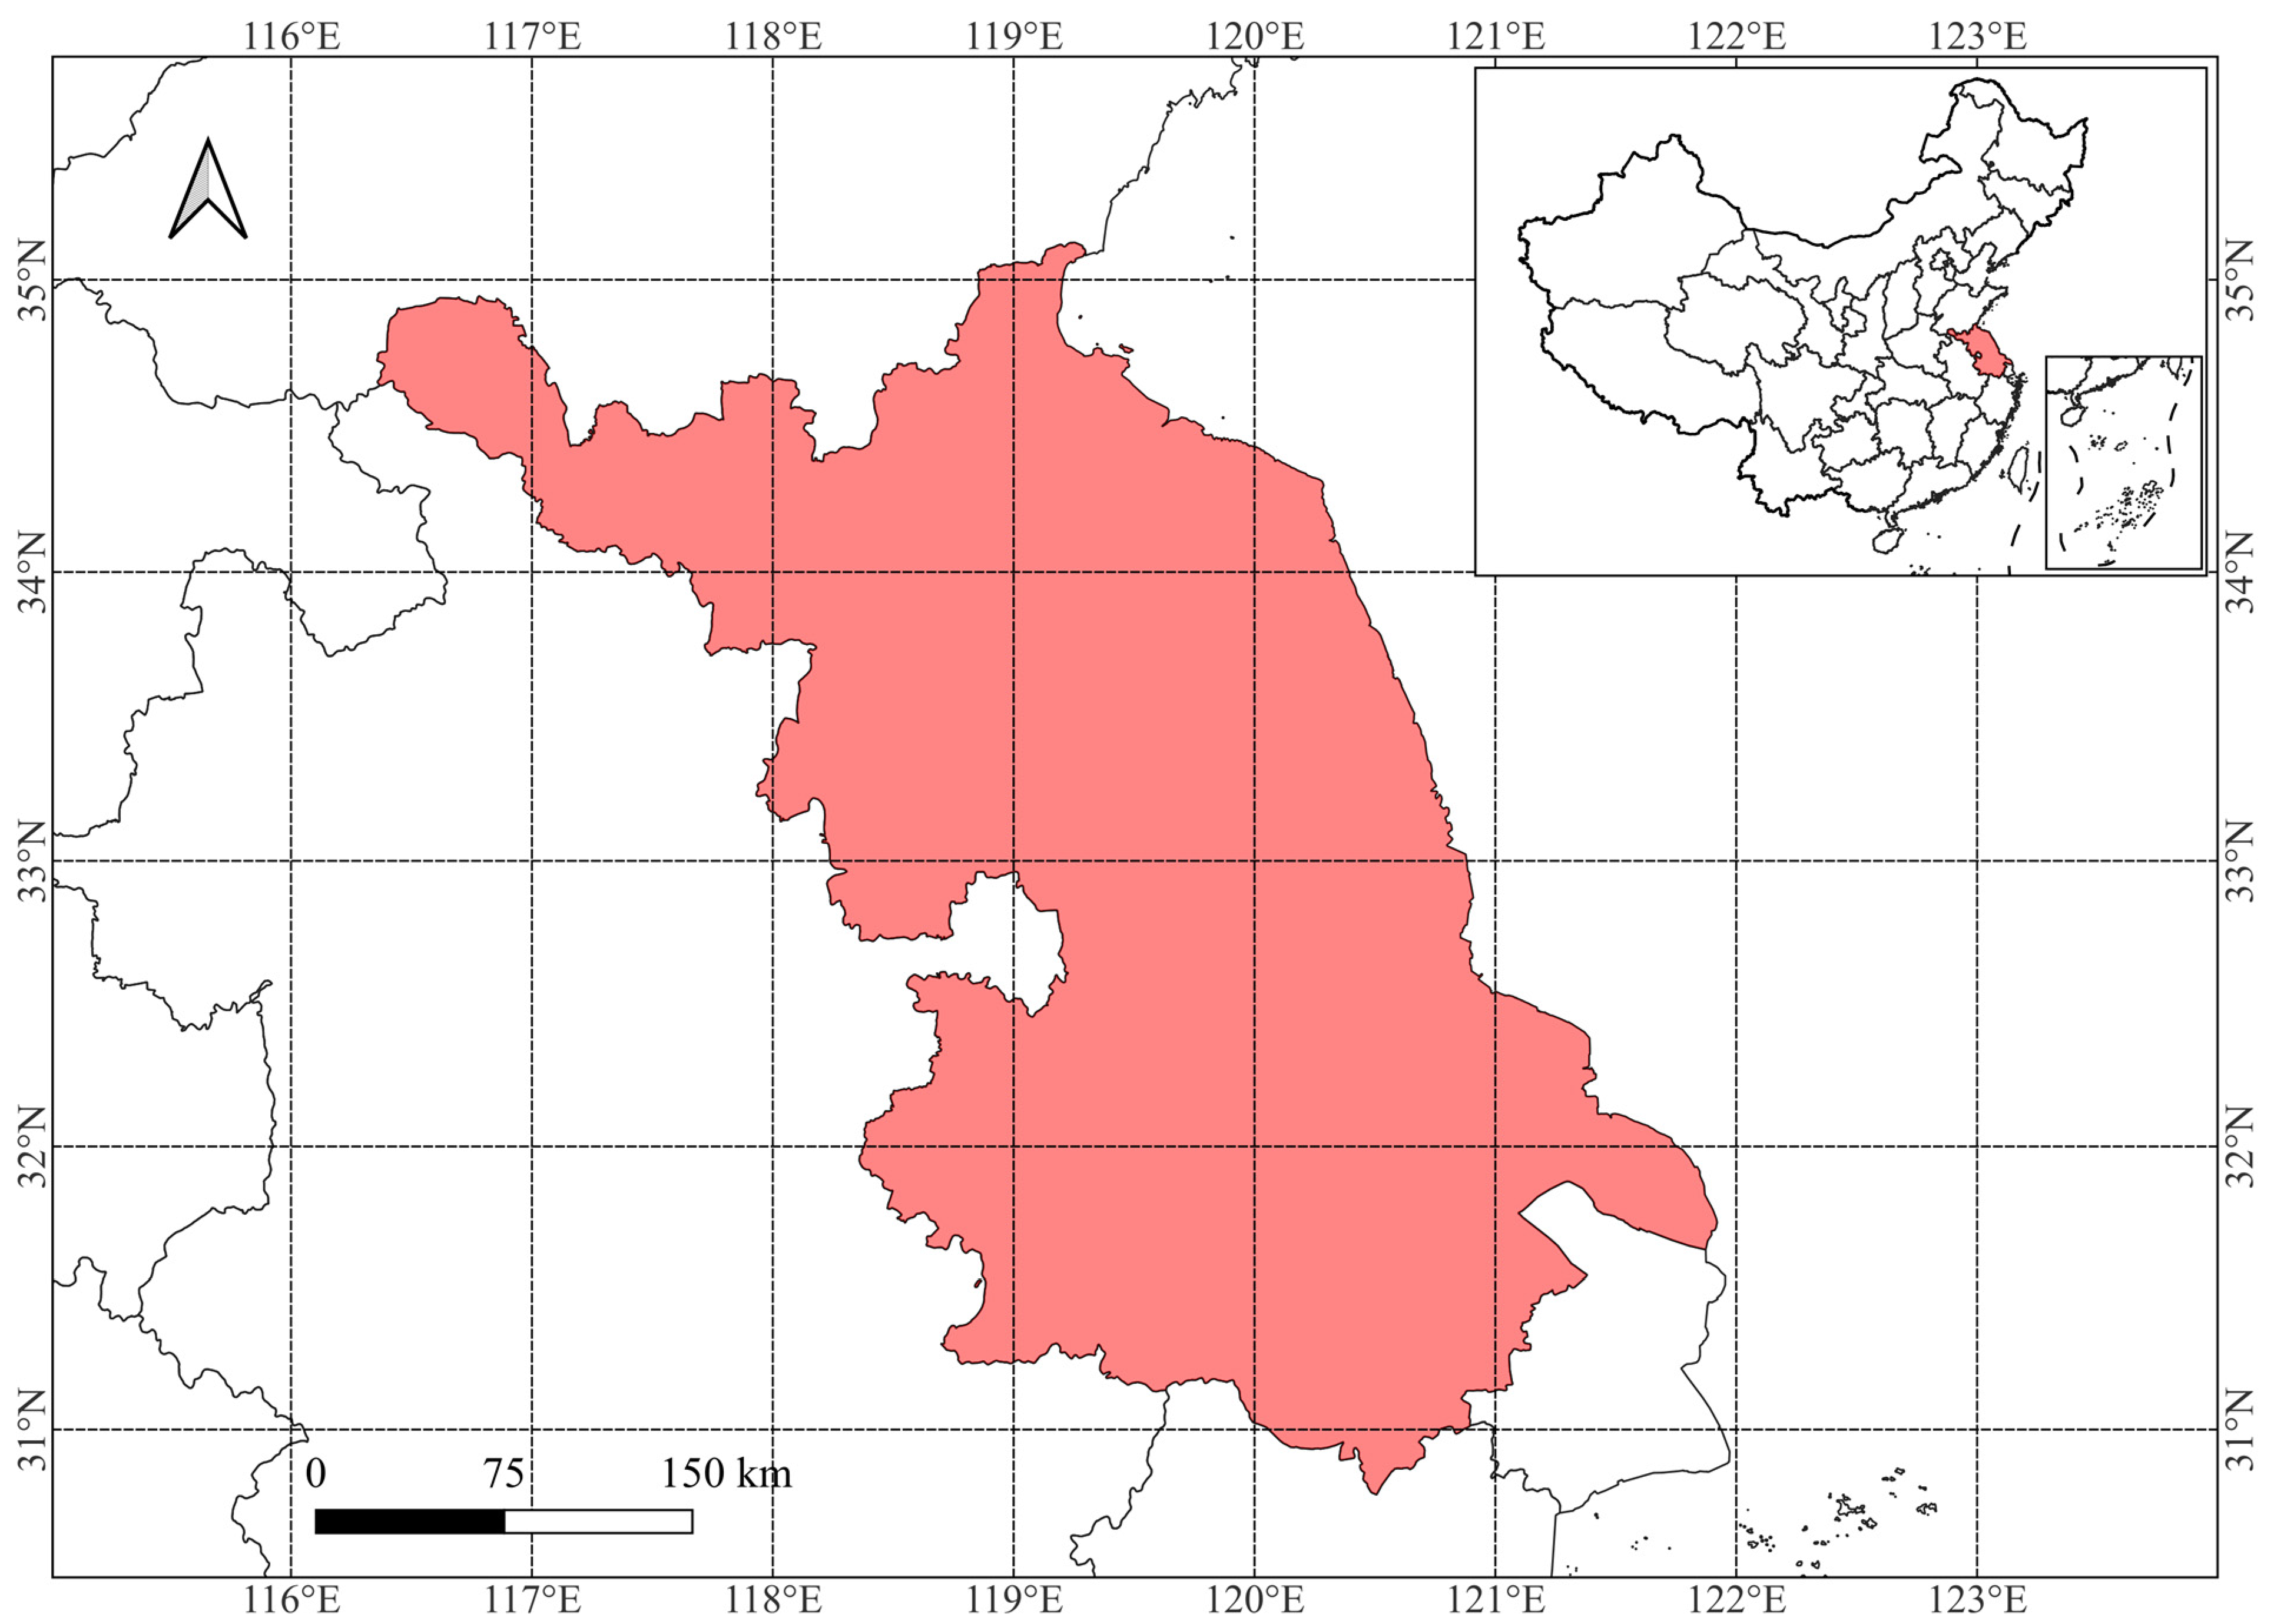
Figure 1. Geospatial location of Jiangsu Province.
Remotesensing 15 05744 g001
Figure 2. Distributed PVs grid-connected data in Jiangsu Province [36]. (a) The cumulative grid-connected capacity data from 2013 to the first quarter of 2023. (b) The new grid-connected capacity data from 2019 to the first quarter of 2023.
Remotesensing 15 05744 g002
Figure 3. Industrial and commercial rooftop PV dataset display.
Remotesensing 15 05744 g003
Figure 4. The optimization process for the public PV dataset.
Remotesensing 15 05744 g004
Figure 5. Industrial and commercial rooftop PV information extraction framework. The dashed line frame indicates the main modules, and the solid line frame indicates the submodules. The red arrow indicates the flow order between the main modules, the black arrow indicates the flow order between the submodules, and the blue arrow indicates the improvement of the semantic segmentation model. The green fields represents the semantic segmentation models, and the blue fields represents the evaluation indicators.
Remotesensing 15 05744 g005
Figure 6. The difference between the structure of MANet and advanced MANet. (a) MANet. (b) Advanced MANet.
Remotesensing 15 05744 g006
Figure 7. Prediction results from the test set based on the GaoFen-7 satellite PV dataset. (ae) represents five different Gaofen-7 images containing industrial and commercial rooftop PVs.
Remotesensing 15 05744 g007
Figure 8. Detailed information extraction results from the test set based on GaoFen-7 satellite PV dataset. (ae) represents five different Gaofen-7 images containing industrial and commercial rooftop PVs. Red boxes represent the predictions of different models in local areas.
Remotesensing 15 05744 g008
Figure 9. Industrial and commercial rooftop PVs predicted results in a large area. (a) Gaofen-7 image in a large area. (b) Predicted results based on the advanced MANet model. Green boxes indicate the area with better recognition, and red boxes indicate the areas with poor recognition.
Remotesensing 15 05744 g009
Figure 10. Detailed information extraction results on the test set based on the optimized public PV dataset. (ae) represents five different images containing industrial and commercial rooftop PVs in optimized public PV dataset. Red boxes represent the predictions of different models in local areas.
Remotesensing 15 05744 g010
Figure 11. Predicted results at different resolutions with trained models based on 0.65 m resolution Gaofen-7 satellite dataset. (a) Results on the 0.65 m resolution image. (b) Results on the 1.3 m resolution downsample image. (c) Results on the 2.6 m resolution downsample image. (d) Results on the 2.6 m resolution multi-spectral image.
Remotesensing 15 05744 g011
Table 1. Confusion Matrix.
Ground Truth
Positive ClassNegative Class
Predicted ResultPositive ClassTrue Positive (TP)False Positive (FP)
Negative ClassFalse Negative (FN)True Negative (TN)
Table 2. Test set evaluation results based on the GaoFen-7 satellite PV dataset.
ModelsIoUAccuracyF1-ScorePrecisionRecall
Deeplabv3+ [45]78.1798.740.855886.0787.27
U2net-lite [46]82.7199.080.887189.5189.62
U2net-full [46]89.0099.370.933093.5593.82
Unet [47]91.0499.510.944095.4194.41
MANet [48]90.9299.520.943595.0694.57
Advanced MANet91.6799.530.950495.4195.13
Table 3. Test set evaluation results based on optimized public PV dataset.
ModelsIoUAccuracyF1-ScorePrecisionRecall
Deeplabv3+95.9898.930.978697.7498.07
U2net-lite95.3898.800.975197.6797.46
U2net-full95.8798.960.978098.0597.62
Unet94.1898.350.968996.9696.98
MANet98.7499.670.993699.3799.35
Advanced MANet99.1699.800.995899.5799.58
Table 4. Ablation experiments results based on the GaoFen-7 satellite PV dataset.
ModelsIoUAccuracyF1-ScorePrecisionRecall
MANet91.3699.630.958195.5295.03
MANet + ASPP92.1299.640.955095.8795.60
MANet + ASPP + ND93.5499.710.963096.8196.31
Table 5. Group statistical results.
PerformanceModelNumbersMeanStd. DeviationStd. Error Means
IoUAdvanced Manet114088.580.22200.0066
Manet114085.820.24330.0072
F1-scoreAdvanced Manet11400.91470.21300.0063
Manet11400.89330.23490.0070
PrecisionAdvanced Manet114092.270.20820.0062
Manet114090.310.23010.0068
AccuracyAdvanced Manet114099.390.02460.0007
Manet114099.310.02460.0007
RecallAdvanced Manet114091.700.21000.0062
Manet114089.580.23590.0070
Table 6. Independent samples t-test results.
PerformanceHypothesisTDfSig. (2-Tailed)
IoUEqual variances assumed2.8322780.005
Equal variances not assumed2.8322590.005
F1-scoreEqual variances assumed2.2722780.023
Equal variances not assumed2.2722570.023
PrecisionEqual variances assumed2.1322780.033
Equal variances not assumed2.1322560.033
AccuracyEqual variances assumed0.7822780.436
Equal variances not assumed0.7822780.436
RecallEqual variances assumed2.2622780.024
Equal variances not assumed2.2622480.024
Disclaimer/Publisher’s Note: The statements, opinions and data contained in all publications are solely those of the individual author(s) and contributor(s) and not of MDPI and/or the editor(s). MDPI and/or the editor(s) disclaim responsibility for any injury to people or property resulting from any ideas, methods, instructions or products referred to in the content.