
An Information Extraction Method for Industrial and Commercial Rooftop Photovoltaics Based on GaoFen-7 Remote Sensing Images

 ,
, 
 , and
, and
Abstract
:1. Introduction
2. Materials and Methods
2.1. Materials
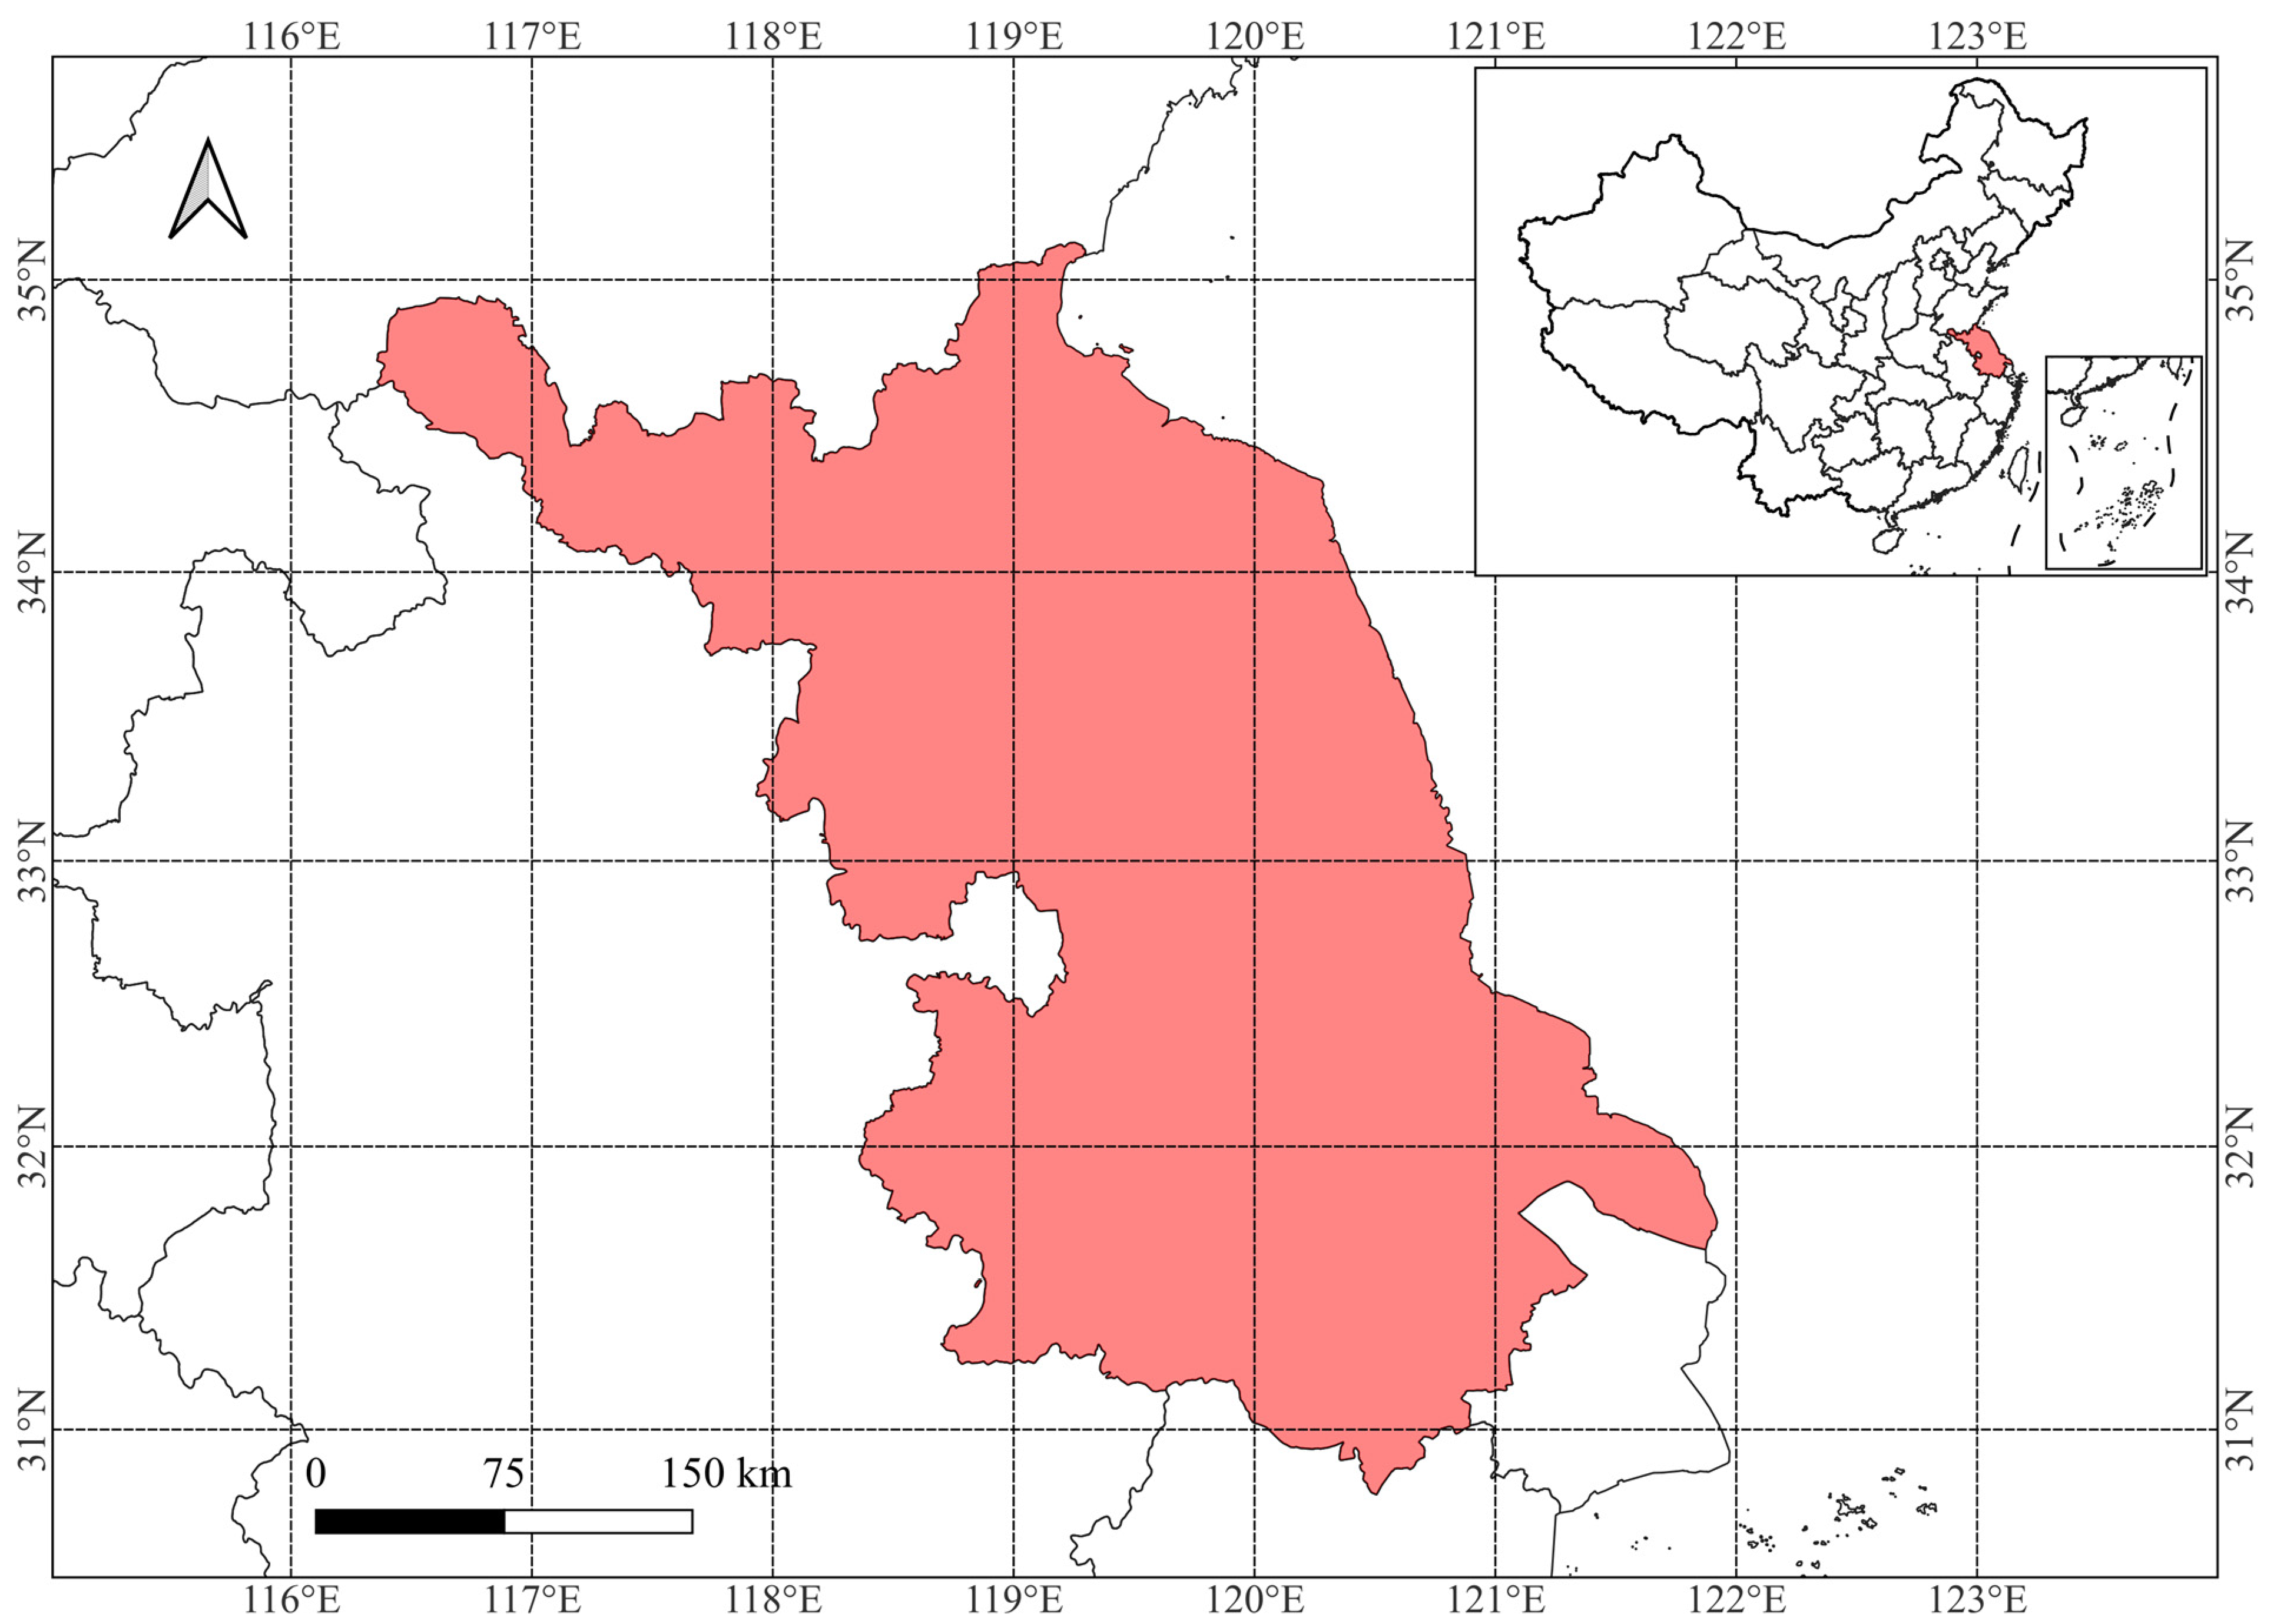
2.1.1. Study Area
2.1.2. Data Sources
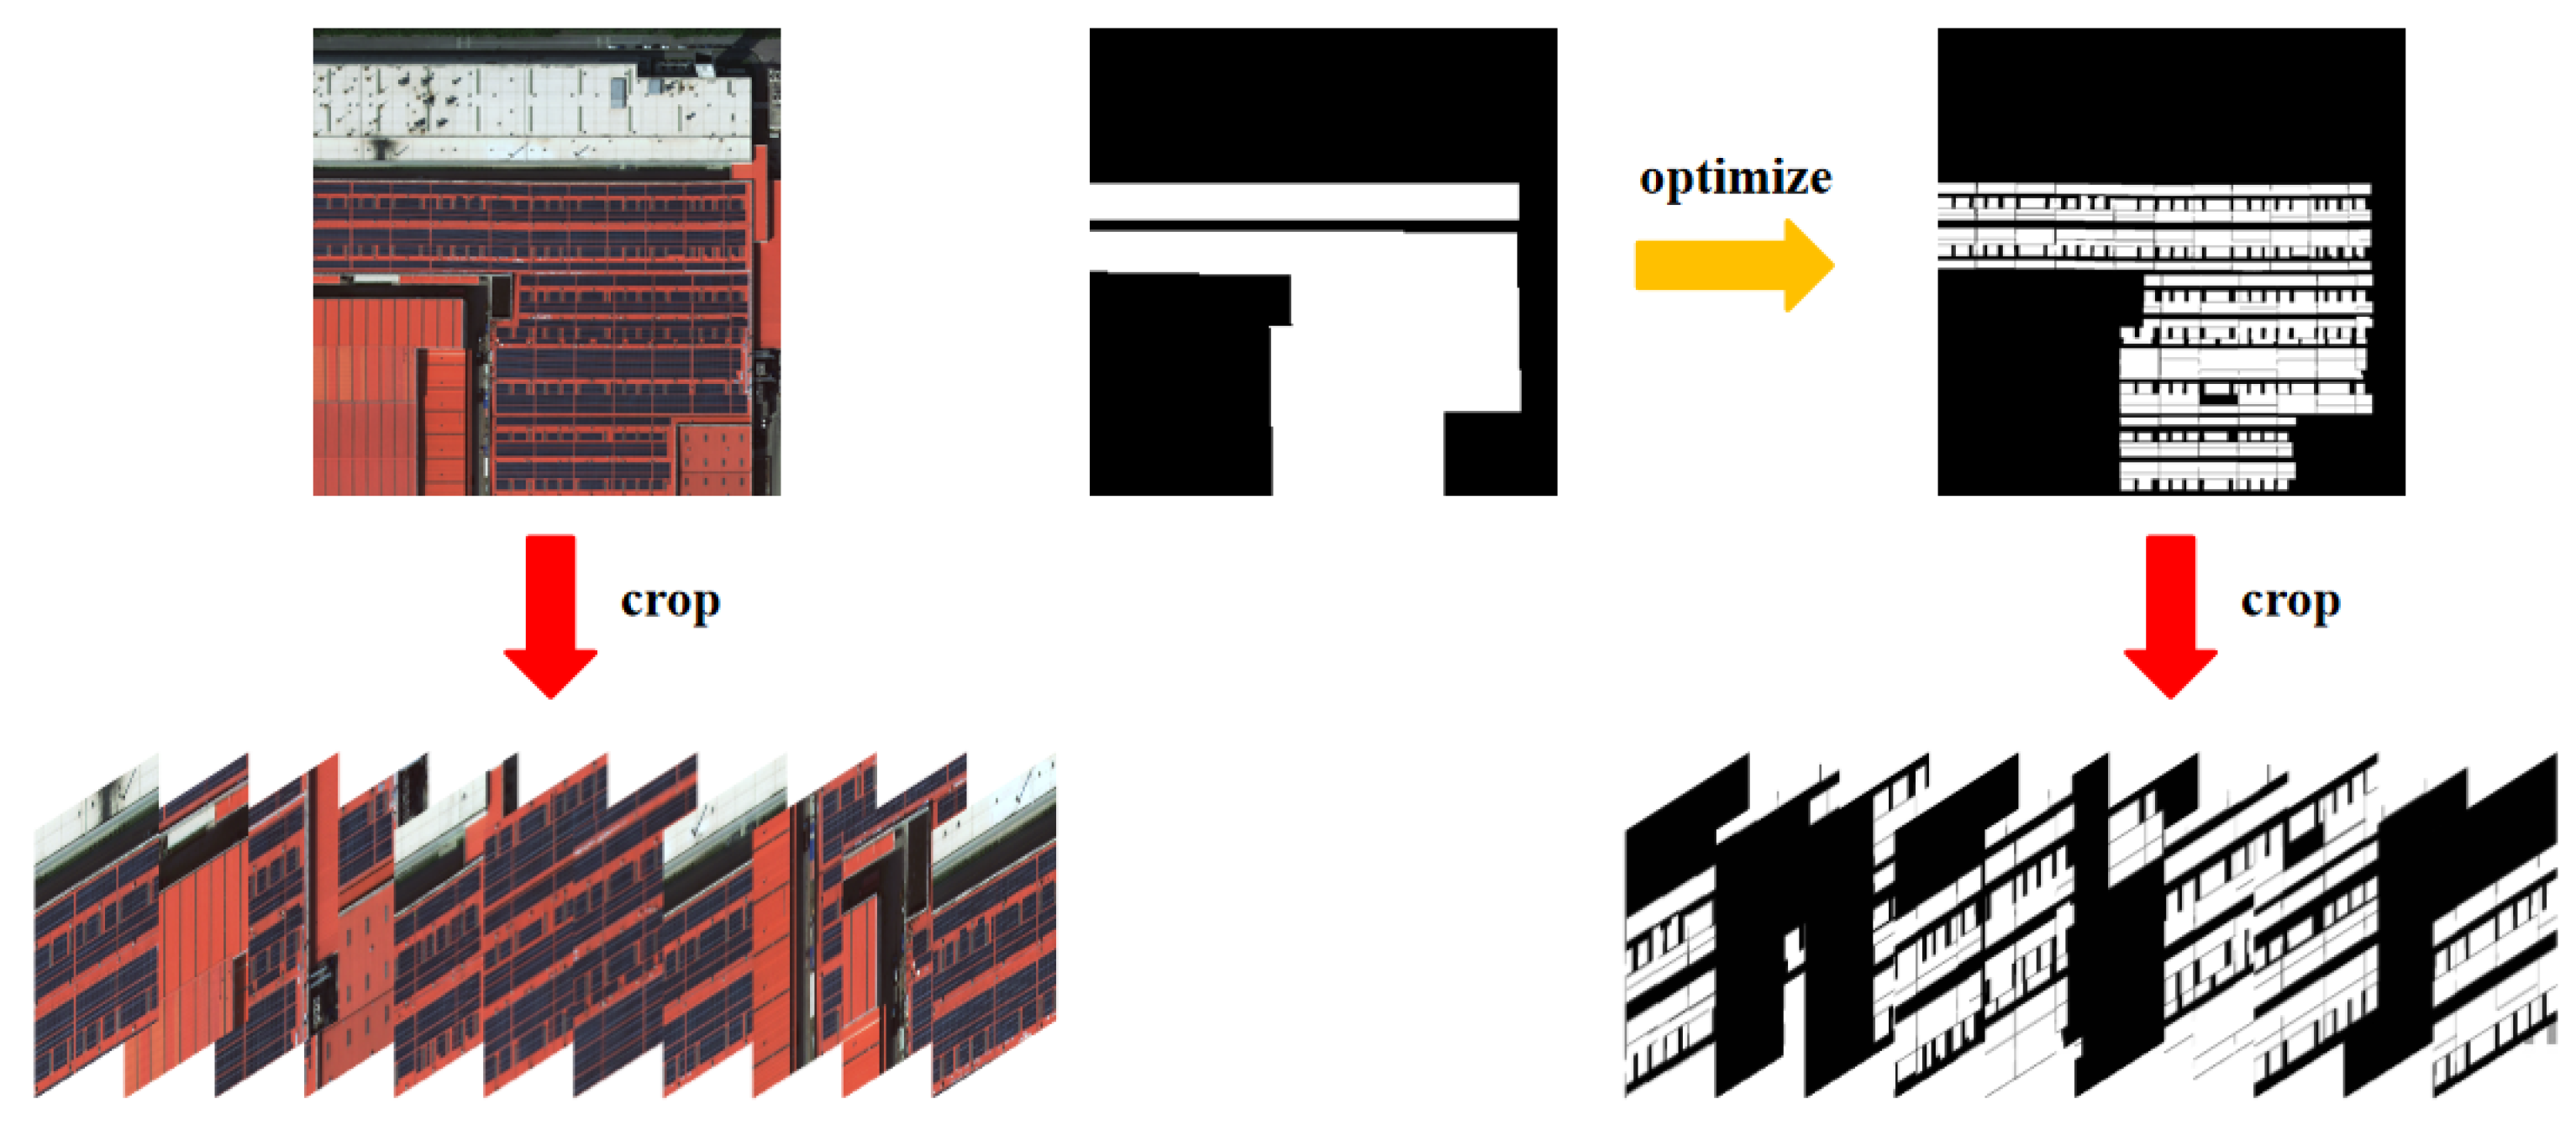
2.1.3. Datasets
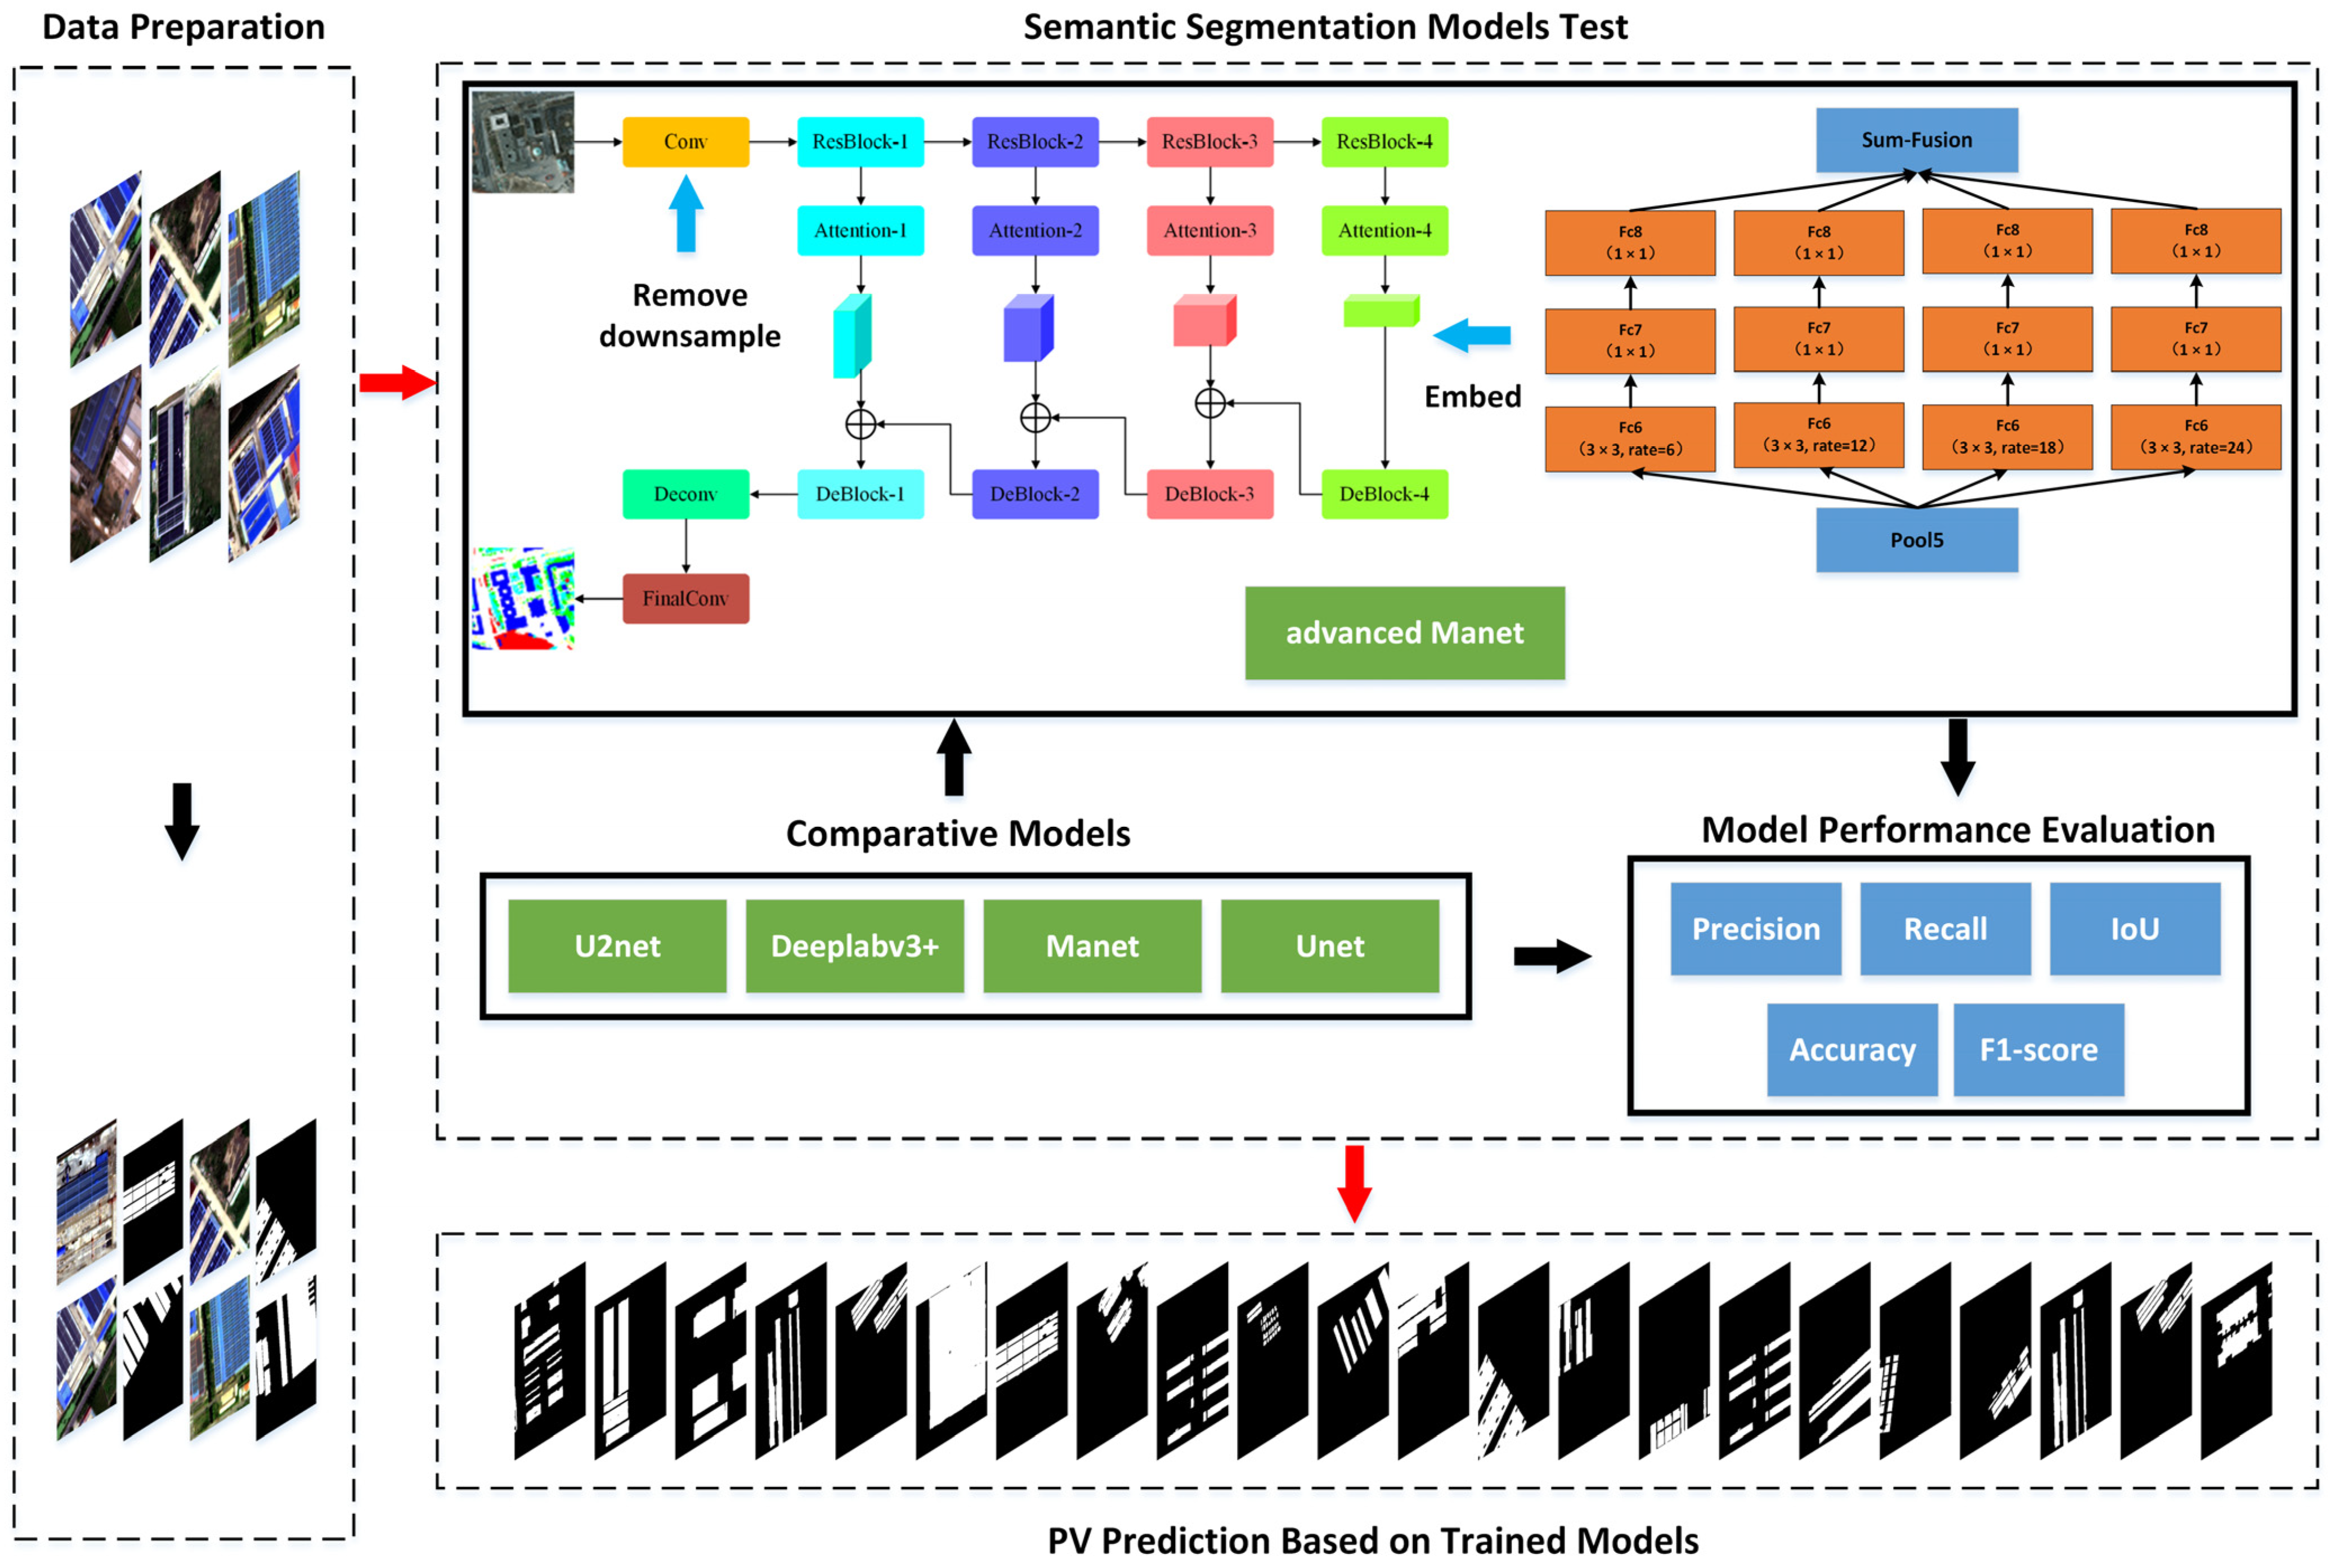
2.2. Methods
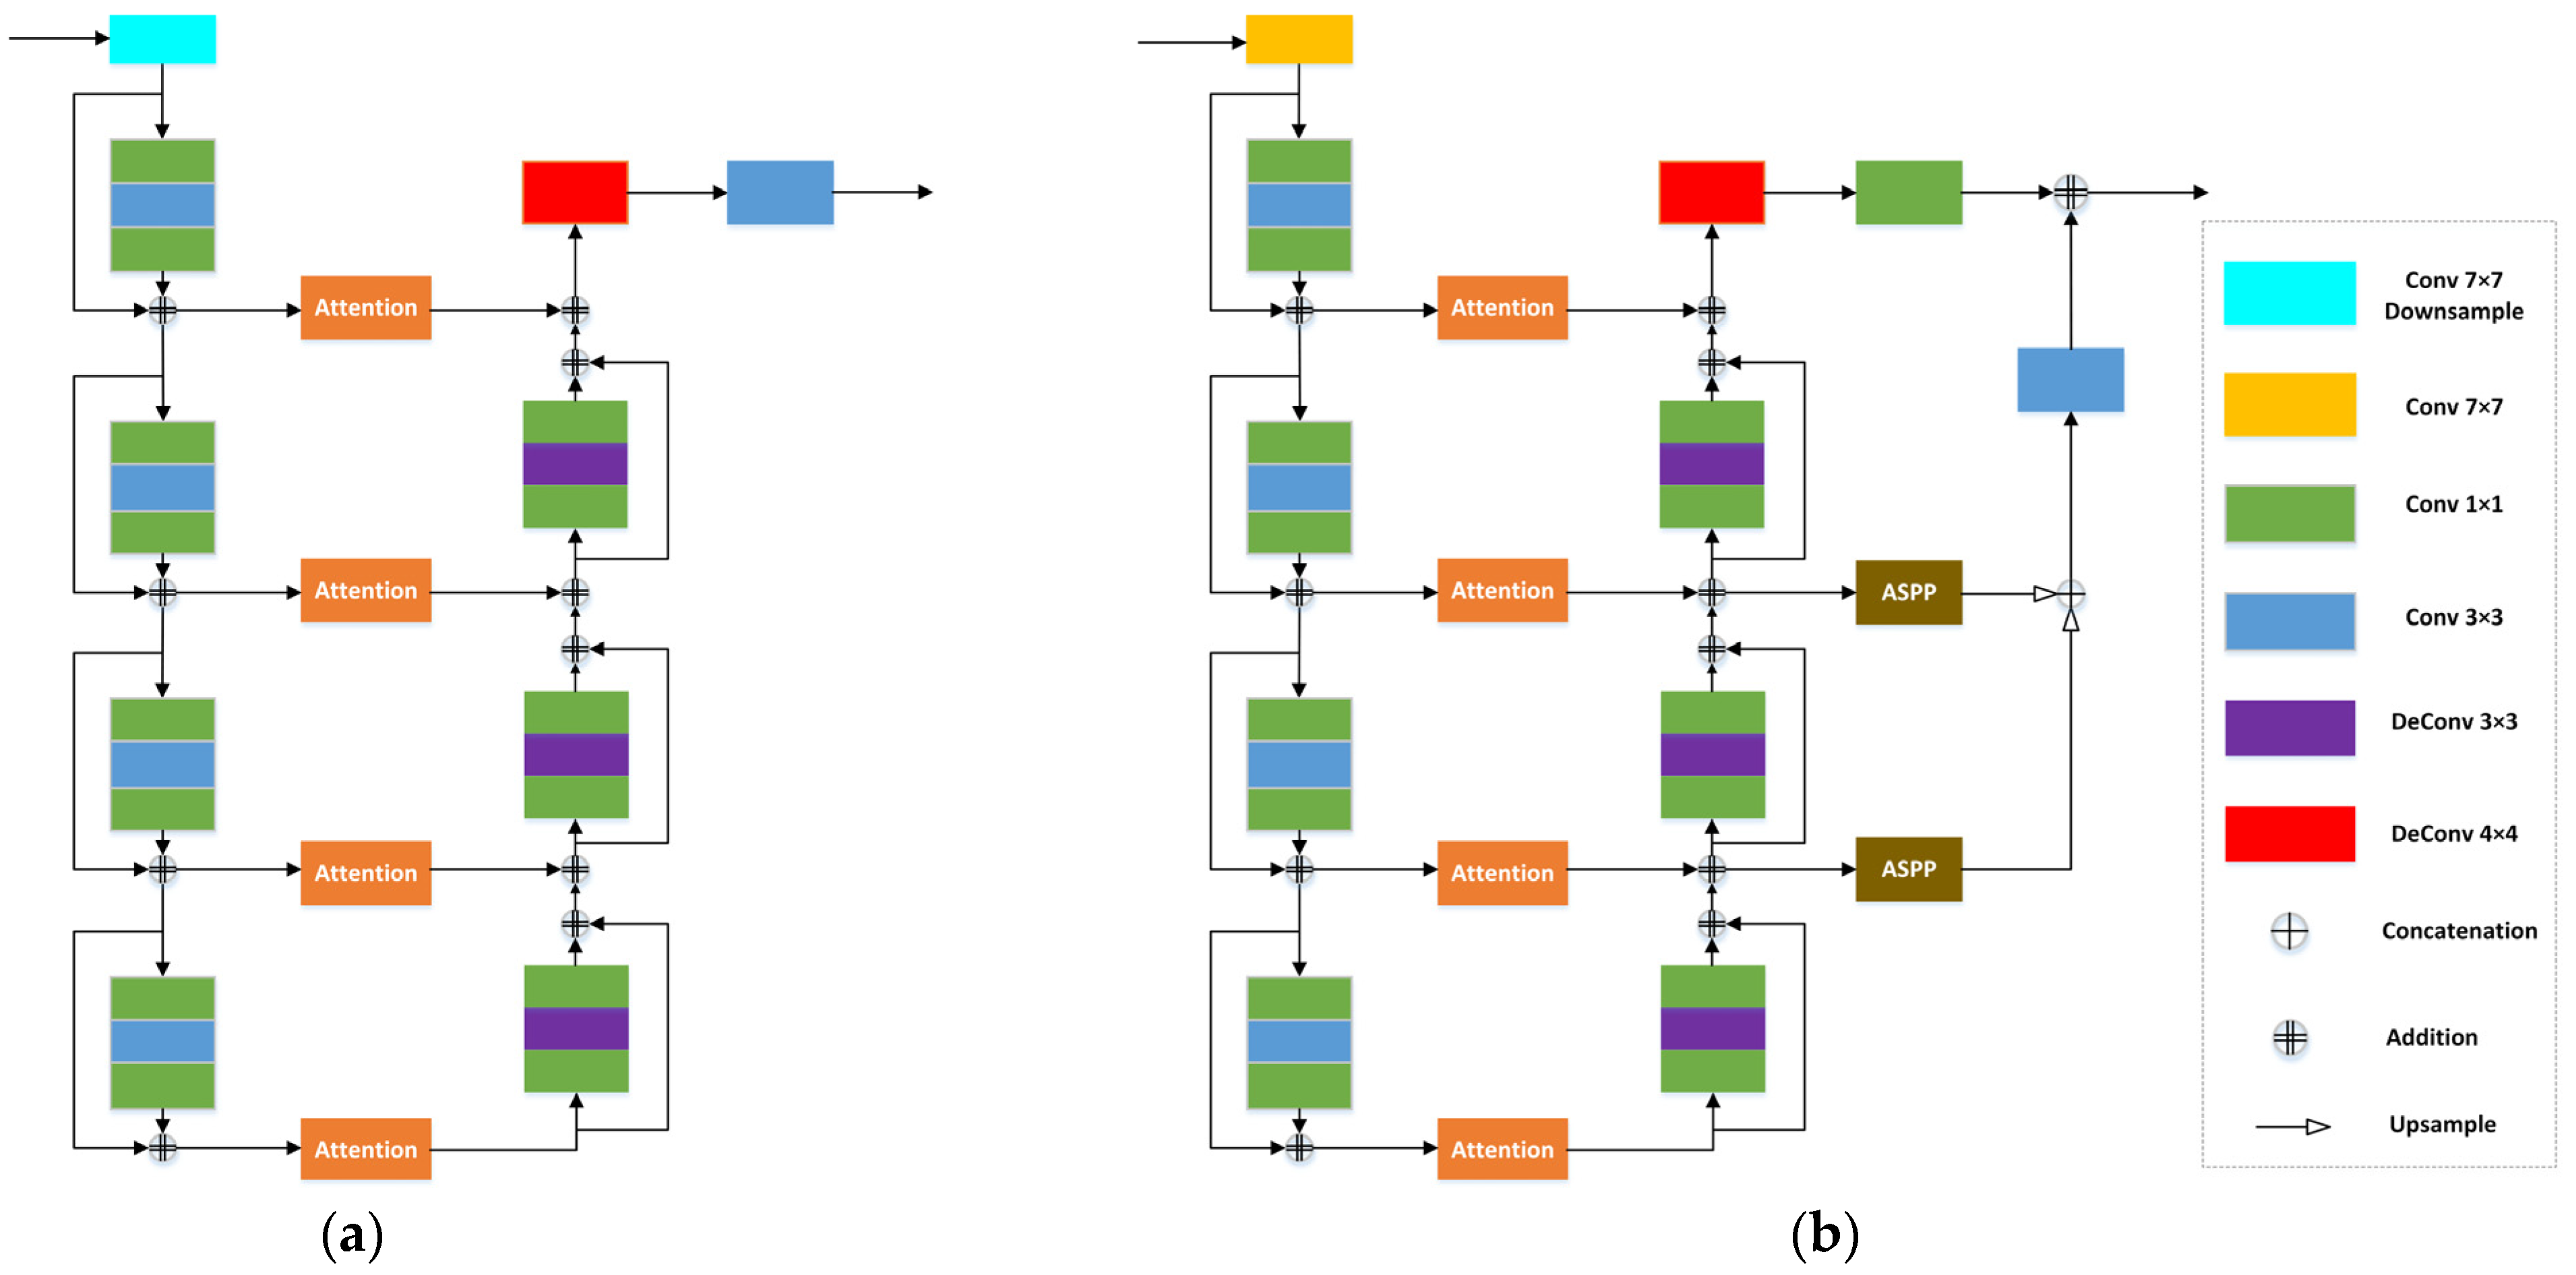
2.2.1. MANet
2.2.2. Atrous Spatial Pyramid Pooling
2.2.3. Advanced MANet
2.2.4. Performance Evaluation
2.2.5. Experimental Settings
3. Results and Discussion
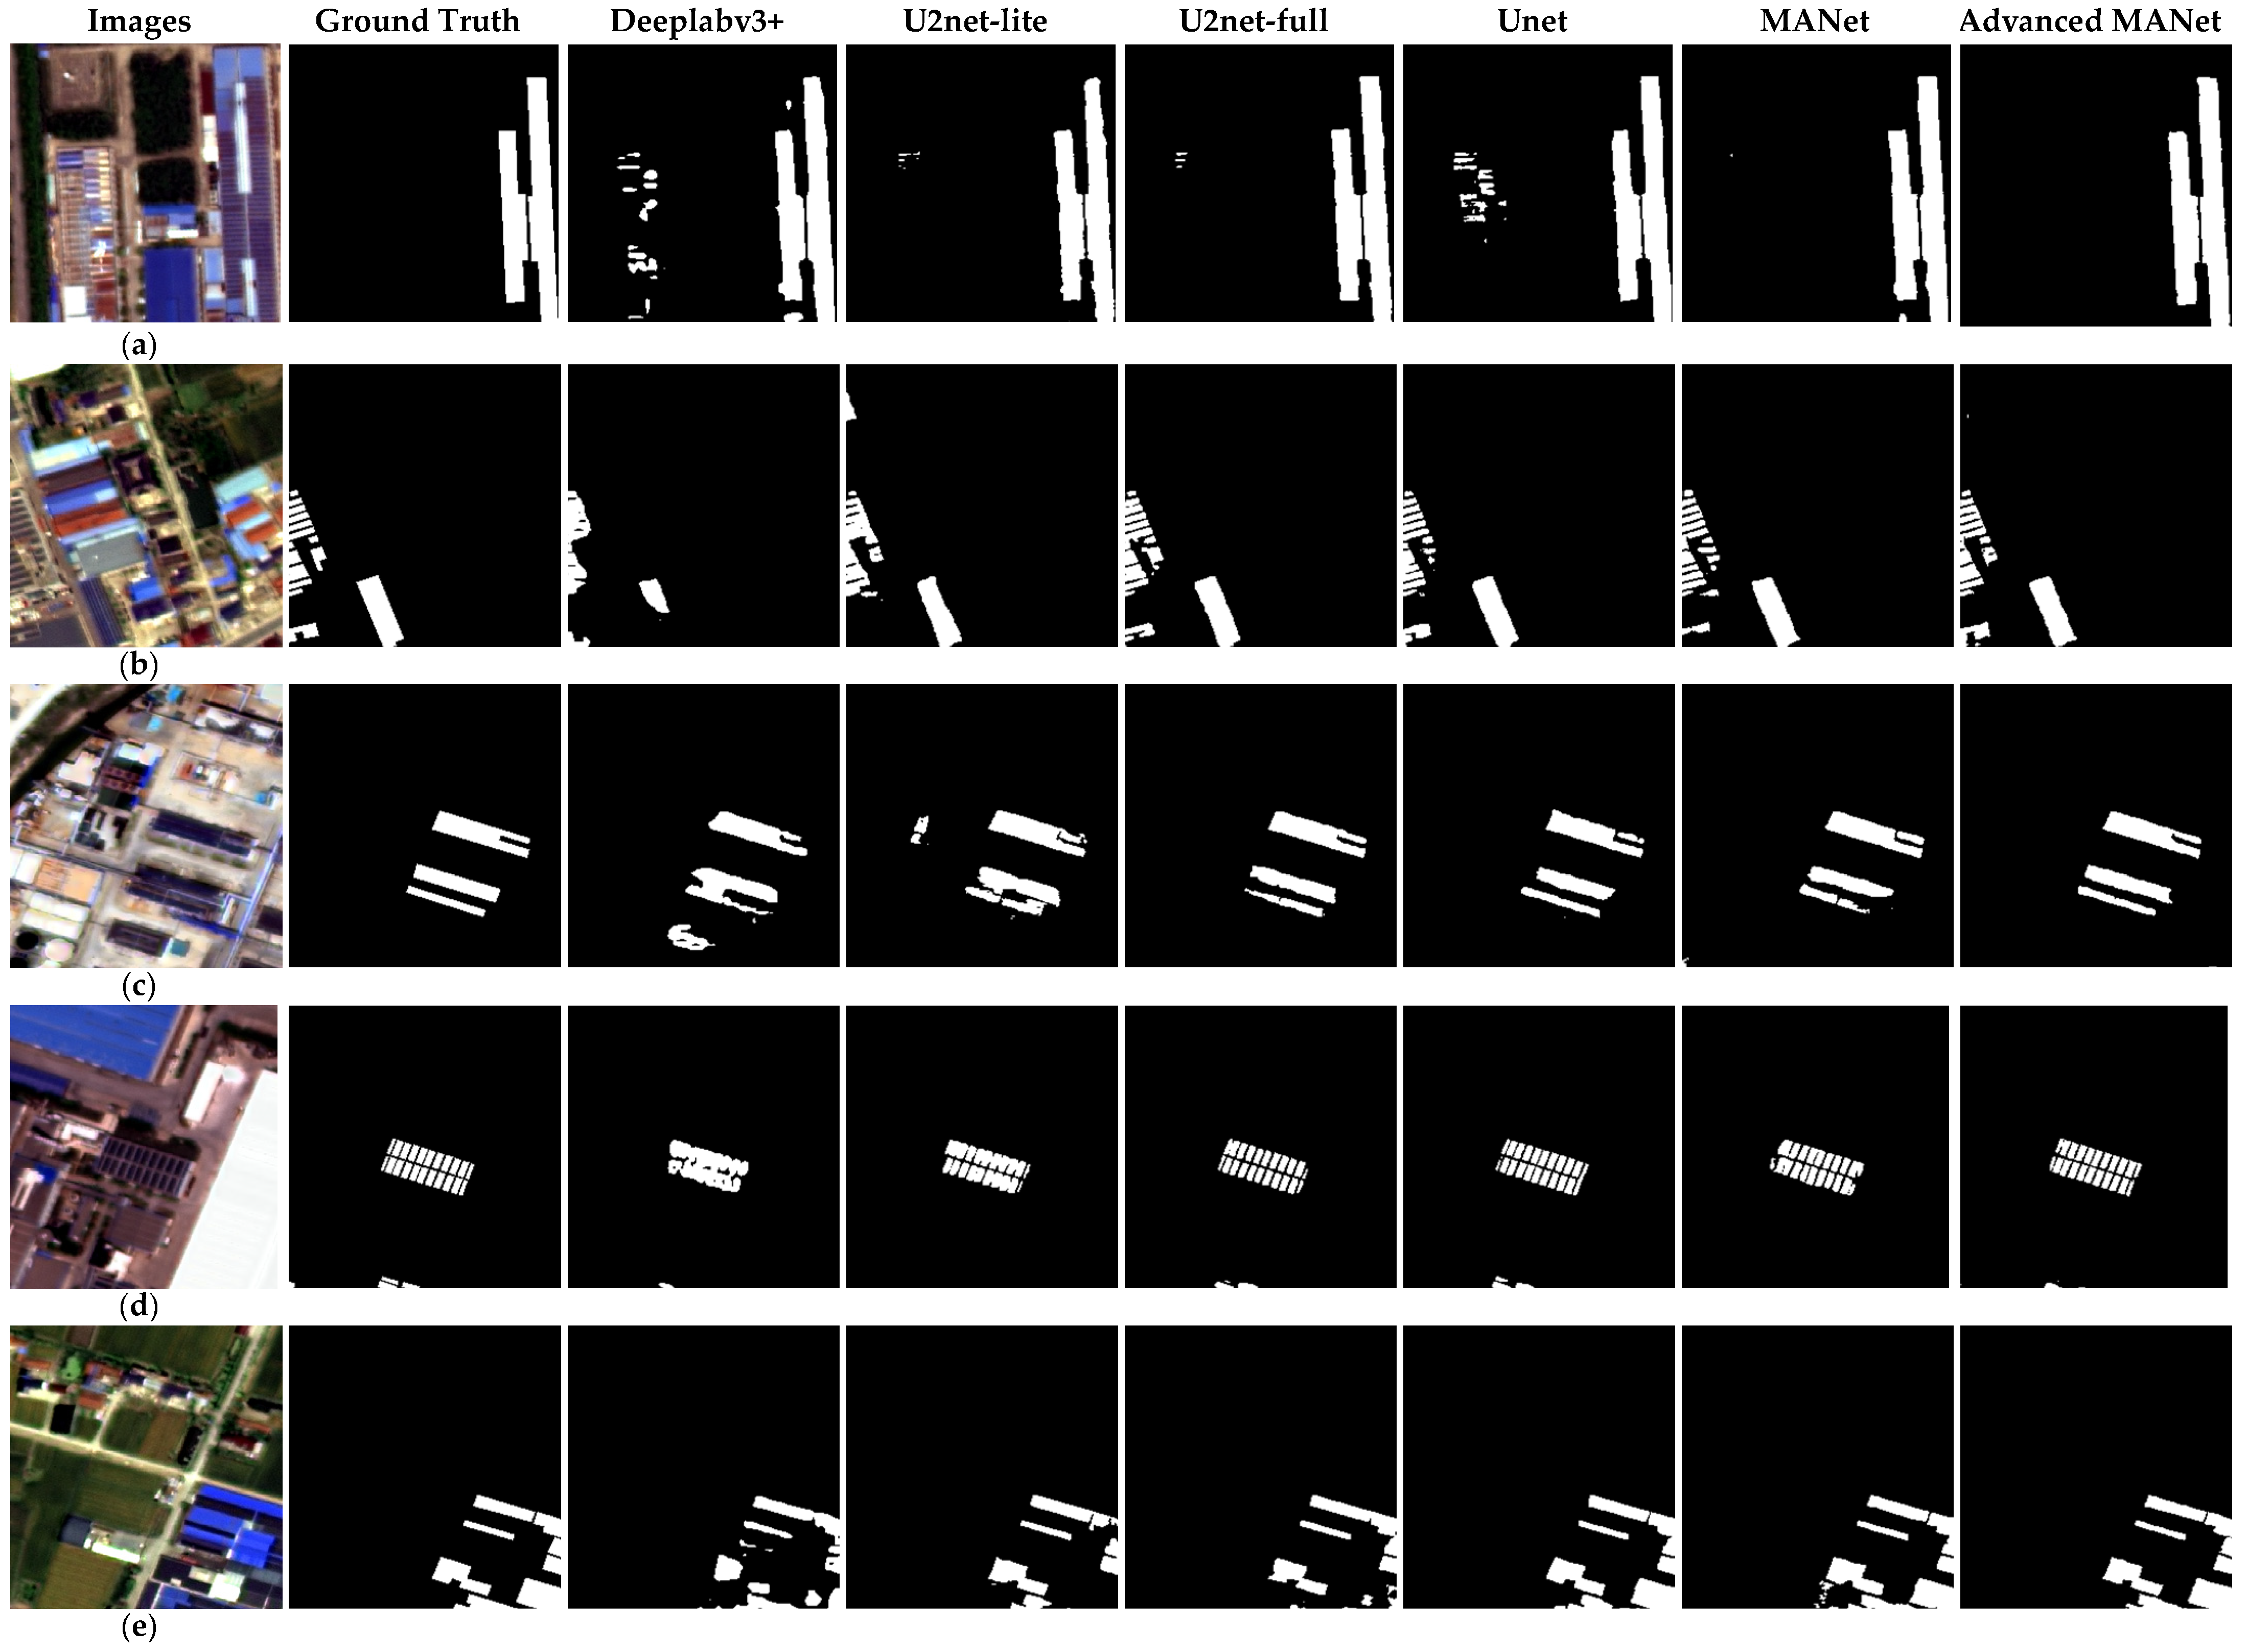
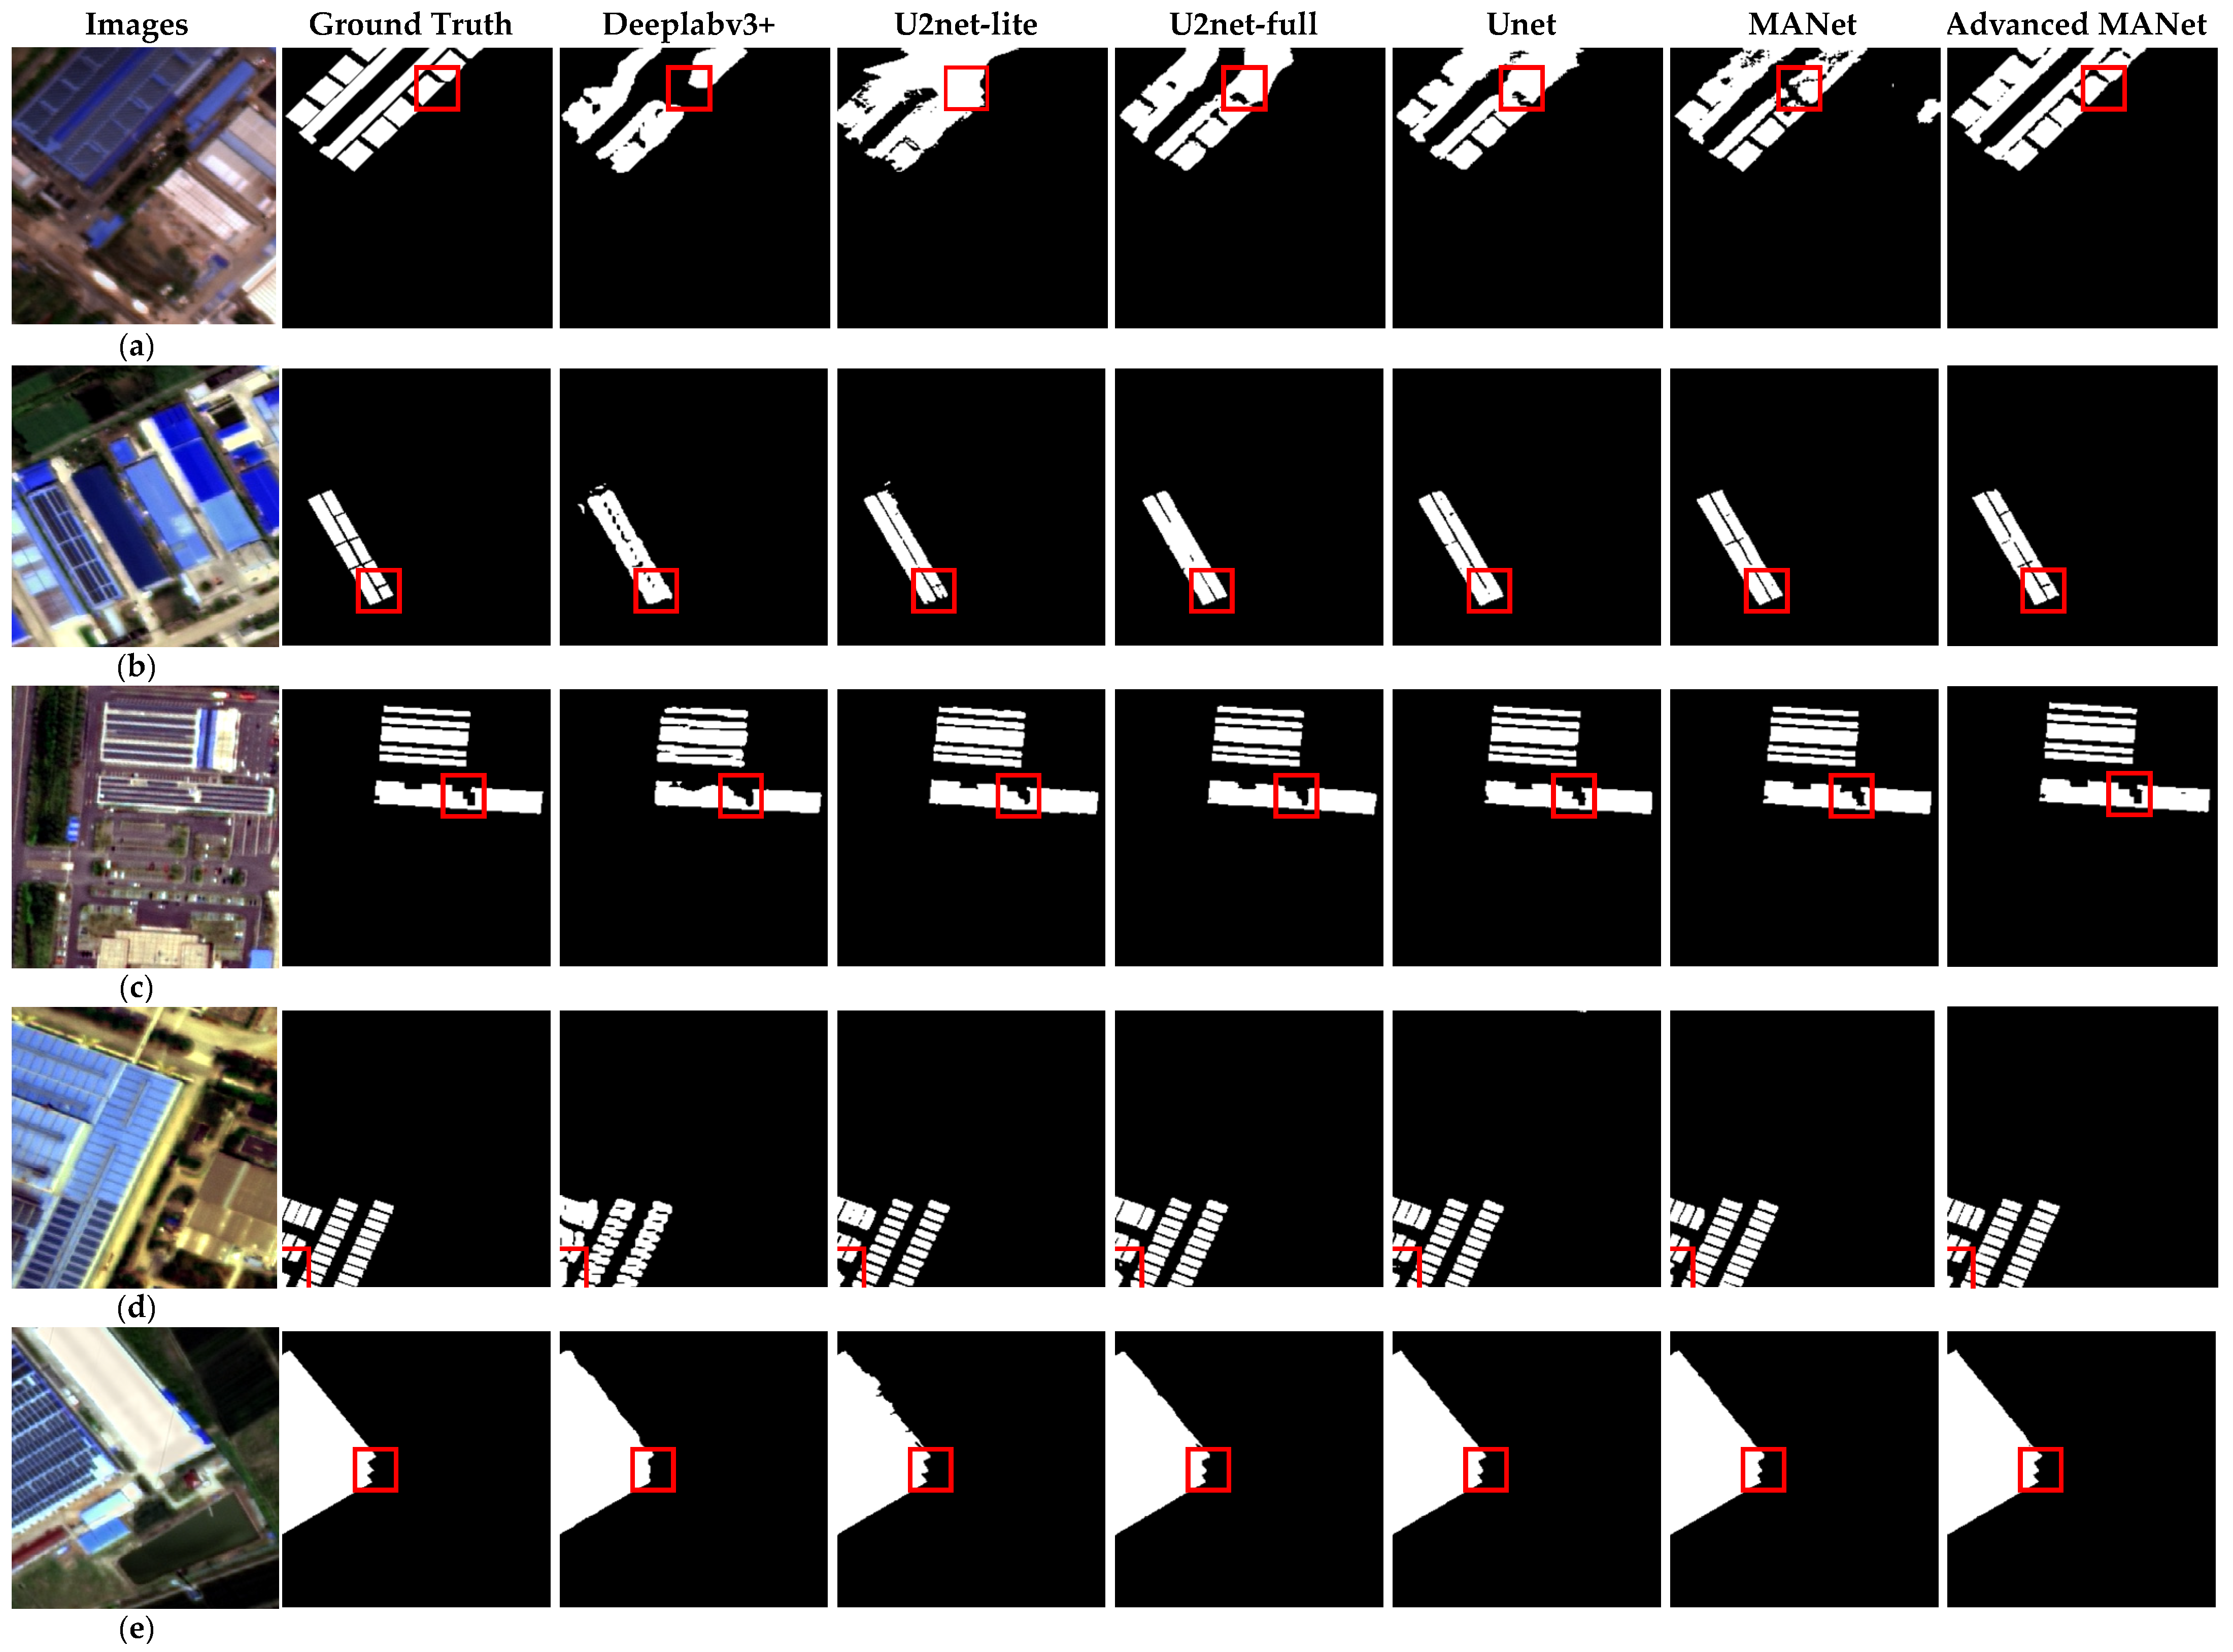
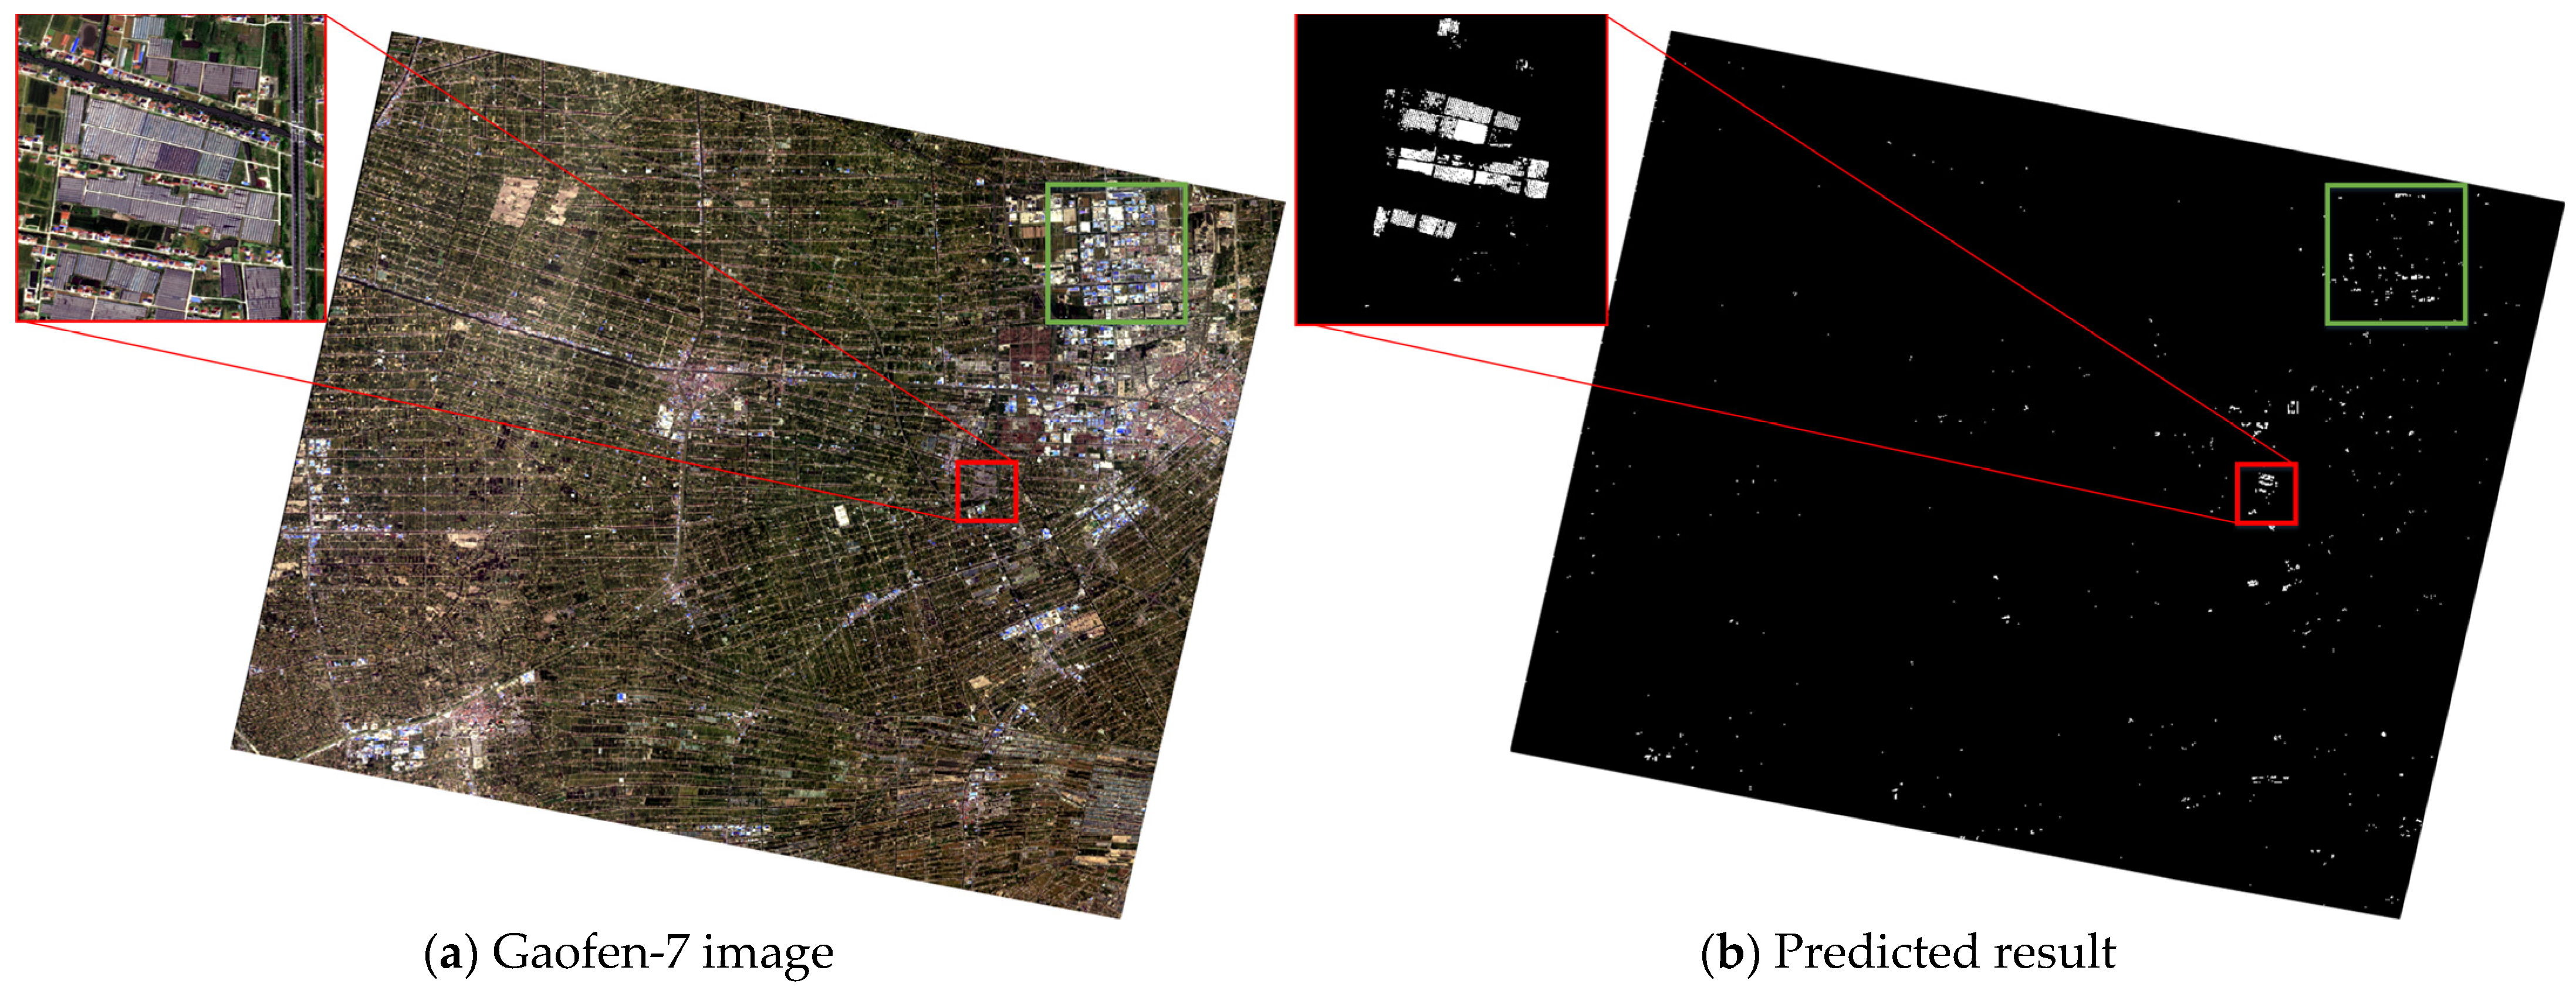
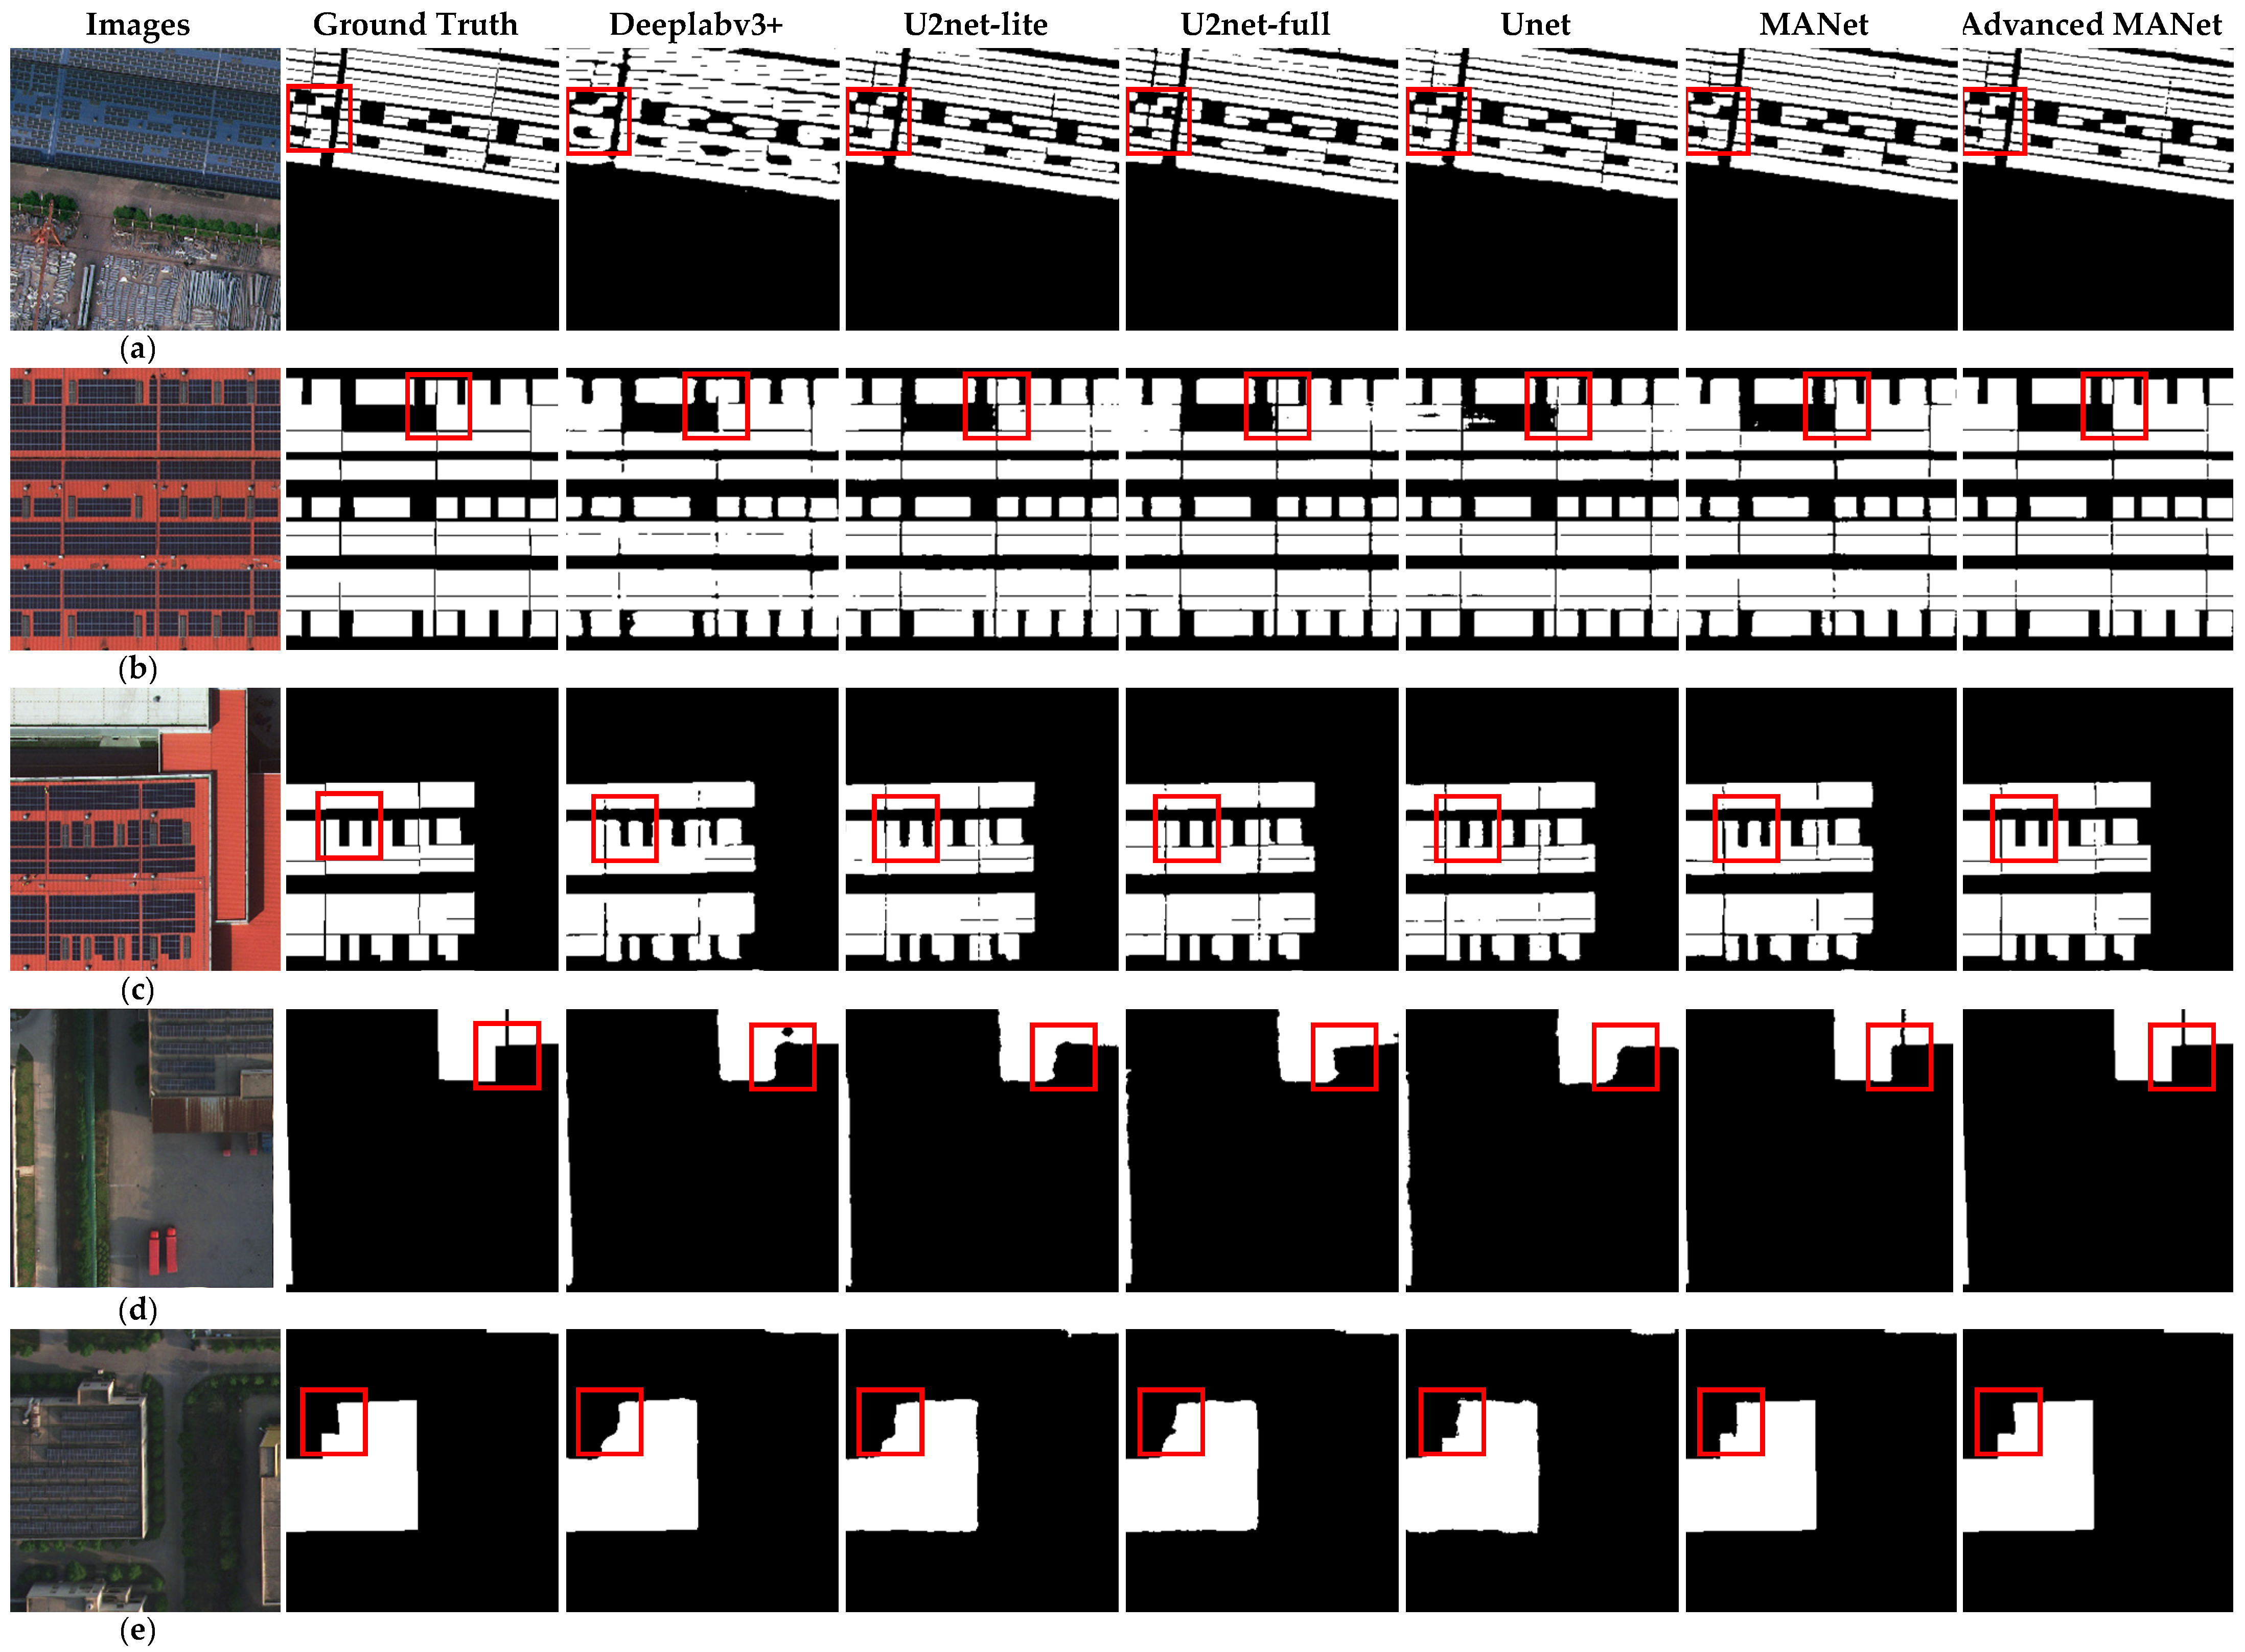
3.1. Results and Analysis
3.2. Discussion
4. Conclusions
Author Contributions
Funding
Institutional Review Board Statement
Informed Consent Statement
Data Availability Statement
Acknowledgments
Conflicts of Interest
References
- Wei, J.; Zhao, Z.; Guo, Y.; Ai, L.; Qiu, C. China’s Photovoltaic Power Generation Development Status and Prospects in 2021. Water Power 2022, 48, 4–8. [Google Scholar]
- Xia, Z.; Li, Y.; Chen, R.; Sengupta, D.; Guo, X.; Xiong, B.; Niu, Y. Mapping the Rapid Development of Photovoltaic Power Stations in Northwestern China Using Remote Sensing. Energy Rep. 2022, 8, 4117–4127. [Google Scholar] [CrossRef]
- Parida, B.; Iniyan, S.; Goic, R. A Review of Solar Photovoltaic Technologies. Renew. Sustain. Energy Rev. 2011, 15, 1625–1636. [Google Scholar] [CrossRef]
- Jiang, H.; Yao, L.; Lu, N.; Qin, J.; Liu, T.; Liu, Y.; Zhou, C. Geospatial Assessment of Rooftop Solar Photovoltaic Potential Using Multi-Source Remote Sensing Data. Energy AI 2022, 10, 100185. [Google Scholar] [CrossRef]
- Mao, H.; Chen, X.; Luo, Y.; Deng, J.; Tian, Z.; Yu, J.; Xiao, Y.; Fan, J. Advances and Prospects on Estimating Solar Photovoltaic Installation Capacity and Potential Based on Satellite and Aerial Images. Renew. Sustain. Energy Rev. 2023, 179, 113276. [Google Scholar] [CrossRef]
- Jurakuziev, D.; Jumaboev, S.; Lee, M. A Framework to Estimate Generating Capacities of PV Systems Using Satellite Imagery Segmentation. Eng. Appl. Artif. Intell. 2023, 123, 106186. [Google Scholar] [CrossRef]
- Zhang, B.; Wu, Y.; Zhao, B.; Chanussot, J.; Hong, D.; Yao, J.; Gao, L. Progress and Challenges in Intelligent Remote Sensing Satellite Systems. IEEE J. Sel. Top. Appl. Earth Obs. Remote Sens. 2022, 15, 1814–1822. [Google Scholar] [CrossRef]
- Chen, Z.; Kang, Y.; Sun, Z.; Wu, F.; Zhang, Q. Extraction of Photovoltaic Plants Using Machine Learning Methods: A Case Study of the Pilot Energy City of Golmud, China. Remote Sens. 2022, 14, 2697. [Google Scholar] [CrossRef]
- Wang, S.; Zhang, L.; Zhu, S.; Ji, L.; Cai, Q.; Shen, Y.; Zhang, R. Multi-Invariant Feature Combined Photovoltaic Power Plants Extraction Using Multi-Temporal Landsat 8 OLI Imagery. Bull. Surv. Mapp. 2018, 11, 46. [Google Scholar] [CrossRef]
- Khan, S.; Sajjad, M.; Hussain, T.; Ullah, A.; Imran, A.S. A Review on Traditional Machine Learning and Deep Learning Models for WBCs Classification in Blood Smear Images. IEEE Access 2021, 9, 10657–10673. [Google Scholar] [CrossRef]
- Çayir, A.; Yenidoğan, I.; Dağ, H. Feature Extraction Based on Deep Learning for Some Traditional Machine Learning Methods. In Proceedings of the 2018 3rd International Conference on Computer Science and Engineering (UBMK), Sarajevo, Bosnia and Herzegovina, 20–23 September 2018; pp. 494–497. [Google Scholar]
- Li, Y. Robust Analysis of Photovoltaic Power Plants Information Extraction Based on High-Resolution Images and Research on Thermal Environment Effects. Master’s Thesis, Lanzhou University, Lanzhou, China, 2016. [Google Scholar]
- Wang, S.; Zhang, F.; Zhu, P.; Zhan, H.; Zhang, Y.; Xi, G. Photovoltaic roof extraction from material and angle attribute filtered method. Bull. Surv. Mapp. 2021, 3, 96–99+151. [Google Scholar] [CrossRef]
- Du, L.; Han, X.; Wang, Z.; Luo, Z.; Liu, A.; You, S.; Gan, Y.; Liu, L. Photovoltaic Power Station Extraction from High-Resolution Satellite Images Based on Deep Learning Method. In Proceedings of the IGARSS 2022—2022 IEEE International Geoscience and Remote Sensing Symposium, Kuala Lumpur, Malaysia, 17–22 July 2022; pp. 3351–3354. [Google Scholar]
- Ge, F.; Wang, G.; He, G.; Zhou, D.; Yin, R.; Tong, L. A Hierarchical Information Extraction Method for Large-Scale Centralized Photovoltaic Power Plants Based on Multi-Source Remote Sensing Images. Remote Sens. 2022, 14, 4211. [Google Scholar] [CrossRef]
- Wang, J.; Chen, X.; Jiang, W.; Hua, L.; Liu, J.; Sui, H. PVNet: A Novel Semantic Segmentation Model for Extracting High-Quality Photovoltaic Panels in Large-Scale Systems from High-Resolution Remote Sensing Imagery. Int. J. Appl. Earth Obs. Geoinf. 2023, 119, 103309. [Google Scholar] [CrossRef]
- Tan, M.; Le, Q.V. EfficientNet: Rethinking Model Scaling for Convolutional Neural Networks. In Proceedings of the 36th International Conference on Machine Learning, Long Beach, CA, USA, 10–15 June 2019. [Google Scholar]
- Kirillov, A.; Wu, Y.; He, K.; Girshick, R. PointRend: Image Segmentation as Rendering. In Proceedings of the IEEE/CVF Conference on Computer Vision and Pattern Recognition, Seattle, WA, USA, 13–19 June 2020; pp. 9799–9808. [Google Scholar]
- Zhu, R.; Guo, D.; Wong, M.S.; Qian, Z.; Chen, M.; Yang, B.; Chen, B.; Zhang, H.; You, L.; Heo, J.; et al. Deep Solar PV Refiner: A Detail-Oriented Deep Learning Network for Refined Segmentation of Photovoltaic Areas from Satellite Imagery. Int. J. Appl. Earth Obs. Geoinf. 2023, 116, 103134. [Google Scholar] [CrossRef]
- Badrinarayanan, V.; Kendall, A.; Cipolla, R. SegNet: A Deep Convolutional Encoder-Decoder Architecture for Image Segmentation. IEEE Trans. Pattern Anal. Mach. Intell. 2017, 39, 2481–2495. [Google Scholar] [CrossRef]
- Camilo, J.; Wang, R.; Collins, L.M.; Bradbury, K.; Malof, J.M. Application of a Semantic Segmentation Convolutional Neural Network for Accurate Automatic Detection and Mapping of Solar Photovoltaic Arrays in Aerial Imagery. arXiv 2018, arXiv:1801.04018. [Google Scholar]
- Howard, A.G.; Zhu, M.; Chen, B.; Kalenichenko, D.; Wang, W.; Weyand, T.; Andreetto, M.; Adam, H. MobileNets: Efficient Convolutional Neural Networks for Mobile Vision Applications. arXiv 2017, arXiv:1704.04861. [Google Scholar]
- Wani, M.A.; Mujtaba, T. Segmentation of Satellite Images of Solar Panels Using Fast Deep Learning Model. Int. J. Renew. Energy Res. 2021, 11, 31–45. [Google Scholar]
- Guo, H.; Shi, Q.; Marinoni, A.; Du, B.; Zhang, L. Deep Building Footprint Update Network: A Semi-Supervised Method for Updating Existing Building Footprint from Bi-Temporal Remote Sensing Images. Remote Sens. Environ. 2021, 264, 112589. [Google Scholar] [CrossRef]
- Liu, T.; Yao, L.; Qin, J.; Lu, N.; Jiang, H.; Zhang, F.; Zhou, C. Multi-Scale Attention Integrated Hierarchical Networks for High-Resolution Building Footprint Extraction. Int. J. Appl. Earth Obs. Geoinf. 2022, 109, 102768. [Google Scholar] [CrossRef]
- Li, P.; Zhang, H.; Guo, Z.; Lyu, S.; Chen, J.; Li, W.; Song, X.; Shibasaki, R.; Yan, J. Understanding Rooftop PV Panel Semantic Segmentation of Satellite and Aerial Images for Better Using Machine Learning. Adv. Appl. Energy 2021, 4, 100057. [Google Scholar] [CrossRef]
- Zhao, X.; Xie, Y. The Economic Performance of Industrial and Commercial Rooftop Photovoltaic in China. Energy 2019, 187, 115961. [Google Scholar] [CrossRef]
- Beuse, M.; Dirksmeier, M.; Steffen, B.; Schmidt, T.S. Profitability of Commercial and Industrial Photovoltaics and Battery Projects in South-East-Asia. Appl. Energy 2020, 271, 115218. [Google Scholar] [CrossRef]
- Chandel, S.S.; Gupta, A.; Chandel, R.; Tajjour, S. Review of Deep Learning Techniques for Power Generation Prediction of Industrial Solar Photovoltaic Plants. Sol. Compass 2023, 8, 100061. [Google Scholar] [CrossRef]
- Li, L.; Lu, N.; Jiang, H.; Qin, J. Impact of Deep Convolutional Neural Network Structure on Photovoltaic Array Extraction from High Spatial Resolution Remote Sensing Images. Remote Sens. 2023, 15, 4554. [Google Scholar] [CrossRef]
- Li, X.; Jin, G.; Yang, J.; Li, Y.; Wei, P.; Zhang, L. Epidemiological Characteristics of Leprosy during the Period 2005–2020: A Retrospective Study Based on the Chinese Surveillance System. Front. Public Health 2023, 10, 991828. [Google Scholar] [CrossRef] [PubMed]
- China Weather Network Jiangsu Station. Climate Profile of Jiangsu Province. Available online: http://www.weather.com.cn/jiangsu/jsqh/jsqhgk/08/910774.shtml (accessed on 8 November 2023).
- Cao, W. Study on the Development Path to Achieve a High Percentage of Photovoltaic Power Generation in Jiangsu Province. Pet. New Energy 2022, 34, 1–7. [Google Scholar]
- Liu, L.; Zhu, W.; Yang, X. Research on Operation Mode of New Distribution System with Integrating Large Scales of Distributed Photovoltaic. In Proceedings of the 2022 IEEE International Conference on Power Systems and Electrical Technology (PSET), Aalborg, Denmark, 13–15 October 2022; pp. 347–352. [Google Scholar]
- Jiangsu’s Distributed Photovoltaic Installed Capacity Ranks among the Top in the Country. Available online: http://paper.people.com.cn/zgnyb/html/2022-04/25/content_25915183.htm (accessed on 12 October 2023).
- International Energy Network. Jiangsu Photovoltaic Industry Analysis. Available online: https://www.in-en.com/article/html/energy-2325200.shtml (accessed on 3 November 2023).
- Chen, L.; Letu, H.; Fan, M.; Shang, H.; Tao, J.; Wu, L.; Zhang, Y.; Yu, C.; Gu, J.; Zhang, N.; et al. An Introduction to the Chinese High-Resolution Earth Observation System: Gaofen-1~7 Civilian Satellites. J. Remote Sens. 2022, 2022, 9769536. [Google Scholar] [CrossRef]
- Zhu, X.; Ren, Z.; Nie, S.; Bao, G.; Ha, G.; Bai, M.; Liang, P. DEM Generation from GF-7 Satellite Stereo Imagery Assisted by Space-Borne LiDAR and Its Application to Active Tectonics. Remote Sens. 2023, 15, 1480. [Google Scholar] [CrossRef]
- Tian, J.; Zhuo, X.; Yuan, X.; Henry, C.; d’Angelo, P.; Krauss, T. Application oriented quality evaluation of Gaofen-7 optical stereo satellite imagery. ISPRS Ann. Photogramm. Remote Sens. Spat. Inf. Sci. 2022, 1, 145–152. [Google Scholar] [CrossRef]
- Jiang, H.; Yao, L.; Lu, N.; Qin, J.; Liu, T.; Liu, Y.; Zhou, C. Multi-Resolution Dataset for Photovoltaic Panel Segmentation from Satellite and Aerial Imagery. Earth Syst. Sci. Data 2021, 13, 5389–5401. [Google Scholar] [CrossRef]
- Hu, J.; Shen, L.; Sun, G. Squeeze-and-Excitation Networks. In Proceedings of the IEEE Conference on Computer Vision and Pattern Recognition, Salt Lake City, UT, USA, 18–23 June 2018; pp. 7132–7141. [Google Scholar]
- Woo, S.; Park, J.; Lee, J.-Y.; Kweon, I.S. CBAM: Convolutional Block Attention Module. In Proceedings of the European Conference on Computer Vision (ECCV), Munich, Germany, 8–14 September 2018; pp. 3–19. [Google Scholar]
- Chen, L.-C.; Papandreou, G.; Kokkinos, I.; Murphy, K.; Yuille, A.L. DeepLab: Semantic Image Segmentation with Deep Convolutional Nets, Atrous Convolution, and Fully Connected CRFs. IEEE Trans. Pattern Anal. Mach. Intell. 2018, 40, 834–848. [Google Scholar] [CrossRef] [PubMed]
- He, K.; Zhang, X.; Ren, S.; Sun, J. Deep Residual Learning for Image Recognition. In Proceedings of the IEEE Conference on Computer Vision and Pattern Recognition, Las Vegas, NV, USA, 27–30 June 2015. [Google Scholar]
- Chen, L.-C.; Papandreou, G.; Schroff, F.; Adam, H. Rethinking Atrous Convolution for Semantic Image Segmentation. arXiv 2017, arXiv:1706.05587. [Google Scholar]
- Qin, X.; Zhang, Z.; Huang, C.; Dehghan, M.; Zaiane, O.R.; Jagersand, M. U2-Net: Going Deeper with Nested U-Structure for Salient Object Detection. Pattern Recognit. 2020, 106, 107404. [Google Scholar] [CrossRef]
- Ronneberger, O.; Fischer, P.; Brox, T. U-Net: Convolutional Networks for Biomedical Image Segmentation. In Proceedings of the 18th International Conference, Munich, Germany, 5–9 October 2015. [Google Scholar]
- Li, R.; Zheng, S.; Zhang, C.; Duan, C.; Su, J.; Wang, L.; Atkinson, P.M. Multiattention Network for Semantic Segmentation of Fine-Resolution Remote Sensing Images. IEEE Trans. Geosci. Remote Sens. 2022, 60, 5607713. [Google Scholar] [CrossRef]


| Ground Truth | |||
|---|---|---|---|
| Positive Class | Negative Class | ||
| Predicted Result | Positive Class | True Positive (TP) | False Positive (FP) |
| Negative Class | False Negative (FN) | True Negative (TN) | |
| Models | IoU | Accuracy | F1-Score | Precision | Recall |
|---|---|---|---|---|---|
| Deeplabv3+ [45] | 78.17 | 98.74 | 0.8558 | 86.07 | 87.27 |
| U2net-lite [46] | 82.71 | 99.08 | 0.8871 | 89.51 | 89.62 |
| U2net-full [46] | 89.00 | 99.37 | 0.9330 | 93.55 | 93.82 |
| Unet [47] | 91.04 | 99.51 | 0.9440 | 95.41 | 94.41 |
| MANet [48] | 90.92 | 99.52 | 0.9435 | 95.06 | 94.57 |
| Advanced MANet | 91.67 | 99.53 | 0.9504 | 95.41 | 95.13 |
| Models | IoU | Accuracy | F1-Score | Precision | Recall |
|---|---|---|---|---|---|
| Deeplabv3+ | 95.98 | 98.93 | 0.9786 | 97.74 | 98.07 |
| U2net-lite | 95.38 | 98.80 | 0.9751 | 97.67 | 97.46 |
| U2net-full | 95.87 | 98.96 | 0.9780 | 98.05 | 97.62 |
| Unet | 94.18 | 98.35 | 0.9689 | 96.96 | 96.98 |
| MANet | 98.74 | 99.67 | 0.9936 | 99.37 | 99.35 |
| Advanced MANet | 99.16 | 99.80 | 0.9958 | 99.57 | 99.58 |
| Models | IoU | Accuracy | F1-Score | Precision | Recall |
|---|---|---|---|---|---|
| MANet | 91.36 | 99.63 | 0.9581 | 95.52 | 95.03 |
| MANet + ASPP | 92.12 | 99.64 | 0.9550 | 95.87 | 95.60 |
| MANet + ASPP + ND | 93.54 | 99.71 | 0.9630 | 96.81 | 96.31 |
| Performance | Model | Numbers | Mean | Std. Deviation | Std. Error Means |
|---|---|---|---|---|---|
| IoU | Advanced Manet | 1140 | 88.58 | 0.2220 | 0.0066 |
| Manet | 1140 | 85.82 | 0.2433 | 0.0072 | |
| F1-score | Advanced Manet | 1140 | 0.9147 | 0.2130 | 0.0063 |
| Manet | 1140 | 0.8933 | 0.2349 | 0.0070 | |
| Precision | Advanced Manet | 1140 | 92.27 | 0.2082 | 0.0062 |
| Manet | 1140 | 90.31 | 0.2301 | 0.0068 | |
| Accuracy | Advanced Manet | 1140 | 99.39 | 0.0246 | 0.0007 |
| Manet | 1140 | 99.31 | 0.0246 | 0.0007 | |
| Recall | Advanced Manet | 1140 | 91.70 | 0.2100 | 0.0062 |
| Manet | 1140 | 89.58 | 0.2359 | 0.0070 |
| Performance | Hypothesis | T | Df | Sig. (2-Tailed) |
|---|---|---|---|---|
| IoU | Equal variances assumed | 2.83 | 2278 | 0.005 |
| Equal variances not assumed | 2.83 | 2259 | 0.005 | |
| F1-score | Equal variances assumed | 2.27 | 2278 | 0.023 |
| Equal variances not assumed | 2.27 | 2257 | 0.023 | |
| Precision | Equal variances assumed | 2.13 | 2278 | 0.033 |
| Equal variances not assumed | 2.13 | 2256 | 0.033 | |
| Accuracy | Equal variances assumed | 0.78 | 2278 | 0.436 |
| Equal variances not assumed | 0.78 | 2278 | 0.436 | |
| Recall | Equal variances assumed | 2.26 | 2278 | 0.024 |
| Equal variances not assumed | 2.26 | 2248 | 0.024 |
Disclaimer/Publisher’s Note: The statements, opinions and data contained in all publications are solely those of the individual author(s) and contributor(s) and not of MDPI and/or the editor(s). MDPI and/or the editor(s) disclaim responsibility for any injury to people or property resulting from any ideas, methods, instructions or products referred to in the content. |
© 2023 by the authors. Licensee MDPI, Basel, Switzerland. This article is an open access article distributed under the terms and conditions of the Creative Commons Attribution (CC BY) license (https://creativecommons.org/licenses/by/4.0/).
Share and Cite
Tao, H.; He, G.; Wang, G.; Yang, R.; Peng, X.; Yin, R. An Information Extraction Method for Industrial and Commercial Rooftop Photovoltaics Based on GaoFen-7 Remote Sensing Images. Remote Sens. 2023, 15, 5744. https://doi.org/10.3390/rs15245744
Tao H, He G, Wang G, Yang R, Peng X, Yin R. An Information Extraction Method for Industrial and Commercial Rooftop Photovoltaics Based on GaoFen-7 Remote Sensing Images. Remote Sensing. 2023; 15(24):5744. https://doi.org/10.3390/rs15245744
Chicago/Turabian StyleTao, Haoxiang, Guojin He, Guizhou Wang, Ruiqing Yang, Xueli Peng, and Ranyu Yin. 2023. "An Information Extraction Method for Industrial and Commercial Rooftop Photovoltaics Based on GaoFen-7 Remote Sensing Images" Remote Sensing 15, no. 24: 5744. https://doi.org/10.3390/rs15245744
APA StyleTao, H., He, G., Wang, G., Yang, R., Peng, X., & Yin, R. (2023). An Information Extraction Method for Industrial and Commercial Rooftop Photovoltaics Based on GaoFen-7 Remote Sensing Images. Remote Sensing, 15(24), 5744. https://doi.org/10.3390/rs15245744