
Correlation between the Channel Discharge Current and Spectrum of a Single-Stroke Lightning Flash to Canton Tower
 ,
, 
Abstract
:1. Introduction
2. Instrumentation and Methods
2.1. Instrumentation
2.2. Theory and Assumptions
3. Results
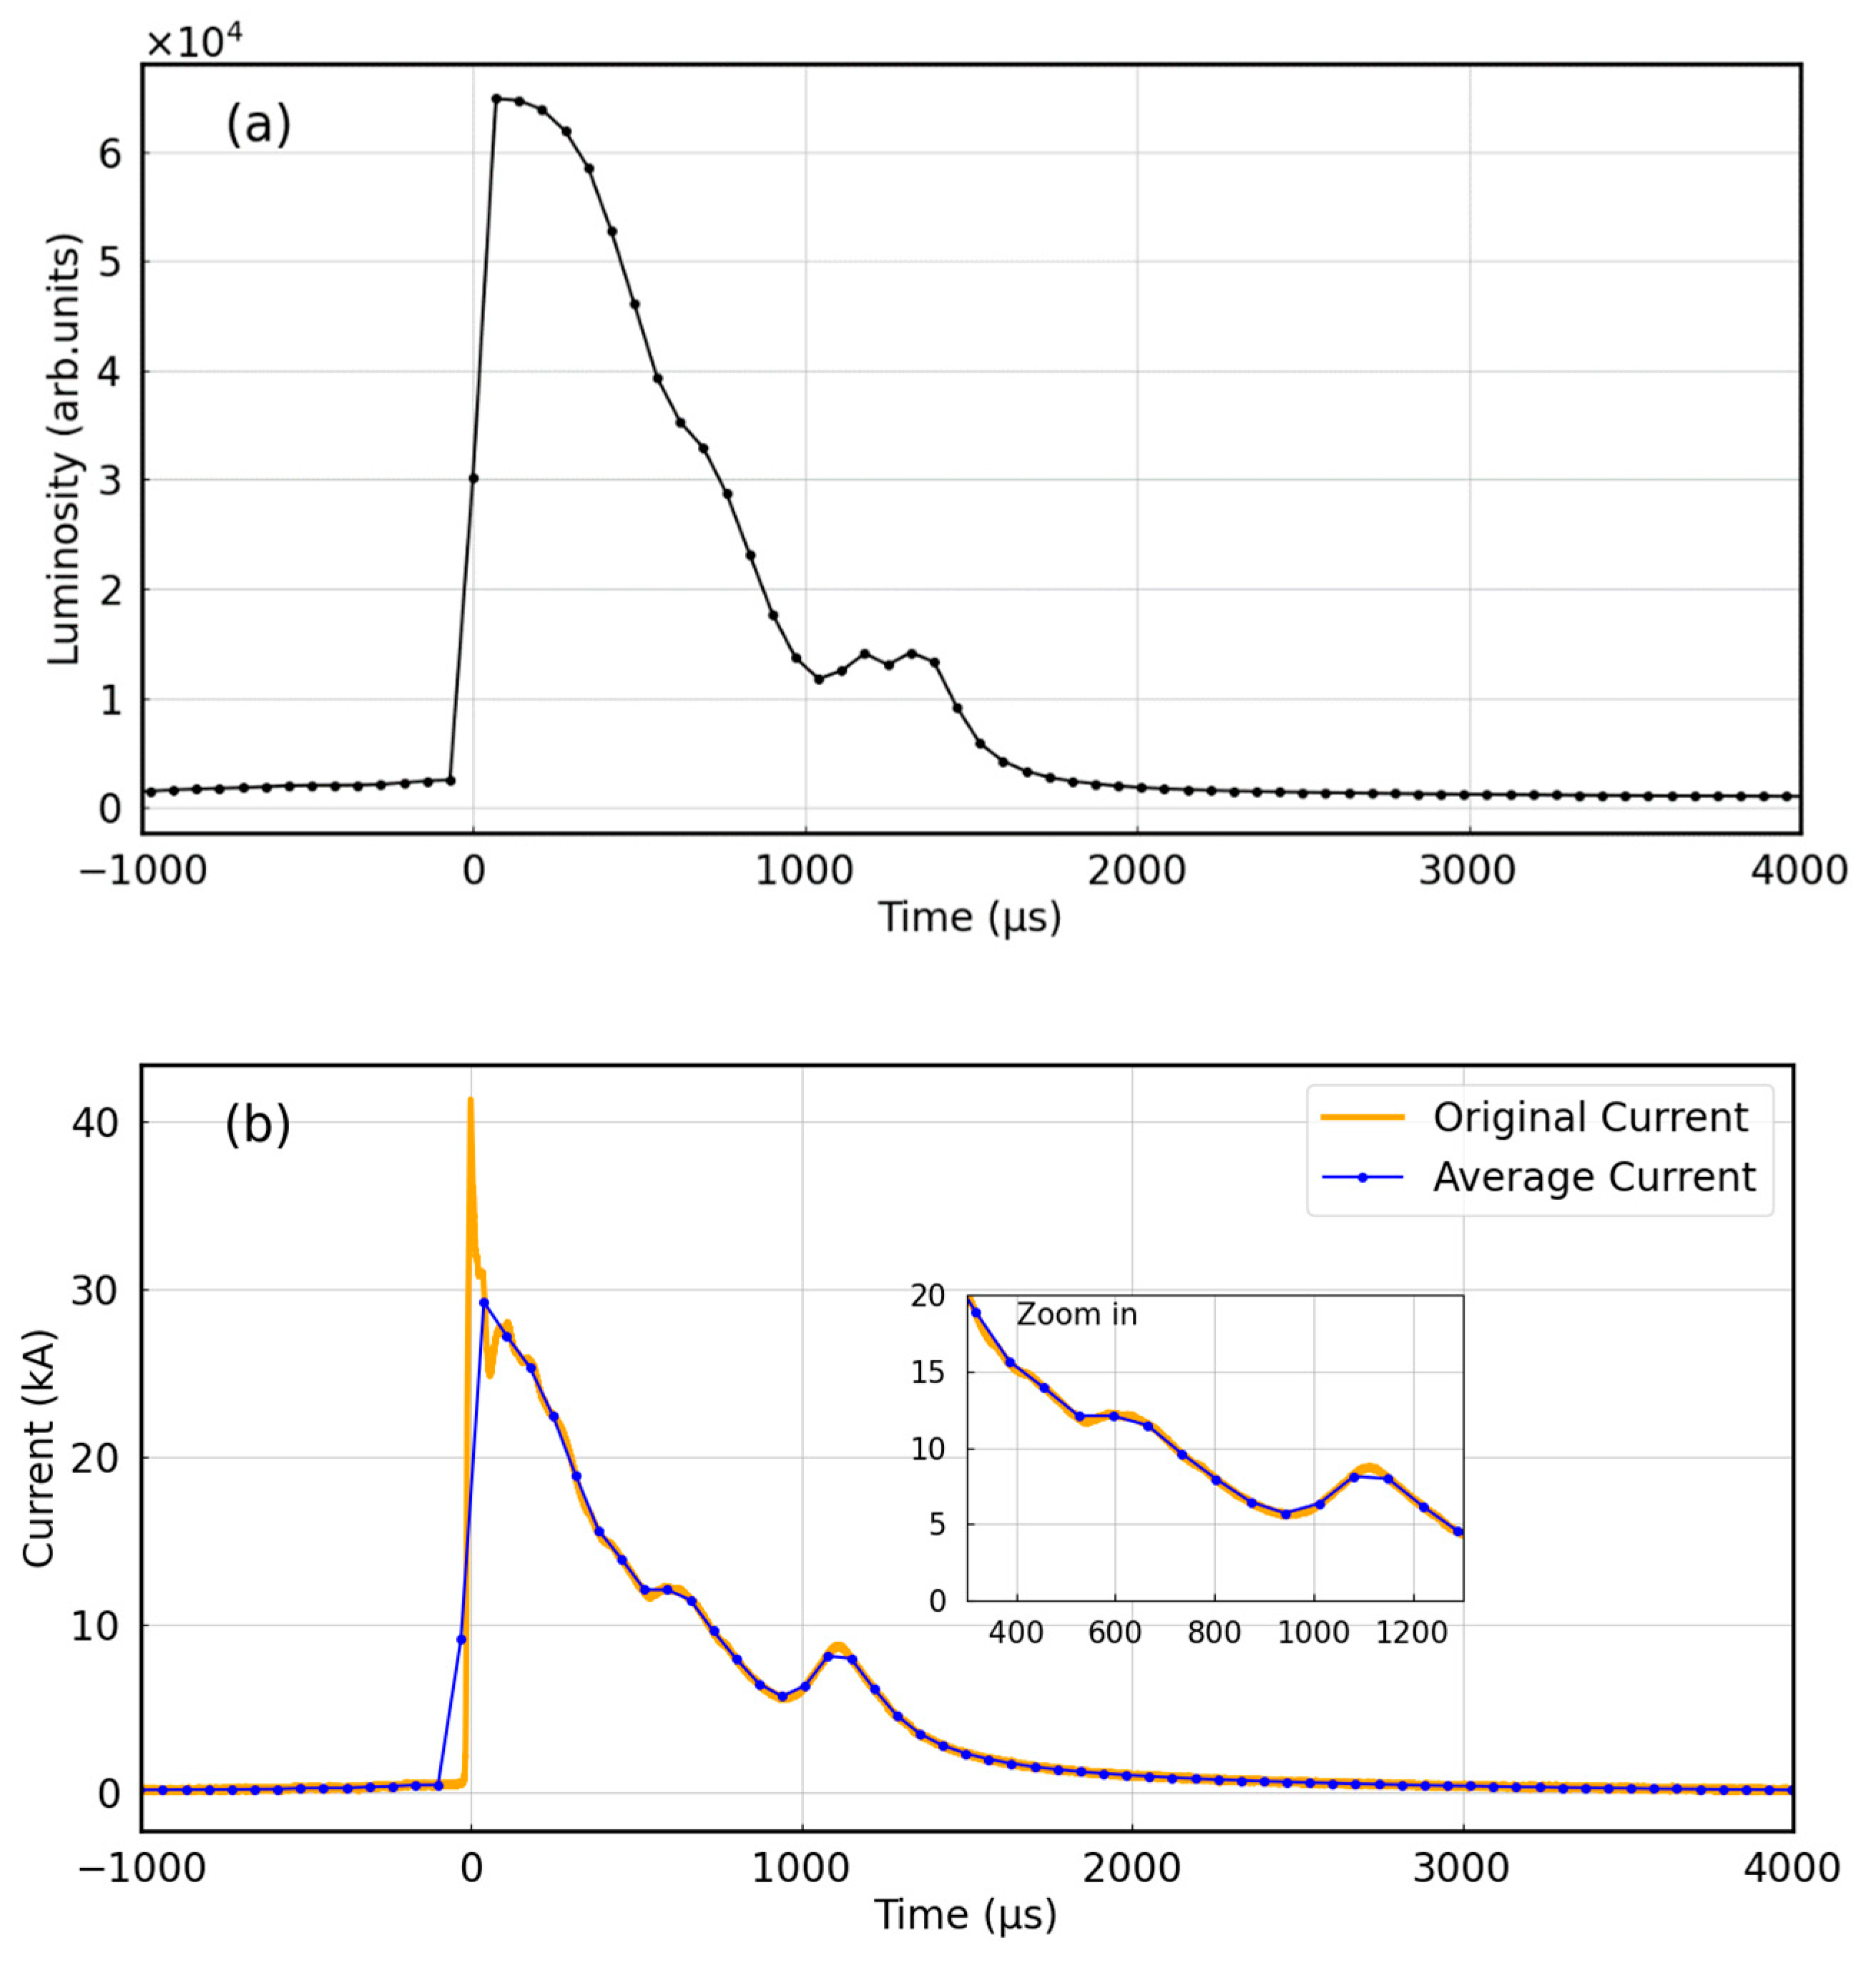
3.1. Overview
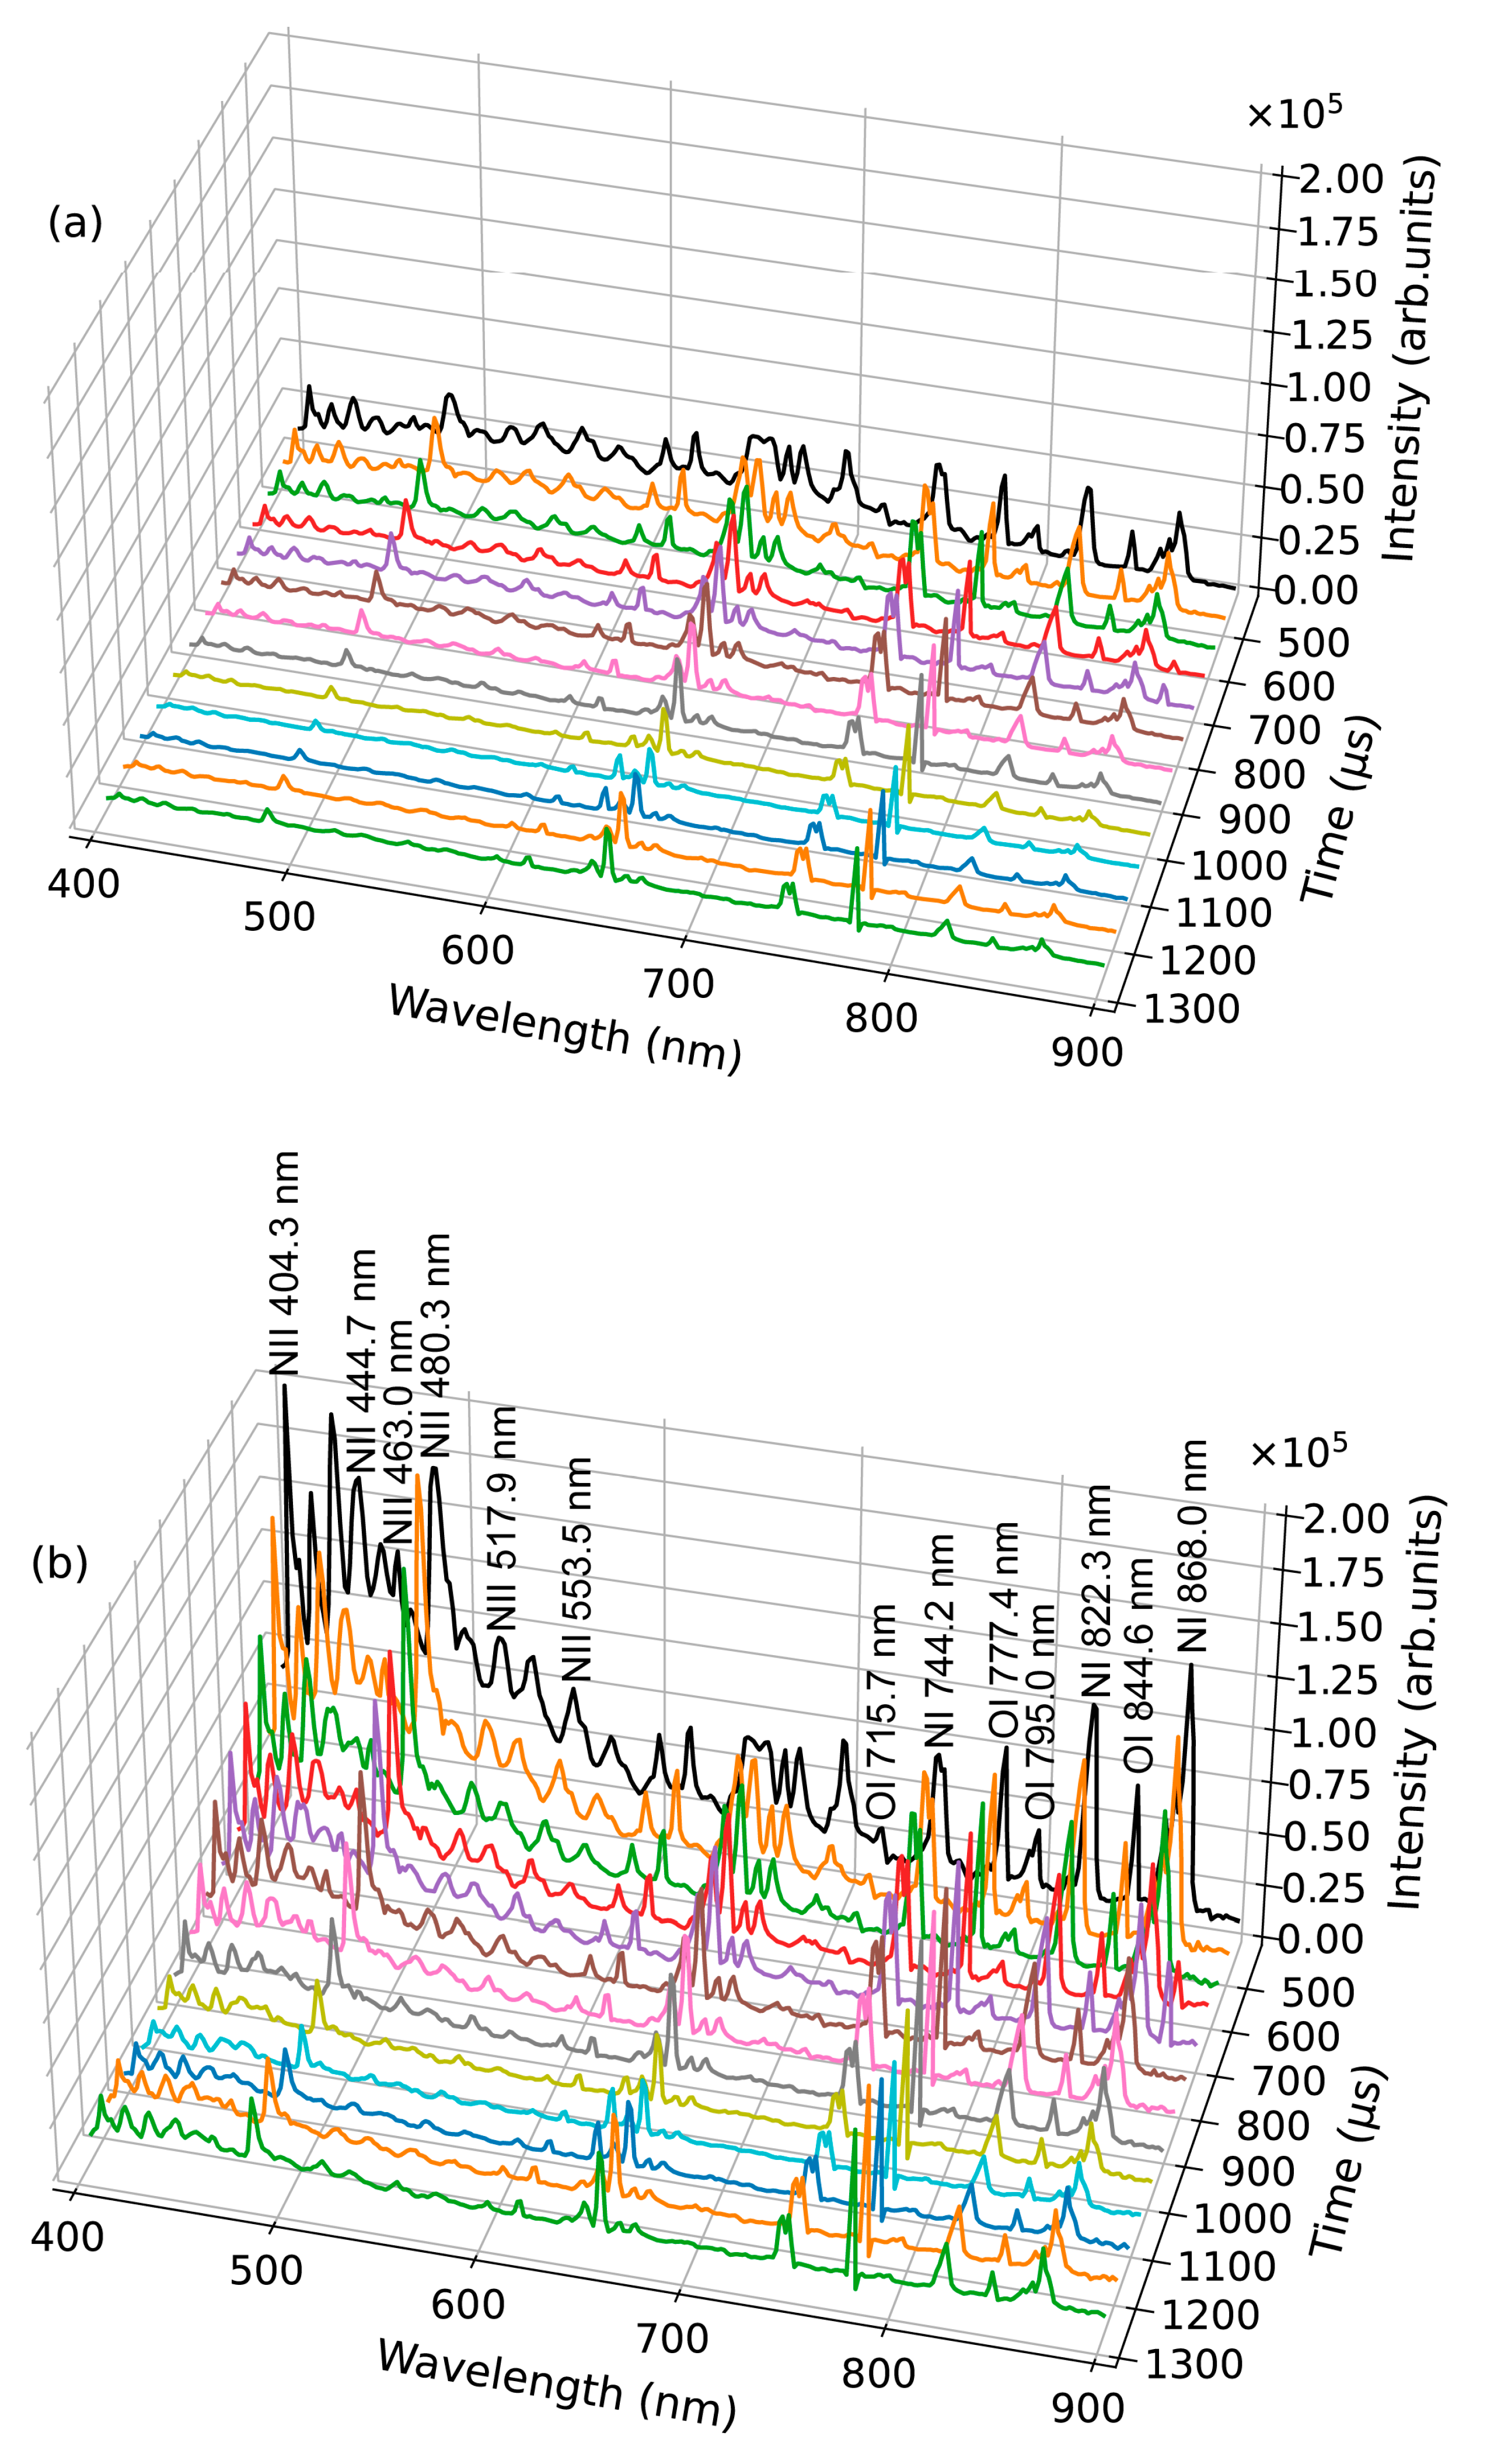
3.2. Spectral Analysis before and after Correction
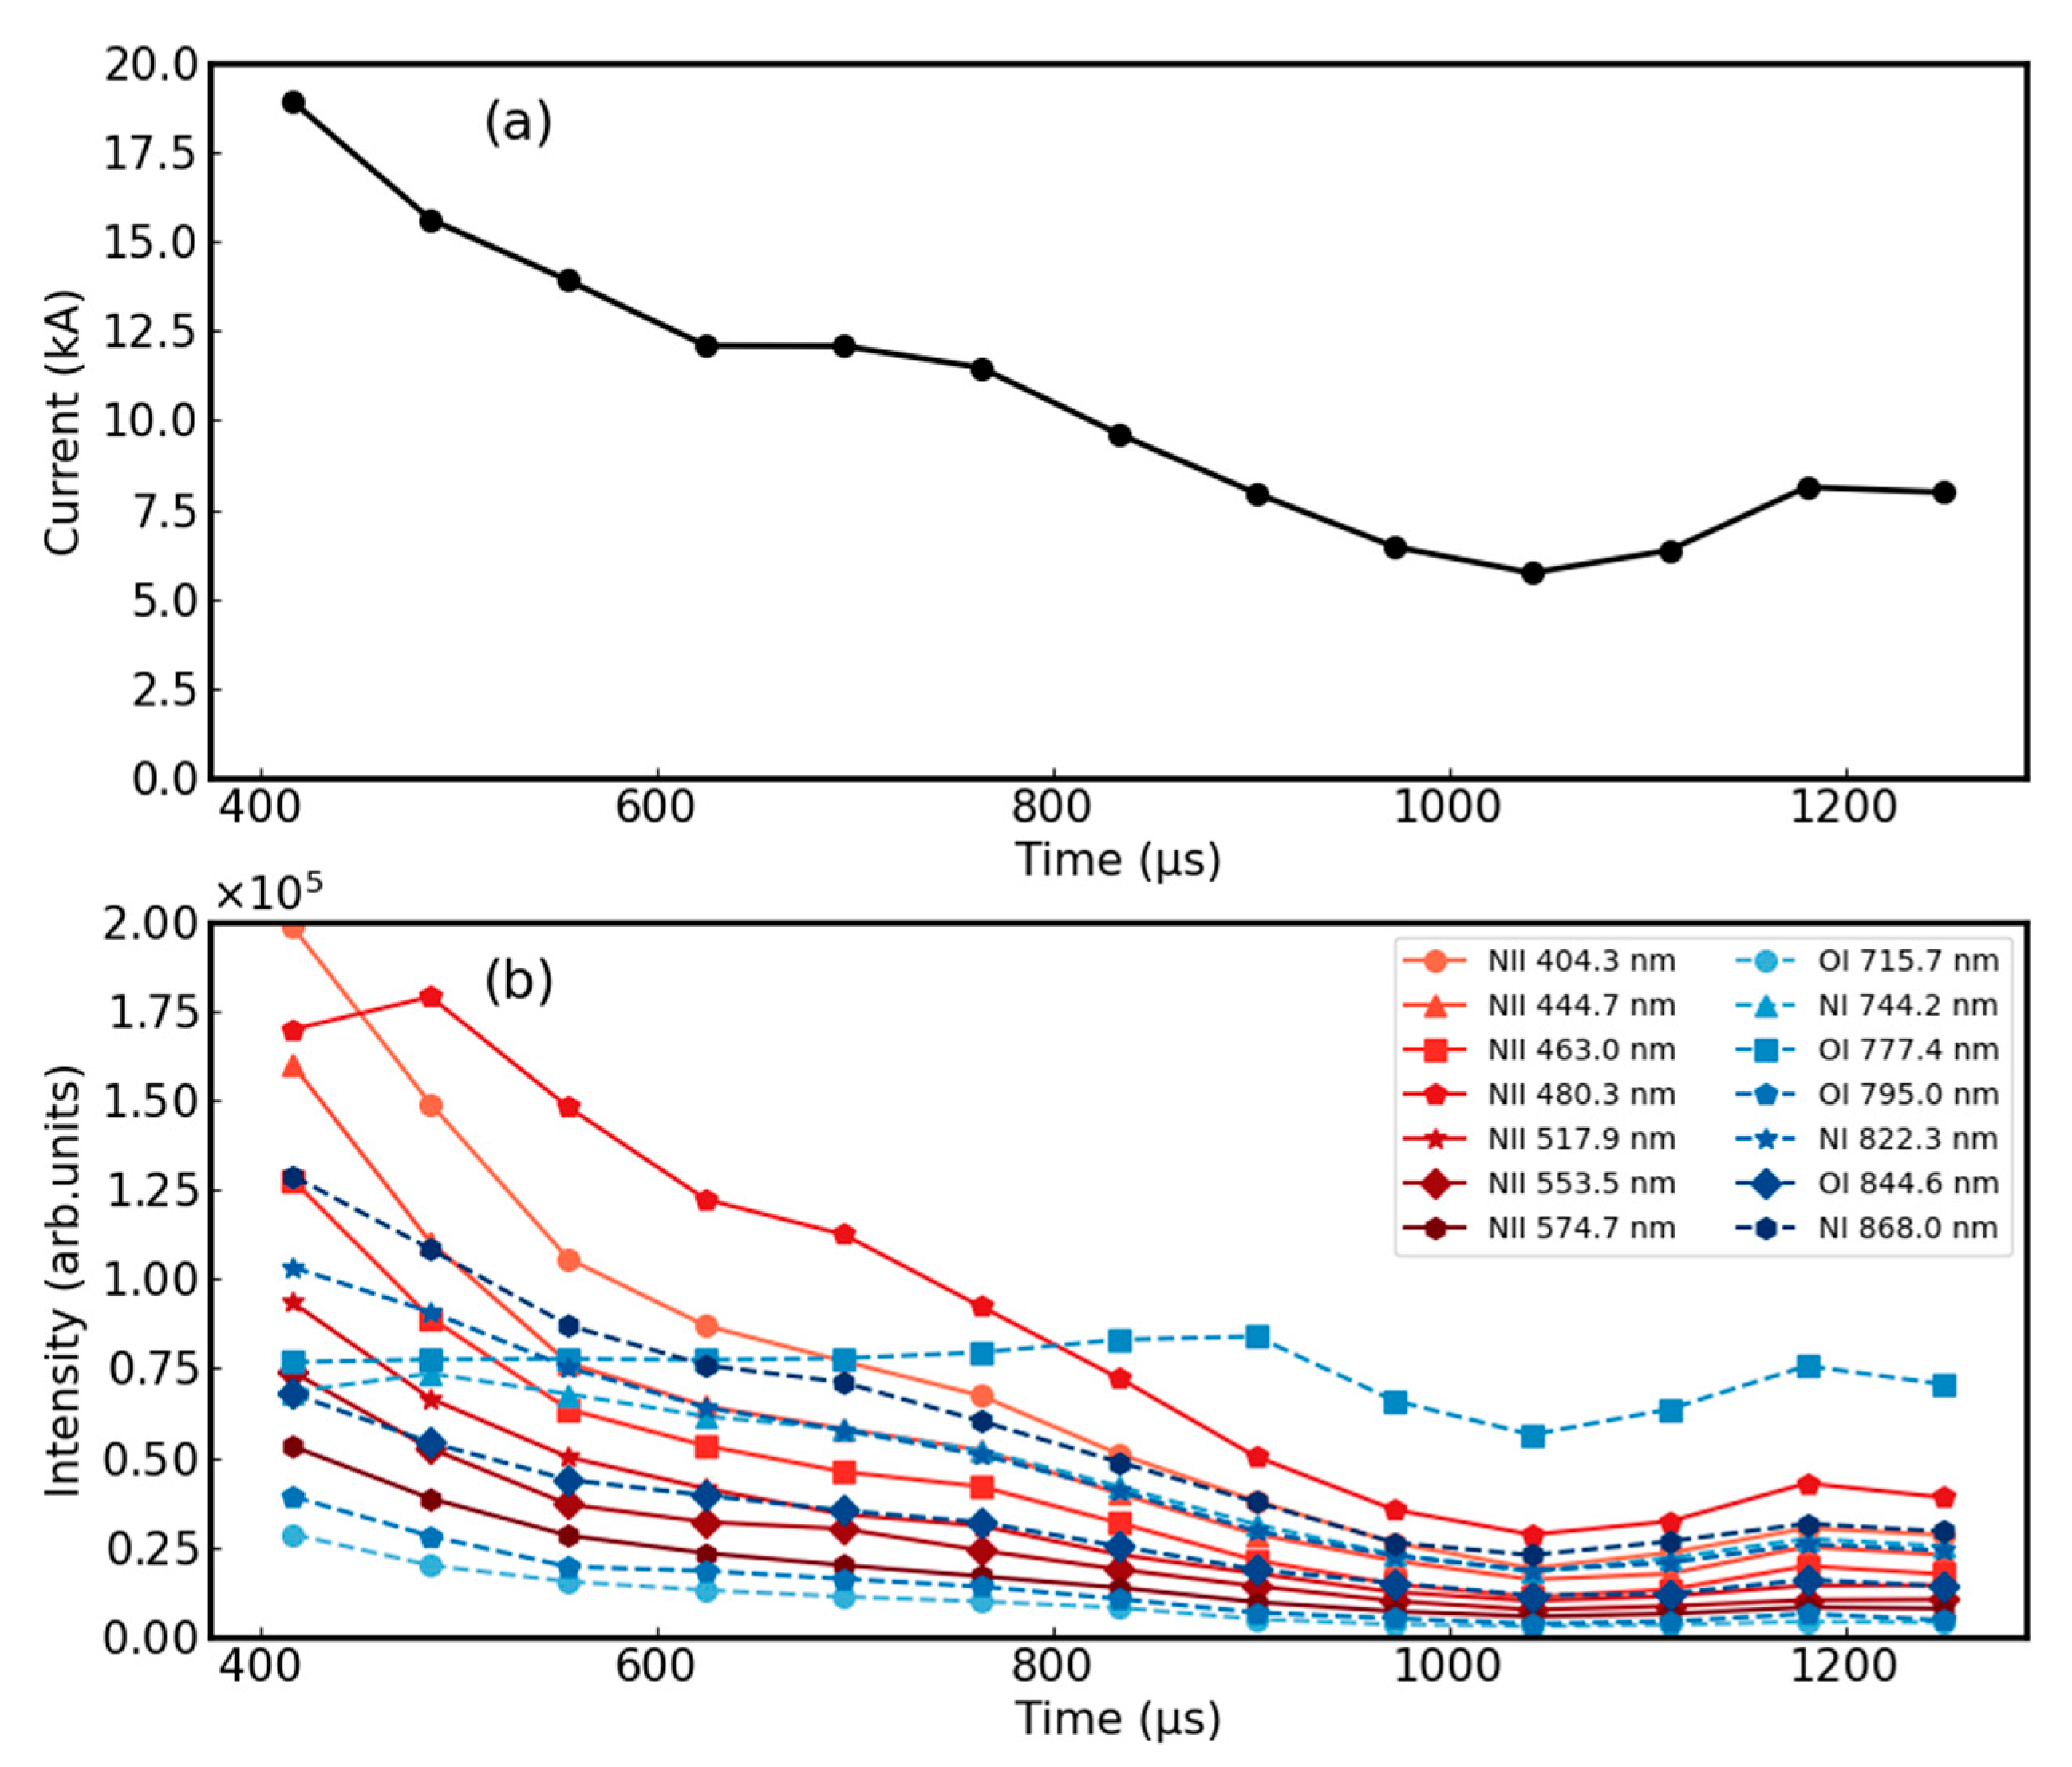
3.3. Correlation between Current and Spectral Lines Intensities
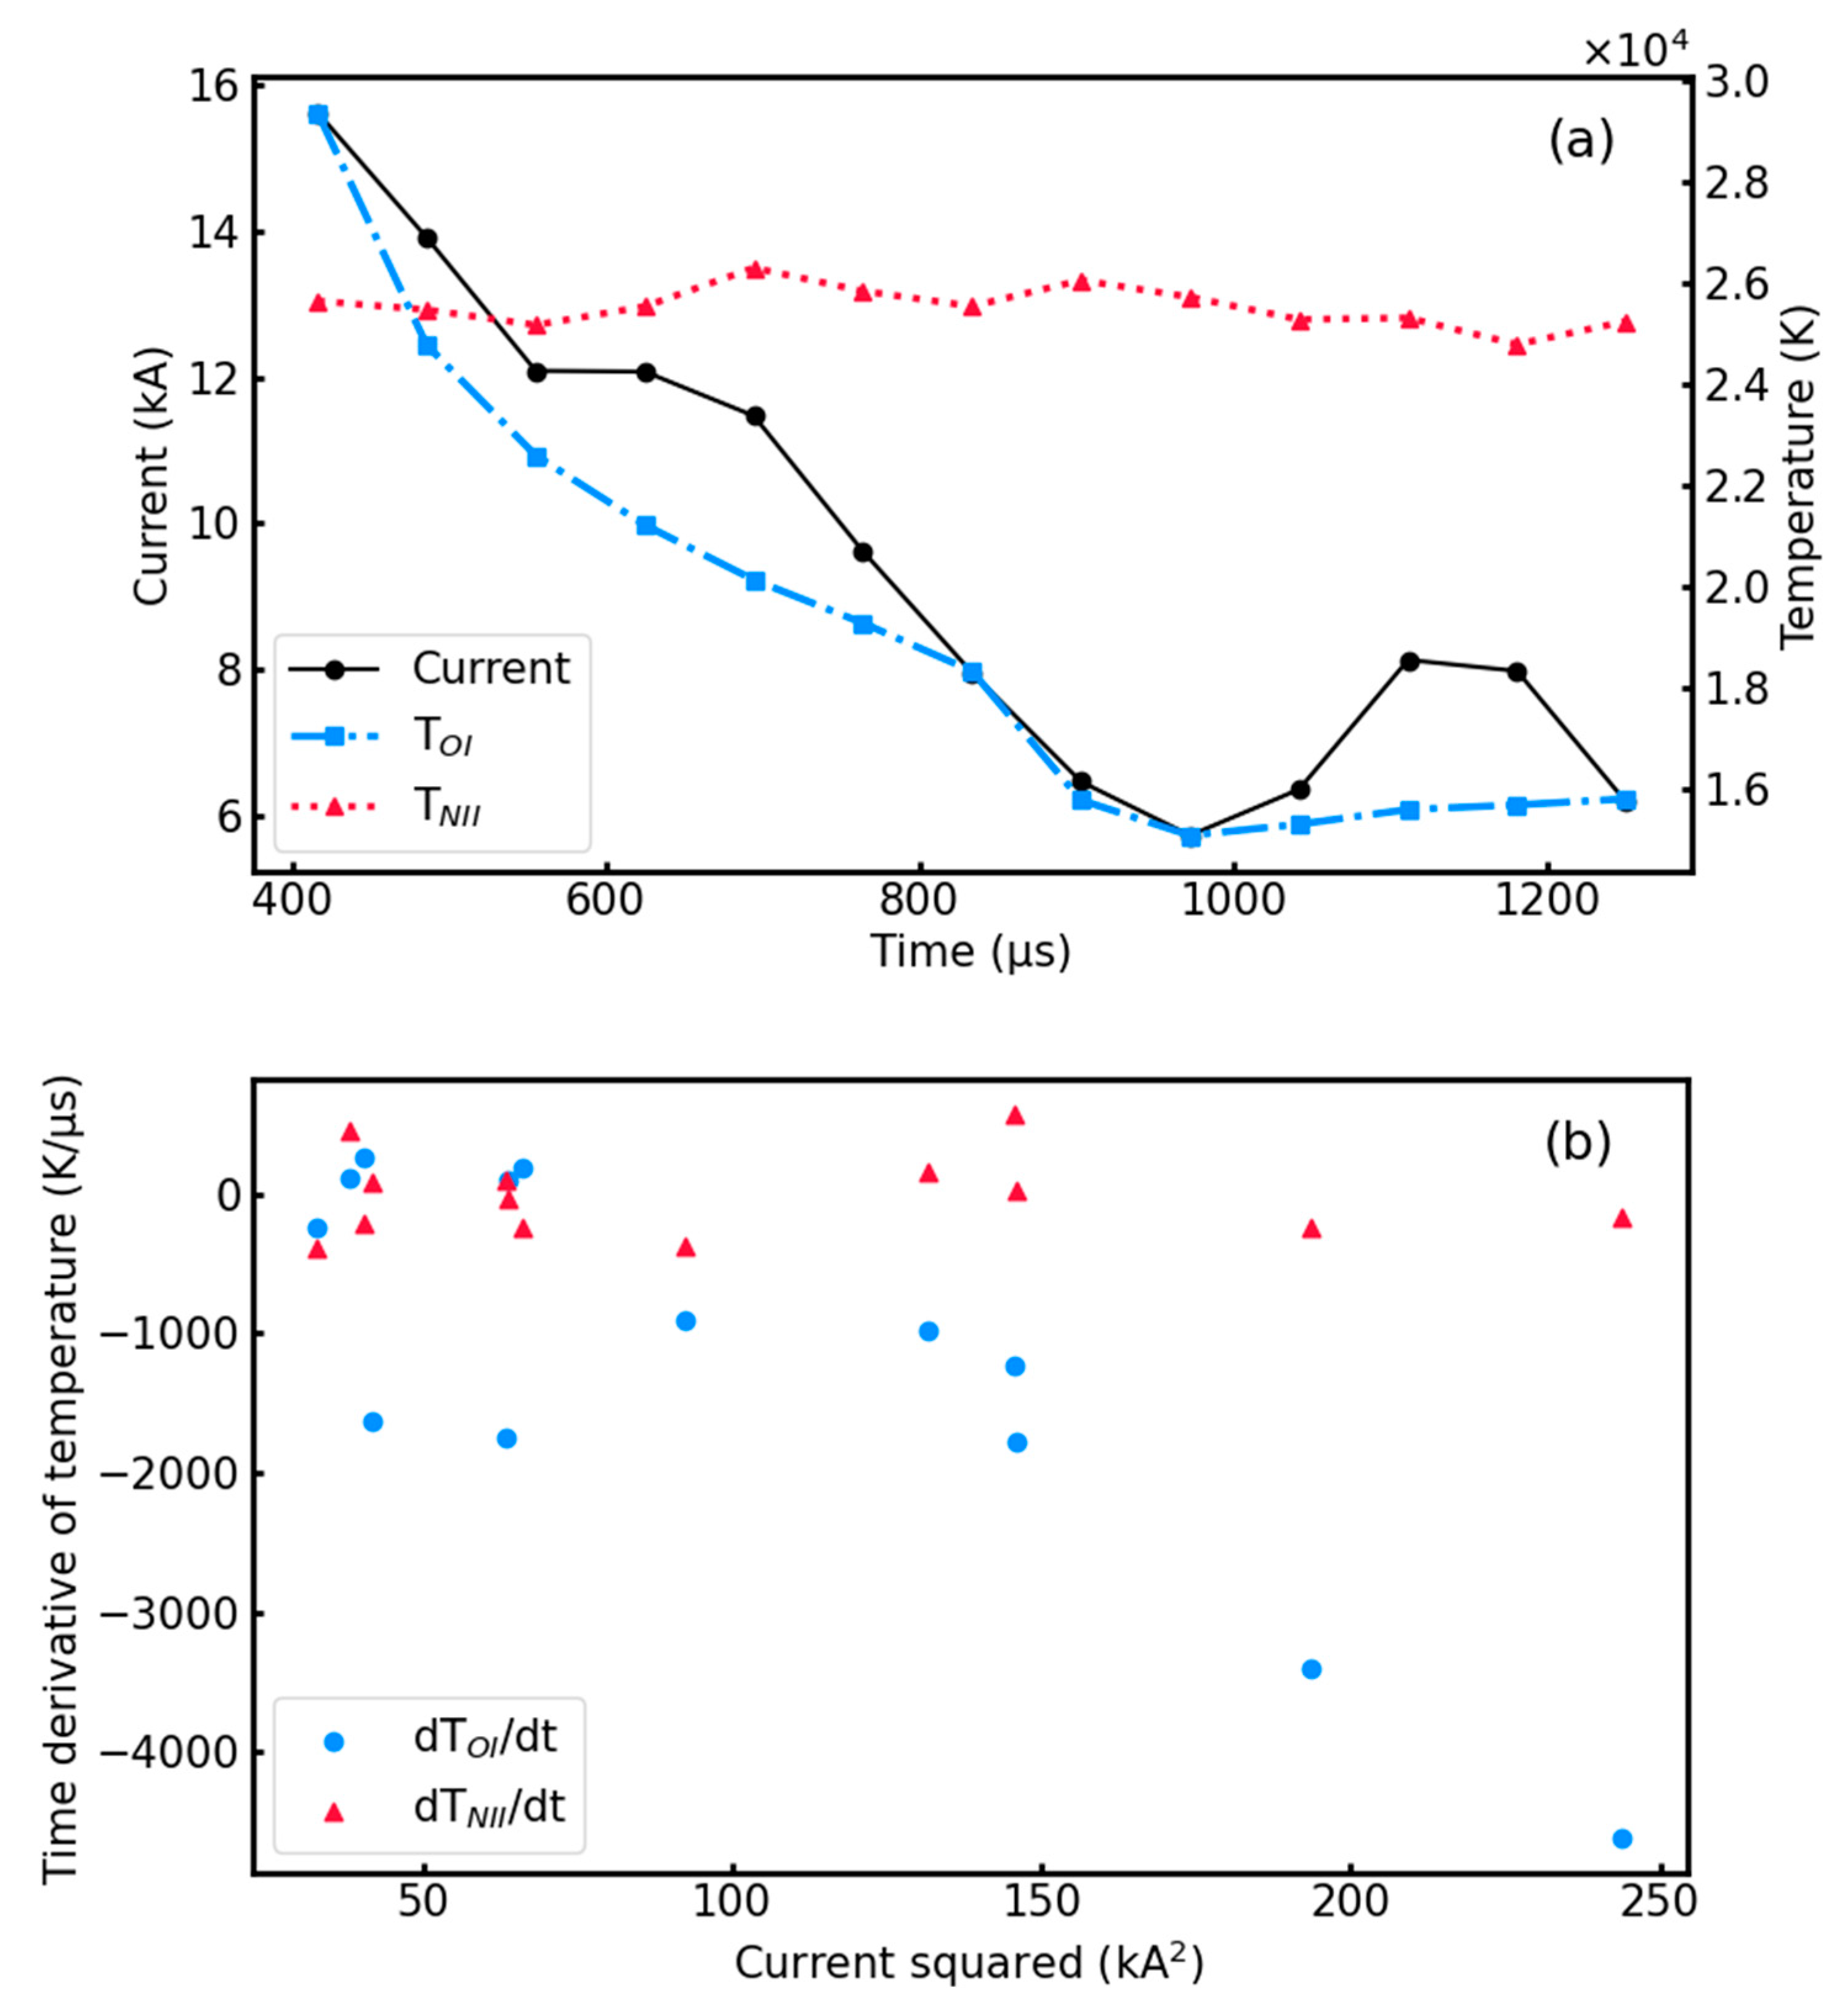
3.4. Channel Temperature
4. Discussion
5. Summary
Author Contributions
Funding
Data Availability Statement
Acknowledgments
Conflicts of Interest
References
- Flowers, J.W. The Channel of the Spark Discharge. Phys. Rev. 1943, 64, 225–235. [Google Scholar] [CrossRef]
- Wang, D.; Takagi, N.; Watanabe, T.; Rakov, V.A.; Uman, M.A.; Rambo, K.J.; Stapleton, M.V. A Comparison of Channel-Base Currents and Optical Signals for Rocket-Triggered Lightning Strokes. Atmos. Res. 2005, 76, 412–422. [Google Scholar] [CrossRef]
- Zhou, M.; Wang, D.; Wang, J.; Takagi, N.; Gamerota, W.R.; Uman, M.A.; Jordan, D.M.; Pilkey, J.T.; Ngin, T. Correlation between the Channel-Bottom Light Intensity and Channel-Base Current of a Rocket-Triggered Lightning Flash. J. Geophys. Res. Atmos. 2014, 119, 13457–13473. [Google Scholar] [CrossRef]
- Qu, H.; Yuan, P.; Zhang, T.; Chang, Z. Analysis on the Correlation between Temperature and Discharge Characteristic of Cloud-to-Ground Lightning Discharge Plasma with Multiple Return Strokes. Phys. Plasmas 2011, 18, 013504. [Google Scholar] [CrossRef]
- Wang, X.; Yuan, P.; Cen, J.; Liu, G. Correlation between the Spectral Features and Electric Field Changes of Multiple Return Strokes in Negative Cloud-to-Ground Lightning. J. Geophys. Res. Atmos. 2017, 122, 4993–5002. [Google Scholar] [CrossRef]
- Fan, T.; Yuan, P.; Wang, X.; Cen, J.; Chang, X.; Zhao, Y. The Evolution of Discharge Current and Channel Radius in Cloud-to-Ground Lightning Return Stroke Process. Atmos. Res. 2017, 194, 226–234. [Google Scholar] [CrossRef]
- Newman, M.M.; Stahmann, J.R.; Robb, J.D.; Lewis, E.A.; Martin, S.G.; Zinn, S.V. Triggered Lightning Strokes at Very Close Range. J. Geophys. Res. 1967, 72, 4761–4764. [Google Scholar] [CrossRef]
- Thottappillil, R.; Goldberg, J.D.; Rakov, V.A.; Uman, M.A.; Fisher, R.J.; Schnetzer, G.H. Properties of M Components from Currents Measured at Triggered Lightning Channel Base. J. Geophys. Res. Atmos. 1995, 100, 25711–25720. [Google Scholar] [CrossRef]
- Schoene, J.; Uman, M.A.; Rakov, V.A.; Rambo, K.J.; Jerauld, J.; Mata, C.T.; Mata, A.G.; Jordan, D.M.; Schnetzer, G.H. Characterization of Return-Stroke Currents in Rocket-Triggered Lightning. J. Geophys. Res. 2009, 114, D03106. [Google Scholar] [CrossRef]
- Walker, T.D.; Christian, H.J. Triggered Lightning Spectroscopy: 2. A Quantitative Analysis. J. Geophys. Res. Atmos. 2019, 124, 3930–3942. [Google Scholar] [CrossRef]
- Diendorfer, G.; Mair, M.; Schulz, W. Detailed Brightness versus Lightning Current Amplitude Correlation of Flashes to the Gaisberg Tower. In Proceedings of the 26th International Conference on Lightning Proection (ICLP 2002), Cracow, Poland, 2–6 September 2002; pp. 8–13. [Google Scholar]
- Hussein, A.M.; Janischewskyj, W.; Milewski, M.; Shostak, V.; Chisholm, W.; Chang, J.S. Current Waveform Parameters of CN Tower Lightning Return Strokes. J. Electrost. 2004, 60, 149–162. [Google Scholar] [CrossRef]
- Miki, T.; Saito, M.; Shindo, T.; Ishii, M. Current Observation Results of Downward Negative Flashes at Tokyo Skytree from 2012 to 2018. IEEE Trans. Electromagn. Compat. 2019, 61, 663–673. [Google Scholar] [CrossRef]
- Chen, L.; Lyu, W.; Ma, Y.; Qi, Q.; Wu, B.; Zhang, Y.; Yin, Q.; Liu, H.; Zhang, Y.; Chen, S.; et al. Return-Stroke Current Measurement at the Canton Tower and Preliminary Analysis Results. Electr. Power Syst. Res. 2022, 206, 107798. [Google Scholar] [CrossRef]
- Lu, W.; Chen, L.; Ma, Y.; Rakov, V.A.; Gao, Y.; Zhang, Y.; Yin, Q.; Zhang, Y. Lightning Attachment Process Involving Connection of the Downward Negative Leader to the Lateral Surface of the Upward Connecting Leader. Geophys. Res. Lett. 2013, 40, 5531–5535. [Google Scholar] [CrossRef]
- Prueitt, M.L. The Excitation Temperature of Lightning. J. Geophys. Res. 1963, 68, 803–811. [Google Scholar] [CrossRef]
- Uman, M.A. The Peak Temperature of Lightning. J. Atmos. Terr. Phys. 1964, 26, 123–128. [Google Scholar] [CrossRef]
- Orville, R.E. A High-Speed Time-Resolved Spectroscopic Study of the Lightning Return Stroke: Part II. A Quantitative Analysis. J. Atmos. Sci. 1968, 25, 839–851. [Google Scholar] [CrossRef]
- Uman, M.A. Quantitative Lightning Spectroscopy. IEEE Spectr. 1966, 3, 102–110. [Google Scholar] [CrossRef]
- Uman, M.A. Determination of Lightning Temperature. J. Geophys. Res. 1969, 74, 949–957. [Google Scholar] [CrossRef]
- Wang, J.; Yuan, P.; Guo, F.; Qie, X.; Ouyang, Y.; Zhang, Y. The Spectra and Temperature of Cloud Lightning Discharge Channel. Sci. China Ser. Earth Sci. 2009, 52, 907–912. [Google Scholar] [CrossRef]
- Walker, T.D.; Christian, H.J. Triggered Lightning Spectroscopy: Part 1. A Qualitative Analysis. J. Geophys. Res. Atmos. 2017, 122, 8000–8011. [Google Scholar] [CrossRef]
- Zhao, J.; Yuan, P.; Cen, J.; Liu, J.; Wang, J.; Zhang, G. Characteristics and Applications of Near-Infrared Emissions from Lightning. J. Appl. Phys. 2013, 114, 163303. [Google Scholar] [CrossRef]
- Zhang, H.; Yuan, P.; Yang, S.; Hao, X.; Niu, Y. Radiation Evolution Characteristic of Lightning Discharge Channel. Acta Photonica Sin. 2010, 39, 998–1003. [Google Scholar] [CrossRef]
- Cvetic, J.; Heidler, F.; Markovic, S.; Radosavljevic, R.; Osmokrovic, P. Dynamics of a Lightning Corona Sheath—A Constant Field Approach Using the Generalized Traveling Current Source Return Stroke Model. Atmos. Res. 2012, 117, 122–131. [Google Scholar] [CrossRef]
- Maslowski, G.; Rakov, V.A. A Study of the Lightning Channel Corona Sheath. J. Geophys. Res. 2006, 111, D14110. [Google Scholar] [CrossRef]
- Uman, M.A.; Orville, R.E. The Opacity of Lightning. J. Geophys. Res. 1965, 70, 5491–5497. [Google Scholar] [CrossRef]
- Orville, R.E. Spectrum of the Lightning Stepped Leader. J. Geophys. Res. 1968, 73, 6999–7008. [Google Scholar] [CrossRef]
- Orville, R.E. A High-Speed Time-Resolved Spectroscopic Study of the Lightning Return Stroke: Part I. A Qualitative Analysis. J. Atmos. Sci. 1968, 25, 827–838. [Google Scholar] [CrossRef]
- Maslowski, G.; Rakov, V.A. Review of Recent Developments in Lightning Channel Corona Sheath Research. Atmos. Res. 2013, 129–130, 117–122. [Google Scholar] [CrossRef]
- Carvalho, F.L.; Uman, M.A.; Jordan, D.M.; Ngin, T. Lightning Current and Luminosity at and above Channel Bottom for Return Strokes and M-components. J. Geophys. Res. Atmos. 2015, 120, 10645–10663. [Google Scholar] [CrossRef]


Disclaimer/Publisher’s Note: The statements, opinions and data contained in all publications are solely those of the individual author(s) and contributor(s) and not of MDPI and/or the editor(s). MDPI and/or the editor(s) disclaim responsibility for any injury to people or property resulting from any ideas, methods, instructions or products referred to in the content. |
© 2023 by the authors. Licensee MDPI, Basel, Switzerland. This article is an open access article distributed under the terms and conditions of the Creative Commons Attribution (CC BY) license (https://creativecommons.org/licenses/by/4.0/).
Share and Cite
Xu, W.; Lyu, W.; Wang, X.; Chen, L.; Wu, B.; Qi, Q.; Ma, Y.; Hua, L. Correlation between the Channel Discharge Current and Spectrum of a Single-Stroke Lightning Flash to Canton Tower. Remote Sens. 2023, 15, 5746. https://doi.org/10.3390/rs15245746
Xu W, Lyu W, Wang X, Chen L, Wu B, Qi Q, Ma Y, Hua L. Correlation between the Channel Discharge Current and Spectrum of a Single-Stroke Lightning Flash to Canton Tower. Remote Sensing. 2023; 15(24):5746. https://doi.org/10.3390/rs15245746
Chicago/Turabian StyleXu, Weiqun, Weitao Lyu, Xuejuan Wang, Lyuwen Chen, Bin Wu, Qi Qi, Ying Ma, and Leyan Hua. 2023. "Correlation between the Channel Discharge Current and Spectrum of a Single-Stroke Lightning Flash to Canton Tower" Remote Sensing 15, no. 24: 5746. https://doi.org/10.3390/rs15245746