
Significant Location Accuracy Changes Resulting from Lightning Detection Networks Deployed on Inclined Terrains
 , , , and
Abstract
:
1. Introduction
2. Methodology
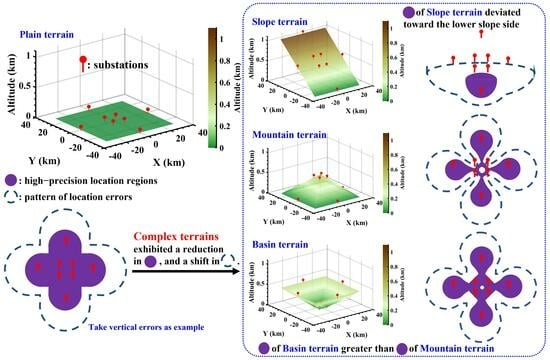
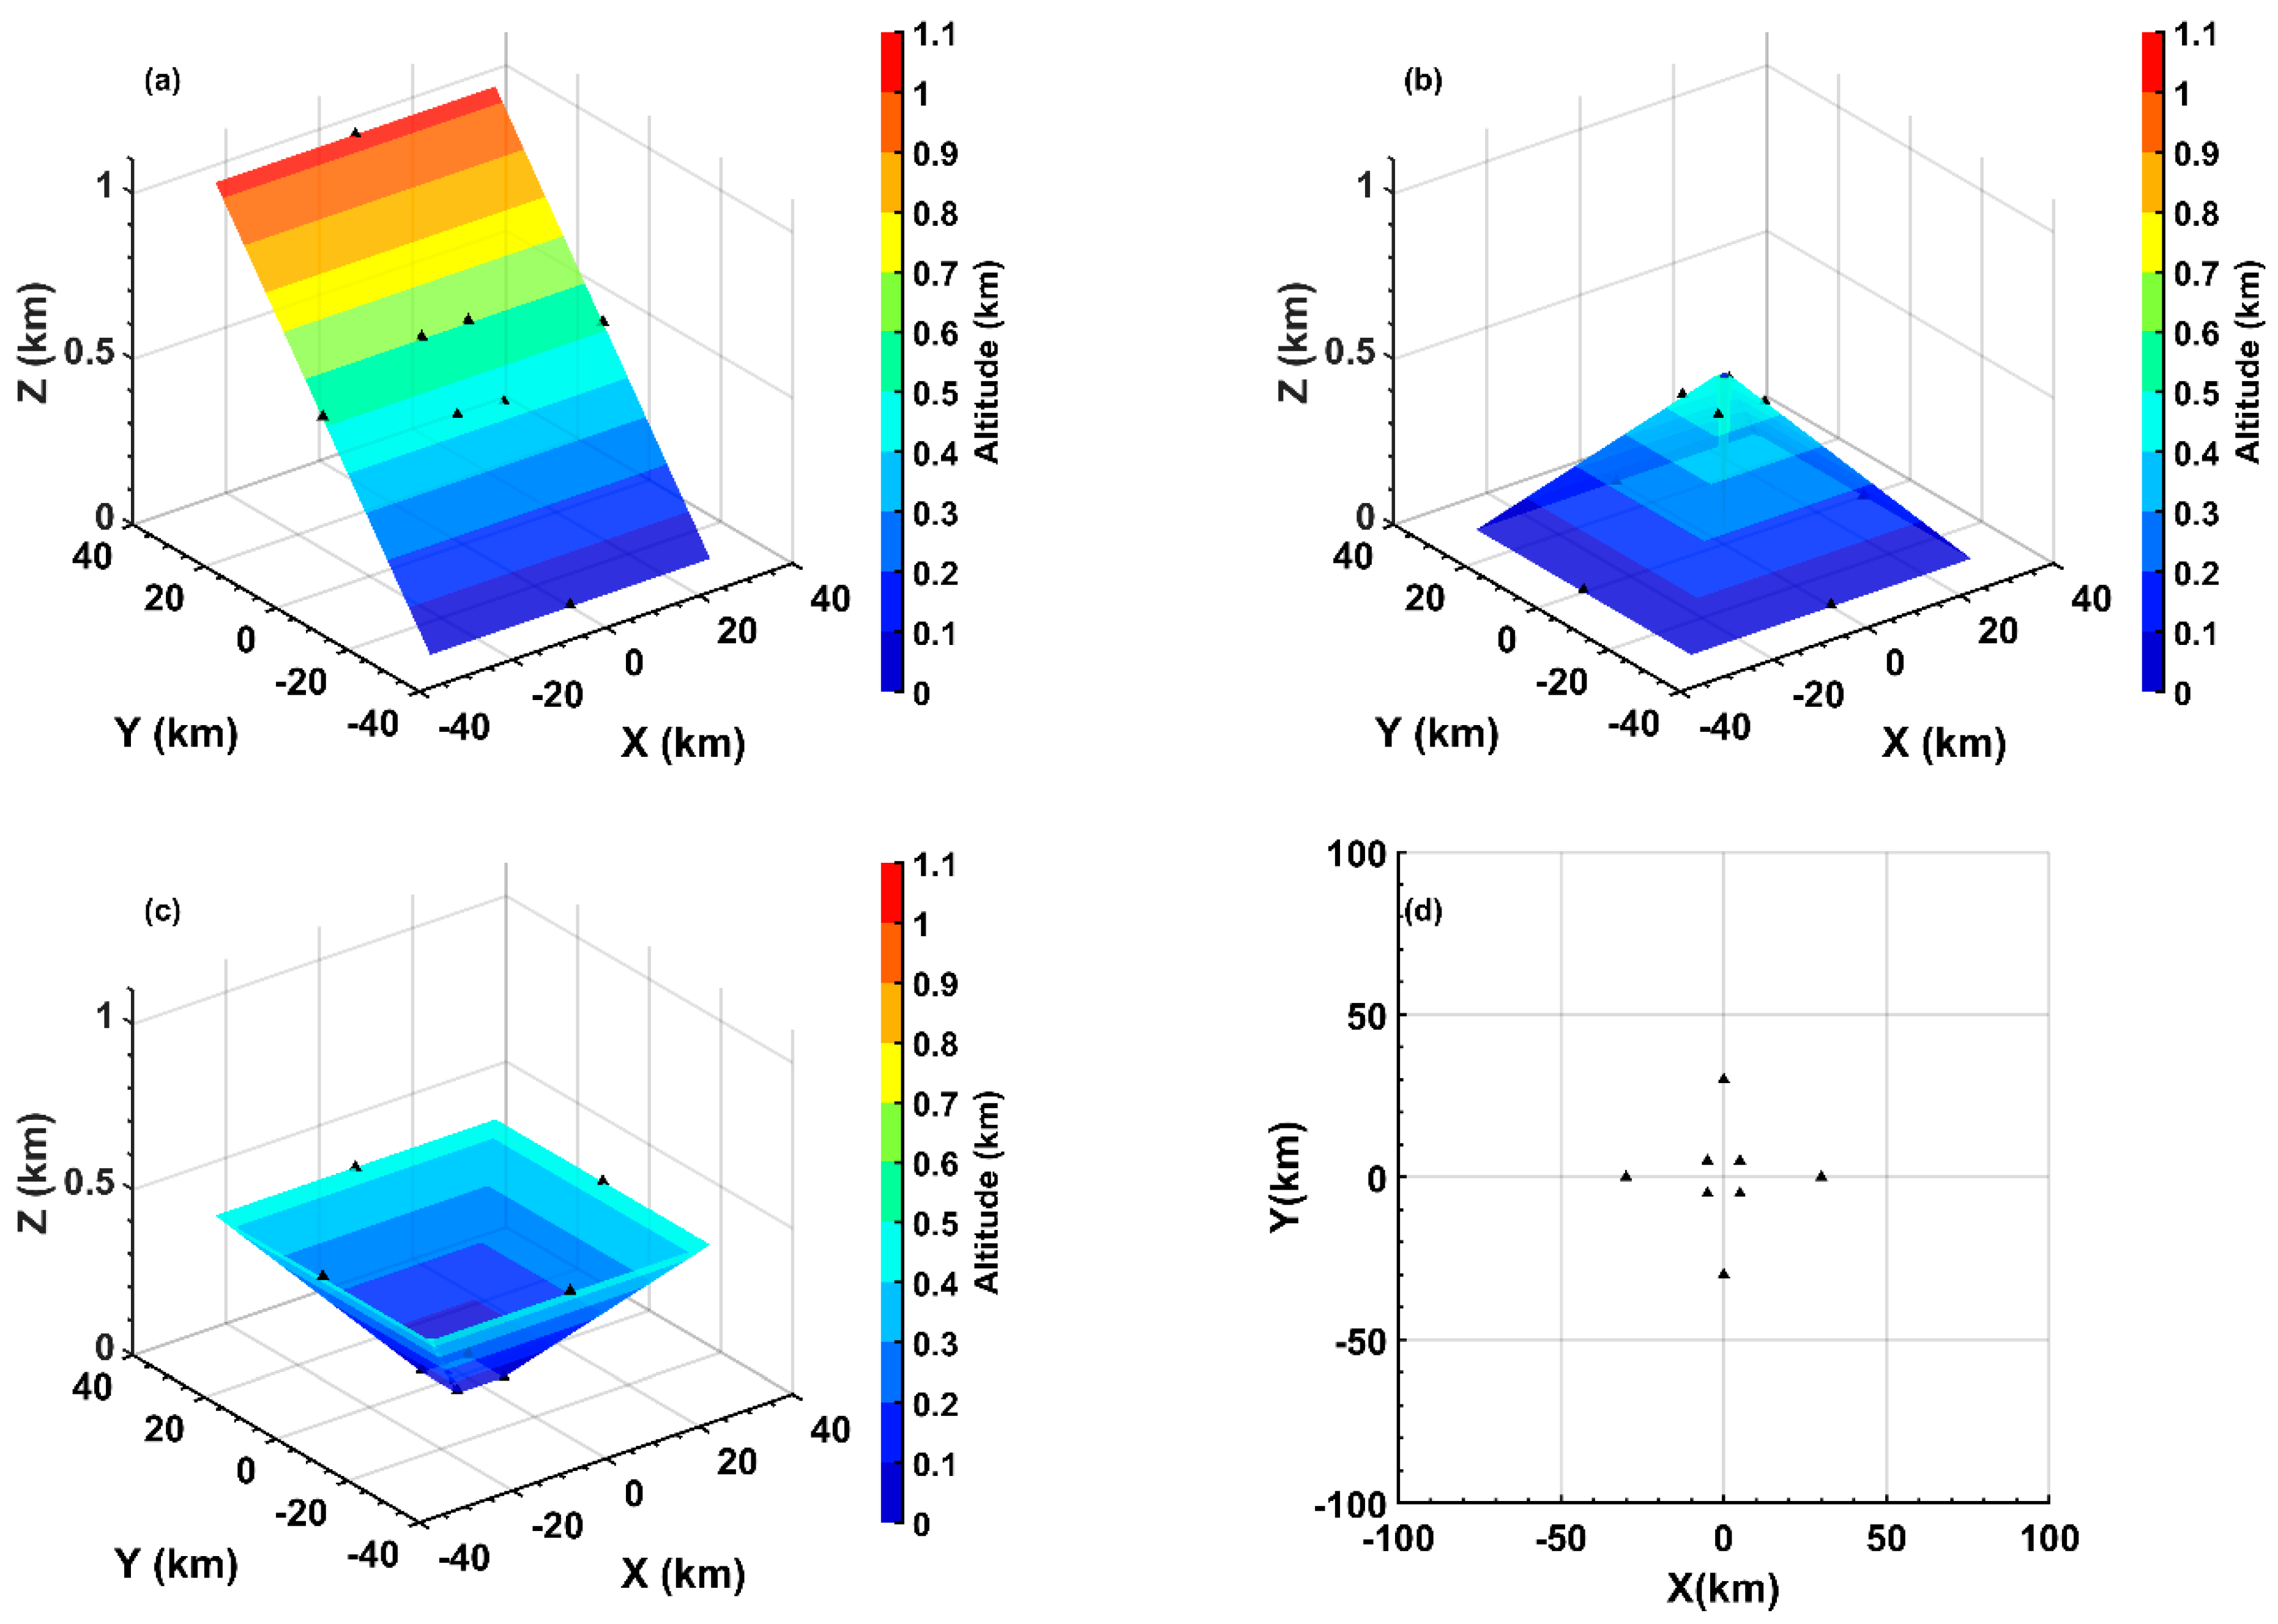
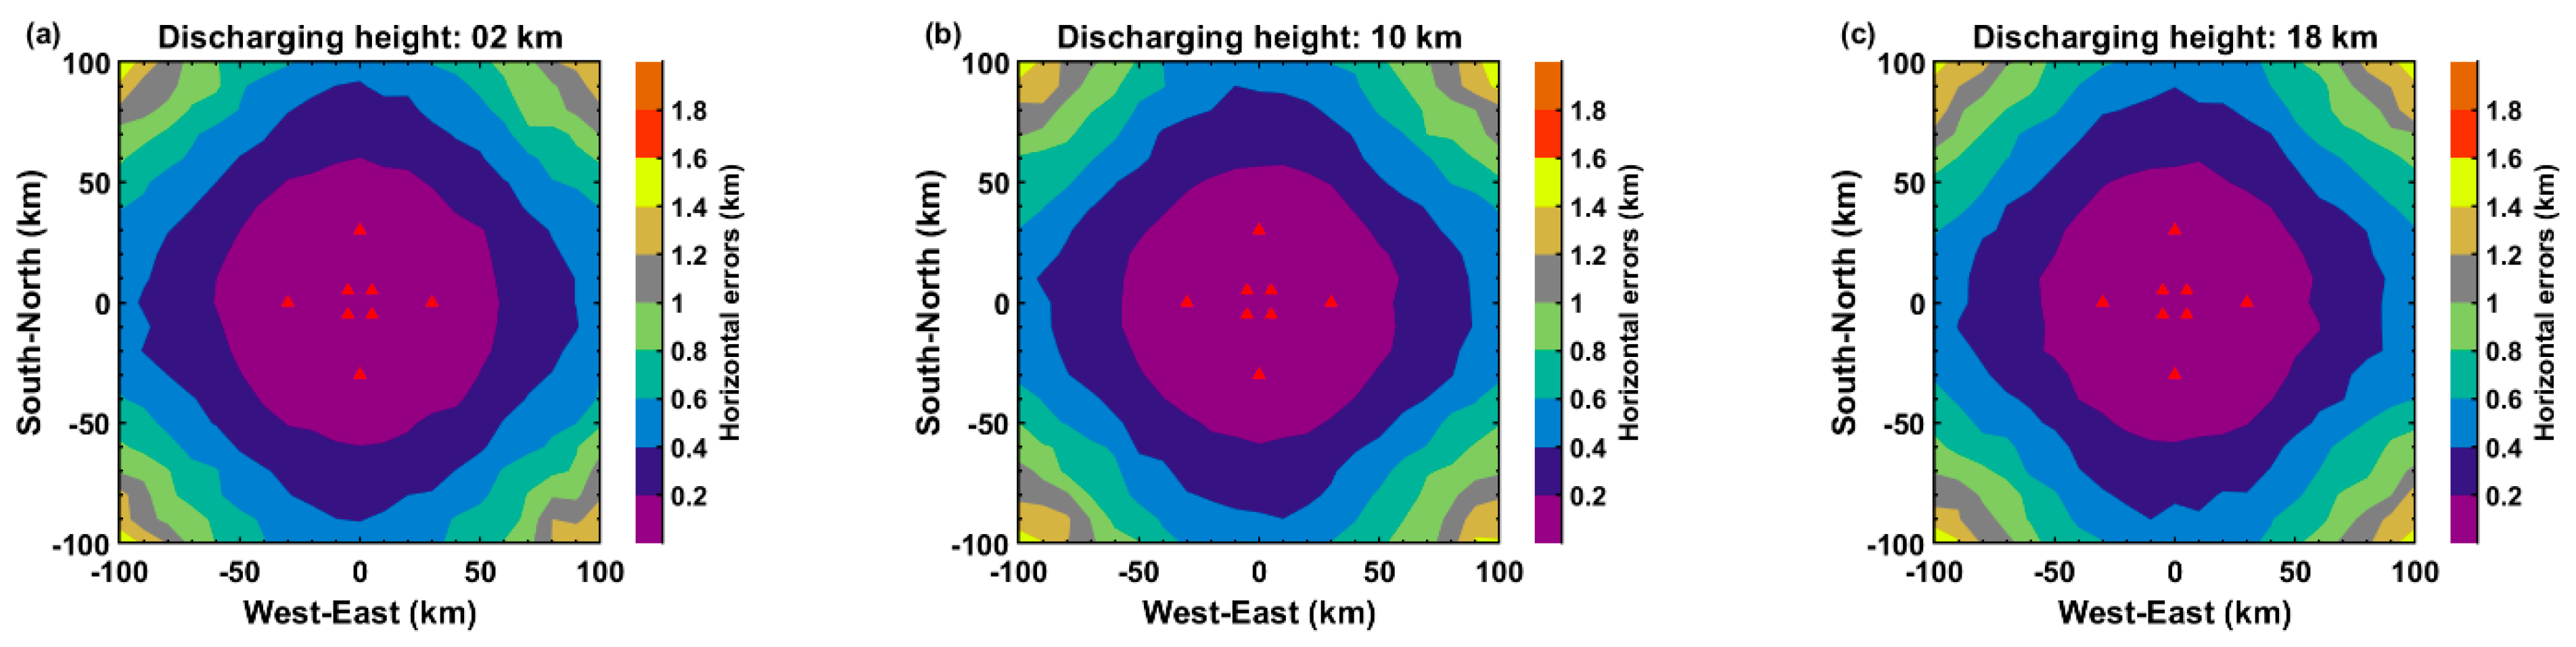
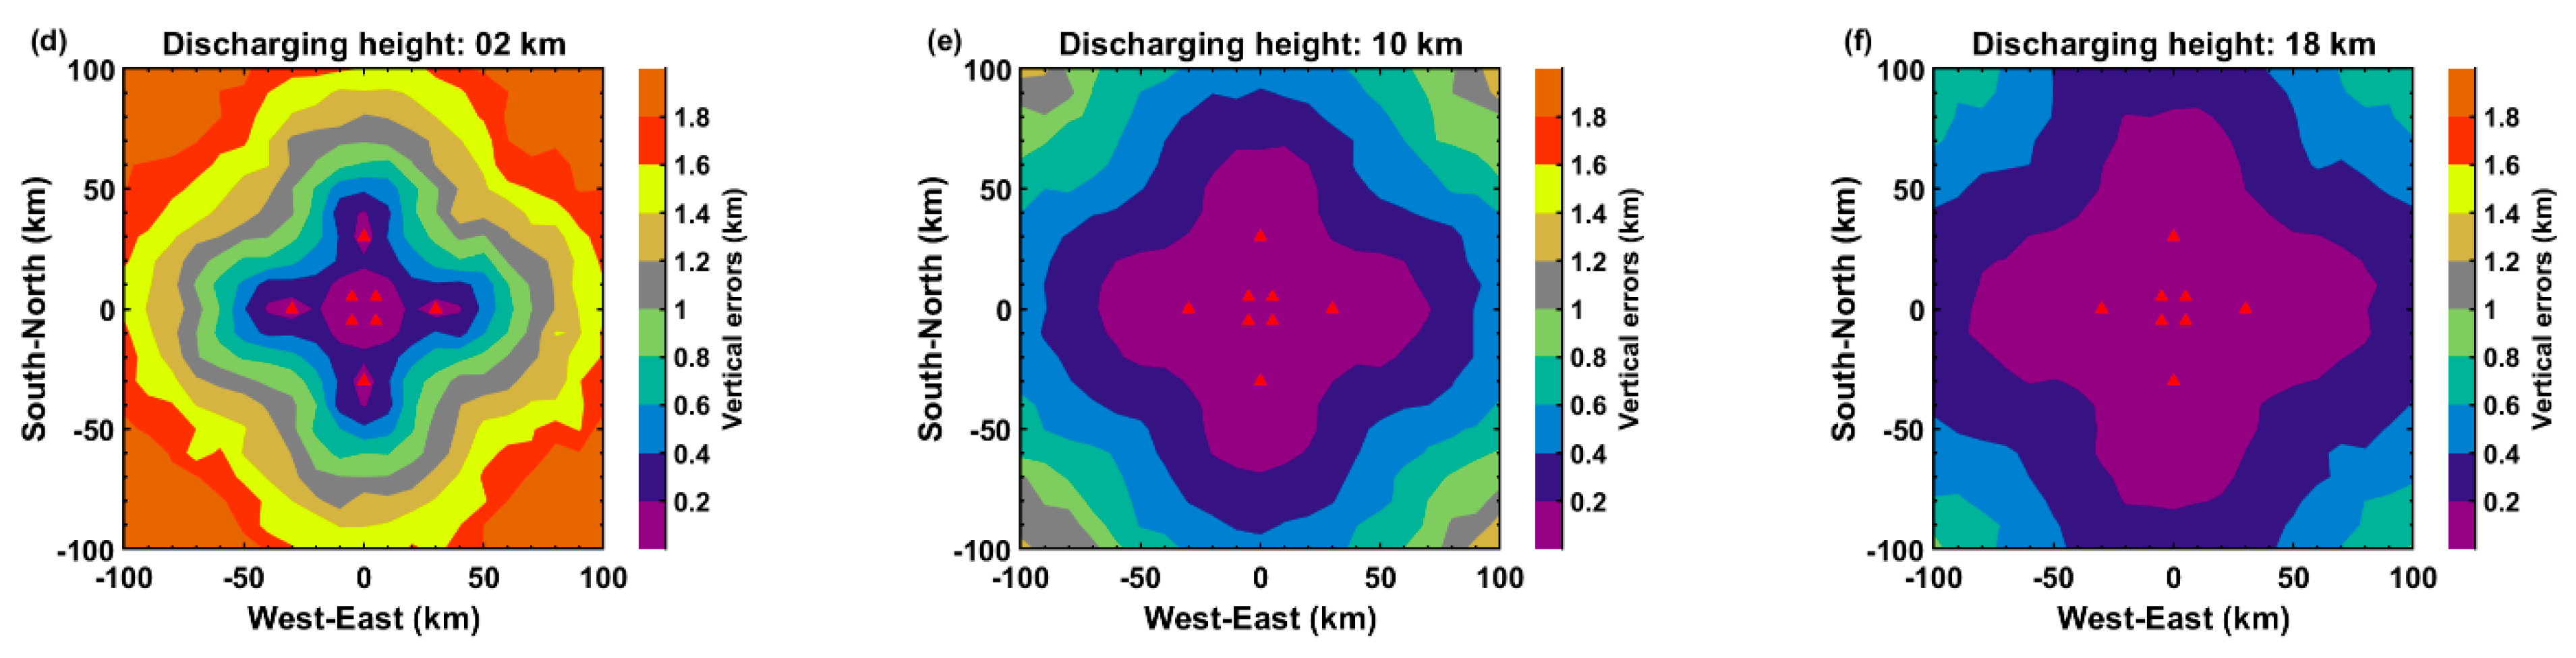
3. Results and Analysis
3.1. Spatial Distribution Pattern of Lightning Location Accuracy
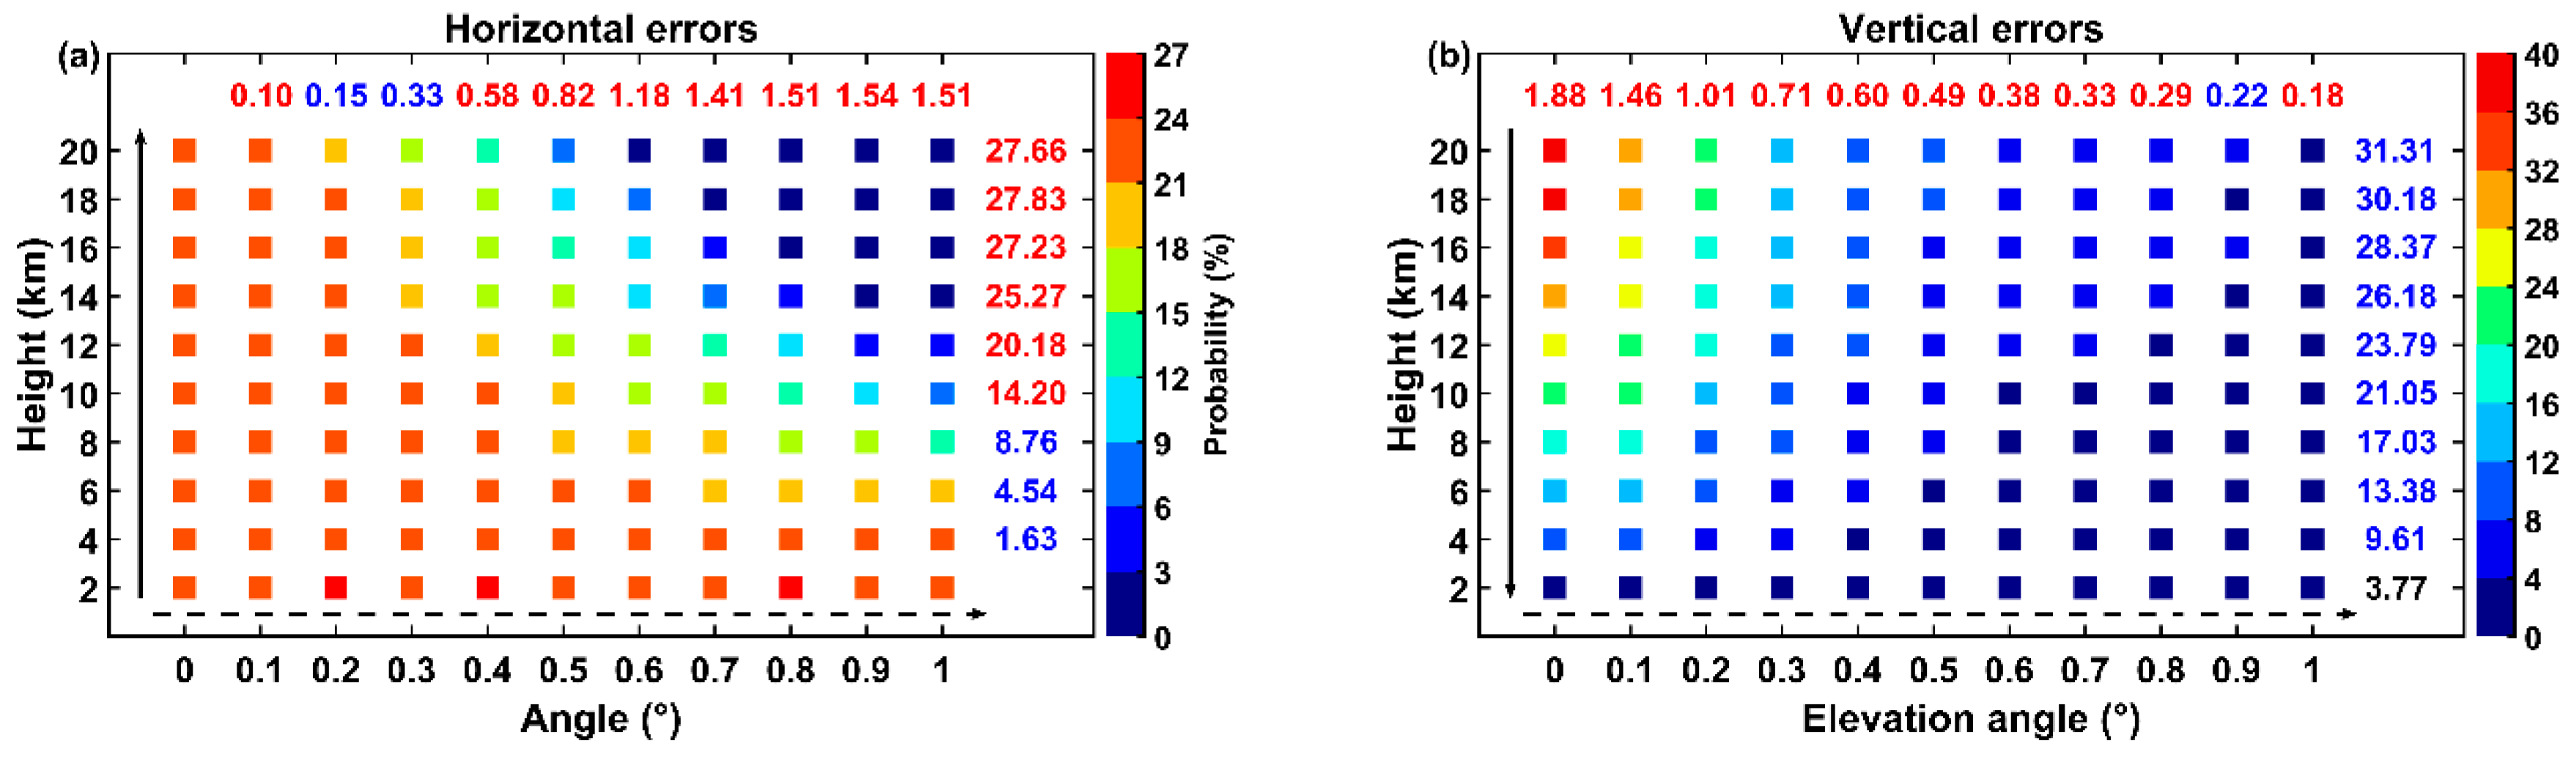
3.1.1. PT LDN
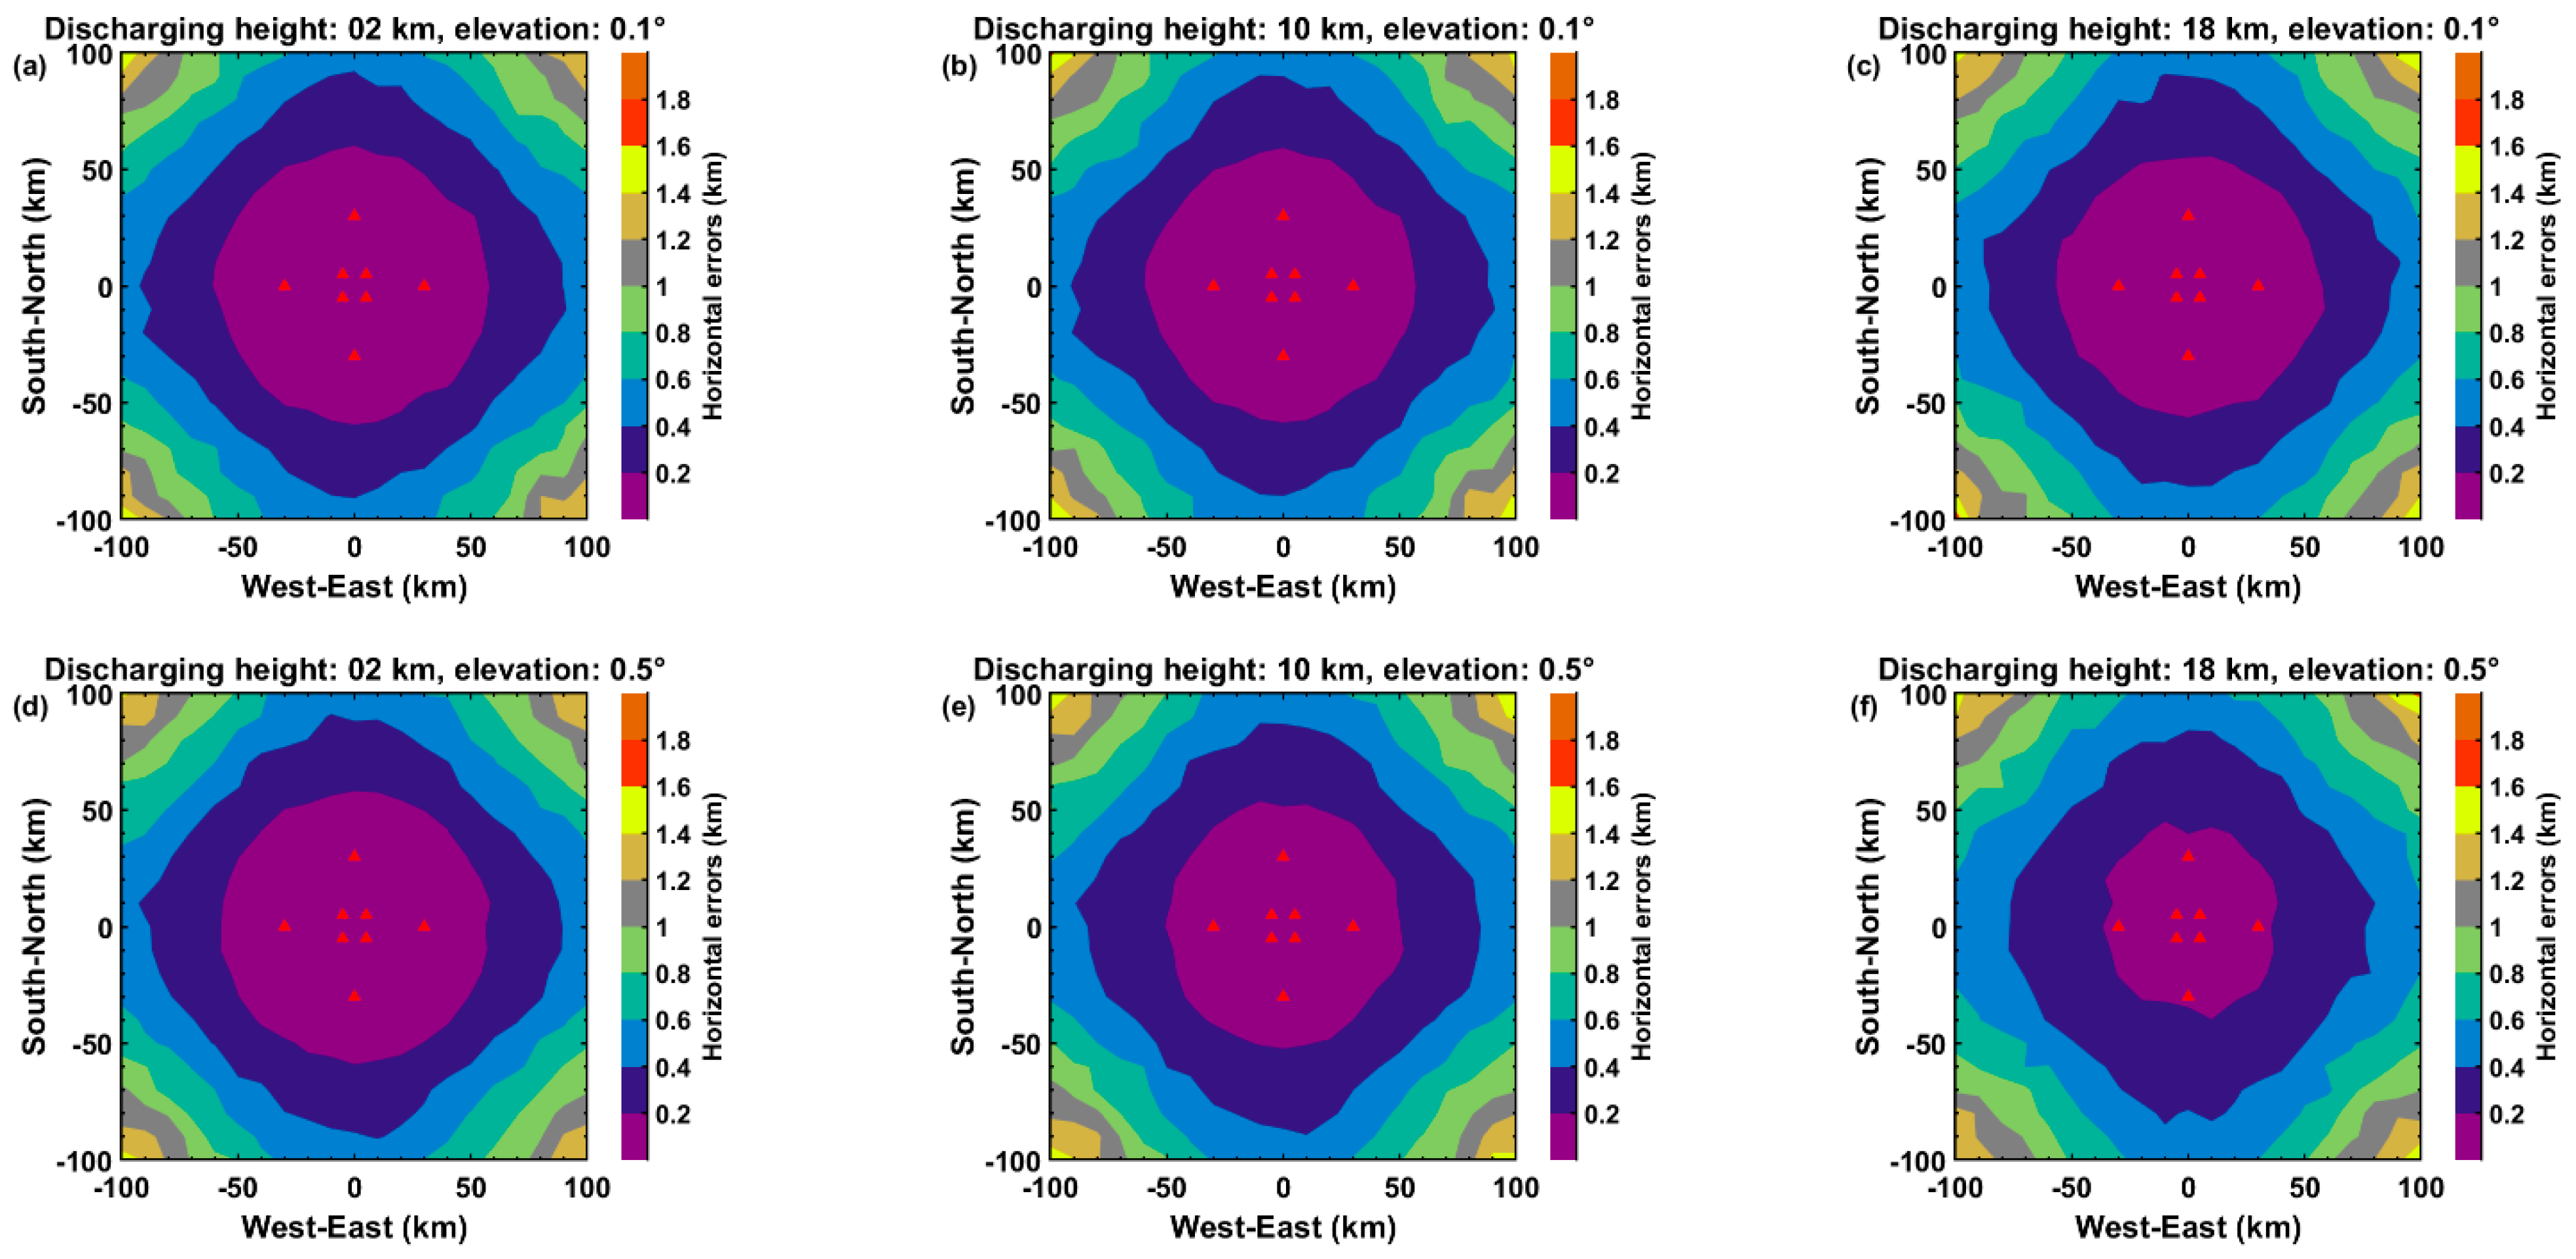
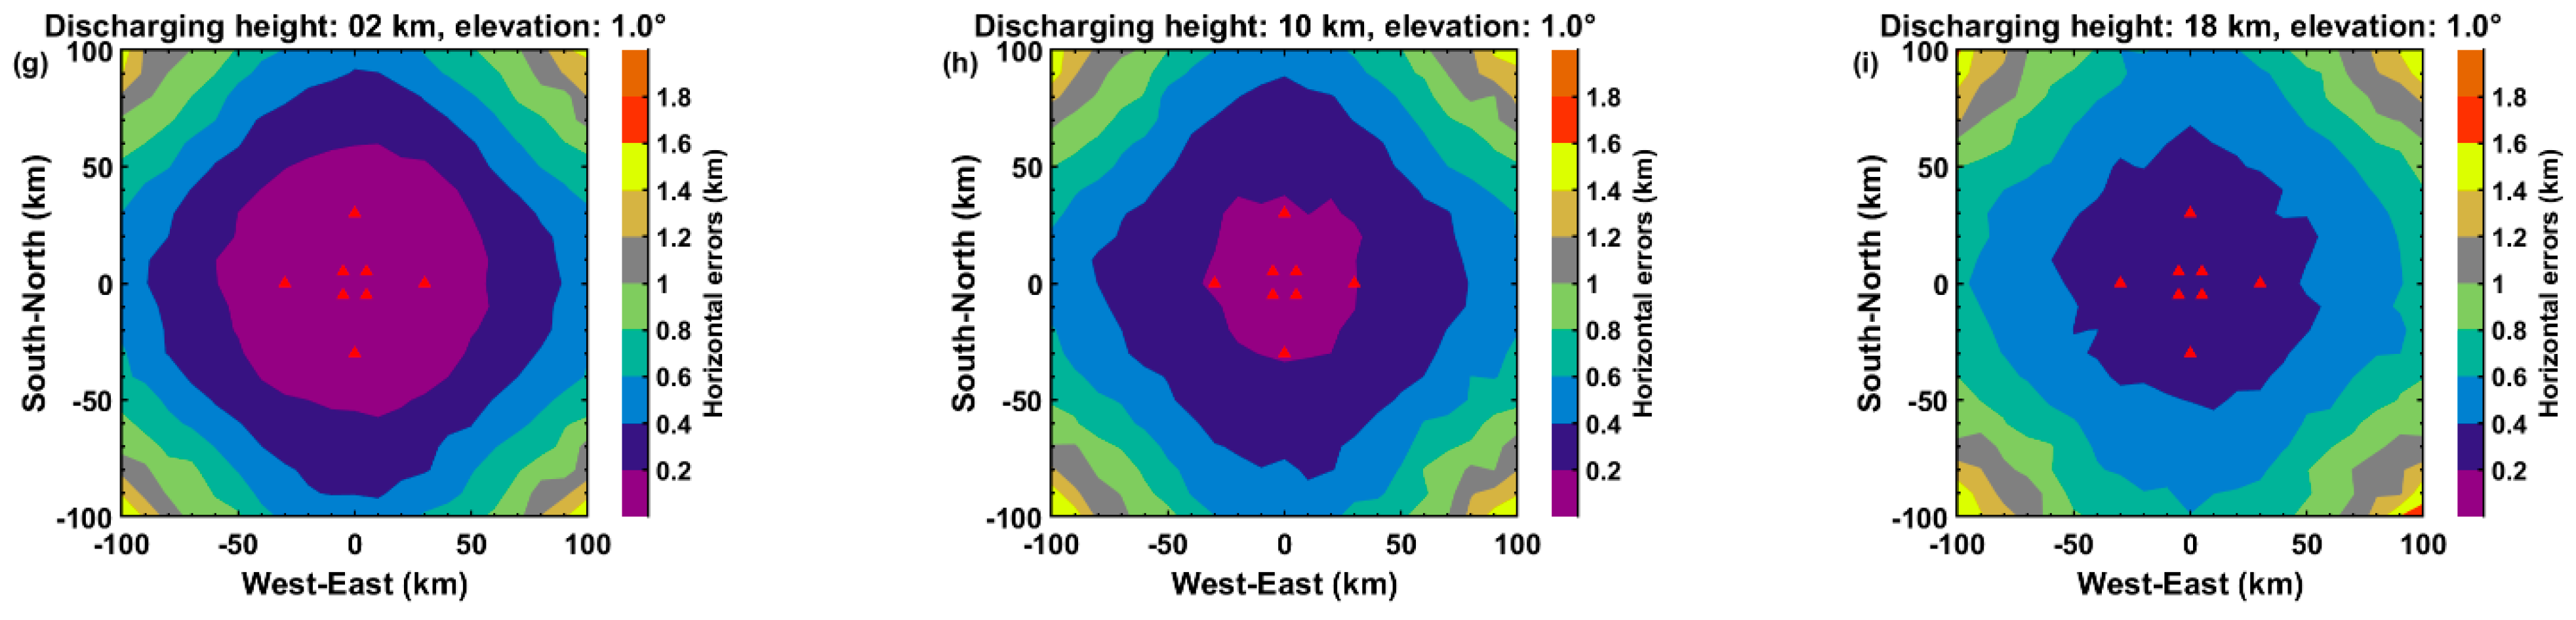
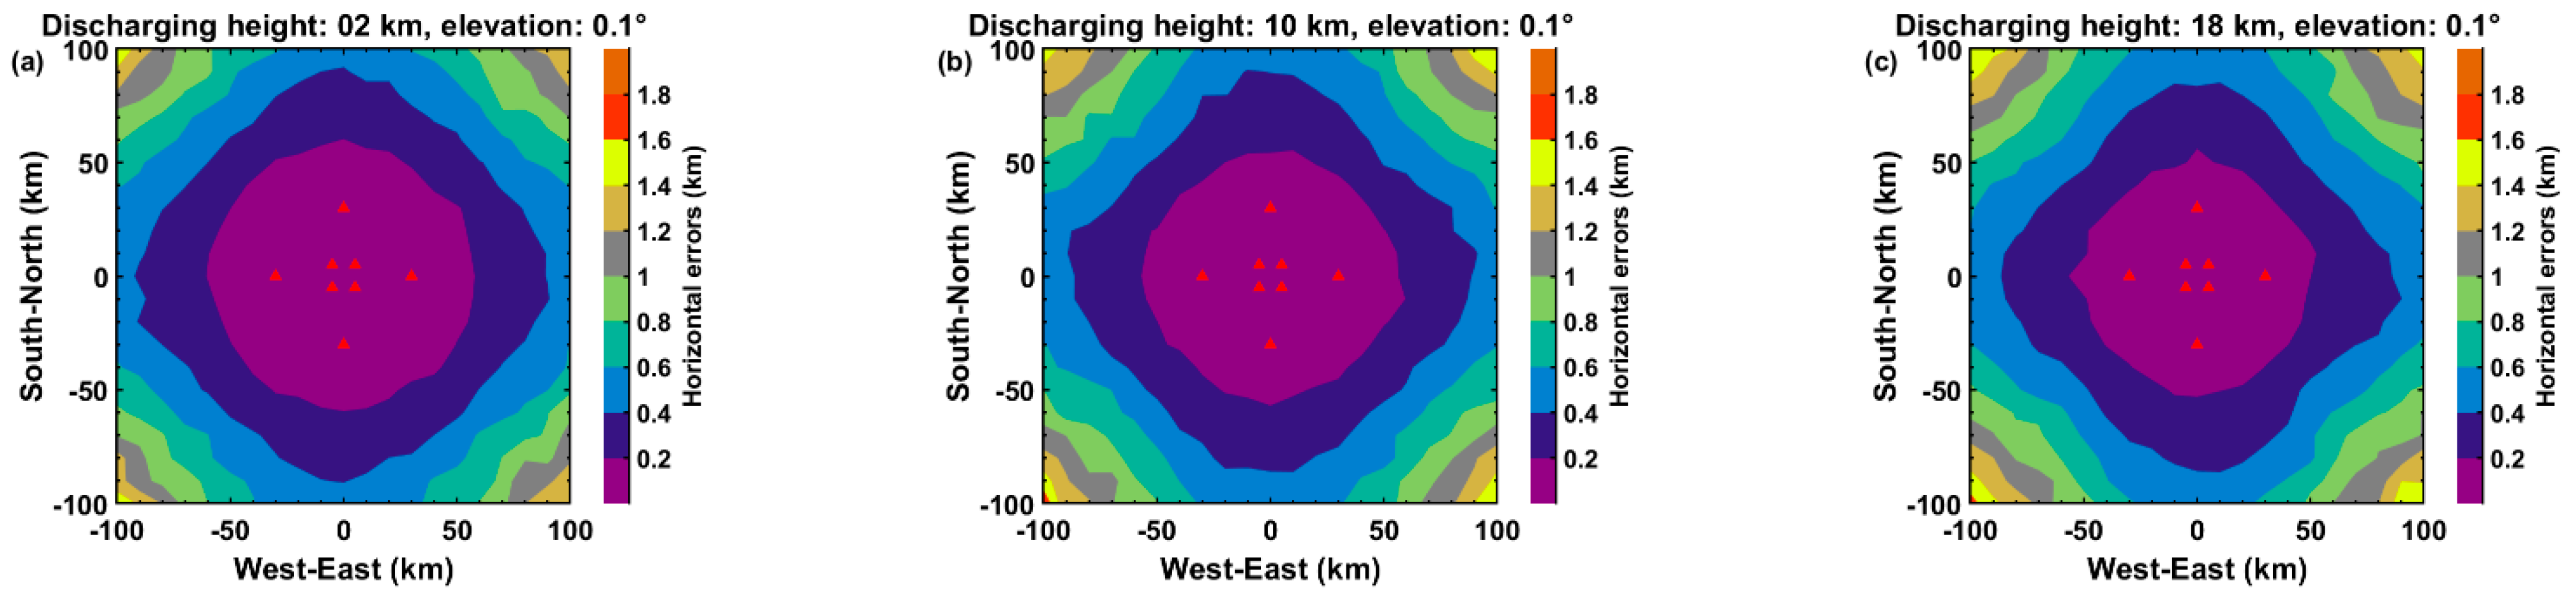
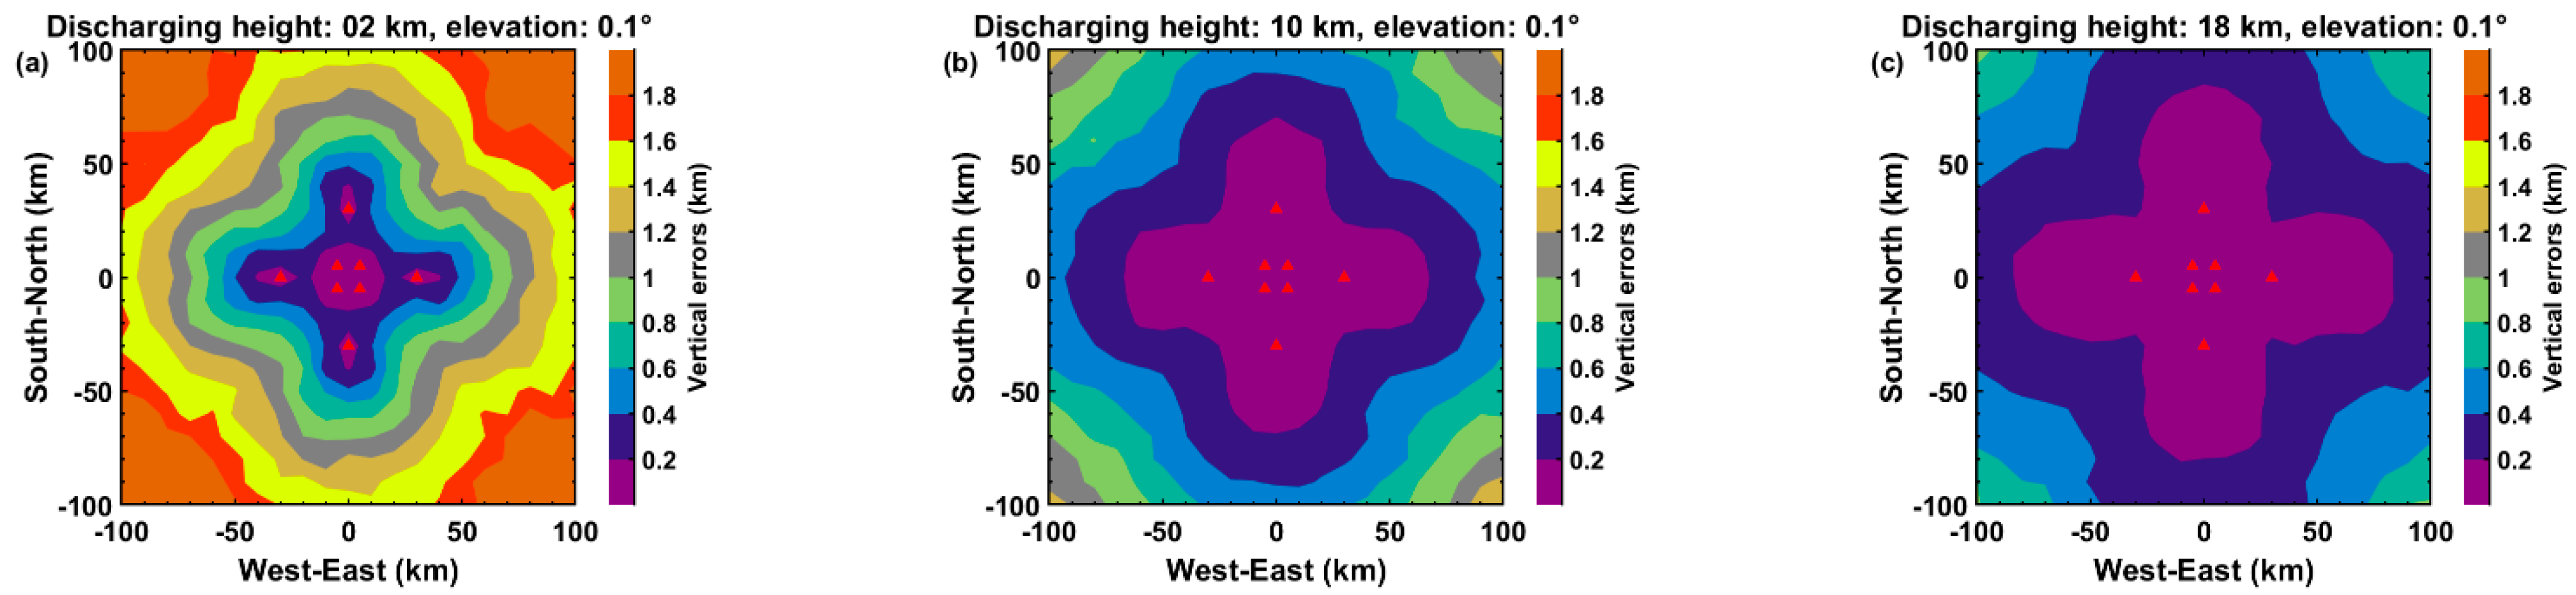
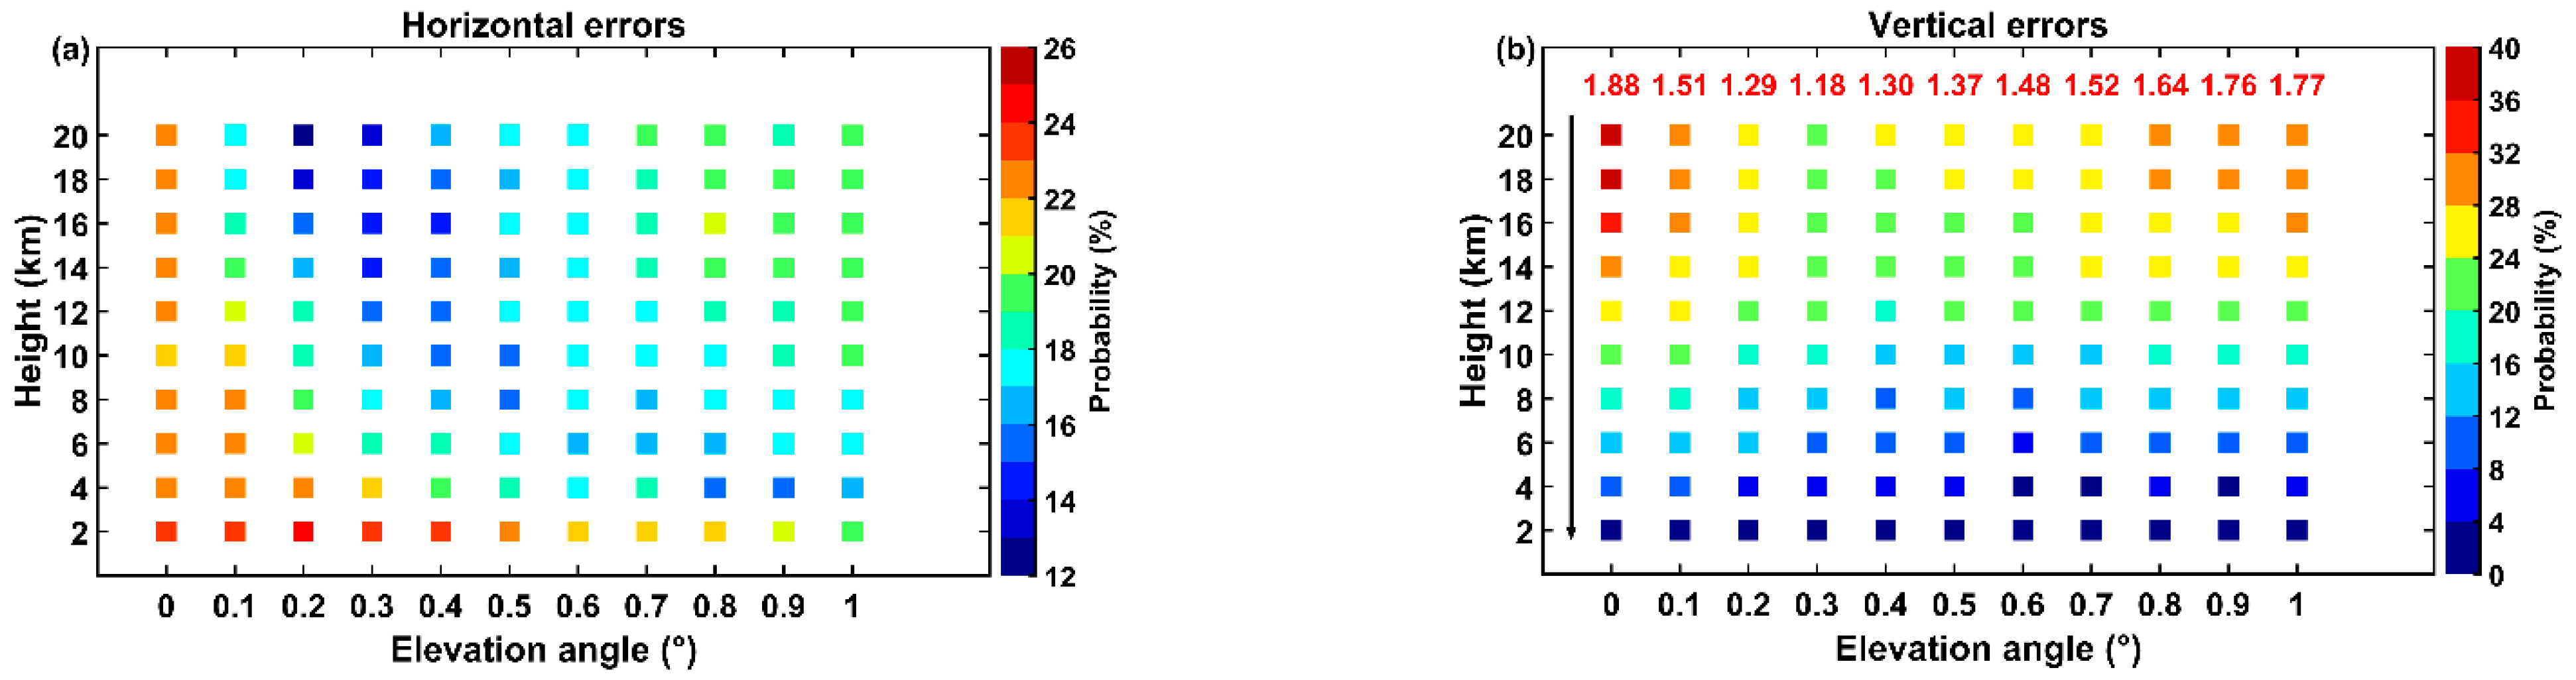
3.1.2. ST LDN
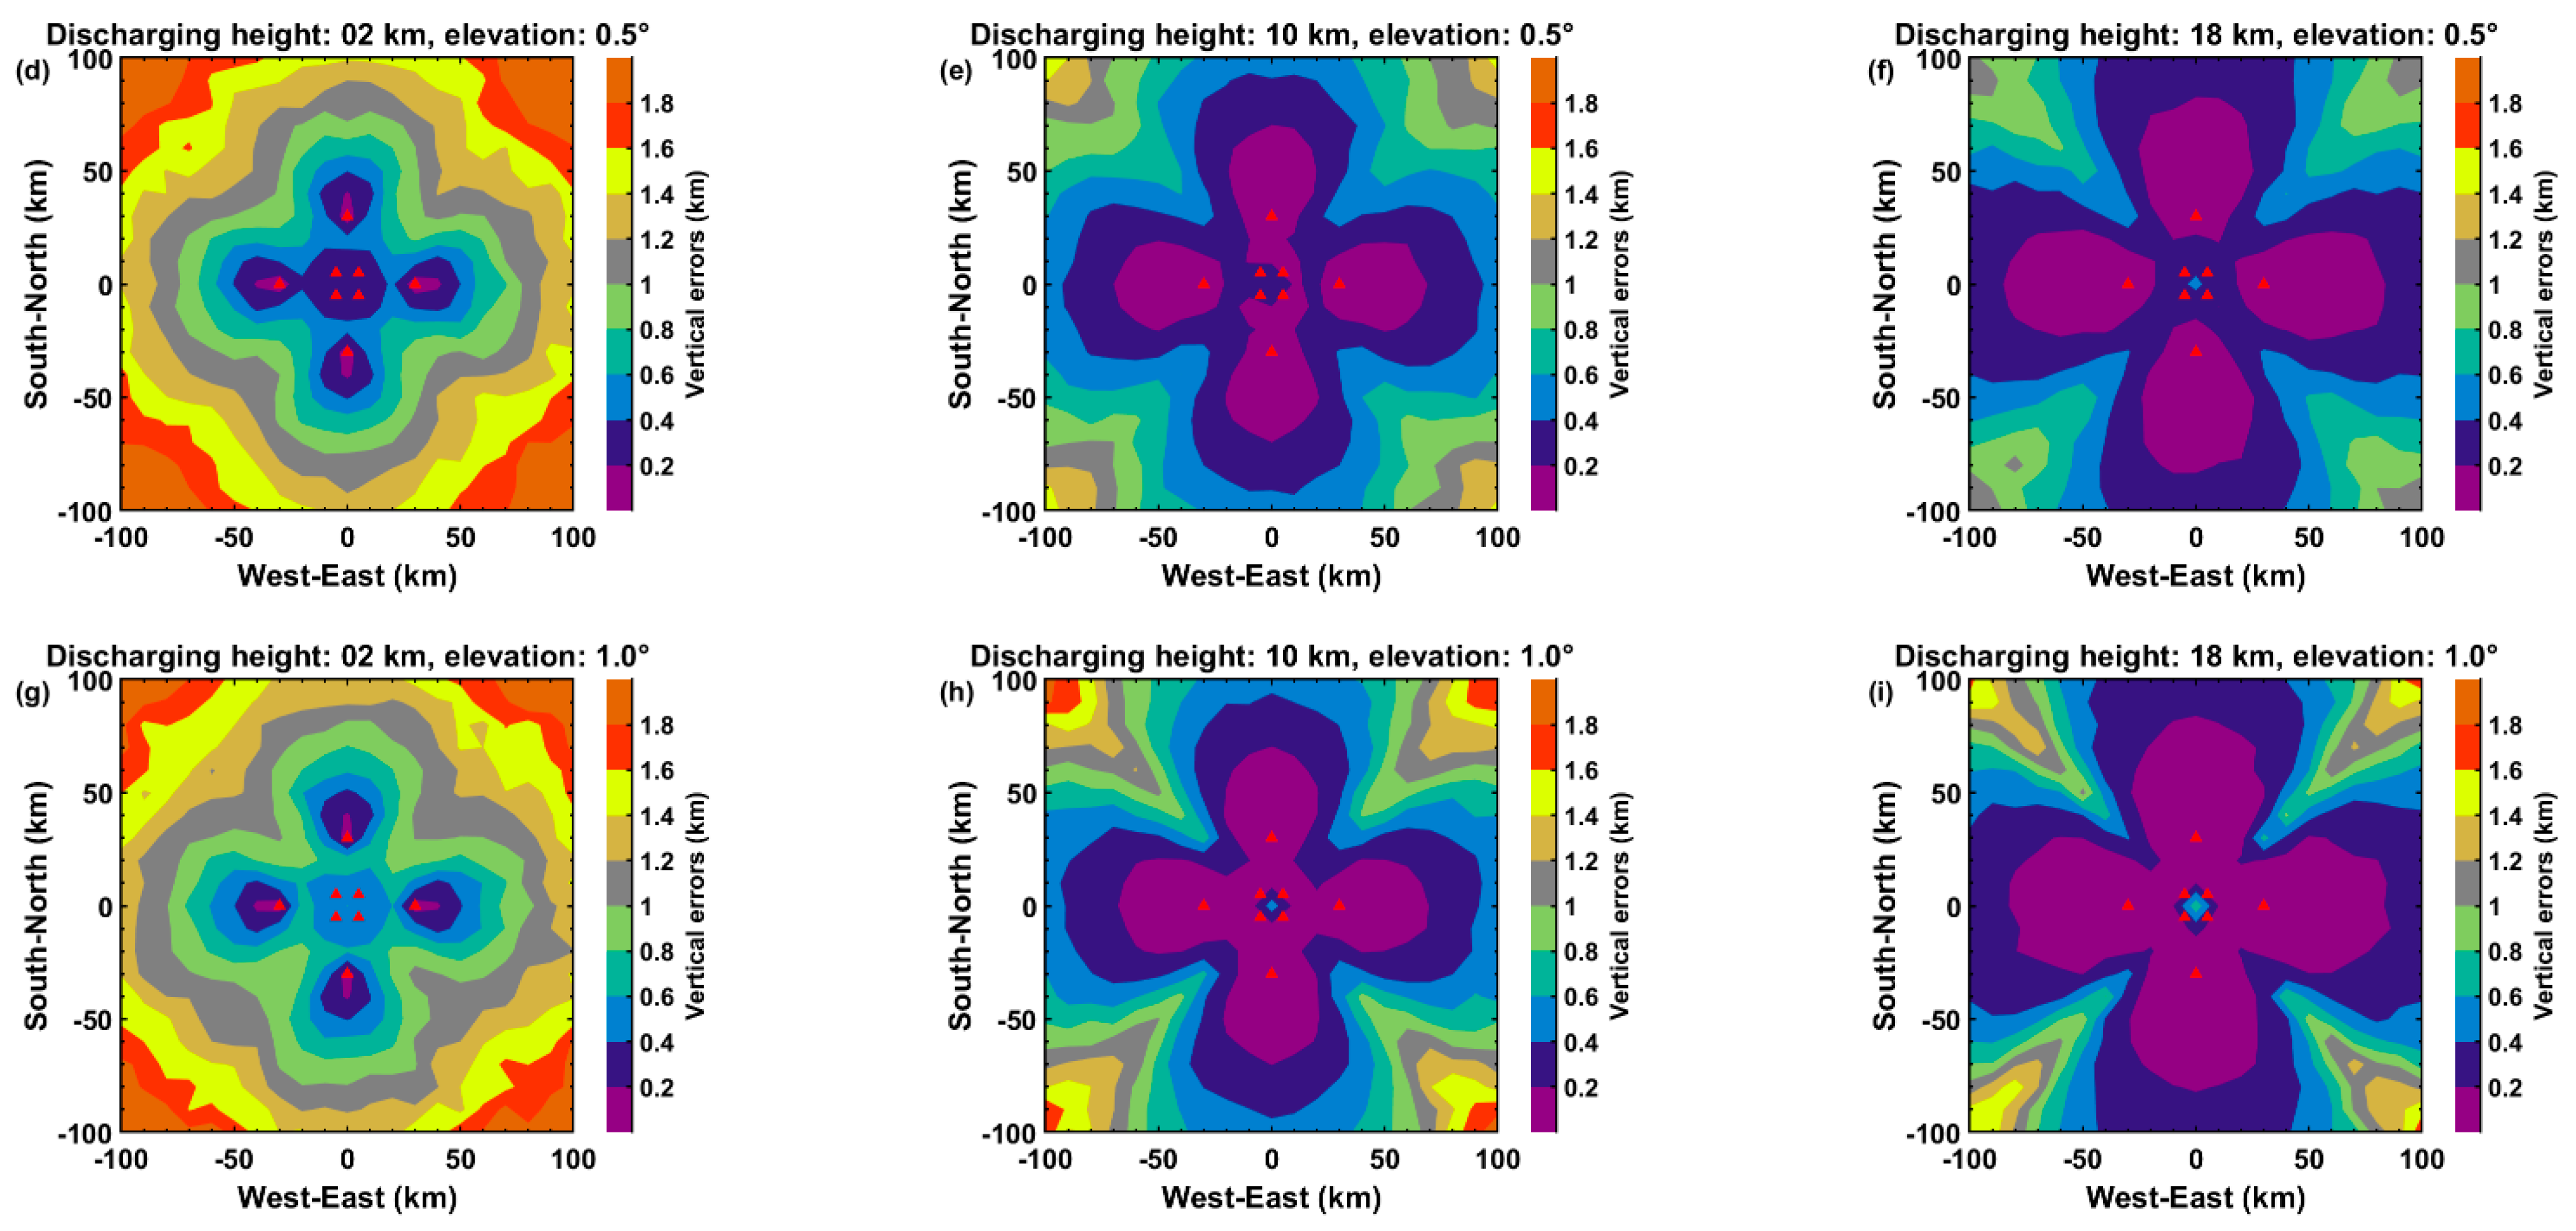
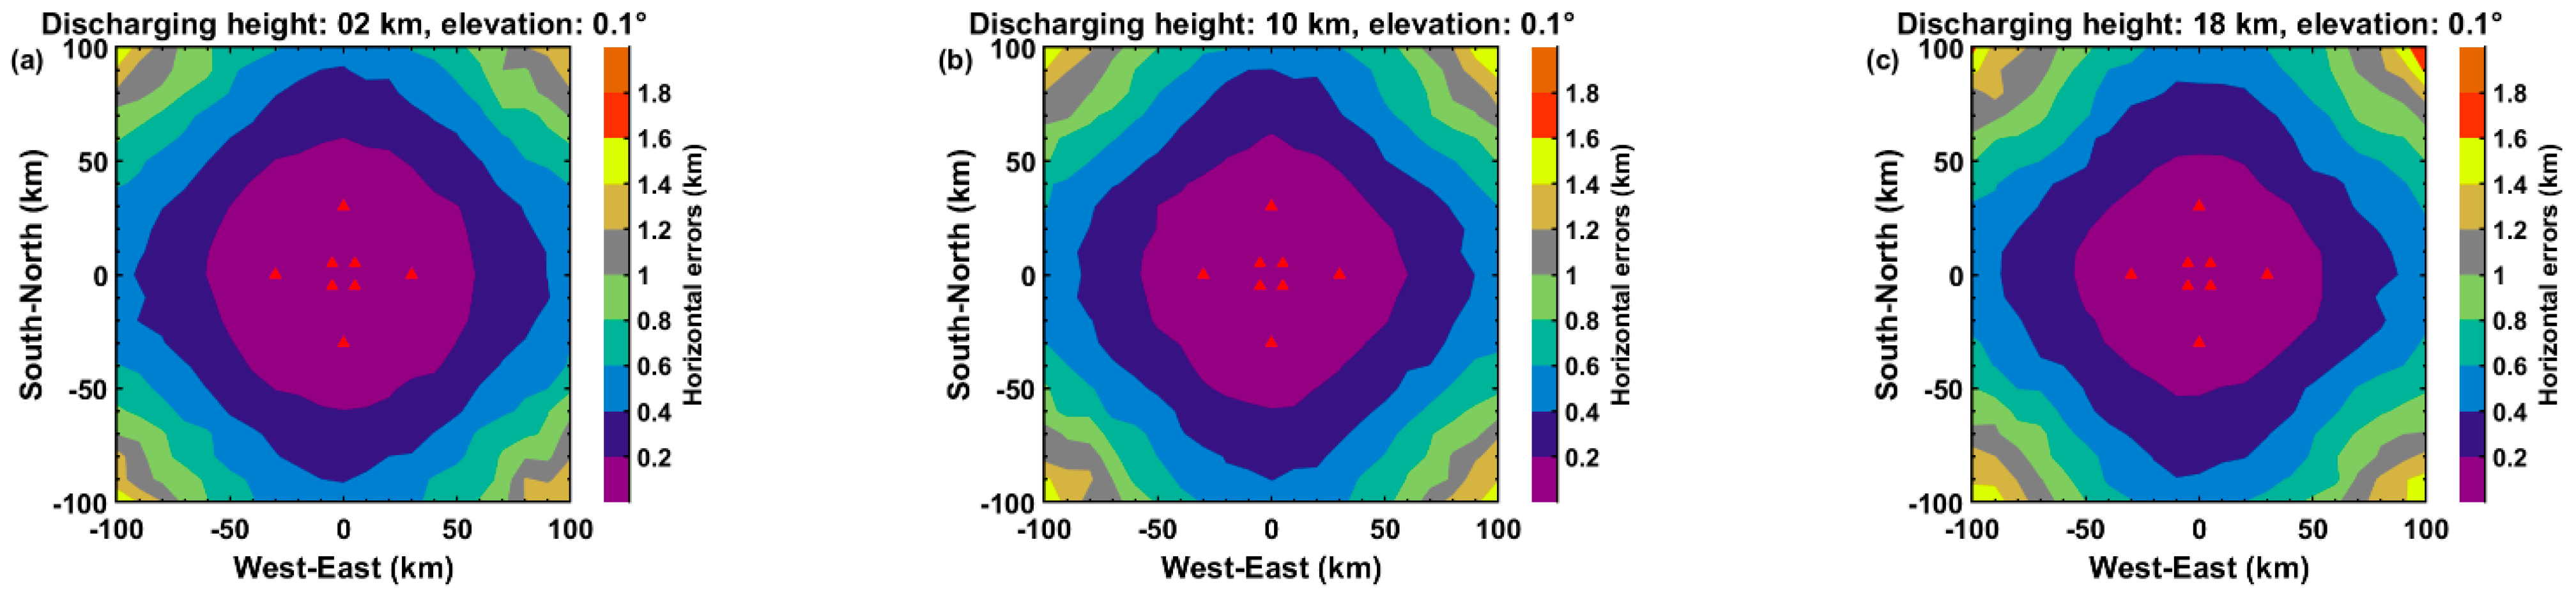
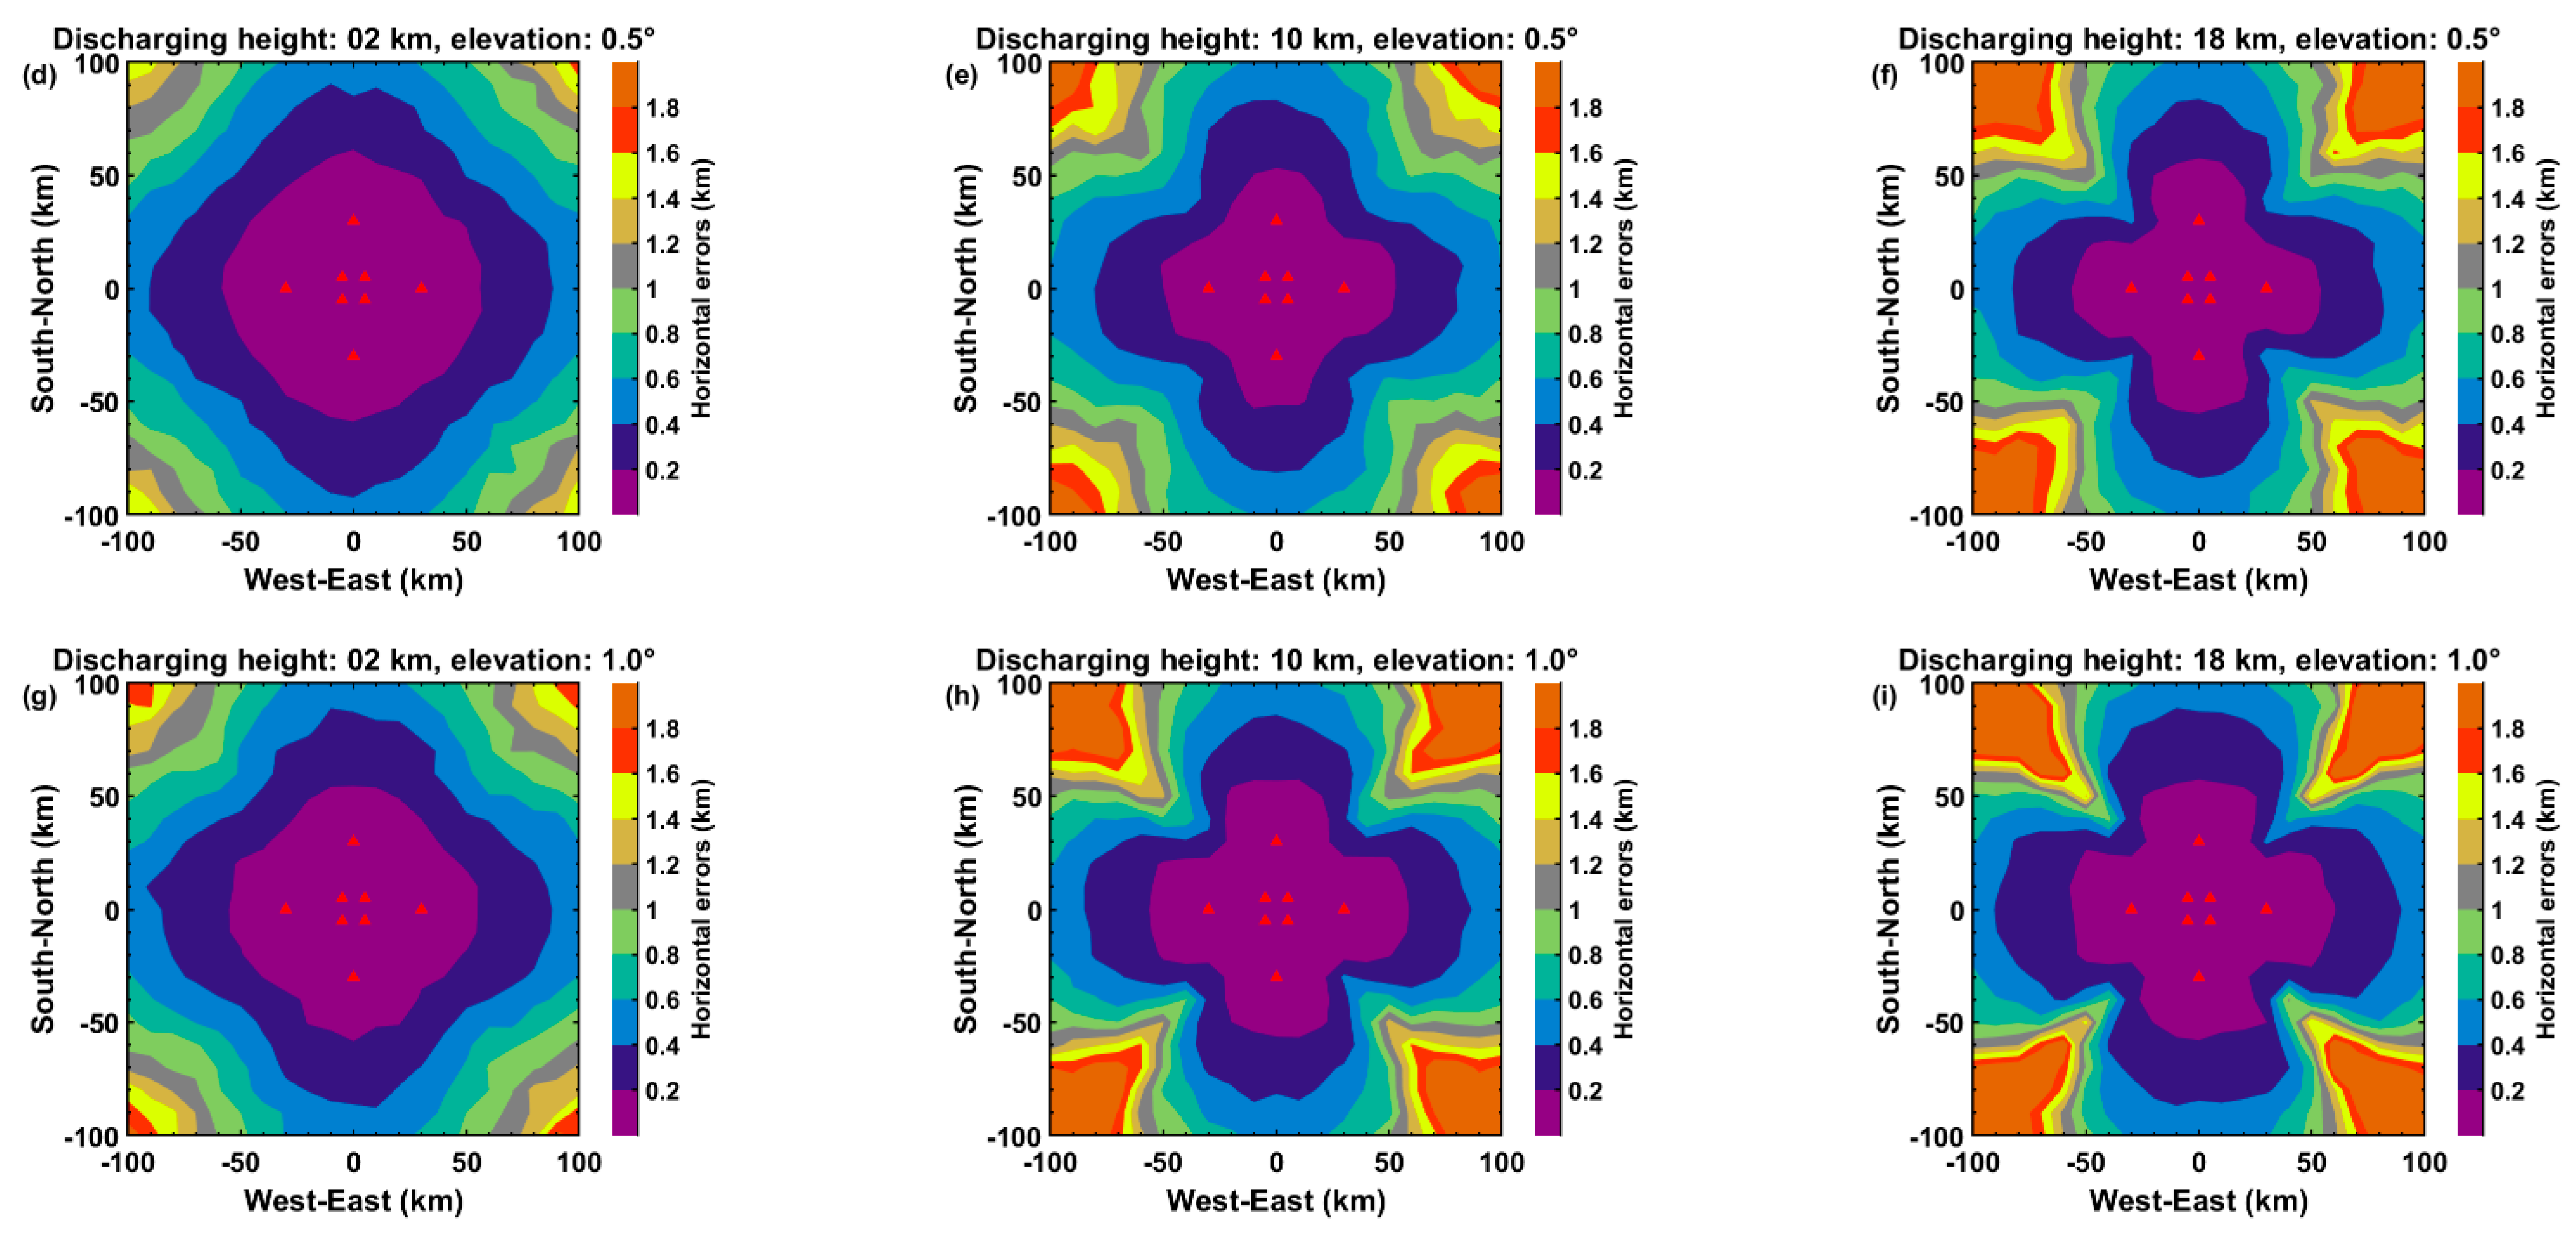
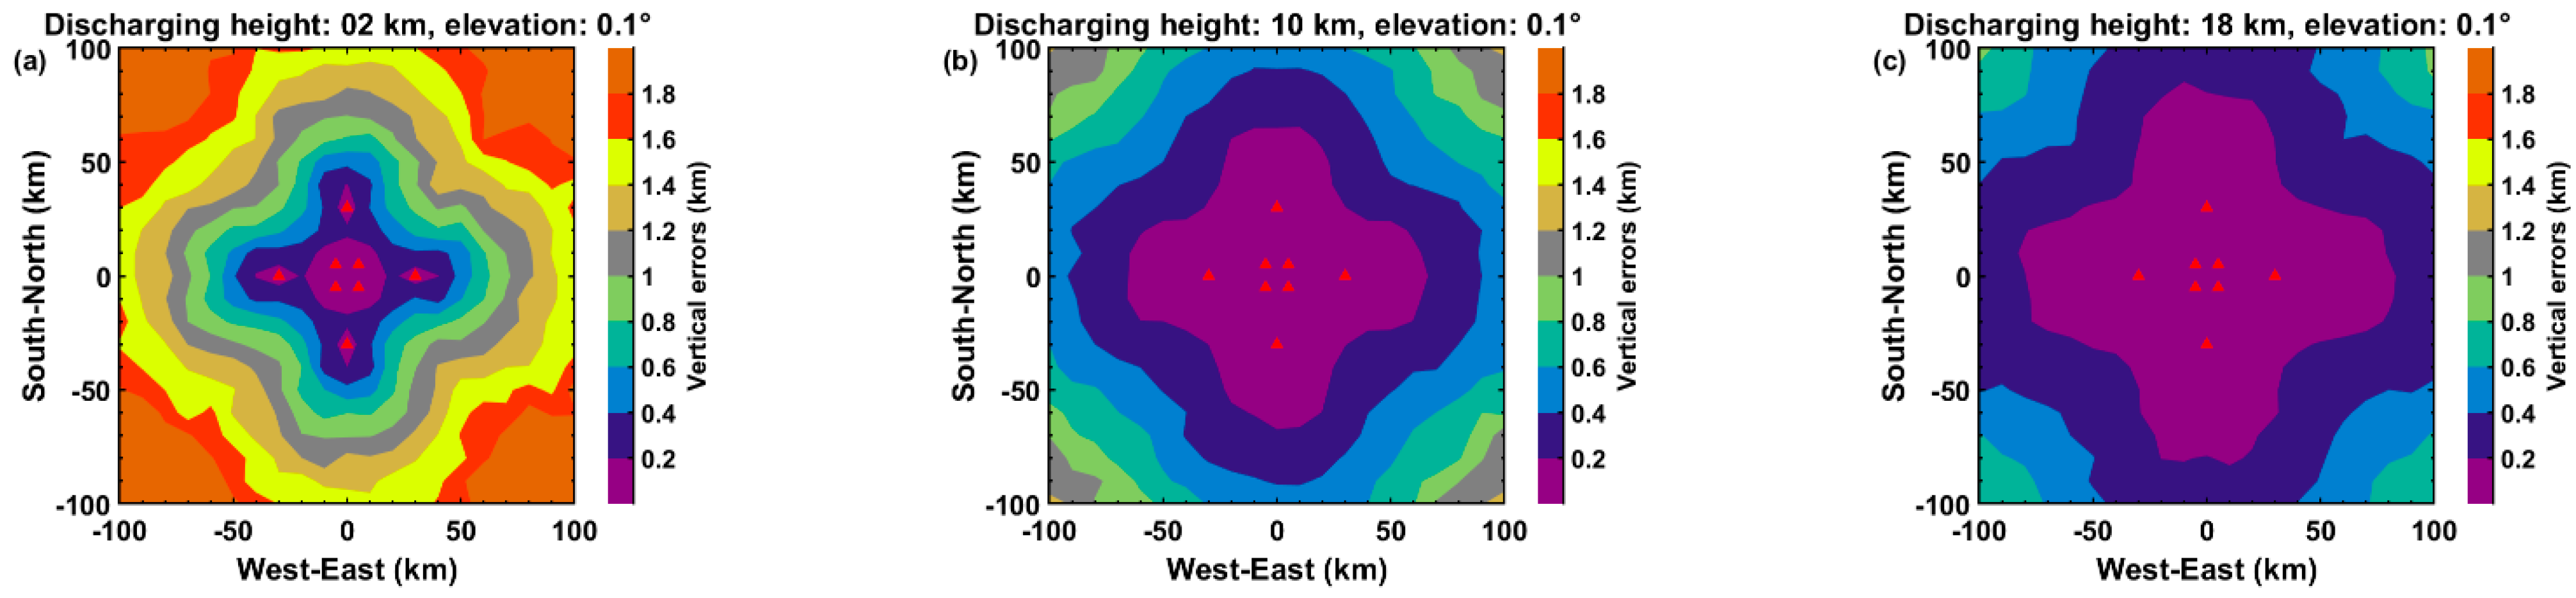
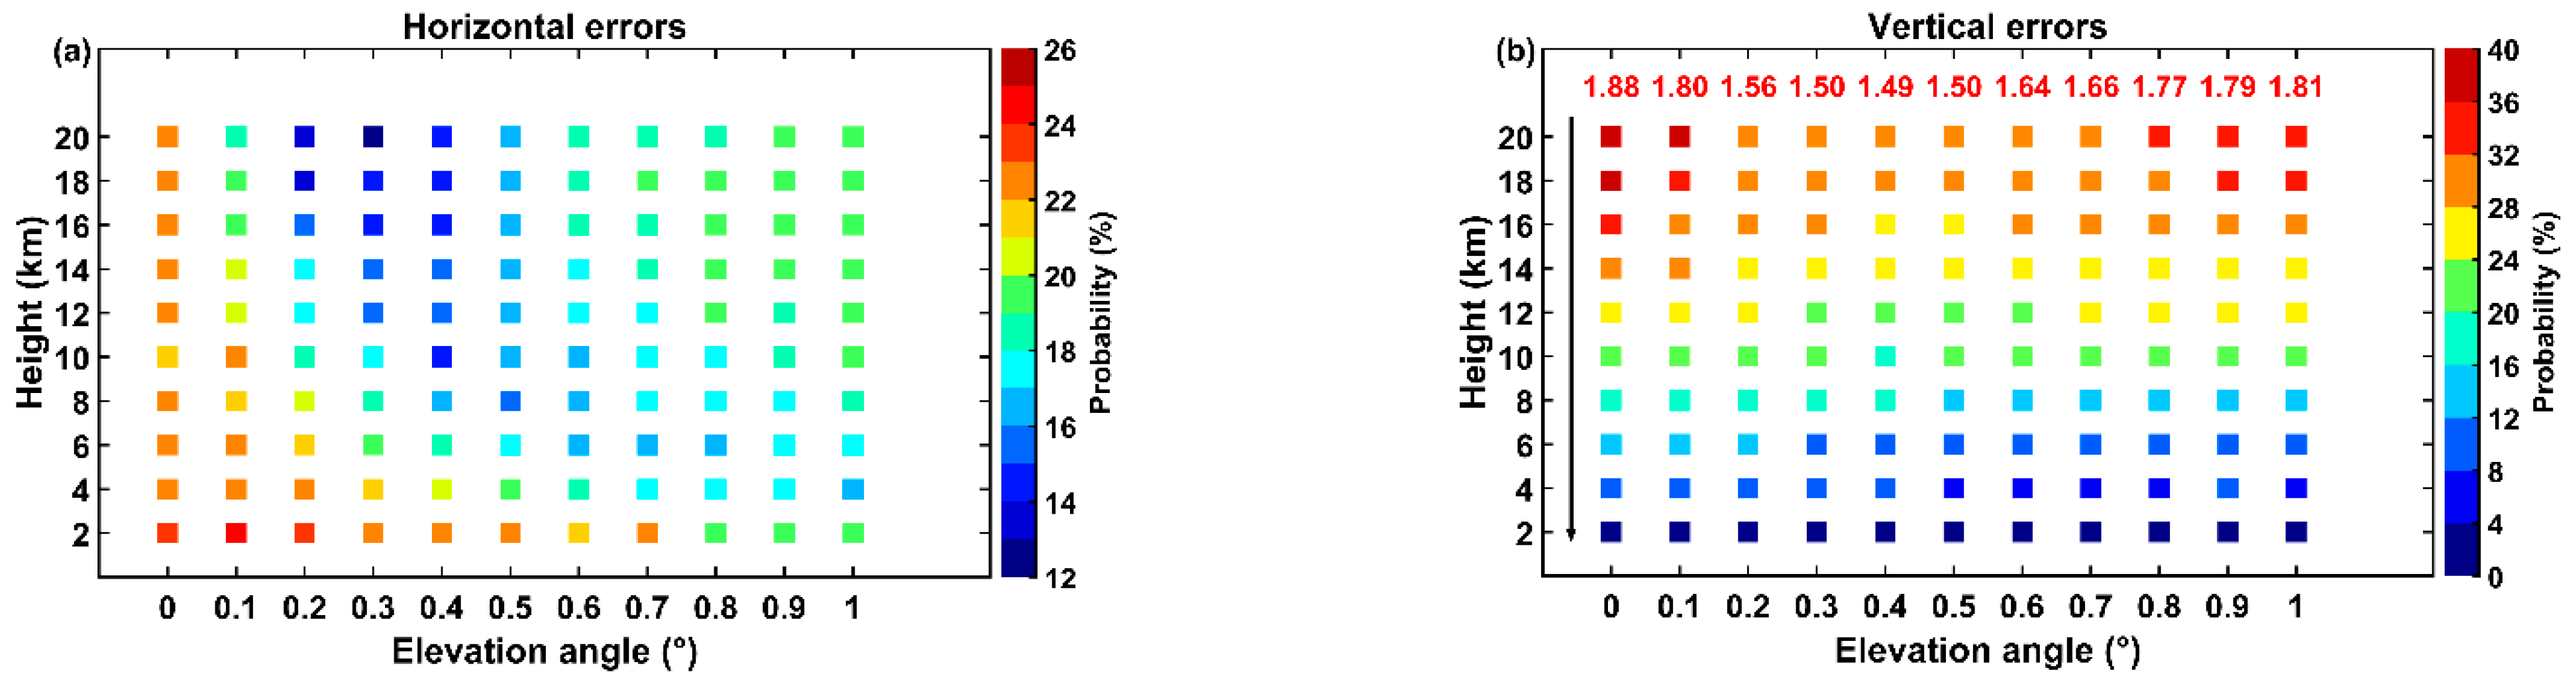
3.1.3. MT LDN
3.1.4. BT LDN
3.2. Quantitative Analysis of Area Variation in High-Precision Location Region
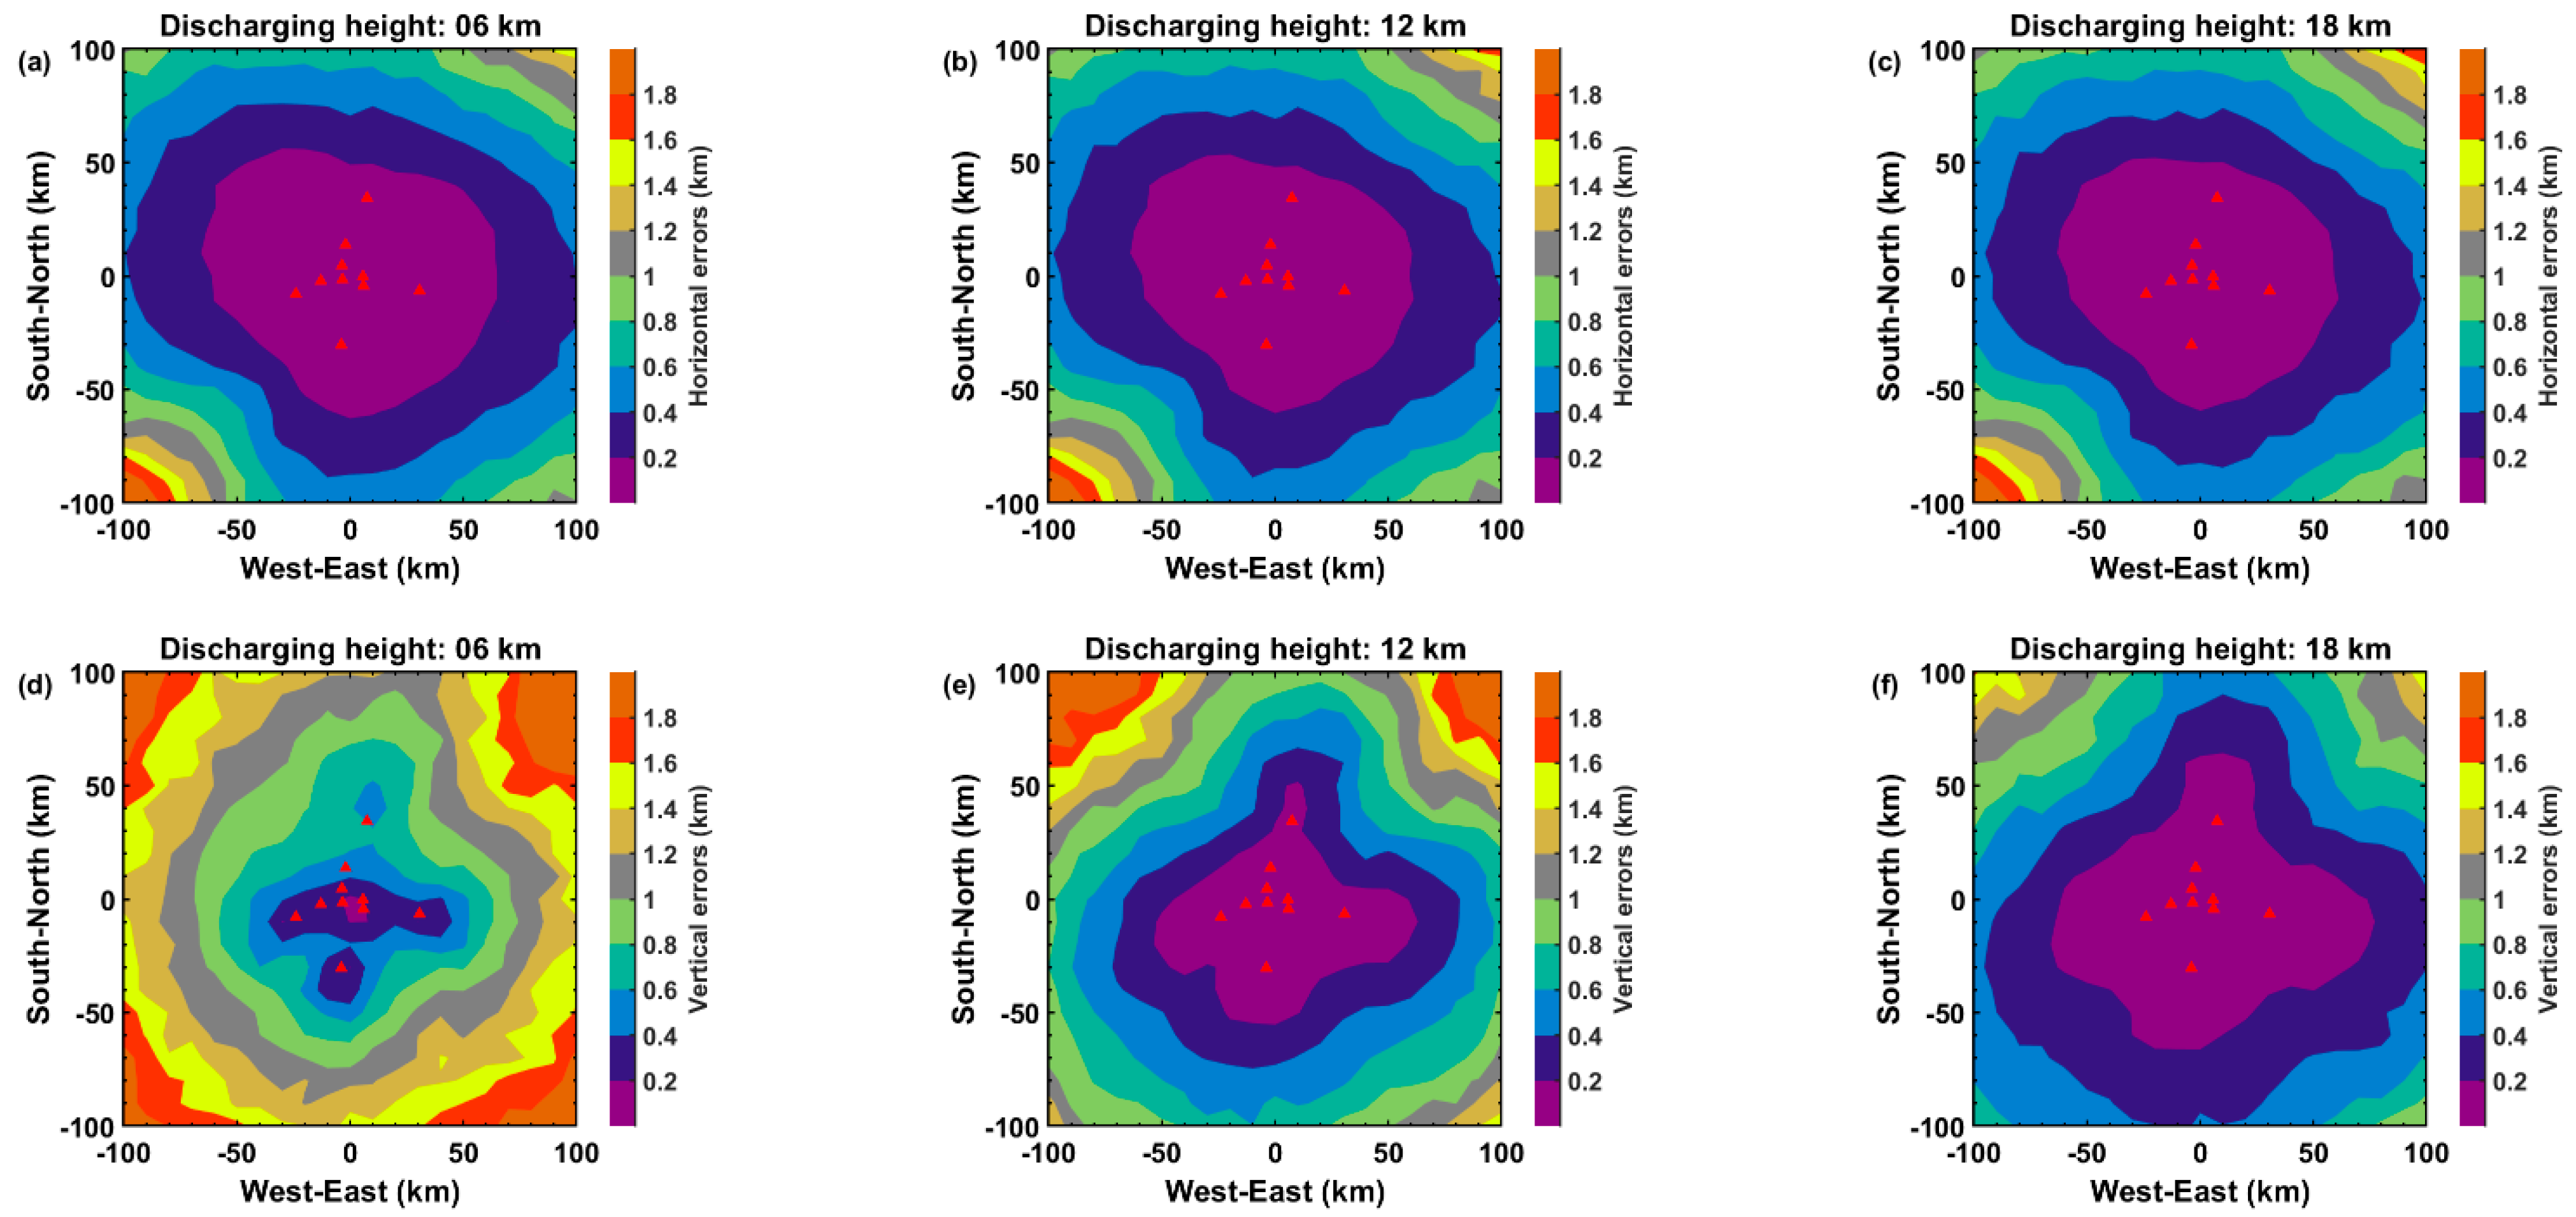
4. Simulation of Lightning Location Accuracy Based on an Actual Network
5. Conclusions and Remarks
5.1. Conclusions
5.1.1. ST LDN
5.1.2. MT LDN
5.1.3. BT LDN
5.1.4. Comparison of Location Accuracy of LDNs with Different Configurations
5.2. Remarks
Author Contributions
Funding
Data Availability Statement
Conflicts of Interest
References
- Curran, E.B.; Holle, R.L.; López, R.E. Lightning casualties and damages in the United States from 1959–1994. J. Clmi. 2000, 13, 3448–3464. [Google Scholar] [CrossRef]
- Holle, R.L.; Copper, M.A. Lightning fatalities in Africa from 2010–2017. In Proceedings of the 34th International Conference on Lightning Protection, Rzeszow, Poland, 2–7 September 2018. [Google Scholar] [CrossRef]
- López, R.E.; Holle, R.L. Fluctuations of lightning casualties in the United States: 1959–1990. J. Clim. 1996, 9, 608–615. [Google Scholar] [CrossRef]
- Yadava, P.K.; Soni, M.; Verma, S.; Kumar, H.; Sharma, A.; Payra, S. The major lightning regions and associated casualties over India. Nat. Hazards. 2020, 101, 217–229. [Google Scholar] [CrossRef]
- Abarca, S.F.; Corbosiero, K.L.; Galarneau, T.J., Jr. An evaluation of the worldwide lightning location network (WWLLN) using the national lightning detection network (NLDN) as ground truth. J. Geophys. Res. Atmos. 2010, 115, D18206. [Google Scholar] [CrossRef]
- Erin, H.L.; Robert, H.H.; Craig, J.R.; Jeremy, N.T.; Osmar, P., Jr.; Richard, L.D. WWLL global lightning detection system: Regional validation study in Brazil. Geophys. Res. Lett. 2004, 31, L03102. [Google Scholar] [CrossRef]
- Mallick, S.; Rakov, V.A.; Ngin, T.; Gamerota, W.R.; Pilkey, J.T.; Hill, J.D.; Uman, M.A.; Jordan, D.M.; Nag, A.; Said, R.K. Evaluation of the GLD360 performance characteristics using rocket-and-wire triggered lightning data. Geophys. Res. Lett. 2014, 41, 3636–3642. [Google Scholar] [CrossRef]
- Said, R.K.; Cohen, M.B.; Inan, U.S. Highly intense lightning over the oceans: Estimated peak currents from global GLD360 observations. J. Geophys. Res. Atmos. 2013, 118, 6905–6915. [Google Scholar] [CrossRef]
- Marchand, M.; Hilburn, K.; Miller, S.D. Geostationary Lightning Mapper and Earth Networks Lightning Detection over the Contiguous United States and Dependence on Flash Characteristics. J. Geophys. Res. Atmos. 2019, 124, 11552–11567. [Google Scholar] [CrossRef]
- Zhu, Y.; Rakov, V.A.; Tran, M.D.; Stock, M.G.; Heckman, S.; Liu, C.; Sloop, C.D.; Jordan, D.M.; Uman, M.A.; Caicede, J.A.; et al. Evaluation of ENTLN performance characteristics based on the ground truth natural and rocket-triggered lightning data acquired in Florida. J. Geophys. Res. Atmos. 2017, 122, 9858–9866. [Google Scholar] [CrossRef]
- Cummins, K.L.; Murphy, M.J. An overview of lightning locating systems: History, techniques, and data uses, with an in-depth look at the U.S. NLDN. IEEE Trans. Electromagn. Compat. 2009, 51, 499–518. [Google Scholar] [CrossRef]
- Cummins, K.L.; Murphy, M.J.; Bardo, E.A.; Hiscox, W.L.; Pyle, R.B.; Pifer, A.E. A combined TOA/MDF technology upgrade of the U.S. National Lightning Detection Network. J. Geophys. Res. Atmos. 1998, 103, 9035–9044. [Google Scholar] [CrossRef]
- Murphy, M.J.; Cramer, J.A.; Said, R.K. Recent History of Upgrades to the U.S. National Lightning Detection Network. J. Atmos. Ocean. Technol. 2021, 38, 573–585. [Google Scholar] [CrossRef]
- Yang, X.; Sun, J.; Li, W. An analysis of cloud-to-ground lightning in China during 2010–2013. Weather Forecast. 2015, 30, 1537–1550. [Google Scholar] [CrossRef]
- Betz, H.D.; Schmidt, K.; Laroche, P.; Blanchet, P.; Oettinger, W.P.; Defer, E.; Dziewit, Z.; Konarski, J. LINET–An International lightning detection network in Europe. Atmos. Res. 2009, 91, 564–573. [Google Scholar] [CrossRef]
- Betz, H.D.; Schmidt, K.; Oettinger, W.P. An International VLF/LF Lightning Detection Network in Europe. In Lightning: Principles, Instruments and Applications; Springer: Berlin, Germany, 2009; pp. 115–140. [Google Scholar] [CrossRef]
- Koshak, W.J.; Solakiewicz, R.J.; Blakeslee, R.J.; Goodman, S.J.; Christian, H.J.; Hall, J.M.; Bailey, C.; Krider, E.P.; Bateman, M.G.; Boccippio, D.J.; et al. North Alabama Lightning Mapping Array (LMA): VHF source retrieval algorithm and error analyses. J. Atmos. Ocean. Technol. 2004, 21, 543–558. [Google Scholar] [CrossRef]
- Thomas, R.J.; Krehbiel, P.R.; Rison, W.; Hunyady, S.J.; Winn, W.P.; Hamlin, T.; Harlin, J. Accuracy of the Lightning Mapping Array. J. Geophys. Res. Atmos. 2004, 109, D14207. [Google Scholar] [CrossRef]
- Chen, Z.; Zhang, Y.; Zheng, D.; Zhang, Y.; Fan, X.; Fan, Y.; Xu, L.; Lyu, W. A Method of Three-Dimensional Location for LFEDA Combining the Time of Arrival Method and the Time Reversal Technique. J. Geophys. Res. Atmos. 2019, 124, 6484–6500. [Google Scholar] [CrossRef]
- Fan, X.; Zhang, Y.; Zheng, D.; Zhang, Y.; Lyu, W.; Liu, H.; Xu, L. A new method of three-dimensional location for low-frequency electric field detection array. J. Geophys. Res. Atmos. 2018, 123, 8792–8812. [Google Scholar] [CrossRef]
- Shi, D.; Zheng, D.; Zhang, Y.; Zhang, Y.; Huang, Z.; Lu, W.; Chen, S.; Yan, X. Low-frequency E-field Detection Array (LFEDA)—Construction and preliminary results. Sci. China Earth Sci. 2017, 60, 1896–1908. [Google Scholar] [CrossRef]
- Srivastava, A.; Tian, Y.; Qie, X.; Wang, D.; Sun, Z.; Yuan, S.; Wang, Y.; Chen, Z.; Xu, W.; Zhang, H.; et al. Performance assessment of Beijing Lightning Network (BLNET) and comparison with other lightning location networks across Beijing. Atmos. Res. 2017, 197, 76–83. [Google Scholar] [CrossRef]
- Wang, Y.; Qie, X.; Wang, D.; Liu, M.; Su, D.; Wang, Z.; Liu, D.; Wu, Z.; Sun, Z.; Tian, Y. Beijing Lightning Network (BLNET) and the observation on preliminary breakdown processes. Atmos. Res. 2016, 171, 121–132. [Google Scholar] [CrossRef]
- Wu, T.; Wang, D.; Takagi, N. Lightning mapping with an array of fast antennas. Geophys. Res. Lett. 2018, 45, 3698–3705. [Google Scholar] [CrossRef]
- Katz, E.; Segev, A. The Lightning Position and Tracking System (LPATS) in Israel: First results. In Proceedings of the Eighteenth Convention of Electrical and Electronics Engineers in Israel, Tel Aviv, Israel, 7–8 March 1995. [Google Scholar] [CrossRef]
- Pinto, I.R.C.A.; Pinto, O., Jr.; Gin, R.B.B.; Diniz, J.H.; de Araujo, R.L.; Carvalho, A.M. A coordinated study of a storm system over the South American continent. II. Lightning-related data. J. Geophys. Res. Atmos. 1992, 97, 18205–18213. [Google Scholar] [CrossRef]
- Gu, J.; Zhang, Q.; Zhang, J.; Zhou, J.; Dai, B.; Sun, H.; Wang, Y.; Wang, J.; Zhong, Y.; Li, Q.; et al. Effect of Number and Configuration of Participating Stations on Lightning Location outside the Network. Remote Sens. 2022, 14, 4242. [Google Scholar] [CrossRef]
- Koshak, W.J.; Solakiewicz, R.J. On the retrieval of lightning radio sources from time of arrival data. J. Atmos. Ocean. Technol. 1996, 101, 26631–26639. [Google Scholar] [CrossRef]
- Li, D.; Azadifar, M.; Rachidi, F.; Rubinstein, M.; Diendorfer, G.; Sheshyekani, K.; Zhang, Q.; Wang, Z. Analysis of lightning electromagnetic field propagation in mountainous terrain and its effects on ToA-based lightning location systems. J. Geophys. Res. Atmos. 2016, 121, 895–911. [Google Scholar] [CrossRef]
- Li, D.; Rubinstein, M.; Rachidi, F.; Diendorfer, G.; Schulz, W.; Lu, G. Location accuracy evaluation of ToA-based lightning location systems over mountainous terrain. J. Geophys. Res. Atmos. 2017, 122, 11760–11775. [Google Scholar] [CrossRef]
- Schütte, T.; Pišler, E.; Filipovic, D.; Israelsson, S. Acceptance of lightning detectors and localization systems under different damping conditions. J. Atmos. Ocean. Technol. 1987, 4, 401–410. [Google Scholar] [CrossRef]


Disclaimer/Publisher’s Note: The statements, opinions and data contained in all publications are solely those of the individual author(s) and contributor(s) and not of MDPI and/or the editor(s). MDPI and/or the editor(s) disclaim responsibility for any injury to people or property resulting from any ideas, methods, instructions or products referred to in the content. |
© 2023 by the authors. Licensee MDPI, Basel, Switzerland. This article is an open access article distributed under the terms and conditions of the Creative Commons Attribution (CC BY) license (https://creativecommons.org/licenses/by/4.0/).
Share and Cite
Pan, Y.; Zheng, D.; Zhang, Y.; Yao, W.; Zhang, Y.; Fang, X.; Lyu, W.; Zhang, W. Significant Location Accuracy Changes Resulting from Lightning Detection Networks Deployed on Inclined Terrains. Remote Sens. 2023, 15, 5733. https://doi.org/10.3390/rs15245733
Pan Y, Zheng D, Zhang Y, Yao W, Zhang Y, Fang X, Lyu W, Zhang W. Significant Location Accuracy Changes Resulting from Lightning Detection Networks Deployed on Inclined Terrains. Remote Sensing. 2023; 15(24):5733. https://doi.org/10.3390/rs15245733
Chicago/Turabian StylePan, Yun, Dong Zheng, Yijun Zhang, Wen Yao, Yang Zhang, Xianggui Fang, Weitao Lyu, and Wenjuan Zhang. 2023. "Significant Location Accuracy Changes Resulting from Lightning Detection Networks Deployed on Inclined Terrains" Remote Sensing 15, no. 24: 5733. https://doi.org/10.3390/rs15245733