Review

An Overview of GIS-RS Applications for Archaeological and Cultural Heritage under the DBAR-Heritage Mission

by
Ya Yao
1,2,3,
Xinyuan Wang
2,3,*,
Lei Luo
2,3,
Hong Wan
2,3,4 and
Hongge Ren
2,3
1
Key Lab for Resources Use and Environmental Remediation, Institute of Geographic Sciences and Natural Resources Research, Chinese Academy of Sciences, Beijing 100101, China
2
Aerospace Information Research Institute, Chinese Academy of Sciences, Beijing 100094, China
3
International Centre on Space Technologies for Natural and Cultural Heritage (HIST) UNESCO, Beijing 100094, China
4
College of Information Science and Engineering, Shandong Agricultural University, Taian 271000, China
*
Author to whom correspondence should be addressed.
Remote Sens. 2023, 15(24), 5766; https://doi.org/10.3390/rs15245766
Submission received: 8 November 2023 / Revised: 8 December 2023 / Accepted: 14 December 2023 / Published: 17 December 2023
(This article belongs to the Special Issue Remote Sensing and GIS for Archaeology)

Abstract

:
In recent decades, the application of GIS and RS in archaeological and cultural heritage (ACH) has witnessed a notable surge both in terms of quantity and scope. During the initial implementation period (2016–2021) of the Digital Belt and Road Heritage (DBAR-Heritage) working group, several instances of GIS-RS-based applications in support of cultural heritage conservation have merged. In this paper, in order to discuss the great potential of GIS and RS on the Silk Road, an overview of GIS- and RS-based applications in ACH is first presented. In a substantial portion of the published scientific literature, the identification and comprehension of archaeological sites, the monitoring and risk assessment of cultural heritage, and the management and visualization of cultural heritage data are highlighted. Following this, five illustrative case studies from the DBAR-Heritage working group are presented to exemplify how the integration of GIS and RS serves as key approaches in recognizing and appreciating cultural heritage. These selected case studies showcase the utilization of multi-source data for the identification of linear sites; detailed, refined monitoring and assessment of the Angkor Wat heritage; and the reconstruction of the Silk Road routes. These instances serve as the cornerstone for highlighting current trends in GIS and RS applications in ACH along the Silk Road. These methodologies efficiently integrate multi-source geospatial data and employ multidisciplinary approaches, ultimately furnishing sophisticated and intelligent tools for the exploration and management of archaeological and cultural heritage in the era of Big Earth Data. Subsequently, a comprehensive discussion on the merits and challenges of GIS and RS applications in ACH is presented, followed by an exploration of the current application trends. Finally, the prospects for the widespread application of GIS and RS in ACH along the Silk Road are outlined in accordance with the operational plan of DBAR-Heritage during its second implementation phase.

1. Introduction

In the 1870s, Richthofen introduced the concept of the Silk Road (SR) in his publication “China” [1]; the term “Silk Road” refers to the trade routes extending from Luoyang-Chang’an to Samarkand that primarily facilitated the exchange of spices and silk. Subsequently, the term “Silk Road” swiftly gained recognition within academic circles and the public sphere, extending its scope to encompass both the Maritime Silk Road and the Grassland Silk Road [1,2]. It is widely accepted that the SR involved the Maritime Silk Road and the Land Silk Road, spanning from the 2nd century BCE to the 16th century BC. In 2014, a collaborative declaration by China, Kazakhstan, and Kyrgyzstan for the “Silk Road: The Road Network of Chang’an-Tianshan Corridor” was successfully selected into the World Heritage List. As a landmark event for SR cultural heritage, this declaration revitalized global awareness of the profound historical significance inherent in the SR. As a system of caravan routes connecting Eurasia and North Africa, the SR promotes the mutual dissemination of science and technology, cultural exchange, and integration of people in the East and the West, which has extensively and profoundly promoted production progress and even social change in countries along the routes [3].
However, serving as the carrier of history and culture, which bears witness to the cultural interaction that took place in or around them, cultural heritage sites along the SR are suffering from human activities and climate change [4,5,6,7]. Limited by traditional preventive conservation techniques and methods, the safeguarding and management of these invaluable sites face unprecedented challenges [8]. Within the myriad of challenges, three key aspects have garnered significant attention in recent scholarly discourse. Specifically, the bottleneck of traditional survey methods hinders the overall acquisition and observation of large-scale heritage information [9,10,11]. The ACH sites along the routes are highly susceptible to atmospheric changes [4,12], weathering [13,14,15,16], erosion, and human activities [14,17,18,19,20], which underscores the urgent need for risk assessment and monitoring to facilitate the preventive conservation of ACH. While several research projects involving Central Asian Archaeological Landscapes [21] and the Digital Silk Road Project [22] are currently making commendable contributions and exerting substantial efforts towards the Silk Road Digital Inventory [21], it is essential to acknowledge that, given the extensive geographical coverage of the Silk Road and the sheer abundance of heritage sites, the development of comprehensive digital documentation remains notably incomplete.
In recent years, an increasing number of peer-reviewed articles have demonstrated the application of remote sensing (RS) and Geographic Information Systems (GIS) in tackling various challenges related to cultural heritage, encompassing the ones outlined above and beyond [23,24,25,26,27,28,29,30,31,32,33,34,35,36,37,38,39,40,41,42,43,44]. Notably, RS and GIS have emerged as tools in numerous cultural heritage research and management [29,45,46,47,48,49,50,51,52,53]. The integration of RS and GIS in cultural heritage studies represents a blend of conventional yet innovative approaches [54,55,56]. These tools are expanding the practice of SR ACH conservation [57,58,59,60,61,62,63]. As space technology continues to advance, RS and GIS are evolving to keep pace with the era of data proliferation. To furnish technical support for ACH research and its sustainable conservation, it is imperative to continuously review trends in cultural heritage research. The Silk Road, with its vast geographical expanse and rich, diverse cultural heritage, offers an excellent repository of case studies for assessing the trends of these technologies.
As a working group dedicated to the sustainable development of heritage [64], DBAR-Heritage is also trying to explore the application of GIS and RS in the field of cultural heritage discovery, protection, and management along the SR [65]. This paper aims to provide instructive insights derived from the previous peer-reviewed publications and five case practices along the BAR, involving both ACH sites and the supporting environment. GIS and RS have become increasingly popular and effective for use in ACH applications, from identification and conservation support to digital route reconstruction. In this review, we examine the brief development of GIS and RS in ACH, whether aimed at specific sites or contextual environments of ACH; highlight their great application potential in ACH on the BAR; and discuss the merits and challenges of their applications for ACH studies, and the development trends are summarized. We identify and propose several potential enhancements for DBAR-Heritage in its second phase of effective execution at the end.

2. The DBAR Heritage Mission

China proposed its Silk Road Economic Belt and the 21st Century Maritime Silk Road (referred to as the Belt and Road, BAR) initiative that was conceived in cooperation with countries along the ancient Silk Road [65]. In 2016, the international science program Digital Belt and Road (DBAR) was proposed by the Chinese Academy of Sciences. This project’s goal is to develop a platform for sharing expertise, knowledge, technology, and data that demonstrate the possible use of Big Earth Data in support of these global frameworks, promoting data- and technology-aided policy development and addressing regional and global issues [64]. DBAR has established seven working groups that provide scientific support for the implementation of the BAR from a scientific point of view. As one of the seven, the DBAR Natural and Cultural Heritage Working Group (DBAR-Heritage) was established in March 2017, contacting relevant experts from around the world to collaborate and promote data sharing and cooperation related to heritages on the BAR [64]. DBAR-Heritage worked towards sharing experiences of Earth observation technologies and Big Earth Data on natural and cultural heritage applications and reviewing results from baseline data collection efforts of Sustainable Development Goals (SDGs) indicators, and for learning and preparing for future SDGs indicator monitoring [64].
The DBAR-Heritage Working Group has outlined several specific objectives. Firstly, it seeks to investigate the spatial and temporal distribution patterns of cultural heritage sites along the BAR, as well as elucidate the underlying evolutionary mechanisms in response to global changes and human activities. Secondly, it aims to establish a public information-sharing system for cultural heritage within the DBAR data-sharing platform while concurrently fostering an international platform for scientific and technological cooperation. Thirdly, the group concentrates on expanding international research initiatives focused on spatial archaeology and digital heritage, emphasizing innovation and practicality within the broader framework of the DBAR science program. Fourthly, it places emphasis on fortifying dialogues among stakeholders, including World Heritage and archaeological site custodians, Earth-observation organizations, and institutions, as well as policymakers responsible for BAR development. This collaborative effort is aimed at pooling and exchanging experiences in science and technology. Lastly, the group is committed to promoting the extensive application of emerging sciences and technologies in the protection of World Heritage sites along the BAR [64]. This collective endeavor aims to enhance the safeguarding and management of these invaluable heritage sites.
The effective execution period for the DBAR-Heritage proceeds for 10 years (from 2016 to 2025) and is being implemented in two phases of 5 years each. In the first 5 years (2016–2021), the DBAR-Heritage working group has focused on international collaborative research in three typical regions and providing consulting support and capacity-building services for earth-observation technology to protect and utilize cultural heritage, archaeological exploration, risk assessment, and sustainable development in the relevant countries. Focusing on the urgent need for advanced GIS-RS-based approaches in the archaeological and conservation work of cultural heritages in arid areas, the DBAR-Heritage working group has conducted a comparative study in spatial archaeology and the conservation of cultural heritage in China, North Africa, and the Mediterranean. Additionally, scientific studies of the monitoring and evaluation of cultural heritages and archaeological landscapes have been carried out in South and Central Asia [64].

3. Overview of GIS- and RS-Based Applications in ACH

3.1. Background of GIS and RS

GIS and RS have evolved into distinct disciplines within geospatial technology, each with well-established theoretical foundations and methodologies [66]. They now encompass various methodologies and software tools(ArcGIS Pro, GRASS GIS, QGIS, ENVI, ERDAS Imagine etc.), expanding their applications in spatial data collection, measurement, analysis, storage, management, display, dissemination, and deployment. GIS has moved beyond just creating digital maps. It has evolved into a comprehensive framework for integrating, storing, analyzing, and presenting geospatial data [67]. This includes location-based analytics that use geographical intelligence to dissect complex datasets, revealing hidden trends and patterns across regions. RS involves observational and investigative activities in the environmental realm. It uses human operators and sensors on satellites, spacecraft, aircraft, near-space vehicles, and terrestrial platforms. These tools collect and analyze extensive spatial information about Earth’s surface, which is crucial for understanding our planet’s diverse environmental and geographical landscapes [68,69].
Generally, GIS and RS primarily focus on studying and supporting sustainable development in societies and guiding decision-making for economic growth. These fields are known for their comprehensive, multi-sourced, heterogeneous, multidimensional, dynamic nature and large information volume [55,70]. This makes them globally significant. GIS-RS is versatile, significantly impacting areas like geography, agriculture, environmental science, urban planning, and traffic management [55]. At their core, GIS and RS can depict real-time surface conditions of research subjects, including their geometric location, spatial extent, and interrelationships. They also reveal hidden insights about land and atmospheric domains [71]. By continuously monitoring the surface environment, GIS and RS integrate temporal and spatial dimensions, enhancing our understanding of the natural world and the human–nature relationship. This understanding is crucial for recognizing, managing, and preserving ACH.
As GIS and RS are often integrated into ACH research, the term “GIS-RS” will be used below to explore their broad scope of technical applications in ACH.

3.2. Literature Overview of GIS-RS Applications for ACH

3.2.1. Bibliometric of GIS-RS Application in ACH

GIS-RS finds widespread utility in the realm of cultural heritage due to its distinctive technical attributes. Over the past century, a considerable body of peer-reviewed research has explored the utilization of GIS and RS in the field of ACH, affirming the crucial role played by geospatial technologies in driving progress and the innovation of novel methodologies and tools [40,46,47,51,72,73,74,75,76,77]. In the pursuit of refining our research scope, we initiated a filtering process centered on the terms “archaeology”, “archaeological”, or “cultural heritage” within the title, abstract, or keywords. Initially employed as a union filter, this process underwent meticulous refinement in alignment with the key facets of GIS-RS. Subsequently, we identified and retained 14 specific terms: “remote sensing”, “aerial”, “satellite”, “airborne”, “spaceborne”, “CORONA”, “photography”, “multispectral”, “hyperspectral”, “LiDAR”, “SAR”, “GIS”, “geospatial”, and “spatial analysis” from the title, abstract, or keywords for further investigation. Following this filtration process, duplicate records were systematically eliminated through the utilization of a document management tool, resulting in the consolidation of these filtered records into a novel dataset. In its final form, our dataset encompassed a total of 7741 journal publication records. Employing this comprehensive compilation of literature data, we conducted a bibliometric analysis to illuminate the disciplinary characteristics, temporal trends, and spatial dimensions of GIS-RS applications in the realm of archaeological and cultural heritage studies over the preceding half-century.
Regarding the temporal distribution of publications, there is a notable upward trajectory evident in the yearly publication trends, as illustrated in Figure 1. Since 1968, the number of published works has exhibited distinct characteristics comprising three phases. The period spanning from 1968 to 1996 is characterized by sporadic paper publications, reflecting the initial research enthusiasm within the academic community. During this phase, despite the technology being in its nascent stage of development, pivotal technological milestones such as the 1992 release of the desktop platform ArcView by ESRI and the promotion of Landsat satellite applications for civil purposes held significant implications for the overarching progress. The period from 1996 to 2005 displays a modest increase, signifying a growing research interest in the field and its escalating importance. Post-2005, there has been a substantial surge in the volume of articles, accompanied by a heightened adoption of GIS and RS applications within the ACH field and a notable proliferation of practical applications. Particularly noteworthy is the intensified growth observed after 2010, characterized by heightened research activity and increased research interest.
From a geographical standpoint, Italy boasts the highest count of academic articles, totaling 1419, thus ranking as the most prolific contributor among these nations (Figure 2). The United States and China also demonstrate notable scholarly productivity, yielding 843 and 580 articles, respectively. Notably, several countries, including the United Kingdom, Greece, and Poland, exhibit a substantial prevalence of single-author articles, signifying a penchant for independent scholarly output. Conversely, countries like China and Germany feature a significant prevalence of multi-collaborator articles, indicative of a prevalent culture of collaborative research. The substantial presence of numerous co-authors in these studies underscores the capacity of their respective disciplines to converge various professional backgrounds and research domains. This convergence fosters a synergy of complementary and diverse knowledge. The array of co-authors brings different viewpoints and research methodologies to the table, fostering a climate conducive to innovative thinking and interdisciplinary investigations. The diversity evident in co-authored papers contributes to a more holistic and integrated research perspective, thereby enhancing the richness and quality of academic research.
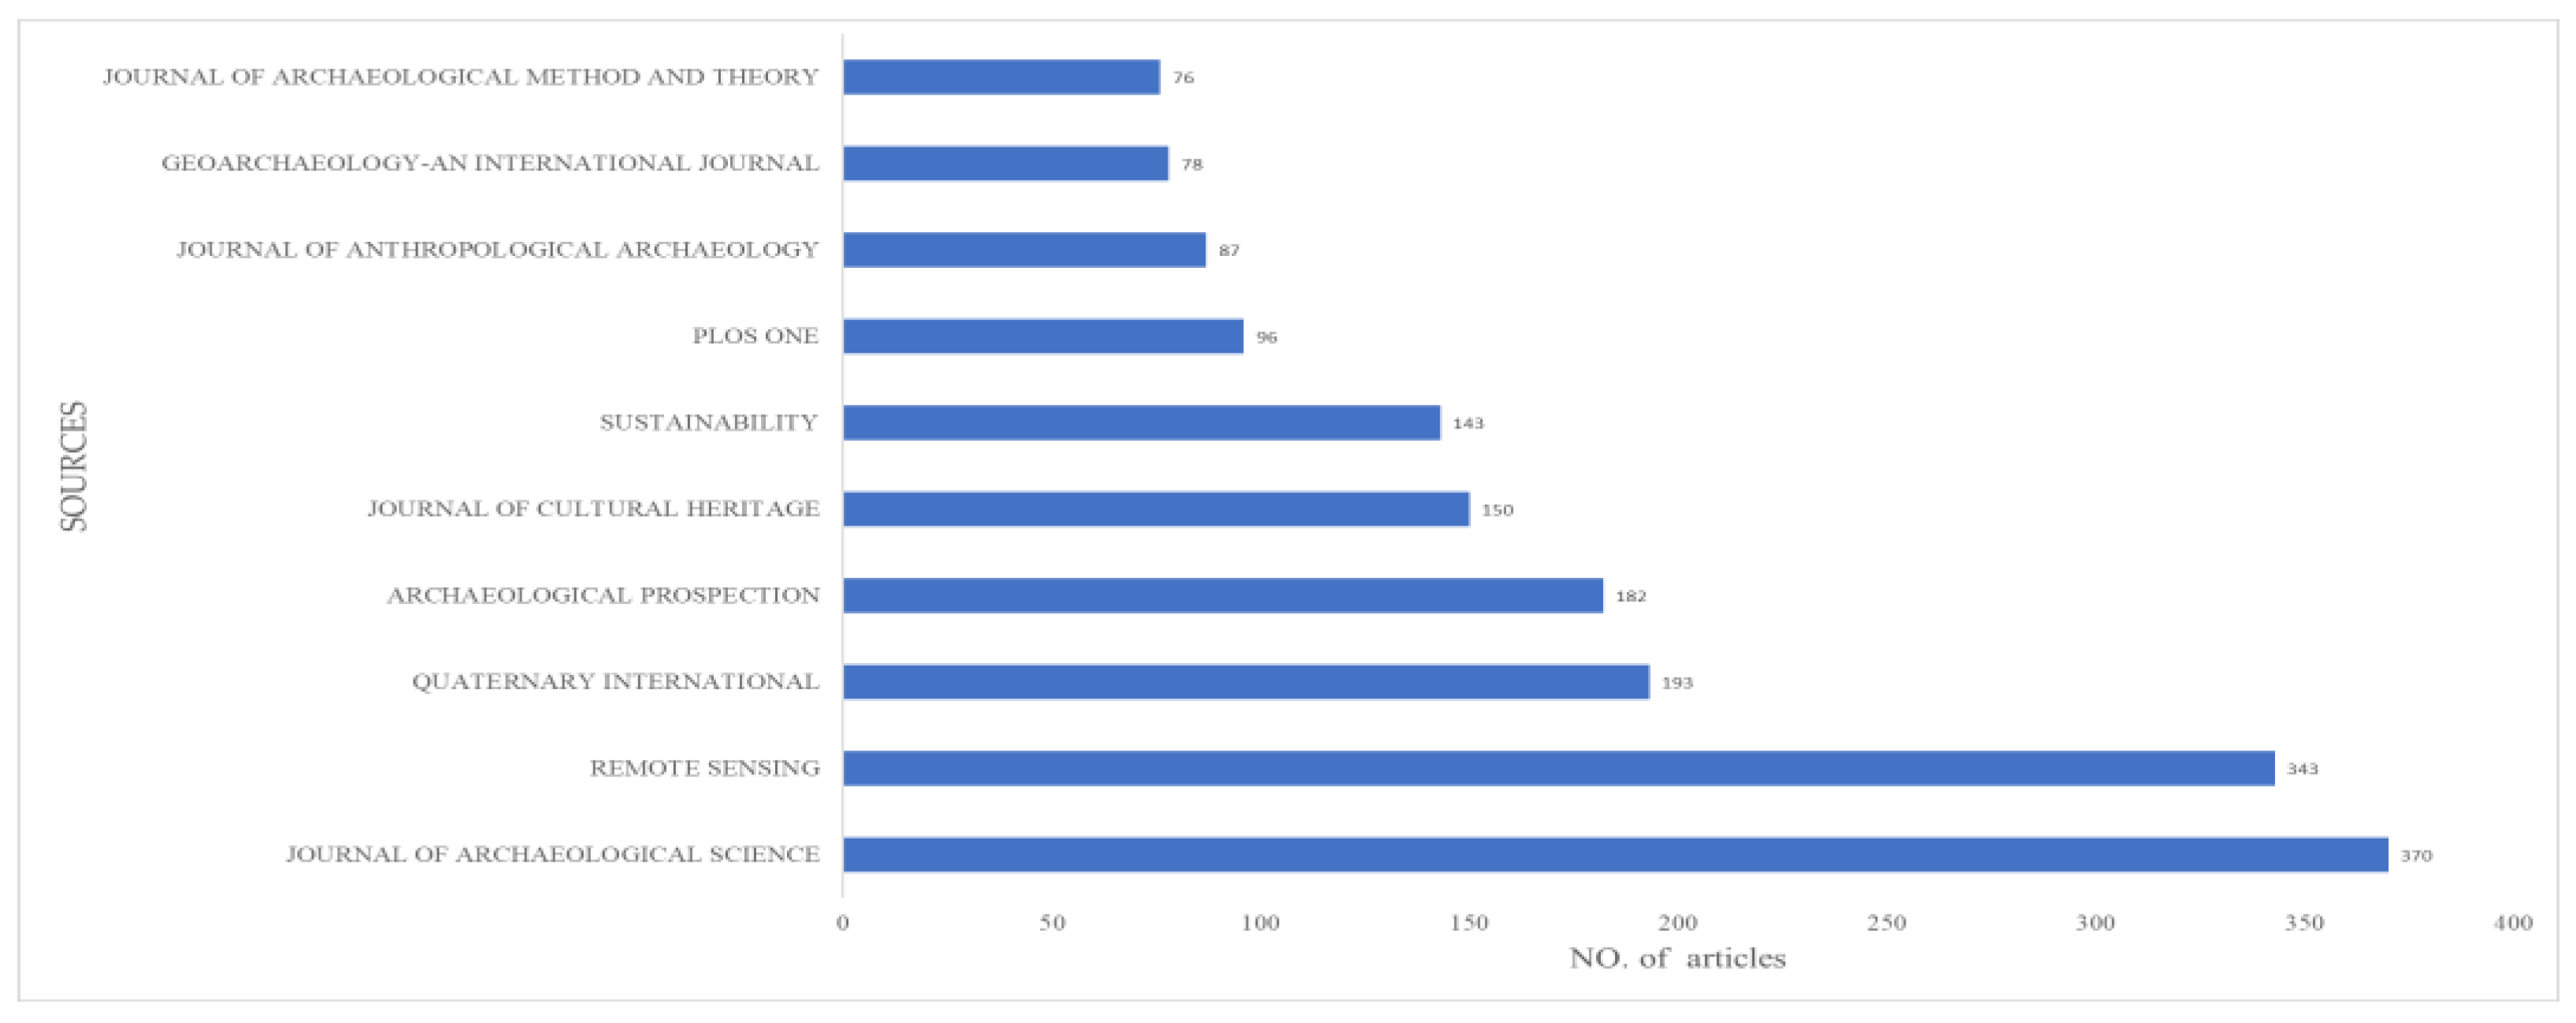
From a pool of 7741 published records, conference papers, book sections, patents, and similar document types were systematically excluded, resulting in the refinement of the dataset to a total of 4719 pertinent results. Subsequently, we conducted an analysis of journals that exhibited the highest relevance in the application of GIS-RS within the realm of ACH. Notably, journals with a primary focus on archaeology accounted for over 50% of the relevant publications, underscoring the considerable interest in the utilization of GIS-RS technology in archaeological research. In terms of article volume, the preeminent sources were found to be the Journal of Archaeological Science and Remote Sensing, both of which are potentially influential and widely circulated publications within the GIS-RS ACH domain. Concurrently, there exist journals that intersect various fields, including geographic information, remote sensing technology, cultural heritage preservation, and sustainability, such as PLOS ONE and Sustainability (Figure 3). This multifaceted journal landscape reflects the interdisciplinary nature of research in this domain.
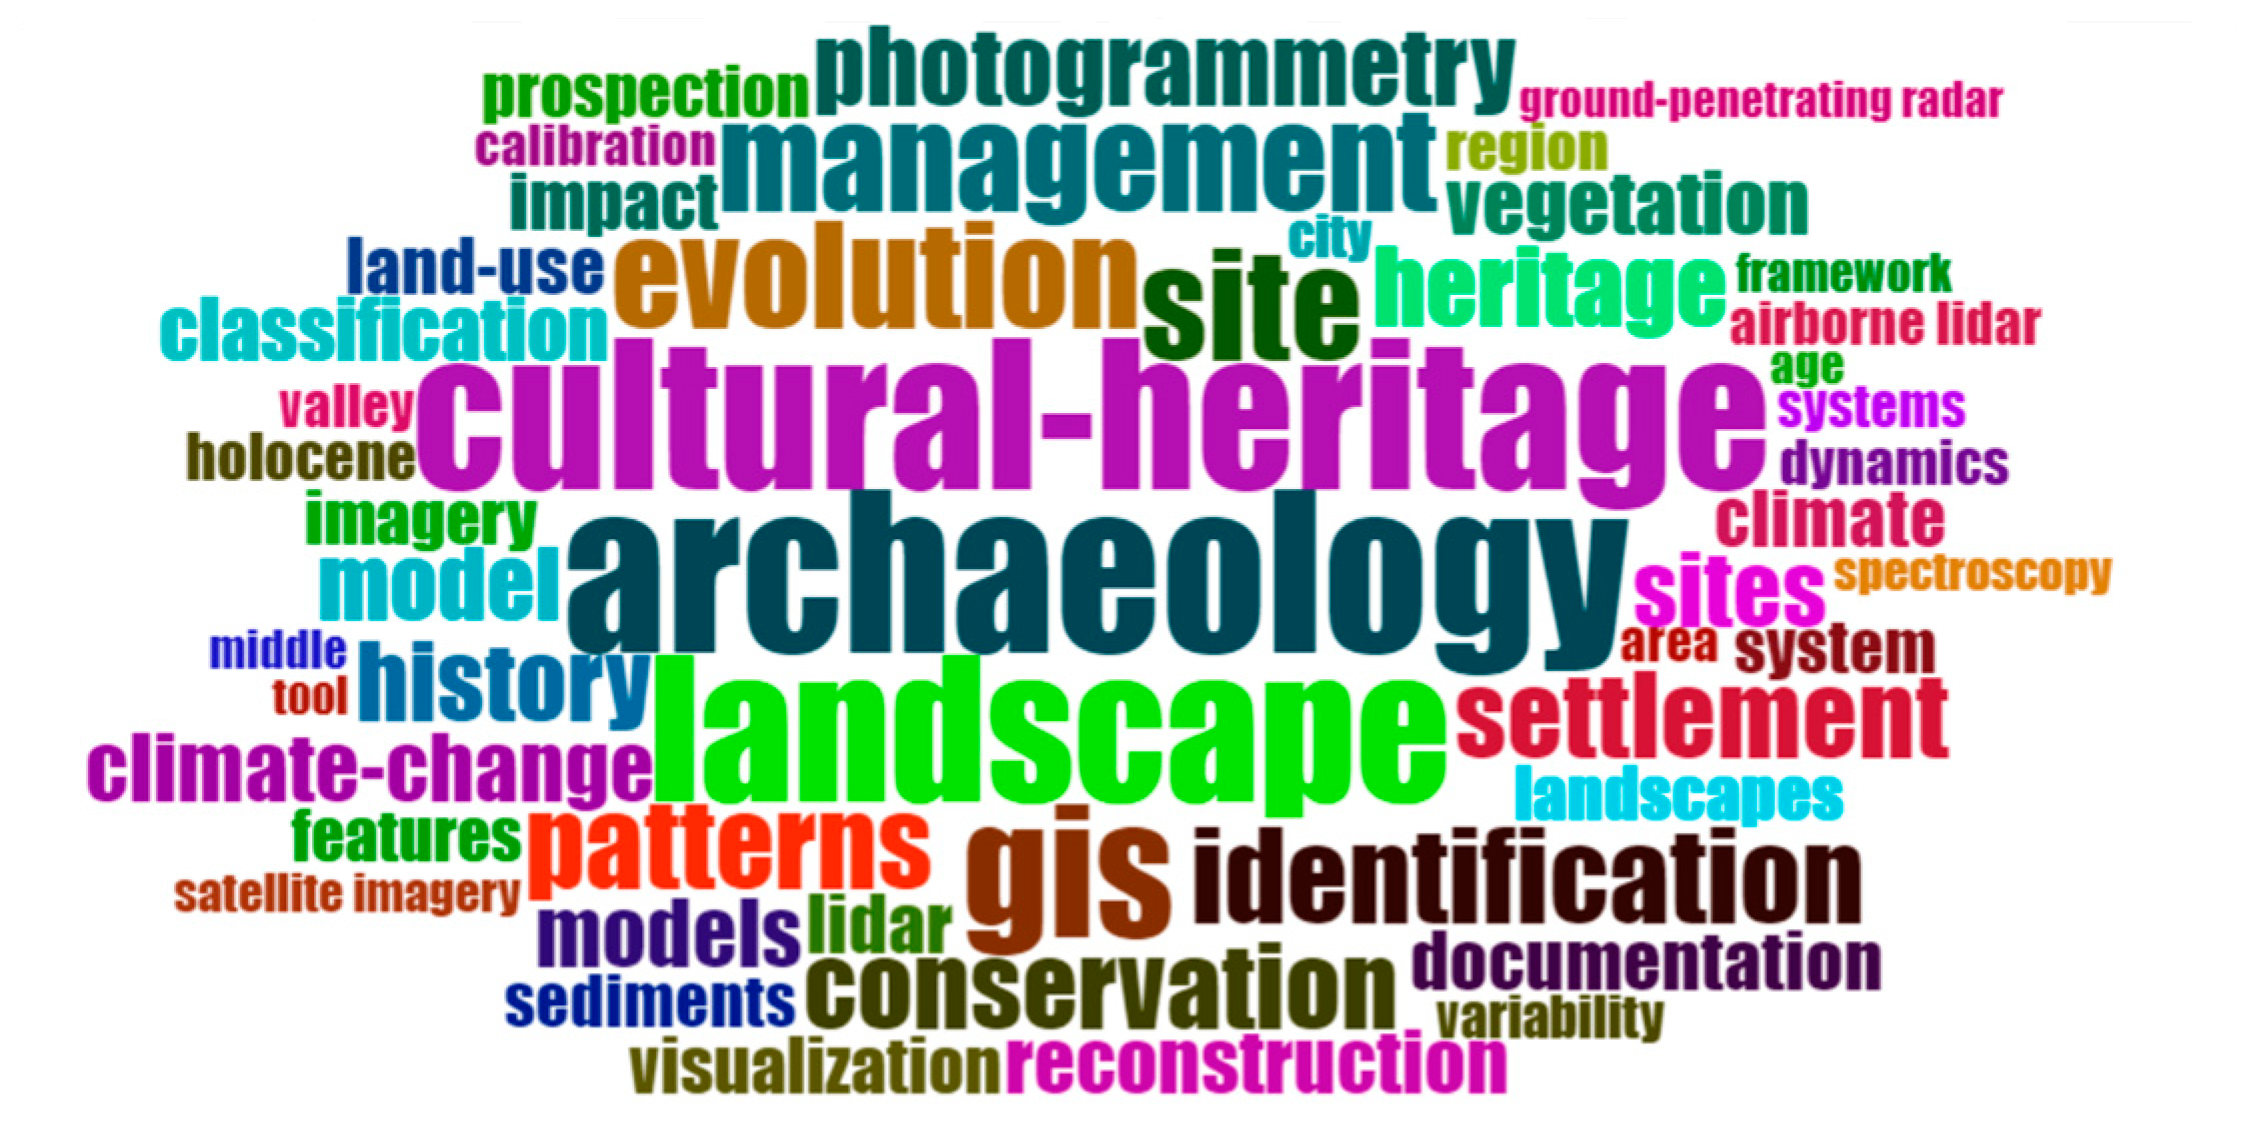
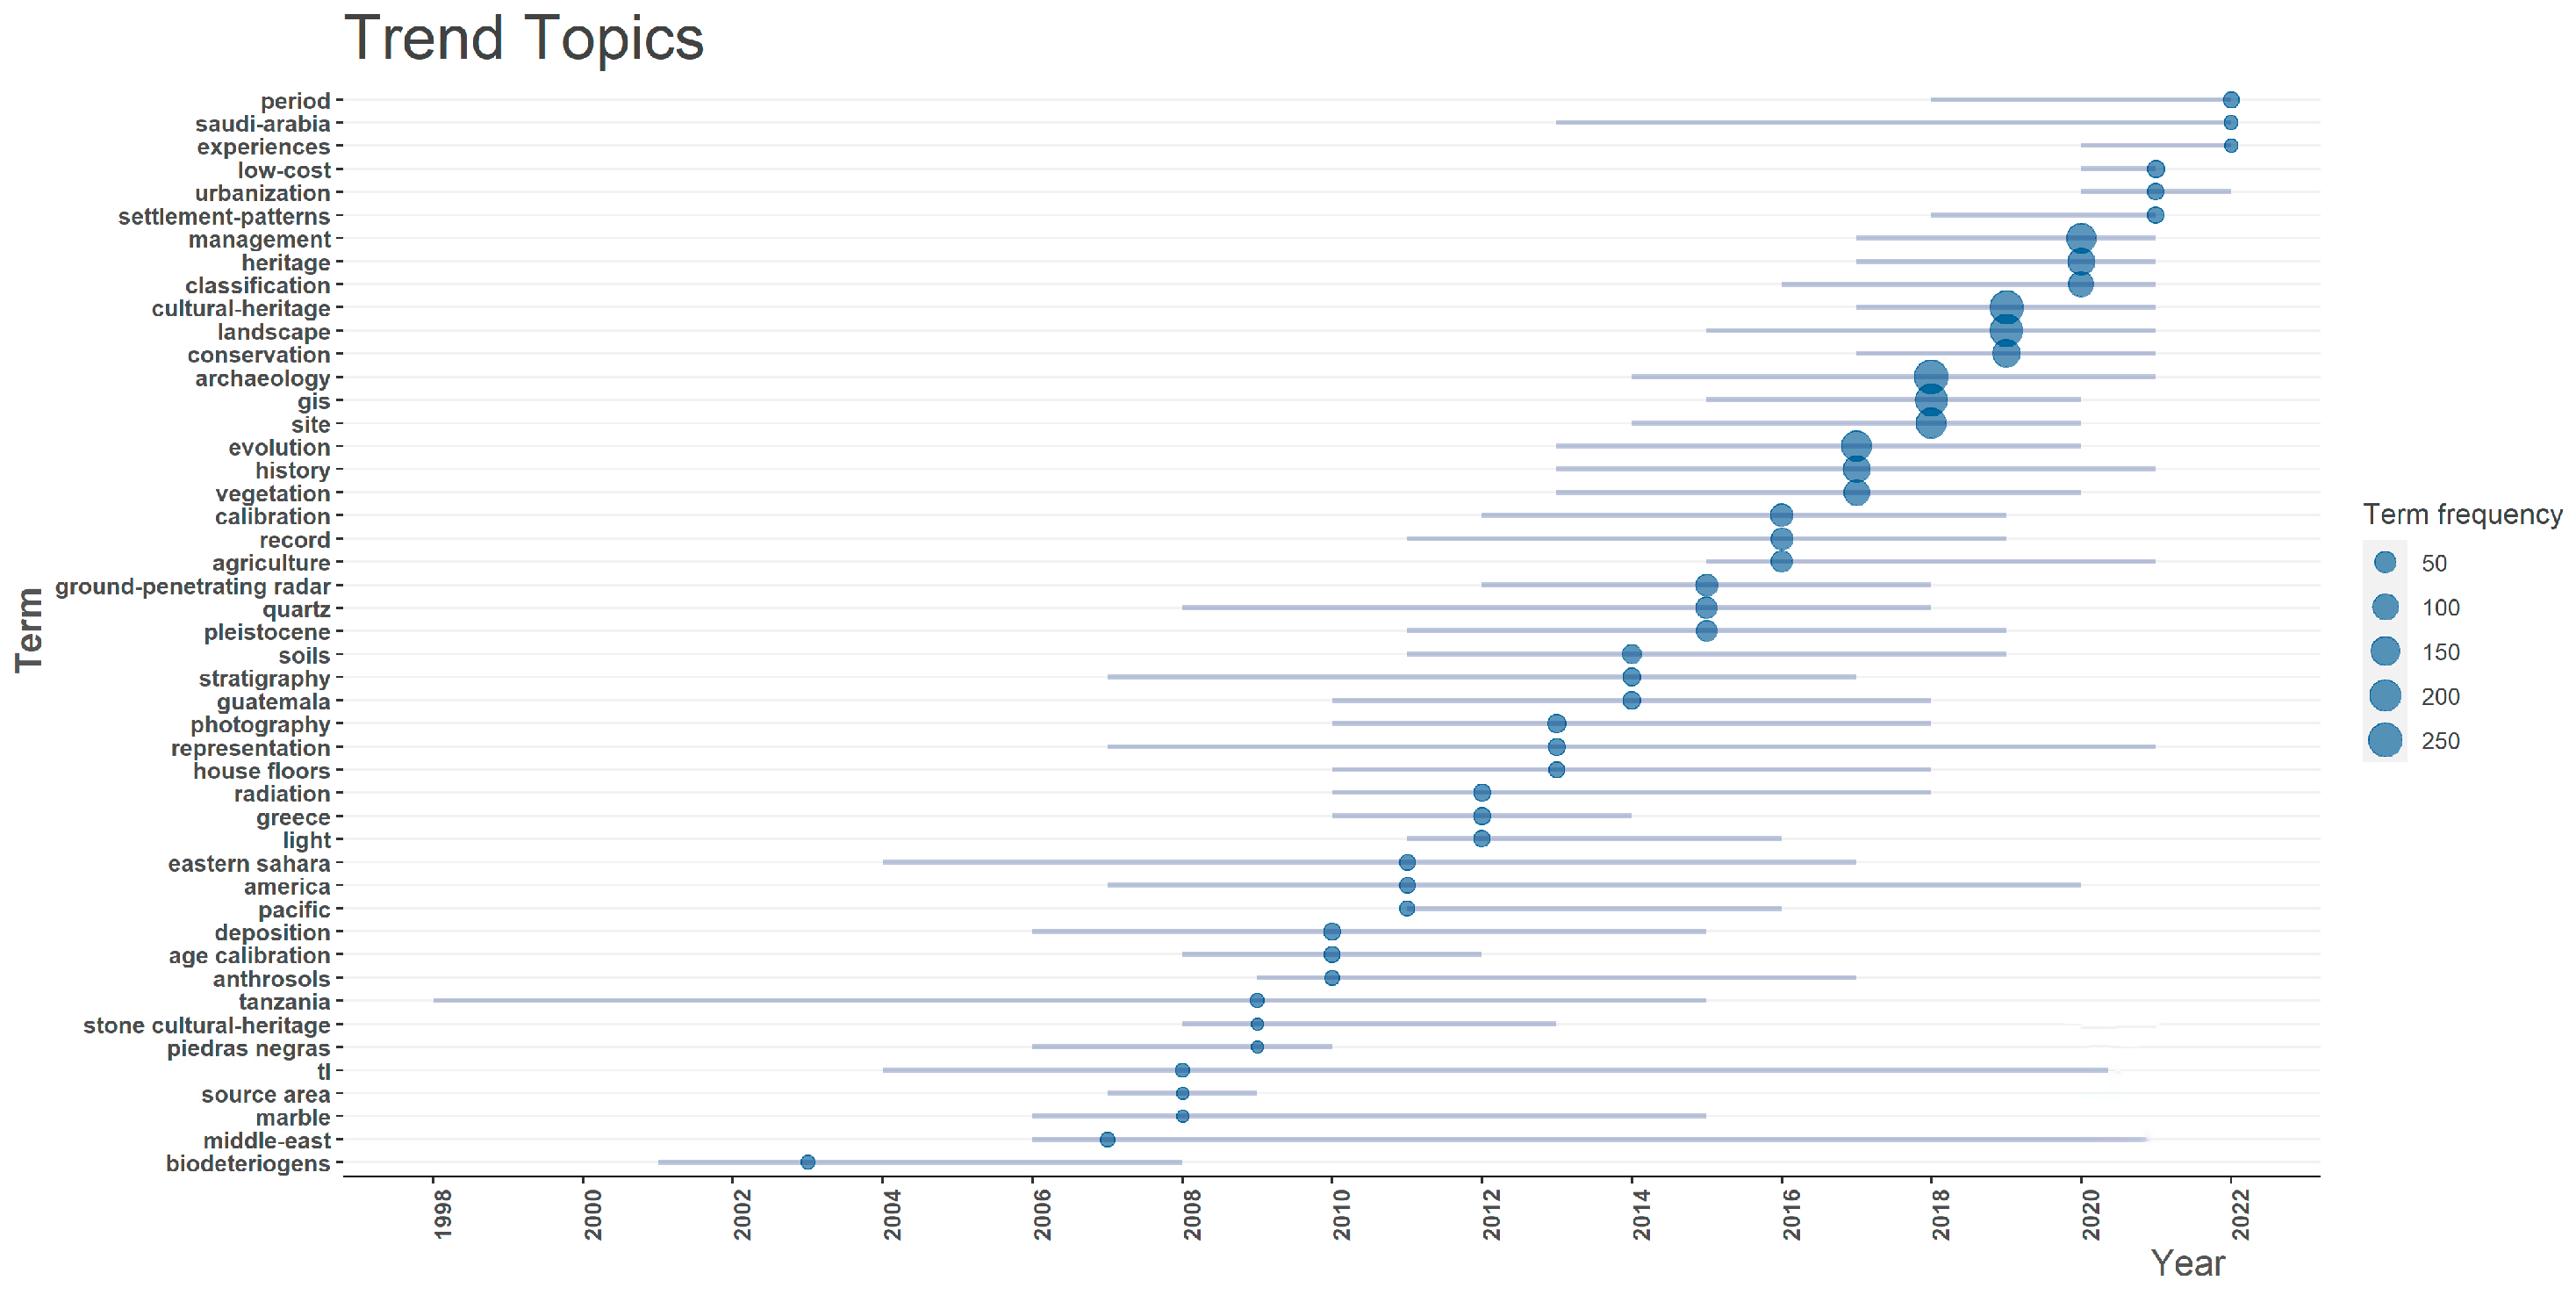
To gain deeper insights into pivotal subjects, methodologies, research trajectories, and emerging areas of significance, we conducted a meticulous analysis of keyword frequency and topic trends (keywords appearing more than three times per year), as delineated in Figure 4 and Figure 5. The empirical findings illuminate that most of these themes commenced their prominence in the early 2000s, with a consistent rise in research endeavors over time. “Archaeology” emerges as the predominant thematic focal point within GIS-RS research in the ACH domain, registering 238 occurrences, closely followed by “Cultural-Heritage” and “Landscape”, both appearing 229 times, respectively. Notably, “GIS” features prominently, manifesting 208 times, underscoring its pivotal role in archaeological inquiry. Furthermore, the recurring appearance of “Management” (163 occurrences), “identification” (149 occurrences), and “Conservation” (135 occurrences) underscores the profound concern within archaeology for the effective stewardship and preservation of cultural heritage resources. In terms of topical dynamics, it is noteworthy that certain keywords such as “urbanization”, “settlement-patterns”, and “human occupation” have only recently garnered scholarly attention, indicating emergent academic trends and research interests. Furthermore, since 2018, the “Climate-Change” thematic realm has emerged as a sustained focal point, representing a notable and enduring research trajectory in recent years.
The strategic diagrams, depicted in Figure 6, are a two-dimensional representation wherein the Density Index serves as the ordinate, and the Centrality Index is employed as the abscissa. Density denotes the robustness of interconnections among fundamental knowledge units within a specific subject area. When the density value of a particular topic is substantial, it signifies a heightened level of topic maturity. On the other hand, Centrality signifies the strength of a topic’s interrelation with other topics. When a topic exhibits a significant centrality value, it indicates close associations with other topics, positioning the topic at the core of all research subjects. The rectangular coordinate system divides the map into four quadrants, contingent on the density and centrality values [78,79]. As illustrated in the figure, the first quadrant features “archaeology site patterns” as a core theme exhibiting elevated maturity. The second quadrant encompasses highly mature isolated topics such as “staff identification spectroscopy history climate research”. Indeed, this observation aligns with findings in other literature reviews, confirming that the applications of remote sensing in archaeology have evolved into a distinct and specialized discipline within the field [80]. This recognition underscores the increasing significance and unique contributions that remote sensing brings to archaeological research and practice. In the third quadrant, “models lidar visualization” represents emerging topics that may either flourish or diminish in significance. Lastly, the fourth quadrant encompasses the theme of “cultural heritage landscape GIS management”, characterized by relatively low maturity, suggesting its potential as a future research focal point or trend.
It is important to acknowledge that while the database includes some foreign literature, the retrieval criteria primarily rely on English abstracts. Additionally, there is ongoing research in relevant fields involving non-English literature; however, the diversity of languages and inconsistent publishing standards pose challenges for classification. Consequently, conducting statistical analyses in this context proves cumbersome. Nonetheless, it remains imperative to underscore the significance of these non-English language studies in advancing this technology and enabling its broader and more profound utilization.
While, as mentioned above, it has been noted that GIS and RS pursue distinct technical objectives and may not develop synchronously, in practical applications, they are frequently integrated. In the following sections, we will provide an overview of the application of GIS-RS in ACH from different research aims. Two divides stand out: the ontological attributes of the ACH sites and the ACH environmental context. ACH encompasses both archaeology and cultural heritage, which, while interconnected, are distinct fields of study. The following sections will introduce the research related to archaeology and cultural heritage, respectively.

3.2.2. GIS-Led Applications in ACH

Due to different research concerns, the evolution of GIS applications in ACH follows distinct trajectories in archaeology and cultural heritage.
  • GIS in archaeology
The application of GIS in archaeology has brought about a transformative shift, equipping archaeologists with powerful tools to gather, analyze, and visualize geospatial data from archaeological sites. In the next section, we will provide an overview of the evolution of GIS in archaeological applications and offer brief insights into the various types of applications.
The emergence of the GIS concept took place in the late 1960s and early 1970s [81], but technological limitations at the time hindered its widespread adoption in archaeology. Nonetheless, archaeologists always exhibit a keen focus on geographical elements in archaeology research. The development of New Archaeology and Process Archaeology ushered in the application of quantitative and statistical analysis methods in archaeological research [82], providing a theoretical framework for the integration of GIS technology in this domain. In the 1980s and 1990s, with advancements in computer technology, the fusion of computer-based quantitative calculations and spatial analysis facilitated the application of GIS in archaeological research. This era also saw the earliest technical applications of archaeological GIS-MAPS [83]. The convergence of these technologies significantly improved researchers’ ability to analyze and interpret archaeological data within a spatial context, leading to valuable insights into past civilizations and cultural landscapes. During the 1990s and early 2000s, archaeologists began constructing digital databases that combined archaeological information with geographic data to enhance data management [84], analysis [85], and sharing [86]. Simultaneously, site prediction methods that used GIS tools for analyzing a variety of archaeological datasets, along with geographical background data, became increasingly popular [73,87,88]. This period saw the rise of landscape archaeology, which shifted the focus from social, economic, and political aspects to explaining spatial structural problems in archaeological research, especially in Europe [89,90,91].
Since the year 2000, as both technological capabilities and archaeological data accumulated, archaeologists began employing GIS for more complex spatial analyses, including landscape analysis and site distribution patterns [92]. The development of 3D GIS technology enabled archaeologists to reconstruct ancient sites in virtual environments, offering a better understanding and visualization of archaeological site structures and layouts [93,94]. In the 21st century, the enthusiasm for landscape archaeology and 3D exploration is expected to continue. Regarding research methods, mature archaeological GIS research increasingly emphasizes comprehensive analyses of multi-source data alongside other methodologies. Moreover, since the early 2000s, numerous archaeological projects have started sharing their data in Web-GIS, fostering broader academic and public participation and understanding of archaeological research. This trend indicates a growing openness and collaborative spirit within the archaeological community [95]. Indeed, the theoretical frameworks and analytical methods underpinning GIS techniques have attained a level of maturity in archaeology over the past 40 years of development. Mature archaeological GIS research places a greater emphasis on conducting comprehensive analyses of multi-source data in conjunction with other methodologies.
GIS served as an increasingly more common tool in archaeology over the past 40 years. It has demonstrated a diverse range of applications in archaeology, spanning from initial field investigations and excavations to subsequent analytical phases [46]. This enduring presence of GIS technology throughout the entirety of archaeological research, both locally and internationally, highlights its comprehensive utility. Specifically, GIS enables more systematic and effective database management, quantitative spatial analysis and geographic modeling, and visual display for archaeological landscapes.
In archaeological research, one of the most pervasive and fundamental applications of GIS lies in its role as a spatial database dedicated to archaeological sites [96]. Supported by specialized computer software(ArcGIS Pro, GRASS GIS, QGIS etc.) and hardware, GIS processes archaeological data in accordance with specific data standards and protocols. This enables the system to perform functions such as querying, browsing, mapping, and conducting spatial analysis of site collections and their associated environmental context [73]. In terms of data organization, archaeological sites and their corresponding geographical contexts within a given region are integrated into a comprehensive and cohesive system. This not only offers more efficient management tools but also liberates archaeological and cultural heritage data from the time-consuming, laborious, and potentially less secure manual management practices of the past [73,97,98]. With the advent of network technology, archaeological GIS has transitioned towards the realm of web-GIS, allowing for the recording, storage, and sharing of archaeological data in a virtual display format on the Internet. This advancement ensures seamless and immediate information exchange, eliminating temporal barriers.
The spatial analysis and geographic modeling of archaeological sites have emerged as the most extensive and prominent research direction for GIS in published archaeological studies. This prominence is owing to GIS’s capacity to integrate extensive environmental and archaeological site data alongside its ability to employ complex spatial models, thereby providing a foundation for constructing archaeological predictive models [73]. These models are typically established through statistical methods or soil erosion analysis, leveraging archaeological data like known site locations and geographical background information such as slope, aspect, and land cover. The resulting models are then computed, analyzed, and displayed within a GIS environment. Over time, archaeological predictive models have undergone continuous refinement, progressing from binary logistic regression [88,99,100,101,102,103], LAMAP (locally adaptive model of archaeological potential) [104], spatial autocorrelation methods [105,106], and the maximum entropy model [102,107] to the machine learning approach [108,109]. These advancements have significantly enhanced the accuracy of site prediction models, offering invaluable decision support for archaeological research.
With the evolution of archaeological focus towards human spatial mobility, the spatial analysis and geographic modeling of GIS have assumed a key role in landscape archaeology, which focuses on the analysis of spatial processes at archaeological sites [110]. GIS provides an array of spatial analysis and geographic modeling tools. Cost surface and network analysis tools, which are commonly used, have been instrumental in examining human migration routes and communication patterns [111]. Mitten’s study in 2002 utilized global Digital Elevation Model (DEM) data in conjunction with climate change data spanning the last 10,000 years to simulate the human migration out of Africa [112]. Bevan et al.’s research focused on the central settlement of Crete during the Bronze Age. They simulated the distinct influences on the settlement resulting from two different modes of spatial movement: foot travel and sea transportation. Their analysis led to the conclusion that maritime transportation played a significant role in the early Mycenaean civilization’s political and economic landscape [113,114]. GIS hydrological analysis is often used to analyze topographical elements and to explore the adaptation of early humans to topographical environments in archaeological studies [111]. Michael Frachetti improved hydrologic flow algorithms to simulate “herd flows” in rich upland pastures, resulting in a more detailed map of the Silk Road network and reconstructing the seasonal migration paths of herders along the Silk Road, arguing that the choice of paths was not random [115].
The rapid advancement of 3D and VR technology has also profoundly impacted archaeological research through the development of 3DGIS. Within this domain, one key area of focus is the landscape modeling of stratigraphic information in field archaeology. Pioneering work involved modeling archaeological site strata within a GIS platform, leveraging the platform’s built-in 3D capabilities and custom development [116,117]. Three-dimensional visual field analysis is a crucial tool in landscape archaeology. It is applied not only in settlement areas and military contexts but also in sites of religious importance. Tests of the effect of intervisibility between sites enable researchers to gain deeper insights into the spatial relationships and dynamics of these significant sites, providing a more comprehensive understanding of ancient civilizations and their environments [118,119,120]. Indeed, 3D GIS also plays a key role in the reconstruction and display of site landscape phenomena. By utilizing this technology, researchers can create virtual models that vividly represent the landscapes of ancient sites. This allows for a more immersive and detailed exploration of these historical locations, providing valuable insights into their layout, structure, and overall environment. Schuppert [121], for example, meticulously processed historical map data and archives from various sources, establishing a spatial database to reconstruct the early characteristics of the cultural landscape in early Celtic kingdoms in southern Germany. Similarly, Apollonion devised a digital framework for Pompeii, enabling the visualization of archaeological remains and their storage in a web-based 3D database [93]. All these endeavors in 3DGIS underscore the transformative potential of advanced visualization technologies in archaeology, offering new avenues for understanding and interpreting ancient sites and landscapes.
However, scholars have raised concerns about the potential over-interpretation in GIS-based landscape archaeology [122,123,124]. This highlights the need for thorough comparative analysis and reasoned speculation to draw reliable conclusions. It is essential to acknowledge that while geographical models play a crucial role in human activities under specific conditions, they may not capture the full complexity of human societies.
  • GIS in CH
The preservation and stewardship of cultural heritage constitutes the paramount mission of the cultural heritage sector, with GIS initially finding application within this domain. In 1992, pioneers in international heritage conservation spearheaded the utilization of GIS technology in delineating zoning and formulating environmental protection strategies for the Angkor Wat sites in Cambodia, thereby inaugurating the application of GIS technology in the realm of immovable heritage conservation [125]. Subsequently, prominent international organizations such as UNESCO, ICOMOS, and WMF have steadfastly endeavored to integrate GIS into the purview of conservation management and spatial analysis for cultural heritage [126]. UNESCO, for instance, has undertaken a series of pertinent operational initiatives, including the establishment of a heritage management and protection framework for the ancient city of Hue in Vietnam, the safeguarding of Angkor monuments in Cambodia, and the conduct of risk assessments pertaining to cultural heritage assets within Thailand’s historic city of Taikosu. In 1999, UNESCO additionally curated pertinent guidelines for the application of GIS within the domain of Cultural Resource Management (CRM) for cultural heritage management [127]. Furthermore, in collaboration with the World Monuments Foundation, the Getty Conservation Institute has conceived “Arches”, an open-source, web-based GIS tailored for the inventorying and administration of immovable cultural heritage [128]. These advancements catalyze the proliferation of GIS applications within the ambit of cultural heritage. Concurrently, they engender the integration of GIS applications across three key dimensions: the cultural heritage management platform, risk assessment, and heritage exhibition.
GIS serves as an invaluable platform for the comprehensive management of cultural heritage resources. It excels in handling a wide array of unstructured data related to cultural heritage, allowing for a more organized and efficient approach to preservation efforts. One significant application of GIS is in the inventorying of cultural heritage sites. This encompasses a diverse range of sites, from archaeological to architectural and historical structures [129]. Traditional recording methods often face limitations in terms of speed and accuracy when it comes to gathering and assessing current situation data. Moreover, these methods may not be well-suited for conducting quantitative scientific management and in-depth analysis. Utilizing GIS-based inventory systems enables the creation of digital inventories, which can help overcome traditional inventory methods. Additionally, the GIS approach not only enhances data accessibility but also offers advanced tools for analysis and decision-making in the context of cultural heritage conservation.
GIS assumes a pivotal role in the assessment of disaster risks to cultural heritage, primarily contingent upon its vector manipulation and spatial analysis, as well as modeling capabilities. In recent years, with the emergence of the concept of preventive conservation of cultural heritage, there has been a shift from post-disaster relief towards pre-risk disaster prevention, leading to the progressive implementation of disaster risk assessments. GIS-based assessment of disaster risks to cultural heritage primarily targets spatially heterogeneous disasters and human activities impact, involving earthquakes [130], floods [131,132], landslides [133], volcanic hazards [134], sea-level rise [135], tourism [136], and urbanization [18], etc. Leveraging the theoretical framework of natural disaster risk, along with the spatial analysis and data processing capabilities inherent to GIS, the assessment of disaster risk within cultural heritage areas is achieved through the integration of layers pertaining to disaster risk factors, environmental sensitivity to disasters, and vulnerability of cultural heritage. It facilitates regional calculations and the display of assessment results, offering a more intuitive depiction of risk outcomes. There are many practical application cases in GIS risk assessment of cultural heritage. For instance, G. Accardo extensively analyzed the methodology and significance of the Italian National Heritage Risk Map (RM) system [137]. Ionut Cristi undertook a risk and vulnerability assessment of the cultural heritage in the Valeoi Valley, Romania, employing the Analytic Hierarchy Process (AHP) in conjunction with GIS. Álvarez proposed a method for geological risk assessment pertaining to karst cave paintings and conducted a thorough geological risk assessment analysis of a culturally significant cave in Spain.
Three-dimensional GIS also demonstrates commendable proficiency in the visualization of cultural heritage. At the beginning of the 20th century, many scholars increasingly incorporated visualization technology and 3D GIS into the purview of cultural heritage management [138]. This is particularly conspicuous in the management of architectural–historical landmarks in Europe, wherein the 2D geographical query functionality was extended to encompass 3D dimensions [139,140]. The amalgamation of multi-source spatial data information within a systematic environment facilitated functionalities such as virtual roaming and three-dimensional spatial information retrieval rooted in heritage ontology. Furthermore, 3D GIS serves as a conduit for corresponding virtual analyses [141,142]. The visualization of cultural heritage information profoundly deepens comprehension. In tandem with the advent and maturation of technologies like 3D computer graphics, high-resolution rendering, artificial intelligence, and 3D printing, these advanced methodologies have progressively found widespread application in the realm of cultural relic preservation, augmenting endeavors in the preventive protection and restoration of cultural artifacts.
By and large, GIS offers efficacious and streamlined methods for the analysis, visualization, and management of cultural heritage. Additionally, it is imperative to recognize the increasing integration of GIS with an array of complementary technologies, encompassing RS, VR/AR, web, and mobile platforms. This convergence amplifies GIS’s technical prowess and facilitates the holistic stewardship of cultural heritage resources.

3.2.3. RS-Led Applications in ACH

Remote sensing serves as a key tool for obtaining Earth data through sampling various parameters such as wavelength bands, polarization, time, space, and angles. Its fundamental purpose, whether in the context of archaeological or cultural heritage research, is to transform the rich Earth information into more constrained and usable remote sensing data. With this approach, the primary objective is to extract pertinent information from remote sensing observations, facilitating the observation and monitoring of the research subjects in question.
  • RS in archaeology
Remote sensing exists as a traditional yet innovative method in archaeological applications [143]. Scholars have systematically reviewed remote sensing archaeology and case studies from different perspectives such as observation platforms (spaceborne, airborne, ground-based) [72,80,144], technical means (aerial photography, multi (high) spectrum, SAR, LiDAR, ground penetrating radar) [42,145], and application areas (China, Europe, Middle East, Latin America) [146]. In order to clarify the specific role of remote sensing in archaeological applications, as well as its advantages and limitations, we will briefly describe the history of remote sensing development and introduce the technical points of remote sensing target recognition and extraction for archaeological sites.
Remote sensing, as a non-contact and non-destructive detection method, has been a focal point in archaeology since the early 20th century. Its application dates to 1906 when a British lieutenant, Sharp, captured aerial photos of Stonehenge from a military balloon, marking one of the earliest instances of aerial archaeological exploration [147]. In 1919, British geographer and archaeologist O.G.S. Crawford introduced three interpretive markers (vegetation marker, soil marker, and shadow marker) for aerial photography archaeology, laying the theoretical groundwork for remote sensing archaeology [148]. While early aerial remote sensing primarily served military reconnaissance purposes, it inadvertently provided valuable imagery for archaeological investigations. Since 1959, spaceborne platforms have been employed in archaeology [80]. Over the ensuing decades, remote sensing satellites have made significant advancements in space capabilities, radiation technology, spectral resolution, and temporal resolution. Despite challenges such as cost, limited endurance, sensitivity to weather conditions, and airspace restrictions, satellite remote sensing has found wide application in archaeological research. From the late 1980s to the early 21st century, remote sensing archaeology predominantly focused on studying the relationship between large archaeological sites and their surrounding environments [72,80]. Medium- and high-resolution spaceborne optical multispectral images, particularly those from the Landsat series satellites, constituted crucial data sources for this research [80]. In the 21st century, there was a rapid emergence of high-resolution spaceborne imaging systems. Simultaneously, declassified high-resolution spy satellite imagery from the Cold War era began to be gradually made available. This led to an unprecedented surge in the development of remote sensing archaeology. Sub-meter optical/SAR image data from sources like CORONA [149,150,151], IKONOS [152], QuickBird [153], GeoEye-2 [154,155], SPOT-6/7 [156], WorldView-2/3/4 [157], Pleiades-1/2, Gaofen-2 [158], Radarsat-2, TerraSAR/TanDEM [159,160], COSMO-SkyMed [161,162,163], and ALOS-PALSAR-2 [164,165] have become favored resources for remote sensing archaeologists. High-resolution optical remote sensing images, known for their rich detail and precision, are widely used to meet the demands of fine identification in archaeological site detection and investigation. SAR (Synthetic Aperture Radar) remote sensing, with its penetrative capabilities, is particularly effective in detecting subsurface archaeological features, especially in arid desert regions [166]. Stewart et al. [167] identified linear archaeological features beneath the sandy stratum in the Sinai Peninsula through an analysis of the backscattering properties exhibited in L-band PALSAR-1/2 imagery. Additionally, Chen et al. [168] discerned subterranean archaeological structures proximate to the Dunhuang Yumen Pass site by computing the mean backscattering attributes across various temporal epochs of PALSAR-2 imagery. The rapid advancement of Unmanned Aerial Vehicle (UAV) technology over the past decade has significantly enhanced low-altitude remote sensing. UAVs and UAV-lidar have gained popularity in the field of archaeology due to their capability to operate effectively under cloud cover [54,169,170].
The principal aim of remote sensing archaeology research is to extract crucial contextual information pertaining to archaeological sites from an array of remote sensing imagery. This undertaking not only facilitates the elucidation of archaeological knowledge but also makes substantial contributions towards a more comprehensive understanding of regional paleoenvironments. With the ongoing advancement of sensor technology, the availability of multispectral, radar, and hyperspectral imagers has enriched the pool of remote sensing data accessible for archaeological research. Nonetheless, owing to the diverse cultural attributes, typologies, and intricate contextual settings of archaeological vestiges, a universally applicable set of spectral attributes remains conspicuously absent [171]. To date, despite the existence of numerous successful instances within remote sensing archaeology, the establishment of a standardized framework for applied research remains unrealized.
Indeed, much of the current research in this field relies on the three primary indicators for archaeological interpretation: vegetation markers, soil markers, and shadow markers. Researchers analyze spectral, geometric, and backscattering attributes in remote sensing images, employing techniques such as band operations [171], image classification [152], image fusion [172], and image transformation [173]. These technologies and methods, whether applied through visual or computer-based interpretation, play a vital role in the detection and identification of archaeological site targets. The advancement in remote sensing and digital image processing technology has led to the popularity of semi-automatic recognition and extraction algorithms for archaeological sites using high-resolution optical images in remote sensing archaeology [174]. A range of valuable archaeological research outcomes have emerged thanks to such semi-automatic techniques. These researches involve gray threshold segmentation [175], threshold segmentation combined with template matching [176], as well as the utilization of geometric features and Niblack genetic algorithms [177]. Additionally, the ISODATA supervised classification method and the object-oriented FX extraction method have been instrumental in leveraging the spectral characteristics of high-resolution images for archaeological target detection and identification [152,178]. With the development of automated methods in remote sensing image recognition and extraction in the past decade, valuable insights and new approaches have been provided for the automated identification and extraction of archaeological site targets through remote sensing [158,179,180,181,182,183]. Particularly noteworthy is the growing prevalence of machine learning within the domain of remote sensing since 2012, a trend that has served to mitigate the algorithmic constraints associated with archaeological remote sensing feature extraction. Machine learning and deep learning algorithms have engendered the formulation of helpful cases. Mehrnoush Soroush et al. used deep learning to automatically detect Qanat shafts on CORONA satellite images in the Kurdistan region of Iraq [181].
In general, the detection of archaeological sites via remote sensing is susceptible to the impact of a multitude of intricate environmental variables. To elucidate the correlation between spectral attributes and archaeological targets, it is imperative to account for the material composition, soil attributes, climatological parameters, phenological traits, and processes of environmental change pertaining to the site. Regardless of the method employed for image extraction, remote sensing target identification falls under the category of supervised approaches. The expertise and prior knowledge of trained professionals are of paramount importance in this regard. Furthermore, owing to the intrinsic uncertainty and ambiguity inherent to archaeological sites, disparate researchers may harbor divergent spatiotemporal interpretations of a singular site. As a result, whether contingent on manually visually interpreted extraction findings or algorithmically automated detection, the expertise and prior acumen of trained professionals wield a considerable influence on the precision and accuracy of the results.
  • RS in CH
From the 1960s to the 1990s, with the breakthrough development of satellite technology, satellite-, aerial-, and ground-based remote sensing techniques gradually expanded from the field of remote sensing archaeology to collaborative observations used for cultural heritage sites and their surrounding environments. Since the 1990s, there has been rapid development in technologies such as remote sensing, GIS, GPS, VR, information communication, network technology, and scientific big data. Concurrently, with the establishment of a monitoring system integrating various remote sensing technologies, including high-resolution optical, radar, and LiDAR, remote sensing technology has permeated the entire process from cultural heritage resource survey, refined monitoring, and documentation to preventive conservation.
The reasonable application of remote sensing technology in the census and registration of cultural heritage can quickly obtain more accurate and detailed information about the spatial location and construction control zone of immovable cultural relics and provide a scientific basis for decision-making on immovable cultural relic protection policies and planning [184,185,186]. Remote sensing data enables overcoming limitations imposed by climatic conditions and observation periods, allowing for the rapid, accurate, and macroscopic acquisition of information regarding the surface and near-surface cultural heritage. Employing techniques encompassing visual interpretation and intelligent analysis, the spectral and spatial attributes of cultural heritage within high-resolution satellite imagery can be discerned and pertinent data extracted. This enables cultural heritage departments to expeditiously and accurately grasp fundamental information such as the quantity, distribution, characteristics, and preservation status of immovable cultural artifacts [185]. This meticulous and intricate spatial data, in consequence, serves as a scientific foundation for the formulation of policies and strategic blueprints for the safeguarding of immovable cultural relics.
The interpretation and analysis of high-resolution satellite imagery facilitates the swift acquisition of information regarding the execution of protection plans within immovable cultural artifact protection zones, allowing for the timely identification of issues such as unauthorized construction and damage to immovable cultural artifacts. This, in turn, provides an objective reference for law enforcement actions, thereby aiding grassroots proactive law enforcement. The corona satellite data, extensively utilized in archaeology and cultural heritage surveys [149], despite its absence of GPS coordinate data and notable geometric distortions, boasts attributes including high spatial resolution (with KH-48 achieving up to 1.8 m), provision of stereoscopic pairs, and convenient accessibility [187]. These characteristics enable clear imaging of cultural heritage that has already suffered damage. Multispectral imaging technology from satellites has also found successful applications in the preservation of built heritages. This includes the use of visible and near-infrared band images to determine vegetation normalization parameters and near-infrared surface temperatures in order to differentiate between artificial environments and natural surroundings [188,189,190]. This, in turn, facilitates the detection, perception, and reconstruction of a built heritage and cultural landscapes. Additionally, by comparing multi-temporal remote sensing images, dynamic monitoring of construction changes within controlled development zones can be conducted, allowing for a timely understanding of construction statuses and alterations. This enhances the intuitive and visual aspects of management while also providing witness to the historical evolution of immovable cultural artifacts.
Based on remote sensing data and interpretation methods, it is possible to conduct refined monitoring of both the core elements of cultural heritage and their associated environments, with the goal of conducting disaster risk assessment and preventive conservation of cultural heritage. Particularly, the integration of multi-source and multi-temporal remote sensing data offers a natural advantage for detecting changes in cultural heritage.
Indeed, the essence of preventive protection for cultural heritage lies in conducting thorough and meticulous risk identification and analysis for heritage and subsequently implementing tailored risk prevention measures. InSAR plays a crucial role in the health diagnosis and monitoring of immovable heritage ontologies. Compared to active remote sensing, passive satellite remote sensing systems have made significant advancements in radiation, spectral, and spatial resolution. However, their usability is hampered by obstructions such as vegetation, clouds, and atmospheric particles. On the contrary, microwave and radar satellite systems utilize active sensors, allowing them to observe target areas continuously and, to some extent, penetrate through soil, vegetation, as well as atmospheric conditions like haze, clouds, smoke, rain, and snow to gather effective data. Immobile cultural artifacts are susceptible to threats from natural weathering, foundation corrosion, and human activities, necessitating various means of measurement, monitoring, and protection. InSAR can achieve measurement precision at the centimeter to millimeter level. It holds significant potential in monitoring structural deformations of a built heritage, changes in the surrounding environment, and surface instability, as well as quantitatively assessing risks and providing early warning for these issues. By estimating displacement values along the radar line of sight (LOS), InSAR can detect motion imperceptible to the naked eye, enabling the assessment of deformation in a built heritage structures (such as cracks, displacements, ground subsidence, brick and stone tilting, collapse) [191,192]. InSAR interferometric measurement technology is considered a high-precision, low-cost deformation monitoring technique. Furthermore, through the inversion of abnormal deformations obtained from SAR satellite data and temporal analysis, coupled with specialized data on hydrology, geology, urbanization, and other relevant topics, it is possible to accurately diagnose the causes and mechanisms of damage to architectural sites [193,194].
Additionally, by integrating high-resolution satellite remote sensing data with basic environmental data, it is possible to monitor structural changes in the heritage environment context for risk assessment. Due to the direct exposure of most cultural heritage sites to the natural environment, they are highly susceptible to atmospheric pollution and acid rain, which accelerates their erosion and damage. A comprehensive approach utilizing optical and microwave remote sensing is employed to monitor the types and concentrations of harmful gases and fine particles within the protected areas of immovable cultural relics. Through the comprehensive use of technologies such as optical and microwave remote sensing, harmful gases and fine particulate matter types and concentrations within immovable cultural artifact protection zones can be monitored, allowing for the determination of the extent and severity of atmospheric pollution [195,196]. Through long-term monitoring, a substantial dataset of atmospheric environmental information is accumulated within the protected areas of immovable cultural relics. This dataset serves as a robust foundation for the development of preservation, restoration, and maintenance initiatives for these invaluable cultural assets. Additionally, activities such as tourism, agriculture, and urban expansion can be fine-tuned through monitoring. Researchers can interpret various types such as CORONA satellites, Landsat series satellites, DMSP-OLS nighttime light data, and multi-temporal satellite images within a certain range around a built heritage, calculate changes in land designated for construction use, study and analyze the spatial pattern of urban sprawl, and predict future trends in urban expansion, thereby assessing the adverse impact of urban expansion on a built heritage [197,198,199].
In conclusion, remote sensing technology also holds immense potential in the realm of cultural heritage conservation and management. Although spatial technologies, represented by satellite remote sensing, were initially not designed for heritage preservation, the acquisition of multiscale and multi-temporal remote sensing observation data from various observation platforms, such as ground-based, aerial-based, and satellite-based platforms, in accordance with the diverse application scenarios and requirements of cultural heritage conservation and management, has become a standard method applied throughout various stages of cultural heritage resource survey, risk assessment, and monitoring. This underscores the increasingly integral role of remote sensing technology in the routine practices of cultural heritage management and protection. Remote sensing technology exhibits good applicability in the risk assessment and dynamic monitoring of cultural heritage in remote or poorly accessible areas, linearly distributed multi-heritage areas, and circularly distributed multi-heritage areas. Additionally, it complements the commonly used ground-based point measurement and monitoring techniques. It is important to note that the application of remote sensing in heritage conservation is still in its early stages. Effectively leveraging satellite data, establishing reliable data processing strategies, integrating field survey data, as well as fundamental data in hydrology, geology, economics, and historical records, and making accurate and comprehensive judgments on the causes and development trends of risks to cultural heritage poses a new challenge.

4. GIS-RS Applications in ACH of BAR

4.1. Sites Identification

The surveys of ancient sites along the BAR present notable challenges owing to the rugged terrain and safety considerations. The Silk Road traversed arid regions with challenging geographical features, notably in northwest China and Central Asia. These regions are typically characterized by arid climates and extensive desert terrain. Cultural heritage sites are scattered across these sparsely inhabited landscapes, making it challenging to access pertinent information. This renders the utilization of conventional archaeological techniques less effective in uncovering archaeological sites in this uncharted region. However, the presence of shallow archaeological features, aridity, and limited human disturbance render these areas ideal for remote sensing archaeology. The following two case studies exemplify the application of remote sensing archaeology within this unique context.

4.1.1. The Great Wall Linear Archaeological Site (GLASS) Identification

As a significant component of the cultural heritage within the Hexi Corridor of the Silk Road, the Great Wall of the Han Dynasty stands as an extensive and intricate military defense system. The sites associated with it encompass diverse categories, some of which have not yet been definitively confirmed through on-site archaeological exploration or excavations. The region flanking the Great Wall of the Han Dynasty is situated within an ecologically delicate and sensitive area susceptible to frequent environmental disruptions. This vulnerability exposes the Han Dynasty Great Wall site to varying degrees of natural and anthropogenic deterioration. Hence, the swift and accurate assessment of the present condition of the Han Dynasty Great Wall site, along with its objective evaluation and analysis, holds paramount practical significance. This endeavor is integral to the monitoring and preservation of the Great Wall site of the Han Dynasty and its enduring sustainability. A substantial portion of the Great Wall sites from the Han Dynasty era has either vanished or become entombed beneath sand dunes, Gobi, and Yadan landforms. In specific locales, only remnants of walls or beacon towers of limited height remain. Moreover, these vestiges are predominantly situated within Gobi and desert terrains, rendering them seldom frequented or challenging to access. Consequently, executing extensive, multi-frequency, ground-based archaeological investigations proves to be a formidable undertaking.
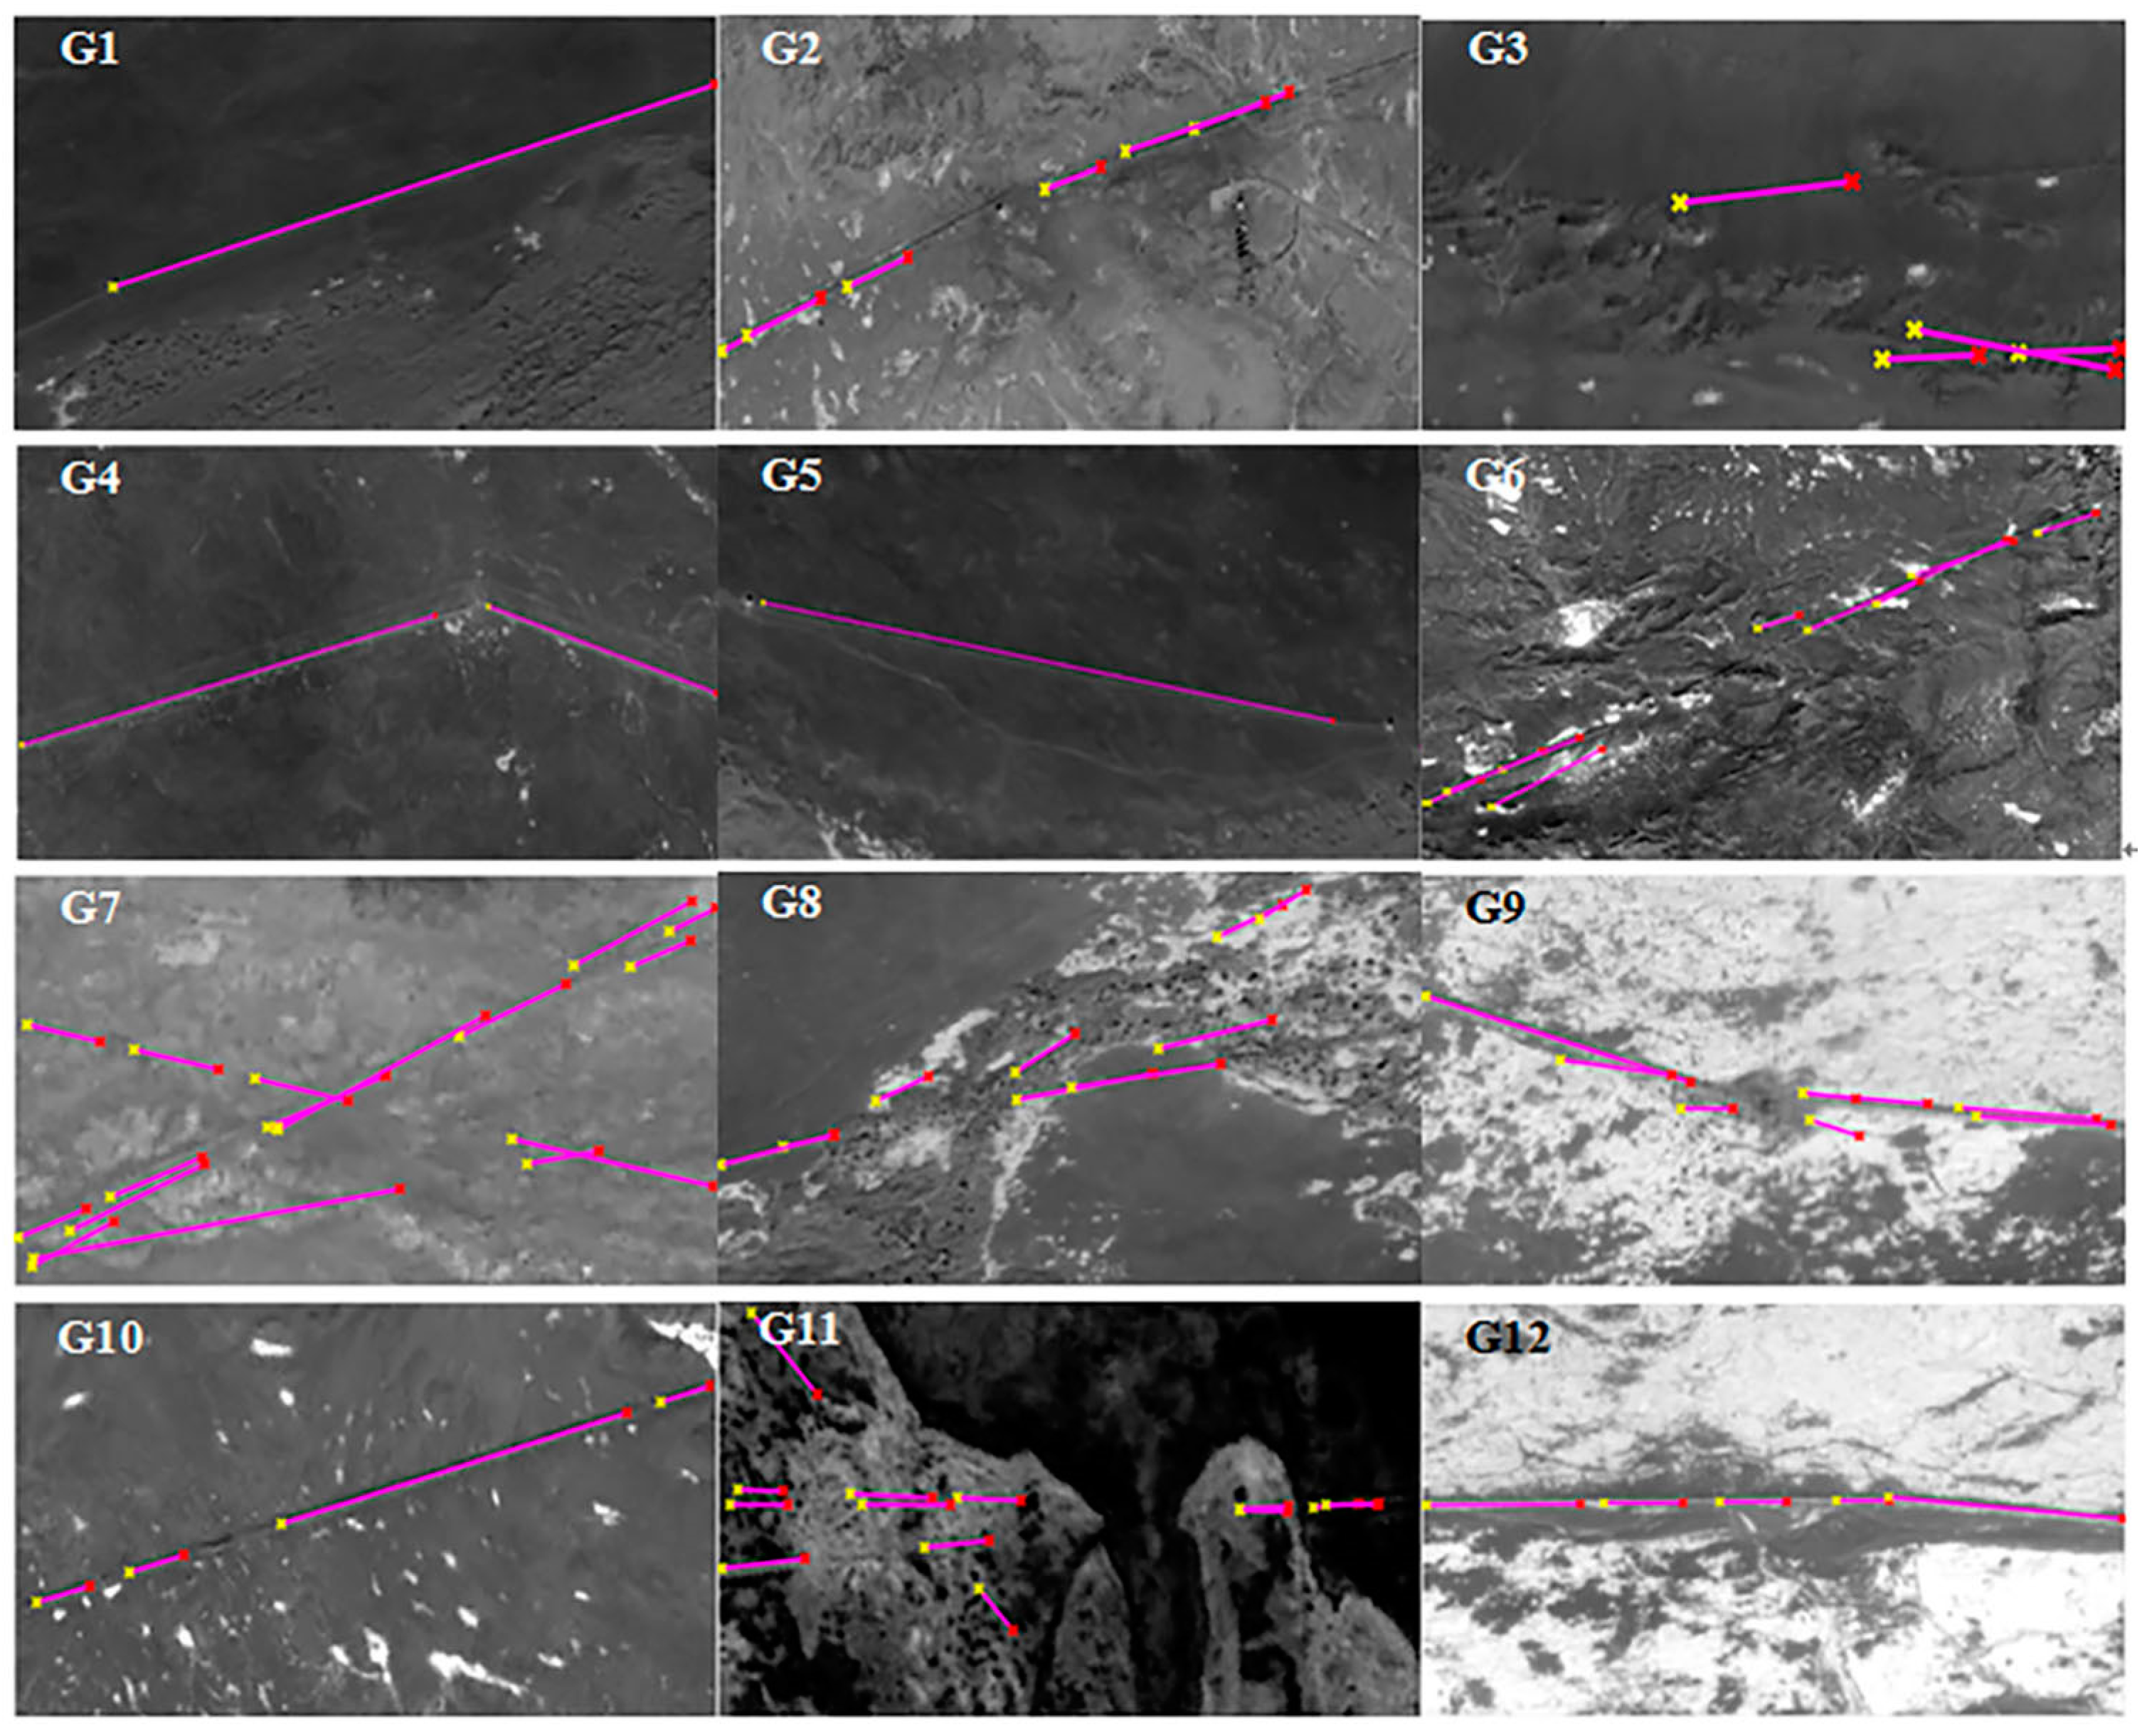
Luo [179] utilized very high-resolution (VHR) satellite remote sensing imagery in the vicinity of the Dunhuang Shazhou area for the automated identification and extraction of linear archaeological sites (linear targets) and beacon sites (point targets) along the Han Great Wall. Initially, the GF-1 data were subjected to image calibration and mathematical morphology for enhancement. The spectral characteristics of GF-1 multispectral data were analyzed using the M-statistic, revealing that the spectral separability index of the Dunhuang–Guazhou GLASS line was consistently below 1. In the case of GLASS, it was found to be challenging to differentiate it from the background using spectral information, as the M-statistic values in the PAN band and the near-infrared/red ratio index were only marginally higher than 0.5. Analysis of the GF-1 PAN image revealed that the high spatial resolution made the linear features of the Han Great Wall highly discernible in the imagery, offering a new approach for the automated identification and extraction of linear archaeological sites along the Han Great Wall. Smooth filtering was applied to the GF-1 PAN data to mitigate the influence of local noise inherent in the image on the grayscale characteristics analysis of GLASS. Based on the statistical analysis of the grayscale histogram, a threshold segmentation algorithm was employed for image segmentation. A comparison of various thresholding methods, including the comparative bimodal method, iterative method, and maximum inter-class variance method (Otsu’s method), revealed that Otsu’s method was better suited for image segmentation in the case of GLASS. The results of typical regional extraction are presented in Figure 7. This methodology attains an 80% accuracy rate within Dunhuang, characterized by a homogeneous background, thus affirming its efficacy in discerning linear traces. The objective is to ascertain the archaeological characteristics of the Han Dynasty Great Wall in Dunhuang, China. Furthermore, this approach holds potential applicability in identifying analogous linear traces of various iterations of the Great Wall of China across diverse geographical regions.
In subsequent work, Yang puts forth an enhanced DeepLabv3+ model designed for the identification of archaeological traces, with a specific emphasis on the Great Wall of the Han dynasty in northwest China. This model leverages very high-resolution aerial imagery. The enhancements introduced to the DeepLabv3+ model involve the substitution of the encoder module with a pre-trained ResNet101 to acquire more profound features. Additionally, the Dice coefficient is incorporated into the loss function to enhance accuracy, particularly in scenarios characterized by imbalanced distributions of positive and negative samples [183].

4.1.2. The Limes Linear Archaeological Site Identification

Tunisia is located at the western end of the ancient Maritime Silk Road and served as a vital maritime trading hub during the Roman era. In the early ninth century B.C., the Phoenicians established the city of Carthage on the gulf coast of present-day Tunisian, and it later developed into a powerful player in the area. In 146 B.C., Carthage became part of the province of Africa in the Roman Empire. The Myra Valley Corridor, in the southwestern part of Gafsa, Tunisia (Figure 8), was an important border crossing between the Roman Empire and the ancient Berber world, which communicated with the southern Sahara Desert and the northern Friana desert steppe. The Romans built a military defense system on their border, consisting mainly of sidewalls and associated military facilities, including linear defense systems (sidewalls and ditches), as well as fortresses, beacons, and observatories. Tunisia’s prosperity during the Roman Empire was attributed to its strong military defenses and the use of developed agricultural facilities. Unfortunately, these massive remains have disappeared.
Nabil conducted a reconstruction of the ancient Roman border defense system in Tunis, employing GIS buffer analysis and overlay analysis based on historical records to identify new suspected areas from remote sensing images. Subsequently, suspect sub-regions were delineated in high-resolution remote sensing images, and these areas were subject to interpretation, verification, and integration with completed GNSS-based archaeological surveys. Pixel-scale spectral analysis, coupled with Local Indicators of Spatial Association (LISA) spatial analysis methods, facilitated the pinpointing of these regions using 1 m resolution Worldview images (Figure 9). The unsupervised classification outcomes revealed a distinctive spectral anomaly indicative of the transition zone between desert steppe and vegetation-free land. Notably, LISA classification significantly enhanced the accuracy of unsupervised classification and the recognition of archaeological features. The findings of this study enable a more precise identification, localization, and mapping of various types of new archaeological sites within the study area.
The research outcomes culminated in more intricate identification, localization, and mapping of various types of new archaeological sites within the study area (Figure 10). Notably, ten archaeological sites dating back to the Roman period have been unearthed in southern Tunisia. These findings were corroborated through remote sensing interpretation and subsequent field investigations. Among these sites are three sidewall locations, two military fort sites, an irrigation system, three water cellar sites, and one burial site. These remains reveal the layout of the southern military defense system and the structure of the agricultural irrigation system during the ancient Roman period [200].
The two case studies previously discussed both occur in a similar geographical context, specifically within the Gobi Desert area, characterized by relatively minimal surface interference. This unique environmental setting presents distinct advantages for the identification of linear heritage sites. Located at the eastern and western ends of the Silk Road, these regions exhibit archaeological sites with similar morphological features. Although the primary research focus may not be the examination of attack and defense structures at both ends of the Silk Road from an archaeological standpoint, the linear nature of these sites, as identified through remote sensing techniques, yields significant insights for comparative East–West archaeological studies.
Methodologically, while both cases employ linear feature extraction, they differ markedly in their technical approaches. Case 4.1.1 involves a comprehensive and efficient extraction of sites across the study area, in contrast to Case 4.1.2, which methodically identifies targets by correlating archaeological findings and historical documentation. This contrast not only underscores the applicability of remote sensing for site identification in such settings but also emphasizes how varying research objectives can influence distinct methodological approaches, even when utilizing the same technical resources.

4.2. Preventive Conservation Support

The International Centre for the Study of the Preservation and Restoration of Cultural Heritage (ICCROM) pointed out that preventive conservation is to take all measures and actions to prevent or reduce possible future deterioration and damage to the heritage in 2008 [126]. This process should be based on the risk assessment and dynamic monitoring of cultural heritage to identify early signs of heritage deterioration [201]. In the context of safeguarding heritage sites of paramount significance, GIS possesses inherent technical advantages that enable them to provide decision support from a preventive and protective standpoint. The concept of “preventive conservation” was formally introduced during the International Conservation Conference held in Rome in 1931 [202]. This development was significantly influenced by the principles of risk management. Over time, this theoretical framework expanded its scope from the realm of collection conservation to encompass immovable cultural heritage conservation. The prevailing preventive protection framework, rooted in risk management theory and widely accepted within the contemporary academic community, follows a systematic sequence: identification of heritage risk factors, evaluation of these risk factors, identification of strategies to mitigate or eliminate them, and the subsequent application of risk reduction measures. This framework essentially adheres to a structured process, encompassing data collection, risk factor identification, risk assessment, and risk mitigation. Its essence lies in the thorough and meticulous analysis of construction-related risks, leading to the development of targeted risk prevention measures. It involves establishing a situation, judging risk, analyzing risk, and evaluating risk. The next cases relate to the application of these two aspects of Angkor Wat to support its conservation decisions.
The Angkor heritage site, a world-renowned cultural heritage site, was the capital of the Angkor dynasty in present-day Cambodia. The Angkor monuments are distributed over a range of 400 square kilometers, including the ancient capitals and temples of the Khmer Empire from the ninth to the fifteenth centuries, such as the ruins of Angkor Wat, Angkor Thom, Bayon Temple, and the Queen’s Palace. Due to the long-term effects of natural disasters and human activities, most of the Angkor monuments have collapsed into ruin. They were listed as Endangered World Heritages while they were selected as World Cultural Heritages in 1992. The protection of the Angkor site was a high priority of both the Cambodian government and the international community. In 1993, the Angkor International Coordinating Committee for Safeguarding and Development (ICC-Angkor) was established. Following the end of the last century, more than 20 countries, including China, have invested a large amount of funding and human resources to protect the Angkor site and have achieved good results. What is the relationship between the collapse of the Angkor monuments and changes in the characteristics of heritage ontology and the environment (including the underground environment)? This is ultimately a scientific challenge that must be considered and studied before it can be restored, and this is also a question that must be investigated as part of the sustainable development of the Angkor site.

4.2.1. The Floods Risk Assessment for Heritage

The natural disasters of the leading heritage are characterized by many kinds, wide distribution, and strong suddenness. The immovable cultural relics exposed to the natural environment for a long time are at high risk of being destroyed or even destroyed in the face of major natural disasters. In the face of natural disasters, floods pose a significant threat to the Angkor World Heritage site. One of the primary concerns of the Authority for the Protection and Management of Angkor and the Region of Siem Reap (APSARA) is how to mitigate the flood risk at Angkor. Strengthening the assessment and management of flood disaster risks is of paramount importance for the protection of the Angkor World Heritage.
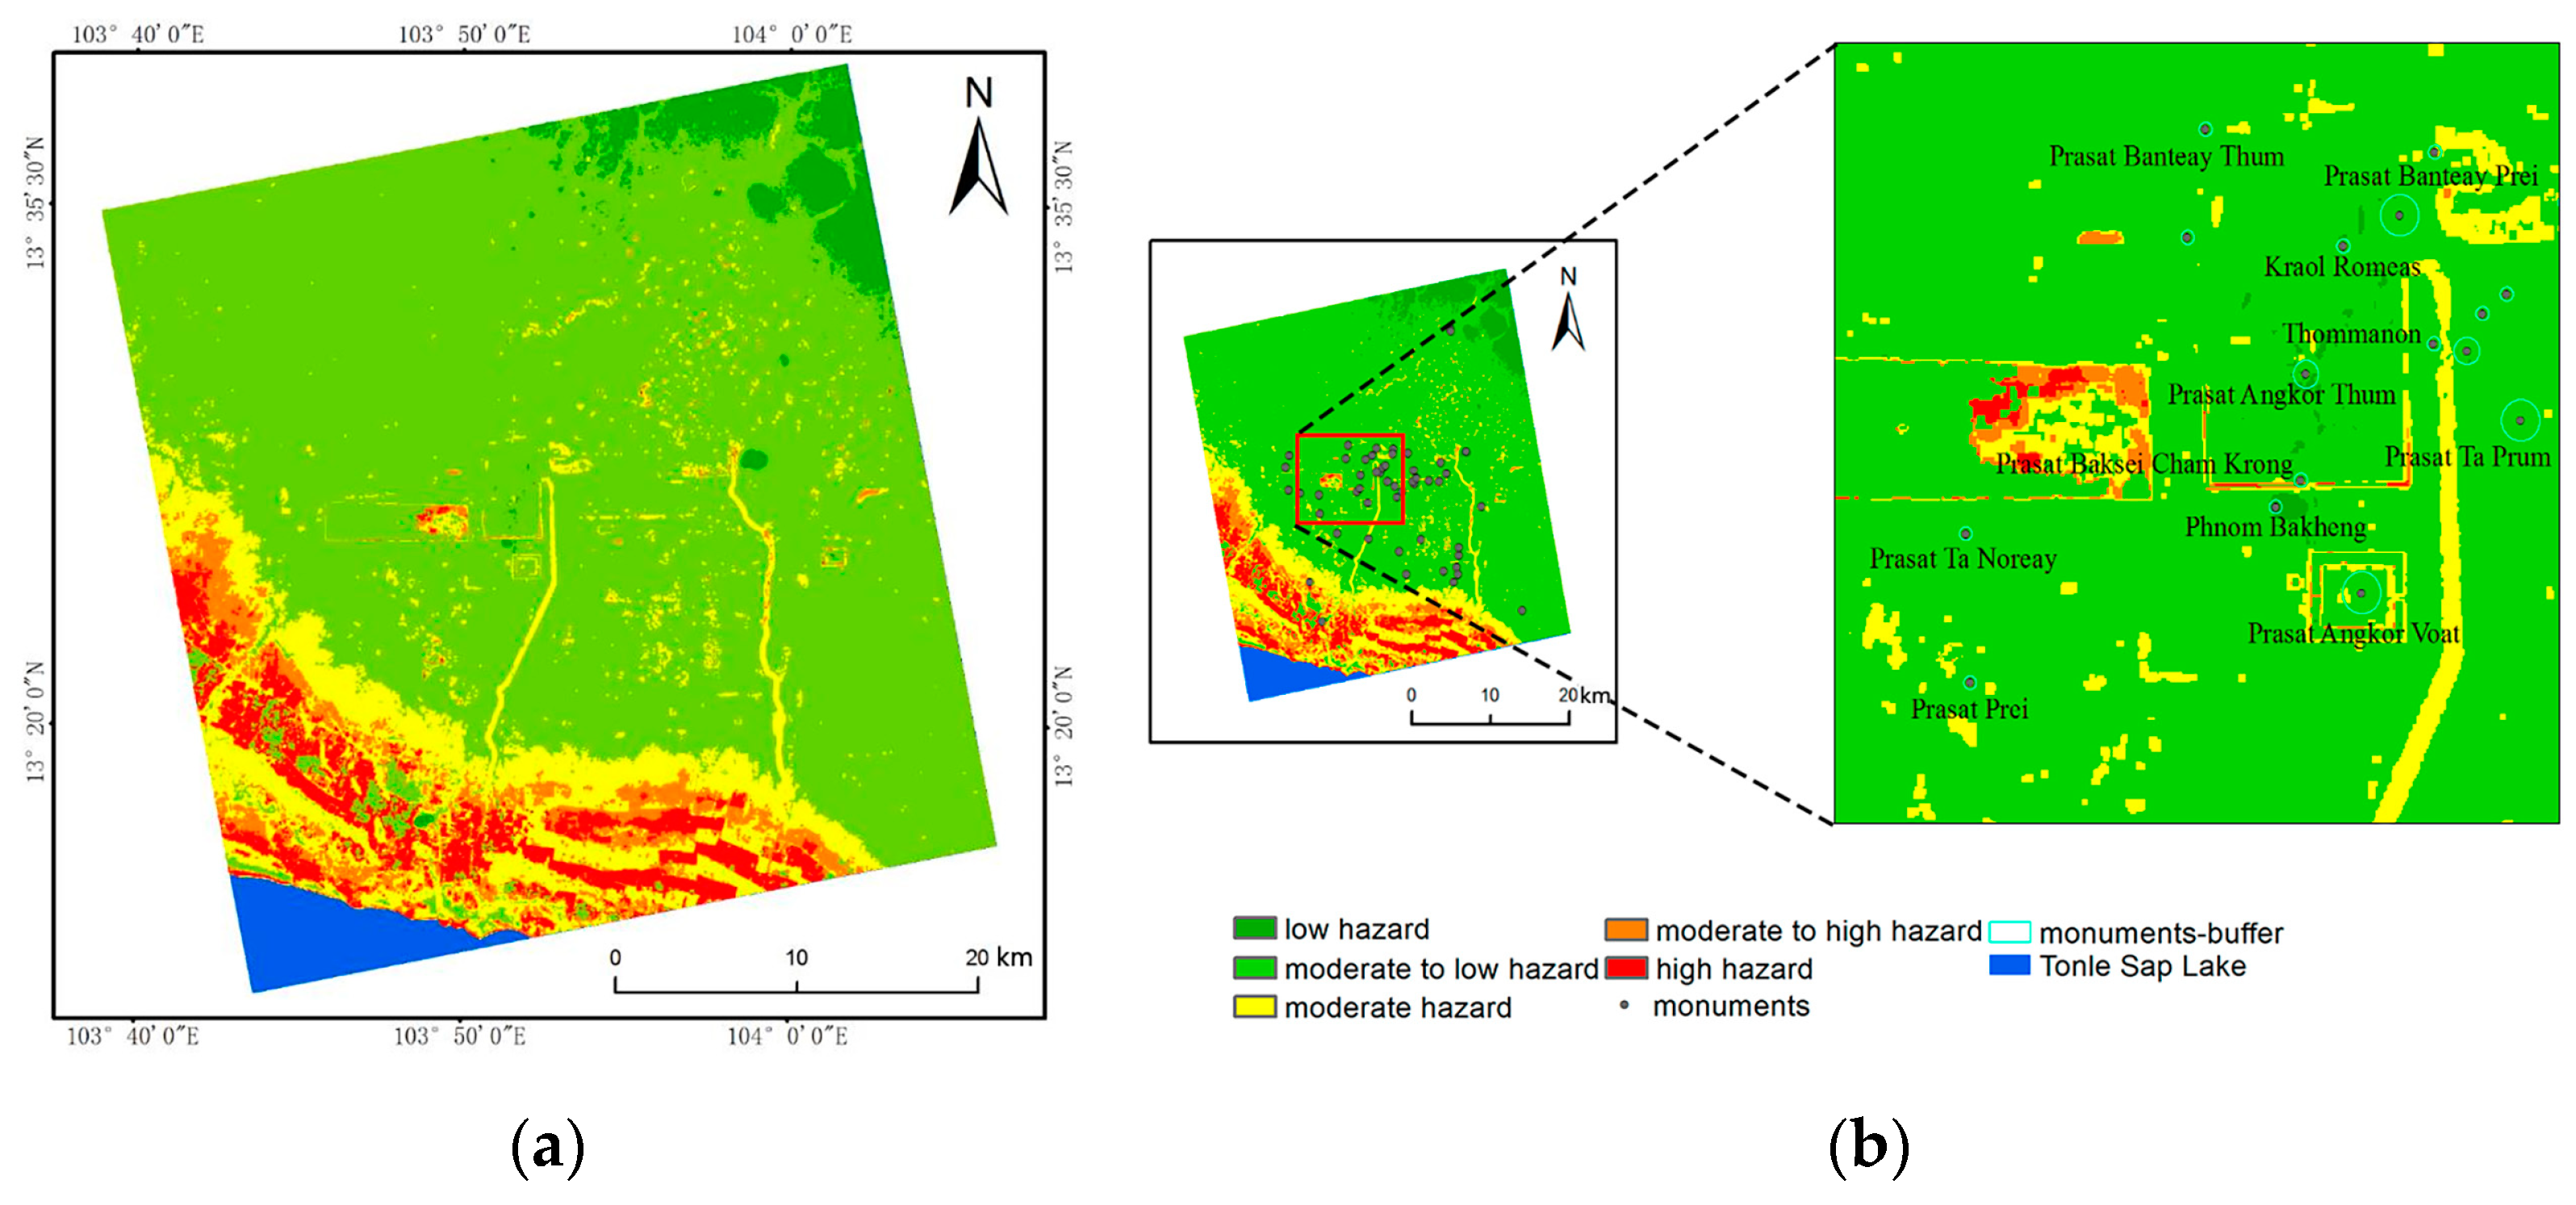
Researchers, led by Liu, developed a Flood Hazard Index (FHI) model based on GIS and utilized SAR data to extract historical flood information at Angkor from 2007 to 2013. The research methodology encompassed the following steps. Initially, SAR data, the Digital Elevation Model (DEM), and river network data were employed to extract four indicators: flooding frequency, absolute elevation, elevation standard deviation, and river network density. These four indicators were utilized for identifying flood-prone areas. Subsequently, SAR images underwent preprocessing and registration. Then, a threshold segmentation method based on Gray Level Co-occurrence Matrix (GLCM) texture analysis in conjunction with a supervised classification method using a Support Vector Machine (SVM) was applied to extract water bodies. The normalization of indicator data was performed, and weights for each indicator were determined using the Analytic Hierarchy Process (AHP) and the Delphi method. The consistency of the weightings was ensured through the construction of judgment matrices. Finally, the FHI model was established using ArcGIS map algebra, with the selected indicators of flooding frequency, absolute elevation, elevation standard deviation, and river network density as its basic parameters. The weighted index was then used to create a distribution map of flood disasters at Angkor (Figure 11) [203].
The research findings revealed that out of the 52 components constituting the Angkor monument, nine components faced potential flood risks. High and moderately high-risk areas were primarily located around West Baray, with no direct risk impact on the core archaeological area. Moderate-risk areas were situated on both sides of the Siem Reap River and the Roluos River, as well as within the inundation zone of the core archaeological area of the Tonle Sap Lake. These areas covered a total area of 19.4 square kilometers, accounting for 9.13% of the total core area. This moderate-risk area poses a greater flood threat to the core area and requires higher attention.

4.2.2. The InSAR Monitoring and Risk Assessment

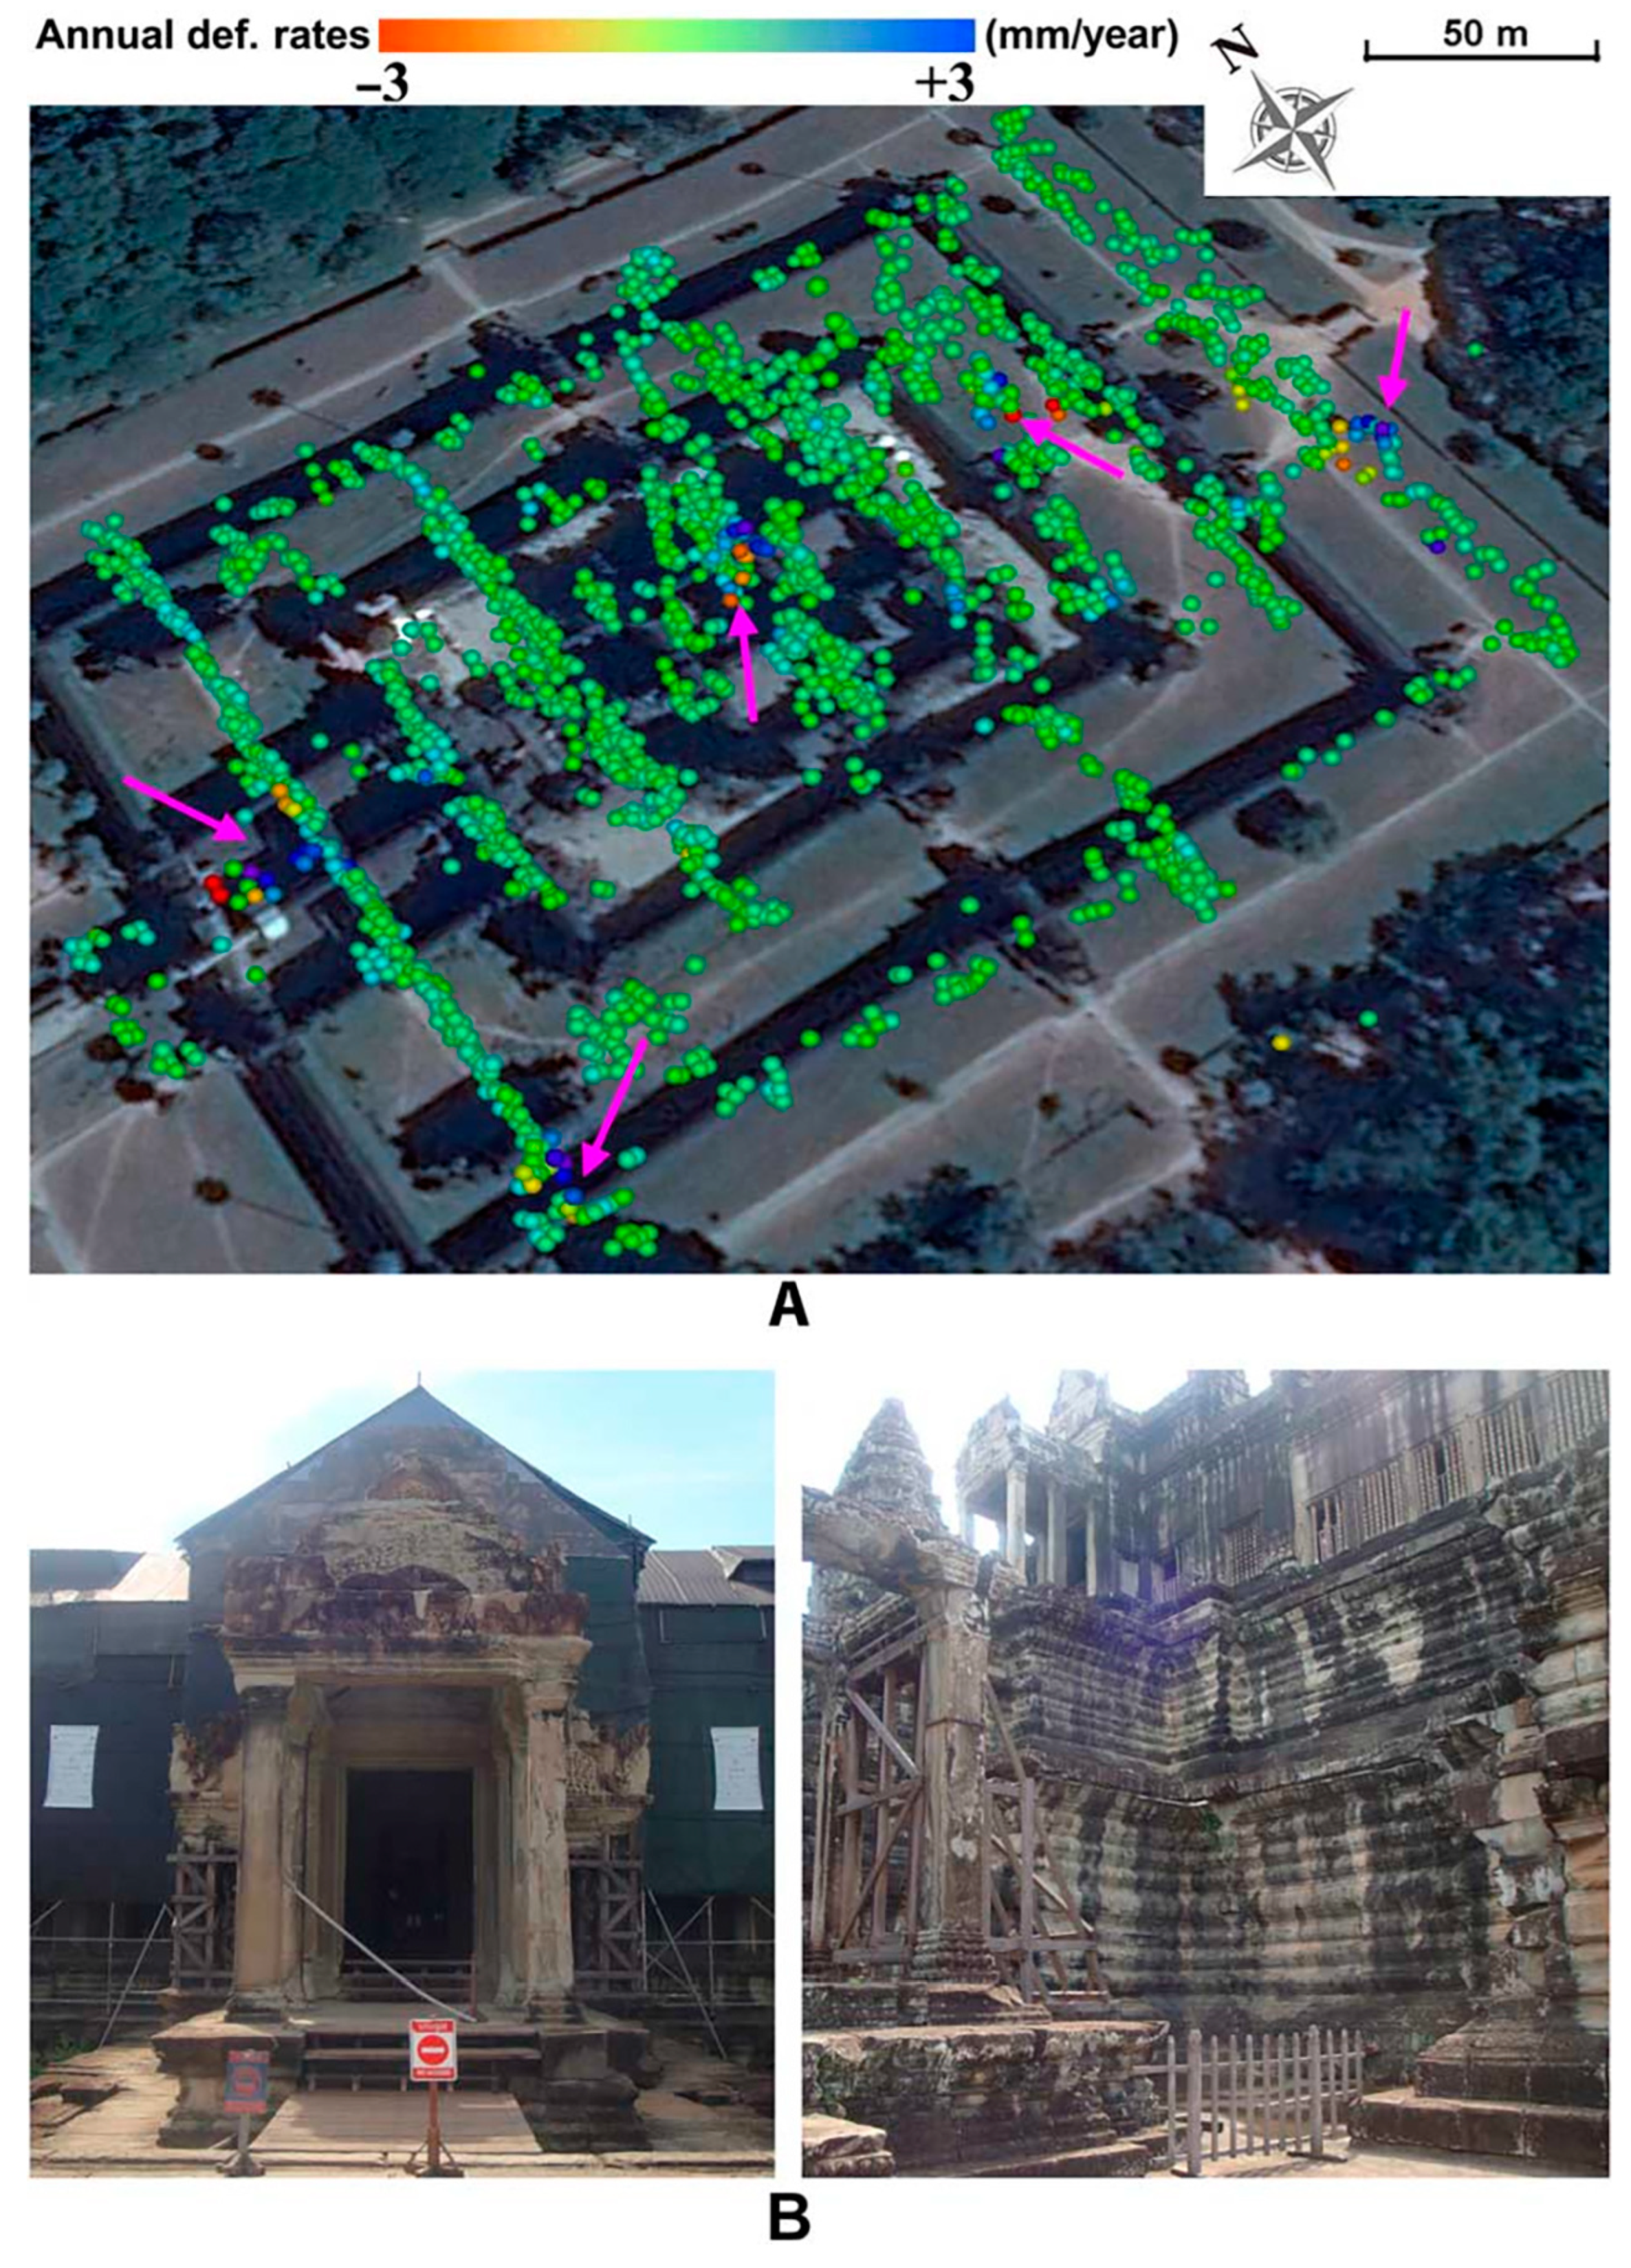
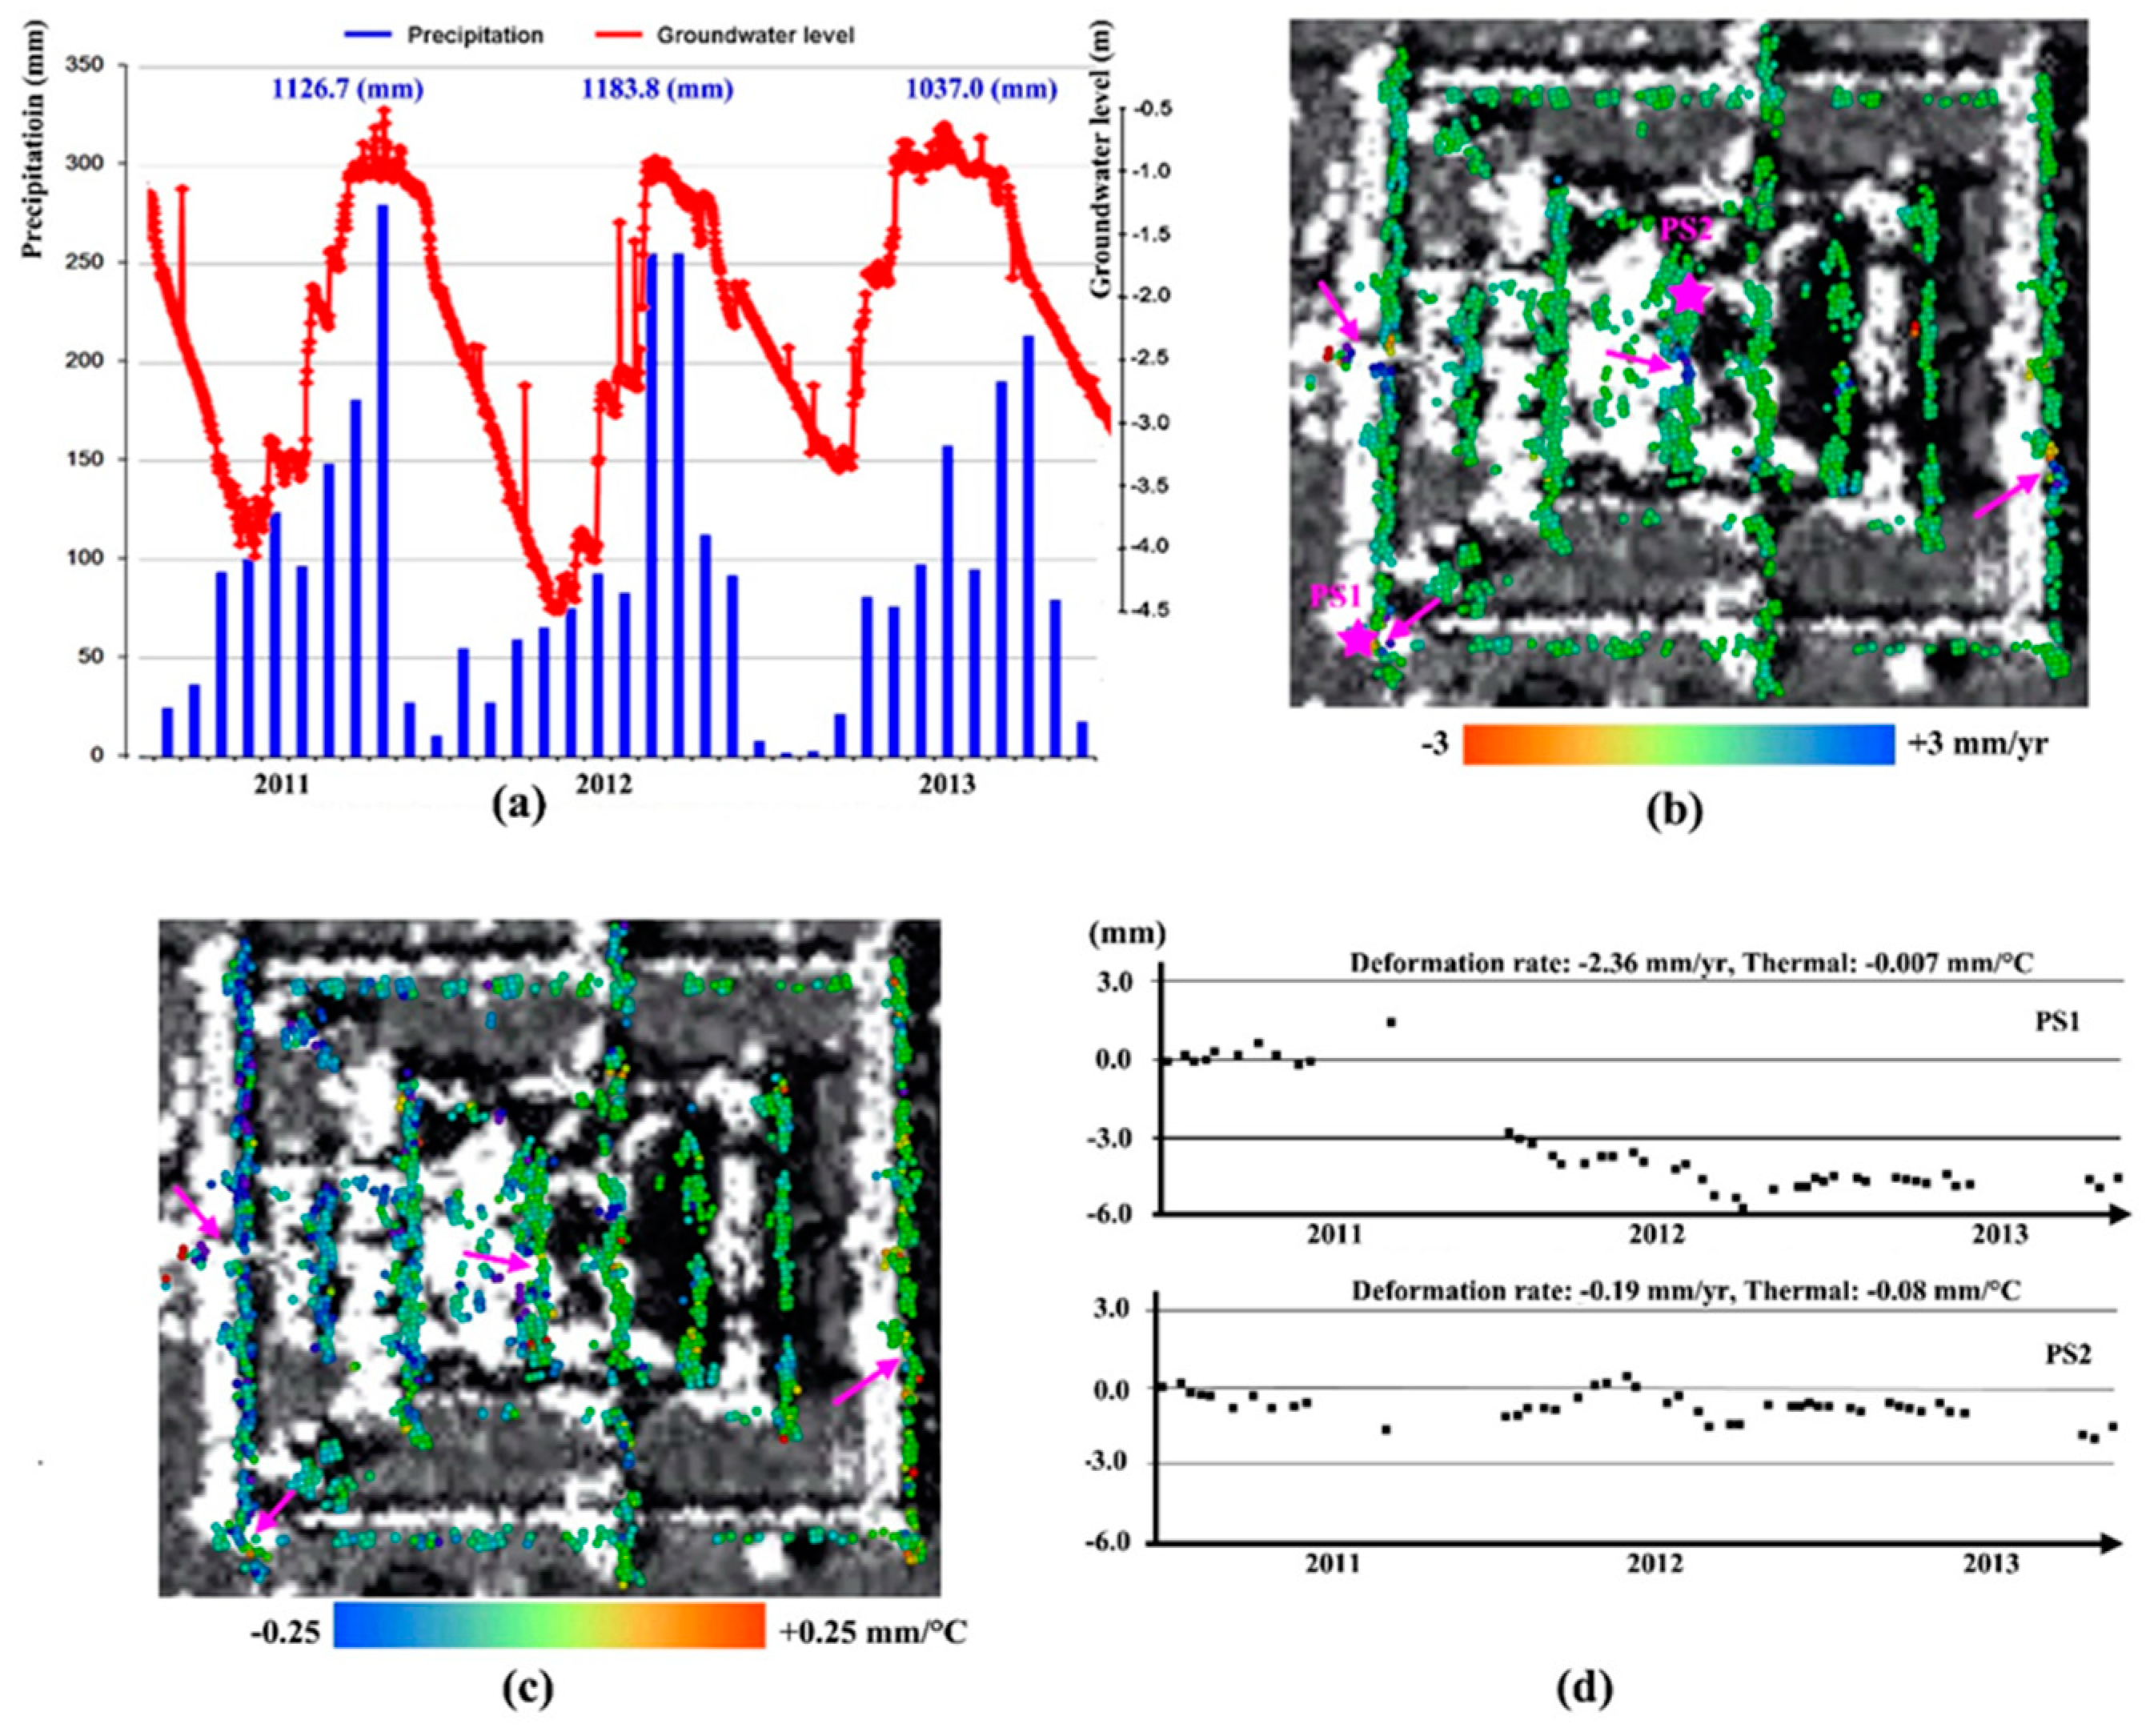
SAR, with high-resolution sensors, enables the retrieval of the proxies of surface morphological changes, which can inform the decision-making process of cultural heritage sectors and stakeholders to implement related measures to alleviate anthropogenic and natural effects on the cultural landscape [166,204]. A powerful tool must be used for monitoring subtle movements at a millimeter level of accuracy at this site. To improve the spatial distribution density of ground subsidence at the site and to monitor abnormal deformation points at the ancient temple heritage, a two-scale Tomo-PSInSAR method was introduced to extract millimeter-level deformation information at the site and the surrounding cultural areas of the city of Siem Reap (Figure 12). The sensitivity of short-wave near-infrared 1/2 (1.56–1.66 µm) and red-band (2.10–2.30 µm) Landsat images on the urbanization map, the study used the maximum-likelihood supervised classification algorithm to obtain the area of urbanization and time-series change information for Siem Reap and it established the prediction model of ground subsidence in connection with the fluctuation of the groundwater table, used to predict and analyze the trend of the ground surface stability of the heritage site. In the comprehensive analysis of rainfall data, pumping groundwater data, the deformation rate field, and the thermodynamics of the stone materials of ancient Jiannian, it was found that the degradation and collapse of the ancient temples were directly related to significant seasonal variations in the groundwater table, the spatial heterogeneity of the thermodynamics of the stone materials, and other factors (Figure 13) [100,119]. This case enables new insight into sustainable conservation. A two-scale Synthetic Aperture Radar interferometry (InSAR) approach was adopted. Multidisciplinary analysis, together with a deterioration kinetics model, offers new insights into the causes that triggered the potential decline of the Angkor monuments (following [204]).

4.3. Digital Routes Reconstruction

In October 2008, during the 16th ICOMOS General Assembly, the ICOMOS Charter on Cultural Routes was formally adopted. Cultural route heritage represents the migration and flow of people, the communication between countries and regions in a certain period of time, and the reciprocal and continuous exchange of goods, ideas, knowledge, and values in multiple dimensions. As a typical cultural route, the reconstruction of a complete geographical network space for SR is of great significance for understanding the interaction of civilizations in different regions. Firstly, the pivotal nodes and routes of the Silk Road constitute indispensable elements for comprehending its overarching history, culture, trade dynamics, and geopolitical significance. Secondly, the methodical restoration of the route serves as the foundation for enhancing our comprehension of its historical evolution and the trajectory of human activities along its course. As highlighted earlier, the intricate natural and human environment within the Silk Road region imperils its cultural heritage, risking irreparable harm and loss. Hence, there is an urgent need to achieve the digital preservation of this heritage through the creation of digital inventories of sites.
Zhang Ping utilized archaeological sites, ancient maps, and remote sensing image data to achieve spatial positioning of historical geographic information pertaining to the Silk Road, thereby reconstructing a comprehensive digital inventory of the Silk Road network heritage [205]. This digital heritage inventory, characterized by topographical accuracy and three-dimensional positioning, serves as the foundation for in-depth statistical analysis, facilitating the examination of Silk Road trends. The initial endeavor involves the integration of extant archival materials. Since the 1890s, explorers from both Eastern and Western origins have conducted extensive geographical exploration and archaeological investigations within Silk Road regions, yielding a substantial collection of geographical survey maps and archaeological records. The heterogeneous origins and languages of these explorers have led to significant toponymic confusion, posing challenges to the effective utilization of these historical resources. Zhang has undertaken spatial registration and digital processing of these maps to create digital archaeological maps, thereby pinpointing previously uncharted sites and relics. This rejuvenates a wealth of investigative data. Through map digitization, geographical names in diverse languages and labels can be geographically referenced using latitude and longitude coordinates, effectively resolving the issue of ambiguous toponyms. Leveraging historical documents, archaeological data, and remote sensing imagery, the paper utilized GIS technology to construct a spatio-temporal database of the Silk Road as it stood in the year 2000. Employing network technology and WebGIS, the paper establishes a historical geographic information platform for the Silk Road (Figure 14), facilitating the reconstruction of the Silk Road’s geographical environment spanning 2000 years and simulating its evolutionary process. Considering human development and other influential factors along the ancient Silk Road, this platform offers a foundational and visually accessible networked comprehensive historical geographic information platform for examining societal changes along the Silk Road. Within the context of factors such as environment, ethnicity, economy, transportation, and culture along the Silk Road, more researchers could examine the ascension, evolution, and eventual wane of the Silk Road Economic Belt during the Han, Tang, Ming, and Qing Dynasties. Although this seems to be a very basic work, it faces a large amount of heterogeneous data and integrates it into a GIS system to generate new cognition, which is of great significance for understanding the Silk Road and economic and cultural exchanges along the route.

5. The Merits and Challenges in GIS-RS Application

5.1. Merits of GIS-RS Applications for ACH

5.1.1. High Efficiency for ACH Investigation

The low cost and high efficiency of cultural heritage information acquisition based on GIS-RS are realized. RS offers a fast, convenient, and labor-saving method for the detection of ACH, especially during the large-scale performance of archaeological land surveys. Conventional archaeology predominantly relies on manual site investigations, particularly for extensive site surveys, which entail substantial labor efforts. Particularly, when conducting investigations in challenging natural environments such as deserts, grasslands, and ancient city sites, the inherent limitations of these settings render field investigations arduous, further complicating the attainment of precise survey results. In contrast, remote sensing platforms gather data without being constrained by geographical environments, leading to substantial time and cost savings in archaeological investigations.
Moreover, in the realm of heritage risk assessment, particularly concerning ancient buildings, ICCROM underscores the significance of minimal intervention and investment to attain efficiency [201]. Remote sensing-GIS techniques align with this philosophy by employing non-invasive monitoring methods, embodying the efficient principles and concepts of risk management. Furthermore, the applied analysis of multi-temporal data enables managers to swiftly identify potential sites or changes, thereby contributing to time and resource conservation.

5.1.2. Quality Improvement for ACH Digital Source

The quality of digital resources pertaining to cultural heritage has been enhanced. The management, protection, and research of cultural heritage impose stringent demands for the integrity, consistency, objectivity, and precision of foundational data. A comprehensive cultural heritage database comprises heritage ontology information along with environmental background data. Satellite remote sensing technology offers macroscopic, rapid, dynamic, and cost-effective capabilities, facilitating all-weather and continuous monitoring of diverse surface conditions.
The utilization of multiple platforms and data collection cycles substantially enhances the integrity of cultural heritage data. Spatial alignment of data from multiple sources guarantees data consistency. The integration of machine learning mitigates subjectivity in human–computer interaction processes. Enhanced data and model accuracy facilitate more precise monitoring of cultural heritage. These factors collectively contribute to a high-quality cultural heritage data resource for research and management.

5.1.3. Cognitive Enhancement for ACH Research

Augment the comprehensive comprehension of cultural heritage within expansive spatial contexts. GIS-RS commands powerful abilities in ACH information mining. Spatial analysis can identify and explain the economic, environmental, and social impacts of the ACH layout and related land-use patterns for historical or cultural researchers. This can further help scholars recognize and understand the interactions between the environment and human activities in the ancient economic evolution and the complexity of social organization changes.
GIS-RS methods can achieve both static and dynamic temporal and spatial changes. The addition of the environmental background further makes it possible for scholars to explore complex environmental drivers or social forces. Specialists can extract key work areas of ACH via GIS-RS, which can also provide scientific data support for early warning mechanisms apropos natural and human-created cultural heritage threats and can assist in the amelioration of monitoring and response measures pertaining to ACH [102]. GIS-RS can also offer analytical support for the development and management of ACH tourism: its planning at the initial stage of development, spatial analysis research on the accessibility of cultural resources, the rationality of transportation, and flow control at heritage sites.

5.2. Challenges of GIS-RS in ACH Application

5.2.1. Heterogeneous Data Problem

Heterogeneous data in multi-source data always remains a challenge. While addressing data heterogeneity remains a fundamental task in ACH research employing GIS and RS, it presents limitations in detail that are not necessarily difficult but cannot be ignored. The swift advancements in remote sensing earth observation technology and computer technology have led to the rapid development of multi-spectral, high-spatial resolution remote sensing data sharing platforms, generating vast quantities of remote sensing data daily and resulting in explosive data volume growth. This growth, in turn, introduces multi-sourced data and data heterogeneity. Furthermore, Silk Road cultural heritage data frequently originate from diverse sources and modalities, exhibiting variations in language composition, platform architecture, and document structure [91]. These disparities in data formats underscore the characteristics of multi-sourced heterogeneity, posing significant challenges to data processing efficiency and comprehensiveness. Distinct remote sensing platforms, including satellite remote sensing and low-altitude remote sensing, as well as variations in satellite data, necessitate distinct pre-processing methods. Additionally, geographic vector data referenced in different coordinate systems and textual information presented in various languages further complicate unified data storage.

5.2.2. Association and Correlation in ACH Data Mining

Establishing correlation levels in data mining challenges the attribution of ACH research. The challenge in establishing a cultural heritage database within the context of GIS and RS applications does not primarily stem from the volume or complexity of “big data”. Rather, it pertains to the nuanced development of data significance and value gradients, necessitating the identification and selection of pertinent data [206,207]. Confronted with intricate geographical environments, the quantitative analysis of cultural heritage frequently overlooks the establishment of correlation levels. This encompasses correlations between cultural heritage and its environmental context, spatial and temporal relationships, cultural elements, and public engagement. This omission may be attributed to the multifaceted and intricate factors influencing changes in cultural heritage. Analyzing how each of these causes affects heritage and how they affect it collectively is extremely complex. Nevertheless, it results in a deficiency in attributing ailments afflicting cultural heritage. For instance, while deformation is detected in Angkor site monitoring, comprehensive causal analyses of these deformations are frequently absent, hindering determinations regarding whether tourism, urban development, extreme climate events, or other factors constitute primary contributors.

5.2.3. Interdisciplinary Dilemma

Additionally, cross-application encounters cognitive limitations stemming from interdisciplinary disparities. GIS-RS presents theoretical and methodological challenges for ACH managers. Effective GIS-RS applications require a thorough knowledge of the theoretical and methodological limitations inherent in the technology as well as the awareness of their implications for the modeling of ACH data. However, most specialists, regardless of whether they are historical and cultural researchers or cultural heritage managers, have not systematically studied the theory and tools of GIS-RS. This lack of expertise can directly lead to short applications of GIS-RS, such as the abuse of spatial analysis models in archaeological analysis [208]. A similar challenge arises in risk monitoring. For instance, despite conducting meticulous remote sensing-based deformation monitoring of Angkor Wat, researchers encounter difficulties in assessing the risk level associated with deformation-related issues. Profound insights from experts specializing in ancient building preservation are essential for providing professional guidance, a task not within the purview of cultural heritage experts. This challenge also extends to issues such as model accuracy evaluation and confidence level selection for skilled archaeologists or Cultural Heritage Specialists.

6. GIS-RS in ACH Applications: Trends and Perspectives

6.1. Towards Big Earth Data-Driven Understanding for ACH

The advancement of Earth observation technology has led to the generation of extensive and diverse Big Earth Datasets [68,143]. These datasets, derived from space technology, encompass data pertaining to land, ocean, atmosphere, and human activities. In the rapidly expanding era of Big Earth Data, the enhanced accessibility of high-resolution and frequently updated RS data has significantly improved [68]. Leveraging these datasets has notably broadened the analytical capabilities in ACH research. This transformation marks a shift from a traditionally static approach to a dynamic, multidimensional framework, thereby enabling more thorough cognitive and predictive analyses [209]. This progression signifies a substantial leap in the depth and intricacy of ACH studies. Considering ACH spatiotemporal data, multi-temporal imagery provides deeper insights into the dynamic alterations of ACH surfaces, elucidating the evolutionary patterns of observed phenomena more effectively than single-temporal remote sensing images. For instance, vegetation maps derived from multi-year indices prove invaluable in detecting and monitoring archaeological and cultural heritage sites in arid regions at risk due to agricultural expansion [210].
At the same time, we need to acknowledge that the vastness and complexity of Big Earth Data present challenges for ACH knowledge extraction. The data’s large scale, varied origins, multi-scale nature, high dimensionality, complexity, and unstructured form pose significant challenges in comprehension, organization, integration, and migration, which hinders efficient ACH spatial data mining [68,209]. Specifically, the challenge inherent in exploring at least three points of Big Earth Data is also manifest in ACH application: (i) selecting appropriate statistical models amidst the uncertainty and nonlinearity of big data [68,211]; (ii) developing efficient spatial data mining algorithms to uncover hidden values [68]; (iii) realizing efficient super-large-scale spatiotemporal visualization analysis [209,212].To solve these problem, advancements in data storage, cloud computing, and the development of innovative algorithms and models are increasingly being recognized. In summary, for GIS-RS initiatives grounded in Big Earth Data to effectively contribute to ACH research and management, it is imperative to develop a suite of scientific and systematic theories and methodologies to address the challenges posed by the Big Data context.
Most recently, substantial research has been conducted in the realms of large-area remote sensing archaeology, heritage monitoring, evaluation, and the development of heritage protection strategies, all grounded in Big Earth Data [54,209,213,214,215]. These studies encompass RS mechanisms, universal methodologies, and pioneering demonstrations [54,56,83,211]. The integration of technological advancements and Big Earth Data has led to new insights into human evolution and societal progression, including investigations into the degradation of Outstanding Universal Values of ACH sites [18,216]. This entails the incorporation of geophysical exploration data, field archaeological excavation data, meteorological and hydrological phenological observations, as well as physical and biochemical data related to site structures and their surrounding environments, facilitated through cloud-based platforms [68]. Pertaining to research methodologies, the establishment of databases cataloging the distribution of ancient sites enables comprehensive exploration of cultural themes encompassing urban transformations, trade dynamics, ethnic migrations, and cultural diffusion across the expansive temporal–spatial dimensions of the SR. By employing quantitative statistical analyses, model assessments, and visual representations of diverse SR data sources, substantial contributions are made toward understanding the trajectories and patterns of change along the SR across various temporal and spatial scales.

6.2. Towards Refinement Monitoring and Assessment for ACH

The integration of GIS-RS in ACH monitoring and risk assessment addresses the limitations of traditional methodologies, offering heritage managers more comprehensive, intuitive, and systematic data and technical resources. On the one hand, high-resolution RS imagery enhances data precision. On the other hand, big data’s multi-source nature and multi-factor traceability facilitate more accurate diagnoses of cultural heritage conditions [216]. GIS-RS technology facilitates the extraction and monitoring of variables that influence heritage degradation, enabling the creation of dynamic, comprehensive case studies of heritage sites. This methodology represents a departure from traditional mapping techniques by prioritizing ontological integrity, systematic analysis, and cost-effectiveness while also emphasizing detailed local information and precise spatial relationships. For example, InSAR is utilized for surface deformation monitoring, offering the capability to detect potential structural instabilities with millimeter-level accuracy from satellite data [217]. Similarly, LiDAR RS generates point cloud data essential for constructing three-dimensional models of ancient structures and tracking structural changes over time [218,219]. The increasing availability of VHR satellite data, complemented by aerial and low-altitude RS, provides higher spatial resolution and more frequent data collection, significantly improving cultural heritage site refined surveys. These advancements in GIS-RS technology not only grant access to complex datasets but also lay the foundation for the development of more sophisticated and refined models and analyses.
It is crucial to recognize that remote sensing monitoring focuses on a detailed representation of local complexities and the accuracy of spatial relationships. However, the primary challenge in fine monitoring and evaluation using GIS-RS technology lies in the complex environments of ACH sites. Understanding both the macroscopic context and the localized conditions is essential; a comprehensive perspective is needed to ensure no critical elements are overlooked. No single sensor provides exhaustive information about a target object, necessitating the exploration of complementary observations for refined monitoring and evaluation.
Thus, refined monitoring and evaluation is not merely about obtaining higher precision data; it involves strategically integrating multi-source data, including natural environment and social activity data such as tourist movements and local community dynamics [6,19]. At the same time, developing corresponding data models is essential for refined impacts monitoring and environmental trends assessment of natural and human activities on heritage sites.

6.3. Towards Artificial Intelligence Understanding for ACH

Undoubtedly, the integration of artificial intelligence (AI) within geographic information GIS-RS represents not merely a trend but a transformative development in the field. AI significantly expedites the processing and analysis of spatial data. The synergy between AI and large-scale remote sensing data has notably augmented the automation and efficiency of interpreting, analyzing, and extracting valuable insights from extensive datasets. Machine learning, a critical branch of AI, is increasingly employed to identify patterns and extract information from remote sensing and geospatial data. This method proves especially beneficial in analyzing Earth observation data, thanks to its autonomous learning capabilities, pattern recognition, and minimal need for human intervention [108,220,221]. The emergence of deep learning and deep neural network technologies has constituted a major leap forward in remote sensing research, particularly in processing and analyzing large volumes of data. These techniques have demonstrated considerable potential in autonomously revealing spatiotemporal relationships and enhancing our understanding, thus improving the prediction and modeling of observed physical phenomena across diverse time scales. Such methodologies are especially promising for research and conservation management in ACH. In the specific context of cultural heritage conservation along the SR, the amalgamation of data-driven machine learning, physical process models, and the extensive, fragmented nature of ACH data highlights the urgent need for precise and timely technical support in the realms of heritage protection, management, and research.
Additionally, as mentioned above (Section 5.2), the paramount challenge in managing, conserving, and researching the SR ACH lies in distilling knowledge from its extensive data repositories. Confronted with vast Earth observation and heritage-related datasets, it is crucial to apply intelligent data analysis and processing to the heterogeneous data of SR ACH. AI, combined with refined remote sensing monitoring, also holds the potential for digital restoration of damaged ACH [222,223]. The advancement of AI technologies, such as computer vision and machine learning, is pivotal in enhancing the exploration of GIS-RS applications in ACH. These technologies facilitate the intelligent extraction of cultural heritage information, thereby elevating the efficiency and quality of data processing.
However, despite AI’s proficiency in language and image recognition, it struggles with the complex and nonlinear information typical of cultural heritage. The varied nature of geographical spaces poses a significant challenge to the generalizability of machine learning algorithms. Although these algorithms can self-improve through continuous learning, their effectiveness is limited in diverse heritage contexts [109,207]. The discussion about using remote sensing and large-scale geospatial models, particularly for different cultural heritage types with unique physical and chemical attributes, indicates a prolonged journey towards fully integrating geospatial intelligence with AI. However, the continual advancements in AI technology suggest a future trend where the analysis and interpretation of cultural heritage are increasingly influenced by Big Earth Data and AI technologies

7. Conclusions

GIS and RS represent outstanding methods of safeguarding ACH sustainable development along the BAR. It offers ACH researchers and managers effective tools, guiding the increased detection or sensing, recognition, preservation, and digital reconstruction of ACH. At the same time, it facilitates the research of both ACH sites and their supporting environments. GIS-RS is of particular interest to scholars and to the ACH sector because it integrates three significant components of ACH research: data acquisition, spatial analysis, and landscape reconstruction. GIS-RS equips ACH with effective data management tools. The attribute information related to ACH sites can easily be integrated and analyzed through varied GIS-RS platforms. Unknown sites can be discovered for archaeological investigation by virtue of RS. Further, GIS-RS can be applied to monitor spatiotemporal changes in ACH from different spans. In this era of Big Earth Data, the GIS-RS pertaining to the ontology of ACH sites and their supporting environments could transcend geospatial landscapes to inform the study of humanities disciplines that aim to better understand the ancient world.
This review not only outlines the key milestones in utilizing GIS-RS within ACH applications but also delivers a comprehensive exploration of methodologies, ongoing advancements, challenges, and emerging trends on the BAR.GIS-RS offers a set of advanced new tools and procedures for the implementation of archaeological prospection and for the facilitation of cultural heritage management. This paper has presented a brief review of GIS-RS applications for ACH. It has also elucidated the merits and limitations of the utilization of GIS-RS. The five study cases discussed in the paper have demonstrated the great potential of GIS-RS in the identification, preventive conservation, and reconstruction of ACH. GIS-RS also offers new insights and applications for the scientific management of ACH, and the present paper has discussed the role discharged by GIS-RS as a policy-making and virtual display platform in the field of ACH management. A wide range of applications supports the immense potential of GIS-RS; however, the presented cases have evidenced the need for continued efforts. GIS-RS is expected to become even easier and more powerful functions for ACH applications in the future. It will offer practical and efficient tools with real-time data accessibility, excellent analysis capabilities, and stronger displays for ACH.
In the second 5 years effective execution period (2021–2026), the DBAR-Heritage Working Group is deepening its study of three areas: southeast Asia and southeast China, Central Asia and northwest China, and the Mediterranean rim, while initially building a BAR sharing platform to protect and utilize natural and cultural heritage [64]. In 2026, the integration of GIS and RS is projected to successfully establish comprehensive platforms for monitoring, evaluating, protecting, and promoting natural and cultural heritage along the Belt and Road. This achievement will mark a significant advancement towards a fully interconnected, cloud-based, and intelligent management approach for heritage site protection. The prospects in this regard are highly promising.

Author Contributions

Conceptualization, Y.Y. and X.W.; methodology, Y.Y.; software, bibliometrix, Y.Y.; validation, Y.Y.; formal analysis, Y.Y.; investigation, Y.Y. and H.R.; resources, Y.Y.; data curation, Y.Y.; writing—original draft preparation, Y.Y., X.W., L.L., H.W. and H.R.; writing—review and editing, Y.Y., L.L. and X.W.; funding acquisition, X.W. All authors have read and agreed to the published version of the manuscript.

Funding

This research was funded by the Construction of the China-Central Asia Human and Environment “Belt and Road” Joint Laboratory and Joint Research on Ancient Human Culture and Environment in the Sulh River Basin (Grant No. 2022YFE0203800, November 2022 to October 2025) and The Strategic Priority Research Program of the Chinese Academy of Sciences (Grant No. XDA19030500).

Acknowledgments

We appreciate the anonymous reviewers and academic editors for their constructive comments and suggestions.

Conflicts of Interest

The authors declare no conflict of interest.

References

  1. Miki, T. Study of the Silk Road: A History of Eastern and Western Ceramic Representations; Genesis Company: Tokyo, Japan, 1968. [Google Scholar]
  2. Christian, D. Silk Roads or Steppe Roads? The Silk Roads in World History. J. World Hist. 2000, 11, 1–26. [Google Scholar]
  3. Beckwith, C.I. Empires of the Silk Road: A History of Central Eurasia from the Bronze Age to the Present. In Empires of the Silk Road; Princeton University Press: Princeton, NJ, USA, 2009; ISBN 1400829941. [Google Scholar]
  4. Hill, D.J. Climate Change and the Rise of the Central Asian Silk Roads. In Socio-Environmental Dynamics along the Historical Silk Road; Springer Nature Switzerland AG: Cham, Switzerland, 2019; pp. 247–259. [Google Scholar]
  5. Chen, F.; Dong, G.; Chen, J.; Gao, Y.; Huang, W.; Wang, T.; Chen, S.; Hou, J. Climate Change and Silk Road Civilization Evolution in Arid Central Asia: Progress and Issues. Adv. Earth Sci. 2019, 34, 561. [Google Scholar]
  6. Chen, F.; An, C.; Dong, G.; Zhang, D. Human Activities, Environmental Changes, and Rise and Decline of Silk Road Civilization in Pan-Third Pole Region. Bull. Chin. Acad. Sci. (Chin. Version) 2017, 32, 967–975. [Google Scholar]
  7. Dong, G.; Lu, Y.; Liu, P.; Li, G. Spatio-Temporal Pattern of Human Activities and Their Influencing Factors along the Ancient Silk Road in Northwest China from 6000 a BP to 2000 a BP. Quat. Sci. 2022, 42, 1–16. [Google Scholar]
  8. Marzeion, B.; Levermann, A. Loss of Cultural World Heritage and Currently Inhabited Places to Sea-Level Rise. Environ. Res. Lett. 2014, 9, 034001. [Google Scholar] [CrossRef]
  9. White, G.G.; King, T.F. The Archaeological Survey Manual; Routledge: London, UK, 2016; ISBN 1315419114. [Google Scholar]
  10. Tartaron, T.F. The Archaeological Survey: Sampling Strategies and Field Methods. Hesperia Suppl. 2003, 32, 23–45. [Google Scholar] [CrossRef]
  11. Williams, T. The Silk Roads: An ICOMOS Thematic Study; ICOMOS: Pairs, France, 2014; ISBN 2918086126. [Google Scholar]
  12. Che, P.; Lan, J. Climate Change along the Silk Road and Its Influence on Scythian Cultural Expansion and Rise of the Mongol Empire. Sustainability 2021, 13, 2530. [Google Scholar] [CrossRef]
  13. Collins, B.D.; Bedford, D.R.; Corbett, S.C.; Cronkite-Ratcliff, C.; Fairley, H.C. Relations between Rainfall-Runoff-Induced Erosion and Aeolian Deposition at Archaeological Sites in a Semi-Arid Dam-Controlled River Corridor. Earth Surf. Process Landf. 2016, 41, 899–917. [Google Scholar] [CrossRef]
  14. Yu, L.; Peng, C.; Regmi, A.D.; Murray, V.; Pasuto, A.; Titti, G.; Shafique, M.; Priyadarshana, D.G.T. An International Program on Silk Road Disaster Risk Reduction—A Belt and Road Initiative (2016–2020). J. Mt. Sci. 2018, 15, 1383–1396. [Google Scholar] [CrossRef]
  15. Yu, X.; Yu, X.; Li, C.; Ji, Z. Information Diffusion-Based Risk Assessment of Natural Disasters along the Silk Road Economic Belt in China. J. Clean. Prod. 2020, 244, 118744. [Google Scholar]
  16. Li, Z.; Chen, Y.; Wang, Y.; Li, W. Drought Promoted the Disappearance of Civilizations along the Ancient Silk Road. Environ. Earth Sci. 2016, 75, 1116. [Google Scholar] [CrossRef]
  17. Su, X.; Sigley, G.G.; Song, C. Relational Authenticity and Reconstructed Heritage Space: A Balance of Heritage Preservation, Tourism, and Urban Renewal in Luoyang Silk Road Dingding Gate. Sustainability 2020, 12, 5830. [Google Scholar] [CrossRef]
  18. Xiao, D.; Lu, L.; Wang, X.; Nitivattananon, V.; Guo, H.; Hui, W. An Urbanization Monitoring Dataset for World Cultural Heritage in the Belt and Road Region. Big Earth Data 2022, 6, 127–140. [Google Scholar] [CrossRef]
  19. Rybina, L. The Impact of Ethnocentrism and Its Antecedents on Cultural Heritage Tourism along the Silk Road. Management 2021, 19, 364–371. [Google Scholar] [CrossRef]
  20. Yu, J.; Safarov, B.; Yi, L.; Buzrukova, M.; Janzakov, B. The Adaptive Evolution of Cultural Ecosystems along the Silk Road and Cultural Tourism Heritage: A Case Study of 22 Cultural Sites on the Chinese Section of the Silk Road World Heritage. Sustainability 2023, 15, 2465. [Google Scholar] [CrossRef]
  21. Available online: https://uclcaal.org/ (accessed on 12 December 2022).
  22. Available online: http://dsr.nii.ac.jp/index.html.en (accessed on 12 December 2022).
  23. Sperry, J. More than Meets the Eyes?: Archaeology Under Water, Technology, and Interpretation. Public Archaeol. 2009, 8, 20–34. [Google Scholar] [CrossRef]
  24. Luo, L.; Liu, J.; Cigna, F.; Evans, D.; Hernandez, M.; Tapete, D.; Shadie, P.; Agapiou, A.; Elfadaly, A.; Chen, M.; et al. Space Technology: A Powerful Tool for Safeguarding World Heritage. Innovation 2023, 4, 100420. [Google Scholar] [CrossRef]
  25. Huo, X.; Liu, Y.; Zhang, G.; Yang, H. A Research on Digital Technology’s Application in Preservation Planning of Wenming Historical and Cultural Block in Kunming. Int. Arch.Photogramm. Remote Sens. Spat. Inf. Sci. 2013, 40, 355–360. [Google Scholar] [CrossRef]
  26. Shevlyakova, M.I.; Atkina, L.I. Application of GIS-Technologies in Inventories of Cultural Heritage Objects by the Example of Kharitonov Garden, Yekaterinburg. In Proceedings of the IV Scientific-Technical Conference Forests of Russia: Policy, Industry, Science and Education, St. Petersburg, Russia, 22–24 May 2019; Volume 316. [Google Scholar]
  27. Zou, H.; Liu, Y.; Li, B.H.; Luo, W.J. Sustainable Development Efficiency of Cultural Landscape Heritage in Urban Fringe Based on GIS-DEA-MI, a Case Study of Wuhan, China. Int. J. Environ. Res. Public Health 2022, 19, 13061. [Google Scholar] [CrossRef]
  28. De Roo, B.; Ooms, K.; Bourgeois, J.; De Maeyer, P. Bridging Archaeology and GIS: Influencing Factors for a 4D Archaeological GIS. In Digital Heritage: Progress in Cultural Heritage: Documentation, Preservation, and Protection; Ioannides, M., Magnenat Thalmann, N., Fink, E., Zarnic, R., Yen, A.Y., Quak, E., Eds.; Springer: Cham, Switzherland, 2014; Volume 8740, pp. 186–195. ISBN 978-3-319-13695-0/978-3-319-13694-3. [Google Scholar]
  29. Nicu, I.C. Frequency Ratio and GIS-Based Evaluation of Landslide Susceptibility Applied to Cultural Heritage Assessment. J. Cult. Herit. 2017, 28, 172–176. [Google Scholar] [CrossRef]
  30. Malinverni, E.S.; Pierdicca, R.; Colosi, F.; Orazi, R. Dissemination in Archaeology: A GIS-Based StoryMap for Chan Chan. J. Cult. Herit. Manag. Sustain. Dev. 2019, 9, 500–519. [Google Scholar] [CrossRef]
  31. Ruzickova, K.; Ruzicka, J.; Bitta, J. A New GIS-Compatible Methodology for Visibility Analysis in Digital Surface Models of Earth Sites. Geosci. Front. 2021, 12, 13. [Google Scholar] [CrossRef]
  32. Campana, S.; Francovich, R. Landscape Archaeology in Tuscany: Cultural Resource Management, Remotely Sensed Techniques, GIS Based Data Integration and Interpretation. Bar. Int. Ser. 2003, 1151, 15–28. [Google Scholar]
  33. Wiseman, C. Uncovering Submerged Landscapes: Towards a GIS Method for Locating Submerged Archaeology in South-East Alaska. Int. J. Naut. Archaeol. 2019, 48, 522–523. [Google Scholar] [CrossRef]
  34. Dockrill, S.J. Interpreting Space—GIS And Archaeology—Allen, Kms, Green, Sw, Zubrow, Ebw. Antiquity 1992, 66, 266–268. [Google Scholar] [CrossRef]
  35. Constantinidis, D. GIS for Managing the Analysis and Protection of Archaeological Remains in the Willandra Lakes World Heritage Area. Archaeol. Ocean. 2009, 44, 112–118. [Google Scholar] [CrossRef]
  36. Arnold, J.B. Remote-Sensing in Underwater Archaeology. Int. J. Naut. Archaeol. 1981, 10, 51–62. [Google Scholar] [CrossRef]
  37. Risbol, O.; Langhammer, D.; Mauritsen, E.S.; Seitsonen, O. Employment, Utilization, and Development of Airborne Laser Scanning in Fenno-Scandinavian Archaeology-A Review. Remote Sens. 2020, 12, 1411. [Google Scholar] [CrossRef]
  38. Hadjimitsis, D.G. What’s next in Remote Sensing Archaeology? Use of Field Spectroscopy to Design a New Space Sensor. In Proceedings of the Second International Conference on Remote Sensing and Geoinformation of the Environment, Paphos, Cyprus, 7–10 April 2014; Hadjimitsis, D.G., Themistocleous, K., Michaelides, S., Papadavid, G., Eds.; SPIE: Bellingham, WA, USA, 2014; Volume 9229, ISBN 978-1-62841-276-5. [Google Scholar]
  39. Thompson, V.D.; DePratter, C.B.; Lulewicz, J.; Lulewicz, I.H.; Thompson, A.D.R.; Cramb, J.; Ritchison, B.T.; Colvin, M.H. The Archaeology and Remote Sensing of Santa Elena’s Four Millennia of Occupation. Remote Sens. 2018, 10, 248. [Google Scholar] [CrossRef]
  40. Lambers, K. Airborne and Spaceborne Remote Sensing and Digital Image Analysis in Archaeology. In Digital Geoarchaeology: New Techniques for Interdisciplinary Human-Environmental Research; Springer: Cham, Switzherland, 2018; pp. 109–122. [Google Scholar]
  41. Jiang, A.H.; Chen, F.L.; Tang, P.P.; Liu, G.L.; Liu, W.K.; Wang, H.C.; Lu, X.; Zhao, X.L. Radar Remote Sensing for Archaeology in Hangu Frontier Pass in Xi’an, China. IOP Conf. Ser. Earth Environ. Sci. 2017, 57, 012031. [Google Scholar] [CrossRef]
  42. Comer, D.C.; Harrower, M.J.; Leisz, S.J. An Overview of the Application of Remote Sensing to Archaeology during the Twentieth Century. In Mapping Archaeological Landscapes from Space; Springer: New York, NY, USA, 2013; pp. 11–19. [Google Scholar]
  43. Bitelli, G.; Gatta, G.; Guccini, A.M.; Zaffagnini, A. GIS and Geomatics for Archive Documentation of an Architectural Project: The Case of the Big Arc of Entrance to the Vittorio Emanuele II Gallery of Milan, by Giuseppe Mengoni (1877). J. Cult. Herit. 2019, 38, 204–212. [Google Scholar] [CrossRef]
  44. De Meo, A.; Espa, G.; Espa, S.; Pifferi, A.; Ricci, U. A GIS for the Study of the Mid-Tiber Valley. Comparisons between Archaeological Settlements of the Sabine Tiberine Area. J. Cult. Herit. 2003, 4, 169–173. [Google Scholar] [CrossRef]
  45. Huang, S.M.; Hu, Q.W.; Wang, S.H.; Li, H.D. Ecological Risk Assessment of World Heritage Sites Using RS and GIS: A Case Study of Huangshan Mountain, China. Chin. Geogr. Sci. 2022, 32, 808–823. [Google Scholar] [CrossRef]
  46. Castleford, J. Archaeology, GIS, and the Time Dimension: An Overview. In Proceedings of the Computer Applications and Quantitative Methods in Archaeology; Lock, G.J.M., Ed.; 1991; pp. 95–106. [Google Scholar] [CrossRef]
  47. Neubauer, W. GIS in Archaeology—The Interface between Prospection and Excavation. Archaeol. Prospect. 2004, 11, 159–166. [Google Scholar] [CrossRef]
  48. Sanchez, M.L.; Del Pulgar, M.L.G.; Cabrera, A.T. Historic Construction of Diffuse Cultural Landscapes: Towards a GIS-Based Method for Mapping the Interlinkages of Heritage. Landsc. Res. 2021, 46, 916–931. [Google Scholar] [CrossRef]
  49. Nishanbaev, I.; Champion, E.; McMeekin, D.A. A Web GIS-Based Integration of 3D Digital Models with Linked Open Data for Cultural Heritage Exploration. ISPRS Int. J. Geoinf. 2021, 10, 684. [Google Scholar] [CrossRef]
  50. Simou, S.; Baba, K.; Nounah, A. A GIS-Based Methodology to Explore and Manage the Historical Heritage of Rabat City (Morocco). Acm J. Comput. Cult. Herit. 2022, 15, 14. [Google Scholar] [CrossRef]
  51. Agapiou, A.; Lysandrou, V.; Alexakis, D.D.; Themistocleous, K.; Cuca, B.; Argyriou, A.; Sarris, A.; Hadjimitsis, D.G. Cultural Heritage Management and Monitoring Using Remote Sensing Data and GIS: The Case Study of Paphos Area, Cyprus. Comput. Environ. Urban. Syst. 2015, 54, 230–239. [Google Scholar] [CrossRef]
  52. Tzouvaras, M.; Kouhartsiouk, D.; Agapiou, A.; Danezis, C.; Hadjimitsis, D.G. The Use of Sentinel-1 Synthetic Aperture Radar (SAR) Images and Open-Source Software for Cultural Heritage: An Example from Paphos Area in Cyprus for Mapping Landscape Changes after a 5.6 Magnitude Earthquake. Remote Sens. 2019, 11, 1766. [Google Scholar] [CrossRef]
  53. Green, A.S.; Orengo, H.A.; Alam, A.; Garcia-Molsosa, A.; Green, L.M.; Conesa, F.; Ranjan, A.; Singh, R.N.; Petrie, C.A. Re-Discovering Ancient Landscapes: Archaeological Survey of Mound Features from Historical Maps in Northwest India and Implications for Investigating the Large-Scale Distribution of Cultural Heritage Sites in South Asia. Remote Sens. 2019, 11, 2089. [Google Scholar] [CrossRef]
  54. Adamopoulos, E.; Rinaudo, F. UAS-Based Archaeological Remote Sensing: Review, Meta-Analysis and State-of-the-Art. Drones 2020, 4, 46. [Google Scholar] [CrossRef]
  55. Song, Y.Z.; Wu, P. Earth Observation for Sustainable Infrastructure: A Review. Remote Sens. 2021, 13, 1528. [Google Scholar] [CrossRef]
  56. Luo, L.; Wang, X.; Guo, H.; Jia, X.; Fan, A. Earth Observation in Archaeology: A Brief Review. Int. J. Appl. Earth Obs. Geoinf. 2023, 116, 103169. [Google Scholar] [CrossRef]
  57. KILIÇ, G. Remote Sensing Monitoring and Assessment of Silk Road in Turkey: Integrating Drone Systems with GPR and RM. Turk. J. Remote Sens. GIS 2022, 3, 126–138. [Google Scholar] [CrossRef]
  58. Fan, L.; Cao, M.; Li, X. Analysis of the Temporal and Spatial Distribution Characteristics and Influencing Factors of Religious Sites on the Maritime Silk Road: A Case Study of Quanzhou. J. Tour. Manag. Res. 2022, 9, 110–124. [Google Scholar] [CrossRef]
  59. Available online: https://www.researchsquare.com/article/rs-2584780/v1 (accessed on 12 December 2022). [CrossRef]
  60. Mirzahossein, H.; Sedghi, M.; Motevalli Habibi, H.; Jalali, F. Site Selection Methodology for Emergency Centers in Silk Road Based on Compatibility with Asian Highway Network Using the AHP and ArcGIS (Case Study: IR Iran). Innov. Infrastruct. Solut. 2020, 5, 113. [Google Scholar] [CrossRef]
  61. Zhu, X.; Chen, F.; Guo, H. A Spatial Pattern Analysis of Frontier Passes in China’s Northern Silk Road Region Using a Scale Optimization BLR Archaeological Predictive Model. Heritage 2018, 1, 15–32. [Google Scholar] [CrossRef]
  62. Winter, T. Geocultural Power and the Digital Silk Roads. Environ. Plan. D 2022, 40, 923–940. [Google Scholar] [CrossRef]
  63. Liu, Q.; Wang, X.; Cong, K.; Zhang, J.; Yang, Z. Temporal and Spatial Analysis of Deformation Monitoring of the Ming Great Wall in Shanxi Province through InSAR. Appl. Sci. 2023, 13, 12179. [Google Scholar] [CrossRef]
  64. Guo, H.; Qiu, Y.; Massimo, M.; Chen, F.; Zhang, L.; van Genderen, J.; Natarajan, I.; Hodson, S.; Uhlir, P.; Liu, J.; et al. DBAR: International Science Program for Sustainable Development of the Belt and Road Region Using Big Earth Data. Bull. Chin. Acad. Sci. 2017, 32, 8. [Google Scholar]
  65. Guo, H. Steps to the Digital Silk Road. Nature 2018, 554, 25–27. [Google Scholar] [CrossRef]
  66. Kumar, S.; Singh, V.; Saroha, J. Geospatial Technology for Sustainable Development. Int. J. Health Sci. 2022, 6, 12282–12292. [Google Scholar] [CrossRef]
  67. Armstrong, M.P. Requirements for the Development of GIS-Based Group Decision-Support Systems. J. Am. Soc. Inf. Sci. 1994, 45, 669–677. [Google Scholar] [CrossRef]
  68. Guo, H.; Liu, Z.; Jiang, H.; Wang, C.; Liu, J.; Liang, D. Big Earth Data: A New Challenge and Opportunity for Digital Earth’s Development. Int. J. Digit. Earth 2016, 10, 1–12. [Google Scholar] [CrossRef]
  69. Kumar, D.; Singh, R.B.; Kaur, R. Spatial Information Technology: Definitions, Types and Linkages. In Spatial Information Technology for Sustainable Development Goals; Kumar, D., Singh, R.B., Kaur, R., Eds.; Springer International Publishing: Cham, Switzerland, 2019; pp. 3–14. ISBN 978-3-319-58039-5. [Google Scholar]
  70. Liu, J.G.; Mason, P.J. Image Processing and GIS for Remote Sensing: Techniques and Applications; John Wiley & Sons: Hoboken, NJ, USA, 2016; ISBN 1118724208. [Google Scholar]
  71. Hognogi, G.G.; Pop, A.M.; Marian-Potra, A.C.; Somesfalean, T. The Role of UAS-GIS in Digital Era Governance. A Systematic Literature Review. Sustainability 2021, 13, 11097. [Google Scholar] [CrossRef]
  72. Opitz, R.S. An Overview of Airborne and Terrestrial Laser Scanning in Archaeology. In Interpreting Archaeological Topography: 3D Data, Visualisation and Observation; Oxbow Books: Oxford, UK, 2013; pp. 13–31. [Google Scholar]
  73. Church, T.; Brandon, R.J.; Burgett, G.R. GIS Applications in Archaeology: Method in Search of Theory. In Practical Applications of GIS for Archaeologists: A Predictive Modelling Toolkit; Taylor & Francis: Abingdon, UK, 1999; pp. 135–155. [Google Scholar]
  74. Yang, W.B.; Cheng, H.M.; Yen, Y.N. An Application of GIS on Integrative Management for Cultural Heritage—An Example for Digital Management on Taiwan Kinmen Cultural Heritage. In Digital Heritage: Progress in Cultural Heritage: Documentation, Preservation, and Protection; Ioannides, M., MagnenatThalmann, N., Fink, E., Zarnic, R., Yen, A.Y., Quak, E., Eds.; Springer: Berlin/Heidelberg, Germany, 2014; Volume 8740, pp. 590–597. ISBN 978-3-319-13695-0/978-3-319-13694-3. [Google Scholar]
  75. Elfadaly, A.; Attia, W.; Qelichi, M.M.; Murgante, B.; Lasaponara, R. Management of Cultural Heritage Sites Using Remote Sensing Indices and Spatial Analysis Techniques. Surv. Geophys. 2018, 39, 1347–1377. [Google Scholar] [CrossRef]
  76. Rajangam, K.; Rajani, M.B. Applications of Geospatial Technology in the Management of Cultural Heritage Sites—Potentials and Challenges for the Indian Region. Curr. Sci. 2017, 113, 1948–1960. [Google Scholar] [CrossRef]
  77. Elfadaly, A.; Eldein, A.S.; Lasaponara, R. Cultural Heritage Management Using Remote Sensing Data and GIS Techniques around the Archaeological Area of Ancient Jeddah in Jeddah City, Saudi Arabia. Sustainability 2020, 12, 240. [Google Scholar] [CrossRef]
  78. Cobo, M.J.; López-Herrera, A.G.; Herrera-Viedma, E.E.; Herrera, F. An Approach for Detecting, Quantifying, and Visualizing the Evolution of a Research Field: A Practical Application to the Fuzzy Sets Theory Field. J. Informetr. 2011, 5, 146–166. [Google Scholar] [CrossRef]
  79. Aria, M.; Misuraca, M.; Spano, M. Mapping the Evolution of Social Research and Data Science on 30 Years of Social Indicators Research. Soc. Indic. Res. 2020, 149, 803–831. [Google Scholar] [CrossRef]
  80. Luo, L.; Wang, X.; Guo, H.; Lasaponara, R.; Zong, X.; Masini, N.; Wang, G.; Shi, P.; Khatteli, H.; Chen, F.; et al. Airborne and Spaceborne Remote Sensing for Archaeological and Cultural Heritage Applications: A Review of the Century (1907–2017). Remote Sens. Environ. 2019, 232, 111280. [Google Scholar] [CrossRef]
  81. Goodchild, M.F. Geographic Information Systems. Prog. Hum. Geogr. 1991, 15, 194–200. [Google Scholar] [CrossRef]
  82. Allen, K.M.; Green, S.W.; Zubrow, E.B.W. Interpreting Space: GIS and Archaeology; Taylor & Francis: Abingdon, UK, 1990. [Google Scholar]
  83. Menéndez-Marsh, F.; Al-Rawi, M.; Fonte, J.; Dias, R.; Gonçalves, L.J.; Seco, L.G.; Hipólito, J.; Machado, J.P.; Medina, J.; Moreira, J. Geographic Information Systems in Archaeology: A Systematic Review. J. Comput. Appl. Archaeol. 2023, 6, 40–50. [Google Scholar] [CrossRef]
  84. Berg, E. National Registries of Sites and Monuments in Norway—Developing GIS-Based Databases. In Computing Archaeology for Understanding the Past, Proceedings: Computer Applications and Quantitative Methods in Archaeology; Stancic, Z., Veljanovski, T., Eds.; Archaeopress: Oxford, UK, 2001; Volume S931, pp. 133–137. ISBN 1-84171-225-6. [Google Scholar]
  85. Bauer, A.; Nicoll, K.; Park, L.; Matney, T. Archaeological Site Distribution by Geomorphic Setting in the Southern Lower Cuyahoga River Valley, Northeastern Ohio: Initial Observations from a GIS Database. Geoarchaeol. Int. J. 2004, 19, 711–729. [Google Scholar] [CrossRef]
  86. Harris, T.M.; Lock, G. Toward an Evaluation of GIS in European Archaeology: The Past, Present and Future of Theory and Applications. In Archaeology and Geographic Information Systems A European Perspective; CRC Press: Boca Raton, FL, USA, 1995; pp. 349–365. [Google Scholar]
  87. Goings, C.A. A Predictive Model for Lithic Resources in Iowa. Plains Anthr. 2003, 48, 53–67. [Google Scholar] [CrossRef]
  88. Kohler, T.A.; Parker, S.C. Predictive Models for Archaeological Resource Location. In Advances in Archaeological Method and Theory; Elsevier: Amsterdam, The Netherlands, 1986; pp. 397–452. [Google Scholar]
  89. Middleton, R.; Winstanley, D. GIS in a Landscape Archaeology Context. Computing the Past. In CAA92: Computer Applications and Quantitative Methods in Archaeology; Aarhus University Press: Aarhus, Denmark, 1993; pp. 151–158. [Google Scholar]
  90. De Silva, M.; Pizzioli, G. GIS Analysis of Historical Cadastral Maps as a Contribution in Landscape Archaeology. 2004. Available online: http://hdl.handle.net/10900/62125 (accessed on 12 December 2022).
  91. Dani, A.H. Significance of Silk Road to Human Civilization: Its Cultural Dimension. Senri Ethnol. Stud. 1992, 32, 21–26. [Google Scholar]
  92. Lock, G. Spatial Technology and Archaeology: The Archaeological Applications of GIS. Int. J. Geogr. Inf. Sci. 2003, 17, 597–599. [Google Scholar]
  93. Apollonio, F.I.; Gaiani, M.; Benedetti, B. 3D Reality-Based Artefact Models for the Management of Archaeological Sites Using 3D Gis: A Framework Starting from the Case Study of the Pompeii Archaeological Area. J. Archaeol. Sci. 2012, 39, 1271–1287. [Google Scholar] [CrossRef]
  94. Orengo, H.A. Combining Terrestrial Stereophotogrammetry, DGPS and GIS-Based 3D Voxel Modelling in the Volumetric Recording of Archaeological Features. ISPRS J. Photogramm. Remote Sens. 2013, 76, 49–55. [Google Scholar] [CrossRef]
  95. McCool, J.P.P. PRAGIS: A Test Case for a Web-Based Archaeological GIS. J. Archaeol. Sci. 2014, 41, 133–139. [Google Scholar] [CrossRef]
  96. Wilkinson, G.G. A Review of Current Issues in the Integration of GIS and Remote Sensing Data. Int. J. Geogr. Inf. Syst. 1996, 10, 85–101. [Google Scholar] [CrossRef]
  97. Khoumeri, E.H.; Santucci, J.F. GIS in Archaeology; IEEE: Piscataway, NJ, USA, 2006; ISBN 978-1-4244-0231-1. [Google Scholar]
  98. Djindjian, F. GIS Usage in Worldwide Archaeology. Methodol. Trends Future Perspect. Appl. GIS Archaeol. 1998, 9, 19–30. [Google Scholar]
  99. Verhagen, P. Case Studies in Archaeological Predictive Modelling; Amsterdam University Press: Amsterdam, The Netherlands, 2007; Volume 14, ISBN 9087280076. [Google Scholar]
  100. Warren, R.E.; Asch, D.L. A Predictive Model of Archaeological Site Location in the Eastern Prairie Peninsula. In Practical Applications of GIS for Archaeologists: A Predictive Modelling Toolkit; CRC Press: Boca Raton, FL, USA, 2003; pp. 5–32. [Google Scholar]
  101. Alberti, G. Modeling Group Size and Scalar Stress by Logistic Regression from an Archaeological Perspective. PLoS ONE 2014, 9, e91510. [Google Scholar] [CrossRef] [PubMed]
  102. Wachtel, I.; Zidon, R.; Garti, S.; Shelach-Lavi, G. Predictive Modeling for Archaeological Site Locations: Comparing Logistic Regression and Maximal Entropy in North Israel and North-East China. J. Archaeol. Sci. 2018, 92, 28–36. [Google Scholar] [CrossRef]
  103. Vaughn, S.; Crawford, T. A Predictive Model of Archaeological Potential: An Example from Northwestern Belize. Appl. Geogr. 2009, 29, 542–555. [Google Scholar] [CrossRef]
  104. Carleton, W.C.; Conolly, J.; Ianonne, G. A Locally-Adaptive Model of Archaeological Potential (LAMAP). J. Archaeol. Sci. 2012, 39, 3371–3385. [Google Scholar] [CrossRef]
  105. Nicu, I.C.; Mihu-Pintilie, A.; Williamson, J. GIS-Based and Statistical Approaches in Archaeological Predictive Modelling (NE Romania). Sustainability 2019, 11, 5969. [Google Scholar] [CrossRef]
  106. Verhagen, P.; Whitley, T.G. Integrating Archaeological Theory and Predictive Modeling: A Live Report from the Scene. J. Archaeol. Method Theory 2012, 19, 49–100. [Google Scholar] [CrossRef]
  107. Muttaqin, L.A.; Murti, S.H.; Susilo, B. MaxEnt (Maximum Entropy) Model for Predicting Prehistoric Cave Sites in Karst Area of Gunung Sewu, Gunung Kidul, Yogyakarta. In Proceedings of the Sixth Geoinformation Science Symposium, Yogyakarta, Indonesia, 26–27 August 2019; SPIE: Bellingham, WA, USA, 2019; Volume 11311, pp. 87–95. [Google Scholar]
  108. Wang, Y.; Shi, X.; Oguchi, T. Archaeological Predictive Modeling Using Machine Learning and Statistical Methods for Japan and China. ISPRS Int. J. Geoinf. 2023, 12, 238. [Google Scholar] [CrossRef]
  109. Resler, A.; Yeshurun, R.; Natalio, F.; Giryes, R. A Deep-Learning Model for Predictive Archaeology and Archaeological Community Detection. Humanit. Soc. Sci. Commun. 2021, 8, 295. [Google Scholar] [CrossRef]
  110. David, B.; Thomas, J. Handbook of Landscape Archaeology; Routledge: London, UK, 2016; ISBN 1315427729. [Google Scholar]
  111. Verhagen, P.; Nuninger, L.; Groenhuijzen, M.R. Modelling of Pathways and Movement Networks in Archaeology: An Overview of Current Approaches. In Finding the Limits of the Limes: Modelling Demography, Economy and Transport on the Edge of the Roman Empire; Springer: Cham, Switzerland, 2019; pp. 217–249. [Google Scholar]
  112. Mithen, S.; Reed, M. Stepping out: A Computer Simulation of Hominid Dispersal from Africa. J. Hum. Evol. 2002, 43, 433–462. [Google Scholar] [CrossRef] [PubMed]
  113. Bevan, A. Spatial Methods for Analysing Large-Scale Artefact Inventories. Antiquity 2012, 86, 492–506. [Google Scholar] [CrossRef]
  114. Bevan, A.; Conolly, J. GIS, Archaeological Survey, and Landscape Archaeology on the Island of Kythera, Greece. J. Field Archaeol. 2002, 29, 123–138. [Google Scholar] [CrossRef]
  115. Frachetti, M.D.; Smith, C.E.; Traub, C.M.; Williams, T. Nomadic Ecology Shaped the Highland Geography of Asia’s Silk Roads. Nature 2017, 543, 193–198. [Google Scholar] [CrossRef] [PubMed]
  116. Donadio, E.; Spano, A. Data Collection and Management for Stratigraphic Analysis of Upstanding Structures. In Proceedings of the 2015 1st International Conference on Geographical Information Systems Theory, Applications and Management (GISTAM), Barcelona, Spain, 28–30 April 2015; Grueau, C., Rocha, J.G., Eds.; IEEE: Piscatawat, NJ, USA, 2015. ISBN 978-989-758-142-7. [Google Scholar]
  117. Rua, H.; Alvito, P. Living the Past: 3D Models, Virtual Reality and Game Engines as Tools for Supporting Archaeology and the Reconstruction of Cultural Heritage—The Case-Study of the Roman Villa of Casal de Freiria. J. Archaeol. Sci. 2011, 38, 3296–3308. [Google Scholar] [CrossRef]
  118. Brughmans, T.; van Garderen, M.; Gillings, M. Introducing Visual Neighbourhood Configurations for Total Viewsheds. J. Archaeol. Sci. 2018, 96, 14–25. [Google Scholar] [CrossRef]
  119. Van Leusen, M. Viewshed and Cost Surface Analysis Using GIS (Cartographic Modelling in a Cell-Based GIS II). In Proceedings of the Computer Applications and Quantitative Methods in Archaeology; Archaeopress: Oxford, UK, 1999; pp. 215–223. [Google Scholar]
  120. Linck, R.; Fassbinder, J.W.E. Proving a Roman Technical Masterstroke: GIS-Based Viewshed and Intervisibility Analysis of the Bavarian Part of the Rhaetian Limes. Archaeol. Anthr. Sci. 2022, 14, 9. [Google Scholar] [CrossRef]
  121. Schuppert, C.; Dix, A. Reconstructing Former Features of the Cultural Landscape Near Early Celtic Princely Seats in Southern Germany A GIS-Based Application of Large-Scale Historical Maps and Archival Sources as a Contribution to Archaeological Research. Soc. Sci. Comput. Rev. 2009, 27, 420–436. [Google Scholar] [CrossRef]
  122. Goodchild, M.F. Scale in GIS: An Overview. Geomorphology 2011, 130, 5–9. [Google Scholar] [CrossRef]
  123. Lock, G.; Pouncett, J. Spatial Thinking in Archaeology: Is GIS the Answer? J. Archaeol. Sci. 2017, 84, 129–135. [Google Scholar] [CrossRef]
  124. Larrain, A.A.; McCall, M.K. Participatory Mapping and Participatory GIS for Historical and Archaeological Landscape Studies: A Critical Review. J. Archaeol. Method Theory 2019, 26, 643–678. [Google Scholar] [CrossRef]
  125. Wager, J. Developing a Strategy for the Angkor World Heritage Site. Tour Manag. 1995, 16, 515–523. [Google Scholar] [CrossRef]
  126. Stovel, H. Risk Preparedness: A Management Manual for World Cultural Heritage; ICCROM: Rome, Italy, 1998; ISBN 9290771526. [Google Scholar]
  127. Box, P. GIS and Cultural Resource Management: A Manual for Heritage Managers; UNESCO: Bangkok, Thailand, 1999. [Google Scholar]
  128. Myers, D.; Dalgity, A.; Avramides, I.; Wuthrich, D. Arches: An Open Source GIS for the Inventory and Management of Immovable Cultural Heritage. In Proceedings of the Progress in Cultural Heritage Preservation: 4th International Conference, EuroMed 2012, Limassol, Cyprus, 29 October–3 November 2012; Proceedings 4. Springer: Heidelberg, Germany, 2012; pp. 817–824. [Google Scholar]
  129. Matrone, F.; Colucci, E.; De Ruvo, V.; Lingua, A.; Spano, A. HBIM in a Semantic 3D GIS Database. In Proceedings of the 2nd International Conference of Geomatics and Restoration, Milan, Italy, 8–10 May 2019; Brumana, R., Pracchi, V., Rinaudo, F., Grimoldi, A., Scaioni, M., Previtali, M., Cantini, L., Eds.; Volume 42, pp. 857–865. [Google Scholar] [CrossRef]
  130. Zhu, M.; Chen, F.L.; Fu, B.H.; Chen, W.K.; Qiao, Y.F.; Shi, P.L.; Zhou, W.; Lin, H.; Liao, Y.A.; Gao, S. Earthquake-Induced Risk Assessment of Cultural Heritage Based on InSAR and Seismic Intensity: A Case Study of Zhalang Temple Affected by the 2021 Mw 7.4 Maduo (China) Earthquake. Int. J. Disaster Risk Reduct. 2023, 84, 15. [Google Scholar] [CrossRef]
  131. Garrote, J.; Diez-Herrero, A.; Escudero, C.; Garcia, I. A Framework Proposal for Regional-Scale Flood-Risk Assessment of Cultural Heritage Sites and Application to the Castile and Leon Region (Central Spain). Water 2020, 12, 329. [Google Scholar] [CrossRef]
  132. Figueiredo, R.; Romao, X.; Pauperio, E. Flood Risk Assessment of Cultural Heritage at Large Spatial Scales: Framework and Application to Mainland Portugal. J. Cult. Herit. 2020, 43, 163–174. [Google Scholar] [CrossRef]
  133. Tarraguel, A.A.; Krol, B.; van Westen, C. Analysing the Possible Impact of Landslides and Avalanches on Cultural Heritage in Upper Svaneti, Georgia. J. Cult. Herit. 2012, 13, 453–461. [Google Scholar] [CrossRef]
  134. Karakhanian, A.; Jrbashyan, R.; Trifonov, V.; Philip, H.; Arakelian, S.; Avagyan, A.; Baghdasaryan, H.; Davtian, V.; Ghouskassyan, Y. Volcanic Hazards in the Region of the Armenian Nuclear Power Plant. J. Volcanol. Geotherm. Res. 2003, 126, 31–62. [Google Scholar] [CrossRef]
  135. Li, Y.Q.; Jia, X.; Liu, Z.; Zhao, L.; Sheng, P.F.; Storozum, M.J. The Potential Impact of Rising Sea Levels on China’s Coastal Cultural Heritage: A GIS Risk Assessment. Antiquity 2022, 96, 406–421. [Google Scholar] [CrossRef]
  136. Su, X.Y.; Song, C.Q.; Sigley, G. The Uses of Reconstructing Heritage in China: Tourism, Heritage Authorization, and Spatial Transformation of the Shaolin Temple. Sustainability 2019, 11, 411. [Google Scholar] [CrossRef]
  137. Accardo, G.; Giani, E.; Giovagnoli, A. The Risk Map of Italian Cultural Heritage. J. Archit. Conserv. 2003, 9, 41–57. [Google Scholar] [CrossRef]
  138. Campanaro, D.M.; Landeschi, G.; Dell’Unto, N.; Touati, A.M.L. 3D GIS for Cultural Heritage Restoration: A “white Box” Workflow. J. Cult. Herit. 2016, 18, 321–332. [Google Scholar] [CrossRef]
  139. Bastanlar, Y.; Grammalidis, N.; Zabulis, X.; Yilmaz, E.; Yardimci, Y.; Triantafyllidis, G. 3D Reconstruction for a Cultural Heritage Virtual Tour System. Int. Arch. Photogramm. Remote Sens. Spat. Inf. Sci. 2008, 37 Pt B5, 1023–1036. [Google Scholar]
  140. Petrescu, F. The Use of GIS Technology in Cultural Heritage. In Proceedings of the XXI International CIPA Symposium, Athens, Greece, 1–6 October 2007; pp. 1–6. [Google Scholar]
  141. Colucci, E.; De Ruvo, V.; Lingua, A.; Matrone, F.; Rizzo, G. HBIM-GIS Integration: From IFC to CityGML Standard for Damaged Cultural Heritage in a Multiscale 3D GIS. Appl. Sci. 2020, 10, 1356. [Google Scholar] [CrossRef]
  142. Goussios, D.; Faraslis, I. Integrated Remote Sensing and 3D GIS Methodology to Strengthen Public Participation and Identify Cultural Resources. Land 2022, 11, 1657. [Google Scholar] [CrossRef]
  143. Luo, L.; Wang, X.; Guo, H. Remote Sensing Archaeology: The next Century. Innovation 2022, 3, 100335. [Google Scholar] [CrossRef] [PubMed]
  144. Parcak, S.H. Satellite Remote Sensing for Archaeology; Routledge: London, UK, 2009; ISBN 1134060459. [Google Scholar]
  145. Wiseman, J.; El-Baz, F. Remote Sensing in Archaeology; Springer: Berlin/Heidelberg, Germany, 2007. [Google Scholar]
  146. Lasaponara, R.; Masini, N. Remote Sensing in Archaeology: An Overview. J. Aeronaut. Space Technol. 2013, 6, 7–17. [Google Scholar]
  147. Capper, J.E. XXIII.—Photographs of Stonehenge, as Seen from a War Balloon. Archaeologia 1907, 60, 571. [Google Scholar] [CrossRef]
  148. Crawford, O.G.S. Air Survey and Archaeology. Geogr. J. 1923, 61, 342–360. [Google Scholar] [CrossRef]
  149. Hammer, E.; FitzPatrick, M.; Ur, J. Succeeding CORONA: Declassified HEXAGON Intelligence Imagery for Archaeological and Historical Research. Antiquity 2022, 96, 679–695. [Google Scholar] [CrossRef]
  150. Goossens, R.; De Wulf, A.; Bourgeois, J.; Gheyle, W.; Willems, T. Satellite Imagery and Archaeology: The Example of CORONA in the Altai Mountains. J. Archaeol. Sci. 2006, 33, 745–755. [Google Scholar] [CrossRef]
  151. Challis, K. Archaeology’s Cold War Windfall—The CORONA Programme and Lost Landscapes of the Near East. JBIS—J. Br. Interplanet. Soc. 2007, 60, 21–27. [Google Scholar]
  152. De Laet, V.; Paulissen, E.; Waelkens, M. Methods for the Extraction of Archaeological Features from Very High-Resoluition Ikonos-2 Remote Sensing Imagery, Hisar (Southwest Turkey). J. Archaeol. Sci. 2007, 34, 830–841. [Google Scholar] [CrossRef]
  153. Lasaponara, R.; Masini, N. QuickBird-Based Analysis for the Spatial Characterization of Archaeological Sites: Case Study of the Monte Serico Medieval Village. Geophys. Res. Lett. 2005, 32, 4. [Google Scholar] [CrossRef]
  154. Luo, L.; Wang, X.Y.; Liu, J.; Guo, H.D.; Zong, X.; Ji, W.; Cao, H. VHR GeoEye-1 Imagery Reveals an Ancient Water Landscape at the Longcheng Site, Northern Chaohu Lake Basin (China). Int. J. Digit. Earth 2017, 10, 139–154. [Google Scholar] [CrossRef]
  155. Lin, A.Y.M.; Novo, A.; Har-Noy, S.; Ricklin, N.D.; Stamatiou, K. Combining GeoEye-1 Satellite Remote Sensing, UAV Aerial Imaging, and Geophysical Surveys in Anomaly Detection Applied to Archaeology. IEEE J. Sel. Top Appl. Earth Obs. Remote Sens. 2011, 4, 870–876. [Google Scholar] [CrossRef]
  156. Agapiou, A.; Alexakis, D.D.; Hadjimitsis, D.G. Spectral Sensitivity of ALOS, ASTER, IKONOS, LANDSAT and SPOT Satellite Imagery Intended for the Detection of Archaeological Crop Marks. Int. J. Digit. Earth 2014, 7, 351–372. [Google Scholar] [CrossRef]
  157. El-Behaedi, R. Detection and 3D Modeling of Potential Buried Archaeological Structures Using WorldView-3 Satellite Imagery. Remote Sens. 2022, 14, 92. [Google Scholar] [CrossRef]
  158. Luo, L.; Wang, X.Y.; Lasaponara, R.; Xiang, B.; Zhen, J.; Zhu, L.W.; Yang, R.X.; Liu, D.C.; Liu, C.S. Auto-Extraction of Linear Archaeological Traces of Tuntian Irrigation Canals in Miran Site (China) from Gaofen-1 Satellite Imagery. Remote Sens. 2018, 10, 718. [Google Scholar] [CrossRef]
  159. Linck, R.; Busche, T.; Buckreuss, S. Visual Analysis of TerraSAR-X Backscatter Imagery for Archaeological Prospection. Photogramm. Fernerkund. Geoinf. 2014, 2014, 55–65. [Google Scholar] [CrossRef]
  160. Le, T.S.; Chang, C.P.; Nguyen, X.T.; Yhokha, A. TerraSAR-X Data for High-Precision Land Subsidence Monitoring: A Case Study in the Historical Centre of Hanoi, Vietnam. Remote Sens. 2016, 8, 338. [Google Scholar] [CrossRef]
  161. Tapete, D.; Cigna, F. COSMO-SkyMed SAR for Detection and Monitoring of Archaeological and Cultural Heritage Sites. Remote Sens. 2019, 11, 1326. [Google Scholar] [CrossRef]
  162. Chen, F.L.; Masini, N.; Yang, R.X.; Milillo, P.; Feng, D.X.; Lasaponara, R. A Space View of Radar Archaeological Marks: First Applications of COSMO-SkyMed X-Band Data. Remote Sens. 2015, 7, 24–50. [Google Scholar] [CrossRef]
  163. Tapete, D.; Cigna, F. Detection, Morphometric Analysis and Digital Surveying of Archaeological Mounds in Southern Iraq with CartoSat-1 and COSMO-SkyMed DEMs. Land 2022, 11, 1406. [Google Scholar] [CrossRef]
  164. Stewart, C.; Lasaponara, R.; Schiavon, G. ALOS PALSAR Analysis of the Archaeological Site of Pelusium. Archaeol. Prospect. 2013, 20, 109–116. [Google Scholar] [CrossRef]
  165. Dore, N.; Patruno, J.; Pottier, E.; Crespi, M. New Research in Polarimetric SAR Technique for Archaeological Purposes Using ALOS PALSAR Data. Archaeol. Prospect. 2013, 20, 79–87. [Google Scholar] [CrossRef]
  166. Chen, F.L.; Lasaponara, R.; Masini, N. An Overview of Satellite Synthetic Aperture Radar Remote Sensing in Archaeology: From Site Detection to Monitoring. J. Cult. Herit. 2017, 23, 5–11. [Google Scholar] [CrossRef]
  167. Stewart, C. Detection of Archaeological Residues in Vegetated Areas Using Satellite Synthetic Aperture Radar. Remote Sens. 2017, 9, 118. [Google Scholar] [CrossRef]
  168. Chen, F.L.; Masini, N.; Liu, J.; You, J.B.; Lasaponara, R. Multi-Frequency Satellite Radar Imaging of Cultural Heritage: The Case Studies of the Yumen Frontier Pass and Niya Ruins in the Western Regions of the Silk Road Corridor. Int. J. Digit. Earth 2016, 9, 1224–1241. [Google Scholar] [CrossRef]
  169. Sarasan, A.; Ardelean, A.C.; Balarie, A.; Wehrheim, R.; Tabaldiev, K.; Akmatov, K. Mapping Burial Mounds Based on UAV-Derived Data in the Suusamyr Plateau, Kyrgyzstan. J. Archaeol. Sci. 2020, 123, 10. [Google Scholar] [CrossRef]
  170. Balsi, M.; Esposito, S.; Fallavollita, P.; Melis, M.G.; Milanese, M. Preliminary Archeological Site Survey by UAV-Borne Lidar: A Case Study. Remote Sens. 2021, 13, 332. [Google Scholar] [CrossRef]
  171. Aminzadeh, B.; Samani, F. Identifying the Boundaries of the Historical Site of Persepolis Using Remote Sensing. Remote Sens. Environ. 2006, 102, 52–62. [Google Scholar] [CrossRef]
  172. Lasaponara, R.; Masini, N.; Holmgren, R.; Forsberg, Y.B. Integration of Aerial and Satellite Remote Sensing for Archaeological Investigations: A Case Study of the Etruscan Site of San Giovenale. J. Geophys. Eng. 2012, 9, S26–S39. [Google Scholar] [CrossRef]
  173. Noviello, M.; Ciminale, M.; De Pasquale, V. Combined Application of Pansharpening and Enhancement Methods to Improve Archaeological Cropmark Visibility and Identification in QuickBird Imagery: Two Case Studies from Apulia, Southern Italy. J. Archaeol. Sci. 2013, 40, 3604–3613. [Google Scholar] [CrossRef]
  174. Figorito, B.; Tarantino, E. Semi-Automatic Detection of Linear Archaeological Traces from Orthorectified Aerial Images. Int. J. Appl. Earth Obs. Geoinf. 2014, 26, 458–463. [Google Scholar] [CrossRef]
  175. Davis, D.S.; Douglass, K. Aerial and Spaceborne Remote Sensing in African Archaeology: A Review of Current Research and Potential Future Avenues. Afr. Archaeol. Rev. 2020, 37, 9–24. [Google Scholar] [CrossRef]
  176. Trier, O.D.; Larsen, S.O.; Solberg, R. Automatic Detection of Circular Structures in High-Resolution Satellite Images of Agricultural Land. Archaeol. Prospect. 2009, 16, 1–15. [Google Scholar] [CrossRef]
  177. Luo, L.; Wang, X.Y.; Liu, C.S.; Guo, H.D.; Du, X.C. Integrated RS, GIS and GPS Approaches to Archaeological Prospecting in the Hexi Corridor, NW China: A Case Study of the Royal Road to Ancient Dunhuang. J. Archaeol. Sci. 2014, 50, 178–190. [Google Scholar] [CrossRef]
  178. Lasaponara, R.; Masini, N. Living in the Golden Age of Digital Archaeology. In Computational Science and Its Applications—Iccsa 2016, Pt Ii; Gervasi, O., Murgante, B., Misra, S., Rocha, A., Torre, C.M., Tanier, D., Apduhan, B.O., Stankova, E., Wang, S., Eds.; Springer: Cham, Switzherland, 2016; Volume 9787, pp. 597–610. ISBN 978-3-319-42108-7. [Google Scholar]
  179. Luo, L.; Bachagha, N.; Yao, Y.; Liu, C.S.; Shi, P.L.; Zhu, L.W.; Shao, J.; Wang, X.Y. Identifying Linear Traces of the Han Dynasty Great Wall in Dunhuang Using Gaofen-1 Satellite Remote Sensing Imagery and the Hough Transform. Remote Sens. 2019, 11, 2711. [Google Scholar] [CrossRef]
  180. Cowley, D.C. In with the New, out with the Old? Auto-Extraction for Remote Sensing Archaeology. In Remote Sensing of the Ocean, Sea Ice, Coastal Waters, and Large Water Regions 2012; Bostater, C.R., Mertikas, S.P., Neyt, X., Nichol, C., Cowley, D.C., Bruyant, J.P., Eds.; SPIE: Bellingham, WA, USA, 2012; Volume 8532, ISBN 978-0-8194-9272-2. [Google Scholar]
  181. Soroush, M.; Mehrtash, A.; Khazraee, E.; Ur, J.A. Deep Learning in Archaeological Remote Sensing: Automated Qanat Detection in the Kurdistan Region of Iraq. Remote Sens. 2020, 12, 500. [Google Scholar] [CrossRef]
  182. Chen, F.; Zhou, R.; Van de Voorde, T.; Chen, X.Z.; Bourgeois, J.; Gheyle, W.; Goossens, R.; Yang, J.; Xu, W.B. Automatic Detection of Burial Mounds (Kurgans) in the Altai Mountains. Isprs J. Photogramm. Remote Sens. 2021, 177, 217–237. [Google Scholar] [CrossRef]
  183. Yang, S.; Luo, L.; Li, Q.; Chen, Y.; Wu, L.; Wang, X. Auto-Identification of Linear Archaeological Traces of the Great Wall in Northwest China Using Improved DeepLabv3+ from Very High-Resolution Aerial Imagery. Int. J. Appl. Earth Obs. Geoinf. 2022, 113, 102995. [Google Scholar] [CrossRef]
  184. Tobiasz, A.; Markiewicz, J.; Lapinski, S.; Nikel, J.; Kot, P.; Muradov, M. Review of Methods for Documentation, Management, and Sustainability of Cultural Heritage. Case Study: Museum of King Jan III’s Palace at Wilanow. Sustainability 2019, 11, 7046. [Google Scholar] [CrossRef]
  185. Deroin, J.P.; Kheir, R.B.; Abdallah, C. Geoarchaeological Remote Sensing Survey for Cultural Heritage Management. Case Study from Byblos (Jbail, Lebanon). J. Cult. Herit. 2017, 23, 37–43. [Google Scholar] [CrossRef]
  186. Patania, I.; Porter, S.T.; Keegan, W.F.; Dihogo, R.; Frank, S.; Lewis, J.; Mashaka, H.; Ogutu, J.; Skosey-Lalonde, E.; Tryon, C.A.; et al. Geoarchaeology and Heritage Management: Identifying and Quantifying Multi-Scalar Erosional Processes at Kisese II Rockshelter, Tanzania. Front. Earth Sci. 2022, 9, 20. [Google Scholar] [CrossRef]
  187. Lasaponara, R.; Yang, R.X.; Chen, F.L.; Li, X.; Masini, N. Corona Satellite Pictures for Archaeological Studies: A Review and Application to the Lost Forbidden City of the Han-Wei Dynasties. Surv. Geophys. 2018, 39, 1303–1322. [Google Scholar] [CrossRef]
  188. Trant, P.L.K.; Kristiansen, S.M.; Sindbaek, S.M. Visible Near-Infrared Spectroscopy as an Aid for Archaeological Interpretation. Archaeol. Anthr. Sci. 2020, 12, 19. [Google Scholar] [CrossRef]
  189. Adamopoulos, E.; Bovero, A.; Rinaudo, F. Image-Based Metric Heritage Modeling in the near-Infrared Spectrum. Herit. Sci. 2020, 8, 12. [Google Scholar] [CrossRef]
  190. Verhoeven, G.J. Near-Infrared Aerial Crop Mark Archaeology: From Its Historical Use to Current Digital Implementations. J. Archaeol. Method Theory 2012, 19, 132–160. [Google Scholar] [CrossRef]
  191. Tang, P.P.; Chen, F.L.; Zhu, X.K.; Zhou, W. Monitoring Cultural Heritage Sites with Advanced Multi-Temporal InSAR Technique: The Case Study of the Summer Palace. Remote Sens. 2016, 8, 432. [Google Scholar] [CrossRef]
  192. Tapete, D.; Cigna, F. InSAR Data for Geohazard Assessment in UNESCO World Heritage Sites: State of-the-Art and Perspectives in the Copernicus Era. Int. J. Appl. Earth Obs. Geoinf. 2017, 63, 24–32. [Google Scholar] [CrossRef]
  193. Tarchi, D.; Rudolf, H.; Pieraccini, M.; Atzeni, C. Remote Monitoring of Buildings Using a Ground-Based SAR: Application to Cultural Heritage Survey. Int. J. Remote Sens. 2010, 21, 3545–3551. [Google Scholar] [CrossRef]
  194. Morrison, K. Mapping Subsurface Archaeology with SAR. Archaeol. Prospect. 2013, 20, 149–160. [Google Scholar] [CrossRef]
  195. Themistocleous, K.; Nisantzi, A.; Hadjimitsis, D.; Retalis, A.; Paronis, D.; Michaelides, S.; Chrysoulakis, N.; Agapiou, A.; Giorgousis, G.; Perdikou, S. Monitoring Air Pollution in the Vicinity of Cultural Heritage Sites in Cyprus Using Remote Sensing Techniques. In Digital Heritage; Ioannides, M., Fellner, D., Georgopoulos, A., Hadjimitsis, D.G., Eds.; Springer: Berlin/Heidelberg, Germany, 2010; Volume 6436, p. 536. ISBN 978-3-642-16872-7. [Google Scholar]
  196. Roots, O.O.; Roose, A.; Eerme, K. Remote Sensing of Climate Change, Long-Term Monitoring of Air Pollution and Stone Material Corrosion in Estonia. Int. J. Remote Sens. 2011, 32, 9691–9705. [Google Scholar] [CrossRef]
  197. Zhang, Y.; Zhang, H.; Sun, Z. Effects of Urban Growth on Architectural Heritage: The Case of Buddhist Monasteries in the Qinghai-Tibet Plateau. Sustainability 2018, 10, 1593. [Google Scholar] [CrossRef]
  198. Lasaponara, R.; Murgante, B.; Elfadaly, A.; Qelichi, M.M.; Shahraki, S.Z.; Wafa, O.; Attia, W. Spatial Open Data for Monitoring Risks and Preserving Archaeological Areas and Landscape: Case Studies at Kom El Shoqafa, Egypt and Shush, Iran. Sustainability 2017, 9, 572. [Google Scholar] [CrossRef]
  199. Agapiou, A.; Alexakis, D.D.; Lysandrou, V.; Sarris, A.; Cuca, B.; Themistocleous, K.; Hadjimitsis, D.G. Impact of Urban Sprawl to Cultural Heritage Monuments: The Case Study of Paphos Area in Cyprus. J. Cult. Herit. 2015, 16, 671–680. [Google Scholar] [CrossRef]
  200. Bachagha, N.; Wang, X.; Luo, L.; Li, L.; Khatteli, H.; Lasaponara, R. Remote Sensing and GIS Techniques for Reconstructing the Military Fort System on the Roman Boundary (Tunisian Section) and Identifying Archaeological Sites. Remote Sens. Environ. 2020, 236, 111418. [Google Scholar] [CrossRef]
  201. Available online: https://www.iccrom.org/publication/guide-risk-management (accessed on 12 December 2022).
  202. Lucchi, E. Review of Preventive Conservation in Museum Buildings. J. Cult. Herit. 2018, 29, 180–193. [Google Scholar] [CrossRef]
  203. Liu, J.; Xu, Z.; Chen, F.; Chen, F.; Zhang, L. Flood Hazard Mapping and Assessment on the Angkor World Heritage Site, Cambodia. Remote Sens. 2019, 11, 98. [Google Scholar] [CrossRef]
  204. Chen, F.L.; Guo, H.D.; Ma, P.F.; Lin, H.; Wang, C.; Ishwaran, N.; Hang, P. Radar Interferometry Offers New Insights into Threats to the Angkor Site. Sci. Adv. 2017, 3, 8. [Google Scholar] [CrossRef]
  205. Zhang, P. The Integration of GIS Technology and Novel Approaches in the Research of Silk Road Restoration in 2000. Trends Recent Res. Hist. China 2017, 2, 57–611. [Google Scholar]
  206. Bi, S.B.; He, X.Q.; Jiao, F.; Lu, G.N.; Pei, A.P. Spatial Data Mining on Cultural Stratums for Field Archaeology Based on Geography Information System Databases; IEEE: Piscataway, NJ, USA, 2009; ISBN 978-0-7695-3816-7. [Google Scholar]
  207. Jaiswal, G.; Sharma, A.; Yadav, S.K. Critical Insights into Modern Hyperspectral Image Applications through Deep Learning. Wiley Interdiscip. Rev. Data Min. Knowl. Discov. 2021, 11, 22. [Google Scholar] [CrossRef]
  208. Howey, M.C.L.; Burg, M.B. Assessing the State of Archaeological GIS Research: Unbinding Analyses of Past Landscapes. J. Archaeol. Sci. 2017, 84, 1–9. [Google Scholar] [CrossRef]
  209. Sudmanns, M.; Tiede, D.; Lang, S.; Bergstedt, H.; Trost, G.; Augustin, H.; Baraldi, A.; Blaschke, T. Big Earth Data: Disruptive Changes in Earth Observation Data Management and Analysis? Int. J. Digit. Earth 2019, 13, 832–850. [Google Scholar] [CrossRef] [PubMed]
  210. Conesa, F.C.; Orengo, H.A.; Lobo, A.; Petrie, C.A. An Algorithm to Detect Endangered Cultural Heritage by Agricultural Expansion in Drylands at a Global Scale. Remote Sens. 2023, 15, 53. [Google Scholar] [CrossRef]
  211. Yang, C.; Yu, M.; Li, Y.; Hu, F.; Jiang, Y.; Liu, Q.; Sha, D.; Xu, M.; Gu, J. Big Earth Data Analytics: A Survey. Big Earth Data 2019, 3, 83–107. [Google Scholar] [CrossRef]
  212. Gomes, V.C.F.; Queiroz, G.R.; Ferreira, K.R. An Overview of Platforms for Big Earth Observation Data Management and Analysis. Remote Sens. 2020, 12, 1253. [Google Scholar] [CrossRef]
  213. Chen, F.; You, J.; Tang, P.; Zhou, W.; Masini, N.; Lasaponara, R. Unique Performance of Spaceborne SAR Remote Sensing in Cultural Heritage Applications: Overviews and Perspectives. Archaeol. Prospect. 2018, 25, 71–79. [Google Scholar] [CrossRef]
  214. Chen, F.; Guo, H.; Tapete, D.; Cigna, F.; Piro, S.; Lasaponara, R.; Masini, N. The Role of Imaging Radar in Cultural Heritage: From Technologies to Applications. Int. J. Appl. Earth Obs. Geoinf. 2022, 112, 102907. [Google Scholar] [CrossRef]
  215. Tapete, D.; Cigna, F. Detection of Archaeological Looting from Space: Methods, Achievements and Challenges. Remote Sens. 2019, 11, 2389. [Google Scholar] [CrossRef]
  216. Lasaponara, R.; Masini, N. Big Earth Data for Cultural Heritage in the Copernicus Era. In Remote Sensing for Archaeology and Cultural Landscapes: Best Practices and Perspectives Across Europe and the Middle East; Hadjimitsis, D.G., Themistocleous, K., Cuca, B., Agapiou, A., Lysandrou, V., Lasaponara, R., Masini, N., Schreier, G., Eds.; Springer International Publishing: Cham, Switzerland, 2020; pp. 31–46. ISBN 978-3-030-10979-0. [Google Scholar]
  217. Chen, F.; Liu, H.; Xu, H.; Zhou, W.; Balz, T.; Chen, P.; Zhu, X.; Lin, H.; Fang, C.; Parcharidis, I. Deformation Monitoring and Thematic Mapping of the Badaling Great Wall Using Very High-Resolution Interferometric Synthetic Aperture Radar Data. Int. J. Appl. Earth Obs. Geoinf. 2021, 105, 102630. [Google Scholar] [CrossRef]
  218. Bohak, C.; Slemenik, M.; Kordez, J.; Marolt, M. Aerial LiDAR Data Augmentation for Direct Point-Cloud Visualisation. Sensors 2020, 20, 2089. [Google Scholar] [CrossRef] [PubMed]
  219. Stular, B.; Eichert, S.; Lozic, E. Airborne LiDAR Point Cloud Processing for Archaeology. Pipeline and QGIS Toolbox. Remote Sens. 2021, 13, 3225. [Google Scholar] [CrossRef]
  220. Orengo, H.A.; Conesa, F.C.; Garcia-Molsosa, A.; Lobo, A.; Green, A.S.; Madella, M.; Petrie, C.A. Automated Detection of Archaeological Mounds Using Machine-Learning Classification of Multisensor and Multitemporal Satellite Data. Proc. Natl. Acad. Sci. USA 2020, 117, 18240–18250. [Google Scholar] [CrossRef]
  221. Lambers, K.; Verschoof-van der Vaart, W.B.; Bourgeois, Q.P.J. Integrating Remote Sensing, Machine Learning, and Citizen Science in Dutch Archaeological Prospection. Remote Sens. 2019, 11, 794. [Google Scholar] [CrossRef]
  222. Ludwig, N.; Orsilli, J.; Bonizzoni, L.; Gargano, M. UV-IR Image Enhancement for Mapping Restorations Applied on an Egyptian Coffin of the XXI Dynasty. Archaeol. Anthr. Sci. 2019, 11, 6841–6850. [Google Scholar] [CrossRef]
  223. Ming, Y.; Me, R.C.; Chen, J.K.; Rahmat, R.W.O.K. A Systematic Review on Virtual Reality Technology for Ancient Ceramic Restoration. Appl. Sci. 2023, 13, 8991. [Google Scholar] [CrossRef]
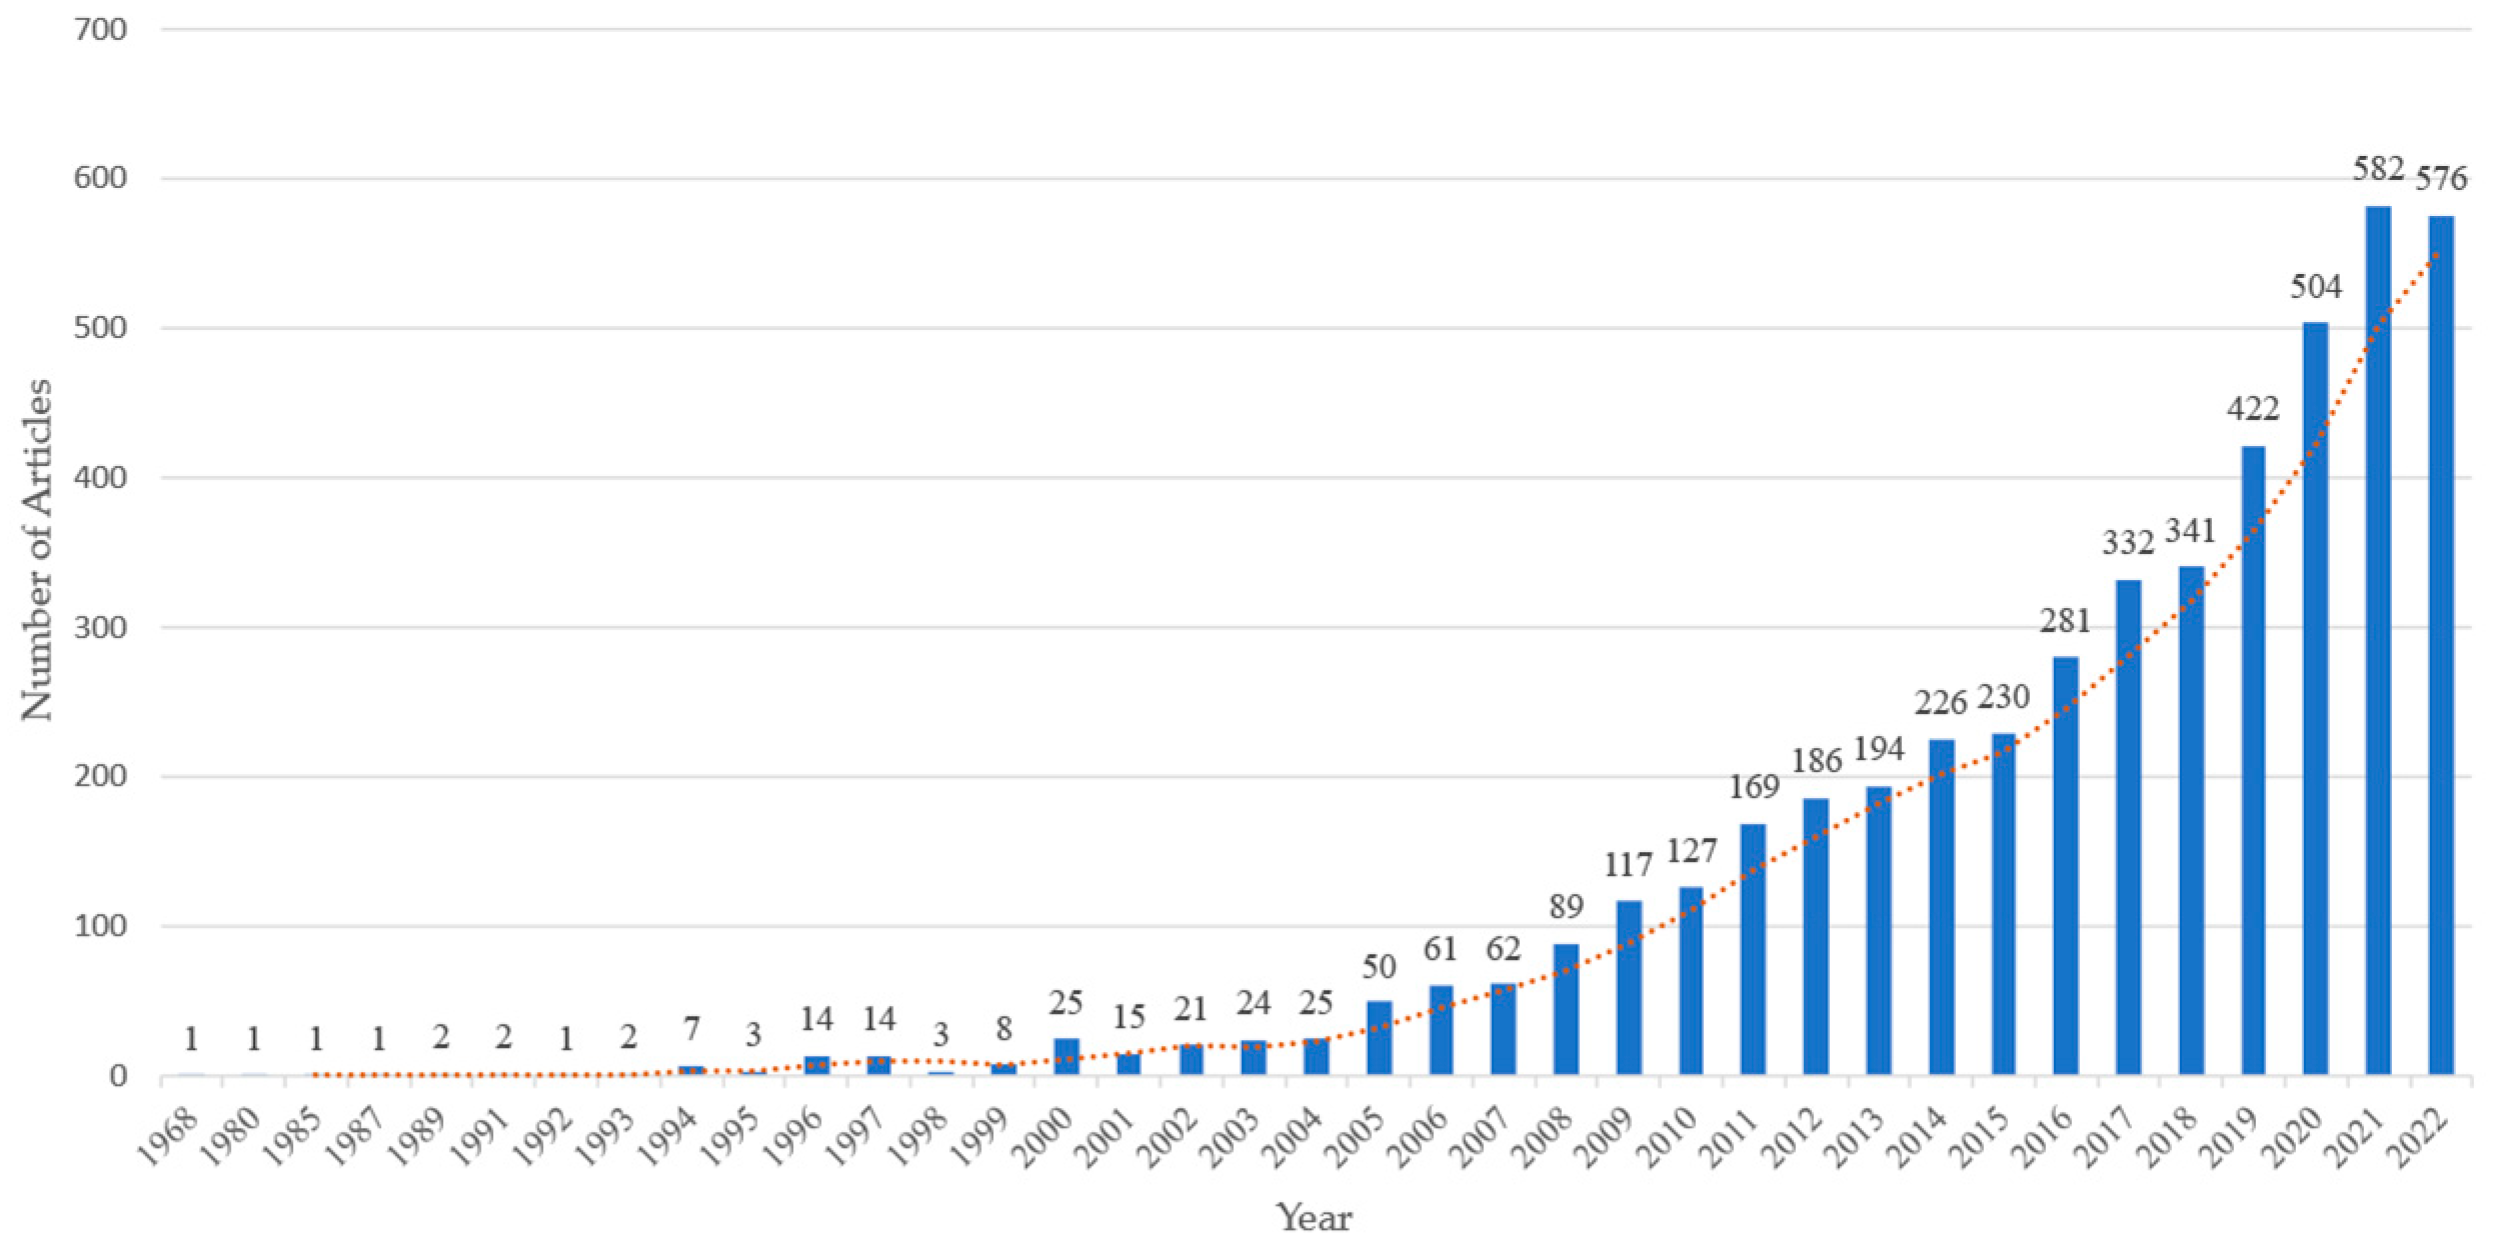
Figure 1. Annual publications (1968–2022) of GIS-RS in ACH extracted from the WOS database.
Remotesensing 15 05766 g001
Figure 2. Corresponding author’s countries of journal articles related to GIS-RS in ACH (generated by Bibliometric).
Remotesensing 15 05766 g002
Figure 3. Sources and numbers of published records related to GIS-RS in ACH.
Remotesensing 15 05766 g003
Figure 4. Most relevant keyword cloud to GIS-RS in ACH (The relative size of the font represents the relative frequency of its appearance. Generated by Bibliometric).
Remotesensing 15 05766 g004
Figure 5. Term frequency and its span trend for GIS-RS application in ACH (Generated by Bibliometric).
Remotesensing 15 05766 g005
Figure 6. Strategic diagrams for GIS-RS application in ACH by abstract PLUS (2010–2022) (Generated by Bibliometric).
Remotesensing 15 05766 g006
Figure 7. Pictures G1 to G12 display 12 typical GLASS fragments from Han Great Wall Site. Colored lines represent the automatic extraction of 12 typical linear traces. Magenta lines represent the identified fragments of linear traces, and yellow and red points represent the start and end points of the extracted lines, respectively [179].
Remotesensing 15 05766 g007
Figure 8. Satellite imagery of the Myra Valley. (a) Location and scope of the Myra Valley Corridor within Tunisia; (b) the Landsat 8 OLI data of Myra Valley Corridor (RGB: band 7, 4, and 3); (c) Elevation of the Myra Valley Corridor derived from ASTER GDEM data (following [200]).
Remotesensing 15 05766 g008
Figure 9. (a) WV2 VHR PAN image of site 1, (b) field photos of wall remains, (c) reddish burned soil, and (d) pottery fragments (following [200]).
Remotesensing 15 05766 g009
Figure 10. Comprehensive interpretation map of Roman limes and forts based on remote sensing satellite data. Using remote sensing technology to detect Roman forts in south Tunisia, we indicated the spatial relationship between limes and forts, as well as between forts. T I, J, K and L represents the potential sites; site 1 and site 2 are new discovered sites. (referenced from [200]).
Remotesensing 15 05766 g010
Figure 11. (a) Flood hazard assessment map of Angkor. (b) Maps showing overlap of the components of the site and those in the buffer zone (reference from [203]).
Remotesensing 15 05766 g011
Figure 12. Results derived from Monument-scale Tomographic Synthetic Aperture Radar Interferometry (Tomo-PSInSAR) at Angkor Wat for the observation period of 2011–2013 are presented. (A) The annual deformation rates reveal spatial motion heterogeneity, which is overlaid on QuickBird imagery provided by DigitalGlobe (www.digitalglobe.com/). (B) Two specific monuments, identified by pink arrows and (A) exhibiting vulnerabilities such as cracks, were under maintenance, as confirmed by field investigations conducted in 2014 (following [204]).
Remotesensing 15 05766 g012
Figure 13. Evidence of seasonal groundwater tables and the thermodynamics of stone materials was observed in the following ways. (a) A correlation between groundwater level and precipitation was evident. Notably, there was a significant seasonal fluctuation in groundwater levels (ranging from −4.5 to −0.5 m) in the central archaeological zone of Angkor following the Barays restoration. This resulted in stabilized groundwater tables despite a decrease in annual precipitation from 2012 to 2013 (1183.8 mm in 2012 to 1037.0 mm in 2013). (b) The annual deformation rates of the Angkor Wat Temple showed irregular fragmentary motions, with values ranging from −3 to +3 mm/year. (c) Thermal amplitudes in Synthetic Aperture Radar (SAR) line of sight direction varied spatially, with values between −0.25 and +0.25 mm/°C, overlaid on the averaged amplitude of SAR imagery. (d) Deformation time series of two representative Persistent Scatterer (PS) points, PS1 showing mild subsidence and PS2 exhibiting a stable trend, were marked by pink stars on (b). A positive correlation was found between the seasonal variation of the groundwater table and the nonlinear motion of PSs. Additionally, the co-occurrence of structural instabilities and thermal amplitude dispersions was observed, as highlighted by pink arrows in (b,c). The TerraSAR/TanDEM-X data utilized in this study were provided by the German Aerospace Center (DLR) under the General AO project (CAL2073). (following [204]).
Remotesensing 15 05766 g013
Figure 14. Silk Road historical geography information open platform (https://www.srhgis.com).
Remotesensing 15 05766 g014
Disclaimer/Publisher’s Note: The statements, opinions and data contained in all publications are solely those of the individual author(s) and contributor(s) and not of MDPI and/or the editor(s). MDPI and/or the editor(s) disclaim responsibility for any injury to people or property resulting from any ideas, methods, instructions or products referred to in the content.