Article

A New Deep Neural Network Based on SwinT-FRM-ShipNet for SAR Ship Detection in Complex Near-Shore and Offshore Environments

The Shanghai Key Laboratory of Multidimensional Information Processing, East China Normal University, Shanghai 200241, China
*
Author to whom correspondence should be addressed.
Remote Sens. 2023, 15(24), 5780; https://doi.org/10.3390/rs15245780
Submission received: 30 September 2023 / Revised: 14 December 2023 / Accepted: 15 December 2023 / Published: 18 December 2023

Abstract

:
The advent of deep learning has significantly propelled the utilization of neural networks for Synthetic Aperture Radar (SAR) ship detection in recent years. However, there are two main obstacles in SAR detection. Challenge 1: The multiscale nature of SAR ships. Challenge 2: The influence of intricate near-shore environments and the interference of clutter noise in offshore areas, especially affecting small-ship detection. Existing neural network-based approaches attempt to tackle these challenges, yet they often fall short in effectively addressing small-ship detection across multiple scales and complex backgrounds simultaneously. To overcome these challenges, we propose a novel network called SwinT-FRM-ShipNet. Our method introduces an integrated feature extractor, Swin-T-YOLOv5l, which combines Swin Transformer and YOLOv5l. The extractor is designed to highlight the differences between the complex background and the target by encoding both local and global information. Additionally, a feature pyramid IEFR-FPN, consisting of the Information Enhancement Module (IEM) and the Feature Refinement Module (FRM), is proposed to enrich the flow of spatial contextual information, fuse multiresolution features, and refine representations of small and multiscale ships. Furthermore, we introduce recursive gated convolutional prediction heads (GCPH) to explore the potential of high-order spatial interactions and add a larger-sized prediction head to focus on small ships. Experimental results demonstrate the superior performance of our method compared to mainstream approaches on the SSDD and SAR-Ship-Dataset. Our method achieves an F1 score, mAP0.5, and mAP0.5:0.95 of 96.5% (+0.9), 98.2% (+1.0%), and 75.4% (+3.3%), respectively, surpassing the most competitive algorithms.

1. Introduction

Synthetic aperture radar (SAR) uses synthetic aperture principles to achieve high-resolution microwave images and has been widely used in civilian and military applications [1,2,3,4]. Ship detection is one of the most popular research fields of ocean monitoring, oil leakage, marine shipping control, etc. With the support of spaceborne SAR technology, many SAR images have become available, such as RADARSAT-2, TerraSAR-X, and Sentinel-1 [5,6,7]. SAR ship detection has been a fundamental task in SAR fields, aiming to extract and analyze effective target information from large numbers of SAR image data to achieve perceptive information on the ground and sea surface [8,9].
Traditional ship detection for SAR imagery requires manually designed features such as shape, texture, grayscale, and contrast to differentiate between land, ocean, and ship targets. The constant false-alarm rate (CFAR) [10] detection algorithm, such as gamma distribution [11] and k distribution [12], is a representative algorithm for SAR ship detection, which adaptively selects an appropriate threshold while maintaining a constant false-alarm rate to detect targets. Wang et al. [13] proposed a strong spatial domain CFAR ship detection method that effectively utilizes the intensity of each pixel and the correlation between adjacent pixels. However, the technique was limited to prior knowledge and background information. Ye et al. [14] proposed a multiscale CFAR algorithm, which used wavelet analysis and scale-space analysis to implement multiscale detection. Although the improved algorithms are widely used, the generalization ability is poor because it requires the appropriate handcrafted features for different scenarios. Additionally, it is susceptible to noise interference and has complex computational calculations.
With the development of deep learning in image detection and classification [15,16], SAR processing based on Convolutional Neural Networks (CNNs) [17] has received increasing attention, especially for ship detection. AlexNet [18], ZF-Net, VGG-Net, GoogLeNet, and ResNet performed exceptionally well [19]. Meanwhile, Ross and Kaiming incorporated CNNs into object detection tasks, and multiple effective algorithms were proposed, like Spatial Pyramid Pooling (SPP)-Net, Region-based Convolutional Neural Network (R-CNN), Fast R-CNN, Faster R-CNN, and Cascade R-CNN [20,21,22,23]. Object detection is mainly divided into single-stage and two-stage algorithms. Faster R-CNN, a representative of the two-stage algorithm, has higher detection accuracy but requires numerous computations and has a longer inference time. The one-stage algorithm includes SSD and YOLO series: SSD (Single Shot MultiBox Detector) connects multiple detection heads to feature maps with different resolutions to detect diverse-sized objects [24]; YOLO is an end-to-end object detection algorithm based on a single neural network [25,26], which includes YOLOv1–YOLOv5. The one-stage algorithm greatly improved computational speed while achieving detection accuracy that was only slightly inferior to the two-stage algorithm.
CNNs demonstrate advantages in spatial information representation, but due to the locality of convolution operations, they face challenges in directly modeling contextual information and global semantic interactions [27]. This leads to difficulty in distinguishing ship targets in complex background environments.
Recently, the success of the Transformer has addressed the limitations of CNNs and achieved outstanding performance. The Vision Transformer (ViT), proposed in 2020 [28], partitioned images into fixed-size blocks and utilized each block as a word embedding in the input sequence for network training, which achieved better results than CNN on large-scale datasets. The Detection TRansformer (DETR) algorithm [29] has simplified the prior knowledge constraints, such as NMS (Non-Maximum Suppression) and anchor boxes, and only performed end-to-end detection, greatly speeding up the detection process. Following the ViT, Swin Transformer [30] is mentioned and shows potential in dense target detection. Although it has been proved that Transformer has made significant progress in the medical field [31], its potential on SAR ship images has not been confirmed.
However, the above detection methods based on CNN cannot be directly applied to SAR ship detection. The main obstacles are listed as follows:
(1)
Complex background, including near-shore environment and noise interference. Due to SAR imaging characteristics [32], there is a presence of speckle noise. Additionally, ship detection is affected by sea clutter, islands, and shore, which could lead to false alarms.
(2)
Multiscale and small-ship detection. Due to various ship shapes and multiresolution imaging modes, there are ships of different sizes present in a single image, especially densely distributed small ships. When small ships are mapped into the final feature map, little information is available for fine-tuning the location and classification, resulting in a high rate of false negatives.
(3)
Capacity for generalization. Most algorithms exhibit limited robustness across different datasets and scenarios.
In [33,34,35], the rotational Libra R-CNN, CenterNet++, and CD framework with bitemporal image transform are proposed to solve small-ship detection in complex environments. In [36,37,38,39], the Spatial Shuffle-group Enhancement (SSE) attention module, Dense Attention Pyramid Network, multidimensional network, and new detector with FFEN and RDN are proposed to solve multiscale detection. However, refs. [33,34,35] often experience missed detections in multiscale scenarios, and the performance of [36,37,38,39] falls short of expectations in the complex backgrounds of small ships. These proposed methods are tailored for a single problem, which cannot effectively address problems of small SAR ship detection in both complex environments and multiple scales.
In this article, we propose an integrated network called SwinT-FRM-ShipNet, illustrated in Figure 1, to improve the performance of multiscale and small-ship detection in complex near-shore and offshore environments. To accurately locate ships in complex backgrounds, we architecturally combine the YOLOv5l with Swin Transformer encoders [30] in the backbone of the feature extraction layer. The combination compensates for the disadvantages of the CNN structure, which is unable to capture global and contextual information due to its limited receptive field. In the neck of the feature fusion layer, we design a feature pyramid network called IEFR-FPN that includes an information enhancement module (IEM) and a feature refinement module (FRM). IEM could enrich spatial contextual information flow, while the FRM could eliminate the significant semantic differences in feature fusions of different scales, preventing small target features from being drowned in conflicting information. Additionally, we introduce recursive gated convolutional (g3Conv) [40] prediction heads (GCPH) to perform high-order spatial information interactions and add a larger-sized prediction head (160 × 160) to improve overall small-ship detection performance and robustness.
The primary contributions of the article can be summarized as follows:
(1)
Considering the complex background, we propose an integrated feature extractor, Swin-T-YOLOv5l, which combines YOLOv5l and Swin Transformer encoders. The extractor significantly improves detection accuracy by encoding both local and global information, effectively distinguishing between targets from complex backgrounds.
(2)
For multiscale and small-ship detection, a feature pyramid IEFR-FPN, including IEM and FRM, is proposed in the feature fusion layer. IEM injects the multiscale features generated by dilated convolution into the feature pyramid network from top to bottom, therefore supplementing contextual information. The FRM introduces a feature refinement mechanism both in the spatial and channel dimensions to prevent small targets from being submerged in conflicting information with an attention mechanism.
(3)
We introduce g3Conv prediction heads (GCPH) and one more prediction head to locate small ships accurately and improve robustness. To verify the robustness of our model, we conduct experiments on the datasets of SSDD [41], and SAR-Ship-Dataset [42], and our method achieves the accuracy of 96.7% and 96.5% separately.

2. Related Work

2.1. SAR Ship Detection

Due to its importance in both civilian and military domains, researchers have conducted numerous studies on SAR ship detection. Facing challenges in SAR images with complex backgrounds, the rotational Libra R-CNN was proposed by Guo et al. [33] to handle imbalance in the object, trait, and instance levels. Sequentially, Guo et al. [34] introduced the CenterNet++, involving a feature fusion pyramid, feature refinement module, and head enhancement module, to address complex background and small object detection. Hao Chen et al. [35] incorporated bitemporal image transform (BIT) into a deep feature differencing-based CD framework. In addition, Transformer encoders were used to construct the context with two sets of tokens. Cui et al. [36] applied the attention module of spatial shuffle-group enhancement into CenterNet to retrieve key points and contextual features to eliminate false alarms. Although the [33,34,35,36] can accurately locate small targets in complex backgrounds, they often exhibit false positives and misses in the detection of multiscale ships. To address the challenges posed by multiscale and small objects, Cui et al. [37] employed a Dense Attention Pyramid Network (DAPN) to perform multi-scene SAR ship detection, including convolutional attention modules and a pyramid structure. Dong Li et al. [38] introduced a new multidimensional network for SAR ship detection, utilizing supplementary features in both spatial and frequency dimensions to enhance robustness in multiscale or rotation situations and complex background scenarios. An innovative CNN, consisting of a fused feature extraction network (FFEN), a refined detection network (RDN), and a region proposal network, was introduced by Dai et al. [39] to locate multiscale SAR ships. However, the potential of [37,38,39] has not been confirmed in complex backgrounds and scenarios. In conclusion, in practical applications, the above-mentioned models fail to simultaneously handle sparse small SAR ship detection in complex backgrounds and multiscale ship detection in near-shore and offshore areas effectively. This limitation results in occurrences of false positives and false negatives. Therefore, we propose the model called SwinT-FRM-ShipNet to overcome these challenges.

2.2. Structure of YOLOv5l

Considering both detection speed and accuracy, we select YOLOv5l [43] as our baseline. In general, the YOLOv5l framework comprises three parts: the backbone, the neck, and the head. The backbone is utilized to retrieve upper-level semantic features and low-level textures from input images via multiple convolutions and merges. The main architecture of CSPDarknet53 could generate three feature maps with the size of 20 × 20, 40 × 40, and 80 × 80. In the neck layer, there is a series of fusion layers completing the function of feature concatenations. Different-sized feature maps generated from the backbone are combined to acquire more contextual information and minimize information loss. For better fusion, the feature pyramid network (FPN) and the path aggregation network (PANet) are employed. The FPN structure allows for robust semantic information to be transferred from top to bottom of the feature maps, while PANet is utilized to transfer strong local texture and pattern features from bottom to top. The joint of FPN and PANet greatly addresses the issue of multiscale detection. Finally, the head structure has three detection heads corresponding to the size of 20 × 20, 40 × 40, and 80 × 80, respectively, to detect objects of different sizes. Each detection layer can produce a 21-channel vector, which is calculated by (4 + numbers of classification categories) × 3, and the predicted categories and bounding boxes of the targets are generated and labeled within the original input image for the final detection.

2.3. Swin Transformer

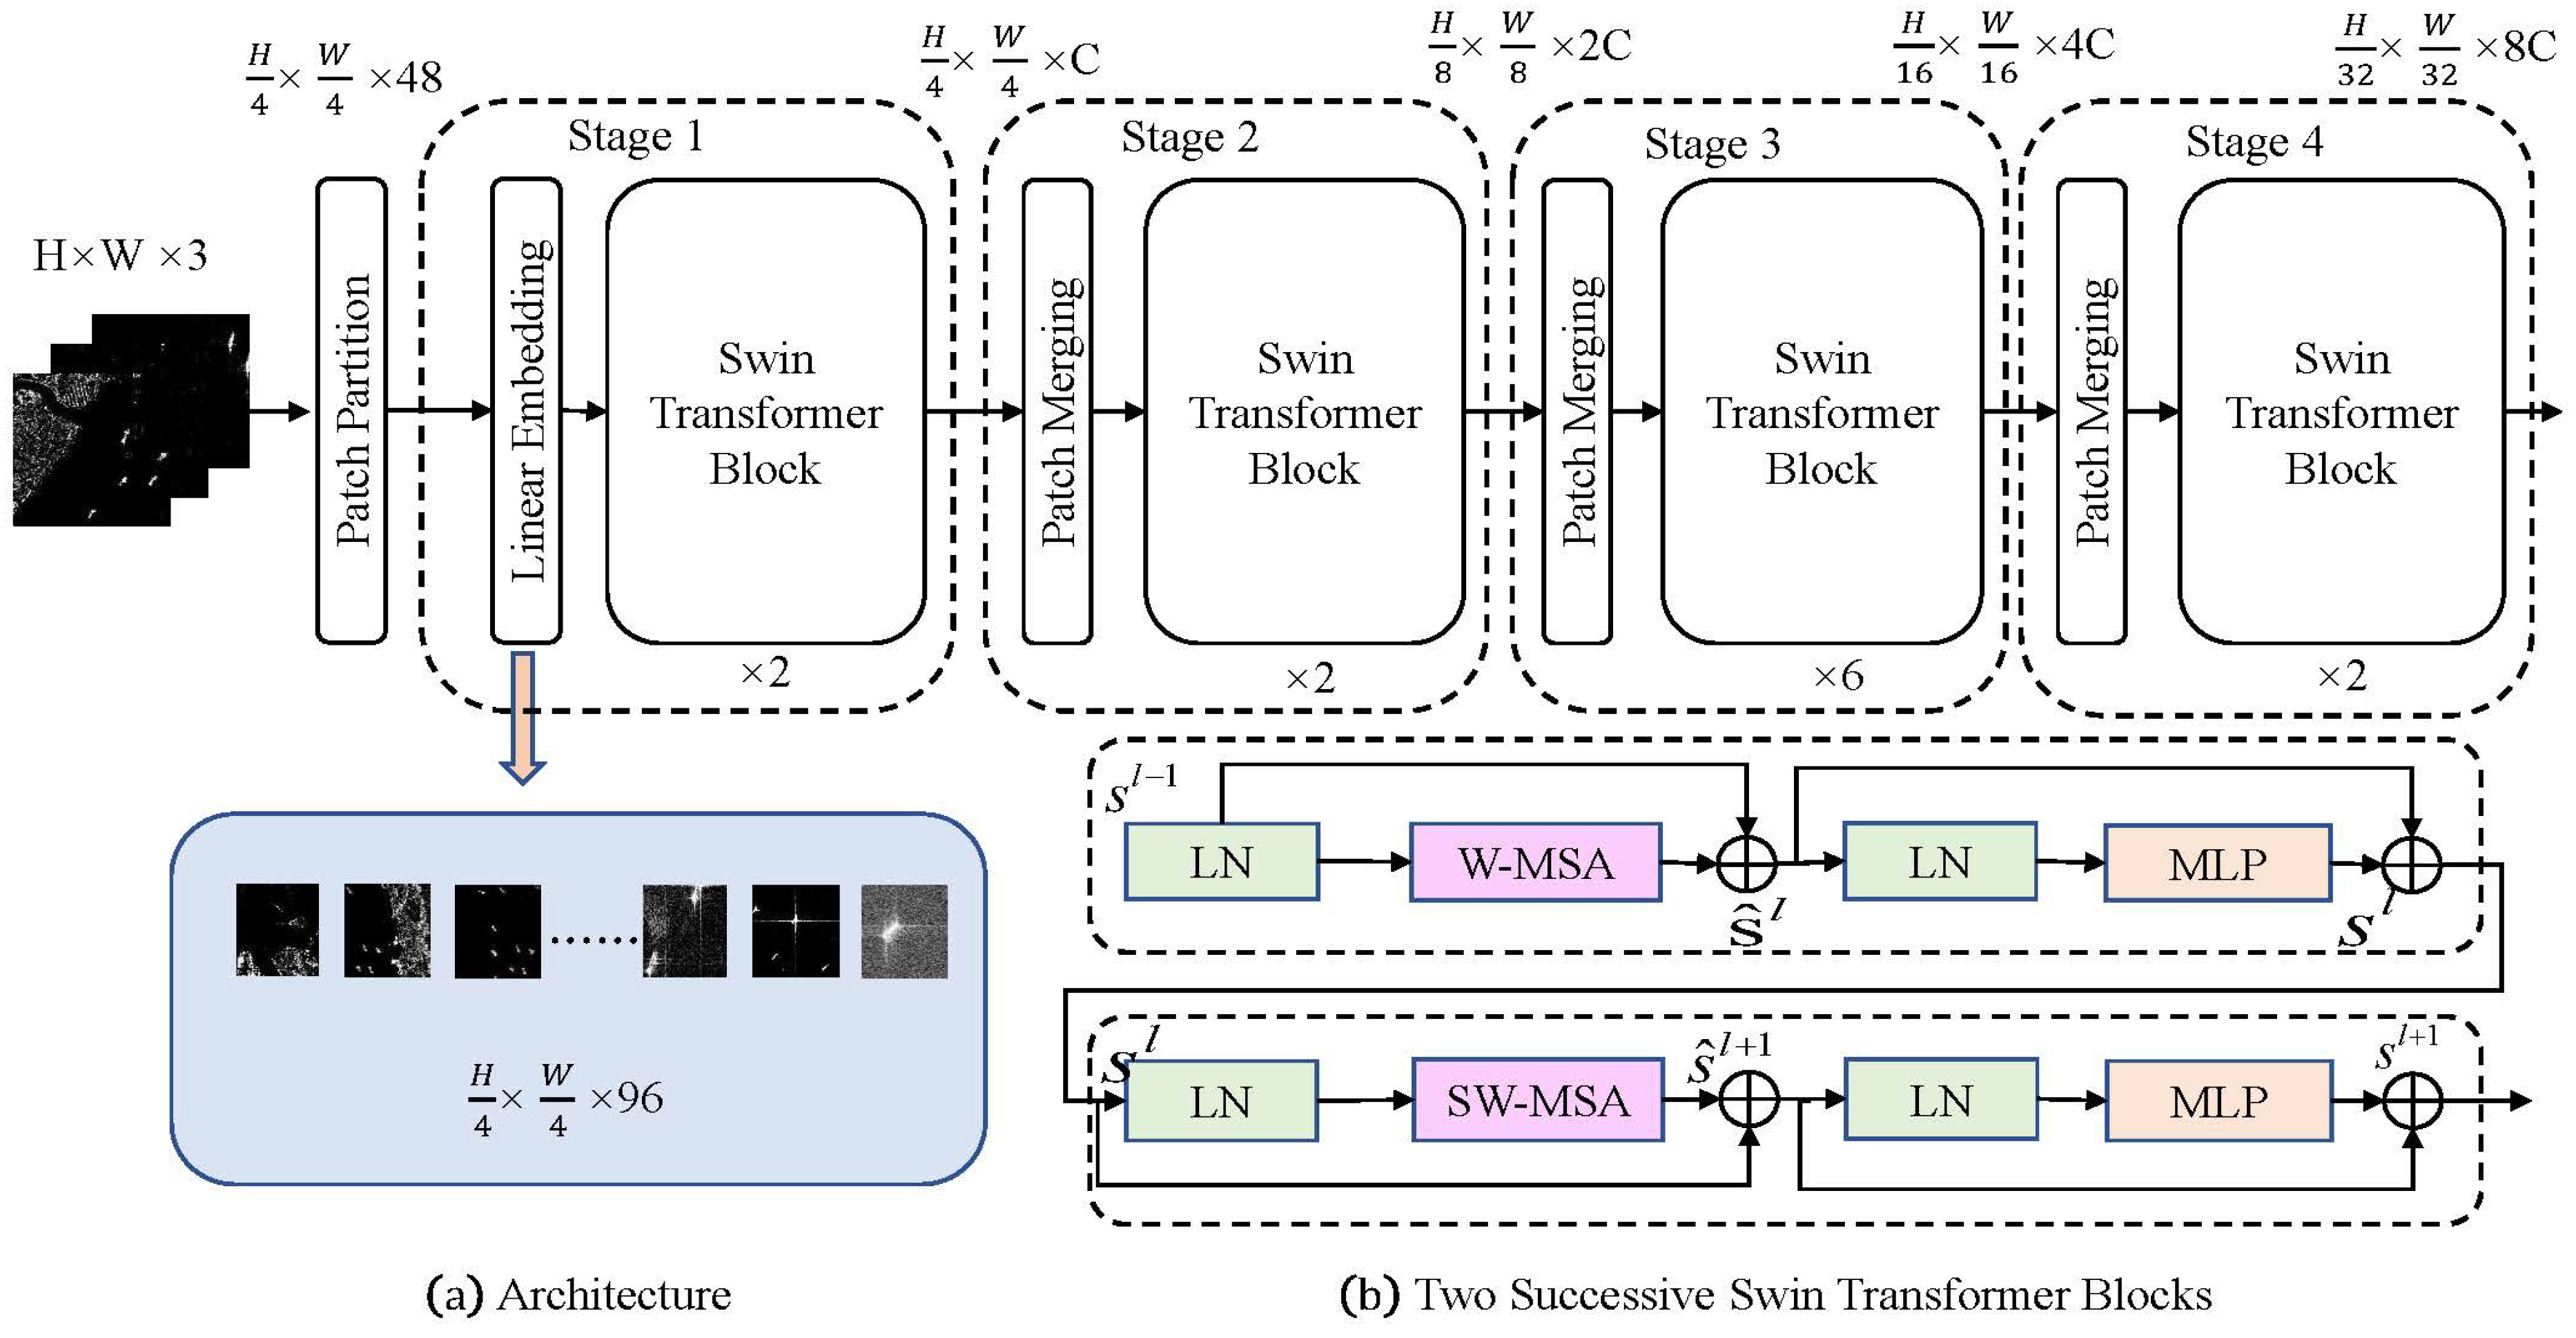
Swin Transformer architecture [30] is displayed in Figure 2. First, the RGB input image could be split into disjoint patches by patch partition. Each patch is considered to be a token, and the features are generated by concatenating original pixel values in the pre-configured patch window. In this study, we set the size of the patch window as 4 × 4. Therefore, the dimension per patch is calculated as 4 × 4 × 3 = 48. Then, a linear embedding layer is designed to project the sequence dimension into 96 dimensions via 1 × 1 convolution. Swin Transformer introduces the multi-head self-attention (MSA) modules (W-MSA) and shifted windows (SW-MSA) based on windows. In this study, the window size is set as 7 × 7. W-MSA and SW-MSA calculate multi-head self-attention within each window, where W-MSA calculates local windows and SW-MSA calculates cross-windows. Through an effective window shift algorithm and mask mechanism, the MSA calculation is not only restricted to non-overlapping local windows but also allows cross-window connections, resulting in higher efficiency.
As shown in Figure 2, W-MSA and SW-MSA are followed by a two-layer Multi-Layer Perception with Rectified Linear Units. LayerNorm and a residual connection are applied before and after each MSA module and MLP layer, respectively. Equation (1) represents the calculation formula and process of the entire Swin Transformer block.
s ^ l = W M S A ( L N ( s ^ l 1 ) ) + s l 1 , s l = M L P ( L N ( s ^ l ) ) + s ^ l , s ^ l + 1 = S W M S A ( L N ( s l ) ) + s l , s l + 1 = M L P ( L N ( s ^ l + 1 ) ) + s ^ l + 1 ,
where s l 1 denotes the input of the W-MSA module, s l denotes the output features of the W-MSA block, and s l + 1 denotes the output features of the SW-MSA block. The Swin Transformer blocks could effectively encode local, global, and contextual clues. Therefore, better feature information is extracted.
Additionally, to create a hierarchical representation, the network gradually reduces the number of tokens using patch merging layers as it goes deeper. Each operation reduces the image size by half while doubling the number of channels.

3. Materials and Methods

3.1. SwinT-FRM-ShipNet Network

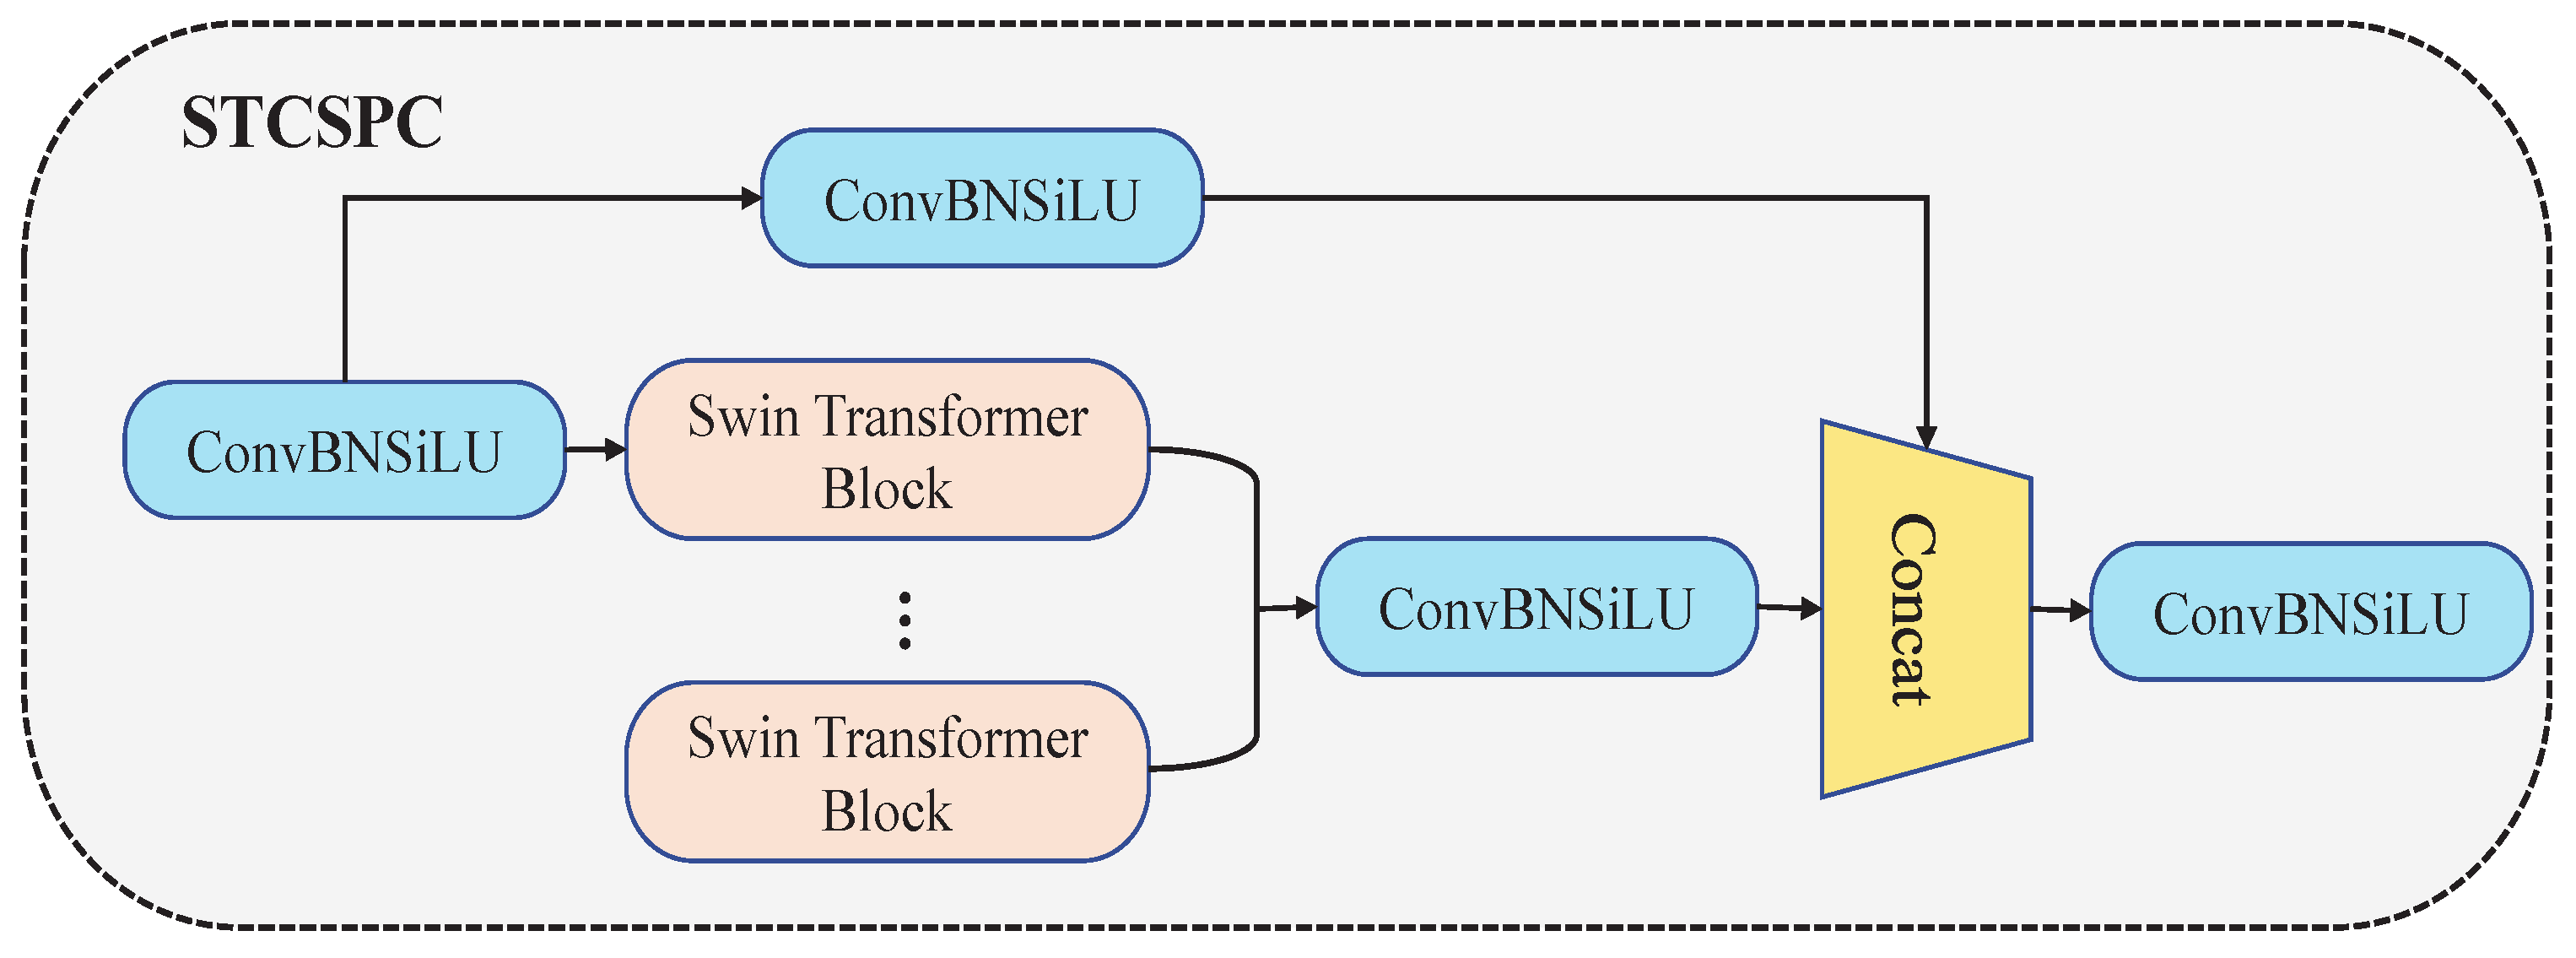
The architecture of SwinT-FRM-ShipNet is depicted in Figure 1. In the backbone, an effectively integrated feature extractor—Swin-T-YOLOv5l is proposed to solve the small-ship detection in the complex environment and strong clutter background. First, we substitute the C3 module with the C2f module [44], as shown in Figure 1b. The C3 module is designed to increase the depth of the network and capture more abstract features to improve the detection accuracy of large objects, while the C2f module is designed to capture global information and improve the detection performance of small objects, which ensures lightweight while obtaining richer gradient flow information. Additionally, an STCSPC module, as illustrated in Figure 3, is designed. This module incorporates the Swin Transformer encoder, which uses a multi-head self-attention mechanism and shift window mechanism to capture long-range dependency relationships and retain different local information. The capability proves essential in distinguishing targets and backgrounds effectively.
In the neck, to solve the multiscale and small-ship detection, we propose an effective feature pyramid network—IEFR-FPN. As we can see in Figure 1, {C5, C4, C3, C2, C1}, represent different levels generated by Swin-T-YOLOv5l, and C2 and C1 are yielded by the proposed integrated feature extractor, which encodes global and local information. {F1, F2, F3, F4} are labeled as feature levels generated by FPN and {P1, P2, P3, P4} are labeled as feature levels generated by FRM. The network mainly consists of IEM and FRM. The inspiration for IEM comes from human object recognition patterns. For instance, it is easier to distinguish a bird in the high sky when the sky is considered to be contextual information rather than treat it as an individual entity. Therefore, the IEM module uses dilated convolutions with different rates to obtain contextual information with diverse receptive fields and injects information into FPN from top to bottom to enrich the information flow. However, due to semantic differences between different levels in FPN, it would introduce incompatible and redundant information while sharing the features. Hence, we propose an FRM module to filter conflicting information and minimize semantic differences. Through adaptively fusing different features across FPN layers, the conflicting information among layers is eliminated, and it prevents small targets from being overwhelmed in conflicts. Finally, we add a larger size prediction head of 160 × 160 to focus on small objects, and the output of FRM would go through the g3Conv prediction head (GCPH) to yield the final detection results. The interaction of high-order spatial information contributes to localization and classification tasks.

3.2. Integration of Swin Transformer and YOLOv5l

To enhance the capability of feature extraction and generalization for SAR images, we introduce an integrated feature extractor—Swin-T-YOLOv5l, in Figure 1—which adopts the self-designed STCSPC module in the last two feature extractor layers. The STCSPC module shown in Figure 3 mainly consists of Swin Transformer blocks. We separately select 6 and 4 Swin Transformer encoder blocks in the last two STCSPC modules. The window size is set to 8. We set the numbers of multi-head to be input channels divided by 32. The encoders could concentrate on a series of image patches and encode global, local, and contextual clues to extract better feature information. Through W-MSA and SW-MSA mechanisms, the model can not only capture long-range dependencies to enhance the overall accuracy but also preserve different local information to improve generalization ability. The integrated extractor combines the strengths of both CNN and Swin Transformer, maintaining local and global information simultaneously. This compensates for the limitations of YOLOv5 as a typical CNN, which struggles to capture global and contextual information due to a limited receptive field. The experiments demonstrate that the integrated extractor is effective for SAR ship detection.

3.3. Information Enhancement Module

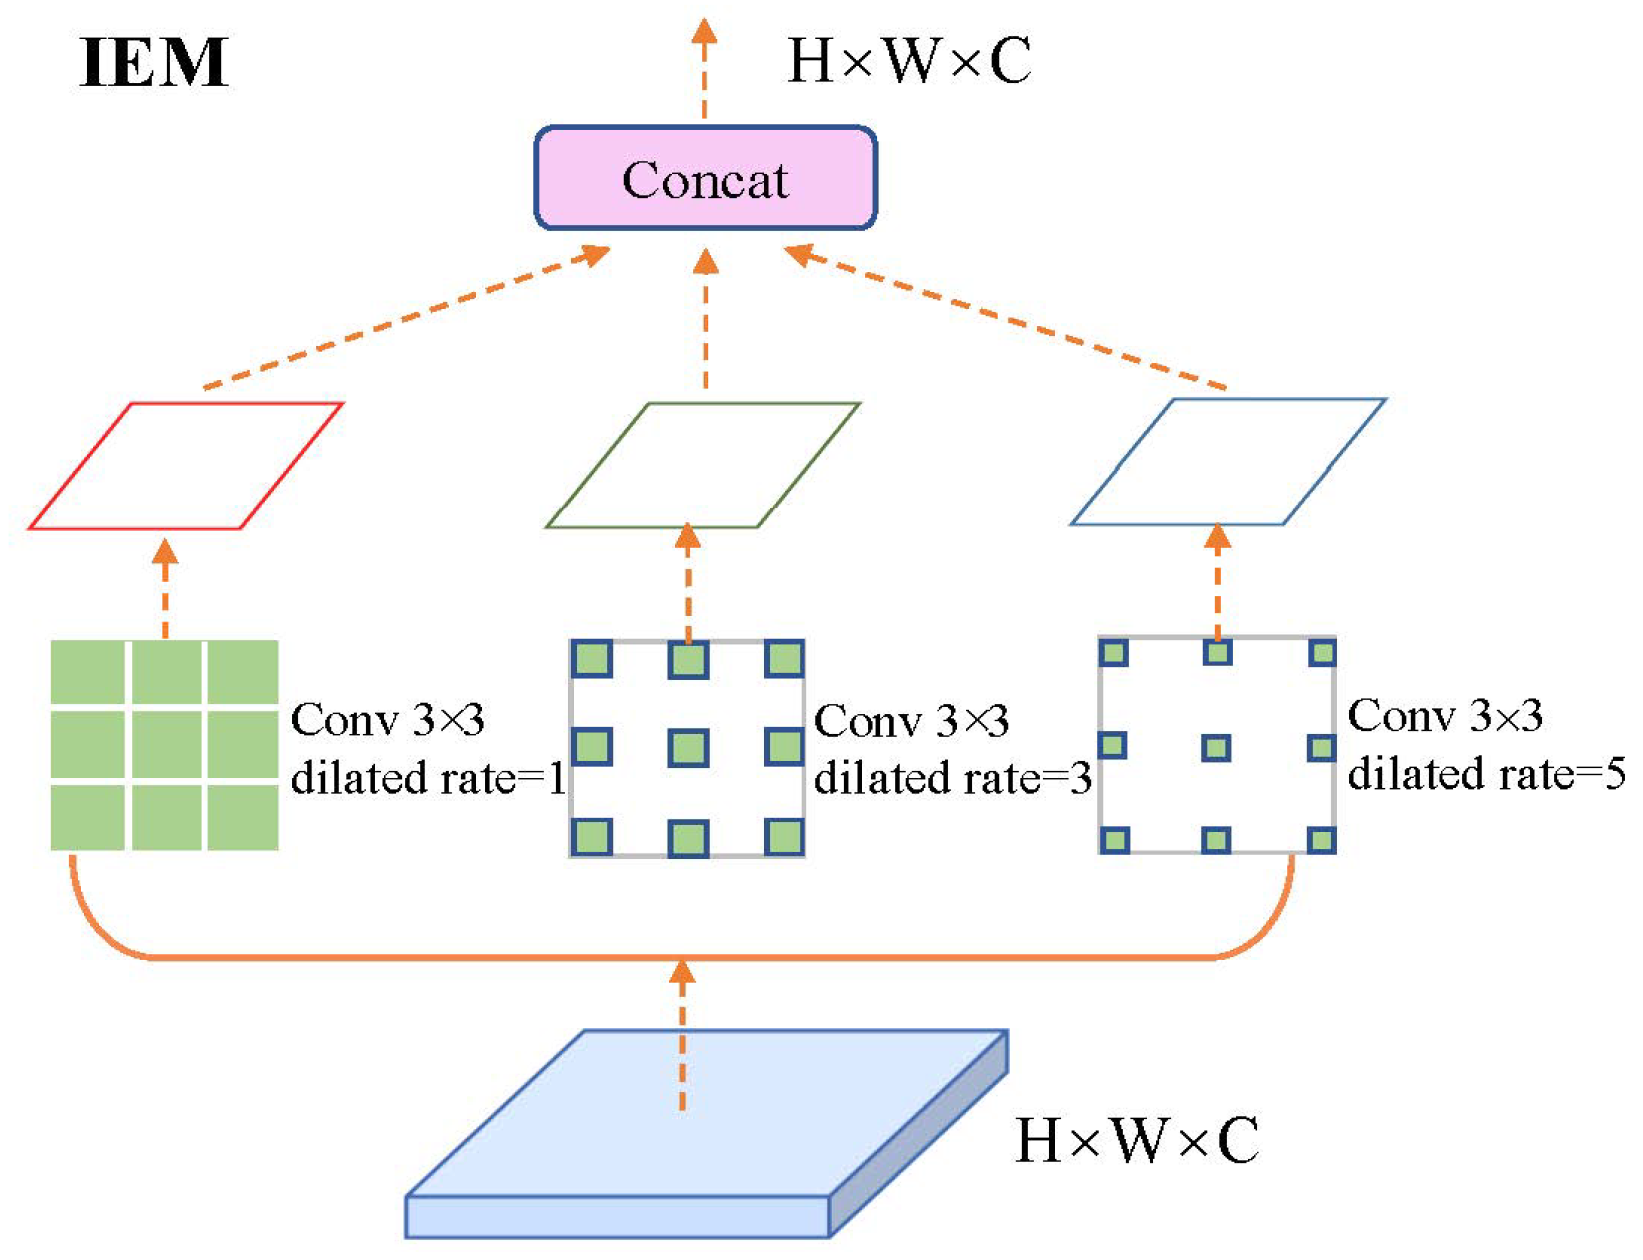
Contextual information is critical in small objection detection. Supported by the contextual information flow, small SAR ships and backgrounds could be effectively distinguished. Figure 4 is the structure of IEM. We adopt different dilated convolutions to obtain context information to enrich the information flow of FPN. The kernel size is 3 × 3, and the dilated rate is 1, 3, and 5. The dilated convolution could increase receptive fields with enlarged dilation rates, allowing the network to capture spatial structure information of input features better than ordinary convolution. Finally, we combine three feature maps with diverse receptive fields to acquire contextual information to localize the SAR ship target precisely.

3.4. Feature Refinement Module

FPN is used to fuse features with different scales. However, the significant semantic differences among these scales can lead to conflicts and redundancy in direct fusion operations, reducing the ability to represent multiple scales. Therefore, we introduce the FRM module to minimize conflicting information and prevent small targets from being overwhelmed by disturbance information.
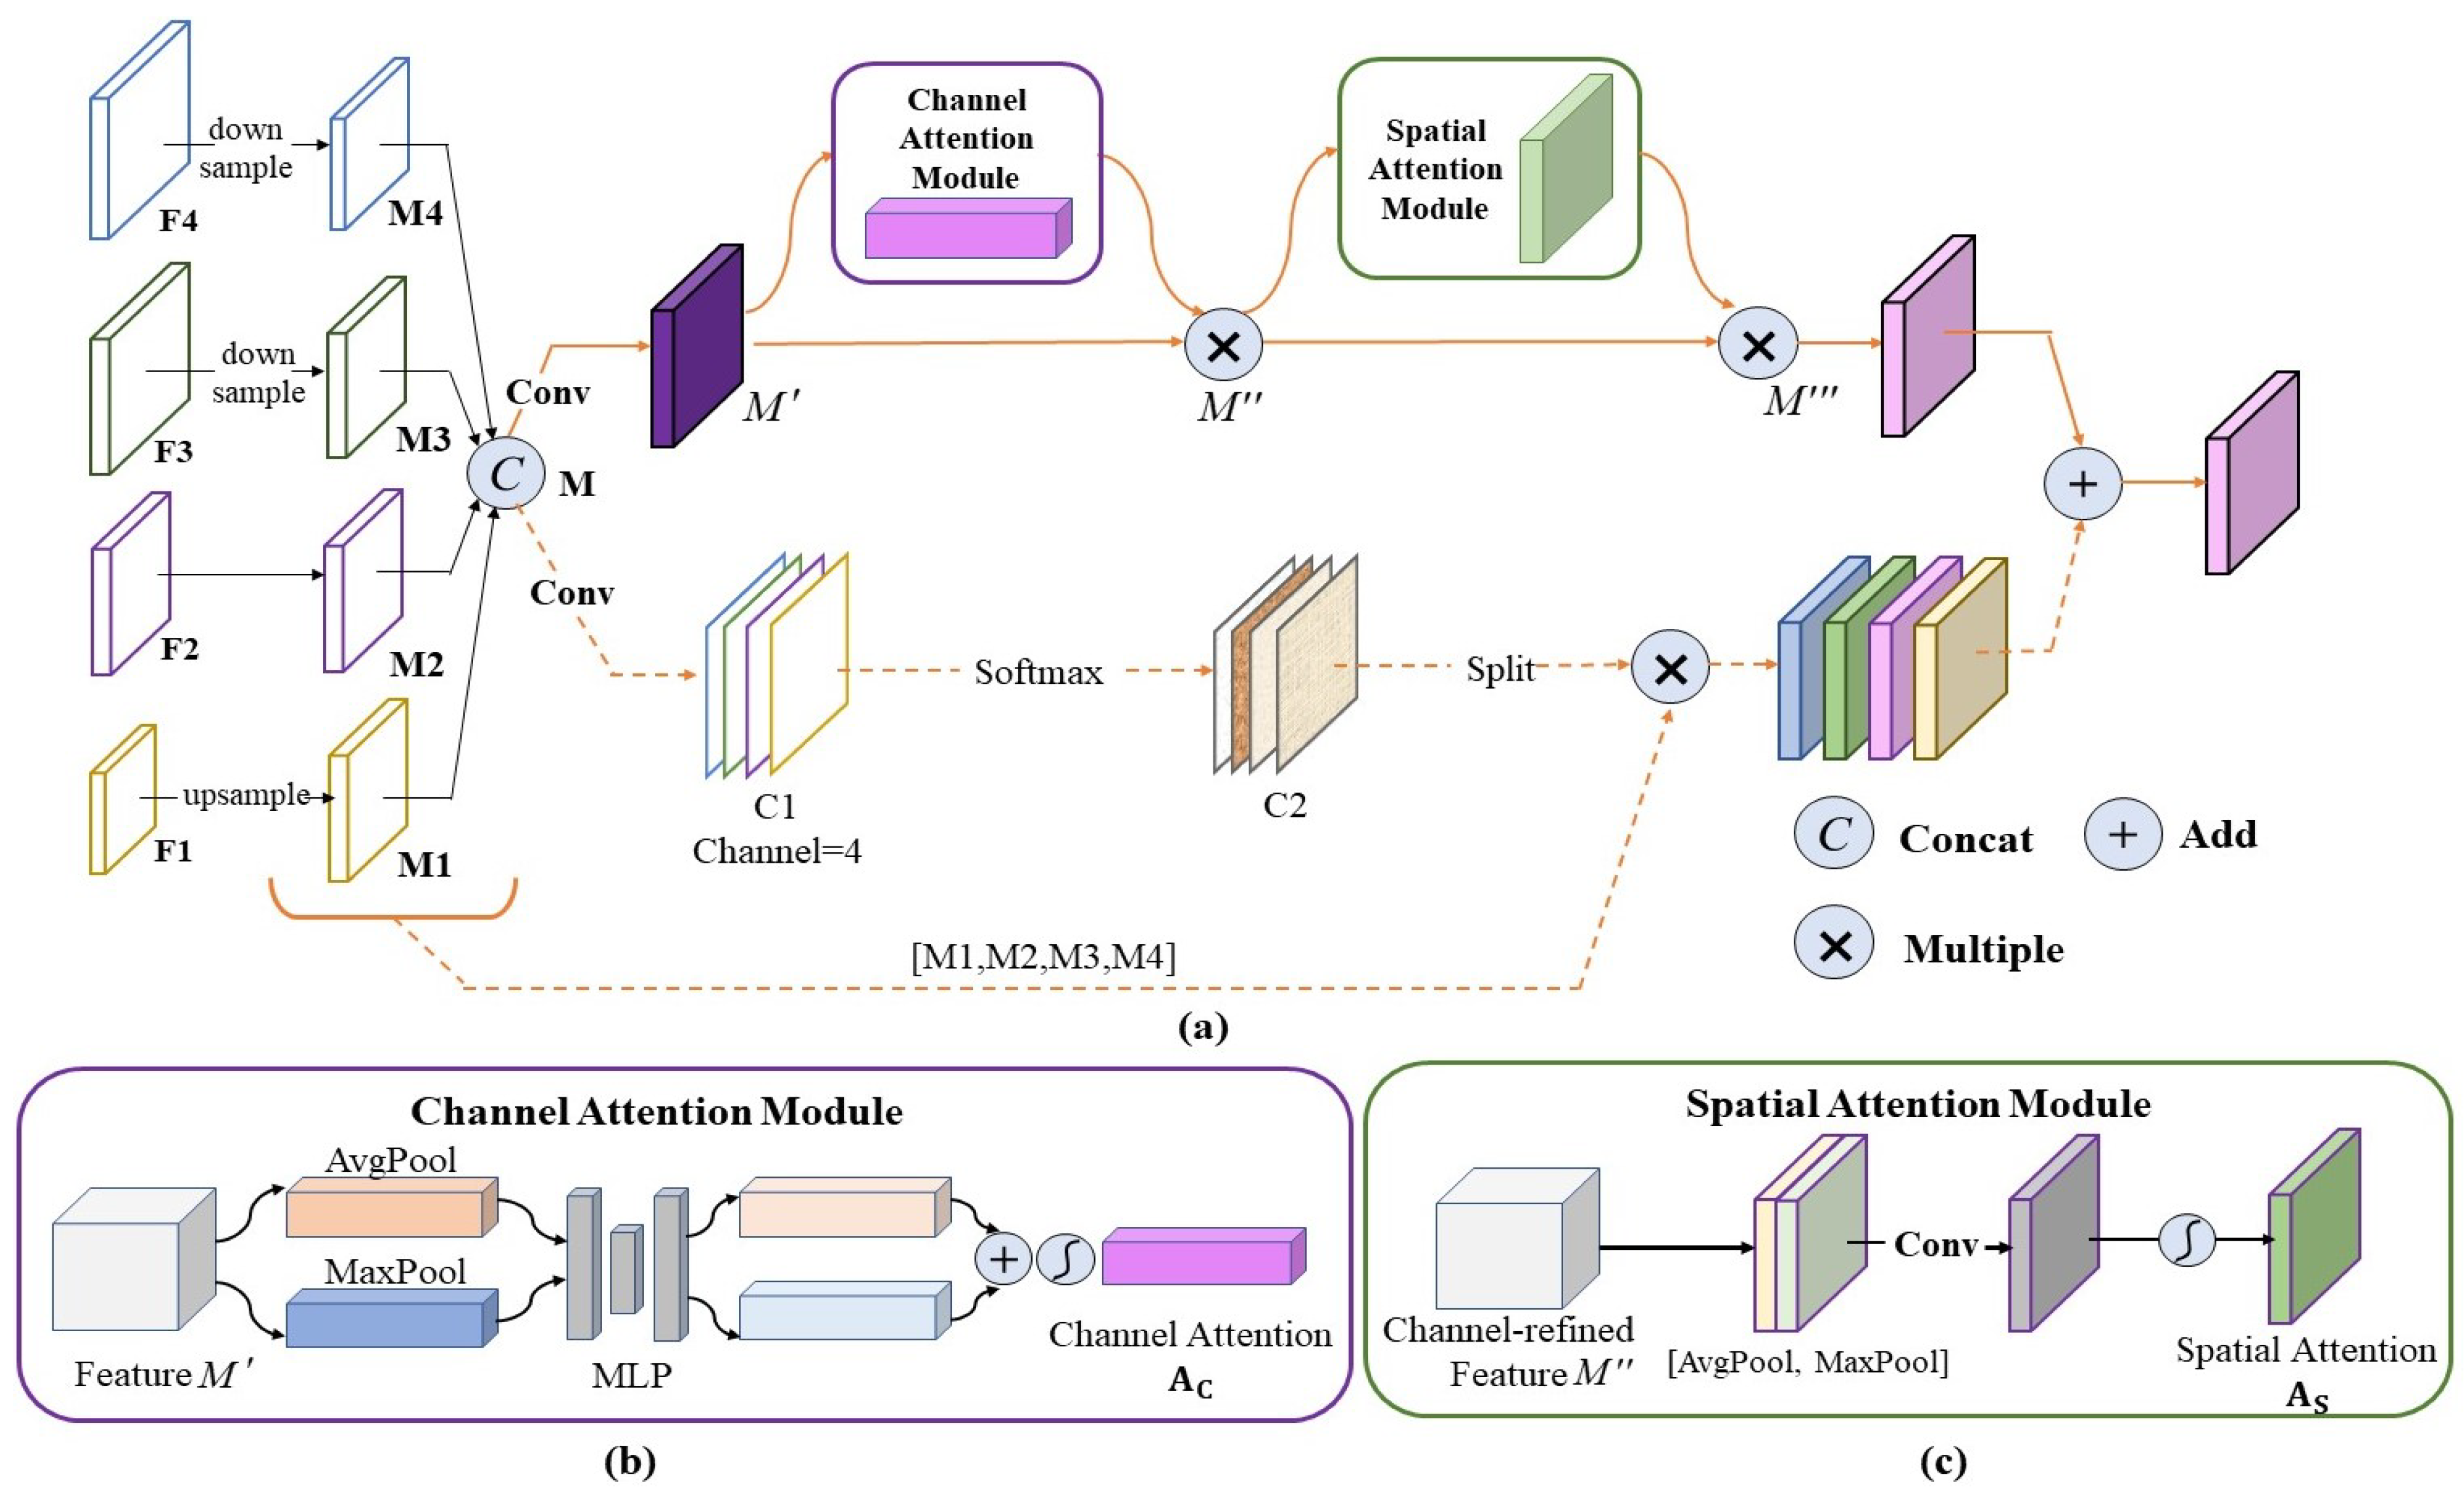
The overall structure of FRM, as shown in Figure 5, is mainly composed of two parallel branches: the convolutional block attention module (CBAM) [45] and the spatial purification module. They are used to generate adaptive weights in spatial and channel dimensions, guiding features to learn toward the more crucial directions.

3.4.1. Convolutional Block Attention Module

The structure of CBAM is shown in Figure 5b,c. F m is defined as the input of m th (m = {1, 2, 3, 4}) layer. F ( m , n ) is defined as the transformation of features from the m th layer to n th layer. The output of the upper branch is:
M = C o n c a t ( F ( 1 , m ) , F ( 2 , m ) , F ( 3 , m ) , F ( 4 , m ) ) M = A c ( C o n v ( M ) ) M ' M = A s ( M ) M
We transform features of {F1, F2, F3, F4} into specified sizes and concatenate them into M. Then, we obtain designated channels of features M through convolution operation. In Equation (2), denotes element-wise multiplication. Considering an intermediate feature map M C × H × W as input, CBAM sequentially derives a 1D channel attention map A C C × 1 × 1 and a 2D spatial attention map A S 1 × H × W . M is the final output via the channel attention and spatial attention module.
As shown in Figure 5b, the feature map M first goes through the channel attention module. The spatial information of the feature map is aggregated by average pooling and max pooling in channel dimension, generating two distinct context indicators: M ' Avg and M ' M a x , representing the average and max features, respectively. Then, two indicators would be sent to a multi-layer perceptron (MLP), sharing with the common parameters to generate our channel attention map A C C × 1 × 1 . To shrink the volume of the network, the hidden dimension of MLP is set to C/r, where r is the reduction ratio. After applying shared MLP to each indicator, we merge the output feature vectors with element-wise multiplication. The computational process of channel attention can be concluded as follows:
A C ( M ) = σ ( M L P ( A v g P o o l ( M ) ) + M L P ( M a x P o o l ( M ) ) )
where σ denotes the sigmoid function.
As shown in Figure 5c, the intermediate feature map M then goes through the spatial attention module, focusing on the global spatial information, which is a supplement to the channel module. To calculate spatial attention, we sequentially perform average pooling and max pooling along the channel axis to develop two 2D maps: M Avg 1 × H × W and M M a x 1 × H × W . Fusing in the channel axis can better attend to critical spatial information. Then, we concatenate them into a whole to form an informative descriptor. Finally, a convolutional layer and sigmoid operation are employed to generate a spatial attention map A S R H × W , which highlights the key pixels and suppresses the distracting features. The spatial attention can be concluded as follows:
A S ( M ) = σ ( f 3 × 3 ( [ M a x P o o l ( M ) ; A v g P o o l ( M " ) ] ) )
where σ denotes the sigmoid function and f 3 × 3 refers to a convolutional operation with the size of 3 × 3 .

3.4.2. Spatial Purification Module

The framework of spatial purification is displayed in Figure 5 in the bottom dashed line. A convolutional layer is applied to merge the features into 4 channels, generating relative weights for each position with respect to the channels through SoftMax operation. F q , x , y m is defined as the output of the m th feature map on the q th channel at the position of ( x , y ) . The definitions of other symbols are the same as those in the CBAM module. Furthermore, the output of the bottom branch can be concluded as the following Equation (5):
Ω x , y m = p = 1 4 q , x , y ( α p , x , y m F q , x , y ( 1 , m ) + β p , x , y m F q , x , y ( 2 , m ) + μ p , x , y m F q , x , y ( 3 , m ) + η p , x , y m F q , x , y ( 4 , m ) )
where q represents the q th channel of the input feature map and x, y represents the spatial position of the feature map. Ω x , y m represents the output feature vector at the position of ( x , y ) . { α p , x , y m , β p , x , y m , μ p , x , y m , η p , x , y m } represents spatial attention weights in relation to the m th layer and p represents the p th channel of them. { α , β , μ , η } can be calculated as Equation (6):
[ α m , β m , μ m , η m ] = Softmax ( C 1 4 )
where C 1 4 stands for the feature map with 4 channels after convolution on the feature map of the M, and SoftMax is utilized to normalize the feature map through the channel axis.
Therefore, the total output of the FRM module can be expressed as:
O m = M + [ Ω m ] m
where O m is the final output of FRM, M represents the output of CBAM, and [ Ω m ] m denotes the output of the spatial purification module, which selects the corresponding part of the m th layer. Accordingly, the features of semantic difference in FPN can be greatly fused to generate new adaptive weights.

3.5. g3Conv Prediction Head

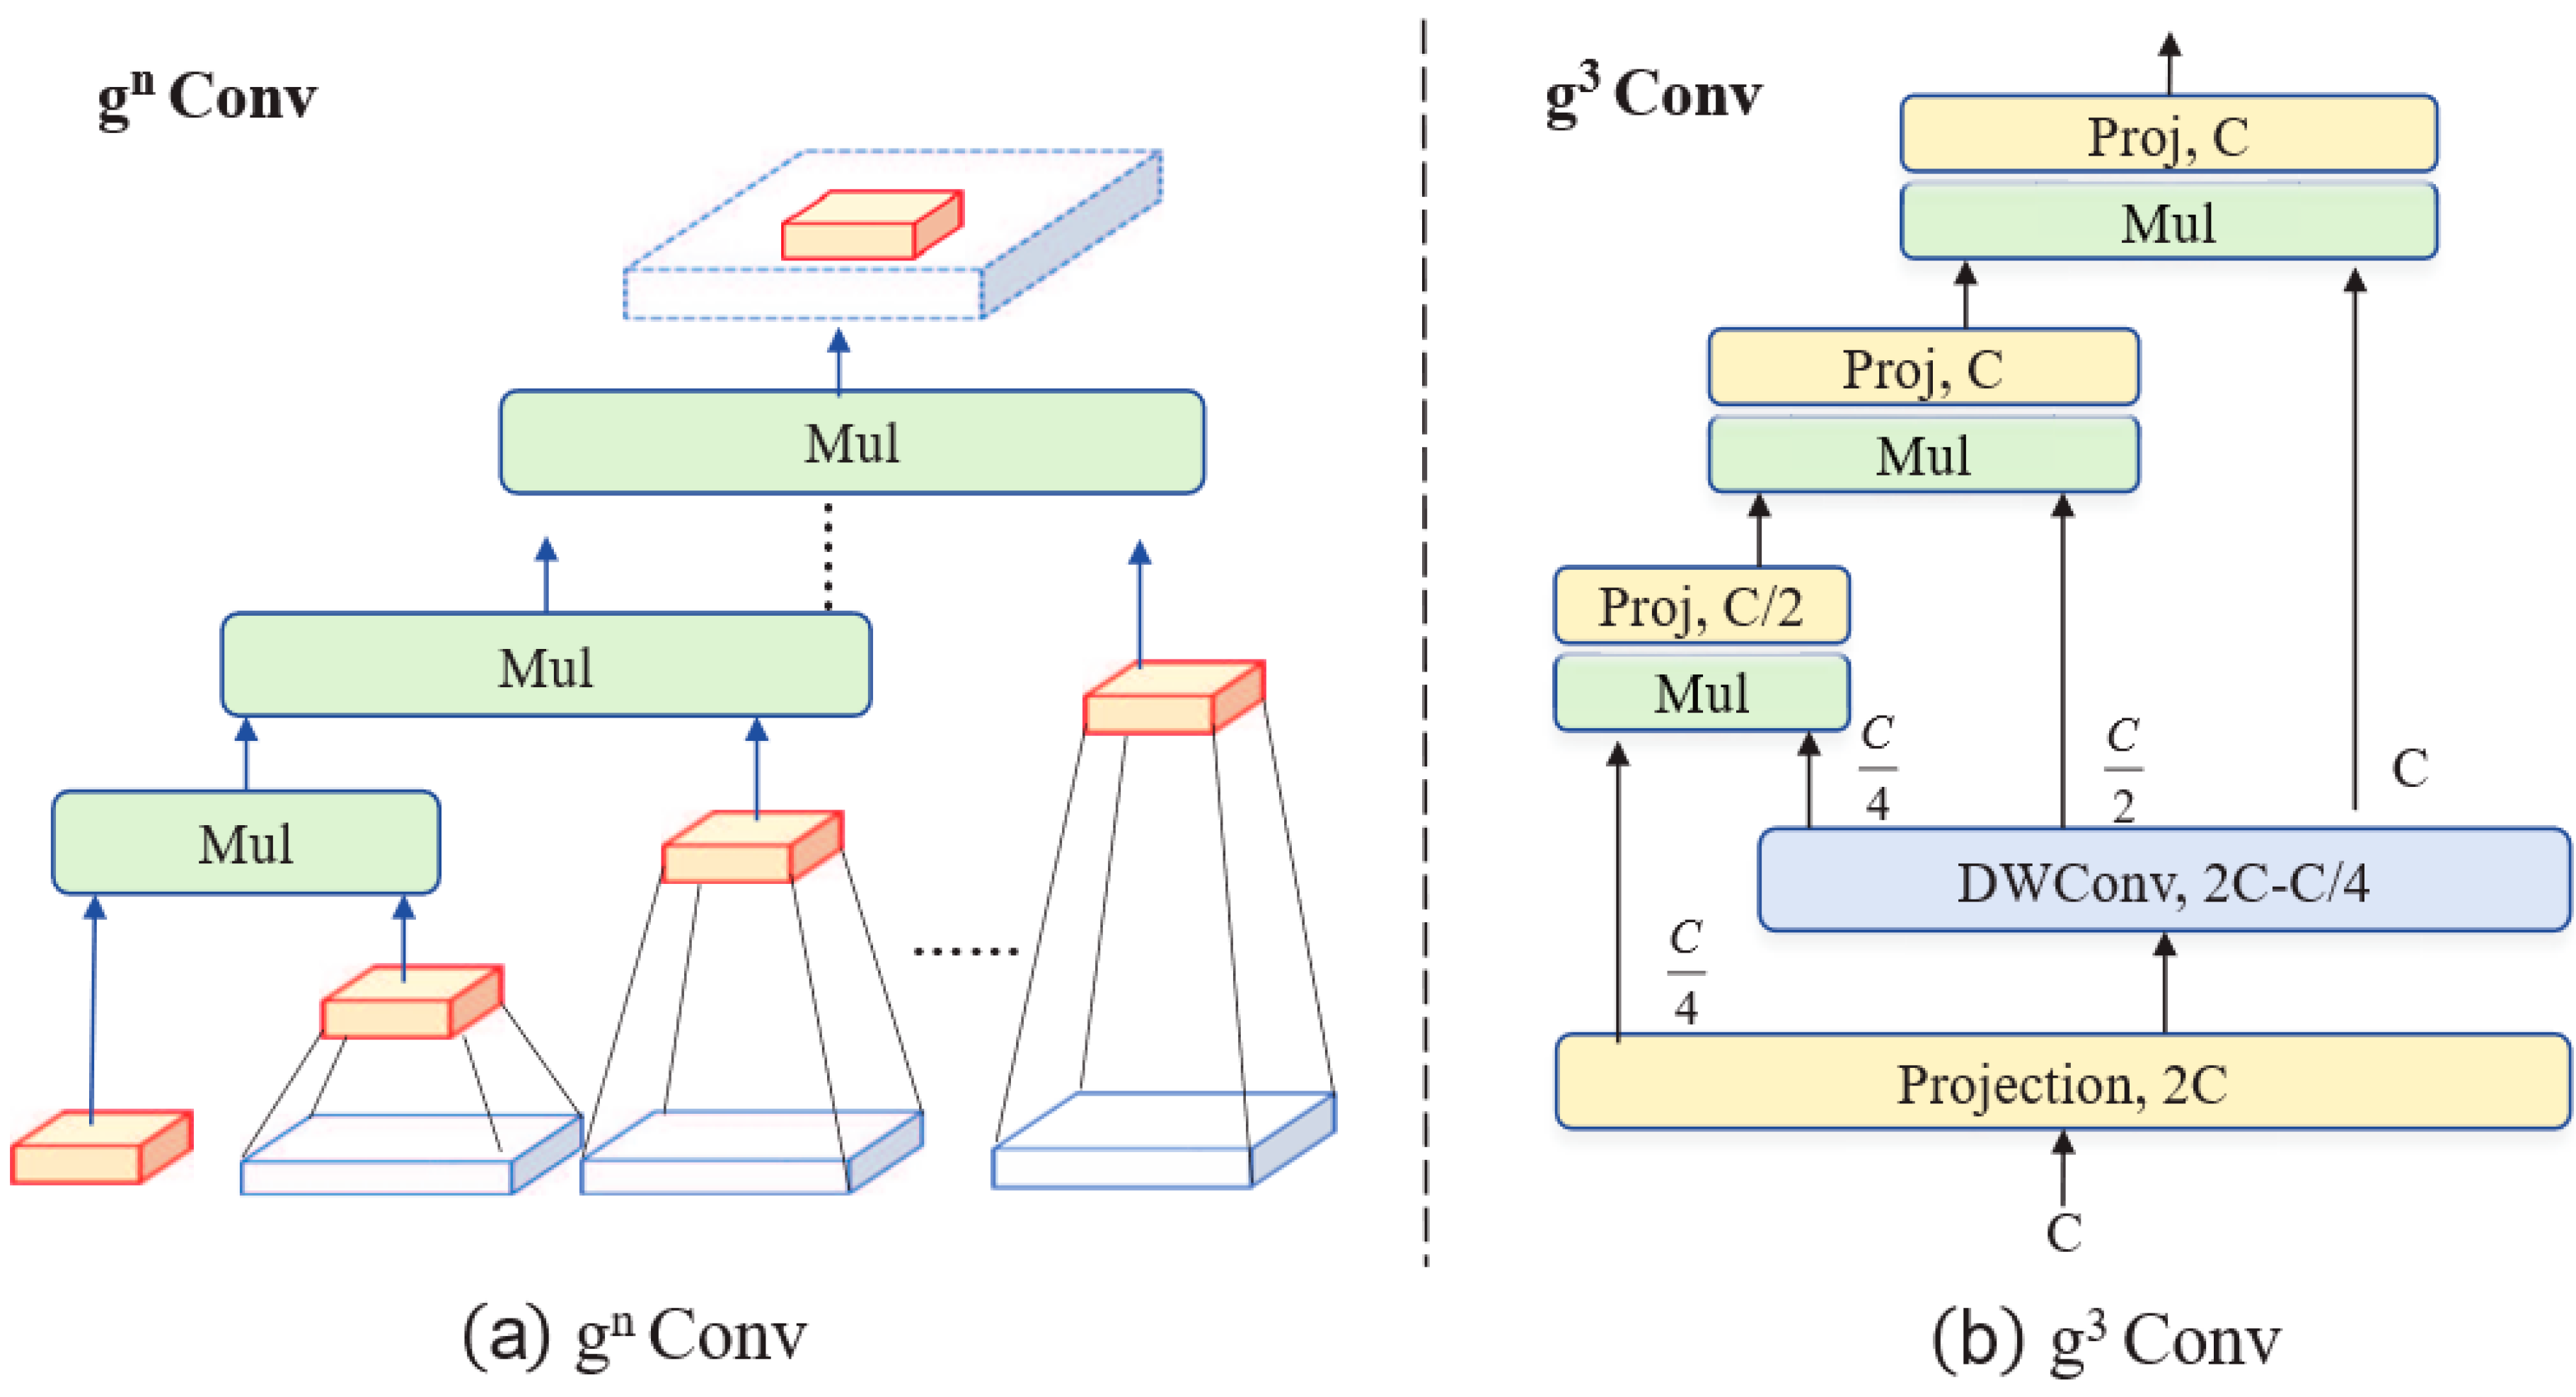
Before entering the localization and classification branches, we added a Recursive Gated Convolution (gnConv) in the detection head. The gnConv, which executes spatial interactions in higher order with recursive structure, gated convolutions, and matrix multiplication operations, is introduced. Inspired by Vision Transformer [28], g3Conv is designed to spatially model with input-adaptive, long-range, and high-order spatial interactions. It has two main advantages. (1) Efficient. The convolution-based method eliminates the quadratic complexity associated with self-attention. Gradually increasing the width during the spatial interaction process is a benefit for achieving high-order spatial interactions with bounded complexity. (2) Extendable. We extend the second-order interactions in self-attention to arbitrary orders, further enhancing modeling capabilities without extra computational load.
The gnConv mainly consists of standard convolution, element-wise multiplication, and linear projection. As shown in Figure 6, to achieve the function of long-term interactions and input-adaptive spatial mixing, we choose a 7 × 7 convolution instead of 3 × 3 and implement two depth-wise convolutions. In this study, we set n = 3 of g3Conv. We divide 2C channels into c 4 , c 2 , c and perform multiplication operations through recursive gates sequentially.

4. Experiment and Results

4.1. Datasets and Evaluation Metric

To analyze the comprehensive effectiveness of our proposed method, we apply it to the public datasets SSDD [34] and SAR-Ship-Dataset [35]. These datasets contain diverse scenarios and ships with different scales, including complex inshore scenarios and offshore environments affected by strong clutter interference, ponds, and lands. The datasets are essential for designing detectors that can identify multiscale and small SAR ships. The SAR-Ship-Dataset labeled by the Wang Chao team is primarily based on high-resolution Sentinel-1 and Gaofen-3 data, totally consisting of 108 scenes of Sentinel-1 images and 102 scenes of Gaofen-3 images. It contains 43,819 ship slices of 256 × 256 pixels. The dataset is randomly split into training, validation, and test sets in a ratio of 7:2:1. The SSDD consists of 1160 images with roughly 500 × 500 pixels. The data mainly includes TerraSAR-X, RadarSat-2, and Sentinel-1 sensors, encompassing four polarization modes: HH, HV, VV, and VH. The resolution ranges from 1 m to 15 m, and the dataset covers large maritime areas as well as coastal regions with ship targets.
To assess the effectiveness of various methods, we employ mAP0.5 and mAP0.5:0.95 as the primary evaluation metrics. The mAP is obtained by calculating the mean of AP values for different categories. In particular, AP is the area under the Precision–Recall curve at different confidence thresholds. Among them, 0.5:0.95 refers to the IOU (Intersection over union) thresholds ranging from 0.5 to 0.95. Additionally, Precision, Recall, and F1 are used as auxiliary evaluation metrics, where the confidence score threshold is set at 0.001. We also consider inference time and model parameters. The formula is calculated as follows:
Precision = TP TP + FP
Recall = TP TP + FN
F 1 = 2 × Precision × Recall Precision + Recall
AP = 0 1 P ( R ) dR
mAP = 1 k i = 1 k A P i
where TP, FP, and FN refer to true positive, false positive, and false negative, respectively, and k represents the total number of classes.

4.2. Experiment Settings

The experiment is conducted on Ubuntu 18.04.5 system with PyTorch 1.8.2, CUDA 11.7, CUDNN 8.6.0, and GeForce RTX 3090 GPU. Performance comparison experiments based on popular detection models are implemented on both SAR-Ship-Dataset and SSDD, and the ablation experiments are implemented on SAR-Ship-Dataset. In the training process, the pre-trained weights are used, and we set the epochs as 300. In addition, we adopt the SGD [46] optimizer with a momentum of 0.937 and a weight decay of 0.0005. We set the batch size to 16 and set the learning rate to 0.01 initially. Moreover, the overall loss consists of classification loss, localization loss, and confidence loss, where the CIOU loss is applied for localization and confidence, and the BCEWithLogits loss is applied for classification. The size of input images fed into the network is fixed to 640 × 640.

4.3. Comparison with the Mainstream Methods

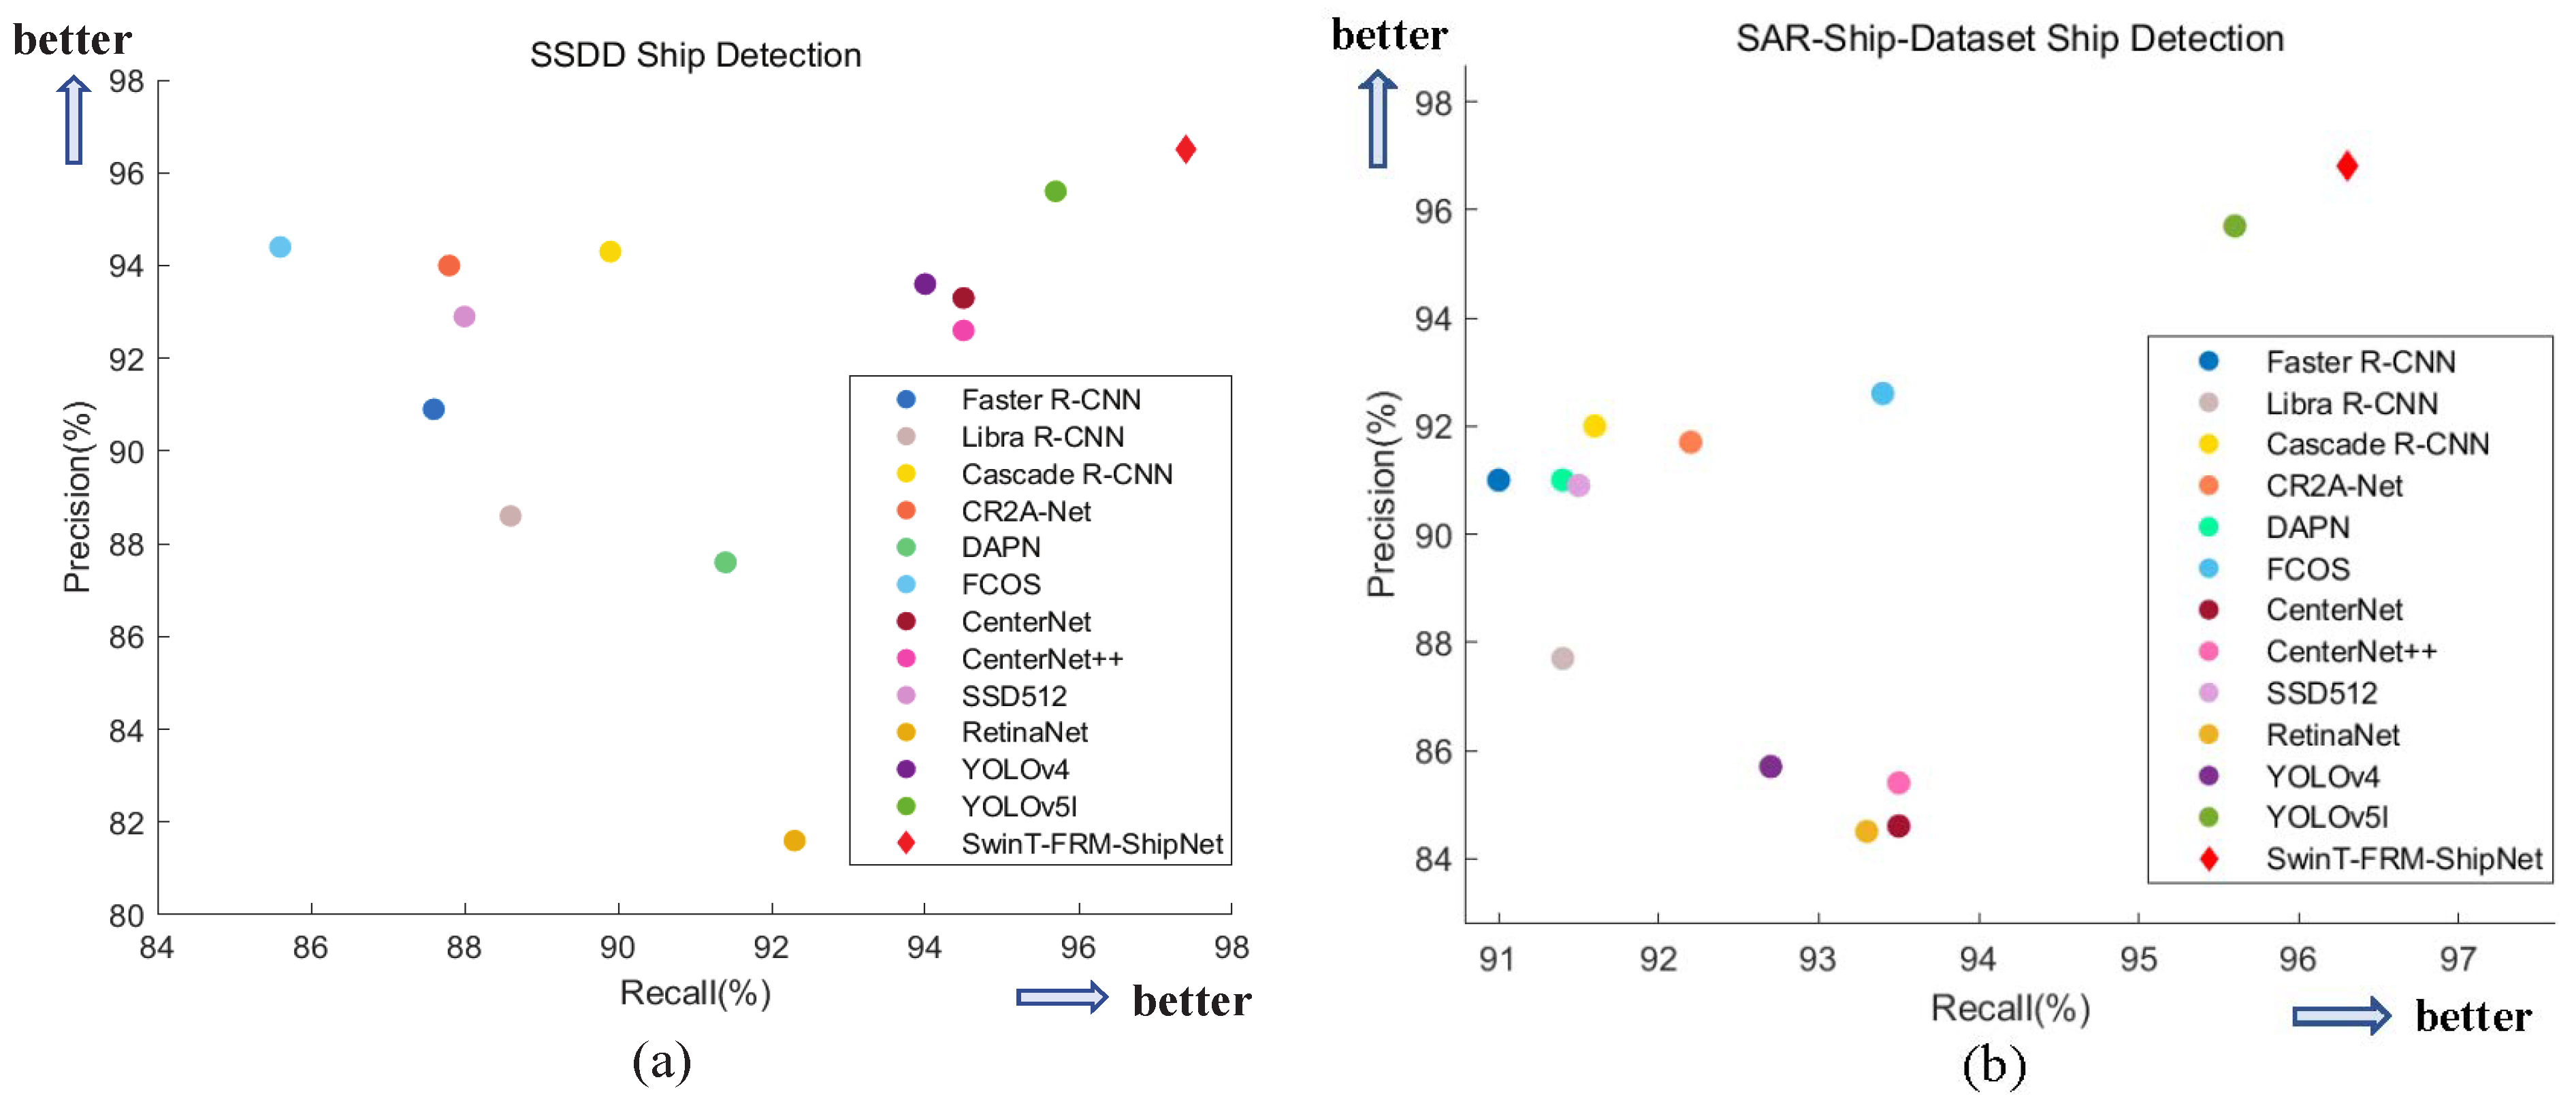
In this section, to validate the effectiveness and generalization of our proposed method, we compare it with mainstream methods, including one-stage, R-CNN-based, two-stage or multistage, and anchor-free algorithms on the datasets of SSDD and SAR-Ship-Dataset. As shown in Table 1 and Table 2, while achieving real-time detection, our method surpasses other comparative methods in terms of detection performance, reaching the advanced level. We also draw the scatter plot in Figure 7 to intuitively illustrate the detection performance of Precision and Recall with different algorithms. A detailed analysis of the experimental outcomes is provided below.

4.3.1. Experiments Based on the SSDD

The results on SSDD in Table 1 show that our proposed method is competitive, benefiting from Swin-T-YOLOv5l, IEM, FRM, and GCPH modules. The integrated feature extractor Swin-T-YOLOv5l enlarges the receptive fields, preserving local features while capturing global dependencies. In addition, to alleviate multiscale challenges, especially small-ship detection, the IEM module is introduced to enrich contextual information for feature enhancement, and the FRM module introduces feature refinement mechanisms to prevent small targets from being overwhelmed by conflicting semantic information. Additionally, GCPH provides spatial information interactions in high order. Our proposed method surpasses other methods, achieving enhancements on mAP0.5 of 9.8%, 8.2%, 8.6%, 9.4%, 4.6%, 4.1%, 8.5%, and 2% over Faster R-CNN, Libra R-CNN, Cascade R-CNN, FCOS, CenterNet, SSD512, RetinaNet, and YOLOv4 separately. Even compared with YOLOv5l, it still outperforms the F1 score (+1.1%) and mAP0.5 (+0.9%). Moreover, contrasted with refined and advanced ship-detection algorithms CR2A-Net, DAPN, and CenterNet++, the proposed method is also outstanding, which is 5.9%, 7.3%, and 3.1% higher on the F1 score and is 8.3%, 8.0%, and 5.4% higher on the mAP50 metric than above methods.

4.3.2. Experiments Based on the SAR-Ship-Dataset

This dataset has more abundant samples of data, and the background is more complicated, so it is effective for evaluating the feasibility of our proposed method. On the SAR-Ship-Dataset, one-stage methods have better performance, especially anchor-free algorithms. From Table 2, it can be observed that our proposed method could achieve a 96.5% F1 score and 98.2% mAP0.5, which outperforms other mainstream algorithms. Contrasted with traditional R-CNN-based algorithms, Faster R-CNN, Libra R-CNN, and Cascade R-CNN, the proposed method could improve approximately by 4.5–6.9% F1 score and 6–7% mAP0.5. For the regular one-stage methods, SSD512, RetinaNet, and YOLOv4, our proposed method could improve 5.3%, 7.8%, and 7.4% F1 scores and 4%, 4.4%, and 3.8% mAP0.5, respectively. Moreover, our method has 3.5%, 7.7% F1 score advantages, and 3.3%, 3.2% mAP0.5 advantages over anchor-free FCOS and CenterNet. In addition, compared with YOLOv5l, our method could exceed 0.9% F1 score and 1% mAP0.5. Additionally, even contrasted with refined and advanced ship-detection algorithms, our method is also 7.2%, 5.3%, and 4.6% higher on the F1 score and 3.3%, 6.3%, and 8.1% higher on the mAP0.5 than CenterNet++, DAPN, and CR2A-Net separately.

4.3.3. Discussion

Figure 7 depicts the performance metric distribution of different models across two datasets, where the x-axis refers to the Recall metric and the y-axis refers to the Precision metric. If the points are clustered closer to the upper-right corner of the graph, it indicates that the model achieves a more optimal balance between Recall and Precision. In Figure 7a,b, the point of the proposed method is located at the upper-right corner, meaning that the detection performance of our method is significantly superior to other state-of-the-art models.
In conclusion, our proposed method could achieve significant detection accuracy and demonstrate good robustness in different datasets. Although the inference time of our model is not as fast as some algorithms (YOLOv5l, SSD512, and CenterNet++), our method outperforms most algorithms and can achieve an inference time of approximately 22 s, which essentially satisfies the requirements of real-time detection.

4.4. Visual Results of Near-Shore and Offshore Areas

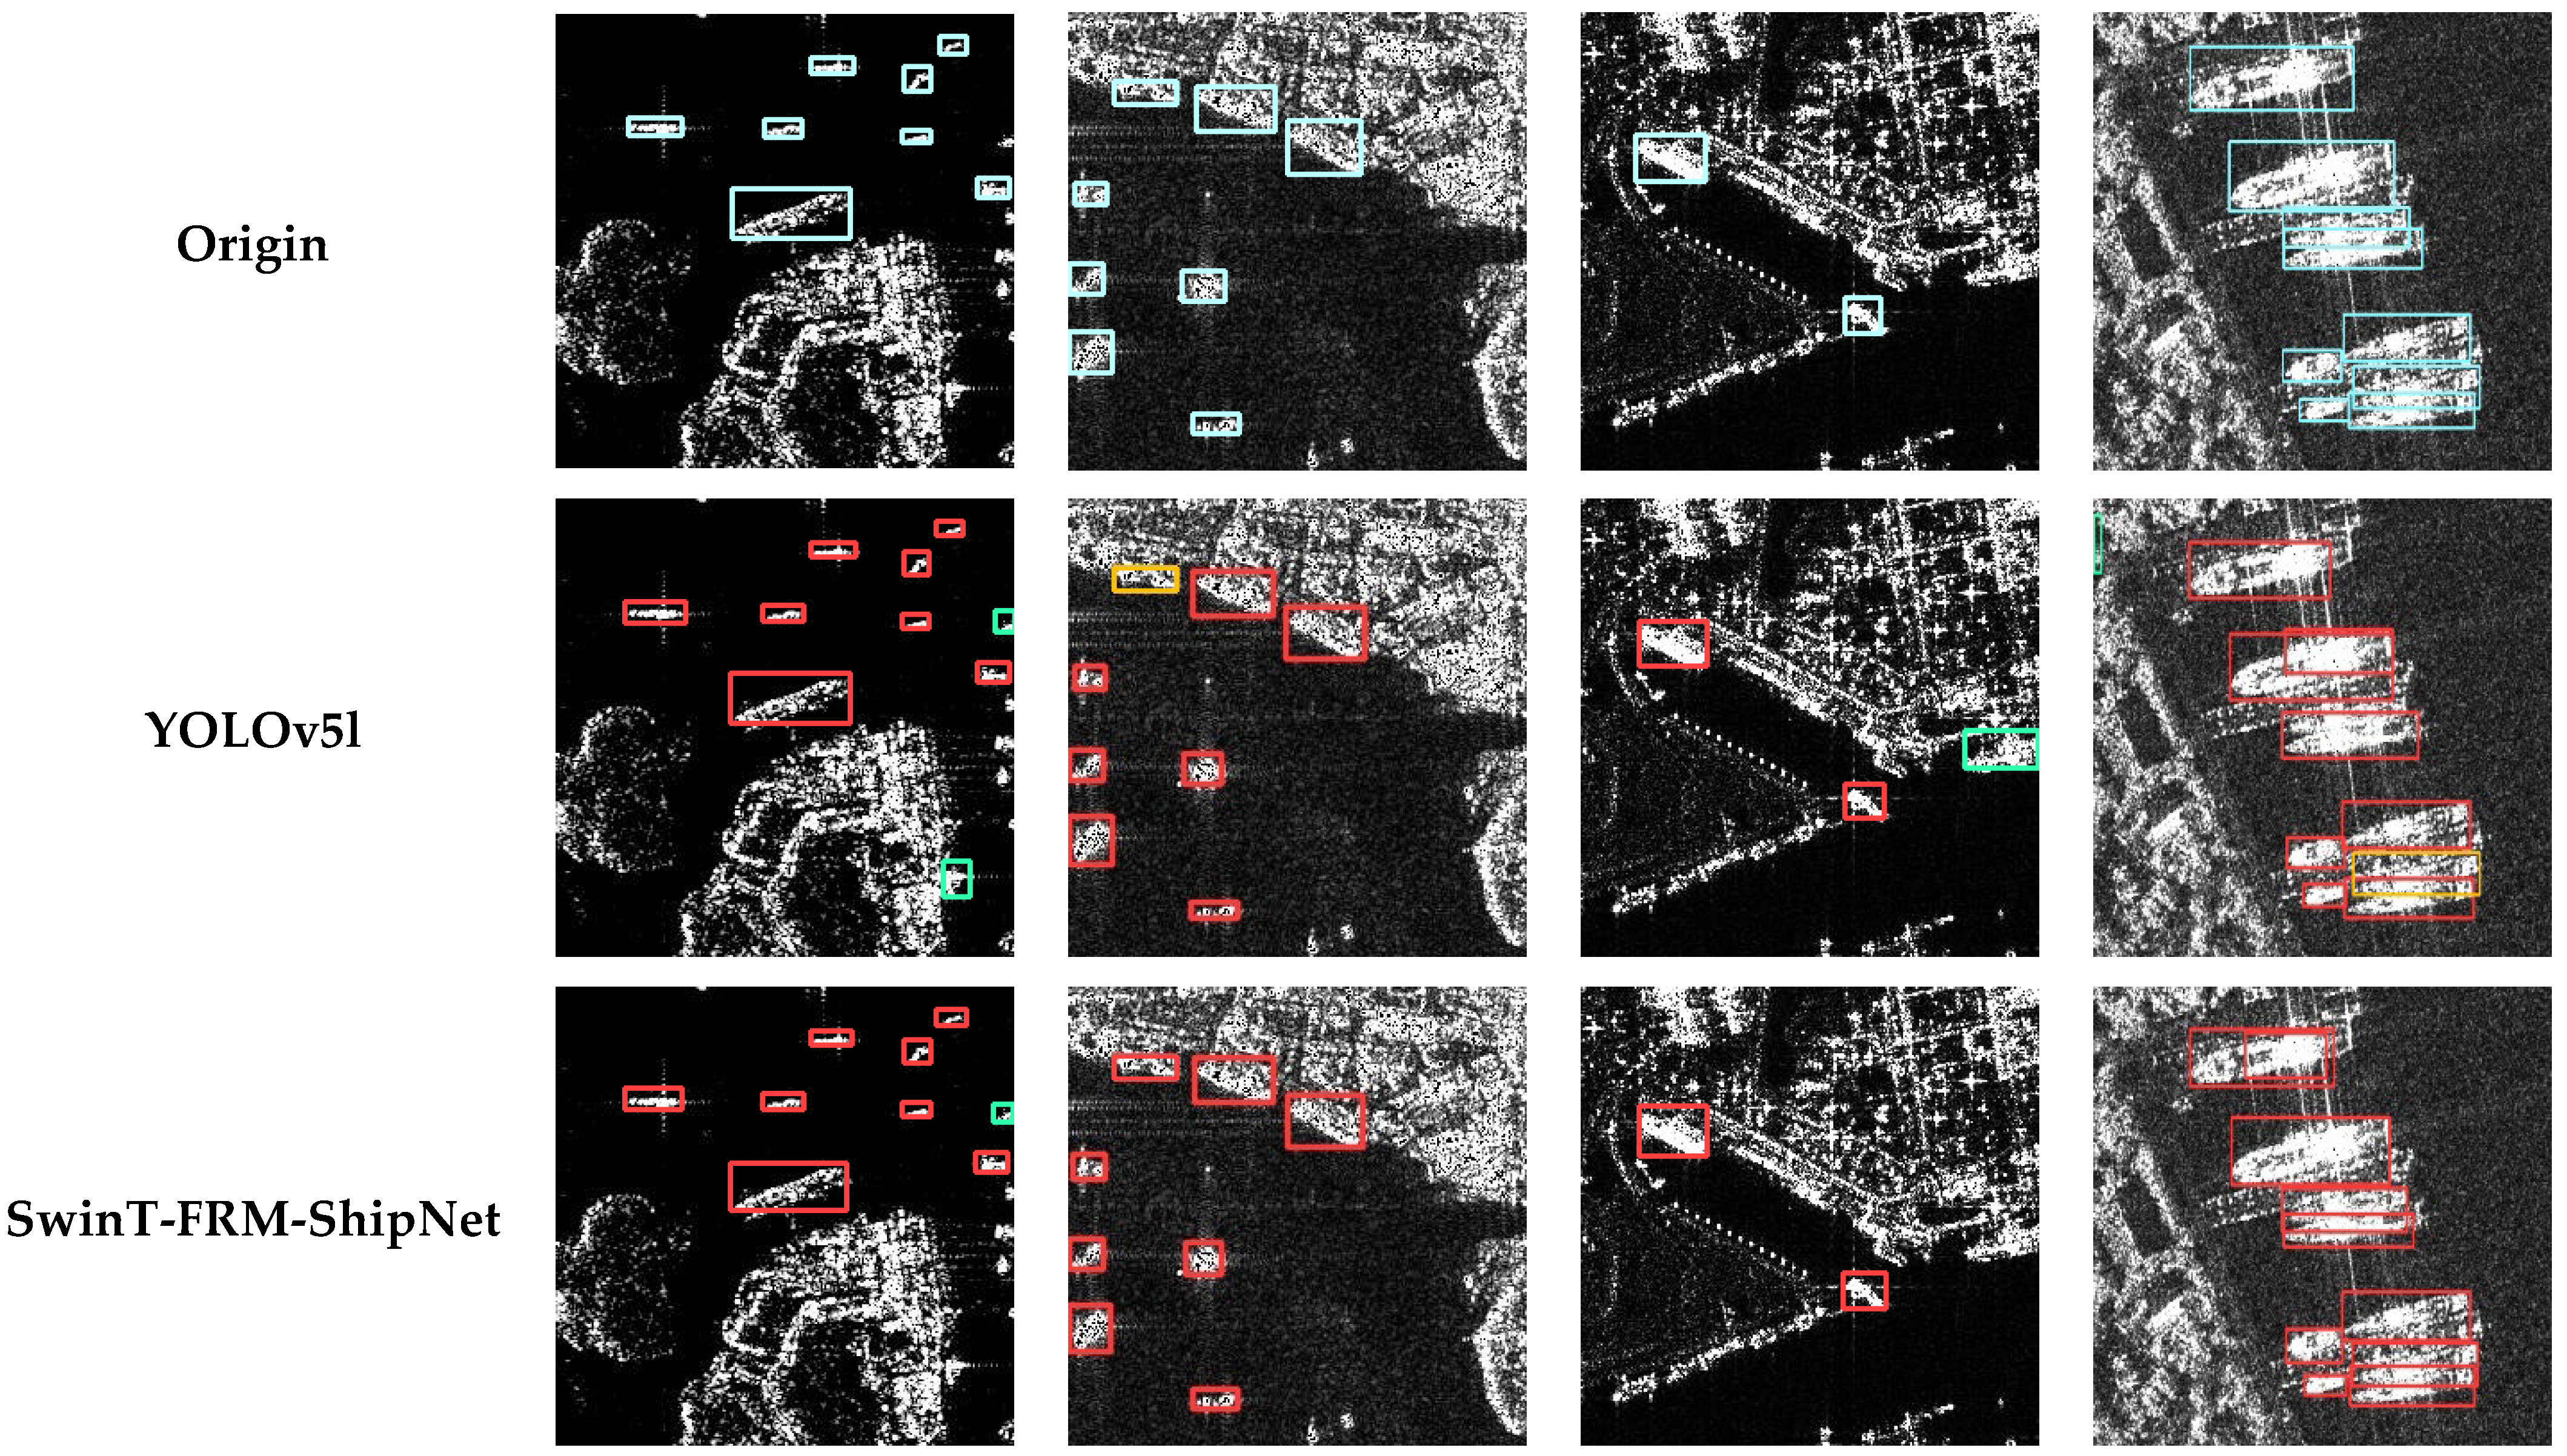
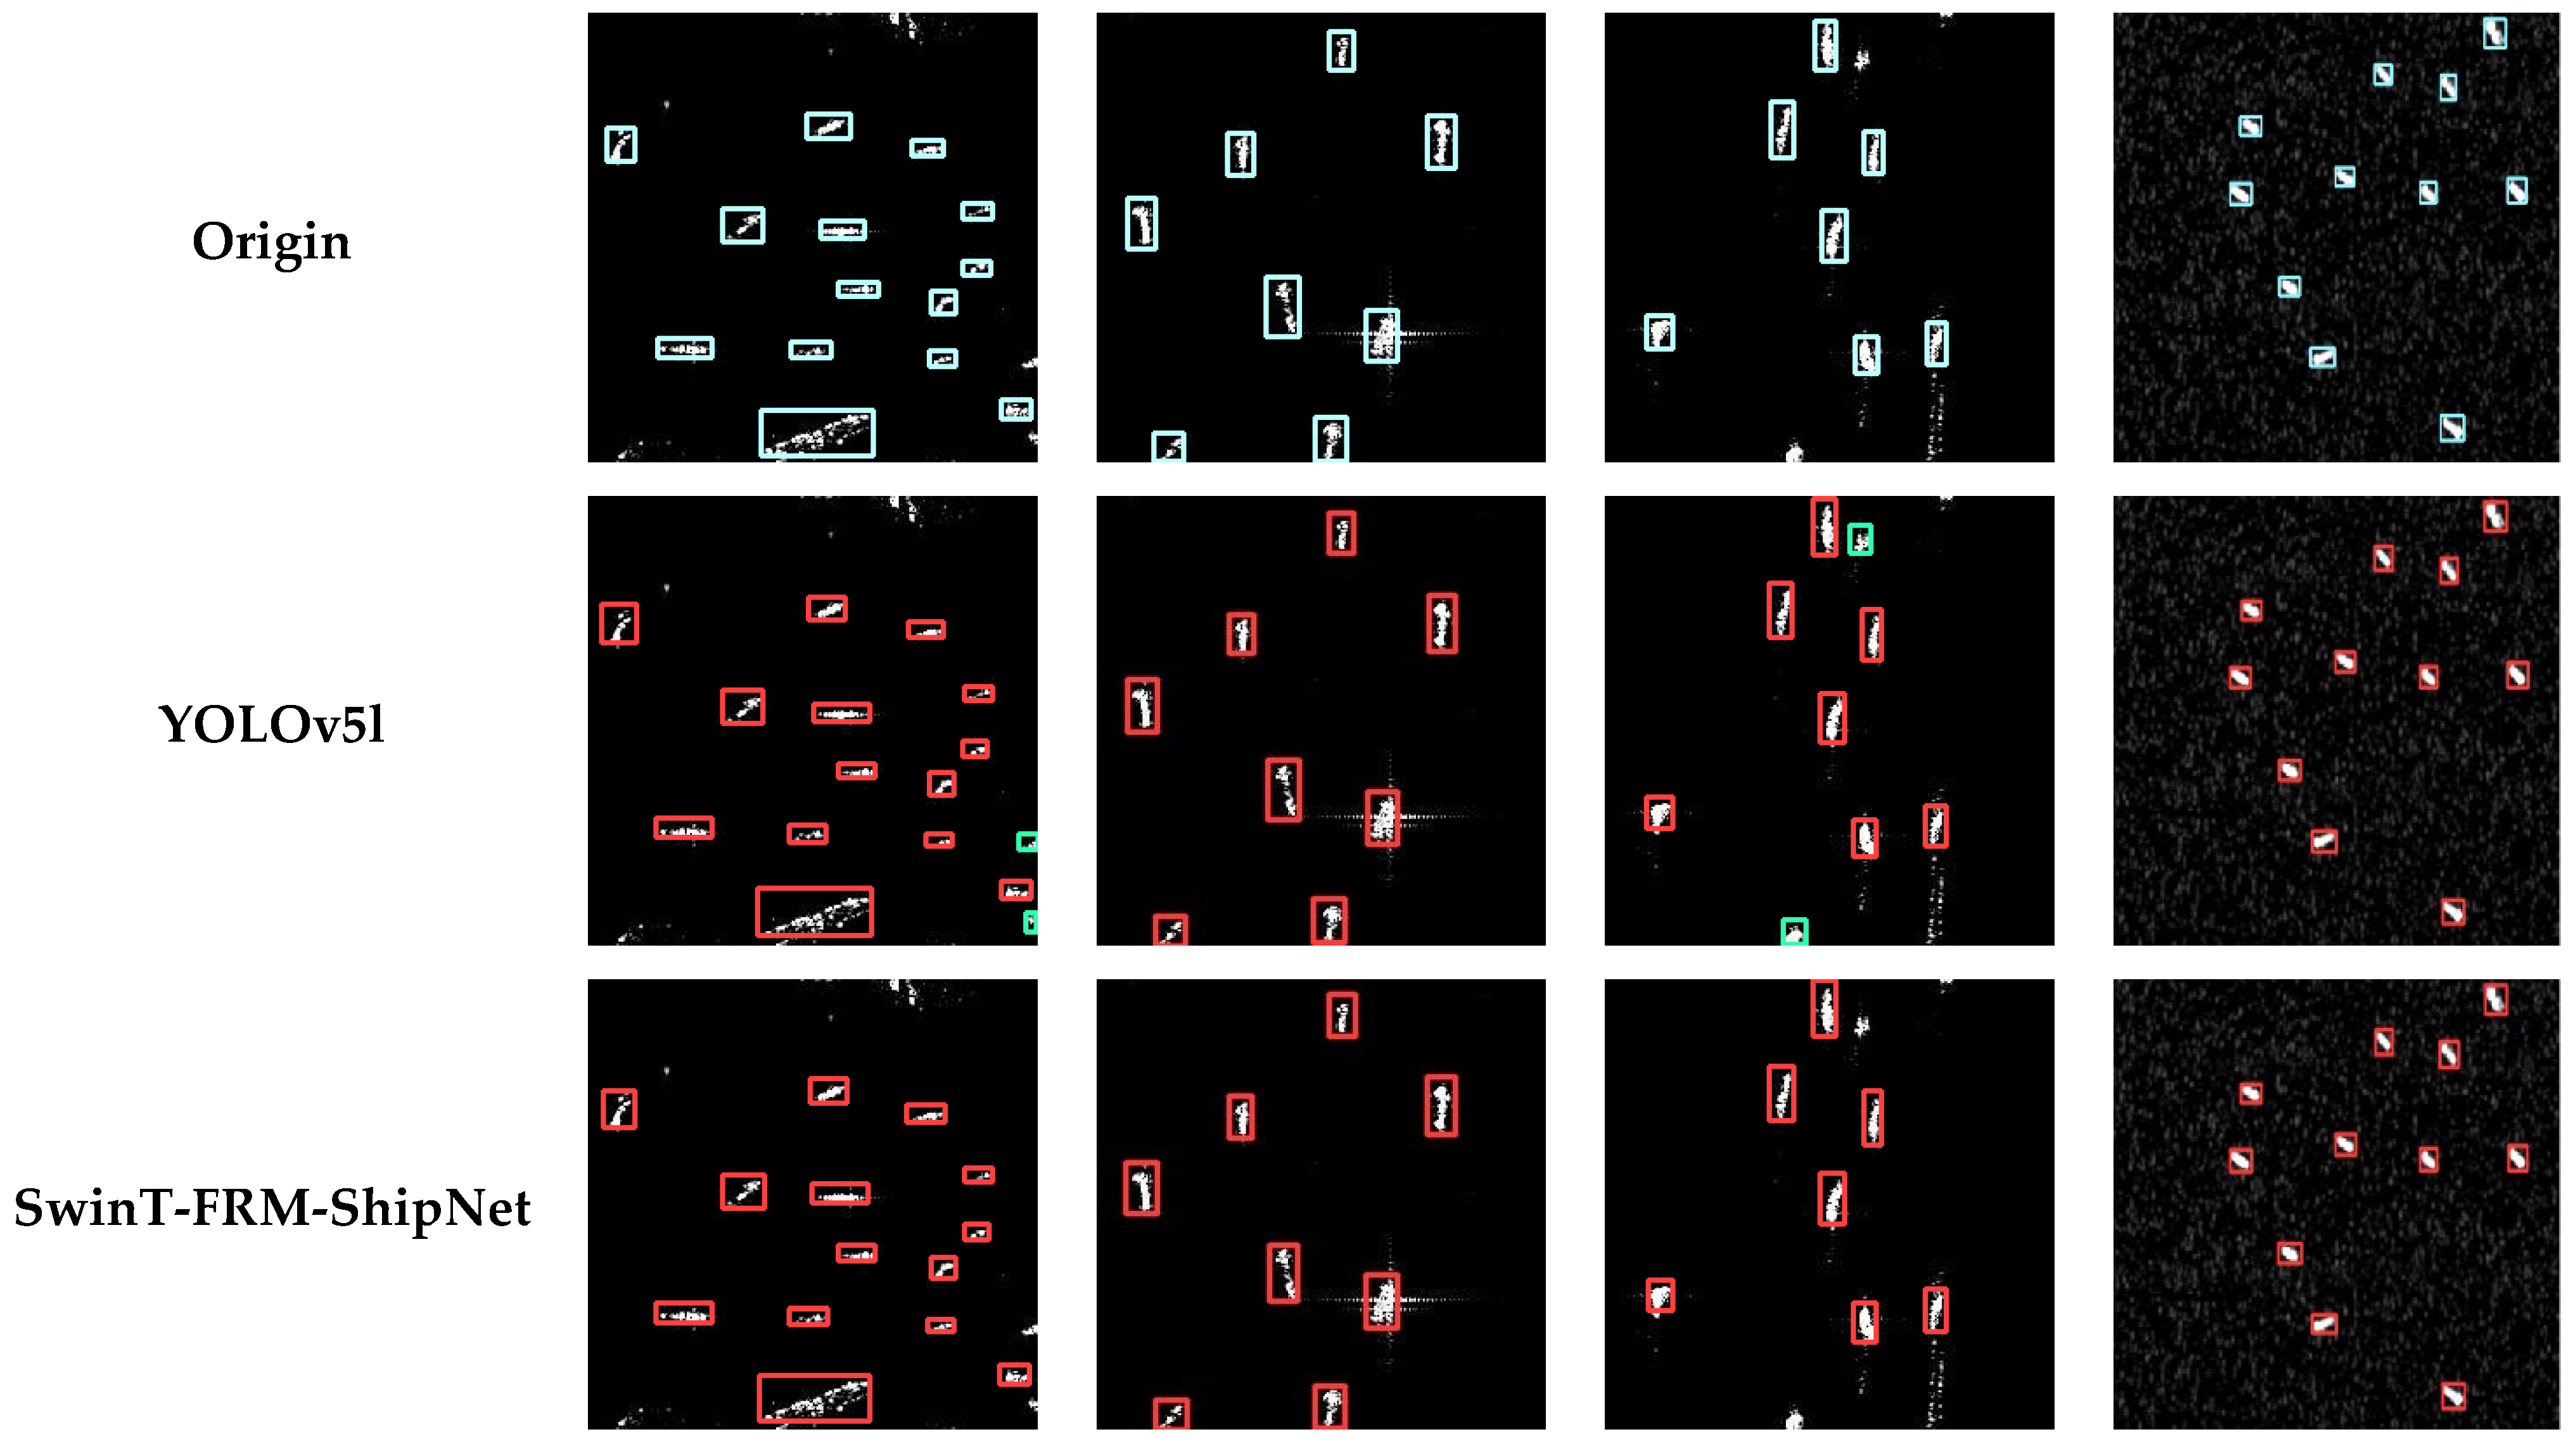
The detection results are visualized to intuitively illustrate the superiority of our algorithm. Figure 8 shows the visualization results in the intricate near-shore of small and medium-sized ships. Our method, SwinT-FRM-ShipNet, is superior to the high-performance YOLOv5l, alleviating the probabilities of missed detections and false alarms significantly. With the help of Swin Transformer, IEM, FRM, and GCPH, small ships could be located accurately under the disruption of complex environments, and multiscale detection could be improved to a great extent. Additionally, from the last set of images, it can be observed that our model is also friendly to overlapping and densely distributed ships. In Figure 9, the pictures are the results of multiscale and small-ship detection in the offshore areas. Despite the small sizes and dense distribution of ships, it can be observed that our method still obtains satisfactory detection performance. In conclusion, our method performs exceptionally well in the task of multiscale and small SAR ship detection under near-shore and offshore areas, especially in reducing the interference of complex environments.

4.5. Ablation Experiment

In this section, due to the complexity and diversity of the SAR-Ship-Dataset, we select it as the validation set for ablation experiments. The influence of each component is detailed in Table 3.

4.5.1. C2f and GCPH

We substitute the C3 module with the C2f module. Additionally, to solve the localization of small ships, we add a 160 × 160 detection head and introduce g3Conv detection head to perform spatial high-order interaction before predicting the results. The improvements increase by 0.4% F1 score, 0.6% mAP0.5, and 0.7% mAP0.5:0.95 than the baseline.

4.5.2. Swin-T-YOLOv5l

We incorporate Swin Transformer into the feature extractor of CNN to enlarge receptive fields, both capturing global and contextual information and retaining local features. Capturing long-distance dependencies is deductive to establish the relationship between small objects and overall context. Compared to C2f and GCPH, this model achieves more significant improvements in detection performance, which is 0.6%, 0.9%, and 2.1% higher than YOLOv5l in F1 score, mAP0.5, and mAP0.5:0.95, respectively.

4.5.3. IEFR-FPN

This structure is composed of IEM and FRM. IEM could obtain contextual information to enrich the information flow of FPN. FRM could alleviate multiscale semantic differences to prevent small targets from being overwhelmed by conflicting information. The performance of IEFR-FPN is comparable to Swin-T-YOLOv5l. It enhances 0.5% F1 score, 0.9% mAP0.5, and 2.3% mAP0.5:0.95.

4.5.4. SwinT-FRM-ShipNet

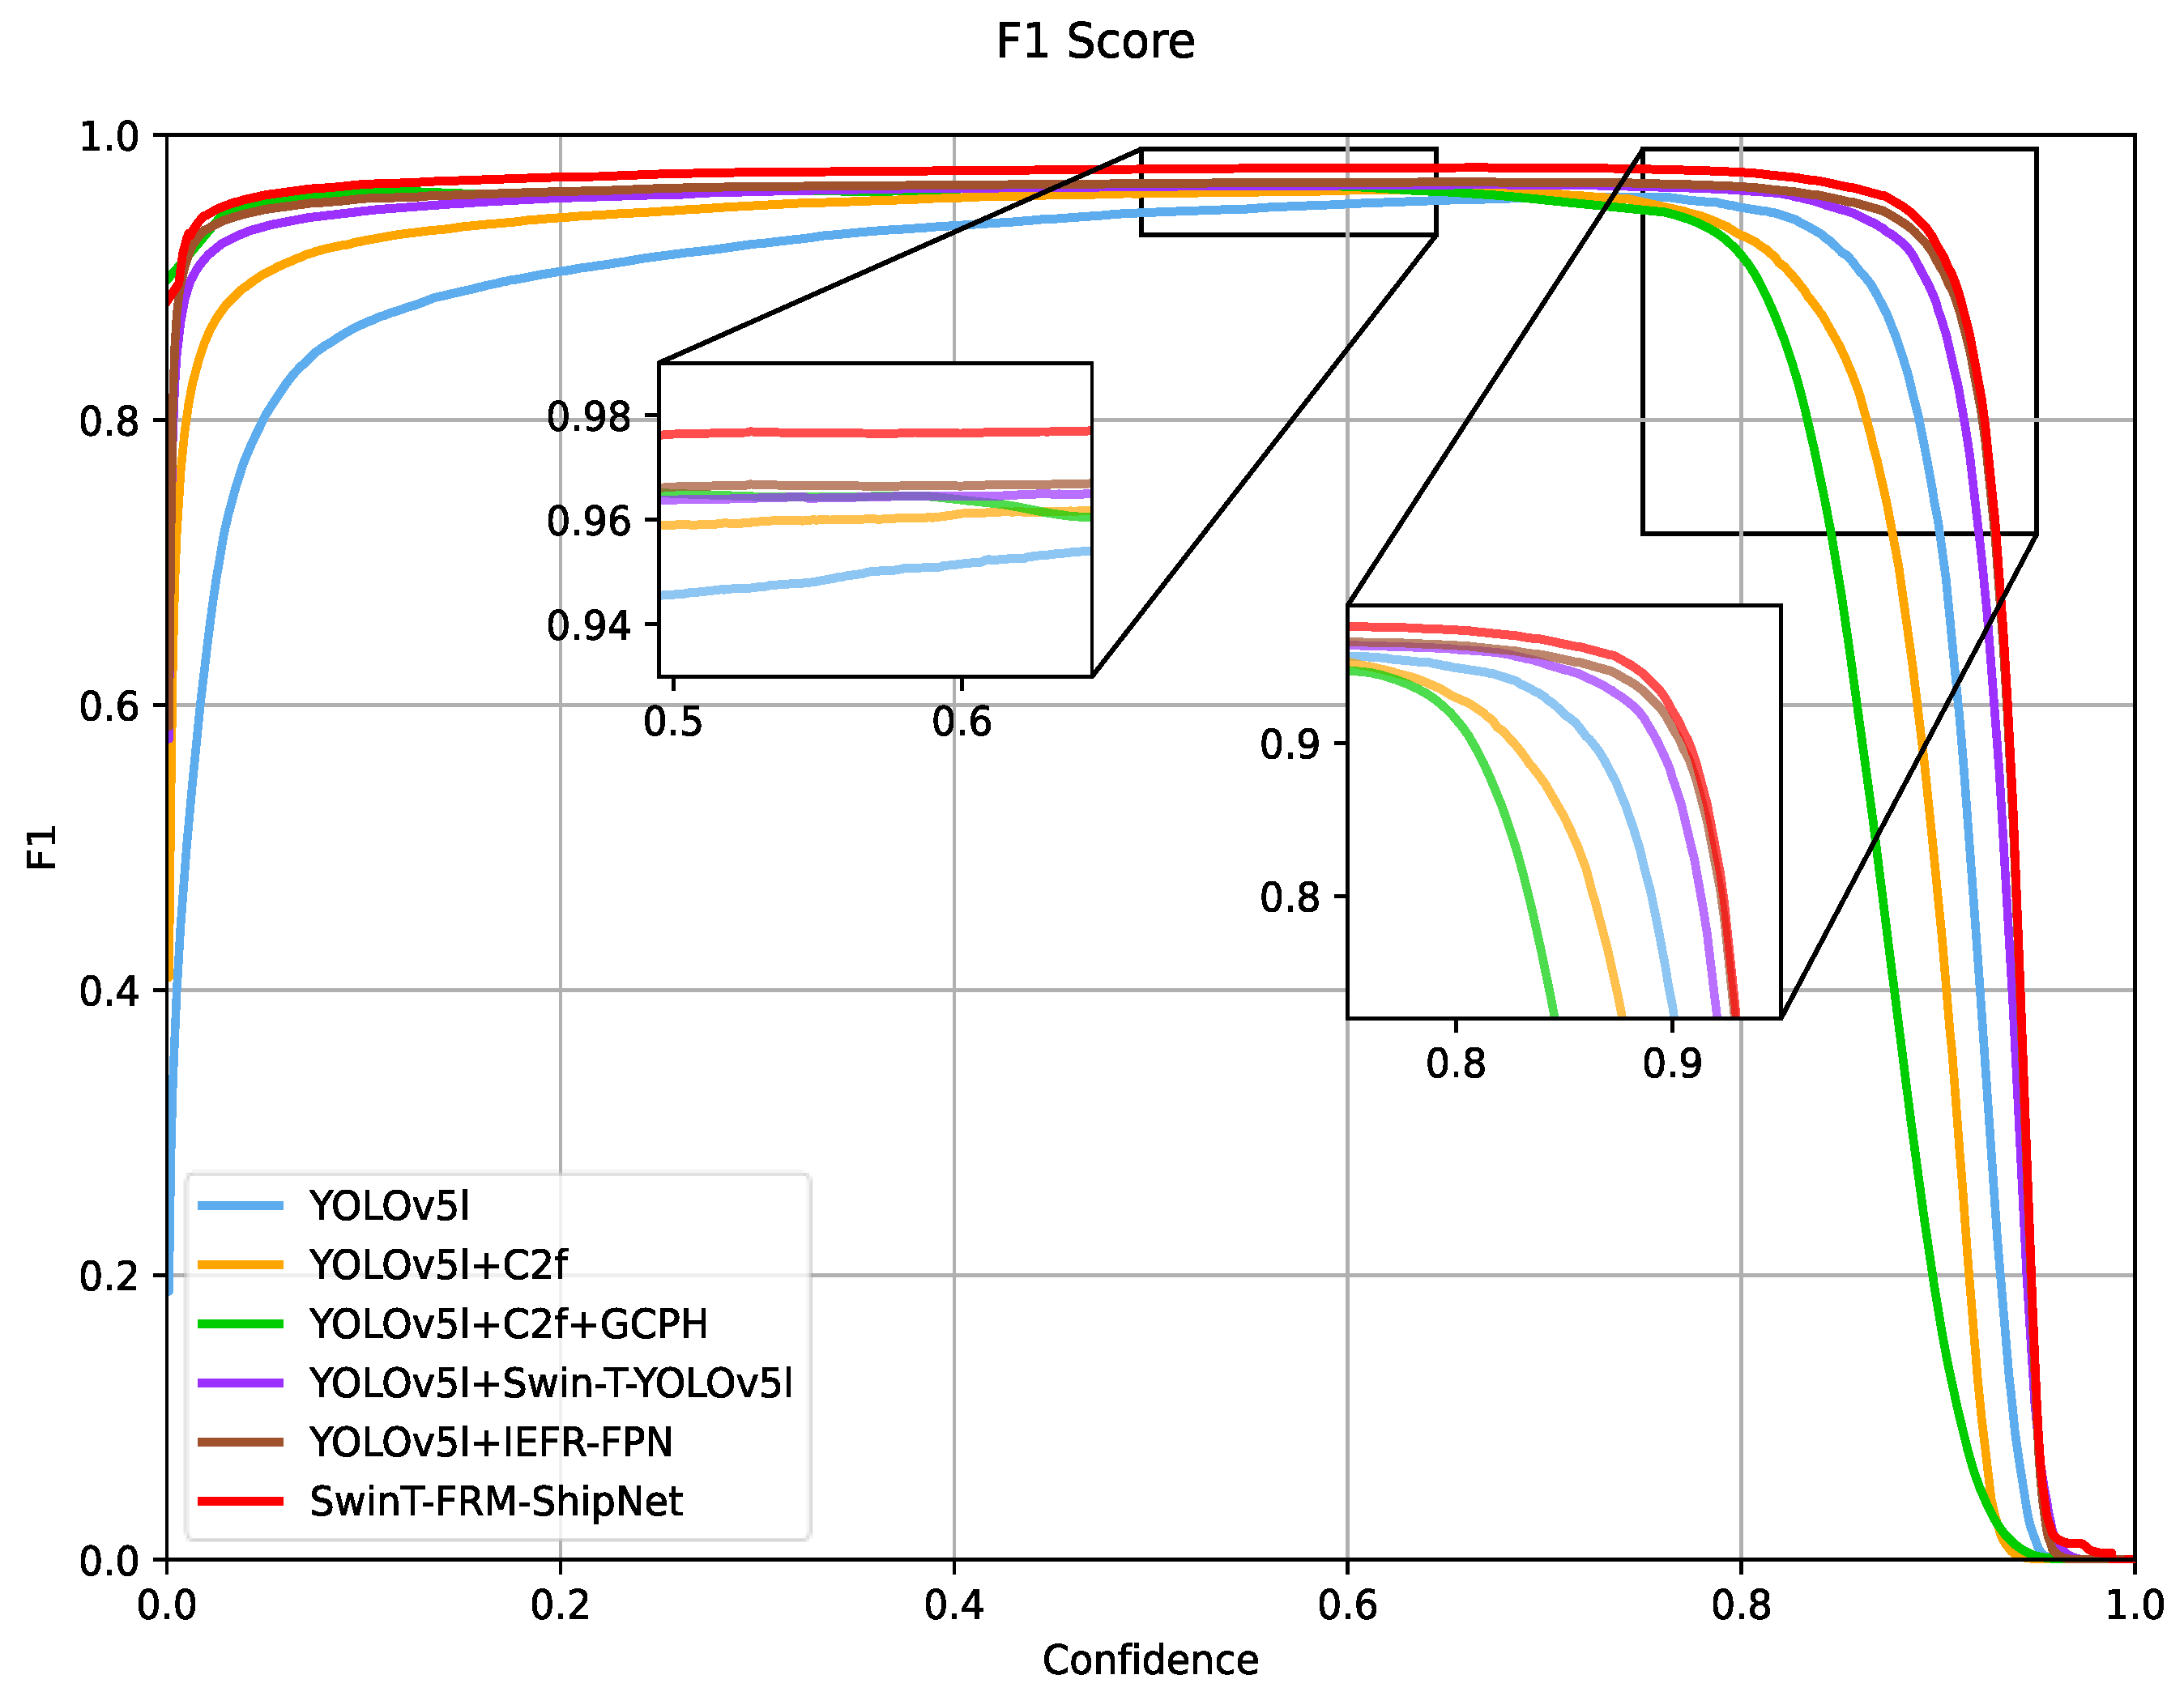
The proposed method inherits the advantages of the aforementioned modules, excelling in small and multiscale SAR ship detection under intricate environments. The F1 score could achieve 96.3%, 0.9% higher than the baseline. Figure 10 displays F1 curves for different models at various confidence thresholds. The C2f and GCPH curves outperform the baseline model of YOLOv5l before a confidence threshold of 0.75, but its performance declines afterward. The IEFR-FPN and Swin-T-YOLOv5l curves are both positioned above the baseline model, indicating excellent performance. Finally, it can be observed that the curve of our proposed model (marked in red) is positioned above all other curves, indicating that it achieves the best F1 score performance. In addition, the mAP0.5 and mAP0.5:0.95 of our model could reach 98.2% and 75.4%, which is 1% and 3.3% higher than the baseline, respectively.

4.6. Feature Visualization

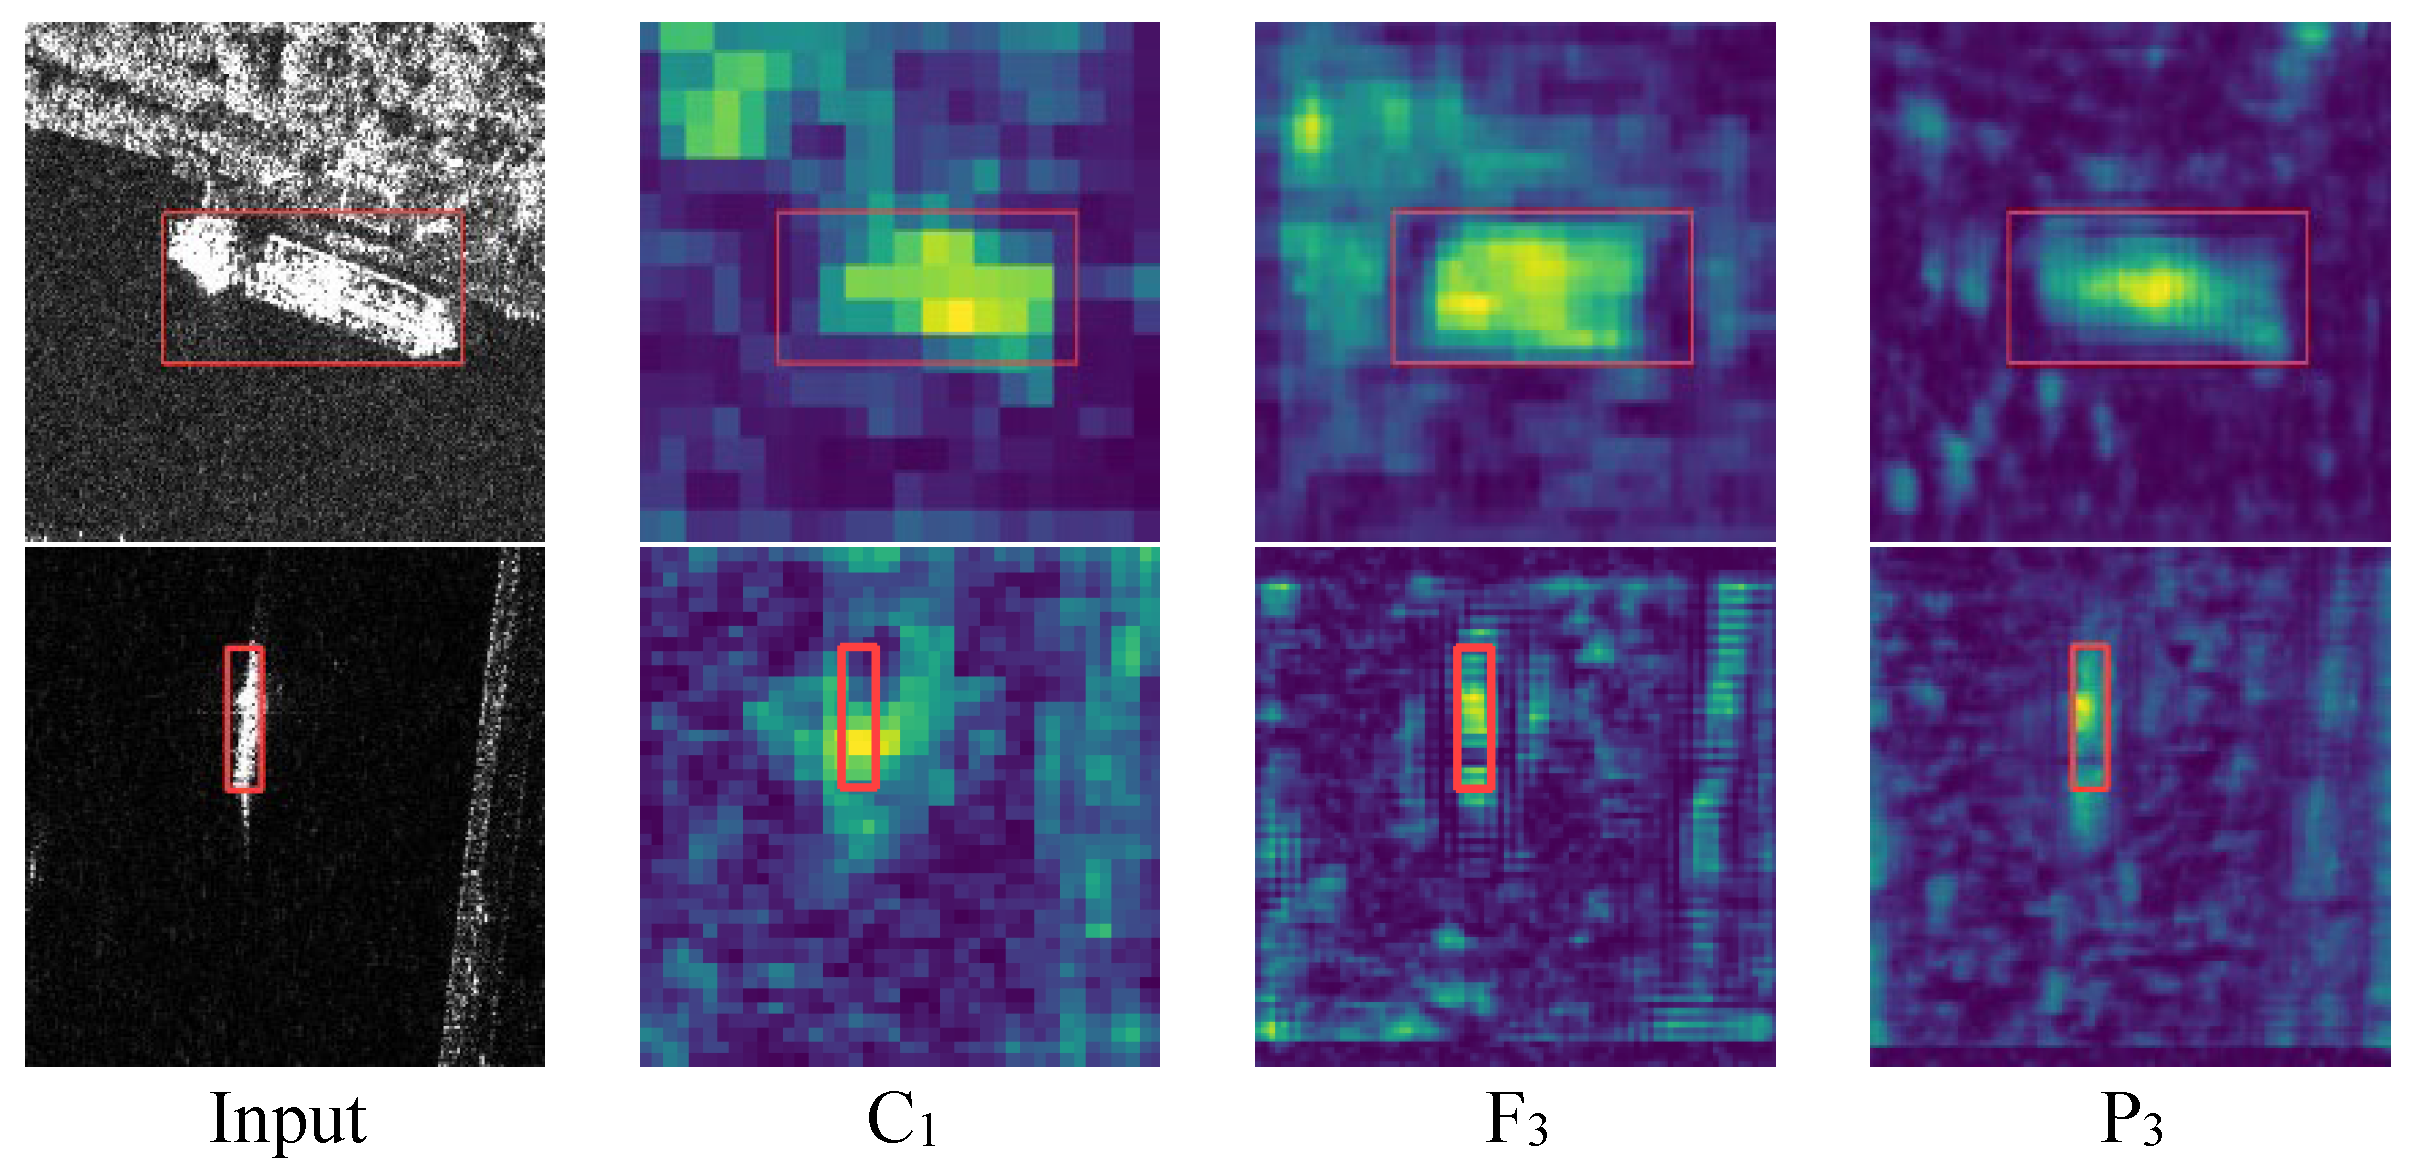
To demonstrate the effectiveness of our model, some feature maps are selected for visualization. C1 is the output of the integrated feature extractor. The bottom layers of FPN dominate the small target detection, so we select the F3 layer with a size of 80 × 80. We also selected P3 as the output feature of FRM. As seen in Figure 11, C1 could roughly locate the positions of targets, but it suffers from a certain amount of background noise. After feature fusion through IEM and FPN, high-level semantic information is introduced into F3 to eliminate background noise. However, the different granularity of features also introduces conflicting information, leading to a weakened response in the target area. In the P3 layer, the feature of the target is enhanced, and the background is suppressed, which makes the boundaries between the target and the background more distinct and accurately distinguishes positive from negative samples. It can be concluded that our model is friendly to small and multiscale SAR ship detection in a complex environment.

5. Discussion

This study proposes the SwinT-FRM-ShipNet, composed of Swin-T-YOLOv5l, IEFR-FPN, and GCPH, for improving the small and multiscale SAR ship detection in complex near-shore and offshore environments. In the ablation experiment, it can be observed that the GCPH module has improved the F1 score by 0.4% and mAP0.5:0.95 by 0.7% compared to the baseline, which can be attributed to the high-order spatial interaction capability of g3Conv. Furthermore, the integrated extractor Swin-T-YOLOv5l is utilized to enlarge receptive fields, both capturing global and contextual information and retaining local features. It has resulted in an increase of 0.6% in F1 score and 2.1% in mAP0.5:0.95. Additionally, IEFR-FPN, composed of the IEM and FRM modules, enhances the 0.5% F1 score and 2.3% mAP0.5:0.95 compared to the baseline. The IEM could capture contextual information by dilated convolution to enrich the information flow of FPN. Furthermore, the FRM could prevent small targets from being engulfed in conflicting information by feature refinement mechanisms both in the channel and spatial dimensions. Moreover, the proposed method has demonstrated good robustness across different datasets: SSDD and SAR-Ship-Dataset. Furthermore, compared with mainstream and state-of-the-art SAR ship-detection methods, our model has brought improvements of at least 1% in mAP0.5, 3.3% in mAP0.5:0.95, and 0.9% in F1 score. To intuitively demonstrate the effectiveness of our model, visualization experiments are implemented in 4.4 and 4.6. (1) Detection visualization: In complex offshore and near-sea scenarios, there are few instances of missed detection and false alarms for small and multiscale ships. The model also excels in scenarios involving dense overlaps. (2) Feature visualization: The features of targets extracted by the integrated detector, after being fed into the IEFR-FPN network for output, are enhanced, and surrounding interferences are suppressed. However, there is still room for improvement in the model’s timely inference. We will focus on model lightweighting in our future work.

6. Conclusions

In this article, we propose the SwinT-FRM-ShipNet against small and multiscale SAR ship detection under complex near-shore and offshore environments. First, we redesign the Swin Transformer and YOLOv5l to generate an integrated feature extractor called Swin-T-YOLOv5l to enlarge receptive fields. The integrated extractor could encode both local and global contextual information to distinguish between the target and the background. Second, a feature pyramid called IEFR-FPN, including IEM and FRM, is proposed. The IEM supplements contextual information by dilated convolution of different receptive fields to enrich the information flow of FPN. Furthermore, FRM introduces a feature refinement mechanism both in the channel and spatial dimension to prevent small targets from being overwhelmed by conflicting information in the multiscale feature fusion. Finally, to enhance the performance of localization and regression in small ships, we add a new detection head with a larger size and apply g3Conv into the prediction head, which could execute high-order spatial interactions without additional computational complexity. Through experimental results on the dataset of SSDD and SAR-Ship-Dataset, it can be concluded that our method achieves superior performance on mAP and F1 scores compared to the mainstream detection algorithms in the task of SAR ship detection. Furthermore, our method exhibits outstanding performance both in near-shore and offshore areas across different datasets while achieving real-time performance.

Author Contributions

Conceptualization, P.W. and Z.L.; methodology, Z.L.; software, Z.L.; validation, P.W. and Y.L.; formal analysis, P.W.; investigation, Y.L.; resources, Z.L.; data curation, B.D.; writing-original draft preparation, Z.L.; writing-review and editing, P.W.; visualization, P.W.; supervision, Z.L.; project administration, P.W. and Z.L. All authors have read and agreed to the published version of the manuscript.

Funding

This research received no external funding.

Data Availability Statement

The SSDD and SAR-Ship-Dataset are public datasets.

Conflicts of Interest

The authors declare no conflict of interest.

References

  1. Reigber, A.; Scheiber, R.; Jager, M.; Prats-Iraola, P.; Hajnsek, I.; Jagdhuber, T.; Papathanassiou, K.P.; Nannini, M.; Aguilera, E.; Baumgartner, S.; et al. Very-High-Resolution Airborne Synthetic Aperture Radar Imaging: Signal Processing and Applications. Proc. IEEE 2013, 101, 759–783. [Google Scholar] [CrossRef]
  2. Moreira, A.; Prats-Iraola, P.; Younis, M.; Krieger, G.; Hajnsek, I.; Papathanassiou, K.P. A tutorial on synthetic aperture radar. IEEE Geosci. Remote Sens. Mag. 2013, 1, 6–43. [Google Scholar] [CrossRef]
  3. Chen, S.; Wang, H.; Xu, F.; Jin, Y.-Q. Target Classification Using the Deep Convolutional Networks for SAR Images. IEEE Trans. Geosci. Remote Sens. 2016, 54, 4806–4817. [Google Scholar] [CrossRef]
  4. Wackerman, C.C.; Friedman, K.S.; Pichel, W.; Clemente-Colón, P.; Li, X. Automatic Detection of Ships in RADARSAT-1 SAR Imagery. Can. J. Remote Sens. 2001, 27, 568–577. [Google Scholar] [CrossRef]
  5. Brusch, S.; Lehner, S.; Fritz, T.; Soccorsi, M.; Soloviev, A.; Van Schie, B. Ship surveillance with TerraSAR-X. IEEE Trans. Geosci. Remote Sens. 2010, 49, 1092–1103. [Google Scholar] [CrossRef]
  6. Martorella, M.; Pastina, D.; Berizzi, F.; Lombardo, P. Spaceborne radar imaging of maritime moving targets with the Cosmo-SkyMed SAR system. IEEE J. Sel. Top. Appl. Earth Obs. Remote Sens. 2014, 7, 2797–2810. [Google Scholar] [CrossRef]
  7. Crisp, D.J. A Ship Detection System for RADARSAT-2 Dual-Pol Multi-Look Imagery Implemented in the ADSS. In Proceedings of the 2013 International Conference on Radar, Adelaide, Australia, 9–12 September 2013; pp. 318–323. [Google Scholar] [CrossRef]
  8. Zhang, T.; Ji, J.; Li, X.; Yu, W.; Xiong, H. Ship Detection from PolSAR Imagery Using the Complete Polarimetric Covariance Difference Matrix. IEEE Trans. Geosci. Remote Sens. 2018, 57, 2824–2839. [Google Scholar] [CrossRef]
  9. Zhang, T.; Jiang, L.; Xiang, D.; Ban, Y.; Pei, L.; Xiong, H. Ship detection from PolSAR imagery using the ambiguity removal polarimetric notch filter. ISPRS J. Photogramm. Remote Sens. 2019, 157, 41–58. [Google Scholar] [CrossRef]
  10. Yang, B.; Zhang, H. A CFAR Algorithm Based on Monte Carlo Method for Millimeter-Wave Radar Road Traffic Target Detection. Remote Sens. 2022, 14, 1779. [Google Scholar] [CrossRef]
  11. Gao, G.; Shi, G. CFAR Ship Detection in Nonhomogeneous Sea Clutter Using Polarimetric SAR Data Based on the Notch Filter. IEEE Trans. Geosci. Remote Sens. 2017, 55, 4811–4824. [Google Scholar] [CrossRef]
  12. Frery, A.C.; Muller, H.J.; Yanasse, C.D.C.F.; Sant’Anna, S.J.S. A model for extremely heterogeneous clutter. IEEE Trans. Geosci. Remote Sens. 1997, 35, 648–659. [Google Scholar] [CrossRef]
  13. Wang, C.; Bi, F.; Zhang, W.; Chen, L. An Intensity-Space Domain CFAR Method for Ship Detection in HR SAR Images. IEEE Geosci. Remote Sens. Lett. 2017, 14, 529–533. [Google Scholar] [CrossRef]
  14. Ye, Z.; Liu, Y.; Zhang, S. A CFAR algorithm for non-Gaussian clutter based on mixture of K distributions. IEEE Geosci. Remote Sens. Lett. 2018, 15, 1531–1535. [Google Scholar]
  15. Drenkow, N.; Sani, N.; Shpitser, I.; Unberath, M. A systematic review of robustness in deep learning for computer vision: Mind the gap? arXiv 2021, arXiv:2112.00639. [Google Scholar]
  16. Buhrmester, V.; Münch, D.; Arens, M. Analysis of Explainers of Black Box Deep Neural Networks for Computer Vision: A Survey. Mach. Learn. Knowl. Extr. 2021, 3, 966–989. [Google Scholar] [CrossRef]
  17. Ciuonzo, D.; Carotenuto, V.; De Maio, A. On Multiple Covariance Equality Testing with Application to SAR Change Detection. IEEE Trans. Signal Process. 2017, 65, 5078–5091. [Google Scholar] [CrossRef]
  18. Krizhevsky, A.; Sutskever, I.; Hinton, G.E. Imagenet classification with deep convolutional neural networks. Commun. ACM 2017, 60, 84–90. [Google Scholar] [CrossRef]
  19. Li, Z.; Liu, F.; Yang, W.; Peng, S.; Zhou, J. A Survey of Convolutional Neural Networks: Analysis, Applications, and Prospects. IEEE Trans. Neural Networks Learn. Syst. 2022, 33, 6999–7019. [Google Scholar] [CrossRef]
  20. He, K.; Zhang, X.; Ren, S.; Sun, J. Spatial Pyramid Pooling in Deep Convolutional Networks for Visual Recognition. IEEE Trans. Pattern Anal. Mach. Intell. 2015, 37, 1904–1916. [Google Scholar] [CrossRef]
  21. Girshick, R. Fast r-cnn. In Proceedings of the IEEE International Conference on Computer Vision 2015, Washington, DC, USA, 7–13 December 2015; pp. 1440–1448. [Google Scholar]
  22. Ren, S.; He, K.; Girshick, R.; Sun, J. Faster R-CNN: Towards real-time object detection with region proposal networks. In Proceedings of the 28th International Conference on Neural Information Processing Systems, Montreal, Canada, 7–12 December 2015; pp. 91–99. [Google Scholar]
  23. Cai, Z.; Vasconcelos, N. Cascade R-CNN: Delving into High Quality Object Detection. In Proceedings of the IEEE Conference on Computer Vision and Pattern Recognition 2018, Salt Lake City, UT, USA, 18–22 June 2018; pp. 6154–6162. [Google Scholar]
  24. Liu, W.; Anguelov, D.; Erhan, D.; Szegedy, C.; Reed, S.; Fu, C.Y.; Berg, A.C. SSSD: Single Shot Multibox Detector. In Proceedings of the Computer Vision–ECCV 2016, 14th European Conference, Amsterdam, The Netherlands, 11–14 October 2016; Proceedings, Part I 14. Springer International Publishing: New York, NY, USA, 2016; pp. 21–37. [Google Scholar]
  25. Bochkovskiy, A.; Wang, C.Y.; Liao, H.Y.M. Yolov4: Optimal speed and accuracy of object detection. arXiv 2020, arXiv:2004.10934. [Google Scholar]
  26. Wang, C.Y.; Bochkovskiy, A.; Liao, H.Y.M. YOLOv7: Trainable bag-of-freebies sets new state-of-the-art for real-time object detectors. arXiv 2022, arXiv:2207.02696. [Google Scholar]
  27. Chen, J.; Lu, Y.; Yu, Q.; Luo, X.; Adeli, E.; Wang, Y.; Lu, L.; Yuille, A.L.; Zhou, Y. Transunet: Transformers make strong encoders for medical image segmentation. arXiv 2021, arXiv:2102.04306. [Google Scholar]
  28. Dosovitskiy, A.; Beyer, L.; Kolesnikov, A.; Weissenborn, D.; Zhai, X.; Unterthiner, T.; Dehghani, M.; Minderer, M.; Heigold, G.; Gelly, S.; et al. An image is worth 16 × 16 words: Transformers for image recognition at scale. arXiv 2020, arXiv:2010.11929. [Google Scholar]
  29. Zhu, X.; Su, W.; Lu, L.; Li, B.; Wang, X.; Dai, J. Deformable DETR: Deformable transformers for end-to-end object detection. arXiv 2020, arXiv:2010.04159. [Google Scholar]
  30. Liu, Z.; Lin, Y.; Cao, Y.; Hu, H.; Wei, Y.; Zhang, Z.; Lin, S.; Guo, B. Swin Transformer: Hierarchical Vision Transformer Using Shifted Windows. In Proceedings of the IEEE/CVF International Conference on Computer Vision, Montreal, BC, Canada, 11–17 October 2021; pp. 10012–10022. [Google Scholar]
  31. Cao, H.; Wang, Y.; Chen, J.; Jiang, D.; Zhang, X.; Tian, Q.; Wang, M. Swin-Unet: Unet-Like Pure Transformer for Medical Image Segmentation. In Proceedings of the European Conference on Computer Vision 2022, Tel Aviv, Israel, 24–28 October 2022; Springer Nature: Cham, Switzerland, 2022; pp. 205–218. [Google Scholar]
  32. Freeman, A. SAR calibration: An overview. IEEE Trans. Geosci. Remote Sens. 1992, 30, 1107–1121. [Google Scholar] [CrossRef]
  33. Guo, H.; Yang, X.; Wang, N.; Song, B.; Gao, X. A Rotational Libra R-CNN Method for Ship Detection. IEEE Trans. Geosci. Remote Sens. 2020, 58, 5772–5781. [Google Scholar] [CrossRef]
  34. Guo, H.; Yang, X.; Wang, N.; Gao, X. A CenterNet++ model for ship detection in SAR images. Pattern Recognit. 2021, 112, 107787. [Google Scholar] [CrossRef]
  35. Chen, H.; Qi, Z.; Shi, Z. Remote sensing image change detection with transformers. IEEE Trans. Geosci. Remote Sens. 2021, 60, 1–14. [Google Scholar] [CrossRef]
  36. Cui, Z.; Wang, X.; Liu, N.; Cao, Z.; Yang, J. Ship detection in large-scale SAR images via spatial shuffle-group enhance attention. IEEE Trans. Geosci. Remote Sens. 2020, 59, 379–391. [Google Scholar] [CrossRef]
  37. Cui, Z.; Li, Q.; Cao, Z.; Liu, N. Dense Attention Pyramid Networks for Multi-Scale Ship Detection in SAR Images. IEEE Trans. Geosci. Remote Sens. 2019, 57, 8983–8997. [Google Scholar] [CrossRef]
  38. Li, D.; Liang, Q.; Liu, H.; Liu, Q.; Liu, H.; Liao, G. A Novel Multidimensional Domain Deep Learning Network for SAR Ship Detection. IEEE Trans. Geosci. Remote Sens. 2022, 60, 5203213. [Google Scholar] [CrossRef]
  39. Dai, W.; Mao, Y.; Yuan, R.; Liu, Y.; Pu, X.; Li, C. A Novel Detector Based on Convolution Neural Networks for Multiscale SAR Ship Detection in Complex Background. Sensors 2020, 20, 2547. [Google Scholar] [CrossRef] [PubMed]
  40. Rao, Y.; Zhao, W.; Tang, Y.; Zhou, J.; Lim, S.N.; Lu, J. Hornet: Efficient high-order spatial interactions with recursive gated convolutions. Adv. Neural Inf. Process. Syst. 2022, 35, 10353–10366. [Google Scholar]
  41. Li, J.; Qu, C.; Shao, J. Ship detection in SAR images based on an improved faster R-CNN. In Proceedings of the 2017 SAR in Big Data Era: Models, Methods and Applications (BIGSARDATA), Beijing, China, 13–14 November 2017; IEEE; New York, NY, USA, 2017; pp. 1–6. [Google Scholar]
  42. Wang, Y.; Wang, C.; Zhang, H.; Dong, Y.; Wei, S. A SAR Dataset of Ship Detection for Deep Learning under Complex Backgrounds. Remote Sens. 2019, 11, 765. [Google Scholar] [CrossRef]
  43. Zhu, X.; Lyu, S.; Wang, X.; Zhao, Q. TPH-YOLOv5: Improved YOLOv5 Based on Transformer Prediction Head for Object Detection on Drone-captured Scenarios. In Proceedings of the IEEE/CVF International Conference on Computer Vision (ICCV) Workshops, Montreal, BC, Canada, 11–17 October 2021; pp. 2778–2788. [Google Scholar]
  44. Reis, D.; Kupec, J.; Hong, J.; Daoudi, A. Real-Time Flying Object Detection with YOLOv8. arXiv 2023, arXiv:2305.09972. [Google Scholar]
  45. Woo, S.; Park, J.; Lee, J.Y.; Kweon, I.S. Cbam: Convolutional Block Attention Module. In Proceedings of the European conference on computer vision (ECCV) 2018, Munich, Germany, 8–14 September 2018; pp. 3–19. [Google Scholar]
  46. Keskar, N.S.; Socher, R. Improving generalization performance by switching from adam to sgd. arXiv 2017, arXiv:1712.07628. [Google Scholar]
Figure 1. (a) The structure of SwinT-FRM-ShipNet. The backbone is an integrated feature extractor, Swin-T-YOLOv5l. The IEM and FRM are the main components of the designed neck network—IEFR-FPN. The IEM injects contextual information into the FPN, and FRM filters out conflicting information. The GCPH consists of four different scales and g3Conv to predict the label class and location. (b) C2f module with multi-gradient flow and Cross Stage Partial Bottleneck.
Remotesensing 15 05780 g001
Figure 2. (a) Overall structure of Swin Transformer; (b) two successive Swin Transformer blocks (W-MSA refers to window-based multi-head self-attention and SW-MSA refers to multi-head self-attention based on the shifted window).
Remotesensing 15 05780 g002
Figure 3. The picture depicts the framework of the STCSPC module. It is mainly composed of n Swin Transformer encoder blocks.
Remotesensing 15 05780 g003
Figure 4. The Structure of IEM: the features are generated by the dilated convolution with rates of 1, 3, and 5, respectively. The features are concatenated to acquire contextual information with distinct receptive fields.
Remotesensing 15 05780 g004
Figure 5. The overall structure of FRM: (a) the framework of FRM. (b) Channel Attention Module. (c) Spatial Attention.
Remotesensing 15 05780 g005
Figure 6. Overview of the basic gnConv module. The left (a) shows the detailed implementation of gnConv, and the right (b) shows the detailed implementation of g3Conv with gated convolutions and recursive gates to realize the high-order spatial interactions.
Remotesensing 15 05780 g006
Figure 7. The scatter plots of Precision and Recall performance metrics across different methods. (a) The scatter plot is based on the results of the SSDD. (b) The scatter plot is based on the results of the SAR-Ship-Dataset.
Remotesensing 15 05780 g007
Figure 8. Visual results of ship detection involving origin, YOLOv5l, and SwinT-FRM-ShipNet in the complex near-shore environment. The CadetBlue, red, yellow, and green represent the ground truths, true positive, false negative, and false positive.
Remotesensing 15 05780 g008
Figure 9. Visual results of ship detection involving origin, YOLOv5l, and SwinT-FRM-ShipNet in the offshore areas. The CadetBlue, red, and green represent the ground truths, true positive, false negative, and false positive.
Remotesensing 15 05780 g009
Figure 10. F1 curves for different models at various confidence. The red curve represents our proposed model.
Remotesensing 15 05780 g010
Figure 11. Visualization results of feature maps. C1 is the output feature map of the Swin-T-YOLOv5l feature extractor, F3 is the 80 × 80 feature map of FPN, and P3 is the output feature of FRM, which has less conflicting information. The red box corresponds to the true target.
Remotesensing 15 05780 g011
Table 1. The comparison of performance metrics across different methods on SSDD. This section demonstrates the outcomes of R-CNN-based methods, anchor-based one-stage methods, anchor-free methods, and our proposed algorithm. The best performance is highlighted in bold.
MethodBackbonePrecision (%)Recall (%)F1 (%)mAP0.5 (%)Runtime (ms)Params (M)
Faster R-CNNResNet-101-FPN90.987.689.288.330.260.1
Libra R-CNNResNet-101-FPN88.688.688.689.930.260.4
Cascade R-CNNResNet-101-FPN94.389.992.089.538.887.9
CR2A-NetResNet-101-FPN94.087.890.889.867.288.6
DAPNResNet-101-FPN87.691.489.490.134.563.8
FCOSResNet-101-FPN94.485.689.888.725.950.8
CenterNetDAL-3493.394.593.993.521.520.2
CenterNet++DAL-3492.694.593.692.721.520.3
SSD512SSDVGG92.988.090.494.030.224.4
RetinaNetResNet-101-FPN81.692.386.689.630.255.1
YOLOv4CSPDarknet-5393.694.093.896.114.964.3
YOLOv5lYOLOv5l95.695.795.697.214.248.5
SwinT-FRM-ShipNetSwin-T-YOLOv5l96.297.496.798.121.264.2
Table 2. The comparison of performance metrics across different methods on SAR-Ship-Dataset.
MethodBackbonePrecision (%)Recall (%)F1 (%)mAP0.5 (%)Runtime (ms)Params (M)
Faster R-CNNResNet-101-FPN91.091.091.091.025.160.1
Libra R-CNNResNet-101-FPN87.791.489.691.525.560.4
Cascade R-CNNResNet-101-FPN92.091.691.892.034.087.9
CR2A-NetResNet-101-FPN91.792.291.990.141.788.6
DAPNResNet-101-FPN91.091.491.291.927.863.8
FCOSResNet-101-FPN92.693.493.094.922.850.8
CenterNetDAL-3484.693.588.895.014.320.2
CenterNet++DAL-3485.493.589.394.915.220.3
SSD512SSDVGG90.991.591.294.223.724.4
RetinaNetResNet-101-FPN84.593.388.793.825.855.1
YOLOv4CSPDarknet-5385.792.789.194.414.264.3
YOLOv5lYOLOv5l95.795.695.697.215.648.5
SwinT-FRM-ShipNetSwin-T-YOLOv5l96.896.396.598.224.564.2
Table 3. The ablation study on SAR-Ship-Dataset.
ModelPrecision
(%)
Recall
(%)
F1
(%)
mAP0.5
(%)
mAP0.5:0.95
(%)
YOLOv5l95.795.695.697.272.1
YOLOv5l + C2f96.4 (+0.7)95.6 (+0.0)95.9 (+0.3)97.7 (+0.5)72.4 (+0.3)
YOLOv5l + C2f + GCPH96.2 (+0.7)95.9 (+0.3)96.0 (+0.4)97.8 (+0.6)74.8 (+0.7)
YOLOv5l + Swin-T-YOLOv5l (Swin Transformer)96.3( +0.6)96.2 (+0.6)96.2 (+0.6)98.1 (+0.9)74.2 (+2.1)
YOLOv5l + IEFR-FPN (IEM + FRM)96.1 (+0.4)96.1 (+0.5)96.1 (+0.5)98.1 (+0.9)74.4 (+2.3)
SwinT-FRM-ShipNet (C2f + GCPH + Swin-T-YOLOv5l + IEFR-FPN)96.8 (+1.1)96.3 (+0.7)96.5 (+0.9)98.2 (+1.0)75.4 (+3.3)
Disclaimer/Publisher’s Note: The statements, opinions and data contained in all publications are solely those of the individual author(s) and contributor(s) and not of MDPI and/or the editor(s). MDPI and/or the editor(s) disclaim responsibility for any injury to people or property resulting from any ideas, methods, instructions or products referred to in the content.