Article

Geometric Quality Assessment of Prefabricated Steel Box Girder Components Using 3D Laser Scanning and Building Information Model

1
Key Laboratory of Coastal Urban Resilient Infrastructures (MOE), Shenzhen University, Shenzhen 518060, China
2
Sino-Australia Joint Research Center in BIM and Smart Construction, Shenzhen University, Shenzhen 518060, China
3
Department of Construction and Real Estate, School of Civil Engineering, Southeast University, Nanjing 211189, China
4
Foshan Shunde Country Garden Property Development Co., Ltd., Foshan 528300, China
*
Author to whom correspondence should be addressed.
Remote Sens. 2023, 15(3), 556; https://doi.org/10.3390/rs15030556
Submission received: 27 December 2022 / Revised: 11 January 2023 / Accepted: 14 January 2023 / Published: 17 January 2023

Abstract

:
Prefabricated steel box girders (SBGs) are widely adopted in bridge engineering due to their light weight and low lifecycle cost. To smoothly assemble SBG components on a construction site, it is necessary to inspect their geometric quality and ensure that all the as-is SBG components have the correct dimensions. However, the traditional inspection method is time-consuming and error-prone. This study developed a non-contact geometric quality assessment technique based on 3D laser scanning to accurately assess the locations and dimensions of SBG components. First, a robust normal-based region-growing algorithm was developed to divide the SBG components into segments with different labels. The scanned data related to the T ribs were then extracted through the proposed subtraction algorithm after the identification of the steel cabin. Lastly, the required items for geometric quality inspection were calculated based on the extracted as-is SBG components. The feasibility of the proposed geometric quality assessment method was validated through a real SBG project. Field test results showed that the developed inspection technique could assess the geometric quality of prefabricated SBG components in a more accurate and efficient manner compared to traditional measurement approaches.

1. Introduction

Steel box girders (SBGs) are widely used in the urban overpasses and other large civil infrastructures. Compared with cast-in-place reinforced concrete bridges, SBG bridges have the advantages of a fast construction speed, a light weight, excellent seismic performance, and less building pollution [1]. The structural integrity of SBGs depends on the correctness of the components’ orientation and dimensions, especially the relative location between adjacent components. As for the cantilever beam of an SBG, T ribs play an important role in bearing the vertical load and ensuring stability. If the location and orientation of the T ribs after welding and installation do not conform to the design requirements, the welds between the T ribs and the steel cabin are prone to cracks and may necessitate reworking [2]. Therefore, the location and orientation of the T ribs of the cantilever beam must be consistent with the blueprints during the welding and installation. Once the SBG components are transported to the construction site and the concrete pouring is completed, incorrect SBG component dimensions and locations can result in incalculable economic losses and even fatalities.
Currently, the geometric quality evaluation of SBG components heavily relies on manual detection with traditional measuring tools such as leaning rulers and steel tapes. However, it is time-consuming, labor-intensive, and tedious to assess large-scale SBG components manually at the prefabrication site, leading to error-prone evaluation results. Although electronic measuring instruments such as total stations and laser rangefinders are extensively applied in the geometric quality inspection of as-is buildings and other large components, these approaches are unable to provide accurate and rapid inspection for large and complex SBG components under unfavorable weather conditions [3].
In recent years, 3D laser scanning technology has become popular in civil infrastructure for the fast establishment of 3D image models of objects. Three-dimensional laser scanning adopts time-of-flight (TOF) technology, which calculates the distance from the scanner to the target object by transmitting a laser beam and detecting the reflected signal of the target. Since 3D visualization models of complex and irregular schemes can be constructed quickly and accurately, 3D laser scanning has been extensively used in various fields, such as reverse engineering [4,5], surveying and mapping engineering [6,7], and structural health monitoring [8,9]. Meanwhile, the scanned data acquired from terrestrial laser scanners (TLSs) represent the as-is status of objects, while the corresponding as-designed information is usually stored in building information modeling (BIM) models, which are digital representations of the physical and functional characteristics of a facility. Several studies have already compared scanned data with BIM models for geometric quality inspections and progress control at the construction stage [10,11].
Since 3D models reverse-constructed based on laser scanning are not as-built BIM models with semantic information, the geometric information of the as-built model cannot be directly obtained. The conversion and extraction of semantic information from 3D point-cloud models of prefabricated SBG components with complex shapes and the assessment of the geometric quality of complex structures are far from being achieved. Previous attempts have focused on identifying and extracting geometrically simple components, such as prefabricated mechanical, electrical, and plumbing (MEP) modules; rebars of reinforced precast concrete elements; and shear keys of prefabricated slabs in a simple prefab scheme [12,13,14]. Components with complex precast schemes, such as large-scale precast concrete components and spatial structural components, have also been studied [11,15]. However, there is a lack of research on extracting the geometric information of large-scale prefabricated components in complex prefab schemes from 3D point-cloud models, and few studies have focused on the geometric quality detection of large-scale prefabricated SBG components.
To address the above research gap, this study proposed a geometric quality inspection method for large-scale prefabricated SBG components with complex connections based on laser scanning and BIM models, including T ribs and the steel cabin of cantilevers, during the manufacturing stage. For large-scale and complex prefabricated components in complex prefab schemes, different point-cloud data processing algorithms were developed to extract the geometry information for the prefabricated components. After extracting the geometry information, the point-cloud model of the regular as-built prefabricated component segment was compared with the as-designed BIM model. Then, the geometric quality of the SBG segment was evaluated by calculating indicators such as the deviation, degree of completeness, and degree of matching compared to a geometrically standardized precast SBG segment. For large-scale precast component segments with complex geometries and interlacing components, a geometric quality evaluation method considering the location and orientation was proposed based on the component geometric feature information obtained by the improved point-cloud data-processing algorithm. The highlights of this study include: (1) the development of a quality assessment method for inspecting the geometric quality of complex SBG components; (2) the design of a robust normal-based region-growing algorithm for detecting the segments of an SBG and the proposal of a subtraction algorithm to extract the scanned data relating to the T ribs; and (3) the improvement of the mean shift algorithm for recognizing the boundaries of T ribs in order to extract the intersection points.
The rest of this paper is organized as follows. Section 2 presents a review of the existing methods for the point-cloud-based segmentation of precast components, object recognition, location recognition, and quality assurance and control. The proposed geometric quality assessment technique is illustrated in detail in Section 3 and Section 4. In Section 5, a validation experiment is presented, and the results are assessed to determine the accuracy and feasibility of the proposed geometric quality assessment technique. Lastly, Section 6 concludes this study and presents future research directions.

2. Literature Review

2.1. Point-Cloud Data Segmentation

In order to extract the geometric information of large-scale prefabricated SBG members with complex geometries, the first step in the reverse-construction of the laser scanning data is point-cloud segmentation. The complete point-cloud model of SBG members is divided into segments according to attribute label information. Subsequently, the feature planes and geometric key feature points are identified and extracted based on the segments. Several geometric information extraction algorithms have been developed for prefabricated components with different geometric complexities and scales. For geometrically simple components, Castillo et al. [16] proposed a point-cloud segmentation algorithm based on surface normal estimation and local point connectivity, which can operate on unstructured point-cloud data and robustly detect corners and edges from point-cloud data. Pu and Vosselman [17] employed a planar surface growing methodology for point-cloud data segmentation to divide and recognize potential building features. Li et al. [18] presented a segmentation algorithm integrating region growing with a multi-size super-voxel segmentation method that was robust to varying point densities and noise, which could extract effective local shape descriptors. For large-scale prefabricated components, Li et al. [11] combined the region-growing algorithm and the random sampling consensus (RANSAC) algorithm to extract the feature plane of prefabricated components, using the RANSAC algorithm to remove the noise outside the plane. Nevertheless, this method is more sensitive to noise when searching along edges and cannot handle small structural members.
Although previous research has investigated large-scale components with simple geometries and applied various methods to the corresponding structural components, the experimental environments involved more idealized prefabricated schemes. Additionally, the segmentation of as-built point-cloud models for complex precast schemes and large-scale complex structural components with multiple element combinations has not been well-studied. Therefore, this study proposes methods for the segmentation of large-scale SBG precast members in complex precast schemes.

2.2. Point-Cloud-Based Object Recognition

SBG bridges comprise components of different sizes and shapes, some of which crisscross each other. In order to generate as-built point-cloud models of SBG bridges with rich geometric information, various components need to be identified after segmentation. Existing object recognition approaches can generally be divided into bottom-up methods and top-down methods. Bottom-up methods typically start by processing small subsets of the laser scanning data to compute corresponding local salient features, including geometric features and color information. Subsets of laser scanning data with similar local features are then classified to form a single segmented object instance [19]. For example, as stated in Date et al. [20], through the local 3D shape matching between a CAD model mesh of an object and the laser scanning data of the scheme, the existence of the object can be recognized and its position and direction in the scheme can be extracted. Yokoyama et al. [21] proposed a method using principal component analysis (PCA) to recognize points on pole-like objects from a mobile laser-scanning system based on the k-nearest neighbor graph and Laplacian smoothing. Wang et al. [13] distinguished rebars from concrete according to the difference between the linear value of the scan data and the probability density function of the surface value.
The top-down approach based on heuristics can decompose the target detection and recognition of the measured object into easier-to-solve sub-problems, reducing the complexity of the laser scanning data. However, when the point-cloud data are missing or incomplete, the method might falsely identify a collection of clutter as a structural element and fail to recognize the real element, which has the potential to affect the following detection process, as pointed out by Yan et al. [22]. Riveiro et al. [23] proposed a heuristics-based top-down method to accelerate the search process, which could effectively perform segmentation and extract point-cloud data containing specific structural components from masonry arch bridges. Compared to steel girder bridges with complex structures such as ribs, the characteristics of masonry arch bridges are easier to distinguish. In addition, the top-down methods are usually based on built bridges with less noise interference, while prefabricated scenarios have more complex environments. Therefore, this study proposes a recognition method that is more sensitive to noise for steel girder bridges in large-scale prefab scenarios.

2.3. Point-Cloud-Based Location Recognition of Structural Components

The locations of SBG bridge components usually strongly impact the structural performance; therefore, locating these components during manufacturing is necessary. Several studies have made breakthroughs in using laser-scanned data or images for location recognition. For instance, Sommer et al. [24] proposed a method for the segmentation-free joint estimation of orthogonal planes, their intersection lines, relationship graphs, and corners lying at the intersection of three orthogonal planes. Wu et al. [25] used the random sampling consensus (RANSAC) algorithm to segment the filtered top bar and finally obtained the radius, position, and posture of each bar, allowing the identification of the bar parts. As stated in Zhe et al. [26], a new deep neural network was developed to extract discriminative and generalizable global descriptors from a raw 3D point cloud. Ren et al. [27] presented a method for the automatic recognition and 3D pose estimation of different kinds of targets based on object CAD models and Kinect V2 RGB-D sensors. Akizuki and Hashimoto [28] used a 3D vector pair to detect randomly stacked industrial parts, simulating the visible state of the vector pair from various viewpoints. However, due to the complexity of the geometric structure of SBG prefabricated components and the limitations of the measuring instruments, there is limited relevant research investigating the relationships among SBG prefabricated components.

2.4. Point-Cloud-Based Quality Assurance and Control
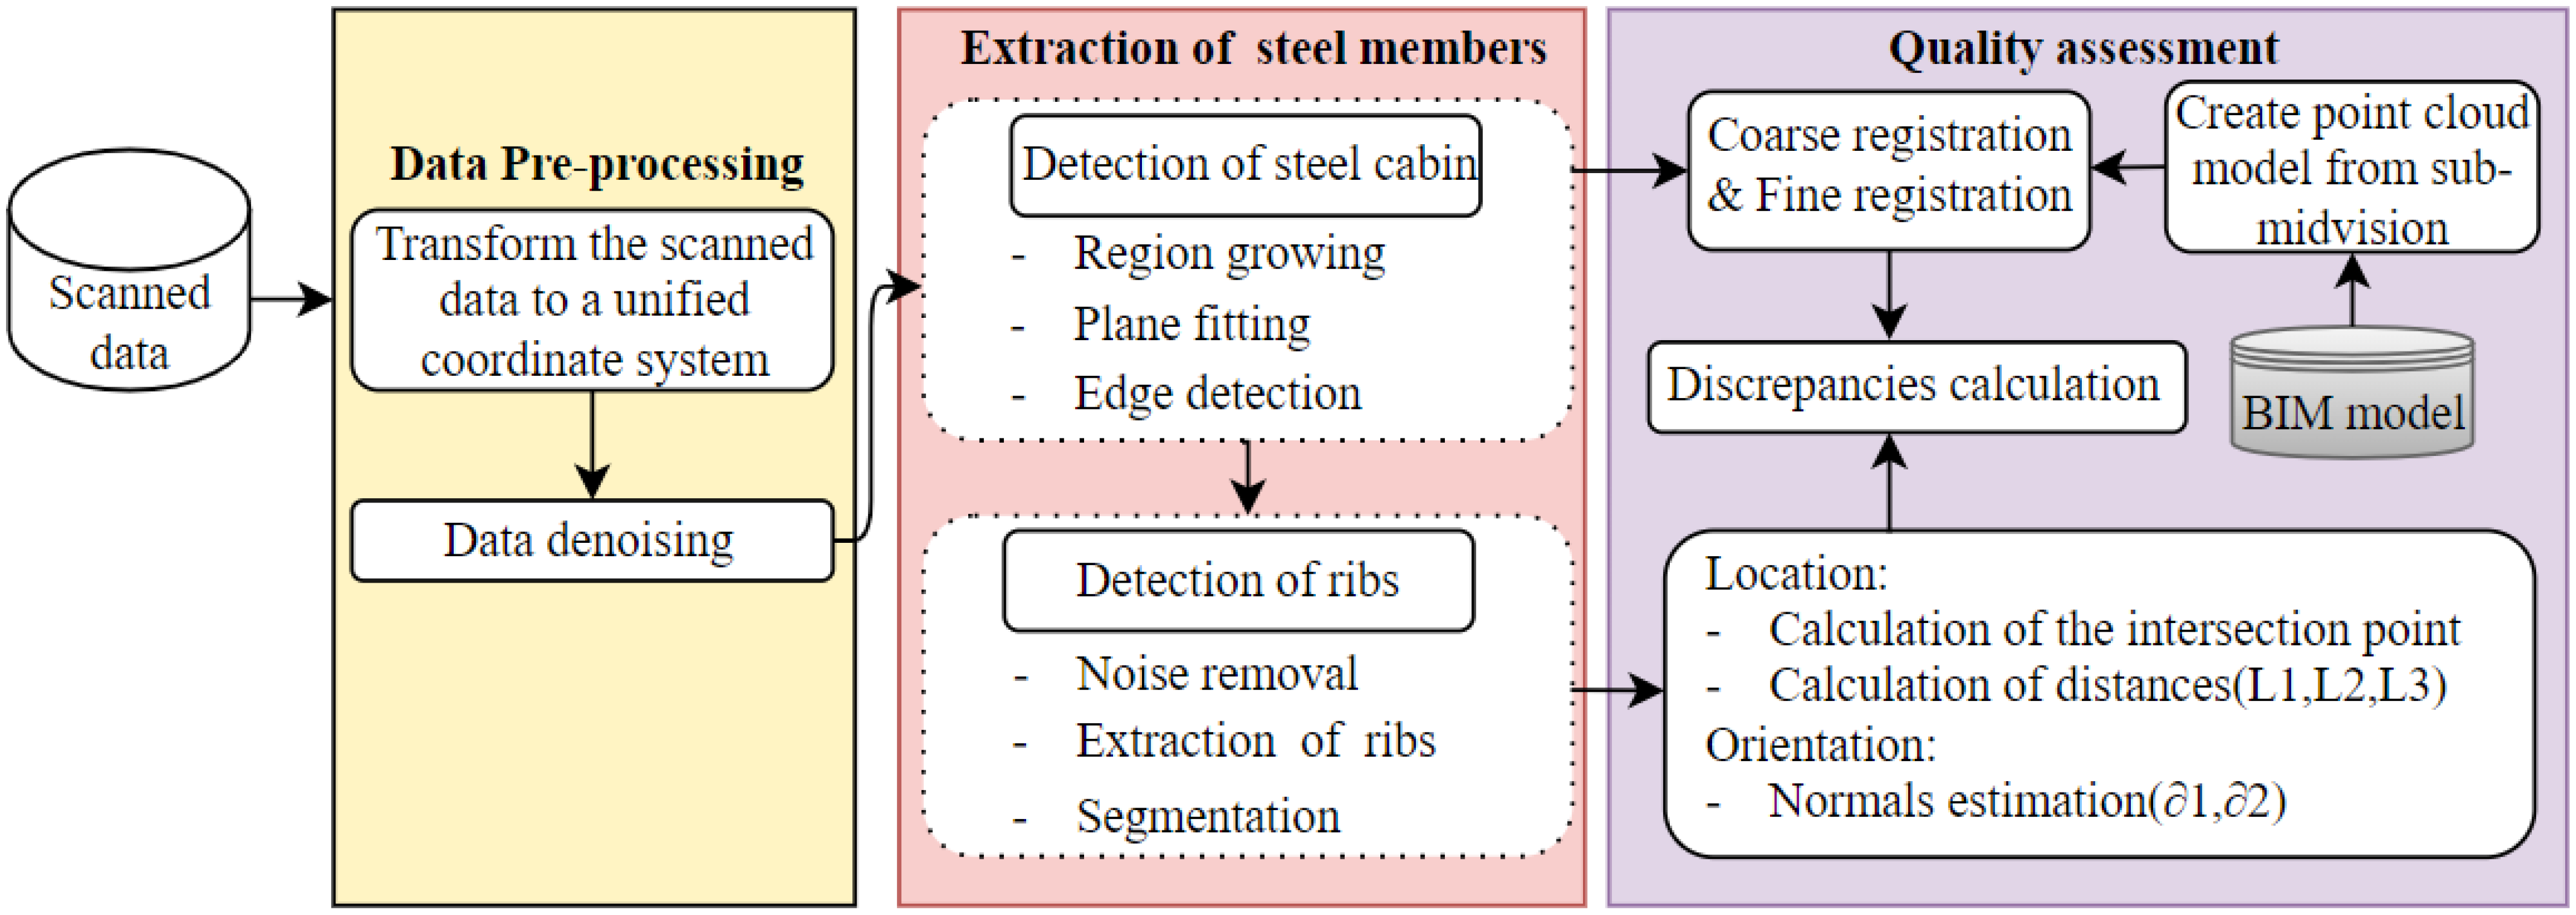
In recent years, numerous methods have been reported for geometric quality assurance and control in the construction and completion acceptance stages. For example, Kim et al. [29] developed a geometric quality-control method to detect and calculate geometric quality deviations for large-scale prefabricated concrete components using laser scanning data and BIM. Anil et al. [30] presented a method for assessing the quality of as-built BIM models generated from point-cloud data by analyzing the patterns of geometric deviations between the as-designed model and the point-cloud data. Ghahremani et al. [31] proposed a method for using 3D point clouds obtained with the aid of a handheld 3D laser scanner for the quality assurance of high-frequency mechanical impact (HFMI) treatment. For the geometrical quality evaluation of components with regularized geometric shapes, the Scan-vs-BIM method can achieve better results [32]. However, for large-scale prefabricated components with complex geometric shapes, the Scan-vs-BIM method has certain limitations due to the influence of factors such as occlusion and component intersection. Therefore, this paper proposes a method for the co-detection of position and orientation based on the extracted feature information for components with complex geometries.
Machine vision technologies have also been extensively applied to geometric quality control, especially for assessing the geometric quality of large-scale components before installation on site. For example, Vaghefi et al. [33] developed a combined nondestructive imaging technology on a bridge deck to yield both surface and subsurface indicators of condition. The authors of [34] proposed an approach to supplement visual bridge inspections by implementing gigapixel technology to promote quality assurance and control in a state bridge management system. Vetrivel et al. [35] identified the damage in buildings based on gaps in 3D point clouds from very-high-resolution oblique airborne images. Park et al. [36] introduced a displacement measurement method based on machine vision technology, which monitored the displacement of high-rise building structures by means of the partition method. Huang et al. [37] proposed a deep-learning-based algorithm called ABCDHIDL, which can automatically detect building changes from multi-temporal HRRS images. However, quality detection and control methods based on machine learning algorithms require a large number of training datasets, which are time-consuming to build.
Researchers have also presented several techniques for the geometric quality assessment of bridges using 3D laser scanning. Guldur et al. [38] detected and documented quantitative information on the condition of bridges by collecting millions of texture-mapped datapoints for the bridges. Cha et al. [39] managed low-volume data obtained from LiDAR for the maintenance of the bridge shape deformation by implementing detailed nodes in an Octree 3D space As stated in An et al. [40], a wireless ultrasonic wavefield imaging (WUWI) technique was proposed to detect hidden damage inside an SBG bridge. Nevertheless, there are no relevant studies on the geometric quality inspection of SBG components.

3. Methodology

This section illustrates the developed technique for assessing the geometric quality of prefabricated SBG components using 3D laser scanning and BIM. Figure 1 shows the overview of the proposed technique, which included four steps: (1) data preprocessing, (2) the extraction of the steel cabin, (3) the extraction of the T ribs (Figure 2a), and (4) geometric quality assessment (Figure 2b). These steps will be illustrated in Section 3.1, Section 3.2 and Section 3.3, respectively.

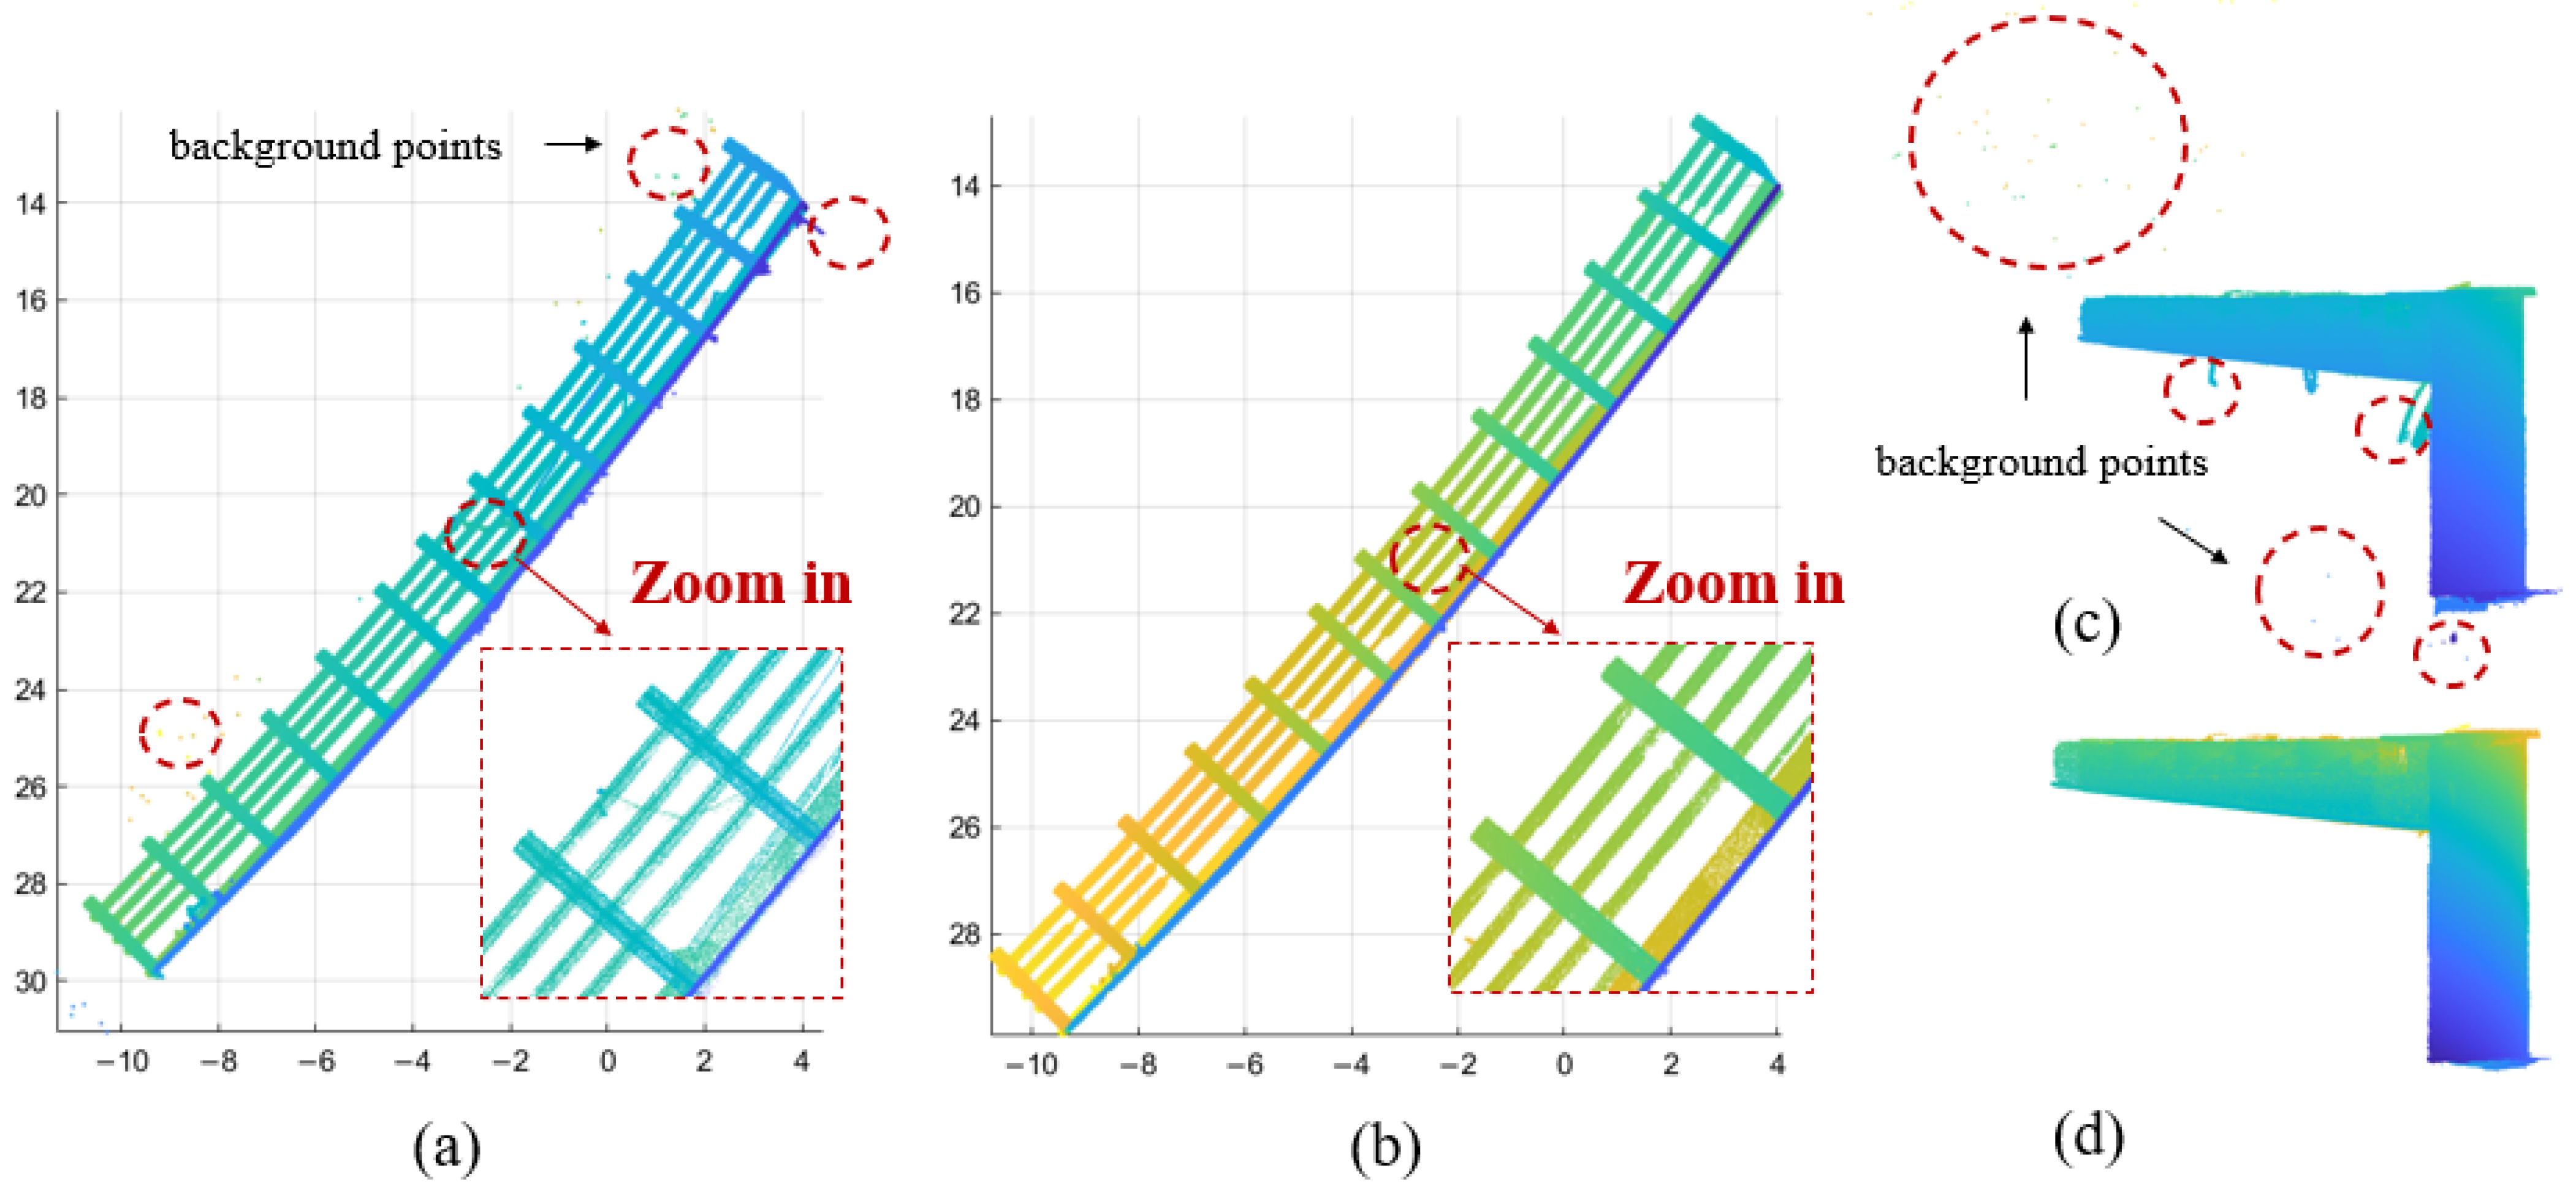
3.1. Data Preprocessing

This step aimed to remove background points and mixed-pixel points while preserving valid points. Due to the complex structure of SBGs, multiple scans are usually required from different locations to obtain complete and uniform-density point-cloud data. The registration method based on the target sphere was adopted to unify the point-cloud data scanned from multiple locations into the same coordinate system for subsequent processing. Once all the laser-scanned data were collected, noise removal was conducted to extract the valid points pertaining to the SBG. There were three types of points in the laser scanning data of the measured object: valid points on the surface of the target object, background points, and mixed-pixel points located between the target plane and the background plane. In this study, the preprocessing step filtered noise using the density-based spatial clustering of applications with noise (DBSCAN) algorithm [41], which can not only detect and distinguish mixed pixels, but also remove mixed pixels and background points at the same time.
As shown in Table 1, DBSCAN requires two parameters, ε and MinPts, which represent the minimum number of neighborhood points and the threshold of neighborhood distance, respectively. The selection of the MinPts value has a great impact on the clustering results. If MinPts is too small, some mixed pixels may be considered as boundary points and will not be used for the further expansion of the class. When the value is too large, some mixed pixels may not be removed due to the increase in the number of neighborhood points. As shown in Figure 3, assuming that the points of the measured object were evenly distributed, the black hollow points are the valid points on the target object, the green points are the mixed-pixel points, and the yellow points are the background points. When horizontal or vertical, the minimum distance between two valid neighborhood points is D 1 , and when in the diagonal direction, the maximum distance between two valid neighborhood points is D 2 . The distance between the valid points and the mixed-pixel points, between the mixed-pixel points and the background points, and between the background points themselves are D 3 , D 4 , and D 5 , respectively, which satisfy D 1 < D 2 < D 3 , D 4 > D 5 . The maximum distance between adjacent valid points is D 2 , so the parameter ε of DBSCAN should be greater than D 2 ; considering the safety factor, the parameter ε is 1.2   D 2 . Since D 3 > 1.2   D 2 , point D was not density-reachable at point A and was not included in this cluster. Then, the final background points and valid points were clustered into two clusters, and the mixed pixels were marked as noise.

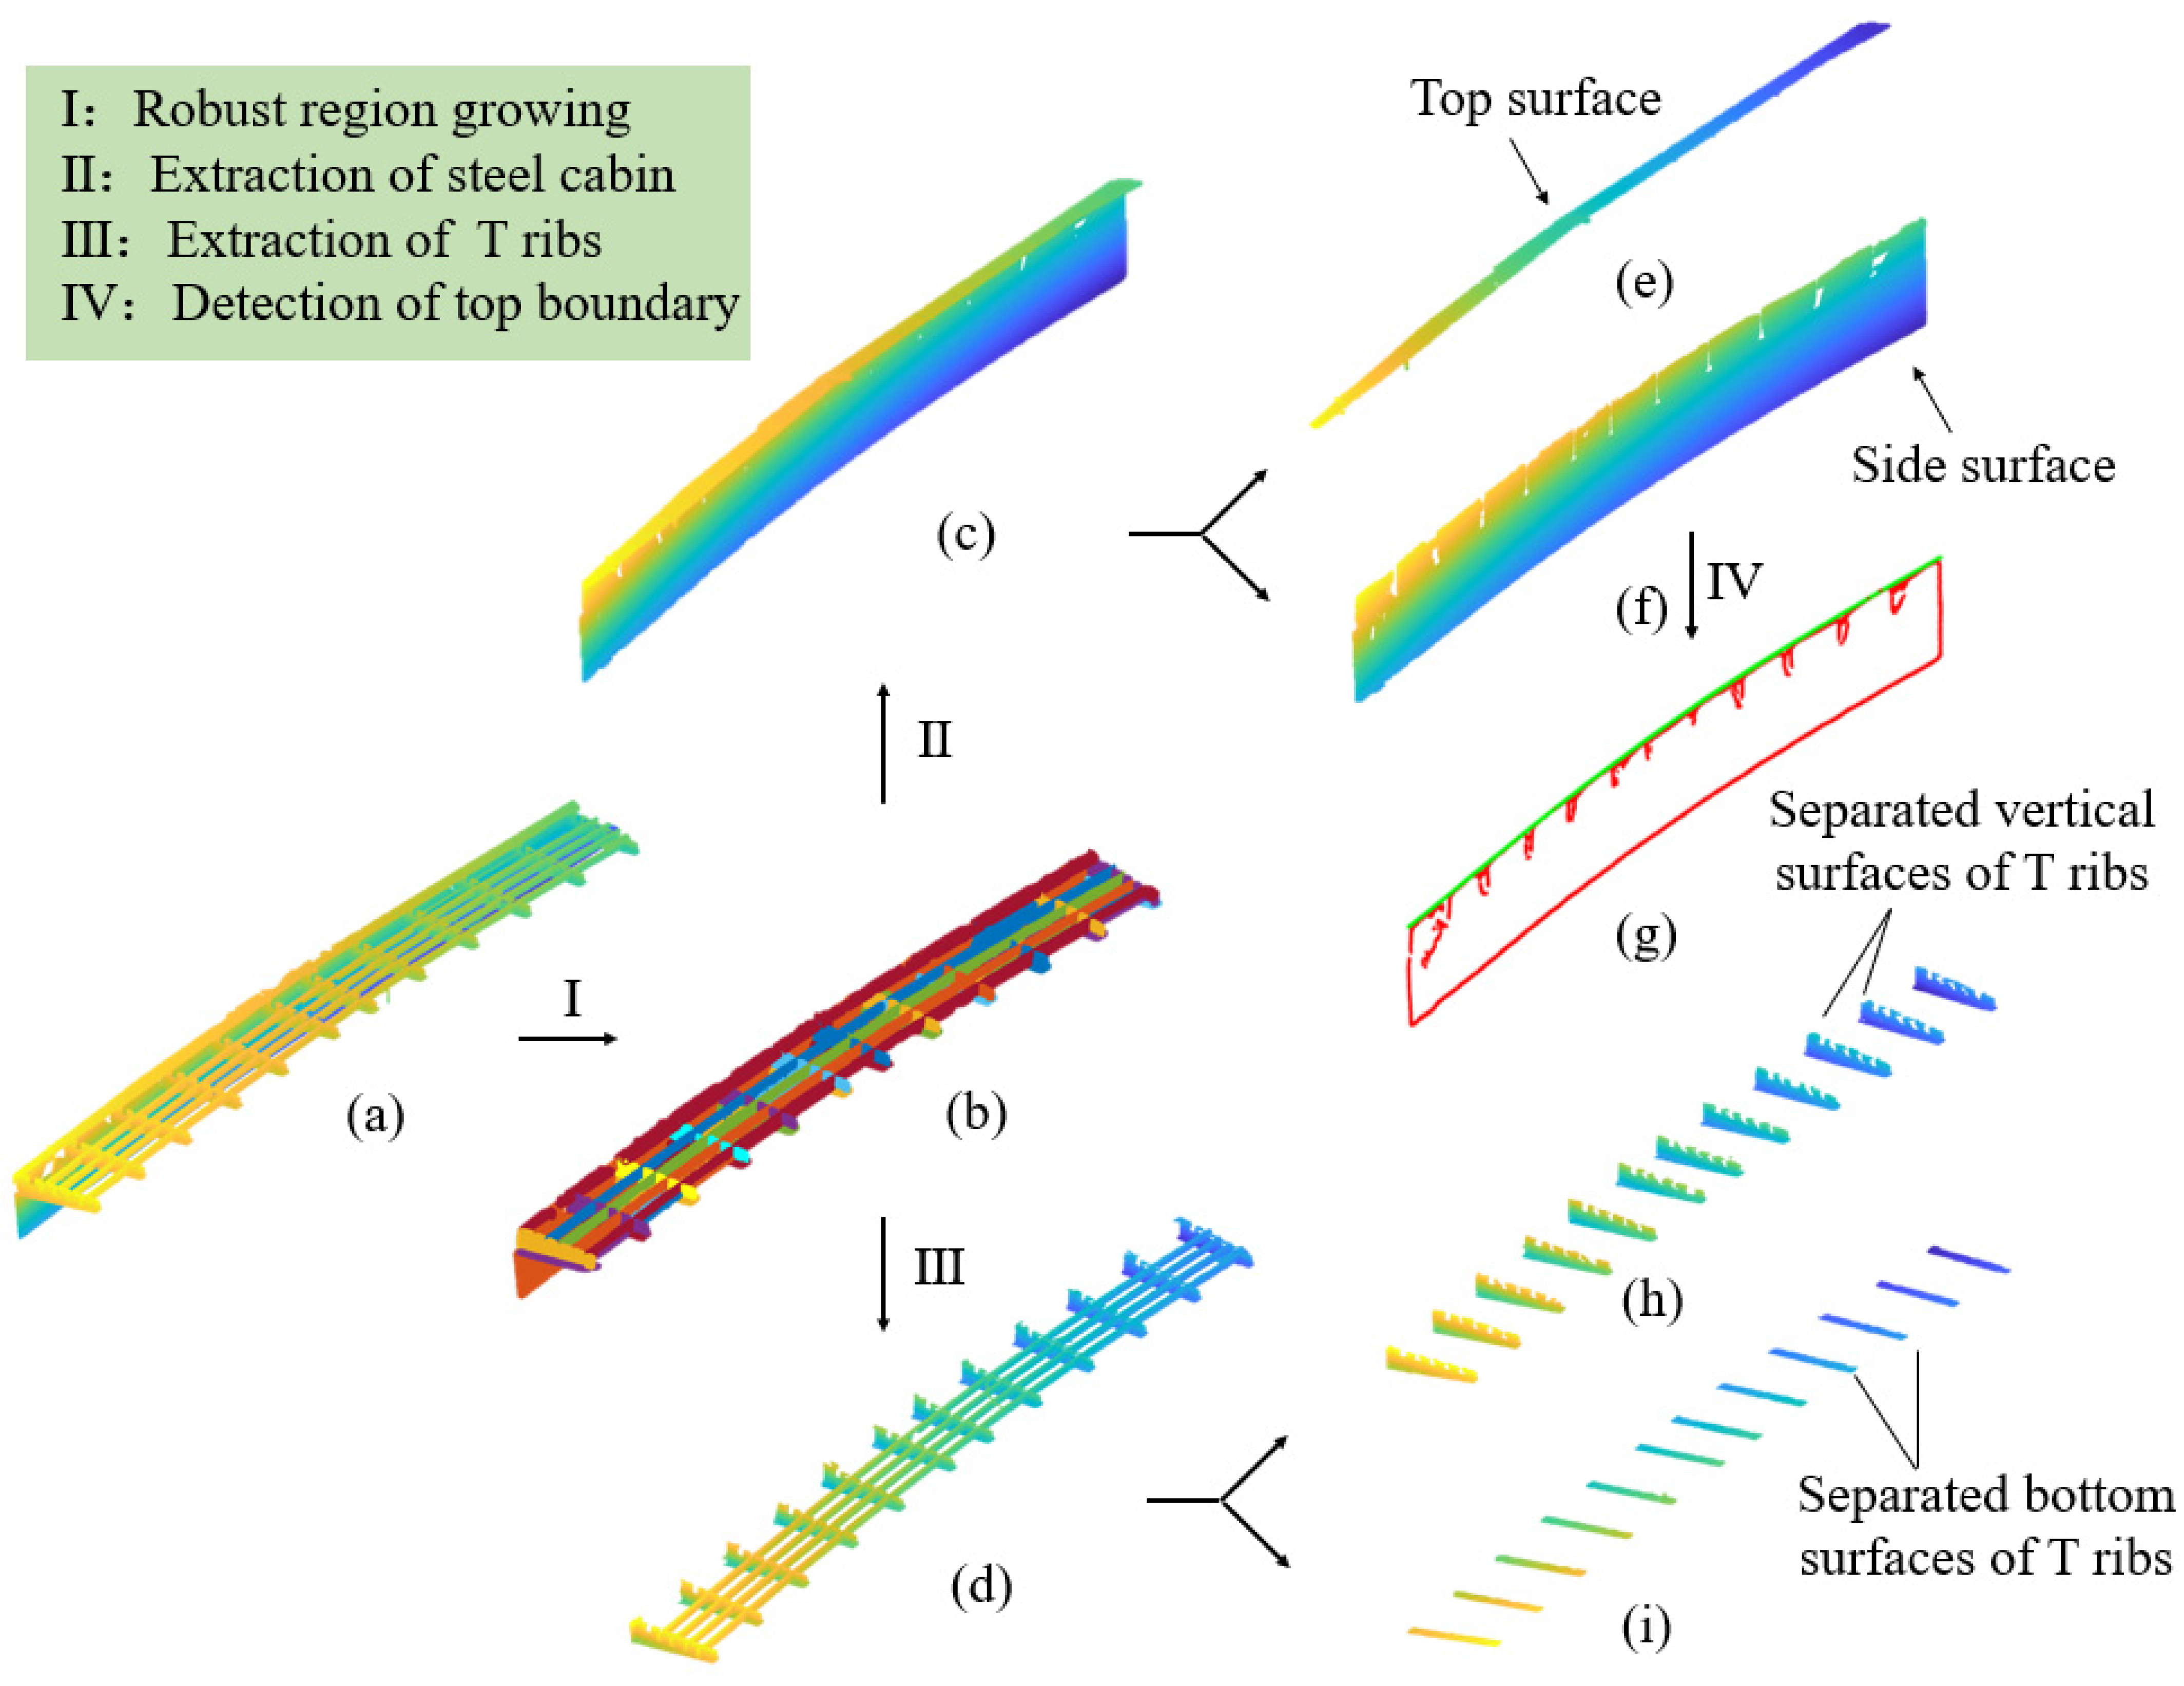
3.2. Extraction of the Steel Cabin

For the extraction of the steel cabin composed of top and side surfaces, the proposed method comprised three steps: (1) the extraction of the side surface; (2) the recognition of the top surface based on plane fitting; and (3) the extraction of the intersection line.

3.2.1. Extraction of Side Surface

This step aimed to extract the side surface of the steel cabin using region-growing segmentation based on the proposed robust PCA. Point-cloud normal vector estimation based on plane fitting is the most commonly used method, having been initially proposed in [42] as the core of a surface reconstruction algorithm. The algorithm estimates the normal vector of a point p i by fitting a local plane under the assumption of planarity in the region of the k-nearest neighbors of a given point, which is known as PCA [43]. Many region-growing methods based on PCA have been developed and implemented. Kawashima et al. [44] introduced a normal-based region-growing method to extract the points on a piping system and segment the points to each pipe; however, the recognition accuracy of the junction parts was low, and the false-positive recognition rate was high. Despite its outperformance of classical PCA in estimating the normal of a point located in highly curved regions or sharp features, DMNE, the method proposed by Khaloo et al. [45], requires more computational time.
Due to the influence of outliers and varying point-cloud densities, the normal vector of the point-cloud data based on k-nearest neighbor plane fitting presented deviation. In this algorithm, the robust PCA was designed to estimate the normal of each point with the minimum covariance determinant ( M C D ) estimator. As shown in Equation (1), M C D was used to obtain the robust mean value and covariance estimators. As stated by Nurunnabi et al. [46], the robust distance ( R D ) is used to measure the distance between each sample point and the center, which is less sensitive to noise. The ( R D ) was calculated according to Equation (2), and whether the point was an outlier was judged by comparing the distance from the point to the sample center and the parameter threshold size. Subsequently, the PCA algorithm was used to solve the minimum eigenvalue of the M C D of each non-outlier point, and the eigenvector corresponding to the minimum eigenvalue was used as the normal vector of the point.
M C D = k M C D e , n , p i e M C D x i u ^ M C D x i u ^ M C D e 1
R D x = x u ^ M C D t     ^ M C D 1   x u ^ M C D  
In Equation (1), e represents the volume of data, k M C D e , n , p is a proportionality constant used to ensure the consistency and unbiasedness of the covariance estimator, and u ^ M C D is the position estimated by the M C D algorithm. In Equation (2), x is the matrix composed of sample points. Once the point-cloud normal was estimated, the region-growing segmentation process first sought a seed point p i and then used the region-growing test criteria to grow the point by incrementally adding new points. When the growing of the first seed point was complete, a new seed point was added for the growing of the next segment. In this algorithm, the selection of seed points was completely automatic. The point with the smallest curvature was used as the first seed point, and if the distance from the neighborhood point to the seed point was within the distance parameter threshold d, the neighborhood point was the seed point. The threshold d had to be 1.2 times the maximum distance between adjacent points, and the distance between adjacent points was determined by the scanning resolution selected by the laser scanner. When the angle between the normal vector of any points and the normal vector of the seed point pi was less than the threshold, the point was assigned the same label as the seed point. The SBG was segmented through the robust region-growing algorithm as shown in Figure 4a. As the normal vector difference of the side point cloud of the steel cabin was very small, the side point cloud was divided into a cluster. The extracted side of the steel cabin is shown in Figure 4b.

3.2.2. Extraction of Top Surface

The purpose of this step was to extract the top surface of the steel cabin with the M-estimator Sample Consensus (MSAC) algorithm [47], which is a variant of the RANSAC. The MSAC algorithm constructs a plane by means of minimizing the loss cost function C f = ρ e i 2 defined in Equation (3) instead of using fixed distance thresholds from points to the plane [45], where e i indicates the error term for the i-th observation and T represents the distance threshold from a point to the estimation plane. Thus, ρ e i 2 is illustrated as:
ρ e i 2 = e i 2 ,         e i 2 < T 2 T 2 ,         e i 2 T 2  
As stated in Nurunnab et al. [48], the MSAC algorithm can achieve a robust evaluation result without any further computational burden. During the execution of the algorithm, MSAC initially constructs a plane according to the detected inliers and grows the plane until no points can be added. The extracted top surface of the steel cabin is shown in Figure 4c.

3.2.3. Detection of Top Boundary

After the extraction of the side and top planes, the improved mean shift algorithm without any parameter setting was directly used to three-dimensionally detect the top boundary of the steel cabin [49], which was equivalent to the intersection between the side and top surfaces. The Gaussian kernel-based mean shift algorithm included two main steps. The first was to calculate the offset vector ( M x ), as illustrated in Equation (4):
M x = 1 k x i   S h ( x x i )
where S h is a high-dimensional sphere with a center point x and a radius h, and k is the number of points in the S h range. The second was to calculate the distance ( d i ) between the sample point and its corresponding pattern point obtained from the mean shift vector, before determining whether the sample point was a boundary point according to the size of d i . The extracted boundary of the steel cabin and the straight line fitted from the boundary points through the least-square method are shown in Figure 4d.

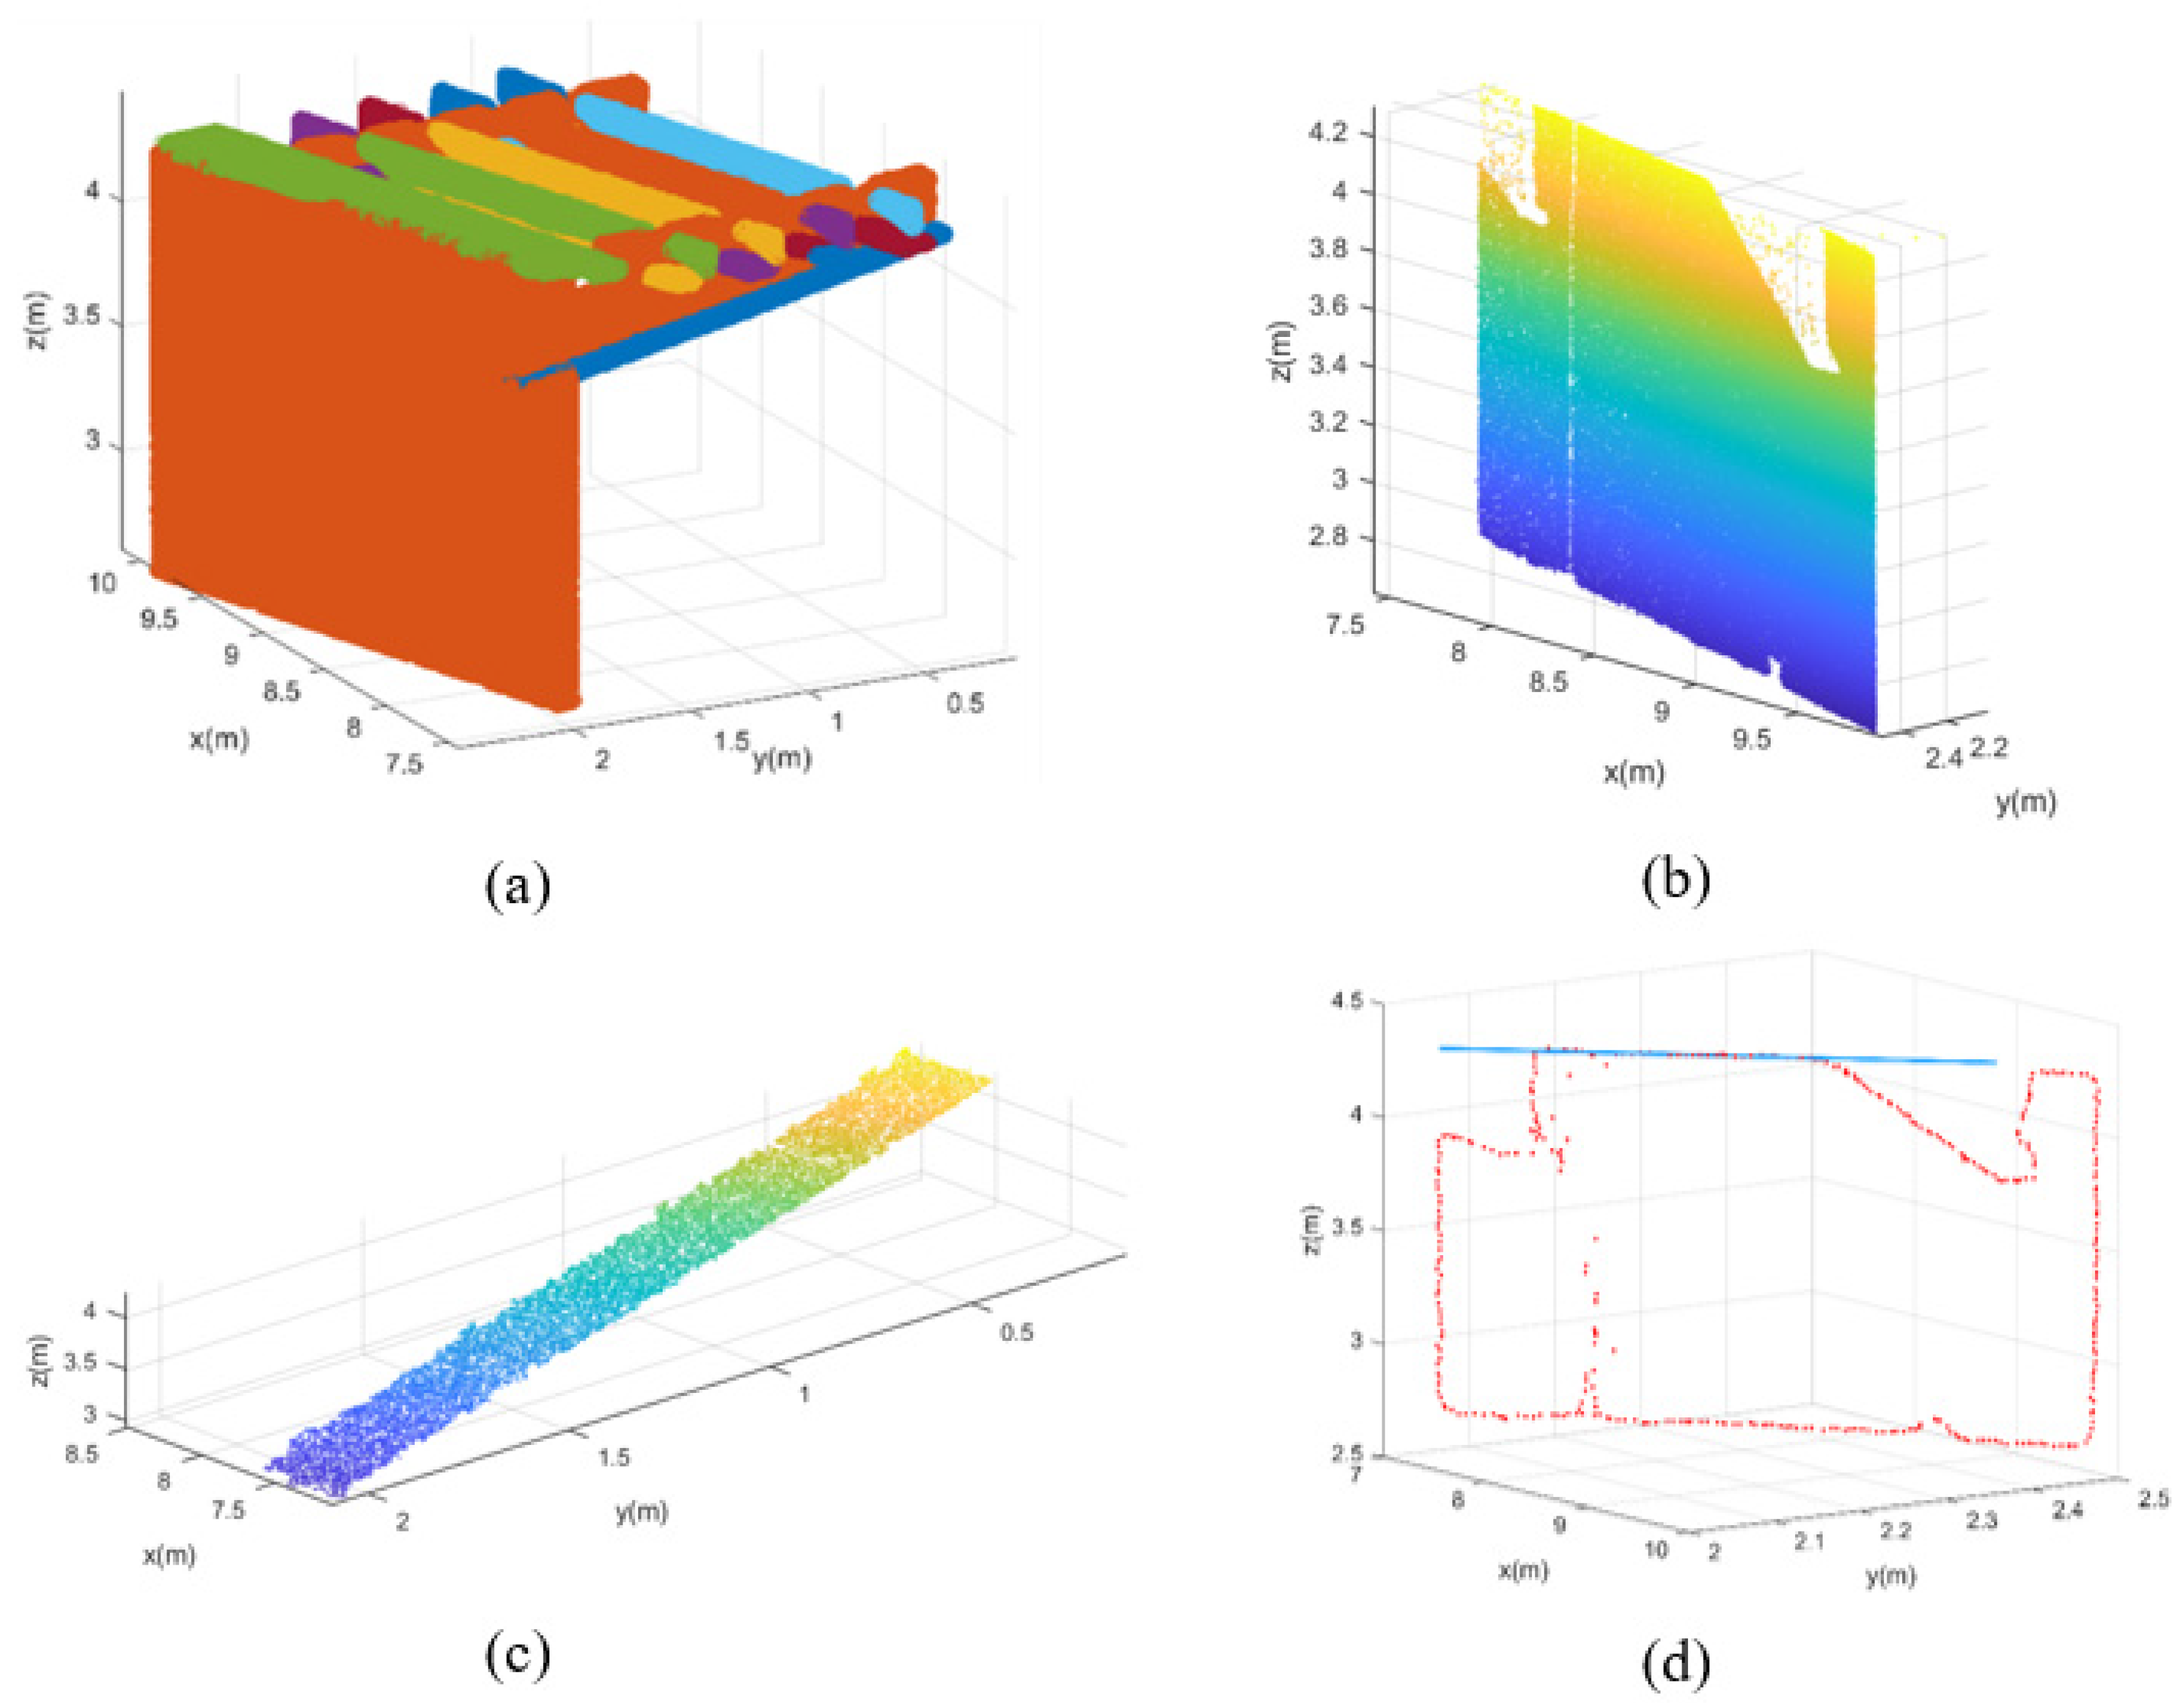
3.3. Extraction of the T Ribs

3.3.1. Extraction of Scanned Data Related to T Ribs

Adjacent T ribs were overlapped by multiple I beams, which were inlaid on the vertical surface of the T ribs (as illustrated in Figure 3). In addition, the I beam was composed of a bottom surface and a vertical surface, whose geometric properties did not differ much. Therefore, the critical step in T-rib extraction was to detect the I beams, which involved two main steps: (1) the extraction of the scanned data related to the T ribs and (2) the recognition of the I beams and T ribs.
As the steel cabin was extracted in Section 3.2, the scanned data related to the T ribs could be obtained by subtracting the extracted point-cloud data of the steel cabin from the scanned data, as shown in Figure 5a. The robust region-growing algorithm proposed in Section 3.2.1 was then used to distinguish between I beams and T ribs, and the results are shown in Figure 5b. Without the influence of the normal vector of the steel cabin, the bottom and vertical plane of each I beam had different attribute labels after the robust cluster-growing process. Figure 5c presents the identified I beams, and the extracted T ribs are shown in Figure 5d.

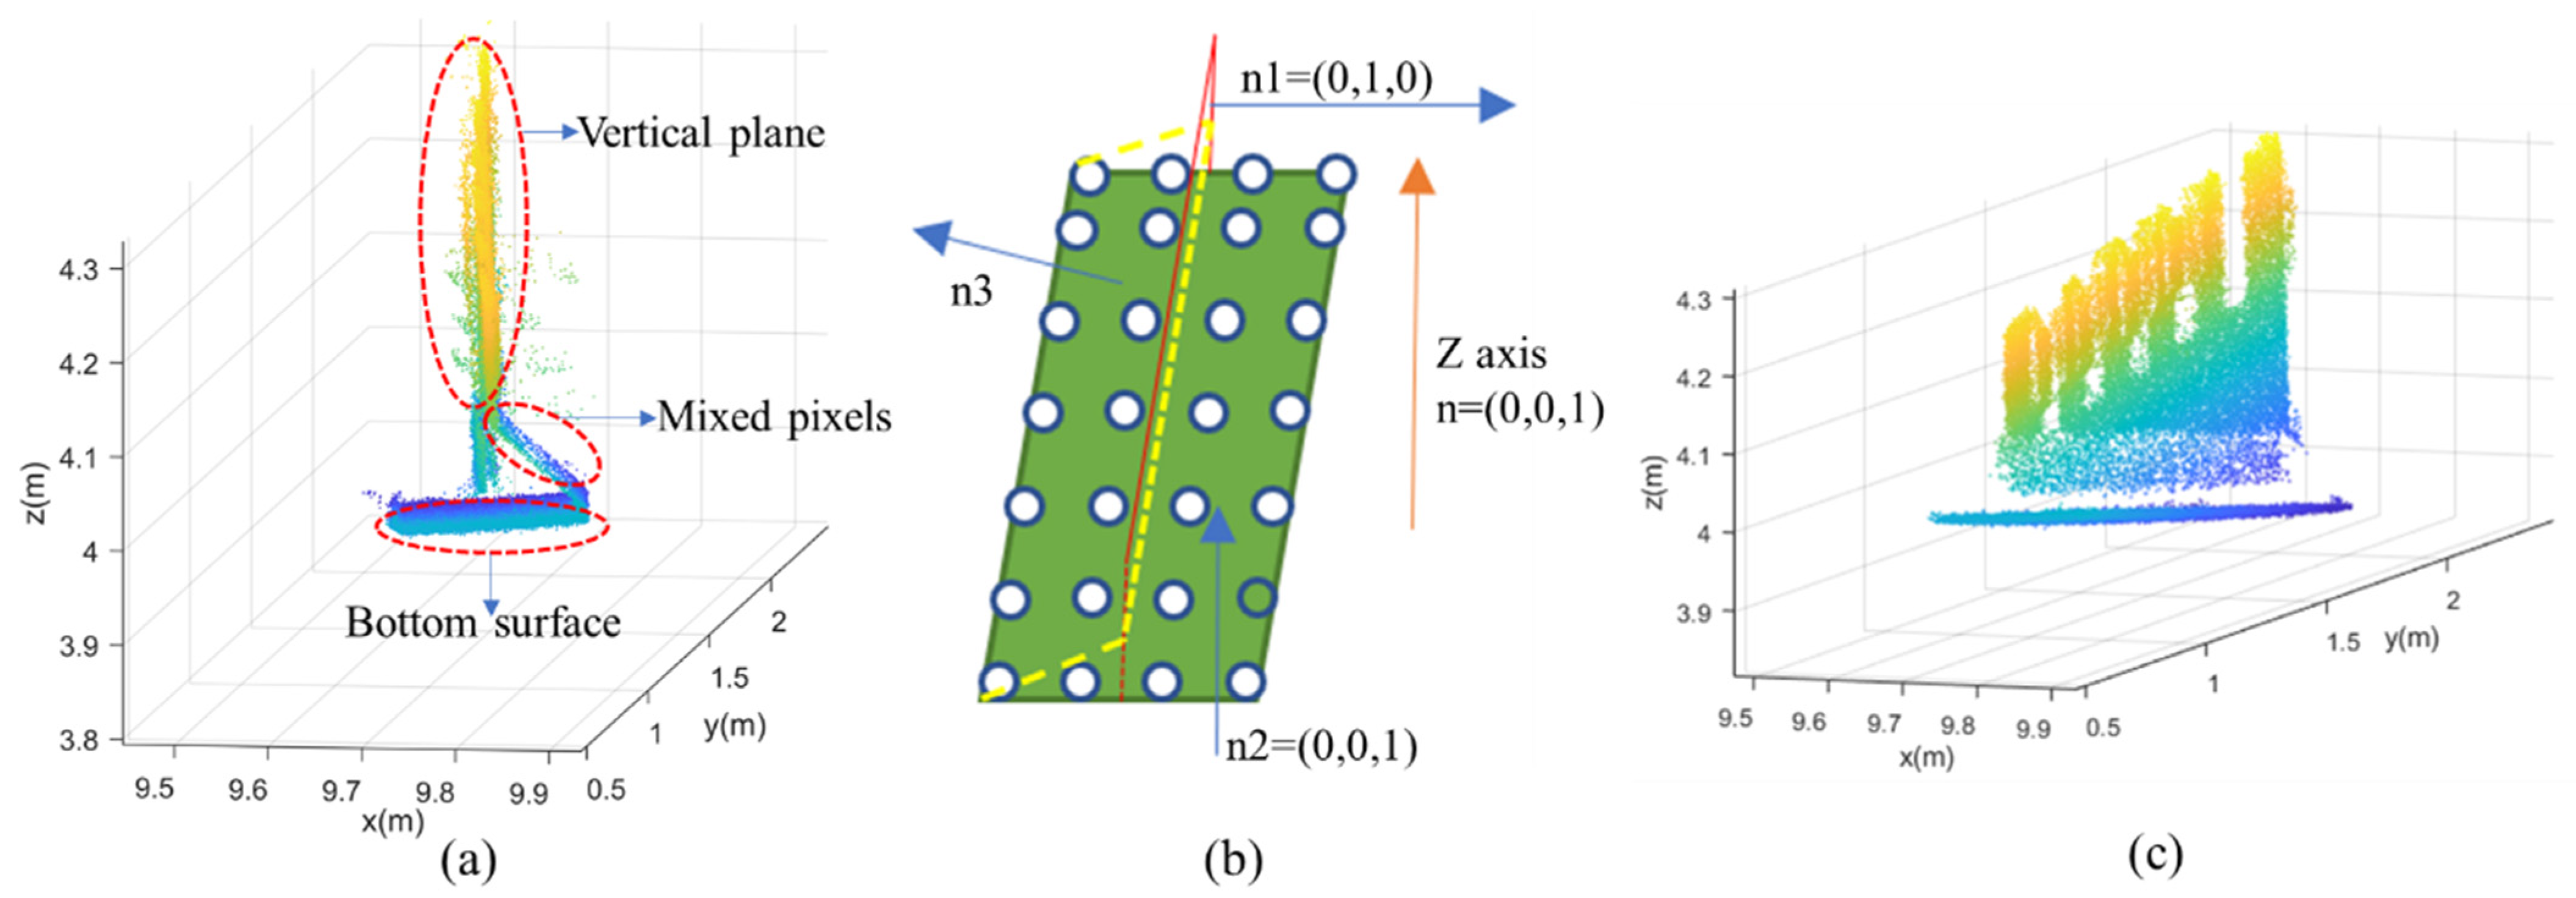
3.3.2. Mixed-Pixel Removal for T Ribs

The individual T rib extracted in the last step was composed of two mutually perpendicular planes. However, the vertical plane of the T rib was not complete and contained numerous mixed pixels due to the occlusion of the bottom surface during scanning, as shown in Figure 6a. Therefore, the mixed pixels that were mistakenly detected as a plane between the vertical plane and the bottom plane needed to be removed. According to the spatial position relationship between the mixed pixels and the two perpendicular planes, a denoising algorithm based on the angle between the z-axis and the normal vector was proposed to remove the mixed pixels. The angles between the normal vector and the z-axis of the bottom plane and vertical plane point clouds were close to 0 and 90 degrees, respectively. Nevertheless, the angle between the normal vector of the mixed pixels and the z-axis was about 60 degrees after angle measurement, as shown in Figure 6b. If the angle was within the threshold, the points would be recognized as mixed pixels and removed (Figure 6c).

4. Geometric Quality Assessment

Geometric dimension consistency control technology based on the Scan-vs-BIM system was applied to assess whether the geometric quality of the steel cabin conformed to the design requirements [32]. The technology involves three main steps: (1) data format conversion, (2) coarse registration and fine registration, and (3) the calculation of the deviation. These steps are further explained in Section 4.1.1, Section 4.1.2 and Section 4.1.3, respectively.

4.1. Assessment of Steel Cabin

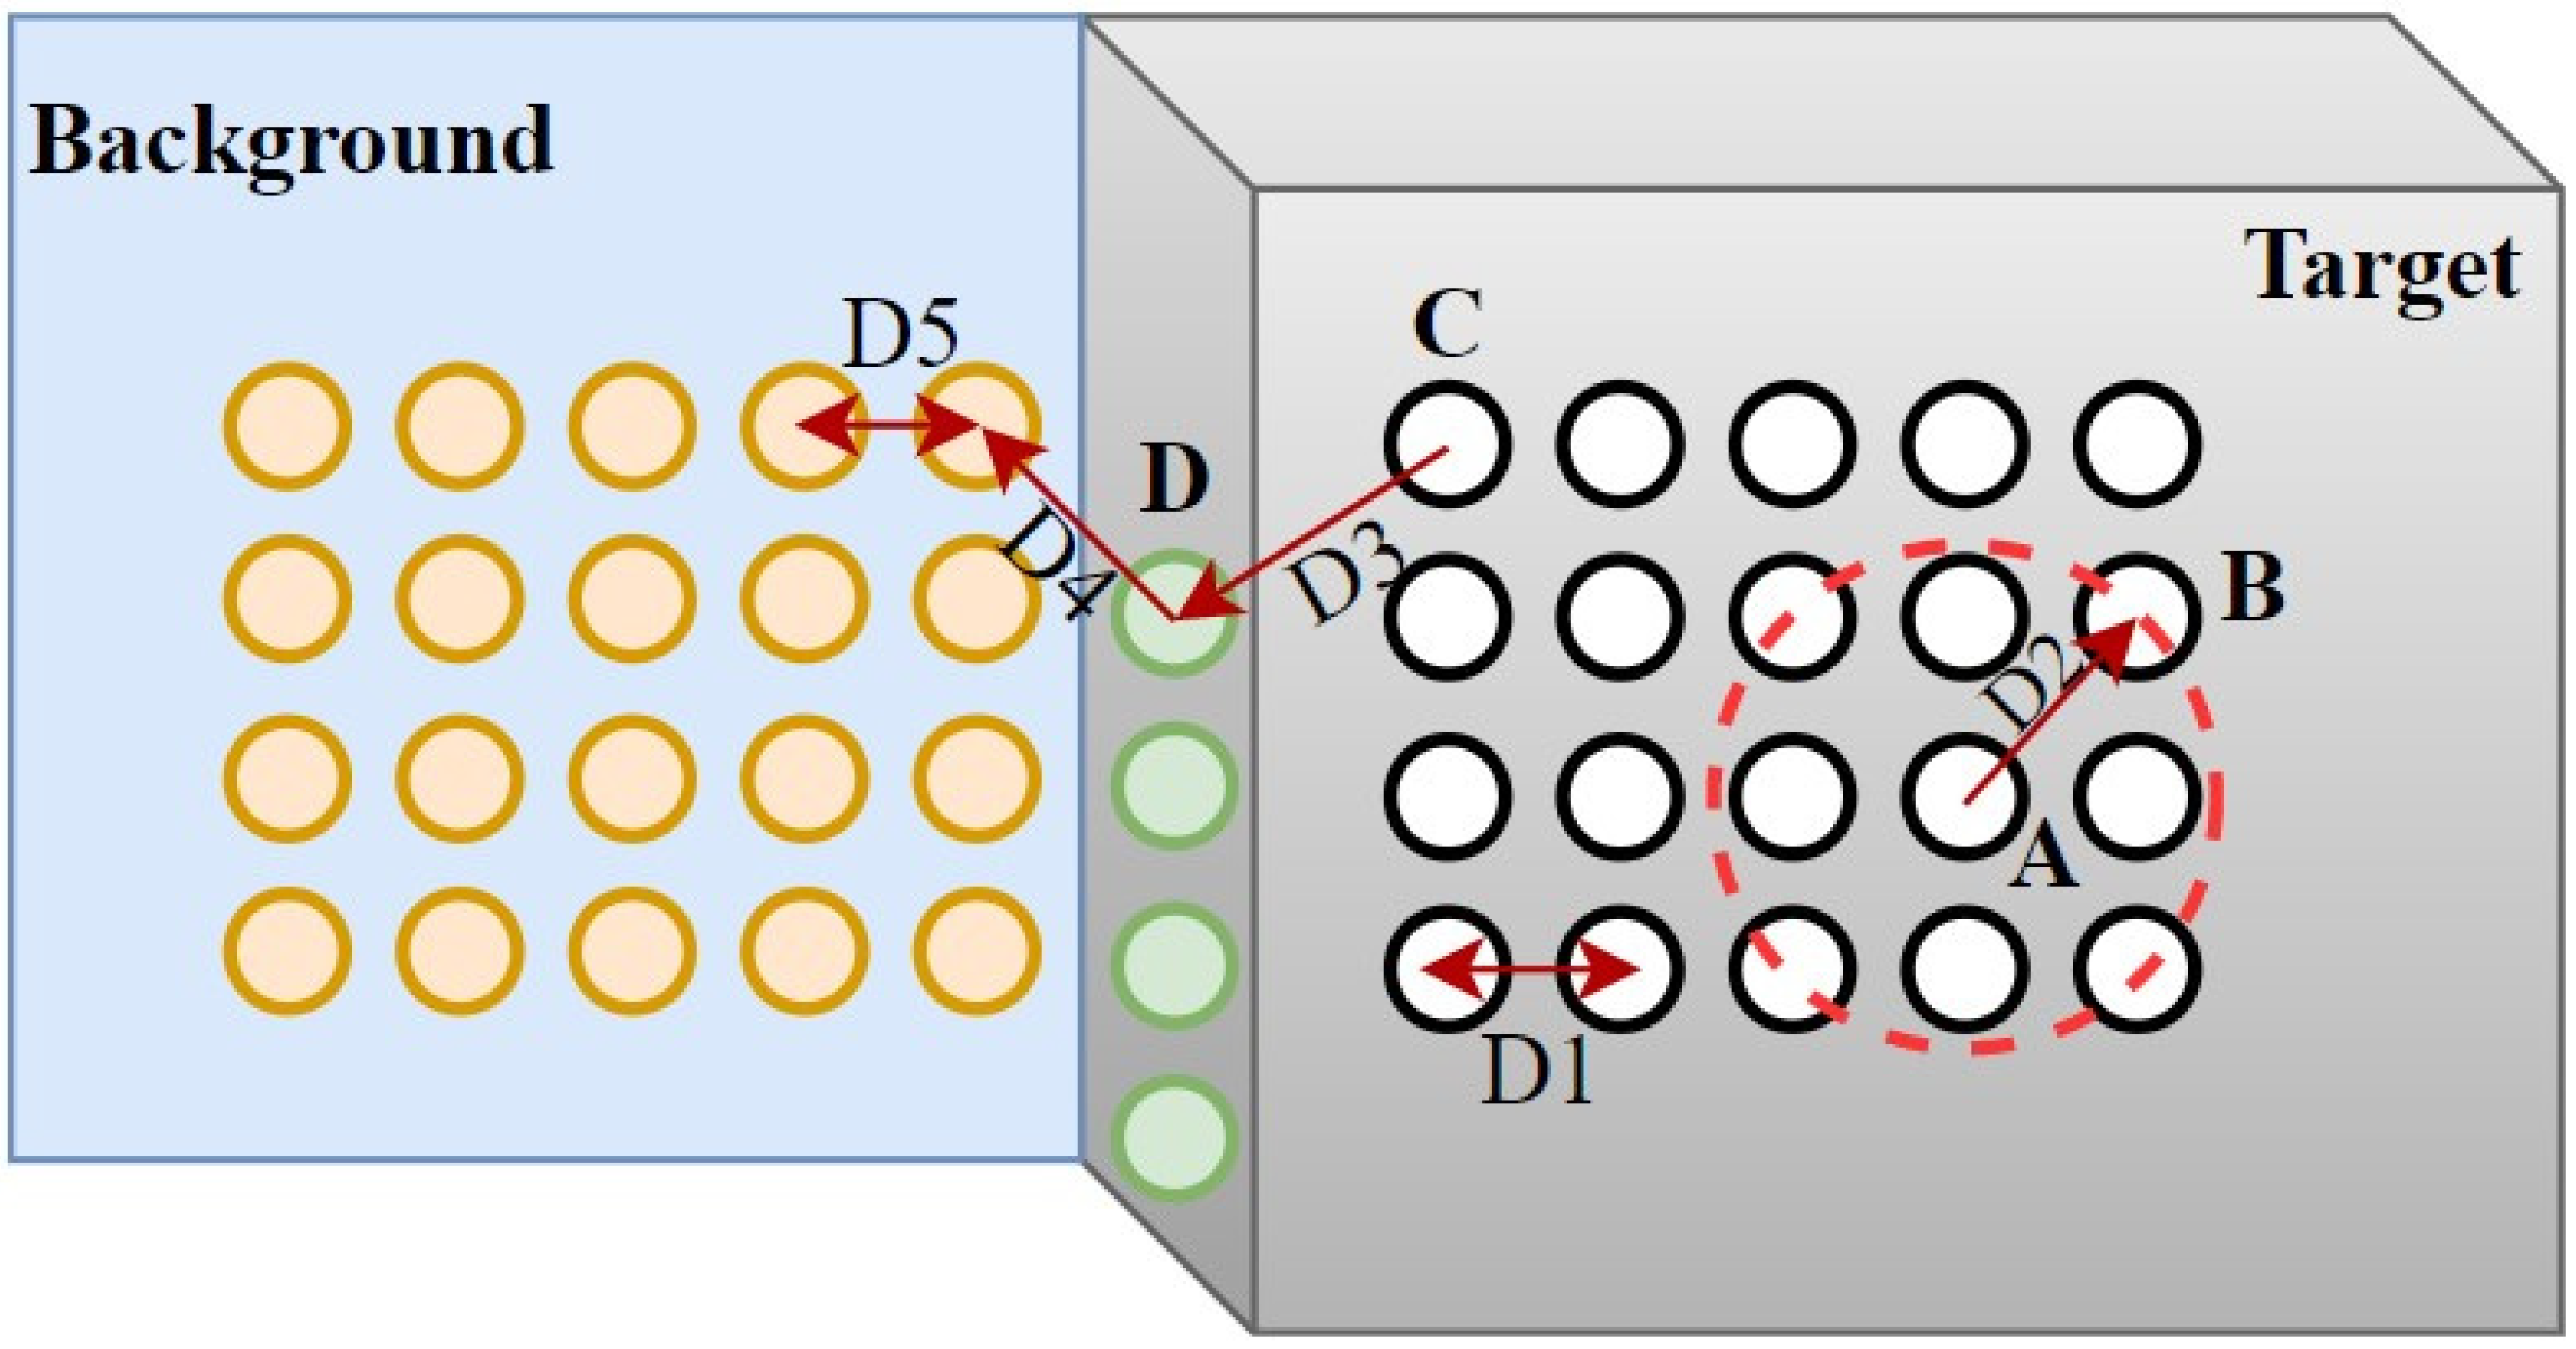
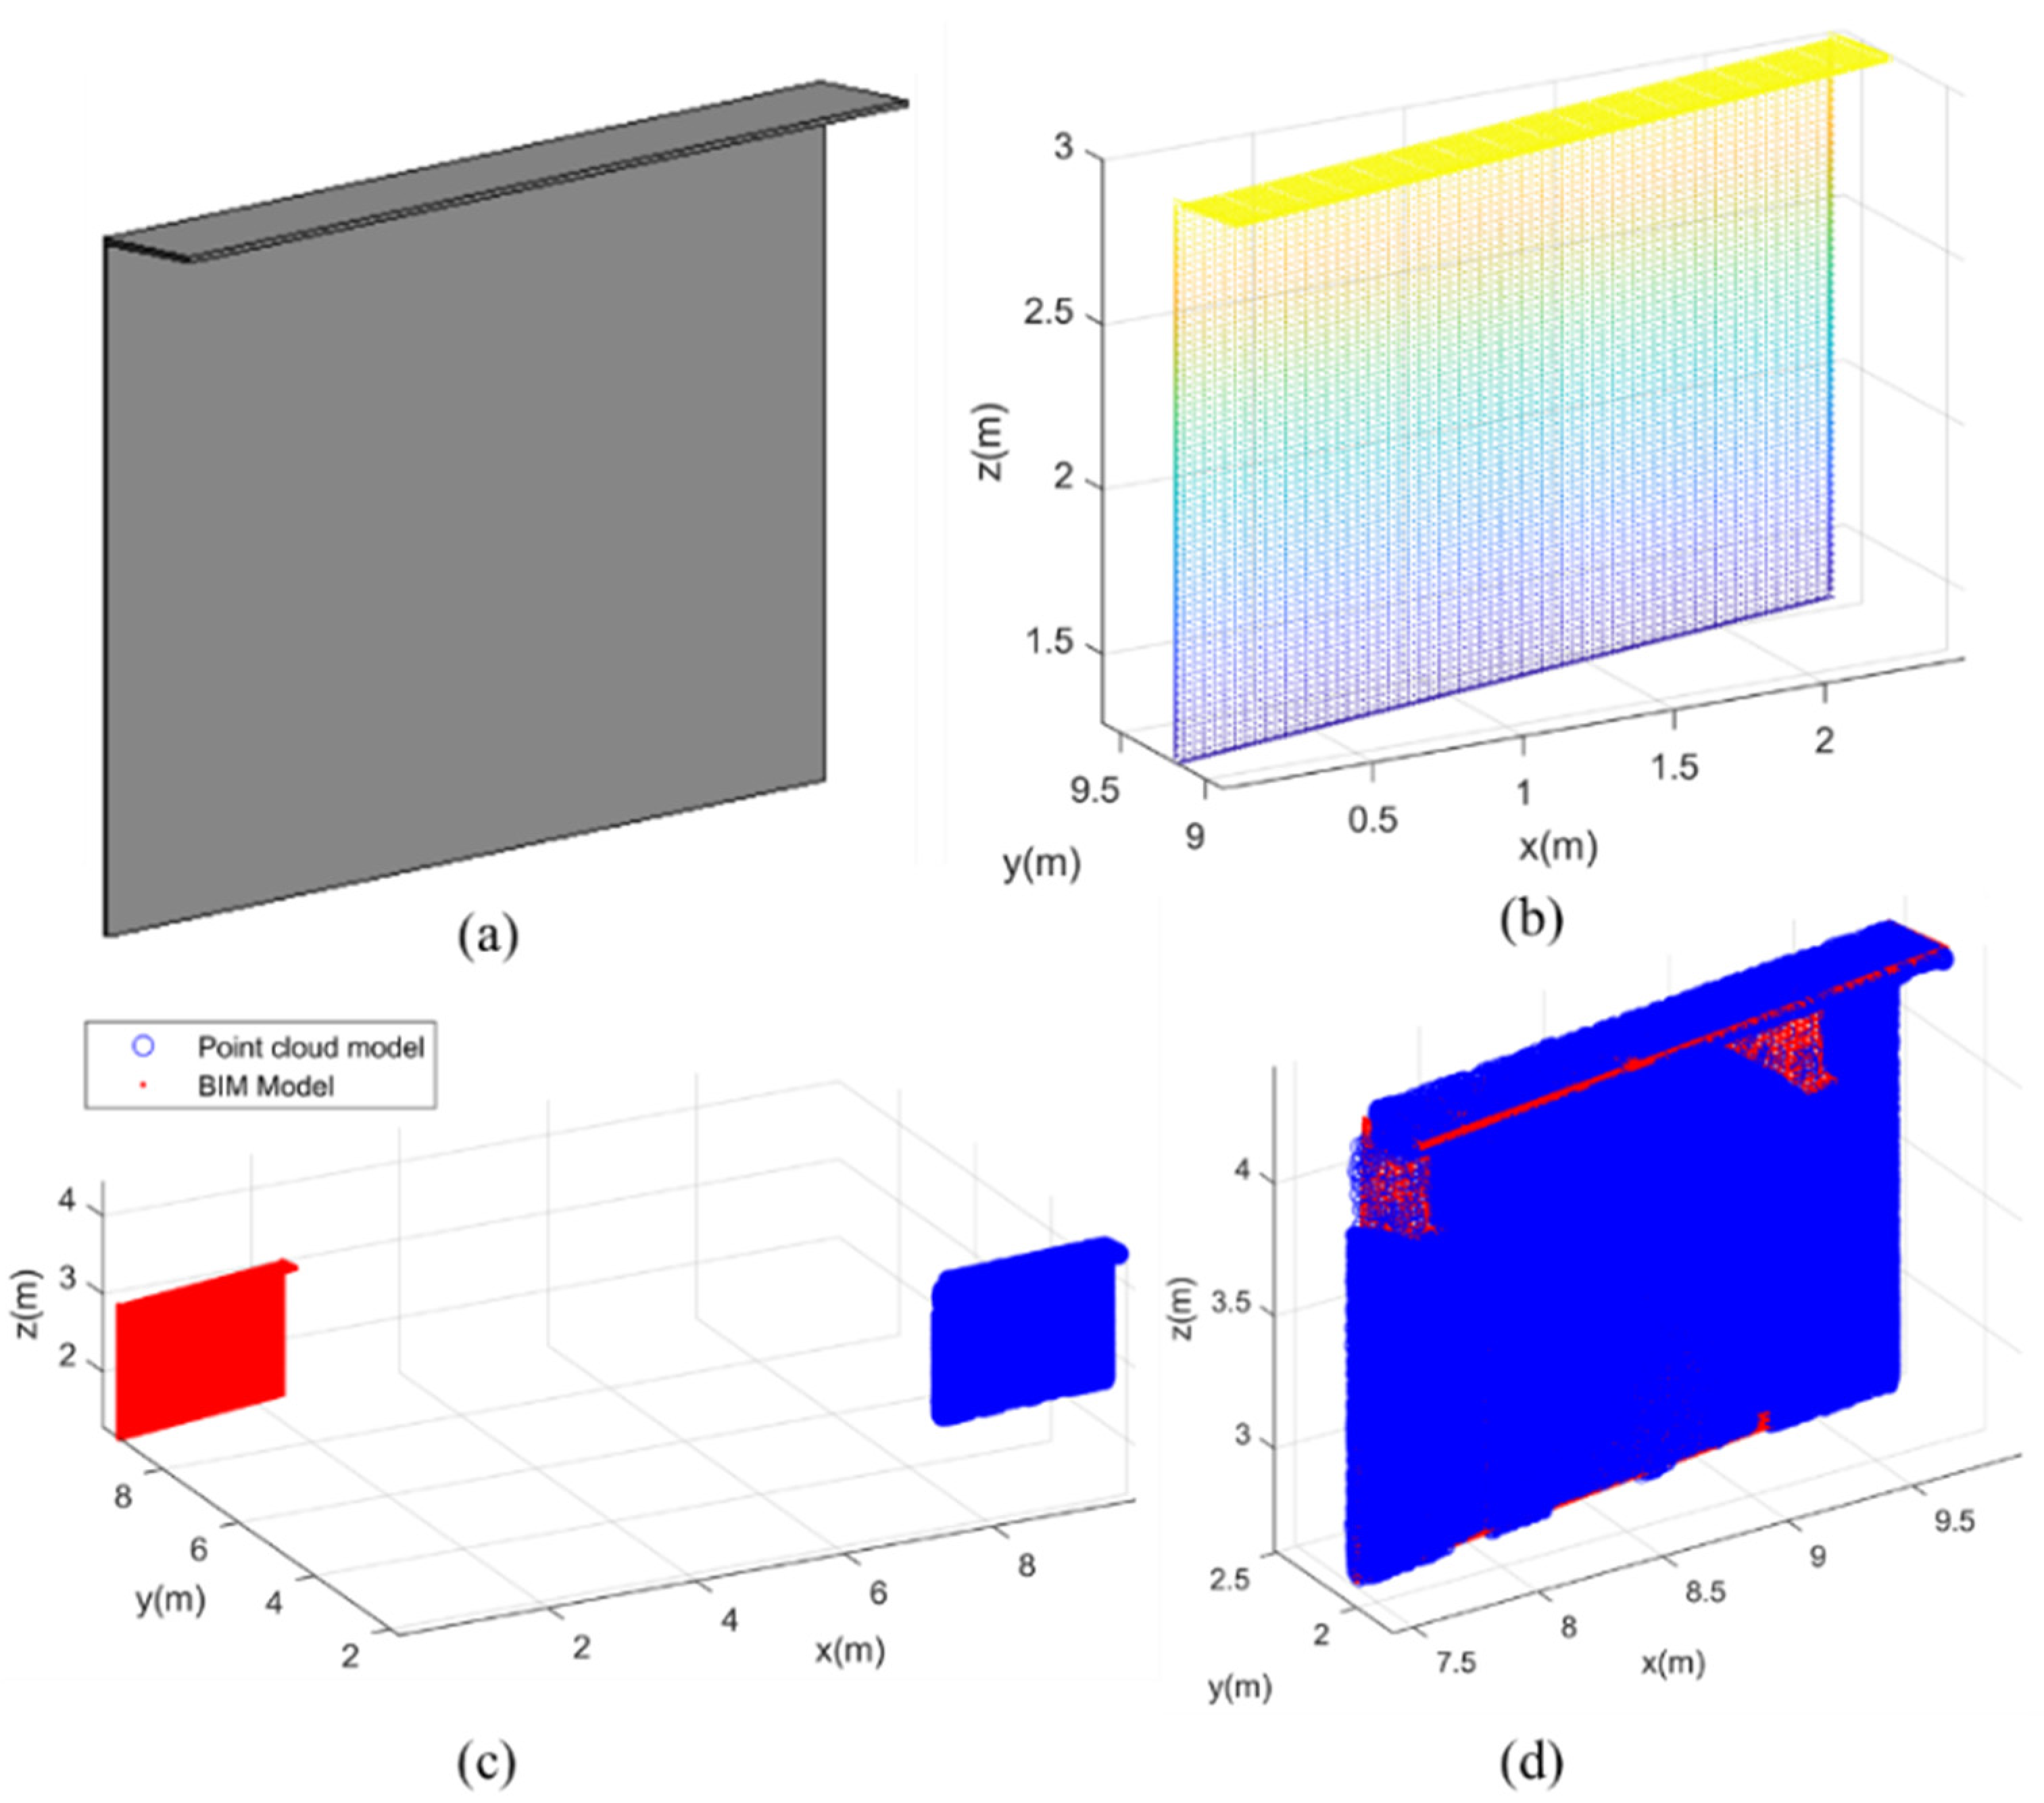
4.1.1. Data Format Conversion

To compare the as-is and as-designed data, the as-designed BIM model of the steel cabin needed to be converted to a point-cloud model. Therefore, the BIM model was first converted into a transitional data format, called STereoLithography (STL), which stored 3D geometric information for the target object through gridding. Then, the plane subdivision scheme based on the boundary midpoint was applied to obtain the 3D point cloud from the STL mesh. This plane subdivision scheme uses the midpoint subdivision matrix to iteratively segment the control mesh, which can be refined continuously to increase the number of points. By controlling the number of iterations, the non-uniform grid algorithm was used to subsample the identified point-cloud data, so the density of the generated point cloud was equivalent to the density of the laser-scanned data. The BIM model and the generated point-cloud model of the steel cabin are shown in Figure 7a,b.

4.1.2. Coarse Registration and Fine Registration

Scan-vs-BIM aims to match as-is point-cloud models with as-designed BIM models. A RANSAC-based coarse registration and iterative closest-point (ICP)-based fine registration process was proposed for alignment.
There were several error point pairs at the initial points of the boundary features. In order to improve the matching accuracy and the convergence speed, the RANSAC algorithm based on a distance constraint was applied to remove the error point pairs. Firstly, three corresponding point pairs were randomly selected. The rotation matrix of rigid body transformation and the distance error of the remaining points were calculated, respectively. If the distance error was less than the threshold error, the point was considered a sample point; otherwise, it was considered a non-sample point. The above steps were repeated until the upper bound of the number of iterations was reached. The number of points in the sample under different rigid transformation models was calculated, and the model with the largest number of sample points was input to calculate the point-cloud registration operation. Then, the ICP algorithm was used for fine registration [50], which aligned the boundary feature point sets to obtain the transformation matrix through minimizing the root mean square error (RMSE) between them. In this study, the as-designed BIM model with geometric information was set as a reference, while the as-is point-cloud model was registered with the BIM model to calculate the discrepancy. The matching of the steel cabin model with coarse and fine registration is shown in Figure 7c,d.

4.1.3. Calculation of Deviation

Based on the registration results, the degree of matching ( D O M ) and the degree of completeness ( D O C ) defined in Equations (5) and (6) were used as the geometric quality assessment metrics, having been initially presented in Wang et al. [14].
D O M = N m a t c h / N t o t a l
D O C = A m a t c h / A t o t a l
where N m a t c h refers to the number of matching points between the as-designed model and the as-is model, and N t o t a l indicates the total points; thus, D O M refers to the percentage of matched points. In addition, A m a t c h refers to the area that matches the as-designed model, and A t o t a l refers to the total area of the as-designed model; thus, D O C denotes the percentage of areas that successfully matched the as-designed model. According to the pre-set D O M and D O C thresholds, the geometric quality of components could be judged by calculating the values of D O M and D O C for the model after registration.

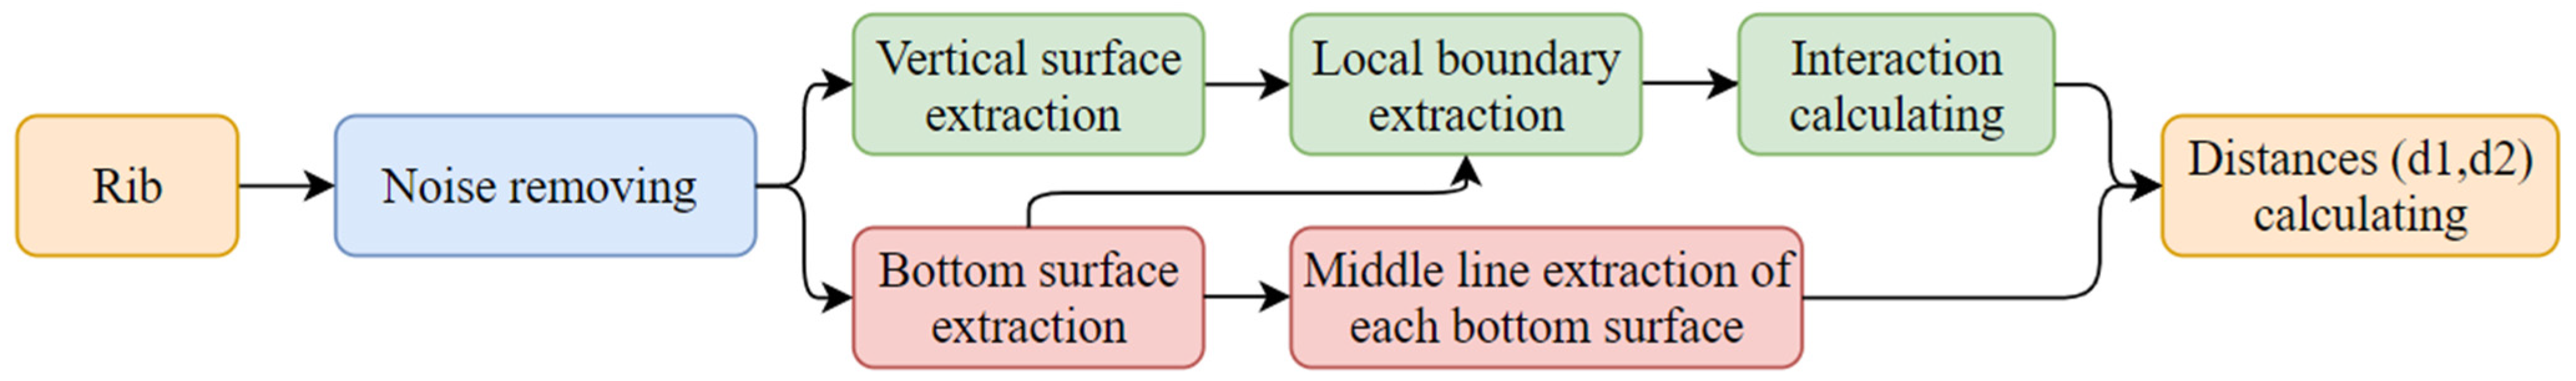
4.2. Assessment of T Ribs

This step aimed to assess the geometric quality of the T ribs, including their location and orientation. Table 2 shows the location and orientation inspection checklist for the T ribs, which are illustrated in Section 4.2.1 and Section 4.2.2 respectively.

4.2.1. Calculation of Locations

After removing the mixed pixels in Section 3.3.2, the locations of the T ribs were assessed to determine whether each T rib was installed in the correct location. As each T rib is manually welded by workers, the actual location of the as-is T ribs may be different from the as-designed location. Hence, it is necessary to evaluate the geometric quality of the T ribs after welding.
As depicted in Figure 2a, the three planes, including the side surface of the steel cabin, the bottom surface of the T rib, and the vertical plane of the T rib, intersected at a common point, which could be extracted by calculating the intersection point of the three intersecting planes or extracting the coplanar point based on Gaussian map clustering [51]. However, due to the large size (19 meters in length and 4 meters in width) of the side surface of the steel cabin in the actual project, as described in Section 5, and the fact that the side surface was not always a regular plane but could be curved in places, the method of obtaining the common intersection by fitting the intersecting planes was not effective in this case. For an individual T rib, the bottom and vertical surfaces have a unique intersection point with the side-surface of the steel cabin. Consequently, the location of the intersection point can be used to determine whether the T rib location meets the design requirements. The proposed geometric quality assessment of the T rib location included three main steps: (1) the recognition of planes, (2) the extraction of the intersection points, and (3) the calculation of distances, as shown in Figure 8.
Since part of the point-cloud data was missing due to the occlusion, the bottom and vertical surfaces of the T rib were completely separated, as shown in Figure 9c. Therefore, the bottom and vertical surfaces of the T rib could be extracted by a simple cluster, as show in Figure 9a,b. To quantify the assessment index, the distance from the intersection point to the upper boundary line of the steel cabin extracted in Section 3.2.3 was applied to the location evaluation of the T ribs. A method based on boundary intersection was proposed to extract the intersection of the three planes. Firstly, the boundary of the bottom surface and the vertical surface were detected by the boundary extraction algorithm proposed in Section 3.2.3, as shown Figure 9c,d. Then, the boundaries near the side surface of the steel cabin were extracted by setting the points of interest. Subsequently, the extracted boundary was fitted into a straight line, and the intersection point of the line was the required three-plane intersection point, as shown in Figure 9e.
After extracting the intersection, the last step was to calculate the distances. As shown in Figure 10a, d1 is the distance from the intersection point to the upper boundary extracted in Section 3.2.3. The distance (d2) between adjacent T ribs should also be consistent with the design requirements. The median line of the bottom surface of one T rib was fitted by least squares. Then, the distance between the center points on another T rib and the fitted line was calculated, and the average distance (d2) was obtained, as shown in Figure 10b.

4.2.2. Calculation of Orientations

This step aimed to assess the direction of the T rib that formed a fixed angle with the side surface of the steel cabin. After the cantilever beam components are welded, rebars are laid on the cantilever beam components and the concrete is poured, so it is important that the direction of the cantilever beam T rib meets the design requirements. The method of T-rib angle evaluation included three main steps: (1) calculating the local normal vector of the steel cabin for each T rib, (2) calculating the principal direction of the bottom surface of the T rib, and (3) calculating the angle between the normal vector and the bottom plane direction and the deviation. The robust normal estimation method proposed in Section 3.2.1 was applied to calculate the local normal vector of the steel cabin for each T rib. The calculated local normal vector (n1) is shown in Figure 10c.
Since a T rib is composed of a vertical surface and bottom surface, the direction of the T rib is consistent with the bottom surface. According to the design requirements, the T rib forms a certain angle with the side of the steel cabin to achieve the best mechanical properties, so the direction of the bottom surface should be strictly controlled during the prefabrication and installation of T ribs. A PCA-based oriented bounding box (OBB) method was developed to estimate the direction of the bottom plane of the T ribs [52]. Bounding boxes with simple characteristics can be used to replace complex geometric objects and are widely adopted for collision detection [53,54]. The covariance matrix was calculated and the eigenvalues and eigenvectors were solved using Equation (7), as follows:
C i , j = C O V X i , X j = E X i u i X j u j       i , j = 1 , 2 , , n
The eigenvector corresponding to the largest eigenvalue of the covariance matrix in the PCA algorithm is the direction of the OBB. As shown in Figure 10d, the direction (n2) of the bottom surface was calculated. In order to obtain the maximum and minimum values in the three axial directions, which are the vertex coordinates of the bounding box, the coordinate points were subsequently projected onto the direction vector. Finally, the coordinates of the bounding box were projected back into the original coordinate system to obtain the OBB along the main direction of the original point cloud.
Next, the local normal vector of the steel cabin (denoted as n 1 ) and the principal direction of the bottom surface of the T rib (denoted as n 2 ) were determined. The angle θ was the return value of the inverse cosine function ( c o s 1 ) in degrees, as shown in Equation (8).
θ = acosd n 1 · n 2 n 1 n 2
During data collection, the considered angle between the bottom of the T rib and the side of the steel cabin was manually measured as θ 1 . Therefore, the angle deviation was calculated according to Equation (9).
Δ θ = θ θ 1

5. Case Study

To validate the proposed method for the geometric quality assessment of SBG components based on 3D laser scanning and BIM, an experiment was carried out on a section of real SBGs on a prefabrication site. The actual SGB components are shown in Figure 11a,b, with dimensions of about 19   m × 3   m × 4   m . The laser-scanned data of the prefabricated SBG components were processed using the proposed method, and the obtained geometric dimensions and locational relationships were compared with manual measurements to evaluate the accuracy of the proposed method. The entire process was implemented in MATLAB and executed on a computer with Intel Core i7-6700 CPU and 16 GB RAM.

5.1. Collection of Laser-Scanned Data

The laser-scanned data of the prefabricated SBGs was collected by a Trimble TX8 laser scanner with a noise range smaller than 2 mm on most surfaces from 2 m to 120 m and 18–90% reflectivity in standard-scan mode. The whole prefabrication site was scanned, including the cantilever structure components, as shown in Figure 11c. Due to the large span of the prefabricated components and the complex scheme, scans taken from 17 different locations were included to reduce occlusions, and Trimble’s RealWorks was used for scan registration based on the six targets.

5.2. Experimental Results

Figure 12 shows the effect of background points based on the DBSCAN algorithm. Figure 12a,c show the top view and side view, respectively, of the scan data obtained from the prefabricated SBGs, which contained many background points and mixed pixels. After using the proposed method, most background points and mixed-pixel points were removed, as presented in Figure 12b,d.
Then, the laser-scanned data were classified into a few clusters with different attribute labels using the proposed robust normal-based region-growing algorithm, as shown in Figure 13b. The two main categories of clusters were the steel cabin (Figure 13c) and the T ribs (Figure 13d). After the extraction of the side and top planes (Figure 13e,f), the as-is steel cabin was then matched with the as-designed BIM model to assess whether the dimensions of the steel cabin were consistent with the design requirements. Thirdly, the locations of the T ribs were evaluated by calculating the distance from the intersection point to the upper boundary line (Figure 13g) and the distance from the bottom surface of the adjacent T rib, as presented in Figure 13h,i. Lastly, the orientations of the T ribs were evaluated based on the local normal estimation of the side surface of the steel cabin and the direction of the bottom plane of the T ribs with the OBB.

5.3. Feasibility of the Proposed Method

The geometric dimensions and locational relationships of the prefabricated components calculated through the proposed method were compared to the actual figures, which were acquired by manually measuring using a steel tape with a millimeter scale and an angle square. The deviations between the assessed results and the manual measurement results were calculated and analyzed as follows.
Table 3 presents the location deviations of the T ribs calculated with the proposed method. L1 is the distance from the intersection point to the upper boundary, as illustrated in Figure 11a, and L1′ is the distance measured manually. L2 is the distance between adjacent T ribs calculated by the proposed method, and L2′ is the distance measured manually. Figure 14a shows the error analysis histogram for the T rib positions; the maximum and minimum absolute differences were 12.5 mm and 0.2 mm, respectively, and the RMSE was 4.7 mm. Note that, in this case, the number of measurements (‘n’ in the RMSE formula) was 24. An average dimension estimation error of 2.4 mm was obtained, which was within the specified tolerance of 5 mm. Therefore, the proposed geometric quality assessment method could measure the location of the T ribs with sufficient accuracy.
Table 4 shows the orientation deviations of the T ribs. θ is the angle calculated by the proposed method, and θ refers to the angle measured manually. Figure 14b shows the error analysis histogram for the T rib orientations; the maximum and minimum absolute deviations were 0.4152° and 0.0160°, respectively. An average orientation estimation error of 0.1925°, which was within the tolerance boundary of 1°, was obtained, and the RMSE was 0.2594°. Note that, in this case, the number of orientation assessment measurements (n in the RMSE formula) was 11. Therefore, the proposed geometric assessment method could measure the orientation of the T ribs with sufficient accuracy.
The ΔL1 values of T ribs 3, 4, and 8 were significantly different from the standard design values, especially for T rib 8. L1 refers to the distance from the geometric key feature point to the feature plane, which was used to evaluate whether the position of the rib met the design requirements. The experimental object considered was an arc-shaped SBG cantilever member, and T rib 8 was located at the center of the cantilever member. Due to the setting of the scanning position of the large-scale cantilever beam components, the occlusion formed by the bottom surface of the T rib caused the missing area of the vertical surface of the T rib to be the largest. Therefore, the distance L1 from the geometric key point to the feature plane calculated by the proposed method was smaller than the actual distance. Evidently, scanning positions and numbers should be carefully planned to collect high-quality laser scanning data for the geometric quality inspection of large-scale SBG prefabricated elements in complex prefab schemes. To collect the surface geometric data characteristics of the measured objects in a holistic way, the automatic-scanning site planning of large prefabricated components in complex schemes will be included in our future research.
Table 5 shows the time required to perform the detection method proposed in this paper and the traditional manual measurement method. The time taken by the proposed method included three stages: (1) the time spent planning the scan of the SBG construction site; (2) the time spent collecting point-cloud data for the SBGs at each site; and (3) the time spent processing and quantifying the 3D model of the SBGs using the point-cloud processing algorithm. Compared with the manual measurement method, the proposed method saved about 115 minutes, or 31.9% of the total detection time.

6. Conclusions

This study proposed a geometric quality assessment method for as-is prefabricated SBG components using 3D laser scanning and BIM. The presented method will be beneficial to the industry by reducing inspection times and labor costs, improving the accuracy of geometric quality inspections, strengthening construction quality through the early detection of position and orientation deviations, and reducing delays in the on-site installation of SBG components.
The proposed method first removed the background points and the mixed pixels from the laser-scanned data with the DBSCAN algorithm. Then, the SBG components were classified under different attribute labels using the proposed robust normal-based region-growing algorithm, and the side surface of the steel cabin with the largest attribute label was extracted. Next, the top surface of the steel cabin was detected, and the scanned data related to the T ribs were extracted using the presented subtraction algorithm. Subsequently, in order to assess whether the extracted SBG components conformed to the design specifications, the Scan-vs-BIM system was applied to assess the dimensions of the steel cabin. Finally, the vertical and bottom planes of the T ribs were extracted using the angle difference clustering algorithm. The locations and orientations provided in the inspection checklist were used to assess the geometric quality of the T ribs.
The proposed technique was validated on a real SBG project with a length of about 19 m. The presented geometric quality assessment method was applied to the laser-scanned data of the SBGs, and the locations and orientations of the T ribs acquired using the proposed method were compared to the actual data acquired from manual inspections. The comparison results showed that the average dimension and angle differences between this method and the manual detection of T rib positions and orientations were 2.4 mm and 0.1925°, respectively. According to the tolerance values (5 mm and 1°), the experimental results showed that the developed method could provide accurate assessments of the geometric quality of SBG components. Compared with the manual measurement method, the time efficiency of the proposed method was improved by 31.9%.
Nevertheless, the proposed approach had a few limitations. First, in the calculation of the intersection point, it was necessary to set the region of interest when extracting the boundary points of line fitting. Therefore, our future work will focus on the boundary extraction step, aiming at the extraction of the specified boundary rather than the complete boundary. Second, the accuracy of the inspection results depends on the quality of the acquired laser-scanned data, and so the laser-scanned data collection path plays an important role. Future research is needed regarding the planning of optimal laser-scanned data collection paths.

Author Contributions

Conceptualization, Y.T.; methodology, Y.T. and D.T.; software, L.C. and D.T.; validation, T.D.; formal analysis, Y.T.; investigation, Q.W.; resources, D.T.; data curation, Y.T. and L.C.; writing—original draft preparation, Y.T., D.T. and L.C.; writing—review and editing, Y.T., D.T. and L.C.; visualization, Q.W. and T.D.; supervision, Y.T. and S.L.; project administration, S.L. and D.T.; funding acquisition, Y.T. All authors have read and agreed to the published version of the manuscript.

Funding

This research was funded by [Foundation for Basic and Applied Basic Research of Guangdong Province] grant number [No. 2020A1515111189]. And The APC was funded by [Foundation for Basic and Applied Basic Research of Guangdong Province].

Data Availability Statement

Some of the data, models, or code that support the findings of this study are available from the corresponding author upon reasonable request.

Acknowledgments

The authors want to thank the anonymous reviewers for their time towards this manuscript.

Conflicts of Interest

The authors declare no conflict of interest.

References

  1. Xiang, Y.; Zhu, S.; Zhao, Y. Research and Development on Accelerated Bridge Construction Technology. China J. Highw. Transp. 2018, 31, 1–27. [Google Scholar]
  2. Deng, Y.; Li, A. Fatigue reliability analysis for welds of U ribs in steel box girders based on fracture mechanics and long-term monitoring data. J. Southeast Univ. Nat. Sci. Ed. 2019, 49, 68–75. [Google Scholar] [CrossRef]
  3. Abu Dabous, S.; Feroz, S. Condition monitoring of bridges with non-contact testing technologies. Autom. Constr. 2020, 116, 103224. [Google Scholar] [CrossRef]
  4. Guan, G.; Gu, W.W. Reconstruction of propeller and complex ship hull surface based on reverse engineering. J. Mar. Sci. Technol.-Taiwan 2019, 27, 498–504. [Google Scholar] [CrossRef]
  5. Tang, P.B.; Huber, D.; Akinci, B.; Lipman, R.; Lytle, A. Automatic reconstruction of as-built building information models from laser-scanned point clouds: A review of related techniques. Autom. Constr. 2010, 19, 829–843. [Google Scholar] [CrossRef]
  6. Barbarella, M.; Cuomo, A.; Di Benedetto, A.; Fiani, M.; Guida, D. Topographic Base Maps from Remote Sensing Data for Engineering Geomorphological Modelling: An Application on Coastal Mediterranean Landscape. Geosciences 2019, 9, 500. [Google Scholar] [CrossRef] [Green Version]
  7. Siebert, S.; Teizer, J. Mobile 3D mapping for surveying earthwork projects using an Unmanned Aerial Vehicle (UAV) system. Autom. Constr. 2014, 41, 1–14. [Google Scholar] [CrossRef]
  8. Olsen Michael, J.; Kuester, F.; Chang Barbara, J.; Hutchinson Tara, C. Terrestrial Laser Scanning-Based Structural Damage Assessment. J. Comput. Civ. Eng. 2010, 24, 264–272. [Google Scholar] [CrossRef]
  9. Xi, C.X.; Zhou, Z.-X.; Xiang, X.; He, S.; Hou, X. Monitoring of long-span bridge deformation based on 3D laser scanning. Instrum. Mes. Metrol. 2018, 18, 113–130. [Google Scholar] [CrossRef]
  10. Bosché, F.; Guillemet, A.; Turkan, Y.; Haas, C.T.; Haas, R. Tracking the Built Status of MEP Works: Assessing the Value of a Scan-vs.-BIM System. J. Comput. Civ. Eng. 2013, 28, 05014004. [Google Scholar] [CrossRef] [Green Version]
  11. Tan, Y.; Li, S.; Wang, Q. Automated Geometric Quality Inspection of Prefabricated Housing Units Using BIM and LiDAR. Remote Sens. 2020, 12, 2492. [Google Scholar] [CrossRef]
  12. Guo, J.J.; Wang, Q. Dimensional Quality Inspection of Prefabricated MEP Modules with 3D Laser Scanning. In Proceedings of the ASCE International Conference on Computing in Civil Engineering (i3CE), Atlanta, GA, USA, 17–19 June 2019; pp. 171–177. [Google Scholar]
  13. Wang, Q.; Kim, M.K.; Cheng, J.C.P.; Sohn, H. Automated quality assessment of precast concrete elements with geometry irregularities using terrestrial laser scanning. Autom. Constr. 2016, 68, 170–182. [Google Scholar] [CrossRef]
  14. Wang, Q.; Cheng, J.C.P.; Sohn, H. Automated Estimation of Reinforced Precast Concrete Rebar Positions Using Colored Laser Scan Data. Comput.-Aided Civ. Infrastruct. Eng. 2017, 32, 787–802. [Google Scholar] [CrossRef]
  15. Liu, J.D.; Zhang, Q.L.; Wu, J.; Zhao, Y.C. Dimensional accuracy and structural performance assessment of spatial structure components using 3D laser scanning. Autom. Constr. 2018, 96, 324–336. [Google Scholar] [CrossRef]
  16. Castillo, E.; Liang, J.; Zhao, H. Point Cloud Segmentation and Denoising via Constrained Nonlinear Least Squares Normal Estimates. In Innovations for Shape Analysis: Models and Algorithms; Springer: Berlin/Heidelberg, Germany, 2013; pp. 283–299. [Google Scholar]
  17. Pu, S.; Vosselman, G. Knowledge based reconstruction of building models from terrestrial laser scanning data. ISPRS J. Photogramm. Remote Sens. 2009, 64, 575–584. [Google Scholar] [CrossRef]
  18. Li, Y.; Wu, B.; Ge, X. Structural segmentation and classification of mobile laser scanning point clouds with large variations in point density. ISPRS J. Photogramm. Remote Sens. 2019, 153, 151–165. [Google Scholar] [CrossRef]
  19. Patraucean, V.; Armeni, I.; Nahangi, M.; Yeung, J.M.; Brilakis, I.; Haas, C. State of research in automatic as-built modelling. Adv. Eng. Inform. 2015, 29, 162–171. [Google Scholar] [CrossRef] [Green Version]
  20. Date, H.; Kaneta, Y.; Hatsukaiwa, A.; Onosato, M.; Kanai, S. Object Recognition in Terrestrial Laser Scan Data using Spin Images. Comput.-Aided Des. Appl. 2012, 9, 187–197. [Google Scholar] [CrossRef] [Green Version]
  21. Yokoyama, H.; Date, H.; Kanai, S.; Takeda, H. Pole-like objects recognition from Mobile Laser Scanning Data using smoothing and principal component analysis. Int. Arch. Photogramm. Remote Sens. Spat. Inf. Sci. 2012, 38, 115–120. [Google Scholar] [CrossRef] [Green Version]
  22. Yan, Y.J.; Hajjar, J.F. Automated extraction of structural elements in steel girder bridges from laser point clouds. Autom. Constr. 2021, 125, 103582. [Google Scholar] [CrossRef]
  23. Riveiro, B.; DeJong, M.J.; Conde, B. Automated processing of large point clouds for structural health monitoring of masonry arch bridges. Autom. Constr. 2016, 72, 258–268. [Google Scholar] [CrossRef]
  24. Sommer, C.; Yumin, S.; Guibas, L.; Cremers, D.; Birdal, T. From Planes to Corners: Multi-Purpose Primitive Detection in Unorganized 3D Point Clouds. IEEE Robot. Autom. Lett. 2020, 5, 1764–1771. [Google Scholar] [CrossRef] [Green Version]
  25. Wu, Q.; Zhu, S.; Zhou, Y.; Wan, C.; He, T. Regular sticks pose position and orientation recognition based on RANSAC. Transducer Microsyst. Technol. 2019, 38, 137–140. [Google Scholar]
  26. Zhe, L.; Shunbo, Z.; Chuanzhe, S.; Yingtian, L.; Yun-Hui, L.; Hesheng, W. LPD-Net: 3D Point Cloud Learning for Large-scale Environment Analysis and Place Recognition. arXiv 2019, arXiv:1812.07050v2[cs.CV], 2831–2840. [Google Scholar]
  27. Ren, B.; Wei, K.; Dai, Y. A novel method of target recognition and 3D pose estimation in unstructured environment. J. Harbin Inst. Technol. 2019, 51, 38–44. [Google Scholar]
  28. Akizuki, S.; Hashimoto, M. Stable Position and Pose Estimation of Industrial Parts Using Evaluation of Observability of 3D Vector Pairs. J. Robot. Mechatron. 2015, 27, 174–181. [Google Scholar] [CrossRef]
  29. Kim, M.K.; Wang, Q.; Park, J.W.; Cheng, J.C.P.; Sohn, H.; Chang, C.C. Automated dimensional quality assurance of full-scale precast concrete elements using laser scanning and BIM. Autom. Constr. 2016, 72, 102–114. [Google Scholar] [CrossRef]
  30. Anil, E.B.; Tang, P.B.; Akinci, B.; Huber, D. Deviation analysis method for the assessment of the quality of the as-is Building Information Models generated from point cloud data. Autom. Constr. 2013, 35, 507–516. [Google Scholar] [CrossRef]
  31. Ghahremani, K.; Safa, M.; Yeung, J.; Walbridge, S.; Haas, C.; Dubois, S. Quality assurance for high-frequency mechanical impact (HFMI) treatment of welds using handheld 3D laser scanning technology. Weld. World 2015, 59, 391–400. [Google Scholar] [CrossRef]
  32. Bosché, F.; Ahmed, M.; Turkan, Y.; Haas, C.T.; Haas, R. The value of integrating Scan-to-BIM and Scan-vs-BIM techniques for construction monitoring using laser scanning and BIM: The case of cylindrical MEP components. Autom. Constr. 2015, 49, 201–213. [Google Scholar] [CrossRef]
  33. Vaghefi, K.; Ahlborn, T.M.; Harris, D.K.; Brooks, C.N. Combined Imaging Technologies for Concrete Bridge Deck Condition Assessment. J. Perform. Constr. Facil. 2015, 29, 04014102. [Google Scholar] [CrossRef]
  34. Heymsfield, E.; Kuss, M. Implementing Gigapixel Technology in Highway Bridge Inspections. J. Perform. Constr. Facil. 2013, 29, 04014074. [Google Scholar] [CrossRef]
  35. Vetrivel, A.; Gerke, M.; Kerle, N.; Vosselman, G. Identification of damage in buildings based on gaps in 3D point clouds from very high resolution oblique airborne images. ISPRS J. Photogramm. Remote Sens. 2015, 105, 61–78. [Google Scholar] [CrossRef]
  36. Park, J.-W.; Lee, J.-J.; Jung, H.-J.; Myung, H. Vision-based displacement measurement method for high-rise building structures using partitioning approach. NDT E Int. 2010, 43, 642–647. [Google Scholar] [CrossRef]
  37. Huang, F.H.; Yu, Y.; Feng, T.H. Automatic building change image quality assessment in high resolution remote sensing based on deep learning. J. Vis. Commun. Image Represent. 2019, 63, 10. [Google Scholar] [CrossRef]
  38. Guldur, B.; Yan, Y.J.; Hajjar, J.F. Condition Assessment of Bridges Using Terrestrial Laser Scanners; American Society of Civil Engineers: New York, NY, USA, 2015; pp. 355–366. [Google Scholar]
  39. Cha, G.; Park, S.; Oh, T. A Terrestrial LiDAR-Based Detection of Shape Deformation for Maintenance of Bridge Structures. J. Constr. Eng. Manag. 2019, 145, 04019075. [Google Scholar] [CrossRef]
  40. An, Y.-K.; Min Kim, J.; Sohn, H. Laser lock-in thermography for detection of surface-breaking fatigue cracks on uncoated steel structures. NDT E Int. 2014, 65, 54–63. [Google Scholar] [CrossRef]
  41. Ester, M.; Kriegel, H.-P.; Sander, J.; Xu, X. A density-based algorithm for discovering clusters in large spatial databases with noise. In Proceedings of the Second International Conference on Knowledge Discovery and Data Mining, Portland, OR, USA, 25 August–1 September 2012; pp. 226–231. [Google Scholar]
  42. Hoppe, H.; Derose, T.; Duchamp, T.; Mcdonald, J.; Stuetzle, W. Surface reconstruction from unorganized points. SIGGRAPH Computer Graphics. ACM SIGGRAPH Comput. Graph. 1996, 26, 71–78. [Google Scholar] [CrossRef]
  43. Pauly, M.; Keiser, R.; Gross, M. Multi-scale feature extraction on point-sampled surfaces. Comput. Graph. Forum 2003, 22, 281–289. [Google Scholar] [CrossRef] [Green Version]
  44. Kawashima, K.; Kanai, S.; Date, H. As-built modeling of piping system from terrestrial laser-scanned point clouds using normal-based region growing. J. Comput. Des. Eng. 2014, 1, 13–26. [Google Scholar] [CrossRef] [Green Version]
  45. Khaloo, A.; Lattanzi, D. Robust normal estimation and region growing segmentation of infrastructure 3D point cloud models. Adv. Eng. Inform. 2017, 34, 1–16. [Google Scholar] [CrossRef]
  46. Nurunnabi, A.; Belton, D.; West, G. Diagnostic-robust statistical analysis for Local Surface Fitting in 3D Point Cloud Data. In Proceedings of the XXII Congress of International Society for Photogrammetry & Remote Sensing, Melbourne, Australia, 5–9 July 2012. [Google Scholar]
  47. Rousseeuw, P.J.; Driessen, K.V. A fast algorithm for the minimum covariance determinant estimator. Technometrics 1999, 41, 212–223. [Google Scholar] [CrossRef]
  48. Nurunnabi, A.; West, G.; Belton, D. Outlier detection and robust normal-curvature estimation in mobile laser scanning 3D point cloud data. Pattern Recognit. J. Pattern Recognit. Soc. 2015, 48, 1404–1419. [Google Scholar] [CrossRef] [Green Version]
  49. Ferraz, A.; Bretar, F.; Jacquemoud, S.; Goncalves, G.; Pereira, L.; Tome, M.; Soares, P. 3-D mapping of a multi-layered Mediterranean forest using ALS data. Remote Sens. Environ. 2012, 121, 210–223. [Google Scholar] [CrossRef]
  50. Yang, L.; Cheng, J.C.P.; Wang, Q. Semi-automated generation of parametric BIM for steel structures based on terrestrial laser scanning data. Autom. Constr. 2020, 112, 103037. [Google Scholar] [CrossRef]
  51. Weber, C.; Hahmann, S.; Hagen, H. Sharp Feature Detection in Point Clouds. In Proceedings of the 2010 Shape Modeling International Conference, Aix en Provence, France, 21–23 June 2010; pp. 175–186. [Google Scholar]
  52. Zhao, Y.Z. On the use of dimension reduction techniques in quasi-Monte Carlo methods. Math. Comput. Model. 2008, 48, 1925–1937. [Google Scholar] [CrossRef]
  53. Bergen, G.V.D. Efficient Collision Detection of Complex Deformable Models using AABB Trees. J. Graph. Tools 1997, 2, 1–13. [Google Scholar] [CrossRef]
  54. Dutta, S.; Cai, Y.Y.; Huang, L.H.; Zheng, J.M. Automatic re-planning of lifting paths for robotized tower cranes in dynamic BIM environments. Autom. Constr. 2020, 110, 19. [Google Scholar] [CrossRef]
Figure 1. Flowchart of the proposed method for geometric quality assessment procedures.
Remotesensing 15 00556 g001
Figure 2. SBG components: (a) composition of steel cabin and ribs; (b) geometric quality inspection checklist.
Remotesensing 15 00556 g002
Figure 3. Denoising based on DBSCAN.
Remotesensing 15 00556 g003
Figure 4. The extraction of the steel cabin: (a) example of the robust region-growing algorithm for SBG; (b) side surface; (c) top surface; and (d) top boundary and the line fitted by boundary points.
Remotesensing 15 00556 g004
Figure 5. Recognition of T ribs: (a) extraction of the scanned data related to T ribs through subtraction algorithm; (b) robust cluster-growing outcome; (c) I beams with different attribute labels; and (d) T ribs with occlusion noise.
Remotesensing 15 00556 g005
Figure 6. Denoising of T ribs: (a) original T rib from segmentation; (b) denoising based on the angle difference of the normal vector; and (c) T rib after mixed-pixel filtering.
Remotesensing 15 00556 g006
Figure 7. Geometric quality assessment of the steel cabin: (a) BIM model of the steel cabin; (b) generated point-cloud model; (c) alignment between as-designed and as-is prefabricated steel cabin; and (d) point-cloud data after coarse and fine registration.
Remotesensing 15 00556 g007
Figure 8. Flowchart of the T-rib location assessment.
Remotesensing 15 00556 g008
Figure 9. Calculation of the intersection point: (a) vertical plane of the T rib; (b) bottom surface of the T rib; (c) boundary of the vertical plane; (d) boundary of the bottom plane; and (e) the calculation of the intersection point of the target boundary line.
Remotesensing 15 00556 g009
Figure 10. Calculation of inspection checklist items: (a) distance (d1) from intersection point to upper boundary line; (b) distance (d2) between adjacent T ribs; (c) local normal vector (n1) of the steel cabin for each T rib; and (d) direction (n2) of the bottom of the T rib based on the OBB.
Remotesensing 15 00556 g010
Figure 11. The SBG overview: (a,b) the SBG in prefabrication; (c) laser-scanned data for prefabricated SBG components.
Remotesensing 15 00556 g011
Figure 12. Experimental process for background points: top view of the scanned data of SBGs (a) before and (b) after applying the DBSCAN algorithm; side view of the scanned data of SBGs (c) before and (d) after applying the DBSCAN algorithm.
Remotesensing 15 00556 g012
Figure 13. Experimental process for validation experiments: (a) preprocessed point clouds of SBGs; (b) laser-scanned data cluster classification; (c) extracted steel cabin; (d) T ribs after the application of the subtraction algorithm; (e) top surface of the steel cabin; (f) side surface of the steel cabin; (g) upper boundary of the steel cabin; (h) vertical planes of the T ribs; and (i) bottom planes of the T ribs.
Remotesensing 15 00556 g013
Figure 14. Geometric quality assessment results of prefabricated T ribs compared with manual measurement results: (a) T-rib dimensions and positions and (b) T-rib orientations.
Remotesensing 15 00556 g014
Table 1. Parameter value interpretation and setting.
ParameterDefinitionSetting Value
ϵ neighborhoodThe radius of neighborhoods around a datapoint pi0.5
MinPtsThe minimum number of points in the neighborhood1.2 D 2
Table 2. Assessment checklist items for T ribs.
ElementCategoryInspection ChecklistTolerance
T ribLocation(1) Distance from the intersection point to the upper boundary (L1)
(2) Distance between adjacent T ribs (L2)
5 mm
T ribOrientationDeviation between the normal vector of the steel cabin and the direction of the T ribs
Table 3. Dimension and location assessment results for prefabricated T ribs compared with manually measured results (measurement unit: m).
12345678910111213
L10.49750.49180.48660.50570.50110.50720.4950.48730.49850.48890.49510.49890.5020
L1′0.50030.49420.49270.49930.50190.50300.50030.49980.49870.49800.49900.49800.4988
|ΔL1|0.00280.00240.00610.00640.00080.00420.00530.01250.00020.00910.00390.00090.0032
L21.75791.73811.84411.70561.80981.34921.66561.79851.73351.77581.74741.6240
L2′1.76001.73991.84051.69801.81021.34741.66631.79831.73171.77241.75081.6279
|ΔL2|0.00210.00180.00360.00760.00040.00180.00070.00020.00180.00340.00340.0039
Table 4. Orientation assessment results for prefabricated T ribs compared with manual measurement results.
123456789101112
  θ 8.4512°8.4840°8.0882°8.3251°8.5672°8.3347°8.3878°8.0848°8.5815°8.5261°8.1246°8.9150°
θ 8.5000°8.5000°8.5000°8.5000°8.5000°8.5000°8.5000°8.5000°8.5000°8.5000°8.5000°8.5000°
Δ θ 0.0488°0.0160°0.4118°0.1749°0.0672°0.1653°0.1122°0.4152°0.0815°0.0261°0.3754°0.4150°
Table 5. Time comparison between the detection method proposed in this paper and the manual measurement method.
Site-Scan PlanningData AcquisitionData ProcessingTotal Time
The proposed method 10 min136 min99 min245 min
The manual method360 min
Disclaimer/Publisher’s Note: The statements, opinions and data contained in all publications are solely those of the individual author(s) and contributor(s) and not of MDPI and/or the editor(s). MDPI and/or the editor(s) disclaim responsibility for any injury to people or property resulting from any ideas, methods, instructions or products referred to in the content.

