Article

Detecting the Effects of Extreme Events on Estuarine Suspended Particulate Matter Using Satellite Remote Sensing (Scheldt Estuary): Challenges and Opportunities

by
Juliana Tavora
1,*,
Mhd. Suhyb Salama
1,
Marloes Penning de Vries
1,
Chris M. Mannaerts
1 and
Daphne van der Wal
1,2
1
Faculty of Geo-Information Science and Earth Observation (ITC), University of Twente, P.O. Box 217, 7500 AE Enschede, The Netherlands
2
Dept of Estuarine and Delta Systems, NIOZ Royal Netherlands Institute for Sea Research, P.O. Box 140, 4400 AC Yerseke, The Netherlands
*
Author to whom correspondence should be addressed.
Remote Sens. 2023, 15(3), 670; https://doi.org/10.3390/rs15030670
Submission received: 21 December 2022 / Revised: 19 January 2023 / Accepted: 20 January 2023 / Published: 23 January 2023

Abstract

:
Suspended Particulate Matter (SPM) plays an important role in controlling water quality, particularly in turbid estuaries. SPM may be impacted by changes in weather and climate, including potential changes in the frequency or intensity of extremes. Yet, the linkages between extreme events in wind and river discharge, and particularly the role these have on local dynamics and spatial patterns of estuarine SPM are, to date, largely unknown. This study investigates the effects that wind and river discharge have on SPM in a turbid estuary. It uses atmospherically corrected remotely sensed reflectances from Landsat-5, -7, and -8. From these data, we establish a 37-year-long time series, from 1984 to 2020, of satellite-derived SPM for the Scheldt Estuary. SPM was estimated using an algorithm applied to the near-infrared band and subsequently compared to in situ SPM data. Additionally, a time series of river discharge and wind speed were used to assess the frequency and severity of extreme events of wind speed and river discharge. In general, statistically significant but weak relationships between SPM and river discharge and between SPM and wind speed were observed. SPM correlated with river discharge and wind in large parts of the estuary, indicating the important role of these drivers in the entire estuarine system. Our study demonstrates how synoptic satellite snapshots can be combined with in situ time series of drivers, such as river discharge and wind, to capture where these drivers relate to (and likely affect) SPM within an estuary. However, our study demonstrates an inability to capture SPM during windstorms both from in situ and satellite data. We discuss the challenges and limitations of assessing the effects of extreme events from satellite and in situ SPM. We recommend the deployment of complementary moored turbidimeters for continuous observations at two strategic locations, as indicated by our spatial study, to improve the ability to capture the effects of extreme events in both space and time.

1. Introduction

Suspended particulate matter (SPM) is a critical variable in determining water quality [1] and the functioning of aquatic systems. It plays an important role in the fate of pollutants and pathogens in estuaries [2,3], modulates light availability for primary productivity [4,5], benthic biota [6], and contributes to the obstruction of waterways [7].
Within estuaries, SPM is expected to be a response to complex interactions among tides, river discharge, and winds. While in microtidal estuarine environments, river discharge and winds are known as the main forcing mechanisms of SPM dynamics; in meso- to macrotidal environments, the tidal regime and the asymmetry between ebb and flood currents are commonly the main driving mechanisms of changes in SPM [8]. For example, the association between ebbing tidal currents and river discharge increases the flow of SPM to the coastal zone, while flooding tidal currents lead to the increased residence time of freshwater and modulate SPM entrainment in turbid maximum zones, or TMZ [9]. The difference between these processes in a tidal cycle indicates residual sediment transport. Although tidal currents and river discharge typically control the distribution and fate of SPM, wind-driven waves can induce erosion and resuspension of sediments [10,11]. Adding to the complexity of the hydrodynamical relationship with SPM in tidal estuaries, the combined effect of tides, rivers, and wind-driven circulation typically creates a constantly changing bathymetry in soft-bottom estuaries [12].
Estuaries are among the areas most susceptible to climate change and extreme meteorological events. Examples include cyclones, storm surges, and extreme rainfall, which are likely to increase in the decades to come [13]. These extreme events impact several national security goods and services due to higher waves, floods, and severe wind conditions affecting navigability and enhancing changes in SPM [14,15]. In this scenario, a long-lasting effect of remobilized SPM may, for example, lead to a change in the trophic state [16].
Therefore, quantifying and understanding the role of SPM and extricating what affects SPM is particularly pressing for estuaries. Most of the studies addressing these questions rely on hydrodynamical modeling (e.g., references [17,18,19]) and water sampling (e.g., [20,21]); however, a growing number of studies have developed a foundation for the use and application of satellite remote sensing to understand SPM dynamics in turbid and tidal-dominated estuarine environments (e.g., references [10,22,23,24]).
The main objective of this study is to explore the potential of long-term monitoring by high spatial resolution satellite-borne sensors to quantify the effects of extreme events on the spatial variability in surface SPM in a complex estuarine environment. We assess the relationships of SPM with wind and river discharge to identify the main spatial patterns and to attribute the contribution of each environmental driver in a spatial context. Our goal will be achieved by performing a long-term spatiotemporal analysis (from 1984 to 2020) of remote sensing data (Landsat-5, -7, and -8).

2. Materials and Methods

2.1. Study Site

The Western Scheldt Estuary is an open estuary on the southwestern part of the Dutch coast. The estuary is characterized as a funnel-shaped multiple-channel system, separated by elongated shallow areas and tidal flats. The Western Scheldt, with its multiple-channel system, forms one estuarine system with the adjacent one-channel Sea Scheldt in Belgium, together referred to as Scheldt Estuary (Figure 1). The Scheldt Estuary functions as an essential area for navigation, recreation, and natural habitat for, among others, birds, fish, and saltmarsh vegetation [25].
Occasional capital dredging and regular maintenance dredging are carried out to secure safe navigation to the port of Antwerp for increasingly larger ship vessels [21]. Dredged material is redistributed either in the deeper areas, in secondary channels, or used to counteract the erosion of shallow subtidal zones near tidal flats [25,26]. Sand mining has also played a role in sediment transport in the Scheldt [7]. The sediment consists of mainly fine inorganic sediments [27,28] ranging from sandy-clay mud in shallower areas, to sand in the deepest channel [29]. Cohesive organo-mineral particles are observed in the TMZ (Turbidity Maximum Zone) [30]. At least four TMZs were reported in the Scheldt (see references [8,21,28,30,31]), with the most prominent TMZ located in the mid estuary (between about 58 and 110 km from the estuary mouth [8]).
The sediment dynamics in the Scheldt are influenced by tides, river discharge, and winds [20,23]. These forcings divide the estuary into three parts governing SPM transport and distribution patterns [20]: (i) the lower estuary (0–45 km), where tides and wind-driven waves are dominant forcing mechanisms, and a net landward SPM transport occurs; (ii) mid estuary (45–75 km), where tidal energy dominates and SPM from the lower and upper estuary converges, and (iii) the upper estuary (75–95 km), where tides and river discharge are governing the dynamics and river discharge may be the prevalent forcing mechanism in winter months. In the upper estuary, a net seaward SPM transport takes place, and the main sources of sediment to the estuary are the eroded tidal flats and shoals and SPM carried by river discharge.
The Scheldt Estuary is under the influence of a semi-diurnal meso to macrotidal regime, with tides reaching up to 4.85 m on spring tides and 2.81 m during neap tides [20,27]. The tidal range increases regularly in the upstream direction, with a maximum range registered as 5.25 m. Another important aspect of the tidal dynamics in the Scheldt is its asymmetry. This is possibly the main factor influencing sediment exchange between the estuary and the adjacent coast [32] during low river discharge [33].
River discharge varies from 2 m3s−1 to 600 m3s−1 (respectively in summer and winter months [34]) with an annual average between 100 and 200 m3s−1 [7]. During peaks in river discharge, the Scheldt changes from mostly a well-mixed to a partially stratified estuary, which leads to increased retention of river sediments from the increased flow of sediment-rich river discharge [28]. Meanwhile, because the flow of marine water upstream is lessened, so is the supply of marine sediment upstream and the intensity of the TMZ.
Wind climate in the Scheldt is characterized by stronger and more frequent south-west (SW) winds and by north-east (NE) winds [35]. The results in reference [35] show that during persistent SW winds, it is likely that the Scheldt Estuary imports marine mud from the Belgian–Dutch inner shelf, which can lead to increased SPM in the lower estuary. Wind-driven waves can also play a significant role in sediment transport in the estuary [20]. This mechanism is likely to be effective in the estuarine mouth (i.e., lower estuary), whereas locally generated wind-driven waves are expected in the middle estuary [36]. The effect of such waves is assumed to be local and dependent on the wind direction. During severe windstorms, wave height can reach peaks up to 3 m [36].

2.2. In Situ Data

In situ data comprise long time series of SPM data and the drivers of estuarine dynamics: water level as a proxy for tidal stage, river discharge, and wind speed and direction (see overview in Table S1).
SPM data provided by Rijkswaterstaat (hereafter RWS, https://waterinfo.rws.nl/#!/nav/index, accessed on 7 April 2021) consists of stations distributed along the Scheldt Estuary domain and covering different temporal ranges (refer to Table S1). The four long-term monitoring stations Vlissingen Boei SSVH, Hansweert Geul, Terneuzen boei 20, and Schaar van Ouden Doel are further in this document referred to as RWS Vlissingen, RWS Hansweert Geul, RWS Terneuzen, and RWS Schaar van Ouden Doel, respectively. The second set of SPM data is provided by [37] and distributed by the R for Science project (https://www.rforscience.com/data/westerschelde/, accessed on 16 March 2021) of NIOZ Royal Netherlands Institute for Sea Research. This dataset consists of seventeen stations sampled along the central axis of the Scheldt Estuary from 1995 to 2004.
Among the drivers of estuarine dynamics, information on water level and river discharge is also available from the RWS database. Water level data (https://waterinfo.rws.nl/#!/nav/index/, accessed on 23 November 2021) were continuously recorded every 10 min from 1984 to 2020 at Hansweert Geul station. We used the estimated time difference from these water level records in [23] to determine the tidal stage (i.e., low tide, high tide, ebb, and flood) associated with the SPM data. For example, high water level at RWS Vlissingen occurs 56 min prior to higher water level at RWS Hansweert Geul (reference station), 37 min prior at RWS Terneuzen, and 34 min after at RWS Schaar van Ouden Doel. The same time differences were applied to the four different regions, centered at each RWS in situ station. Daily river discharge was recorded at station Schaar van Ouden Doel from 1984 to 2020. Extreme events in river discharge (Q) were classified as extremely high when discharge was equal to or higher than the 95th percentile of the entire time series. Wind data were obtained from Royal Netherlands Meteorological Institute (KNMI, https://www-p.knmi.nl/nederland-nu/klimatologie/uurgegevens, accessed on 16 October 2020) from Vlissingen (station 310) with a 1 h temporal resolution and covering the period between 1984 and 2020. To obtain daily, monthly, and yearly wind data, wind speed (U) and direction cannot be directly averaged. First, wind components (u and v) must be calculated; then, each component can be averaged to the needed timestep, and subsequently converted back to wind speed and direction. The stronger the wind speeds, the higher the discrepancy between vector and scalar averages. KNMI defines extremely high wind (i.e., windstorms) when wind speed is equal to or higher than 20.8 m·s−1 (https://www.knmi.nl/kennis-en-datacentrum/uitleg/storm, accessed on 16 October 2020).

2.3. Remote Sensing Data and Validation of SPM Products

A time series of all available, full resolution, level 1 data from Landsat-5 (1984–2011), Landsat-7 (1999–2003), and Landsat-8 (2013–2020) were processed using the Royal Belgium Institute of Natural Sciences (RBINS) processor ACOLITE (https://odnature.naturalsciences.be/remsem/software-and-data/acolite, accessed on 20 December 2022; version 20210114.0), using the default dark spectrum fitting scheme [38,39] to obtain atmospherically corrected remotely sensed reflectance (Rrs) for the Scheldt Estuary (swath inside the area 3.19°–4.42°E and 51.15°–51.49°N, refer to Figure 1). Every satellite scene was mapped to a cylindrical equidistant projection at a spatial resolution of 30 m. All scenes were then manually inspected with the help of true-color composites, and cloud-compromised scenes were removed, leaving 178 good-quality scenes (114, 22, 42 scenes for Landsat-5, -7, and -8, respectively). SPM was then estimated using the semi-analytical algorithm described in reference [40], Equation (1):
SPM = A   ·   ρ w 1 ρ w C
where ρ w ( ρ w = Rrs   ·   π ) is the water-leaving reflectance, and coefficients A and C are hyperspectral narrow-band coefficients originally provided by reference [40]. Here, we test and compare the application of A and C coefficients as originally provided and band-weighted coefficients from the original narrow-band coefficients (provided in Table S2). The choice of algorithm is motivated by the fact that it was developed from an in situ dataset collected in the southern North Sea. Satellite-derived SPM was calculated from both the red and the near-infrared (NIR) bands to check for the best suitable satellite band and prevent underestimation of SPM due to possible saturation of Rrs signal at high SPM [41].
Following the good-practices criteria proposed in [3], the median and standard deviation of satellite-derived SPM were extracted by applying 3 × 3-pixel boxes centered at the location of each in situ sampling site. Additionally, two performance assessments were carried out to analyze the algorithm retrievals at both red and NIR bands (see Section 3.1). Firstly, median and standard deviation parameter from SPM data retrieved from the satellite was compared with in situ SPM data collected within 30 min and within 60 min of each satellite scene (hereafter called match-up analysis). The shorter time window may provide more accurate estimates, which can be significant given the strong hydrodynamical forcings the Scheldt Estuary is under, while a longer time window increases the number of data match ups [3,42]. For validation metrics, a type II linear regression [43] least squares fit (MATLAB script by [44]) was applied [3]. Additional statistical descriptors such as the mean absolute error, MAE (g·m−3), root mean square error, RMSE (g·m−3), and mean absolute percentage error, MAPE (%), were estimated.
Secondly, the frequency distributions of full time series of both satellite-derived and in situ SPM were compared at four long-term established stations in the Scheldt Estuary: Vlissingen SSVH, Terneuzen Boei 20, Hansweert Geul, and Schaar van Ouden Doel (hereon RWS Vlissingen, RWS Terneuzen, RWS Hansweert Geul, and RWS Schaar van Ouden Doel, respectively). Location of stations is shown in panels b, g, k, and l in Figure 1. Such a comparison tests if the independent sets of SPM data yield similar frequency distribution (i.e., shape, center, spread, skewness), as this indicates that the satellite and in situ instruments observe similar patterns [3,45]. Differences may be due to calibration inaccuracies (possibly causing a bias), ineffective atmospheric correction, or differences in measurement statistics due to, e.g., cloud cover, cloud shade, or time of observation.

2.4. Data Analysis

Climatological yearly cycles were extracted from the monthly river discharge and wind speed time series, and a least square curve was fitted to each parameter. Extreme events in daily river discharge and hourly winds were analyzed for their frequency, duration, and magnitude from January to December of each year. Theil–Sen regression (MATLAB script by [46]) was carried out to establish the significance of temporal trends, applying a significance level of 5%.
Maps were then generated with SPM derived from satellite data using the NIR-based algorithm. From these SPM maps, we extracted median and standard deviation from the region surrounding each of the four long-term monitoring in situ stations (see polygons in Figure 1). The resulting satellite-derived time series of SPM were compared to time series of river discharge and wind speed using Theil–Sen regressions. Spatial correlations of SPM with wind speed and river discharge were examined, applying Kendall-tau correlations at a 5% significance level (with statistical descriptors Kendall-tau correlation coefficient (r), probability (p), and the number of observations (n). Estimated significant correlation coefficients were classified as weak if r ≤ 0.3 and moderate if 0.3 < r ≤ 0.6 [47].

3. Results

3.1. Validation of SPM Products

SPM match ups and frequency distributions convey qualitative and quantitative information in different ways, both visually and statistically. The match-up analysis covered a large extent of the Scheldt Estuary (black and dark-yellow dots in Figure 1) and a considerable range of in situ SPM (4 to 147 g·m−3) despite the limited number of cloud-free satellite scenes matching in situ measurements. Match ups totaled n = 27, of which 18 come from Landsat-5, 7 from Landsat-7, and 2 from Landsat-8 (refer to Table S3).
A first validation analysis was carried out as a comparison of in situ SPM against the match ups for SPM derived from narrow-band and from band-weight coefficients. Results show larger differences in the NIR band with lower uncertainties from the band-weighted coefficients (i.e., improved MAPE by about 14%), and technically similar uncertainties were observed in the red band (less than 1% difference). From these results, the remainder of this study is carried out by applying band-weighted coefficients.
The comparison of the NIR bands (satellite-derived SPM) and in situ SPM (Figure 2a) shows general overestimation (n = 27, RMSENIR = 35.77 g·m−3, MAENIR = 24.86 g·m−3, MAPENIR = 103.75%, and r = 0.37; p = 0.007). Overall, and as expected, results show that the shorter time differences (i.e., 30 min versus 60 min) between satellite overpass and in situ SPM introduce lower uncertainties to the match-up analysis (n = 12, RMSENIR = 24.88 g·m−3, MAENIR = 22.18 g·m−3, MAPENIR = 98.65%, and r = 0.35; p = 0.13 (NS)) although the relationship at a shorter time difference is not statistically significant. Comparison of the satellite-derived SPM using the red band algorithm (Figure 2b) and in situ SPM showed general underestimation at higher SPM concentrations (n = 27; RMSEred = 37.92 g·m−3, MAEred = 22.44 g·m−3, MAPEred = 45.21%, and r = 0.33; p = 0.017) and a weaker relationship.
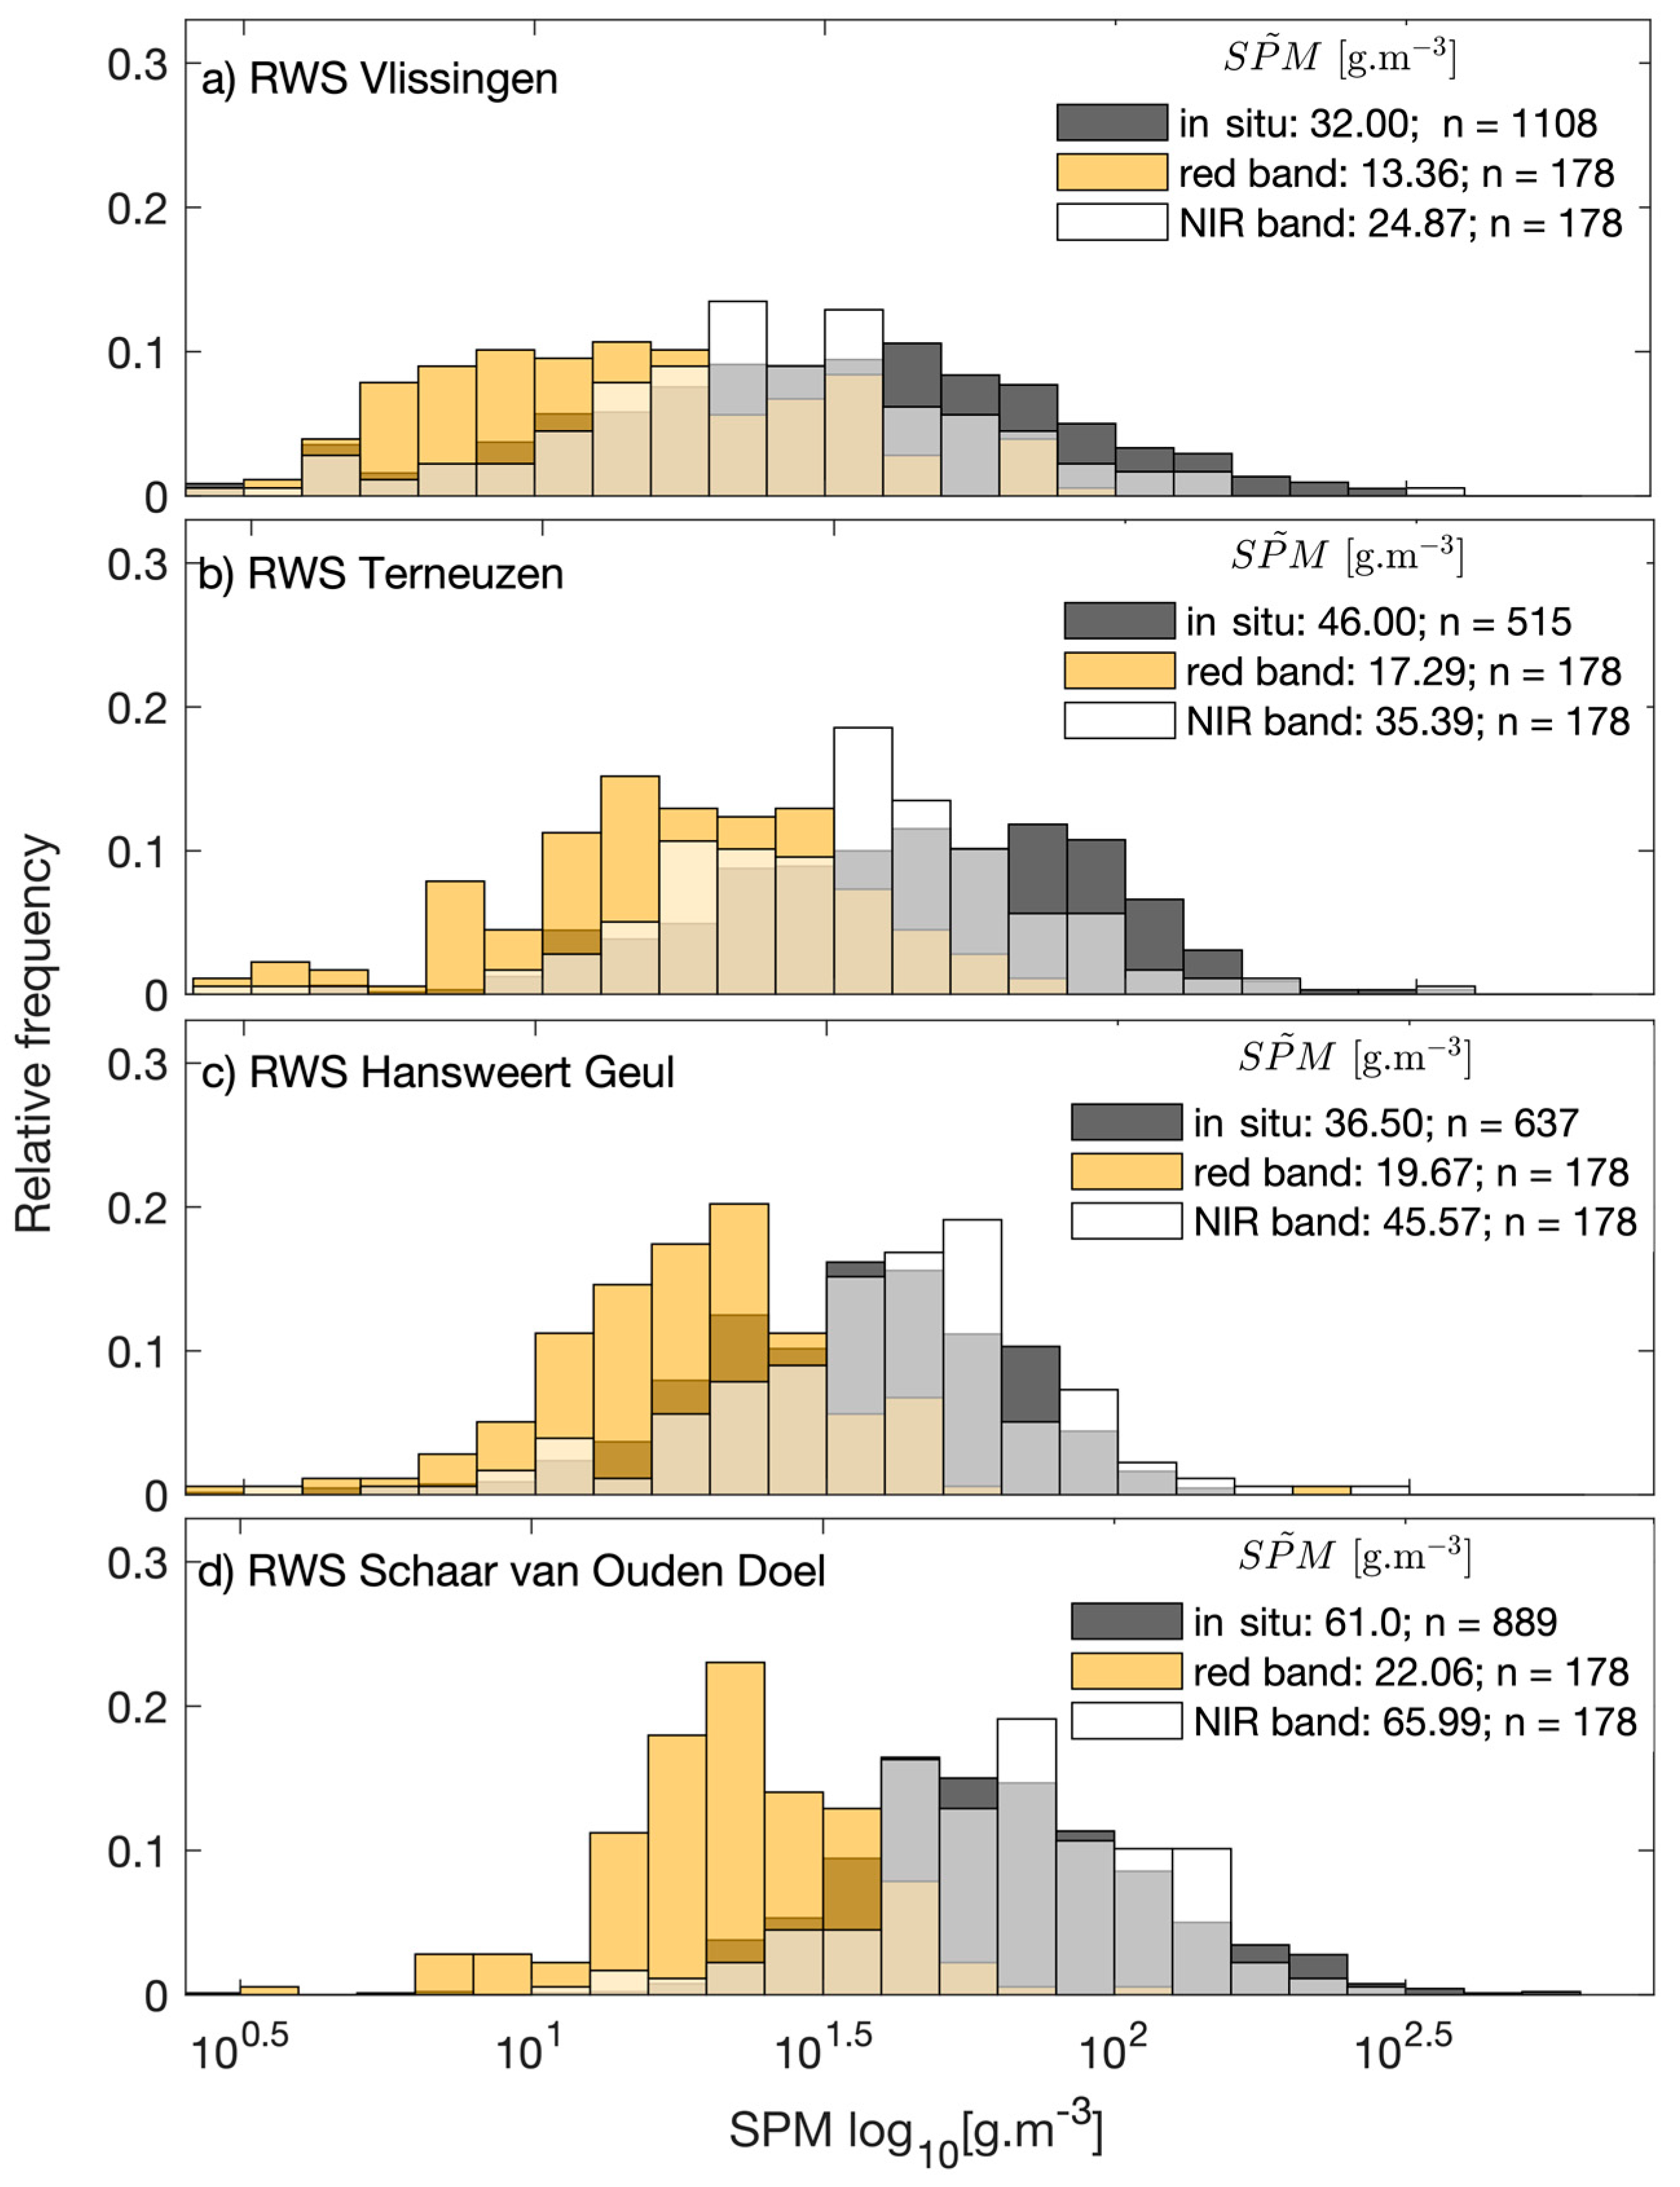
Comparison of frequency distributions of all in situ SPM (at four long-term monitoring stations) to the satellite-derived SPM from the red and the NIR bands (at the location represented by the four in situ stations) allowed for more samples than for the match ups. For all four long-term monitoring stations, satellite-derived SPM distributions from the red band are underestimated by about 50% (Figure 3, distributions in dark yellow). On the other hand, satellite-derived SPM from the NIR band yielded a reasonable maximum underestimation of 25%, and distributions follow a similar shape and skewness (Figure 3, distributions in white). It corroborates the assumption that the NIR band is the most useful satellite band for applications in the Scheldt Estuary under moderate to high SPM concentrations, compared to shorter wavelengths (as suggested in [48]). Thus, the results presented further are carried out using the NIR band. Additionally, the frequency distributions suggested that SPM concentrations increase upstream by a large factor (e.g., medians show that SPM at RWS Schaar van Ouden Doel is about 100% higher than at RWS Vlissingen).

3.2. Description and Context of Estuarine Drivers during SPM Data Acquisition

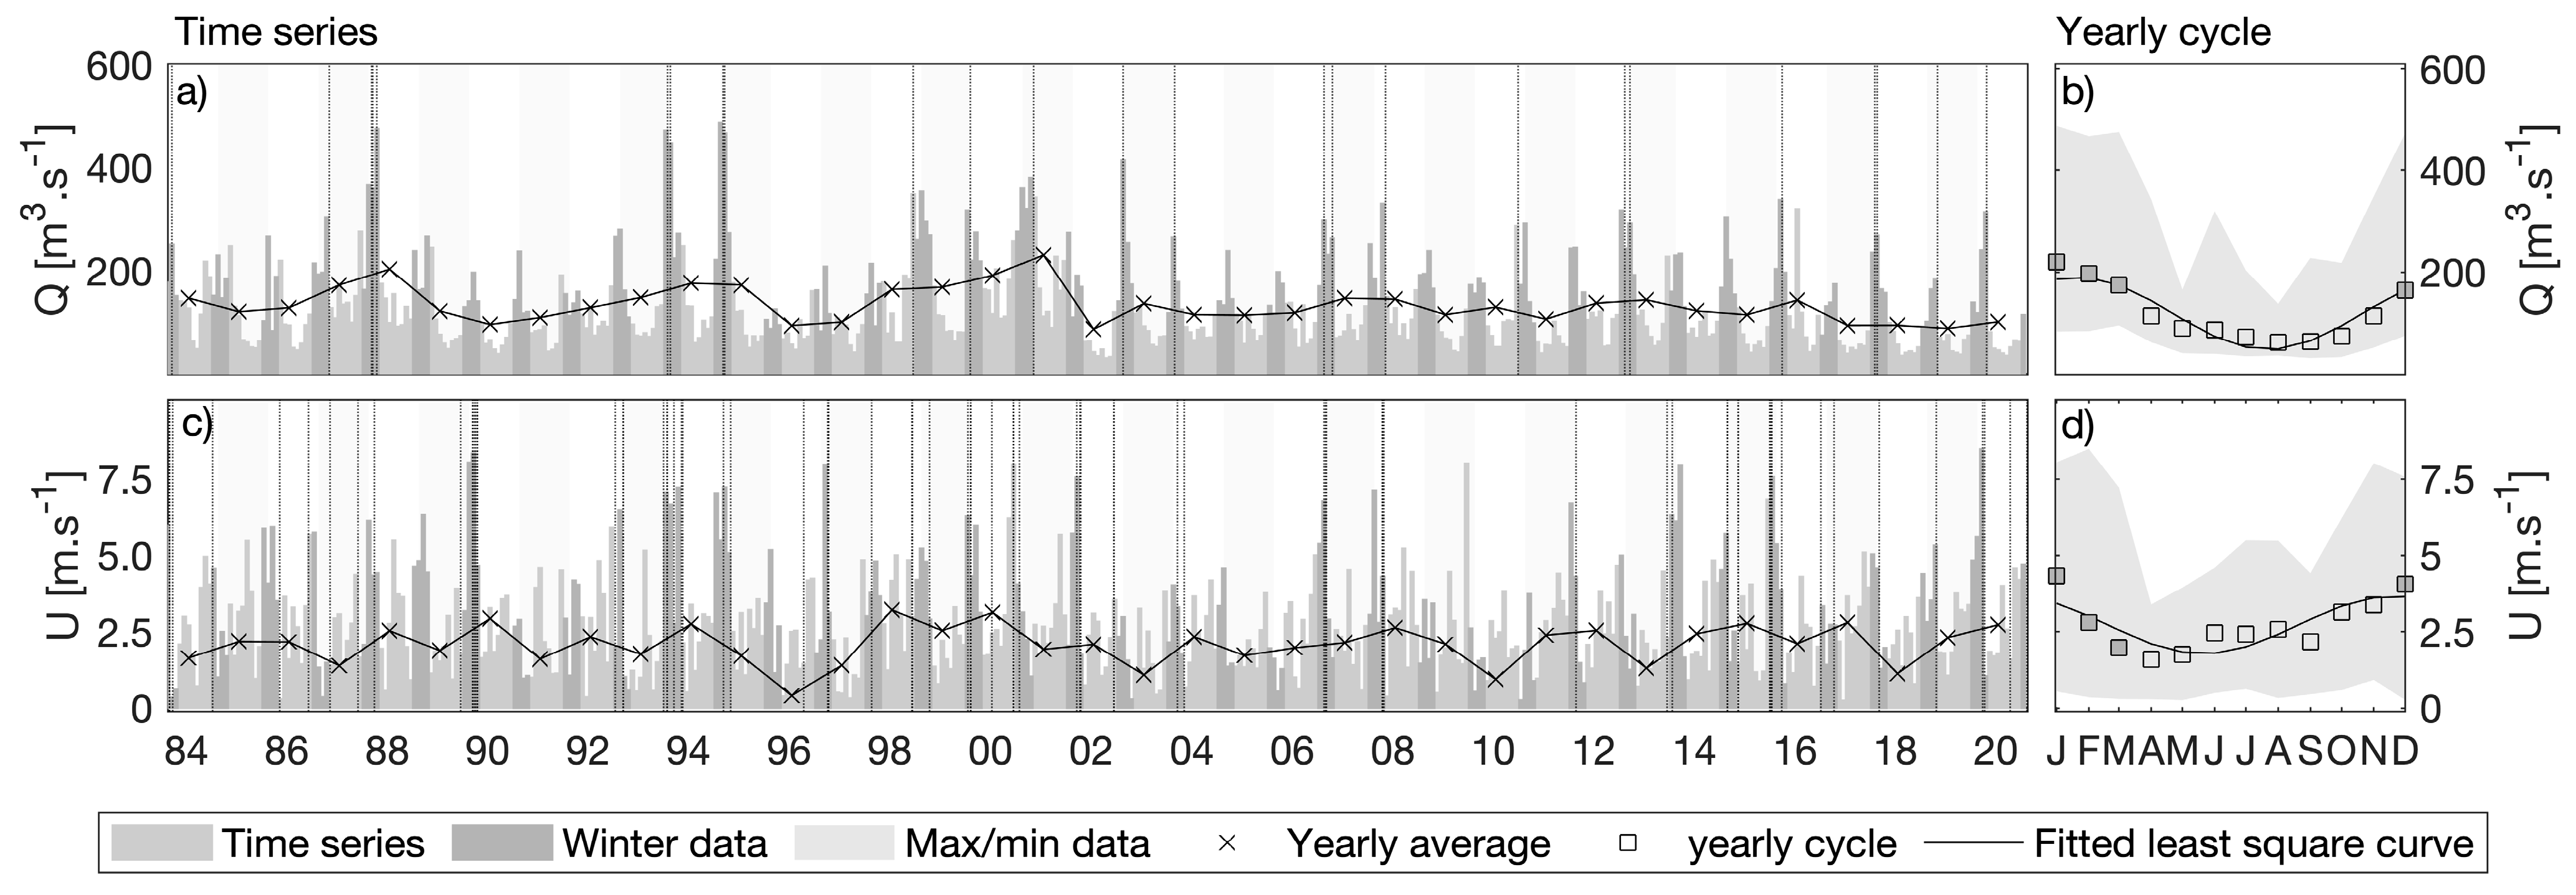
With strong interannual variability and regular seasonality, river discharge is generally low in the spring and end of summer and high in winter months (Figure 4b), while wind speed is low in late winter and spring with highs in late fall and early winter (Figure 4d). Both river discharge and wind speed peak in the winter (see Figure S1 for a qualitative interannual comparison with SPM).
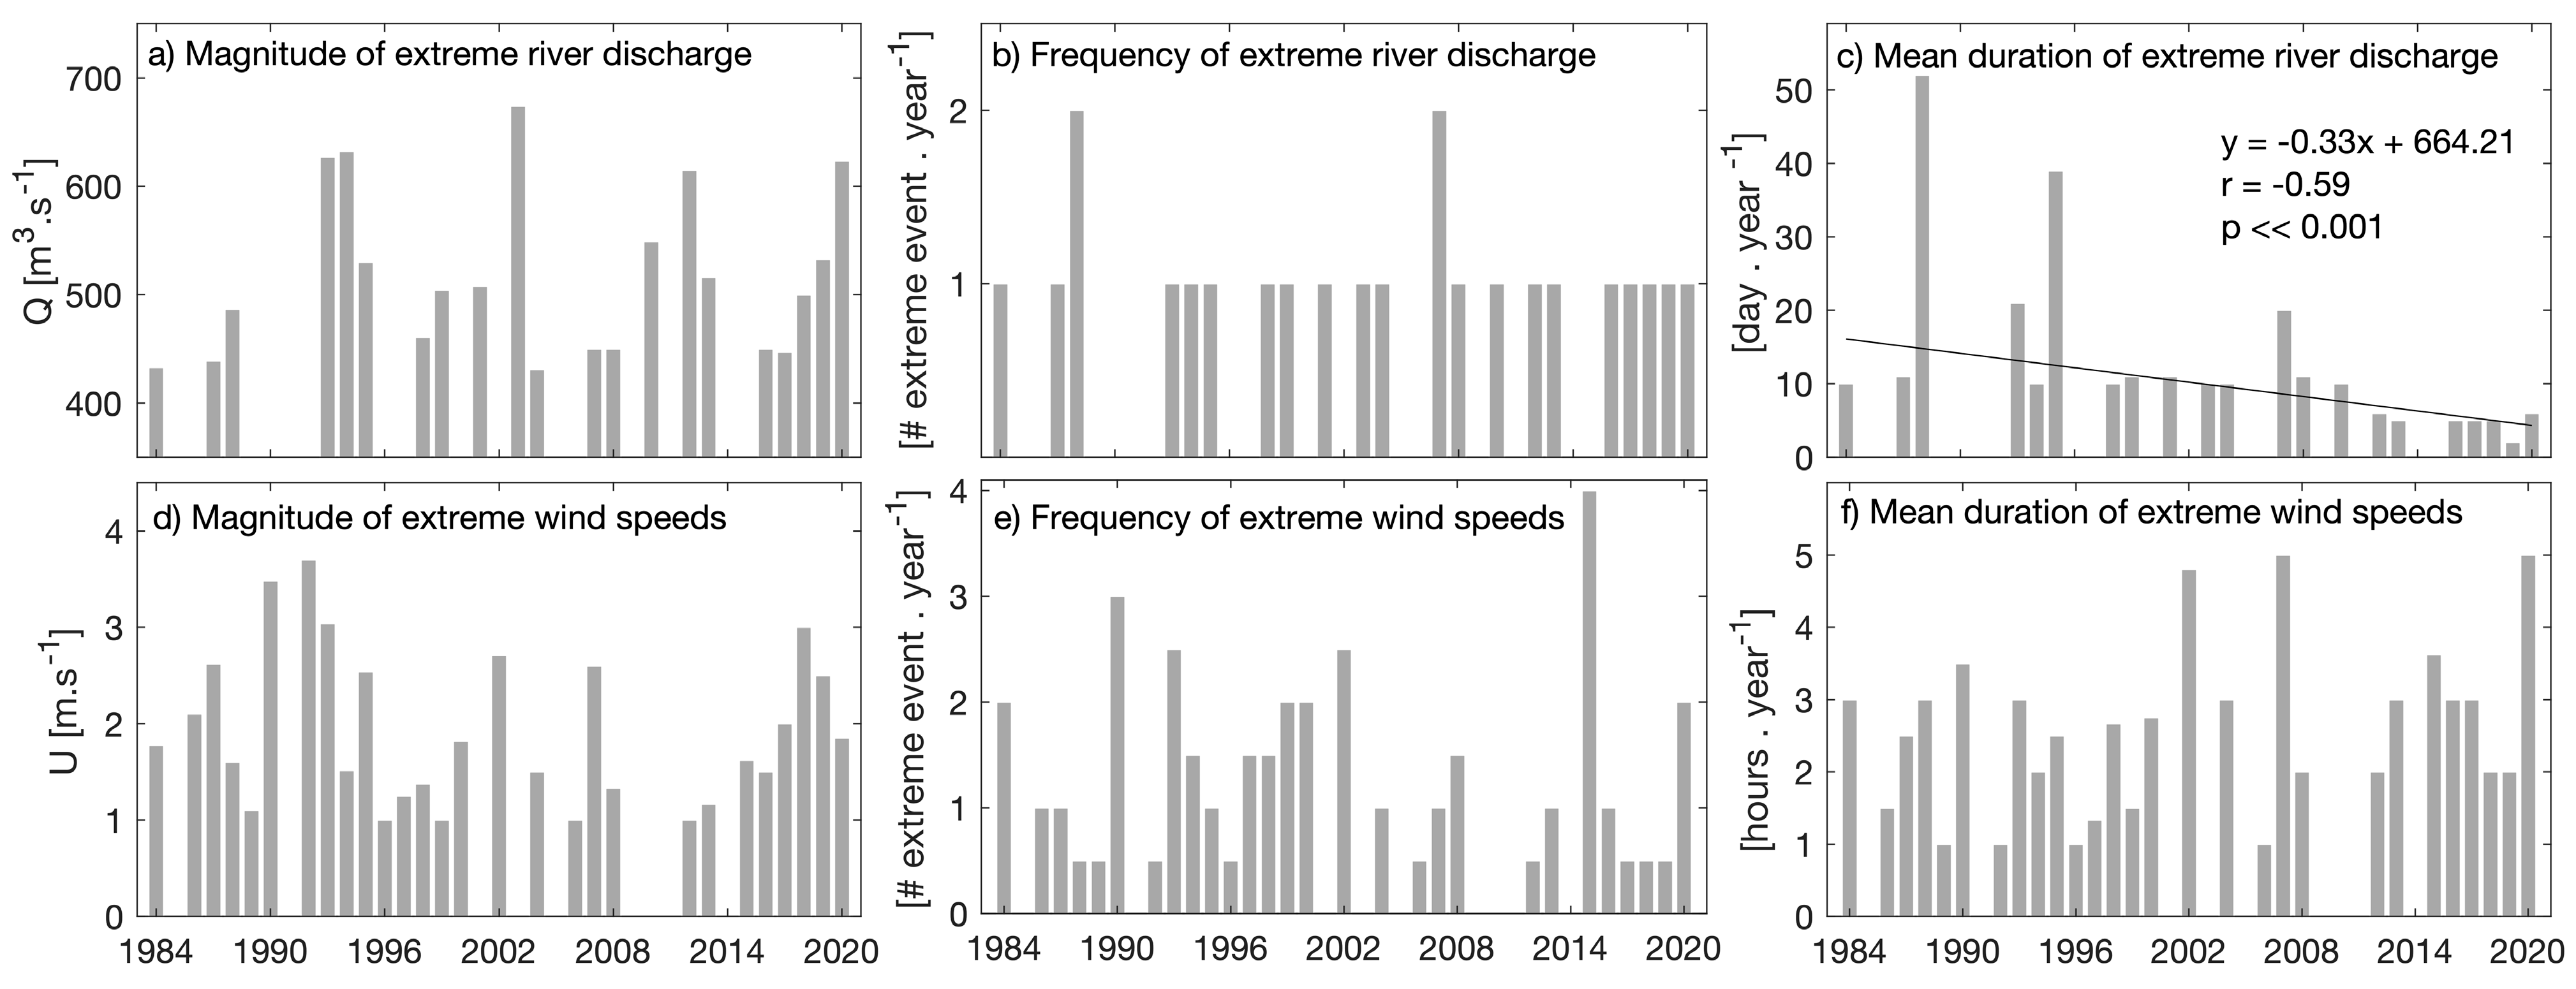
Analysis of the in situ data for extreme events of river discharge revealed no significant trends in the magnitude (Figure 5a) or in the frequency of extreme river discharge (Figure 5b); there was a significant negative trend in time in the duration of extreme river discharge (Figure 3c; r = −0.59, p < 0.001). No significant long-term trends were detected in the magnitude (Figure 5d), frequency (Figure 5e), and duration (Figure 5f) of extreme wind speeds (i.e., windstorms); however, a seemingly decadal oscillation of magnitude of windstorms, with a relatively weak period between 1998 and 2013, is observed (Figure 5d).
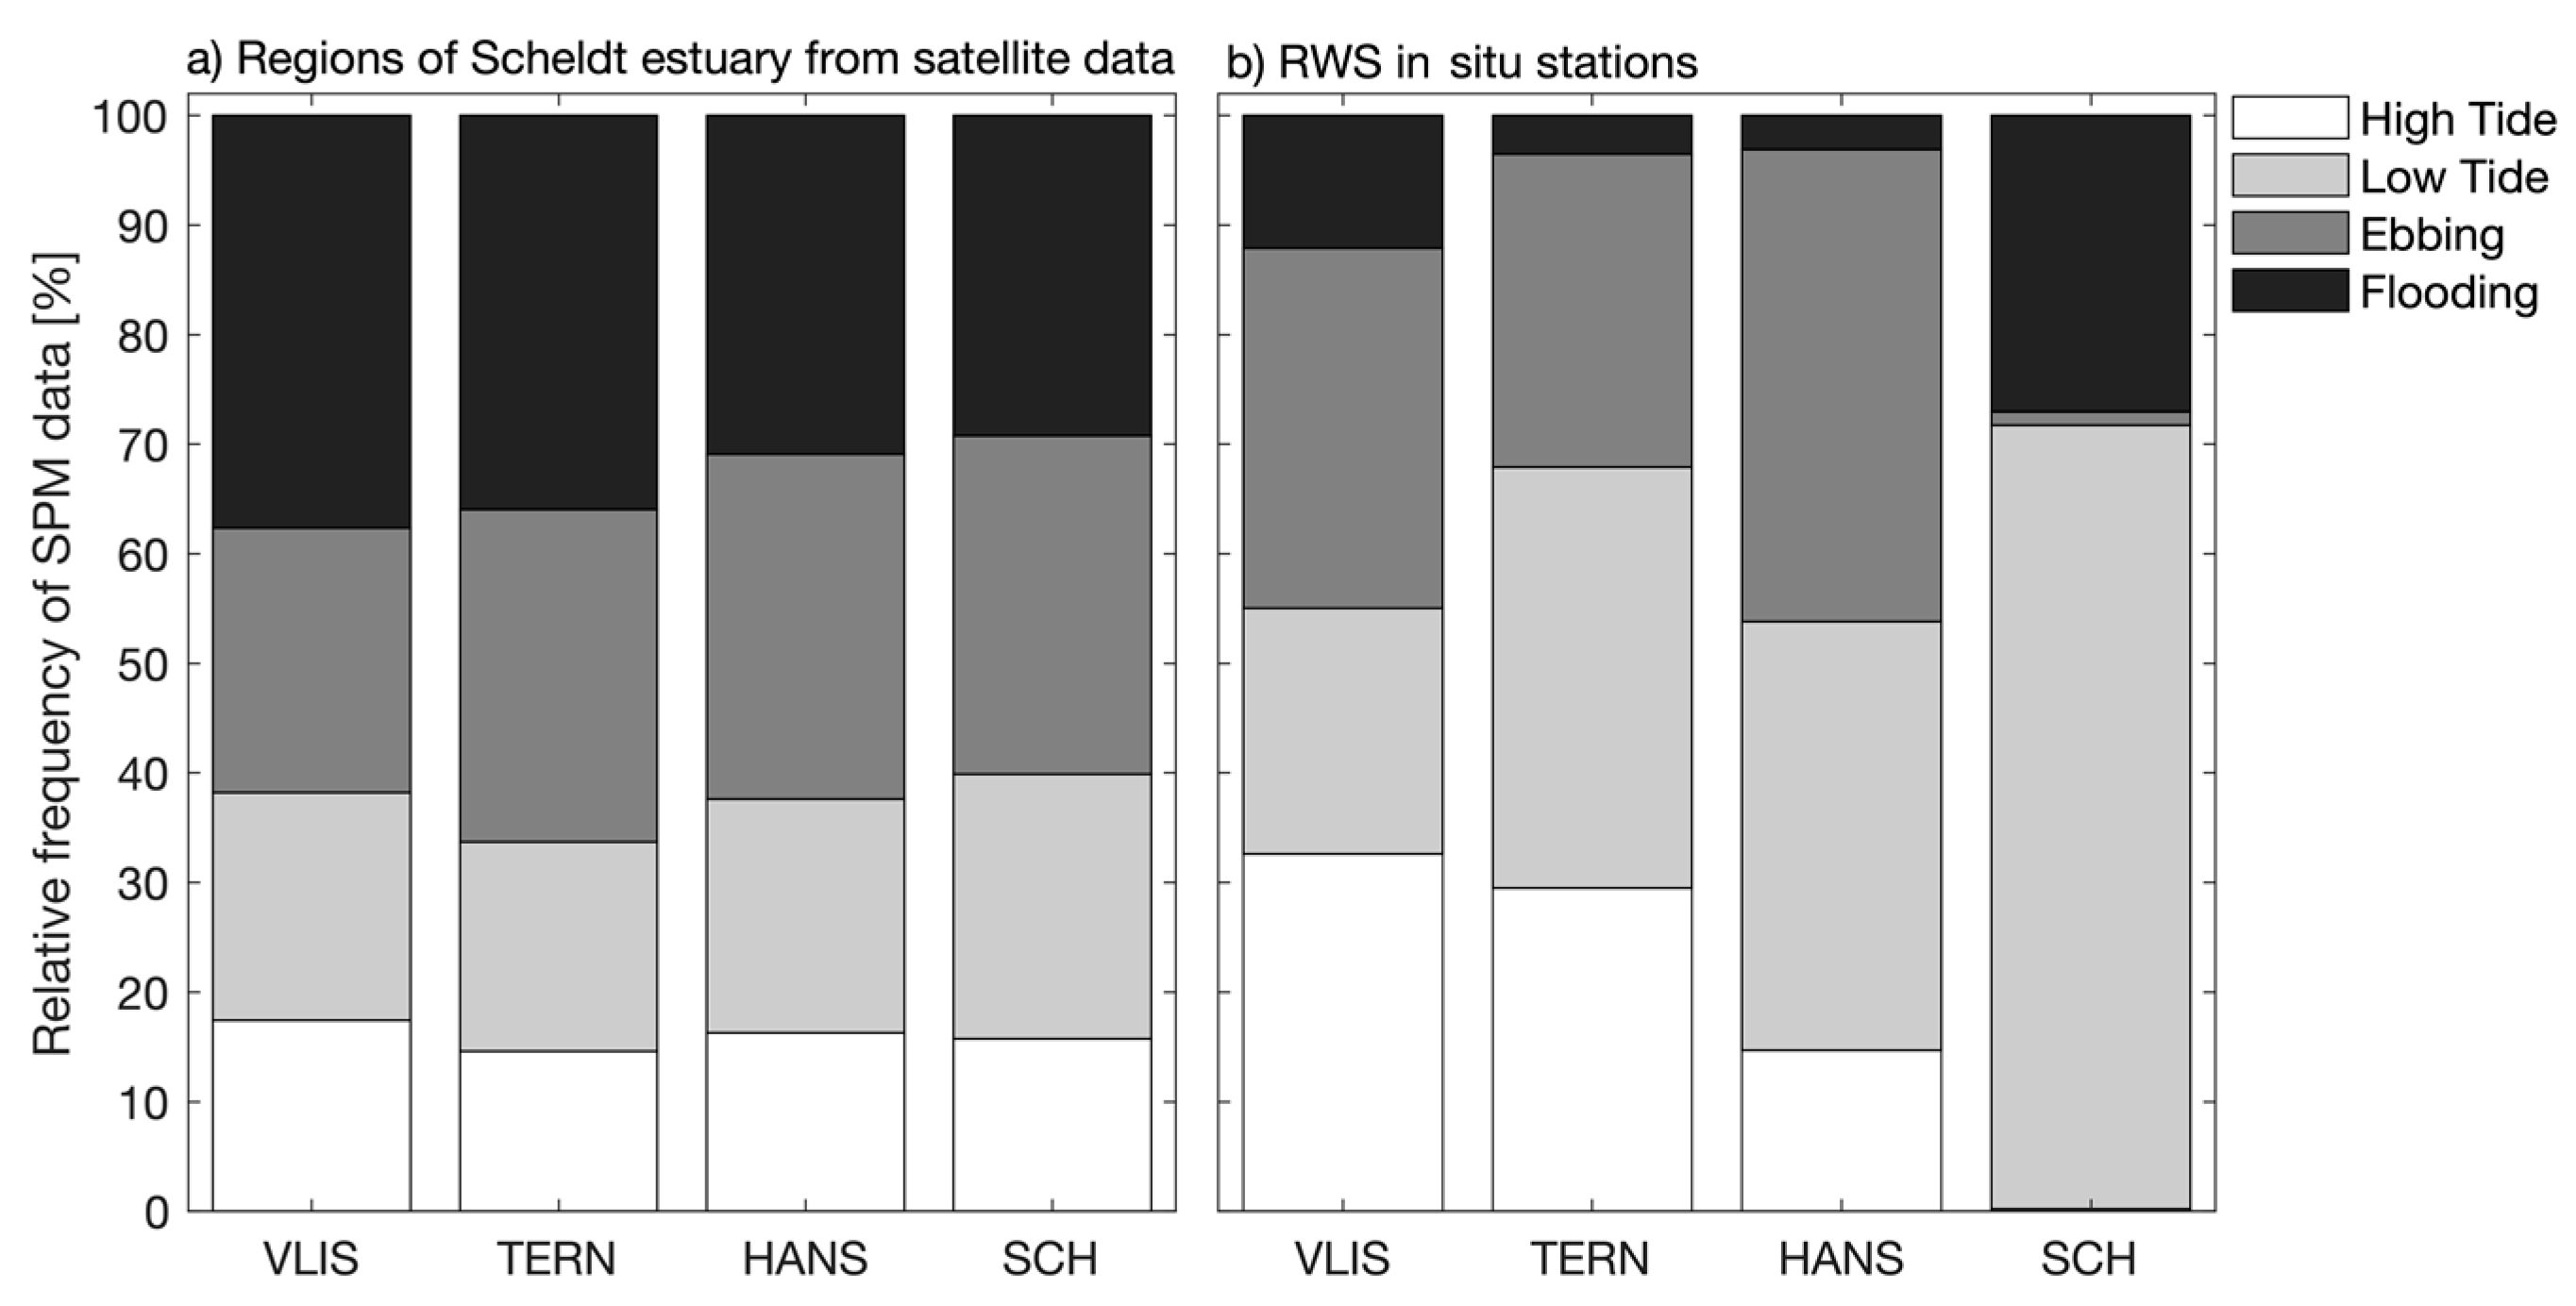
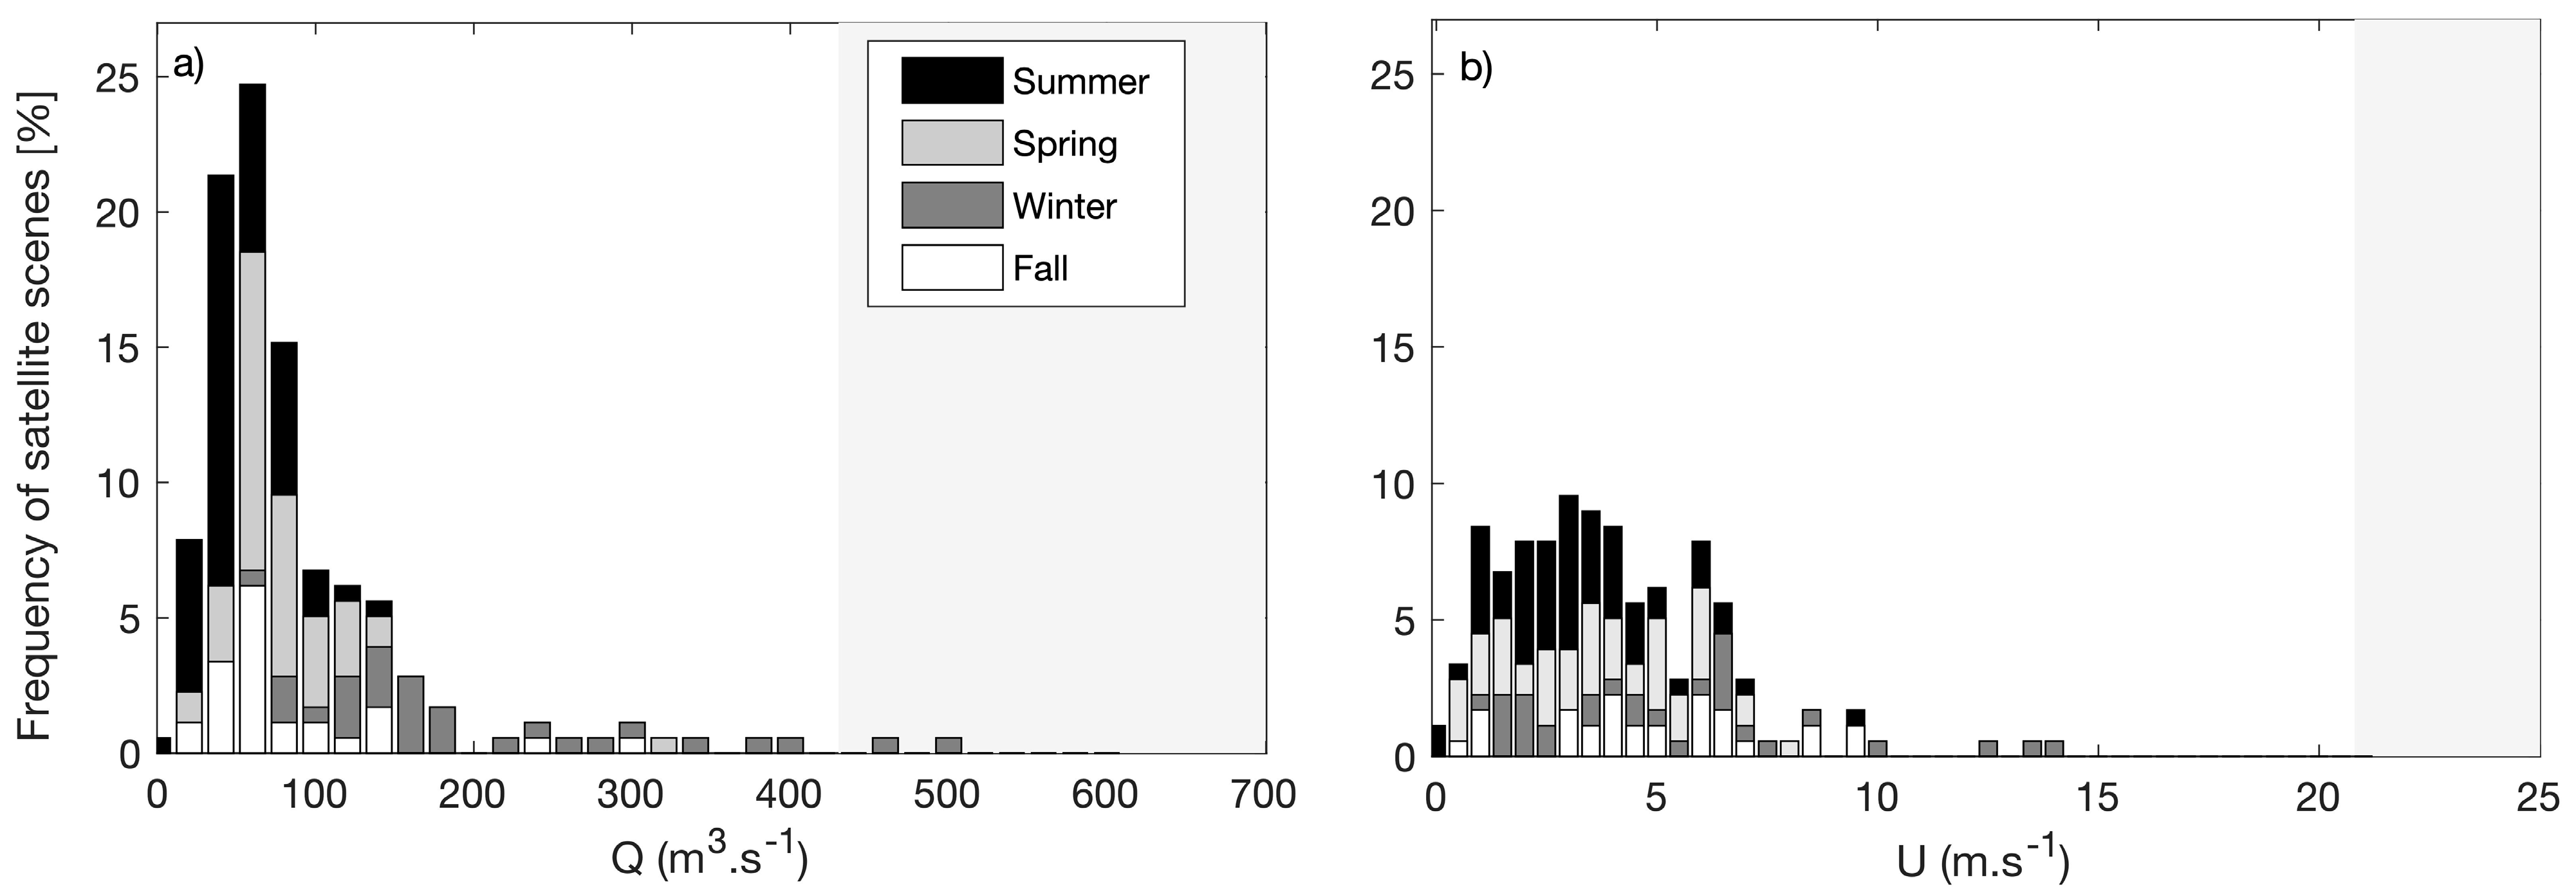
Neither satellite scenes nor in situ SPM were uniformly acquired at tidal stages or seasons (Figure 6a,b). Interestingly, the heterogeneity in SPM sampling is larger for in situ data than for satellite observations of tidal stages (i.e., while ebbing and flooding tides are overrepresented from satellite scenes, there is no clear pattern in tidal bias observed from in situ samples and the heterogeneity increases in the upstream stations).
Seasonally, satellite observations are underrepresented by about 50% in fall and winter compared to summer and spring (Figure S2A,B) for both river discharge and wind (Figure 7) due to cloudiness. Of all satellite observations, high extreme events were only recorded during the winter season for river discharge (Figure 7a), while high extreme events in wind speed (i.e., windstorms) were not observed within satellite overpass for the period (Figure 7b). In situ SPM was not sampled during windstorms. On the other hand, in situ SPM was sampled during extreme river discharge events in spring, fall, and winter (Figure S2A,B). SPM was also investigated for peaks under predominant wind directions, for which NE and SW winds were observed to be the most frequent and stronger, in accordance with the literature (refer to Figure S3).

3.3. Spatial Relationships of River Discharge and Wind Speed with SPM

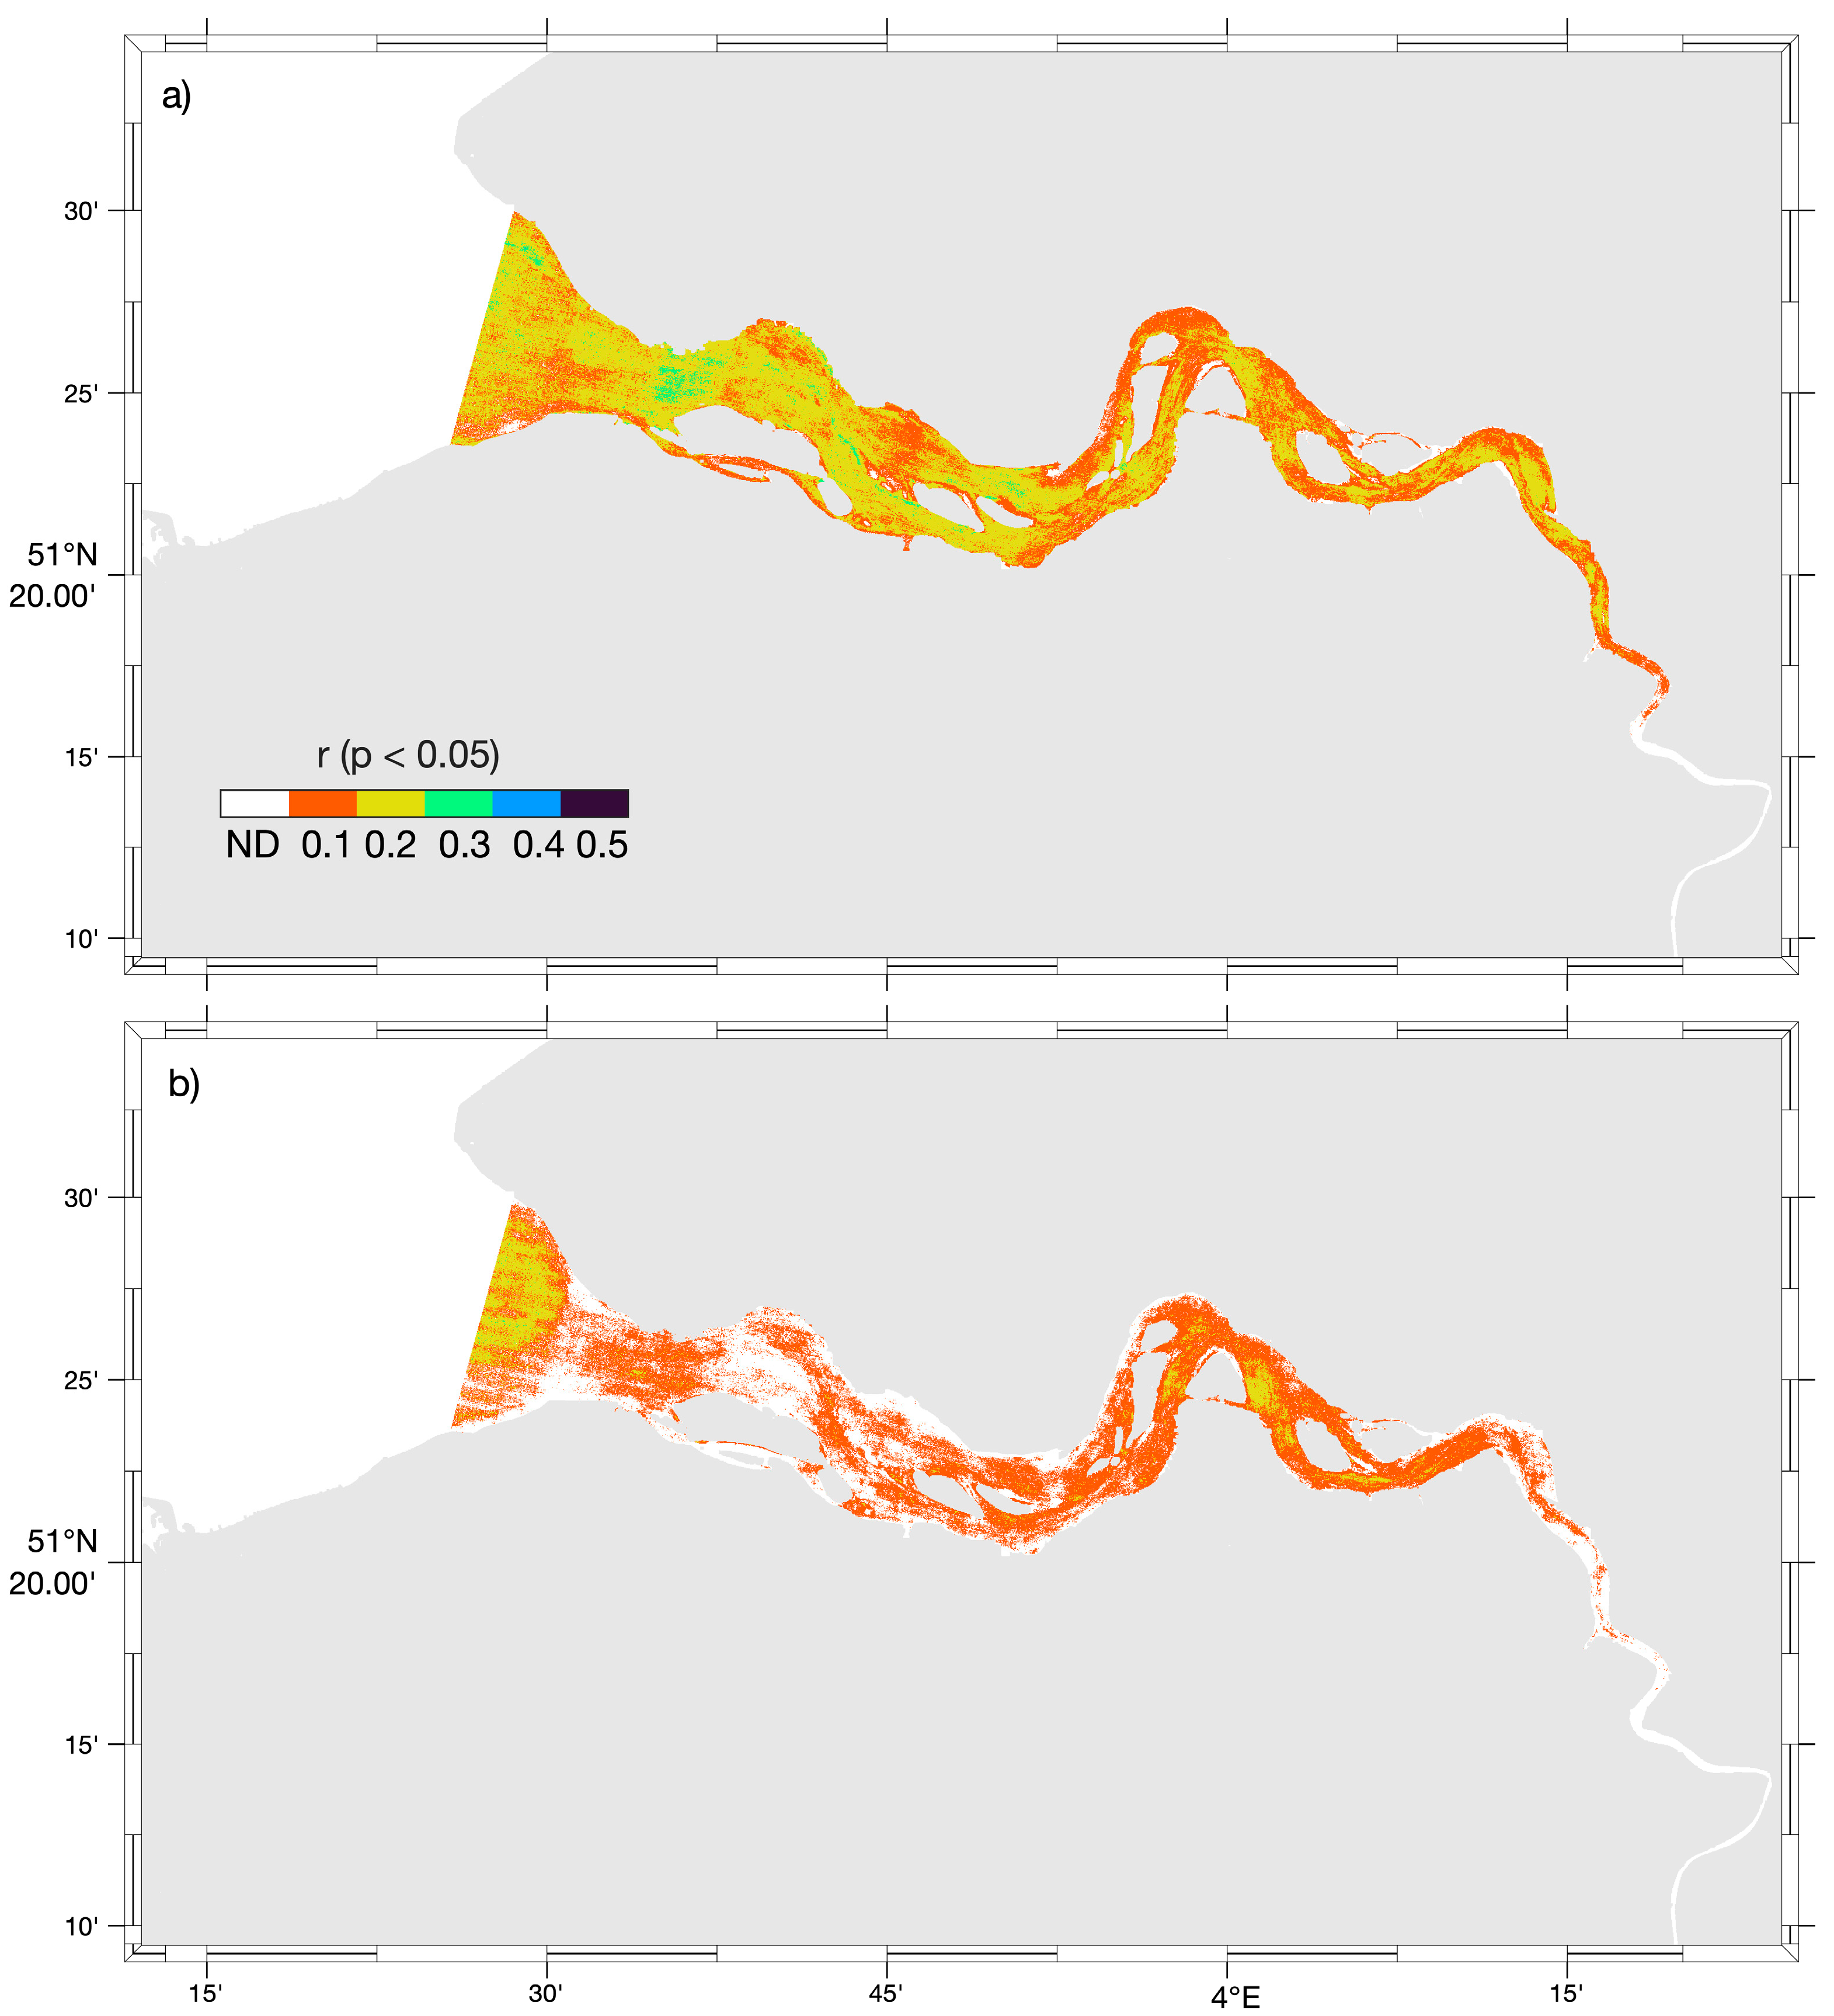
We observed a statistically significant daily correlation of SPM with river discharge (Kendall-tau correlation r » 0.1–0.3; Figure 8a) and a weaker correlation with daily wind speed (Kendall-tau correlation r » 0.1–0.2; Figure 8b). The TMZ-dominated area presented no significant relationship with either river discharge or wind speed for the period.
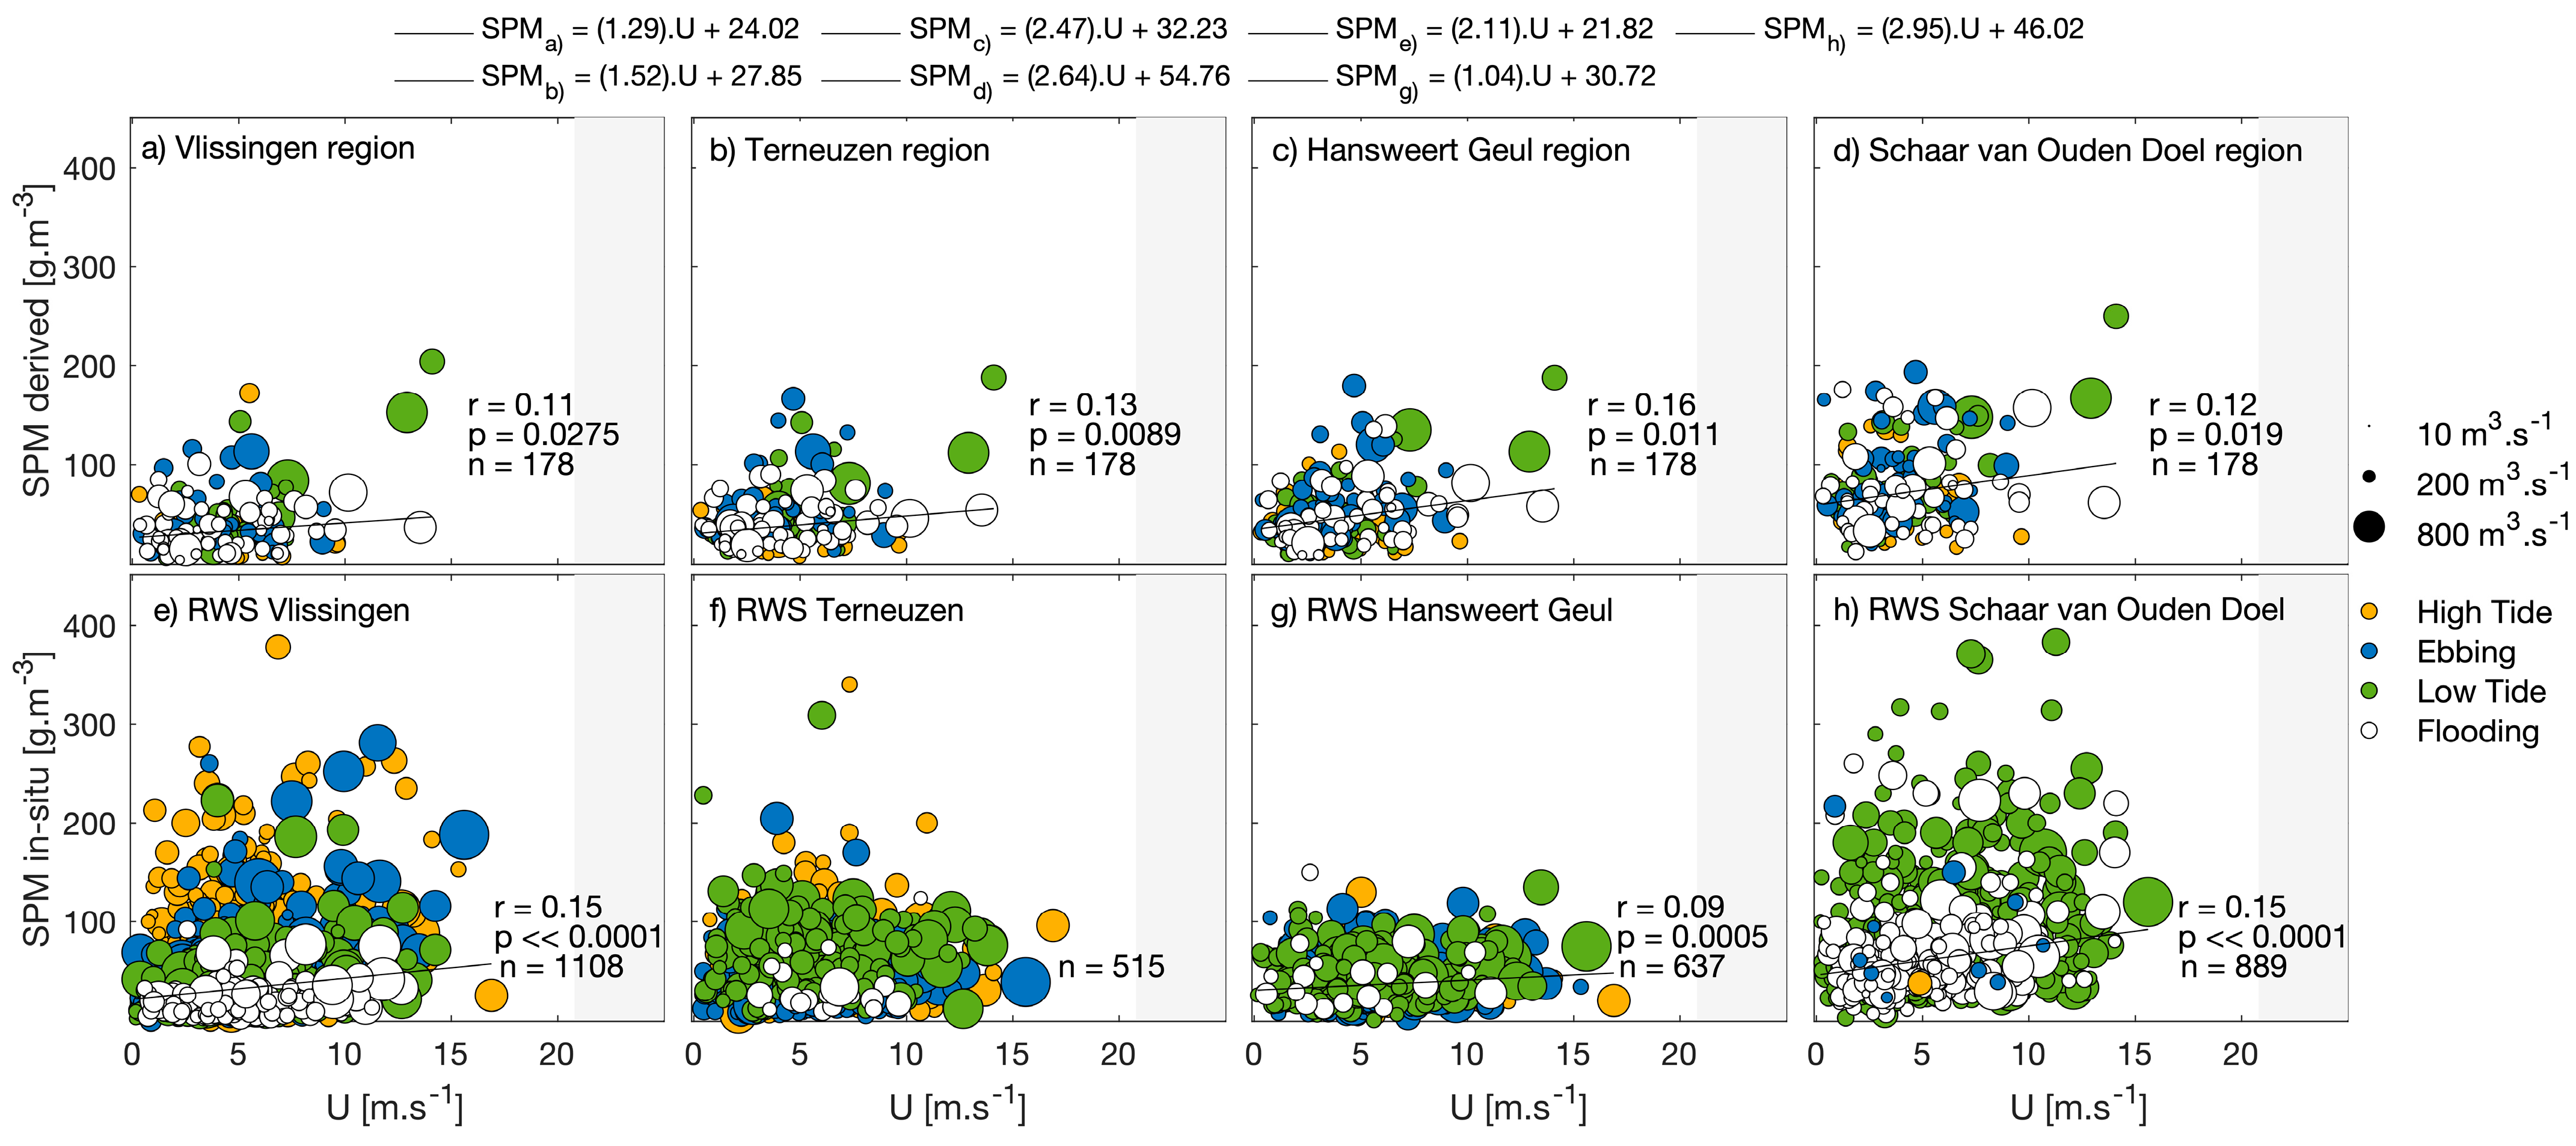
Furthermore, we investigated in situ SPM in the long-term stations in comparison with satellite-derived SPM at each region surrounding the in situ stations (Figure 9 and Figure 10). All relationships are statistically significant, and estimated intercepts are comparable (within about ±15% difference) between each satellite region (Figure 9a–d) and respective in situ stations (Figure 9e–h).
While river discharge relationships with SPM are observed on the high extreme event range (grey regions in Figure 9), there was no observation from satellite nor in situ SPM carried out during extremely high wind speed settings (Figure 10). The lack of SPM observations during windstorm conditions prevents our analysis from assessing possible responses in SPM in such circumstances. Additionally, the statistically significant relationships between SPM and wind speed are weak (and weaker than the relationships with river discharge).

4. Discussion

4.1. Assessing Estuarine SPM Concentrations from Landsat Satellite Sensors

We assessed the effects of river discharge and wind on the variability in Suspended Particulate Matter (SPM) using remote sensing and in situ data. The unique 37-year data record of Landsat-5, -7, and -8 sensors, coupled with improved data processing, allows for investigating these relationships in a spatially explicit context.
The overall agreement between in situ SPM and satellite-estimated SPM concentrations confirms the accuracy of satellite observation and the used NIR-band algorithm [40] to derive SPM. In particular, the band-weighted coefficients used in the present paper give a reasonably better performance for SPM in the NIR band than the original narrow-band coefficients. Band-weighting is a more accurate technique for (broad-band) satellite-derived water quality products. This highest accuracy makes band-weighted coefficients desirable over narrow-band coefficients (e.g., reference [39]) for best algorithm performance [49]. However, band-weighting may be somewhat limited by the SRF (Spectral Response Function) spectral limits in the NIR band of Landsat-5 (760–900 nm), Landsat-7 (770–9000 nm), and Landsat-8 (829–900 nm) because their ranges are not fully covered by the spectral resolution provided in the original narrow-band coefficients (520–885 nm). This source of uncertainty was addressed in Supplementary Material S1. Our results, therefore, provide a cautious note and a recommendation on applying band-weighted coefficients for Landsat-5, -7, and -8 given the spectral data limitations.
For both NIR and red-based SPM estimates, other relevant sources of uncertainties may result from (1) space and time differences between in situ sampling and satellite overpass when sampling in patchy waters or highly dynamic environments, i.e., we observed that a time interval of 60 min might be a large interval for a system such as the Scheldt; and (2) (specific) inherent optical properties, namely absorption and backscattering of particles may vary, i.e., due to the natural or human-induced variability in particle size (e.g., formation of flocs), or particle composition (e.g., seasonal plankton bloom; refer to Supplementary Material I in reference [38]). Additionally, results showed that in the turbid waters of the Scheldt Estuary, the performance of the red band was less optimal than the NIR, which may also be attributed, to a degree, to the saturation of reflectance and the contribution of Colored Dissolved Organic Matter (CDOM) to the total SPM estimate which reference [40] observed could underestimate SPM by about 22% in the red band and by 2% in the NIR.
Finally, from the frequency histograms, the magnitudes and spatial patterns of satellite-derived SPM from the NIR band were consistent with long-term in situ observations at four stations along the Scheldt Estuary. These are the reasons why we believe applying NIR bands is the most adequate choice for SPM estimates, especially under extreme event conditions.

4.2. SPM Variability from Interaction with Estuarine Forcing Mechanisms and Its Limitations

We have found that, in general, the relationship of SPM was stronger with river discharge, and weaker with wind speed (by 50%). In addition, while river discharge presents a similar spatial relationship with SPM along the estuary, winds present more zones of statistically non-significant relationships. A relatively stronger correlation was observed west of RWS Vlissingen station and in the RWS Hansweert Geul region. Our analysis also suggests large SPM variability under lower river discharge (i.e., Q < 250 m3·s−1) and a linearly increasing trend in SPM concentrations under higher river discharge (i.e., Q > 250 m3·s−1, including extremely high river discharge episodes), while large SPM variability is observed at all wind speeds (U < 15 m·s−1). Wind direction may also relate to SPM variability: we observed that overall stronger wind speeds and peaks of SPM are more frequent during NE and S-SW wind conditions.
We speculate that the large SPM variability and consequently relatively low correlation coefficients observed from the interaction with river discharge and wind speeds may be explained by tidal influence and delayed effects on SPM. In the Scheldt, tides were observed to be significant across the estuary. From the studies by references [23,27], we speculate that the high variability in SPM may partially be explained by sediment transport from tidal flats (likely observed at the end of low tide and flooding); entrainment and advection processes, especially in the mid and upper estuary (i.e., presence of the TMZ); and high tidal current velocities responsible for mixing processes (in high tide and ebbing). In our study, we considered only the instantaneous effects of river discharge and wind over SPM concentrations, while a delayed effect (e.g., long settling time) of high SPM could have been captured when SPM data were sampled.
Analyses based on satellite-derived or in situ SPM are proven to have their inherent limitations. Reference [23] concluded that remote sensing by sun-synchronous sensors may overrepresent SPM at certain tidal stages, while SPM is underrepresented seasonally (i.e., winter months) due to cloud cover. From in situ SPM, we have observed a similar misrepresentation of SPM. When SPM in situ sampling is carried out on the same day (i.e., within hours among RWS Vlissingen, RWS Terneuzen, RWS Hansweert Geul, and RWS Schaar van Ouden Doel stations), changes in a tidal stage are likely observed, as an interval of just a few hours is long enough for a change in tidal stage, current direction, and SPM dynamics. Finally, in situ sampling is seasonally less biased than satellite remote sensing, yet it also underrepresents extreme wind events.

4.3. Effects of Extreme Events on SPM

Extreme events in river discharge and wind speed (windstorms) were expected to play a role in the complex SPM dynamics, especially—if not exclusively—in winter months, as river discharge is at its maximum flow, likely carrying a higher input of inland sediments in suspension, and when wind-driven waves are expected to regulate resuspension of bottom sediment and prevent SPM from settling. Our study, however, shows the limitation of data collection of SPM in extreme wind events: neither long-term high spatial resolution satellite imagery (limited overpass, likely cloud conditions during storms) nor in situ data (monitoring ships will not sail during storms) were available to capture SPM under extremely high wind conditions. Therefore, our regressions concerning wind speed and SPM do not consider extremely high wind events preventing a more detailed analysis of windstorms. In contrast, SPM observations (both in situ and satellite-derived estimates) were possible during extremely high river discharge conditions, although in a low number of samples. In that sense, extrapolation of the system’s response during extreme river discharge events surpassing the range of data analyzed here is discouraged.
Our regression analysis did not reveal significant linear changes in the magnitude, frequency, and duration of windstorms revealing the stochastic nature of extreme wind events. However, we qualitatively observed decadal peaks in the magnitude of windstorms. We suggest for future studies that a longer time series may be used to investigate the occurrence of any non-linear temporal patterns of extreme wind events in the Scheldt. Extreme river discharge has experienced stepwise declines over the past decades, indicating a reduction in sediment discharge, i.e., a decline in the winter magnitude of river discharge but also a significant decline in the duration of extreme events. We speculate that this might be associated with engineering works particularly in the Sea Scheldt, such as the so-called SigmaPlan (https://www.sigmaplan.be, accessed on 21 December 2022) in Belgium, which includes the construction of natural flood-control areas in the river valleys to capture excess river water to manage floodwater levels.
Numerous studies have described the relationship and effects of estuarine drivers of SPM dynamics in multiple coastal sites, e.g., references [16,50,51], most of which, such as the Scheldt Estuary, shelter large population counts and have undergone a series of human-made adaptations to prevent the unwanted effects of extreme events. However, due to the particularities of each system, the responses to extreme events are diverse. For example, the Mekong River Delta (Vietnam) [50] was described with positive feedback between river discharge and the amount of SPM during the monsoon season due to stronger river discharge and intensified wind-induced resuspension. In contrast, reference [51] observed a sharp loss of turbidity in the occurrence of flood events (river discharge above the 75th percentile) in the macrotidal Gironde Estuary (France), and reference [16] observed lower turbidity in the microtidal estuary of Río de la Plata (Uruguay) caused by periods of intensified river discharge due to excessive rain. However positive (i.e., increase in turbidity with extreme events) or negative (i.e., turbidity dilution) the trend with SPM, it is rational to expect that extreme events represent changes in the local SPM dynamics and that these changes likely also affect other aspects of the estuary (e.g., changes in water quality and sediment-related biota [21], or shoreline recession of tidal flats [52]). We also speculate that the effects of extreme events in the diverse biogeochemical aspects of the estuary are not uniform along the estuary, e.g., reference [53], thus affecting more the sites and regions that are not used to large variability in SPM. In such sites, the biota may be less resilient to environmental changes, or a temporary loss of species richness and species composition may be observed. For example, the dynamics may change more drastically with an above-the-records extreme event in the region surrounding Hansweert Geul station than in the region of Schaar van Ouden Doel station. The latter region is more susceptible to (frequent) large SPM variability and/or species biologically adapted to low light conditions and increased turbulent conditions in the water column, for example.

4.4. Transferable Lessons and Opportunities to Monitor SPM in Extreme Events

The effects of extreme events on SPM patterns (and patterns of other optically active parameters such as chlorophyll or colored organic matter) using remote sensing techniques may also be assessed on other estuarine and coastal systems, regardless of the main drivers of dynamics. Large coastal systems may resort to low spatial and high temporal resolution satellite sensors such as MODIS or VIIRS to study short-term or event-specific variability (e.g., reference [54]), or even to geostationary satellite sensors (e.g., reference [10]). Studies of smaller coastal water bodies still rely on a high spatial resolution characterized by a lower temporal resolution such as Sentinel–2 or Landsat-5, -7, -8 (e.g., the present study, [24]). Sensors with higher temporal resolution may be exploited to observe the state of the estuary during extreme events, or to make a comparison of the situation directly before and after the occurrence of events, as long as atmospheric conditions allow. In addition, the combined application of multiple satellite sensors could be more effective and fill gaps in our current observation of estuarine dynamics.
Our synergetic use of satellite-derived SPM and in situ data of river discharge and wind show exactly where the drivers of SPM variability have the most effect within the estuary. Satellite data providing unique spatial observations could then be complemented with moored stations at strategic locations (e.g., derived from the correlation maps of SPM and their drivers) equipped with optical (e.g., turbidimeters) and/or acoustic (e.g., Acoustic Doppler Current Profiler—ADCP) calibrated instruments to represent the highest temporal and continuous data sampling available—regardless of weather or sea state (e.g., references [51,55]).
For instance, based on our results and the successful examples of high-resolution turbidity sensors (e.g., the MAGEST program in the Gironde estuary (https://magest.oasu.u-bordeaux.fr/, accessed on 21 December 2022) [51,56]), we reason that the two best suitable locations for those sensors would likely be site I, West of the estuary mouth, where both spatial correlations of river discharge and wind speed were stronger and which is likely a region to be most affected by windstorms, and site II at the upper-most section of the estuary, where no spatial correlation was statistically significant, a possibility due to the almost permanent effect of the TMZ in the area (see location in Figure 1 for the suggested sites I and II, respectively). We speculate that with a data acquisition on the order of minutes, those high temporal resolution instruments, in strategic locations (sites I and II), are most likely able to capture the complex SPM variability that in situ data or satellite sensors are only partially able to explain. Additional opportunities include providing valuable insights towards assessing sediment budget/flow, migration, and expansion of the TMZ, or feeding ecological and hydrodynamical models.

5. Conclusions

This study contributes to the understanding of the spatial relationship between SPM and river discharge and wind speed. From the results of this study, we conclude that (1) the duration of extreme river discharge significantly decreased in the past 37 years (1984–2020), (2) satellite data at low temporal resolution is likely unable to capture extreme wind or river discharge events, while in situ SPM data are not sampled during extreme wind events for safety reasons, (3) SPM derived from the red band (or wavelengths < 800 nm) is less optimal to capture the peaks in SPM concentration that are expected during extreme events, and (4) synoptic satellite (Landsat) time series can be used in combination with time series of drivers, such as river discharge and wind, to capture where these forcing mechanisms affect SPM within an estuary as a tool to establish best locations for moored sensor stations.
Additional temporal point data of moored turbidimeters at strategic locations can complement these insights by providing data under particularly extreme events. Such a synergistic approach is valid both for retrieving and attributing the spatial and long-term temporal variability in SPM in estuaries around the world.

Supplementary Materials

The following supporting information can be downloaded at: https://www.mdpi.com/article/10.3390/rs15030670/s1. Table S1: Overview of in situ data. Table S2: Coefficients A and C of SPM algorithm. Original narrow-band and band-weighted coefficients (A and C; Equation (1) in main text) in the used SPM algorithm for each satellite sensor. Acronyms for satellite sensors are: TM (Thematic Mapper), ETM+ (Enhanced Thematic Mapper), and OLI (Operational Land Imager). Table S3: Match-up information data. In situ data is provided by RWS and by NIOZ. Refer to main text for full SPM data description. L5 is Landsat-5, L7 is Landsat-7, and L8 is Landsat-8. Figure S1: Interannual variability of SPM from in situ RWS datasets (grey scatter) and satellite-derived SPM (yellow scatter) relative to each region delimited in Figure 1 (main text). Overall yearly median is represented by black line. Figure S2A: Distribution of total number of satellite scenes and in situ SPM per classes of boreal season. Figure S2B: Distribution of total number of in-situ SPM data (from in situ data RWS) per classes of boreal season (a), (c), (e), (g), daily river discharge and (b), (d), (f), (h), daily wind speed. Shared areas mark the threshold for extreme events. Figure S3: Relationship between wind direction and SPM. Panels (a), (c), (e), (g) represent the median satellite-derived SPM in the delimited region (refer to Figure 1 in main text). Panels (b), (d), (f), (h) represent the RWS long-term SPM in situ stations. Shaded areas represent each of the eight wind directions: northeast (NE centered at 45°), east (E; centered at 90°), south-east (SE; centered at 135°), south (S; centered at 180°), south-west (SW; centered at 225°), north-west (NW; centered at 315°), and north (N; centered at 0° or 360°). Scatter size is proportional to wind speed. And Supplementary Material S7: Band-weighted uncertainties in the NIR bands. Reference [57] is cited in Supplementary Materials.

Author Contributions

J.T.: conceptualization, investigation, methodology, software, validation, visualization, writing—original draft, writing, and review and editing. D.v.d.W.: conceptualization; funding acquisition; methodology; supervision; writing—original draft, writing, and review and editing. C.M.M.: supervision, writing, and review and editing. M.S.S.: methodology; software, validation, writing, and review and editing. M.P.d.V.: writing and review and editing. All authors have read and agreed to the published version of the manuscript.

Funding

This research received no external funding.

Data Availability Statement

The datasets generated/analyzed for this study will be found in the DANS (Data Archiving and Networked Services) repository. Additionally, data processing scripts can be made available upon request to the corresponding author.

Acknowledgments

The authors are grateful to USGS for openly providing Landsat-5, -7, and -8 imagery, and to KNMI, Rijkwaterstaad, and NIOZ for the in situ data. The authors are also grateful to Quinten Vanhellemont for his fast support on the ACOLITE forum. The authors would like to thank Emmanuel Boss for useful insights on the validation procedures of satellite SPM and the reviewers.

Conflicts of Interest

The authors declare no conflict of interest.

References

  1. Stall, J.B. Effects of Sediment on Water Quality. J. Environ. Qual. 1972, 1, 353–360. [Google Scholar] [CrossRef]
  2. Olsen, C.R.; Larsen, I.L.; Mulholland, P.J.; Von Damm, K.L.; Grebmeier, J.; Schaffner, L.C.; Diaz, R.J.; Nichols, M.M. The Concept of an Equilibrium Surface Applied to Particle Sources and Contaminant Distributions in Estuarine Sediments. Estuaries 1993, 16, 683–696. [Google Scholar] [CrossRef]
  3. IOCCG. Uncertainties in Ocean Colour Remote Sensing; Mélin, F., Ed.; Report Serie; International Ocean Color Coordinating Group: Dartmouth, NS, Canada, 2019; ISBN 9780415475976. [Google Scholar]
  4. Wetsteyn, L.P.M.J.; Kromkamp, J.C. Turbidity, Nutrients and Phytoplankton Primary Production in the Oosterschelde (The Netherlands) before, during and after a Large-Scale Coastal Engineering Project (1980–1990). Hydrobiologia 1994, 282–283, 61–78. [Google Scholar] [CrossRef]
  5. Schallenberg, M.; Burns, C.W. Effects of Sediment Resuspension on Phytoplankton Production: Teasing Apart the Influences of Light, Nutrients and Algal Entrainment. Freshw. Biol. 2004, 49, 143–159. [Google Scholar] [CrossRef]
  6. Harrison, E.; Norris, R.; Wilkinson, S. The Impact of Fine Sediment Accumulation on Benthic Macroinvertebrates: Implications for River Management. In Proceedings of the 5th Australian Stream Management Conference, Albury, NSW, Australia, 21–25 May 2007; pp. 139–144. [Google Scholar]
  7. Meire, P.; Ysebaert, T.; Van Damme, S.; Van Den Bergh, E.; Maris, T.; Struyf, E. The Scheldt Estuary: A Description of a Changing Ecosystem. Hydrobiologia 2005, 540, 1–11. [Google Scholar] [CrossRef]
  8. Fettweis, M.; Sas, M.; Monbaliu, J. Seasonal, Neap-Spring and Tidal Variation of Cohesive Sediment Concentration in the Scheldt Estuary, Belgium. Estuar. Coast. Shelf Sci. 1998, 47, 21–36. [Google Scholar] [CrossRef]
  9. Doxaran, D.; Ruddick, K.; McKee, D.; Gentili, B.; Tailliez, D.; Chami, M.; Babin, M. Spectral Variations of Light Scattering by Marine Particles in Coastal Waters, from Visible to near Infrared. Limnol. Oceanogr. 2009, 54, 1257–1271. [Google Scholar] [CrossRef] [Green Version]
  10. Constantin, S.; Doxaran, D.; Derkacheva, A.; Novoa, S.; Lavigne, H. Multi-Temporal Dynamics of Suspended Particulate Matter in a Macro-Tidal River Plume (the Gironde) as Observed by Satellite Data. Estuar. Coast. Shelf Sci. 2018, 202, 172–184. [Google Scholar] [CrossRef]
  11. Mulligan, R.P.; Smith, P.C.; Tao, J.; Hill, P.S. Wind-Wave and Tidally Driven Sediment Resuspension in a Macrotidal Basin. Estuaries Coasts 2019, 42, 641–654. [Google Scholar] [CrossRef]
  12. Andutta, F.P.; Wang, X.H.; Li, L.; Williams, D. Hydrodynamics and Sediment Transport in a Macro-Tidal Estuary: Darwin Harbour, Australia. In Estuaries of Australia in 2050 and Beyond; Springer: Dordrecht, The Netherlands, 2014; pp. 111–129. [Google Scholar] [CrossRef] [Green Version]
  13. Seneviratne, S.I.; Nicholls, N.; Easterling, D.; Goodess, C.M.; Kanae, S.; Kossin, J.; Luo, Y.; Marengo, J.; Mc Innes, K.; Rahimi, M.; et al. Changes in Climate Extremes and Their Impacts on the Natural Physical Environment. In Managing the Risks of Extreme Events and Disasters to Advance Climate Change Adaptation: Special Report of the Intergovernmental Panel on Climate Change; Field, C.B., Barros, V., Stocker, T.F., Qin, D., Dokken, D.J., Ebi, K.L., Mastrandrea, M.D., Mach, K.J., Plattner, G.-K., Allen, S.K., et al., Eds.; Cambridge University Press: Cambridge, UK; New York, NY, USA, 2012; Volume 9781107025, pp. 109–230. ISBN 9781139177245. [Google Scholar]
  14. Scavia, D.; Field, J.C.; Boesch, D.F.; Buddemeier, R.W.; Burkett, V.; Cayan, D.R.; Fogarty, M.; Harwell, M.A.; Howarth, R.W.; Mason, C.; et al. Climate Change Impacts on U.S. Coastal and Marine Ecosystems. Estuaries 2002, 25, 149–164. [Google Scholar] [CrossRef]
  15. Paerl, H.W. Assessing and Managing Nutrient-Enhanced Eutrophication in Estuarine and Coastal Waters: Interactive Effects of Human and Climatic Perturbations. Ecol. Eng. 2006, 26, 40–54. [Google Scholar] [CrossRef]
  16. Dogliotti, A.I.; Ruddick, K.; Guerrero, R. Seasonal and Inter-Annual Turbidity Variability in the RíO de La Plata from 15 Years of MODIS: El NiñO Dilution Effect. Estuar. Coast. Shelf Sci. 2016, 182, 27–39. [Google Scholar] [CrossRef] [Green Version]
  17. Stanev, E.V.; Brink-Spalink, G.; Wolff, J.O. Sediment Dynamics in Tidally Dominated Environments Controlled by Transport and Turbulence: A Case Study for the East Frisian Wadden Sea. J. Geophys. Res. Oceans 2007, 112, 1–20. [Google Scholar] [CrossRef] [Green Version]
  18. van Kessel, T.; Vanlede, J.; de Kok, J. Development of a Mud Transport Model for the Scheldt Estuary. Cont. Shelf Res. 2011, 31, S165–S181. [Google Scholar] [CrossRef] [Green Version]
  19. van Maren, D.S.; Winterwerp, J.C.; Vroom, J. Fine Sediment Transport into the Hyper-Turbid Lower Ems River: The Role of Channel Deepening and Sediment-Induced Drag Reduction. Ocean Dyn. 2015, 65, 589–605. [Google Scholar] [CrossRef] [Green Version]
  20. Chen, M.S.; Wartel, S.; Van Eck, B.; Van Maldegem, D. Suspended Matter in the Scheldt Estuary. Hydrobiologia 2005, 540, 79–104. [Google Scholar] [CrossRef]
  21. Cox, T.J.S.; Maris, T.; Van Engeland, T.; Soetaert, K.; Meire, P. Critical Transitions in Suspended Sediment Dynamics in a Temperate Meso-Tidal Estuary. Sci. Rep. 2019, 9, 12745. [Google Scholar] [CrossRef] [PubMed] [Green Version]
  22. Doxaran, D.; Froidefond, J.; Castaing, P. Remote-Sensing Reflectance of Turbid Sediment-Dominated Waters. Reduction of Sediment Type Variations and Changing Illumination Conditions Effects by Use of Reflectance Ratios. Appl. Opt. 2003, 42, 2623–2634. [Google Scholar] [CrossRef] [PubMed]
  23. Eleveld, M.A.; van der Wal, D.; Van Kessel, T. Estuarine Suspended Particulate Matter Concentrations from Sun-Synchronous Satellite Remote Sensing: Tidal and Meteorological Effects and Biases. Remote Sens. Environ. 2014, 143, 204–215. [Google Scholar] [CrossRef] [Green Version]
  24. Normandin, C.; Lubac, B.; Sottolichio, A.; Frappart, F.; Ygorra, B.; Marieu, V. Analysis of Suspended Sediment Variability in a Large Highly Turbid Estuary Using a 5-Year-Long Remotely Sensed Data Archive at High Resolution. J. Geophys. Res. Oceans 2019, 124, 2019JC015417. [Google Scholar] [CrossRef] [Green Version]
  25. van der Wal, D.; Forster, R.M.; Rossi, F.; Hummel, H.; Ysebaert, T.; Roose, F.; Herman, P.M.J. Ecological Evaluation of an Experimental Beneficial Use Scheme for Dredged Sediment Disposal in Shallow Tidal Waters. Mar. Pollut. Bull. 2011, 62, 99–108. [Google Scholar] [CrossRef] [PubMed]
  26. Vet, P.L.M.; Prooijen, B.C.; Colosimo, I.; Ysebaert, T.; Herman, P.M.J.; Wang, Z.B. Sediment Disposals in Estuarine Channels Alter the Eco-Morphology of Intertidal Flats. J. Geophys. Res. Earth Surf. 2020, 125, e2019JF005432. [Google Scholar] [CrossRef] [Green Version]
  27. Verlaan, P.A.J. Marine vs Fluvial Bottom Mud in the Scheldt Estuary. Estuar. Coast. Shelf Sci. 2000, 50, 627–638. [Google Scholar] [CrossRef]
  28. Lee, B.J.; Fettweis, M.; Toorman, E.; Wang, J. Multimodal Particle Size Distribution in a Coastal Zone. In Proceedings of the Abstract of 11th International Conference on Cohesive Sediment Transport Processes (INTERCOH XI), Shanghai, China, 18–21 October 2011; p. 2. [Google Scholar]
  29. Manning, A.J.; Van Kessel, T.; Melotte, J.; Sas, M.; Winterwerp, H.; Pidduck, E.L. On the Consequence of a New Tidal Dock on the Sedimentation Regime in the Antwerpen Area of the Lower Sea Scheldt. Cont. Shelf Res. 2011, 31, S150–S164. [Google Scholar] [CrossRef]
  30. Manning, A.J.; Martens, C.; De Mulder, T.; Vanlede, J.; Winterwerp, J.C.; Ganderton, P.; Graham, G.W. Mud Floc Observations in the Turbidity Maximum Zone of the Scheldt Estuary during Neap Tides. In Journal of Coastal Research, SI 50 (Proceedings of the 9th International Coastal Symposium), Gold Coast, Australia, 25–29 April 2007; Coastal Education & Research Foundation, Inc.: Coconut Creek, FL, USA, 2007; pp. 832–836. [Google Scholar]
  31. Fettweis, M.; Van den Eynde, D. The Mud Deposits and the High Turbidity in the Belgian–Dutch Coastal Zone, Southern Bight of the North Sea. Cont. Shelf Res. 2003, 23, 669–691. [Google Scholar] [CrossRef]
  32. Gerrtisen, H.; Wang, Z.B.; van der Weck, A. Morfologische Interpretatie Can de Veranderingen in Het Getij van de Westerchelde; Report Z2671; Deltares (WL): Delft, The Netherlands, 1999. [Google Scholar]
  33. Allen, G.P.; Salomon, J.C.; Bassoullet, P.; Du Penhoat, Y.; de Grandpré, C. Effects of Tides on Mixing and Suspended Sediment Transport in Macrotidal Estuaries. Sediment. Geol. 1980, 26, 69–90. [Google Scholar] [CrossRef]
  34. Baeyens, W.; Van Eck, B.; Lambert, C.; Wollast, R.; Goeyens, L. General Description of the Scheldt Estuary. Hydrobiologia 1997, 366, 1–14. [Google Scholar] [CrossRef]
  35. Baeye, M.; Fettweis, M.; Voulgaris, G.; Van Lancker, V. Sediment Mobility in Response to Tidal and Wind-Driven Flows along the Belgian Inner Shelf, Southern North Sea. Ocean Dyn. 2011, 61, 611–622. [Google Scholar] [CrossRef]
  36. Sistermans, P.; Nieuwenhuis, O. Western Scheldt Estuary (the Netherlands). Eurosion Case Study 2004, 31, 1–14. [Google Scholar]
  37. Soetaert, K.; Middelburg, J.J.; Heip, C.; Meire, P.; Van Damme, S.; Maris, T. Long-Term Change in Dissolved Inorganic Nutrients in the Heterotrophic Scheldt Estuary (Belgium, The Netherlands). Limnol. Oceanogr. 2006, 51, 409–423. [Google Scholar] [CrossRef] [Green Version]
  38. Vanhellemont, Q.; Ruddick, K. Atmospheric Correction of Metre-Scale Optical Satellite Data for Inland and Coastal Water Applications. Remote Sens. Environ. 2018, 216, 586–597. [Google Scholar] [CrossRef]
  39. Vanhellemont, Q. Adaptation of the Dark Spectrum Fitting Atmospheric Correction for Aquatic Applications of the Landsat and Sentinel-2 Archives. Remote Sens. Environ. 2019, 225, 175–192. [Google Scholar] [CrossRef]
  40. Nechad, B.; Ruddick, K.G.; Park, Y. Calibration and Validation of a Generic Multisensor Algorithm for Mapping of Total Suspended Matter in Turbid Waters. Remote Sens. Environ. 2010, 114, 854–866. [Google Scholar] [CrossRef]
  41. Luo, Y.; Doxaran, D.; Ruddick, K.; Shen, F.; Gentili, B.; Yan, L.; Huang, H. Saturation of Water Reflectance in Extremely Turbid Media Based on Field Measurements, Satellite Data and Bio-Optical Modelling. Opt. Express 2018, 26, 10435. [Google Scholar] [CrossRef] [PubMed] [Green Version]
  42. Bailey, S.W.; Werdell, P.J. A Multi-Sensor Approach for the on-Orbit Validation of Ocean Color Satellite Data Products. Remote Sens. Environ. 2006, 102, 12–23. [Google Scholar] [CrossRef]
  43. Laws, E. Mathematical Methods for Oceanographers: An Introduction; John Wiley and Sons: New York, NY, USA, 1997. [Google Scholar]
  44. Peltzer, E.T. Least Squares, Type 2 Regression Fit (Revised in 2016). MBARI. Available online: http://www.mbari.org/index-of-downloadable-files/ (accessed on 27 October 2021).
  45. Werdell, P.J.; Bailey, S.W.; Franz, B.A.; Harding, L.W.; Feldman, G.C.; McClain, C.R. Regional and Seasonal Variability of Chlorophyll-a in Chesapeake Bay as Observed by SeaWiFS and MODIS-Aqua. Remote Sens. Environ. 2009, 113, 1319–1330. [Google Scholar] [CrossRef]
  46. Danziger, Z. Theil-Sen Robust Linear Regression 2021. MATLAB Central File Exchange. Available online: https://www.mathworks.com/matlabcentral/fileexchange/48294-theil-sen-robust-linear-regression (accessed on 27 October 2021).
  47. Ratner, B. The Correlation Coefficient: Its Values Range between 1/1, or Do They. J. Target. Meas. Anal. Mark. 2009, 17, 139–142. [Google Scholar] [CrossRef] [Green Version]
  48. Novoa, S.; Doxaran, D.; Ody, A.; Vanhellemont, Q.; Lafon, V.; Lubac, B.; Gernez, P. Atmospheric Corrections and Multi-Conditional Algorithm for Multi-Sensor Remote Sensing of Suspended Particulate Matter in Low-to-High Turbidity Levels Coastal Waters. Remote Sens. 2017, 9, 61. [Google Scholar] [CrossRef] [Green Version]
  49. Cao, Z.; Ma, R.; Duan, H.; Xue, K. Effects of Broad Bandwidth on the Remote Sensing of Inland Waters: Implications for High Spatial Resolution Satellite Data Applications. ISPRS J. Photogramm. Remote Sens. 2019, 153, 110–122. [Google Scholar] [CrossRef]
  50. Loisel, H.; Mangin, A.; Vantrepotte, V.; Dessailly, D.; Ngoc Dinh, D.; Garnesson, P.; Ouillon, S.; Lefebvre, J.P.; Mériaux, X.; Minh Phan, T. Variability of Suspended Particulate Matter Concentration in Coastal Waters under the Mekong’s Influence from Ocean Color (MERIS) Remote Sensing over the Last Decade. Remote Sens. Environ. 2014, 150, 218–230. [Google Scholar] [CrossRef]
  51. Jalón-Rojas, I.; Schmidt, S.; Sottolichio, A. Turbidity in the Fluvial Gironde Estuary (Southwest France) Based on 10-Year Continuous Monitoring: Sensitivity to Hydrological Conditions. Hydrol. Earth Syst. Sci. 2015, 19, 2805–2819. [Google Scholar] [CrossRef] [Green Version]
  52. Duong, T.M. Climate Change Induced Coastline Change Adjacent to Small Tidal Inlets. Front. Mar. Sci. 2021, 8, 1860. [Google Scholar] [CrossRef]
  53. Kromkamp, J.C.; Van Engeland, T. Changes in Phytoplankton Biomass in the Western Scheldt Estuary during the Period 1978–2006. Estuaries Coasts 2010, 33, 270–285. [Google Scholar] [CrossRef] [Green Version]
  54. Edmiston, H.L.; Fahrny, S.A.; Lamb, M.S.; Levi, L.K.; Wanat, J.M.; Avant, J.S.; Wren, K.; Selly, N.C. Tropical Storm and Hurricane Impacts on a Gulf Coast Estuary: Apalachicola Bay, Florida. J. Coast. Res. 2008, 10055, 38–49. [Google Scholar] [CrossRef] [Green Version]
  55. Jalón-Rojas, I.; Schmidt, S.; Sottolichio, A. Comparison of Environmental Forcings Affecting Suspended Sediments Variability in Two Macrotidal, Highly-Turbid Estuaries. Estuar. Coast. Shelf Sci. 2017, 198, 529–541. [Google Scholar] [CrossRef]
  56. Jalón-Rojas, I.; Schmidt, S.; Sottolichio, A.; Bertier, C. Tracking the Turbidity Maximum Zone in the Loire Estuary (France) Based on a Long-Term, High-Resolution and High-Frequency Monitoring Network. Cont. Shelf Res. 2016, 117, 1–11. [Google Scholar] [CrossRef]
  57. Nechad, B.; Ruddick, K.G.; Neukermans, G. Calibration and Validation of a Generic Multisensor Algorithm for Mapping of Turbidity in Coastal Waters. In Remote Sensing of the Ocean, Sea Ice, and Large Water Regions 2009; SPIE: Bellingham, WA, USA, 2009. [Google Scholar] [CrossRef]
Figure 1. Scheldt Estuary (Western Scheldt in the Netherlands (NDL) and Sea Scheldt Estuary in Belgium (BEL), respectively). Polygons indicate selected limits surrounding each in situ data station. Yellow round markers indicate the locations of NIOZ in situ SPM stations (a(station #1), c(#2), d(#3), f(#4), m(#13), n(#14), o(#15), p(#16), and q(#17)) and black circles represent the location of the RWS in situ SPM stations (b(RWS Vlissingen), e(Pas van Terneuzen boei 10), g(RWS Terneuzen), h(Hansweert overloop boei 28), i(Hoedekenskerke boei 4), j(Zuidergat boei 49), k(RWS Hansweert Geul), l(RWS Schaar van Ouden Doel)). The yellow hatched area depicts the region of TMZ occurrence (within this study’s boundaries). Regions in light yellow represent no bathymetric data available for the Sea Scheldt (BEL). Sites I and II approximately indicate the sites of suggested installation/deployment of high temporal resolution turbidity sensors discussed in Section 4.4.
Remotesensing 15 00670 g001
Figure 2. Type II regression fit of in situ vs. median satellite-derived SPM (g·m−3) from the NIR band (a) and red band (b) of Landsat-5, -7, and -8 (black, orange, and blue symbols, respectively). Symbols’ size is proportional to the time difference between each satellite overpass and in situ data acquisition (largest symbols represent 60 min time difference). Vertical error bars represent standard deviation of satellite-derived SPM estimates. No uncertainties were available from the in situ SPM datasets.
Remotesensing 15 00670 g002
Figure 3. Frequency distribution of SPM for in situ SPM (dark gray bar), satellite-derived SPM using the red band (dark yellow bar) and using the NIR band (white bar) at the four RWS long-term monitoring stations along the Scheldt Estuary. Panels (ad) represent stations Vlissingen, Terneuzen, Hansweert Geul, and Schaar van Ouden Doel, respectively). The median SPM and number of sample (n) of each dataset is shown in each panel.
Remotesensing 15 00670 g003
Figure 4. Time series of monthly mean river discharge (Q, panel (a)), and wind speed (U, panel (c)) and the respective yearly cycles. Right panels: square symbols represent median of monthly means of (b) river discharge and (d) wind speed data for the entire time series. Grey-filled square symbols represent winter months. Vertical lines on panels (a,c) represent the occurrence of extreme events.
Remotesensing 15 00670 g004
Figure 5. Extreme events in high river discharge represented in top panels: (a) mean magnitude, (b) yearly mean frequency, and (c) mean duration; extreme events in wind speeds represented in the bottom panels: (d) scalar mean magnitude of extremely high wind speeds, (e) yearly mean frequency, and (f) mean duration.
Remotesensing 15 00670 g005
Figure 6. Distribution of the total number of (a) satellite scenes by delimited region and (b) in situ SPM classified per tidal stage. Regions and stations are labeled as VLIS (Vlissingen), TERN (Terneuzen), HANS (Hansweert Geul), and SCH (Schaar van Ouden Doel).
Remotesensing 15 00670 g006
Figure 7. Distribution of the total number of satellite scenes per class of season for (a) daily river discharge (Q) and (b) mean daily wind speed (U). Light gray-shaded areas mark the threshold for extreme events.
Remotesensing 15 00670 g007
Figure 8. Correlation maps between SPM and river discharge (a) and wind speed (b). For all panels, Kendall-tau correlation coefficients (r) were kept if p < 0.05. ND refers to No Data for each correlation map.
Remotesensing 15 00670 g008
Figure 9. Relationship between river discharge (Q) and SPM. Panels (ad) represent the median satellite-derived SPM in the delimited region (refer to Figure 1). Panels (eh) display the long-term SPM in situ stations. Shaded areas represent the region of extremely high river discharge. Tidal stages are color-coded, and the size of dots is proportional to wind speed on the day of data acquisition (see legend). Theil–Sen regressions are statistically significant (i.e., p < 0.05).
Remotesensing 15 00670 g009
Figure 10. Relationship between wind speed (U) and SPM. Panels (ad) represent the median satellite-derived SPM in the delimited region (refer to Figure 1). Panels (eh) display the long-term SPM in situ stations. Shaded areas represent the region of extremely high wind speed. Tidal stages are color-coded, and the size of dots is proportional to river discharge on the day of data acquisition (see legend). Theil–Sen regressions are statistically significant (i.e., p < 0.05).
Remotesensing 15 00670 g010
Disclaimer/Publisher’s Note: The statements, opinions and data contained in all publications are solely those of the individual author(s) and contributor(s) and not of MDPI and/or the editor(s). MDPI and/or the editor(s) disclaim responsibility for any injury to people or property resulting from any ideas, methods, instructions or products referred to in the content.