Article

Voronoi Centerline-Based Seamline Network Generation Method

1
School of Remote Sensing and Information Engineering, Wuhan University, Wuhan 430079, China
2
Center for Spatial Information Center, The University of Tokyo, Kashiwa 277-6568, Chiba, Japan
*
Author to whom correspondence should be addressed.
Remote Sens. 2023, 15(4), 917; https://doi.org/10.3390/rs15040917
Submission received: 14 January 2023 / Revised: 1 February 2023 / Accepted: 3 February 2023 / Published: 7 February 2023

Abstract

:
Seamline network generation is a crucial step in mosaicking multiple orthoimages. It determines the topological and mosaic contribution area for each orthoimage. Previous methods, such as Voronoi-based and AVOD (area Voronoi)-based, may generate mosaic holes in low-overlap and irregular orthoimage cases. This paper proposes a Voronoi centerline-based seamline network generation method to address this problem. The first step is to detect the edge vector of the valid orthoimage region; the second step is to construct a Voronoi triangle network using the edge vector points and extract the centerline of the network; the third step is to segment each orthoimage by the generated centerlines to construct the image effective mosaic polygon (EMP). The final segmented EMP is the mosaic contribution region. All EMPs are interconnected to form a seamline network. The main contribution of the proposed method is that it solves the mosaic holes in the Voronoi-based method when processing with low overlap, and it solves the limitation of the AVOD-based method polygon shape requirement, which can generate a complete mosaic in any overlap and any shape of the orthoimage. Five sets of experiments were conducted, and the results show that the proposed method surpasses the well-known state-of-the-art method and commercial software in terms of adaptability and effectiveness.

1. Introduction

The seamline network generation is a crucial step in the orthoimage mosaicking process, as it determines the contribution area of each image to the final mosaic. A seamline network is a set of closed seamline vectors that encloses the mosaic contributing regions of the orthoimage in a mosaic, as shown in Figure 1. These vectors compose the EMP (effective mosaic polygon) of the individual images and are used to stitch multiple orthoimages together.
Since the process of orthoimage rectification contains invalid regions, as shown in Figure 2, the orthoimage mosaic should utilize the overlap of the valid image region, and the seamlines should not be exceeded [1].
The resulting mosaic is a single, large-scale orthoimage in which each pixel has absolute geographical coordinates. The construction of the seamline network must follow two principles: (1) The EMP of each orthoimage should preferably be selected near the image center, as this reduces the overall projection error of the final mosaic; (2) Seamlines in the network cannot cross the invalid region of the orthoimage, as this can result in mosaic holes, i.e., areas with invalid pixel values in the final mosaic image. It is essential to avoid mosaic holes in order to ensure the quality and accuracy of the final mosaic orthoimage [2].
Many studies on optimal seamline detection between two overlapped orthoimages have been proposed, mainly focusing on how seamlines avoid obvious objects to create a seamless mosaic [3,4,5]. However, seamline network generation is the core step of mosaicking, and more research should be performed on it. Early studies of seamline network generation used the incremental-based method. Individual seamlines are formed first, and new seamlines are continuously added for combination, eventually obtaining a complete seamline network. Xandri et al. [6] proposed a strip-based method, which first calculates the seamline network within a strip and then combines them as one seamline network. The limitation of this method is that the image set must be a regular airstrip. Yang [2] proposed a technique based on the overlapping area, which takes the center line of the overlapping area as the seamline and connects them gradually in a particular order to form a seamline network. Wang et al. [7] constructed the seamline network by triangulating the image overlaps and extracting the skeleton line as the seamline. The problem with the incremental-based methods is that the seamline network changes with the order of the image sequence; thus, its results are unstable.
To solve these drawbacks, methods based on the Voronoi diagram were widely studied. Hsu [8] used the method based on the Manhattan distance of the Voronoi diagram to generate the seamline network. Song et al. [9] use boundary-constrained Voronoi diagrams to construct the seamline network and add mosaic boundaries to the network. Zheng et al. [10] proposed a Voronoi-based seamline network on the basis of which the starting and ending positions of seamlines were optimized. Li li [11] proposed a method to construct seamline networks based on the principle of minimizing the image centroid distance; its most significant contribution is network joint optimization using multi-label graph cuts, which has the advantage that all joints are within the passable area. He et al. [12] proposed a Voronoi-based method to repair the mosaic holes using the adjacent EMP and obtained a mosaic result without holes. The Voronoi-based method allows each EMP to be located at the center of the image and balanced in size, resulting in more stable seamline network results and better mosaicking than the incremental method.
However, the Voronoi-based method only considers the centroid of the orthoimage and there may be invalid regions in the orthoimage that the Voronoi diagram cannot guarantee the seamline does not pass through, which may result in mosaic holes. The lines forming the seamline network need to be kept within the overlap of the valid orthoimage region, and to ensure the EMP of each orthoimage is uniform in size, the overlapping area should preferably be equally divided by the seamline. The centerline of the image’s overlap is guaranteed to be completely within the valid region, and the seamline network constructed with them can completely prevent mosaic holes. Based on this, Pan et al. [13] proposed the area Voronoi diagram (AVOD) concept and accordingly proposed the seamline network generation method. The centerline is first constructed using the angle bisector of the image overlap. Then the centerline is used to build the EMP. Finally, the seamline network is obtained. This method can produce a perfect mosaic, but it is necessary to ensure that both the valid region and the overlapped area of the orthoimages are quadrilaterals. Mills [14] used a technique similar to AVOD, based on which a bottleneck model was introduced to optimize the node positions of the seamline network. Pan et al. [15] proposed an improved approach based on AVOD; it extends the method of centerline generation and is no longer limited to quadrilaterals; a bottleneck model was also introduced to optimize the seamline network nodes. However, complex polygons and concave polygons still cannot be handled. Furthermore, Pan et al. [16] proposed a seeded region growing-based method, which uses pixel seed point growth on the raster to replace the angle bisector vector calculation method. Wang [17] proposed a seamline network generation method, which adds the optimization of linkage points based on the AVOD method to avoid the impassable area, but there is no improvement in the polygon adaptation of AVOD. Yang [18] proposed a method to triangulate the overlaps between orthoimages, and the optimal cutline is obtained using the graph cut model; it can build seamline networks quickly.
In the method mentioned above, the AVOD-based method meets the two principles of seamline network generation, which overcomes the disadvantage of the Voronoi-based method of not being able to consider the valid region of the orthoimage. It ensures that seamlines are in the valid orthoimage region. However, the calculation of these methods has limitations in terms of the polygon shape of the valid image region. Although there are improvements in the following methods, the polygon problem is not completely overcome, and the calculation is more complicated.
As a result, a Voronoi centerline-based seamline network generation method is proposed in this paper. The Voronoi algorithm triangulates the overlap of the valid image region in the network, and the centerline is extracted from the corresponding Voronoi network. For arbitrarily shaped polygons, centerlines can be extracted stably. Then, using the extracted centerline, the initial EMP of each image is gradually segmented to obtain the final EMP. After that, all the EMPs of the orthoimages are merged to form the seamline network.
The main contributions of this paper are as follows:
A Voronoi centerline-based seamline network generation method is proposed, which applies the Voronoi diagram to the centerline extraction of overlapping regions. It can solve the problem of mosaic holes caused by the presence of seamlines through invalid regions, and can be adapted to arbitrary polygon shapes, solving the limitation of polygon shapes in the AVOD-based method. Compared with the previous methods, the proposed method can generate a proper seamline network with any overlap and any shape of orthoimage to achieve a perfect mosaic.

2. Materials and Methods

In practice, the polygons of the valid orthoimage region are varied and not limited to quadrilateral or convex. The centerline extraction of these irregular polygons is a challenging problem. This poses difficulties for the generation of seamline networks.
Considering the diversity of valid orthoimage and overlap region polygons, the Voronoi algorithm can triangulate any polygon with arbitrary conditions. In turn, the centerline of arbitrarily shaped polygons can be stably extracted. Figure 3 shows the centerline extracted from the rectangle, concave polygon, and irregular polygon, respectively.
The workflow of the proposed seamline network generation method is demonstrated in Figure 4. The main workflow is as follows: First, the valid region is extracted for each orthoimage as the EMP. Then the valid overlap area between every two images is generated by computing the intersection of the two corresponding EMPs and recording it as VOA (valid overlapped area); the Voronoi network is constructed by the VOA vector, and the centerline is extracted in the network. Next, the initial EMP is gradually segmented using every corresponding centerline until it can no longer be cut. After all the EMPs are segmented, the seamline network is constructed by merging all the EMPs. The principles and implementation of each step are detailed in the subsequent sections.
The first step in the entire process is the initial EMP extraction. In orthoimage generation, the inverse projection is generally used to carry out the geometric rectification process. Thus, the rectified orthoimage probably contains invalid regions. For the seamline to not cross the invalid region, the valid region needs to be precisely separated to generate the initial EMP.
First, the orthoimage is binarized to obtain the separated valid region; the edge tracking algorithm is used to obtain the closed boundary vector of the valid region. The boundary vector is obtained as the initial EMP of the image, recorded as EMPi; i is the index of the image. It is worth noting that the initial EMP extracted from orthoimage is not guaranteed to be a regular quadrilateral or even to be non-concave, and the applicable assumptions in the AVOD-based method may not always be satisfied; in the next step, a Voronoi diagram is used to perform centerline extraction.

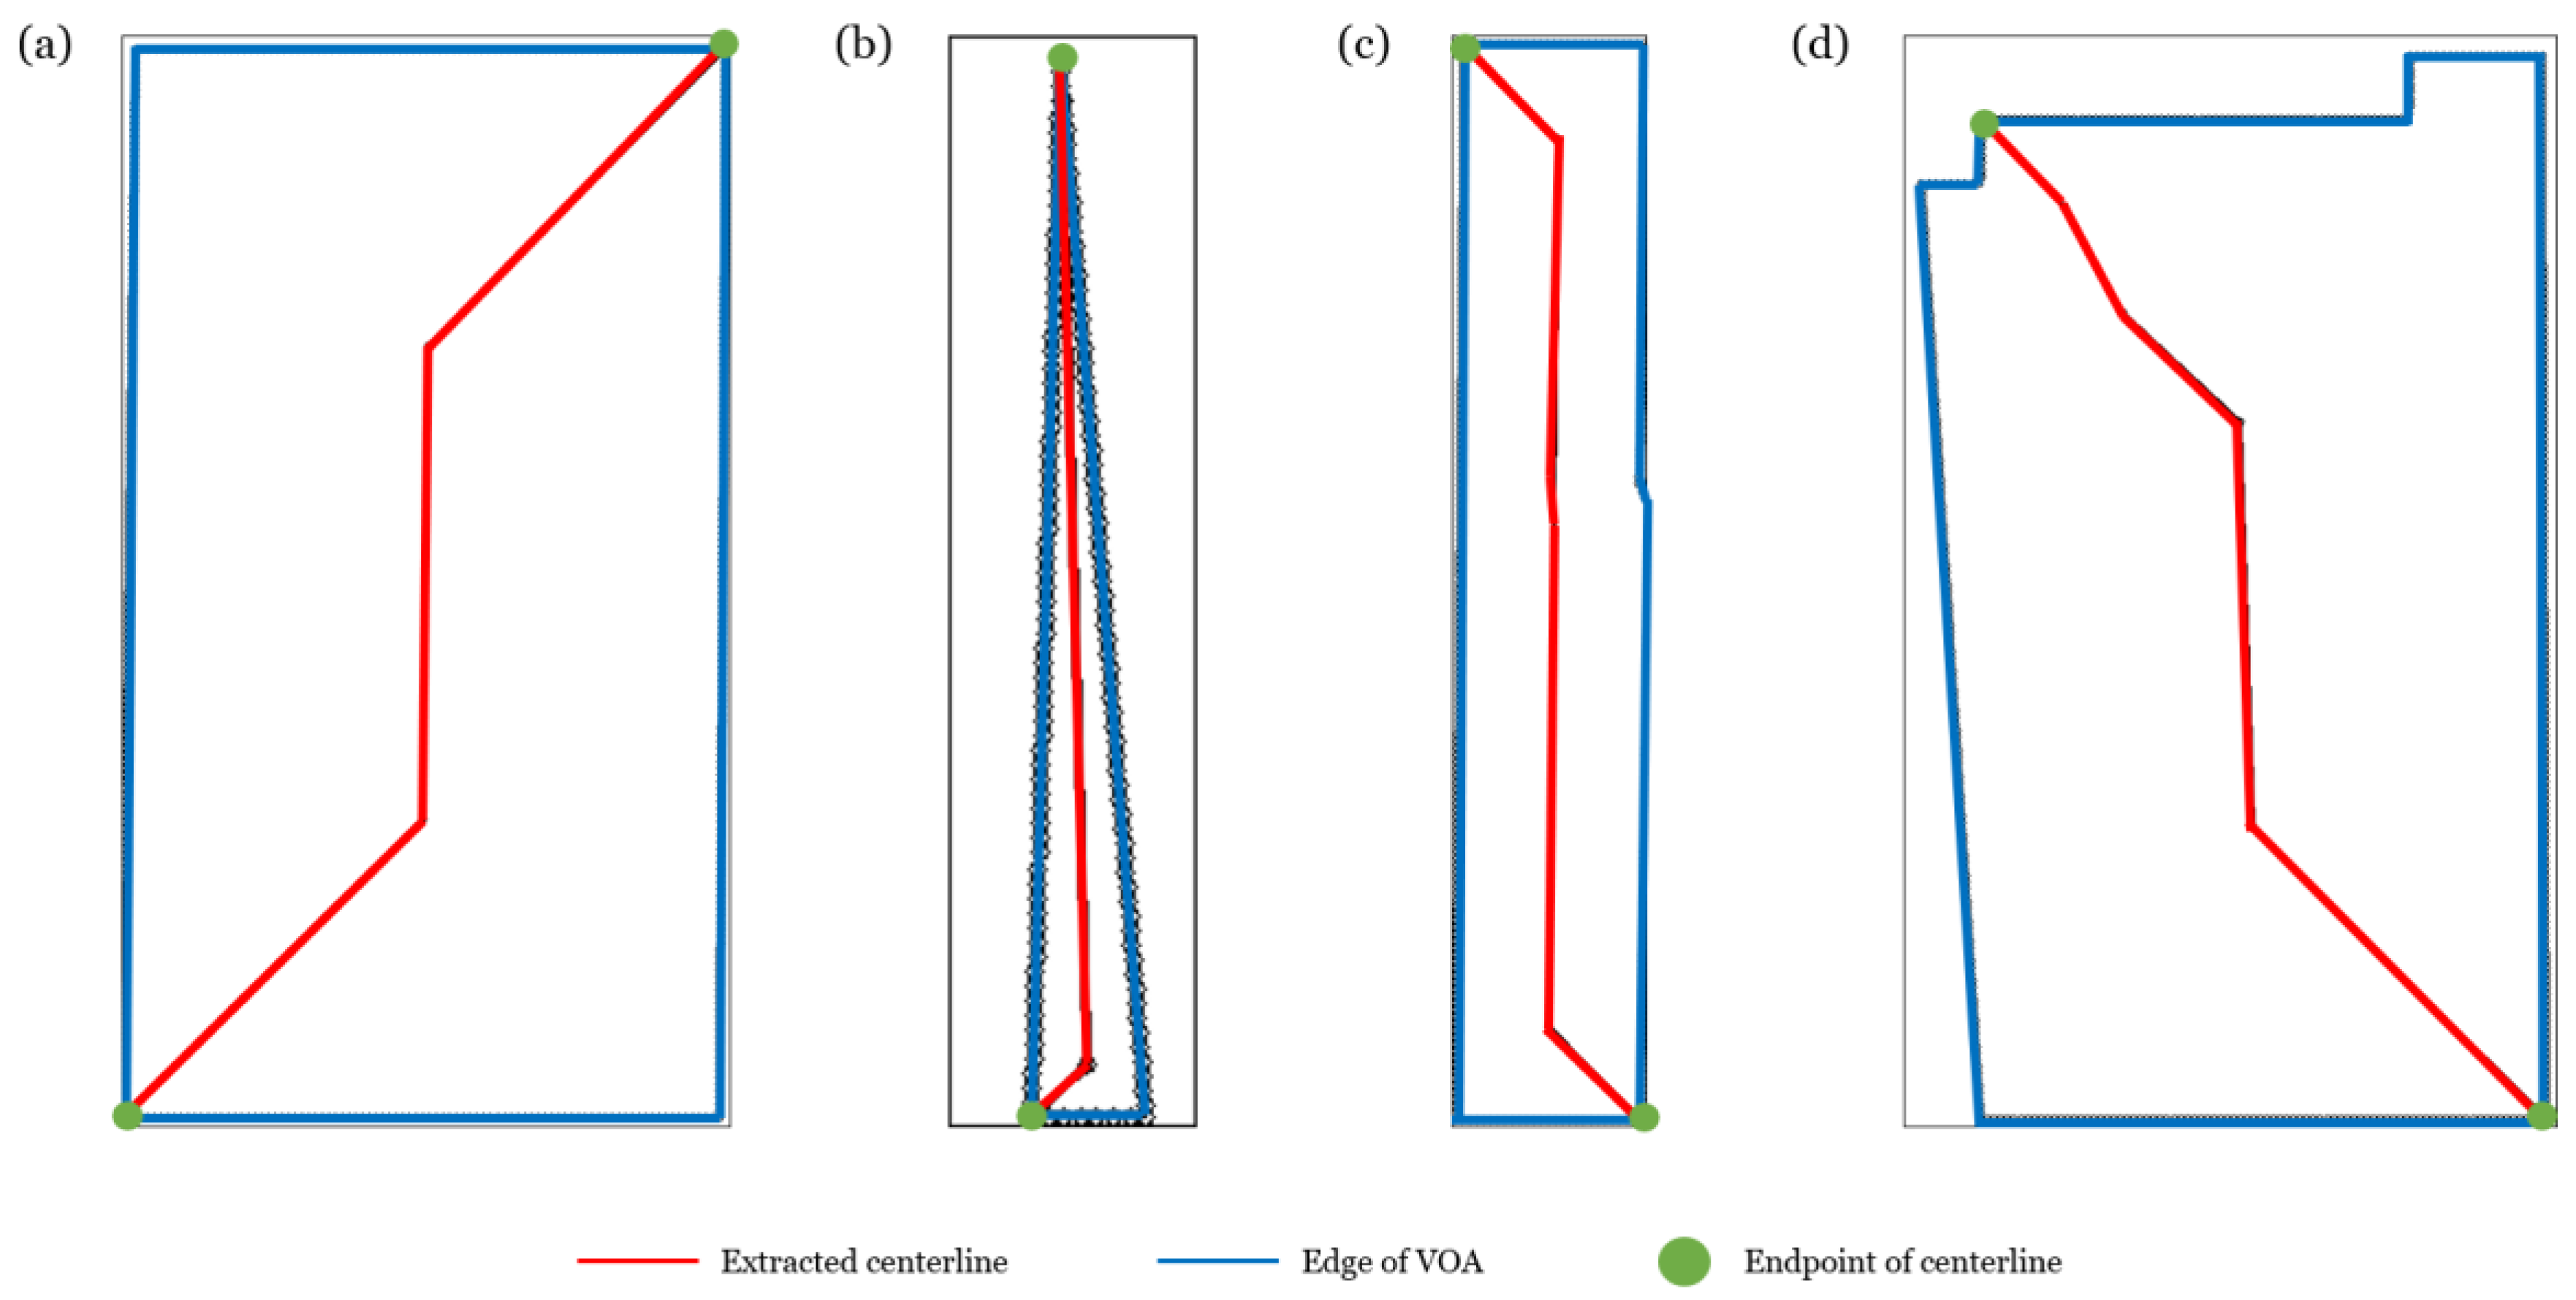
2.1. Voronoi-Based Centerline Extraction

The Voronoi diagram consists of a set of vertical bisections of a line connecting two neighboring points. Where these perpendicular bisectors are at equal distances from the two adjacent points, this provides the possibility to extract the closure polygon centerline in the Voronoi network.
The centerline extraction is performed on the orthoimage overlap regions to make the seamline not exceed the valid region; the proposed method calculates the EMP of every two orthoimages, and if there is an intersection, then a valid overlap area is generated, recorded as VOA. The VOA is a closed polygon vector determined by the EMP. When the vector points of the EMP are sparse and non-uniform, the vector points of the generated VOA are also sparse and non-uniform. The Voronoi diagrams generated in the case of sparse and non-uniform seed points are sparse and unstable. To make the generated Voronoi network more intensive and stable, the VOA points need to be densified.
The VOA is a closed polygon where each vector consists of two endpoints. The minimum endpoint distance for densification is defined as Distmin and the length of vectori in VOA as Length (vectori). If Length (vectori) is greater than Distmin, then points are insert ed in the vector. Details are given in Algorithm 1.
Algorithm 1 VOA Densification
Input: VOA, Distmin
Output: Denified VOA
1:    for each vector ∈VOA (vector0, vector1 … vectorn)
2:     if Lengh (vectori) < Distminthen
3:      n = Lengh (Vectori)/Distmin;
4:      for each j ∈ [0,n)
5:       Pointj (j * VectoriX/n, j * VectoriY/n);
6:       Vectori.Insert (Pointj);
7:      endfor
8:     endif
9:    endfor
In Figure 5a,c, Voronoi networks are generated without VOA densification, as opposed to (b) and (d), where VOA densification is performed. It can be seen that the enhanced density of the VOA can generate a denser Voronoi network, and higher-quality centerlines can be extracted. More specifically, (a) is a simple quadrilateral, direct network construction that gives good results, while (c) is a concave polygon; the resulting network is irregular and unstable, and the centerline cannot be extracted from the network.
After the VOA is densified, the point set of the VOA vector Pvoa is used as the seed points to construct the Voronoi network, and the network can be regarded as a graph recorded as Gvoa(E, V). Figure 6 shows the Voronoi network generated by four typical VOA polygons. Figure 6a is a simple quadrilateral, (b) is a triangle, (c) is a concave polygon, and (d) is an irregular polygon. Among them, a quadrilateral is easier to handle, while the concave and irregular polygons are more challenging and usually approximated as a quadrilateral in other methods. It can be seen that the Voronoi diagram can obtain stable results for all four representative cases, especially for the concave and complex cases. In addition, these Voronoi networks contain potential polygonal centerlines, which will be extracted in the next step.
Each overlapping EMP has two intersection points; these two intersections are also in Gvoa (E, V). They are considered as the starting and ending points; then, the Dijkstra algorithm is used to find the shortest path in Gvoa (E, V). In this search, the edge length was set to the value of the edge weight. The result of the extracted centerline from different Gvoa is shown in Figure 7; it can be seen that the centerline was precisely detected.
In the next step, the extracted centerline is used as a cutline to segment the EMP of each orthoimage.

2.2. EMP Segmentation

Each orthoimage may have a VOA with multiple orthoimages, and each VOA generates a centerline as a cutline to segment the EMP of this image. Suppose there is an image whose initial EMP is recorded as EMPInitial and has n VOAs overlapping with it, and there are n cutlines recorded as lineSetcut {cutline1, cutline2, …, cutlinen}. The initial EMP is sequentially segmented by using the cutline in the lineSetcut. The EMP segmented by cutlinei can be called EMPi. The segment is executed when the intersection of EMPi and cutlinen is greater than 1. This process is repeated until the lineSetcut is fully traversed.
The polygon trace algorithm is used in the implementation to segment new polygons from EMP polygons. The details of the principle are as follows:
Starting from the cutline and traversing each node, when the intersection point is encountered, it is recorded into a new polygon if the successor node of the intersection on the cutline is within the EMP, the cutline is traced, and the points on the cutline are recorded into the new polygon. If the successor node of the intersection is outside the EMP, then the same polygon trace is performed on the EMP vector. Until the next intersection point is met, the previous decision step is executed. Tracing continues until a closed polygon is formed. The schematic diagram of the segmentation of the cutline with the EMP is given in Figure 8.
After all the cutlines have segmented the EMPi in lineSetcut, the final EMP of the corresponding orthoimage is obtained. The image area surrounded by each EMP is the contribution area to the final mosaic. Finally, these EMPs are merged to form the final seamline network.

3. Results

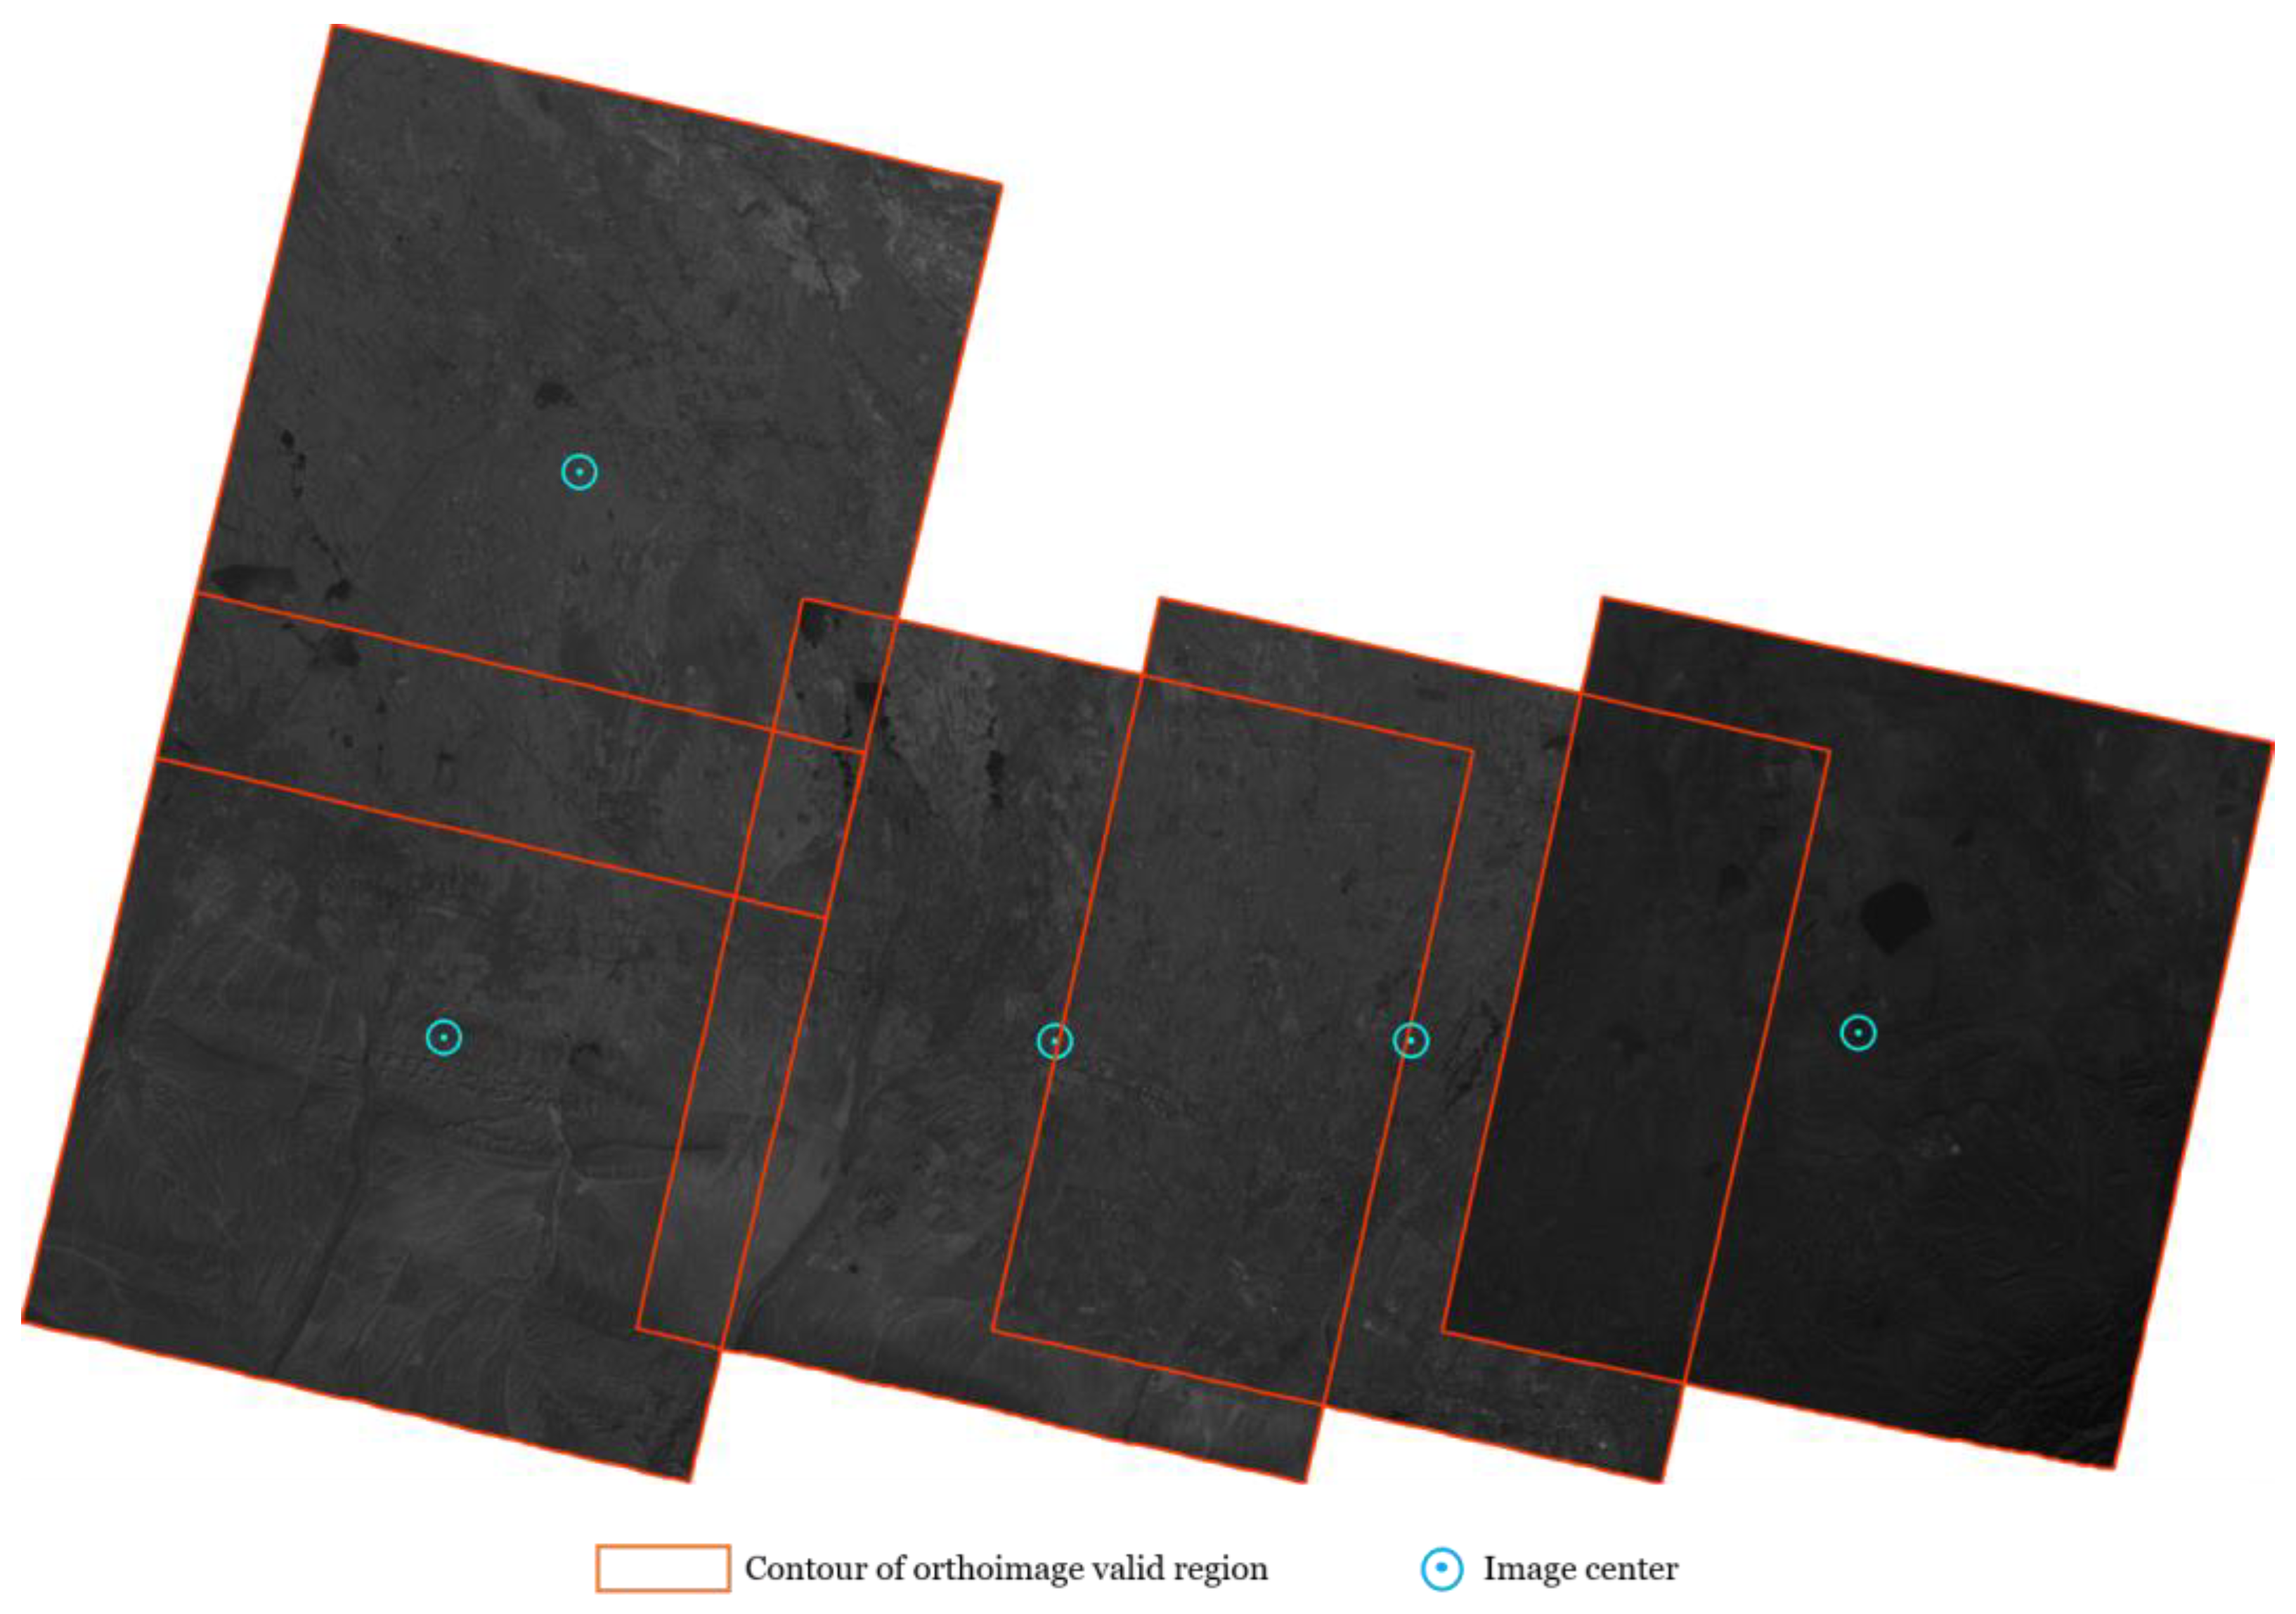
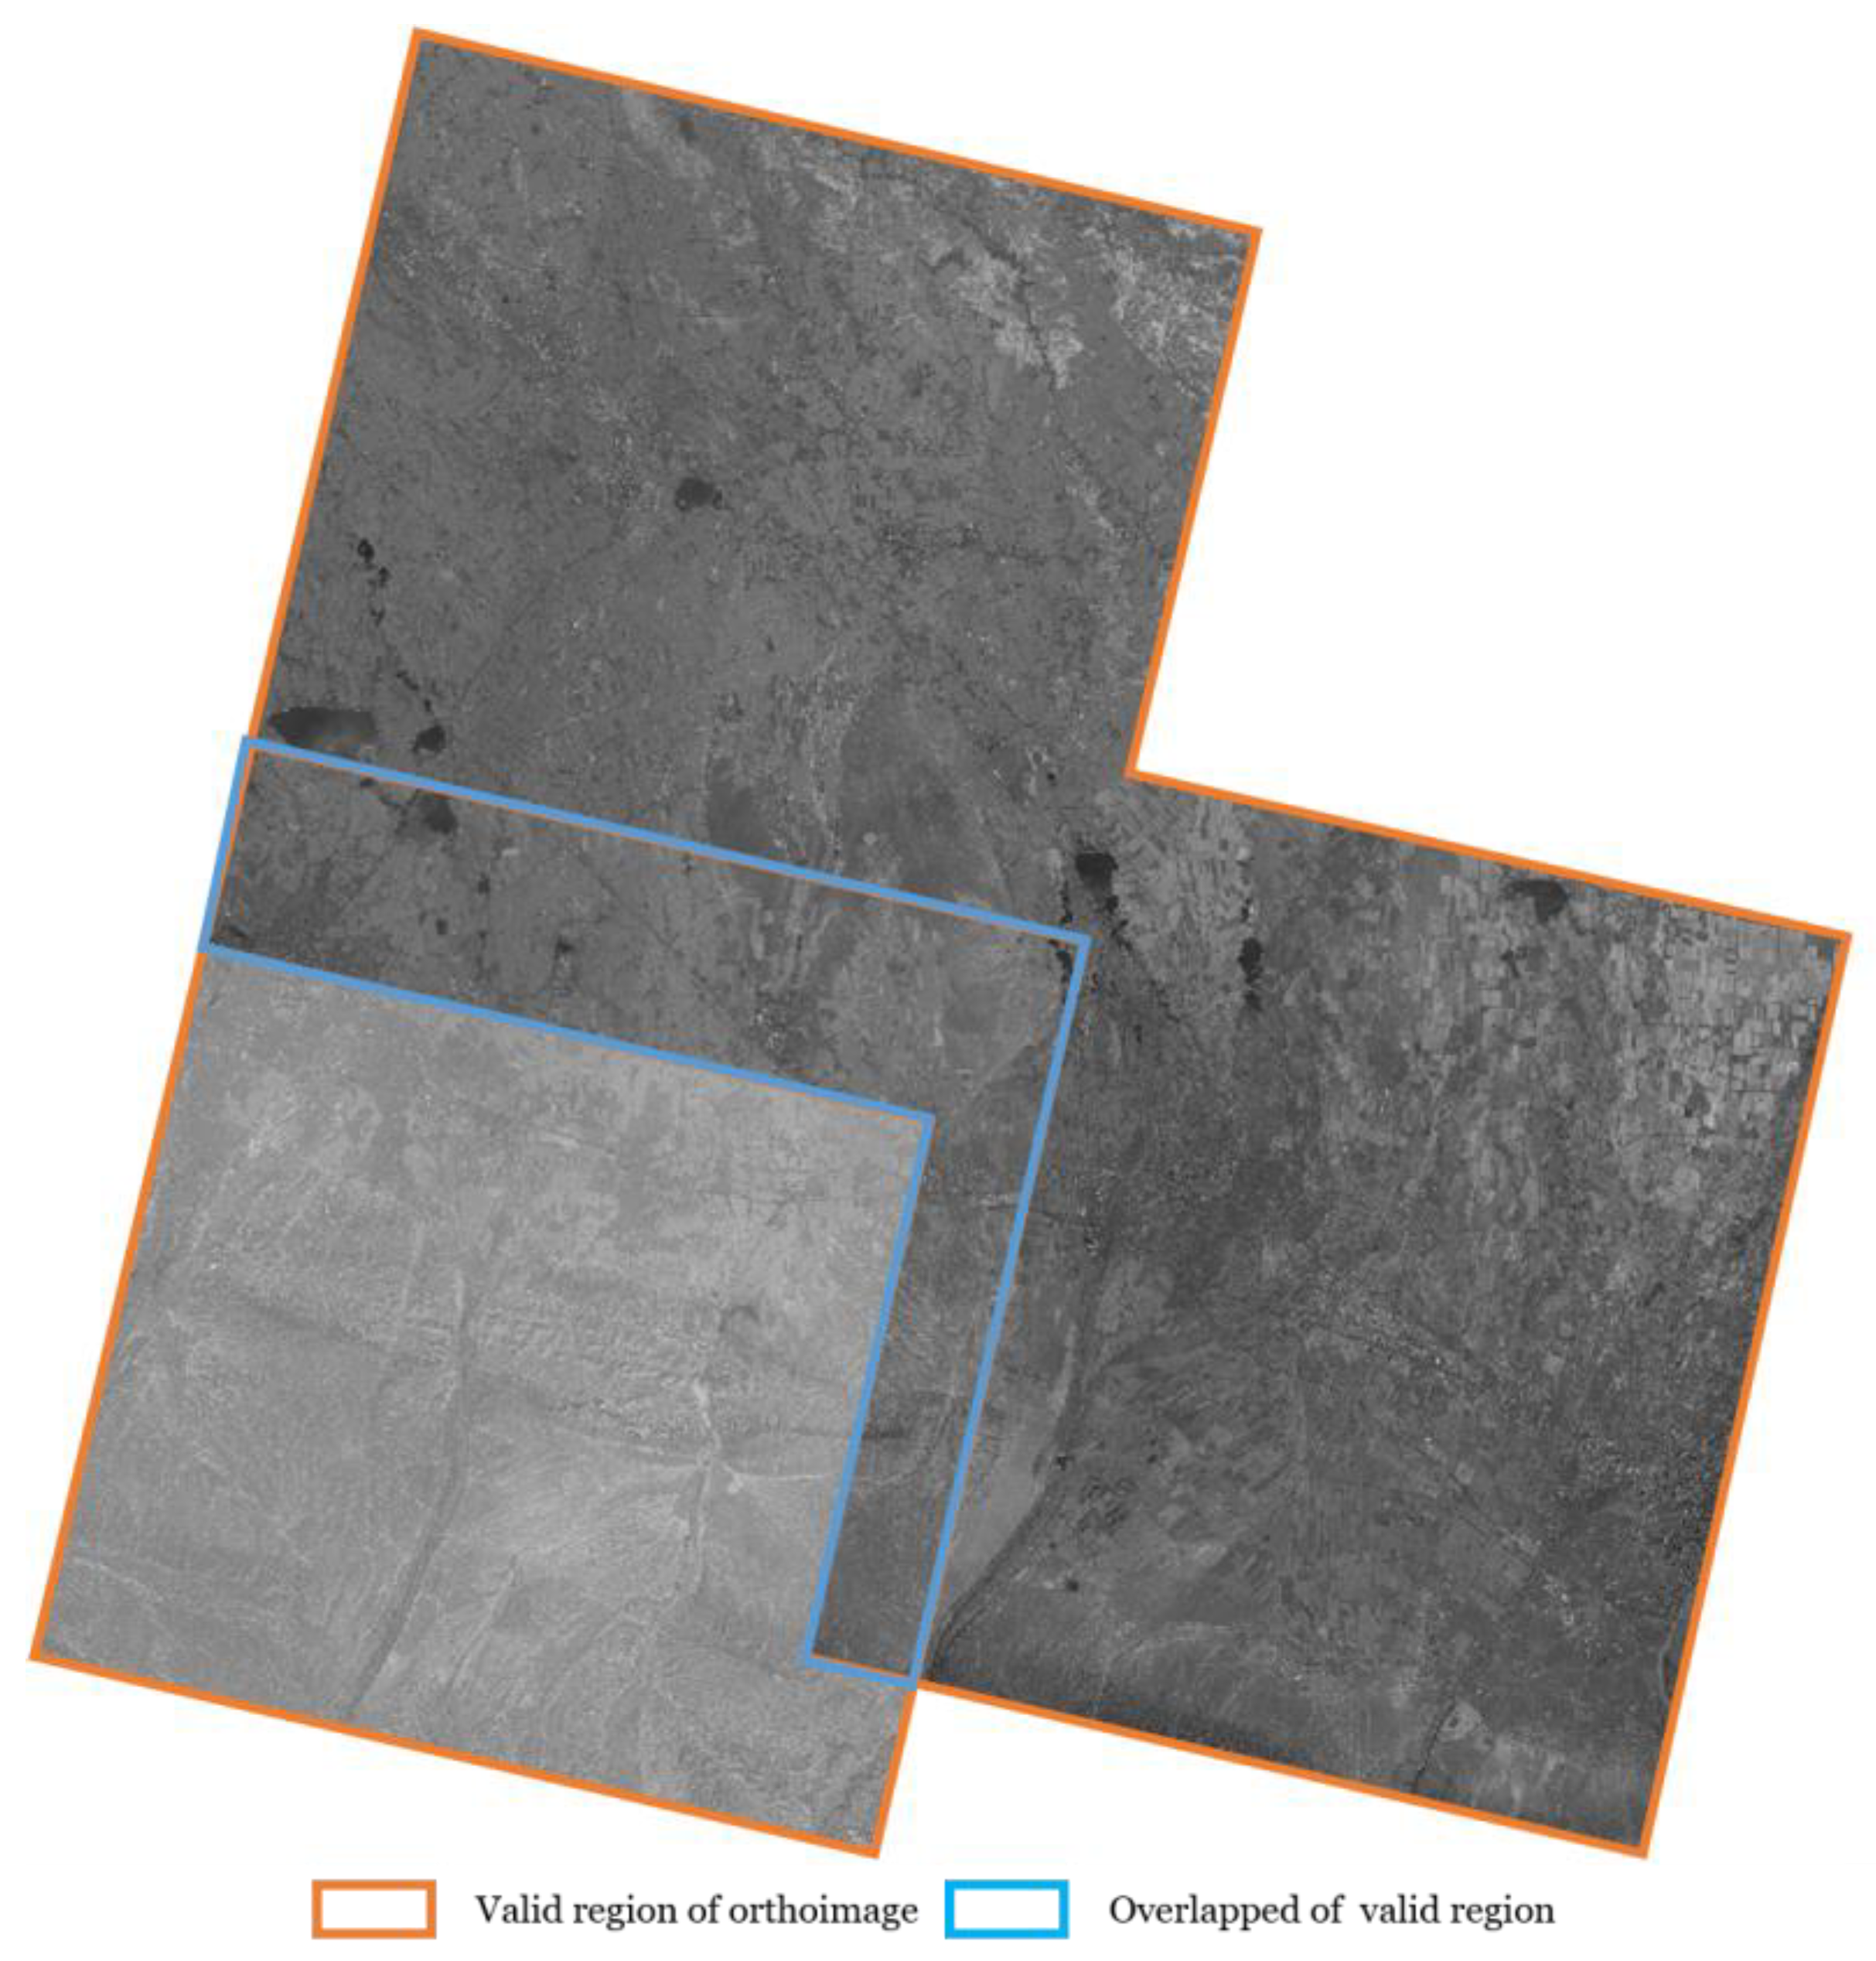
3.1. Preparation for Experiments
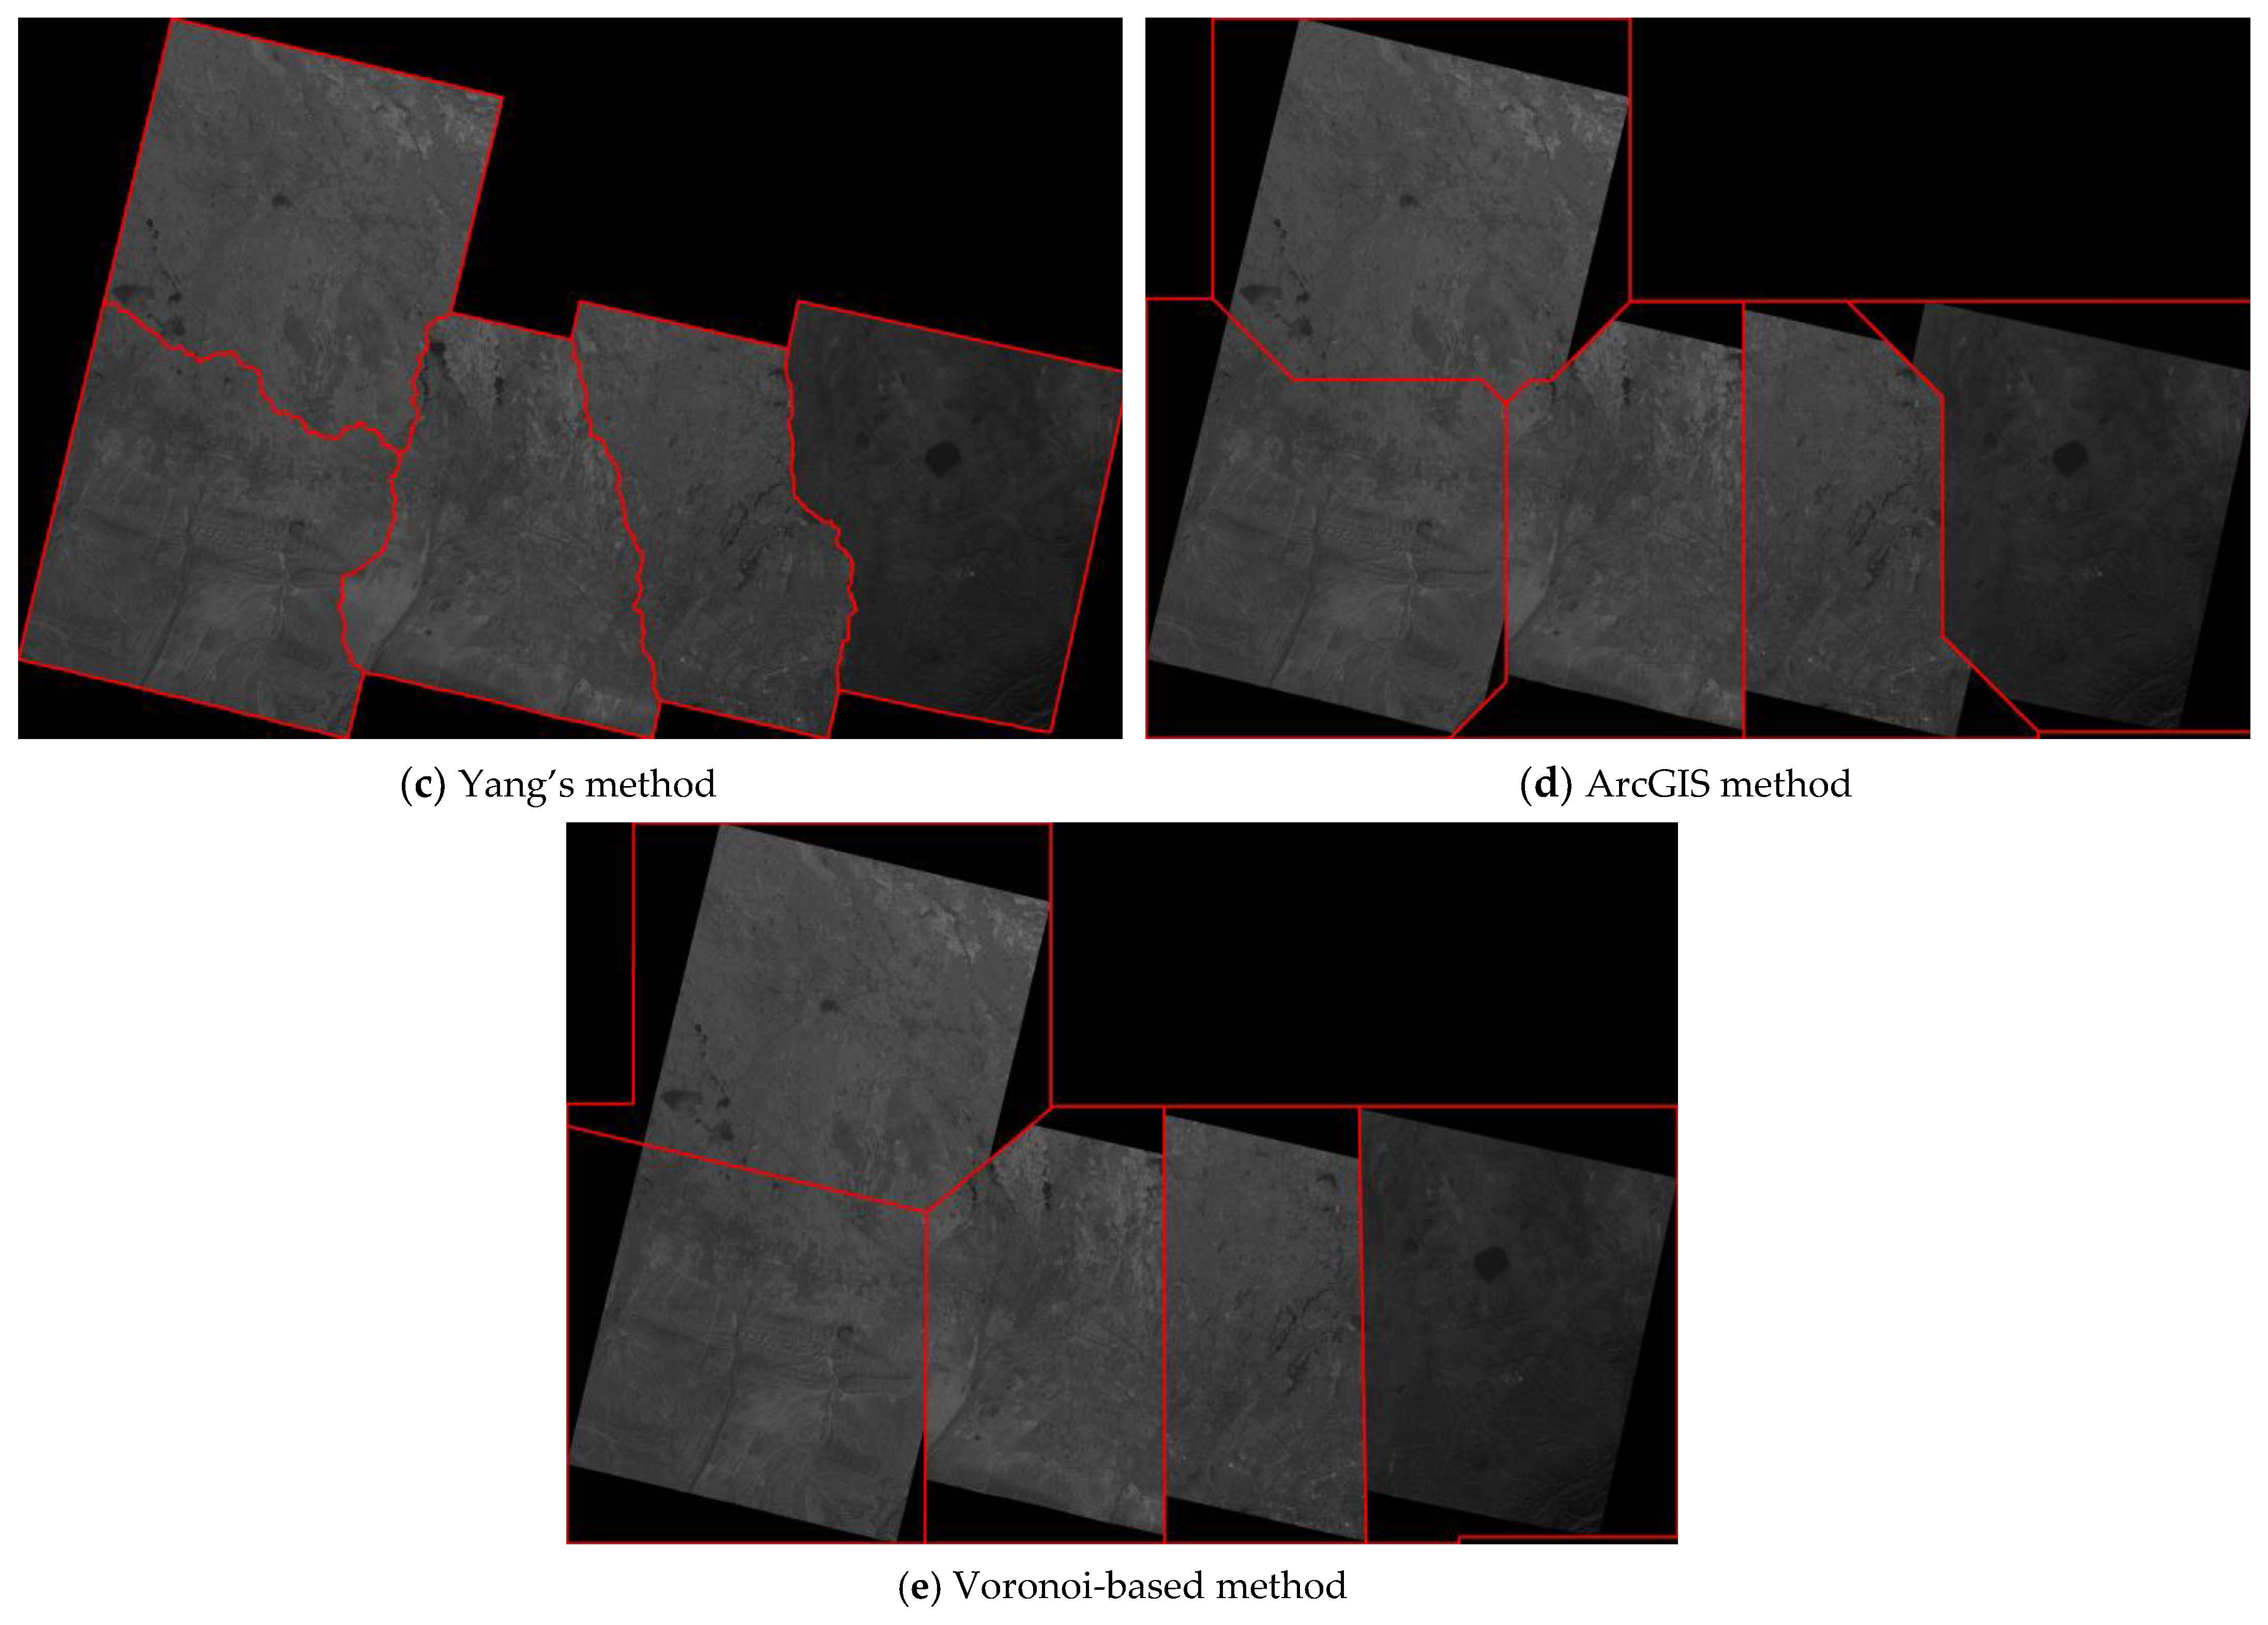
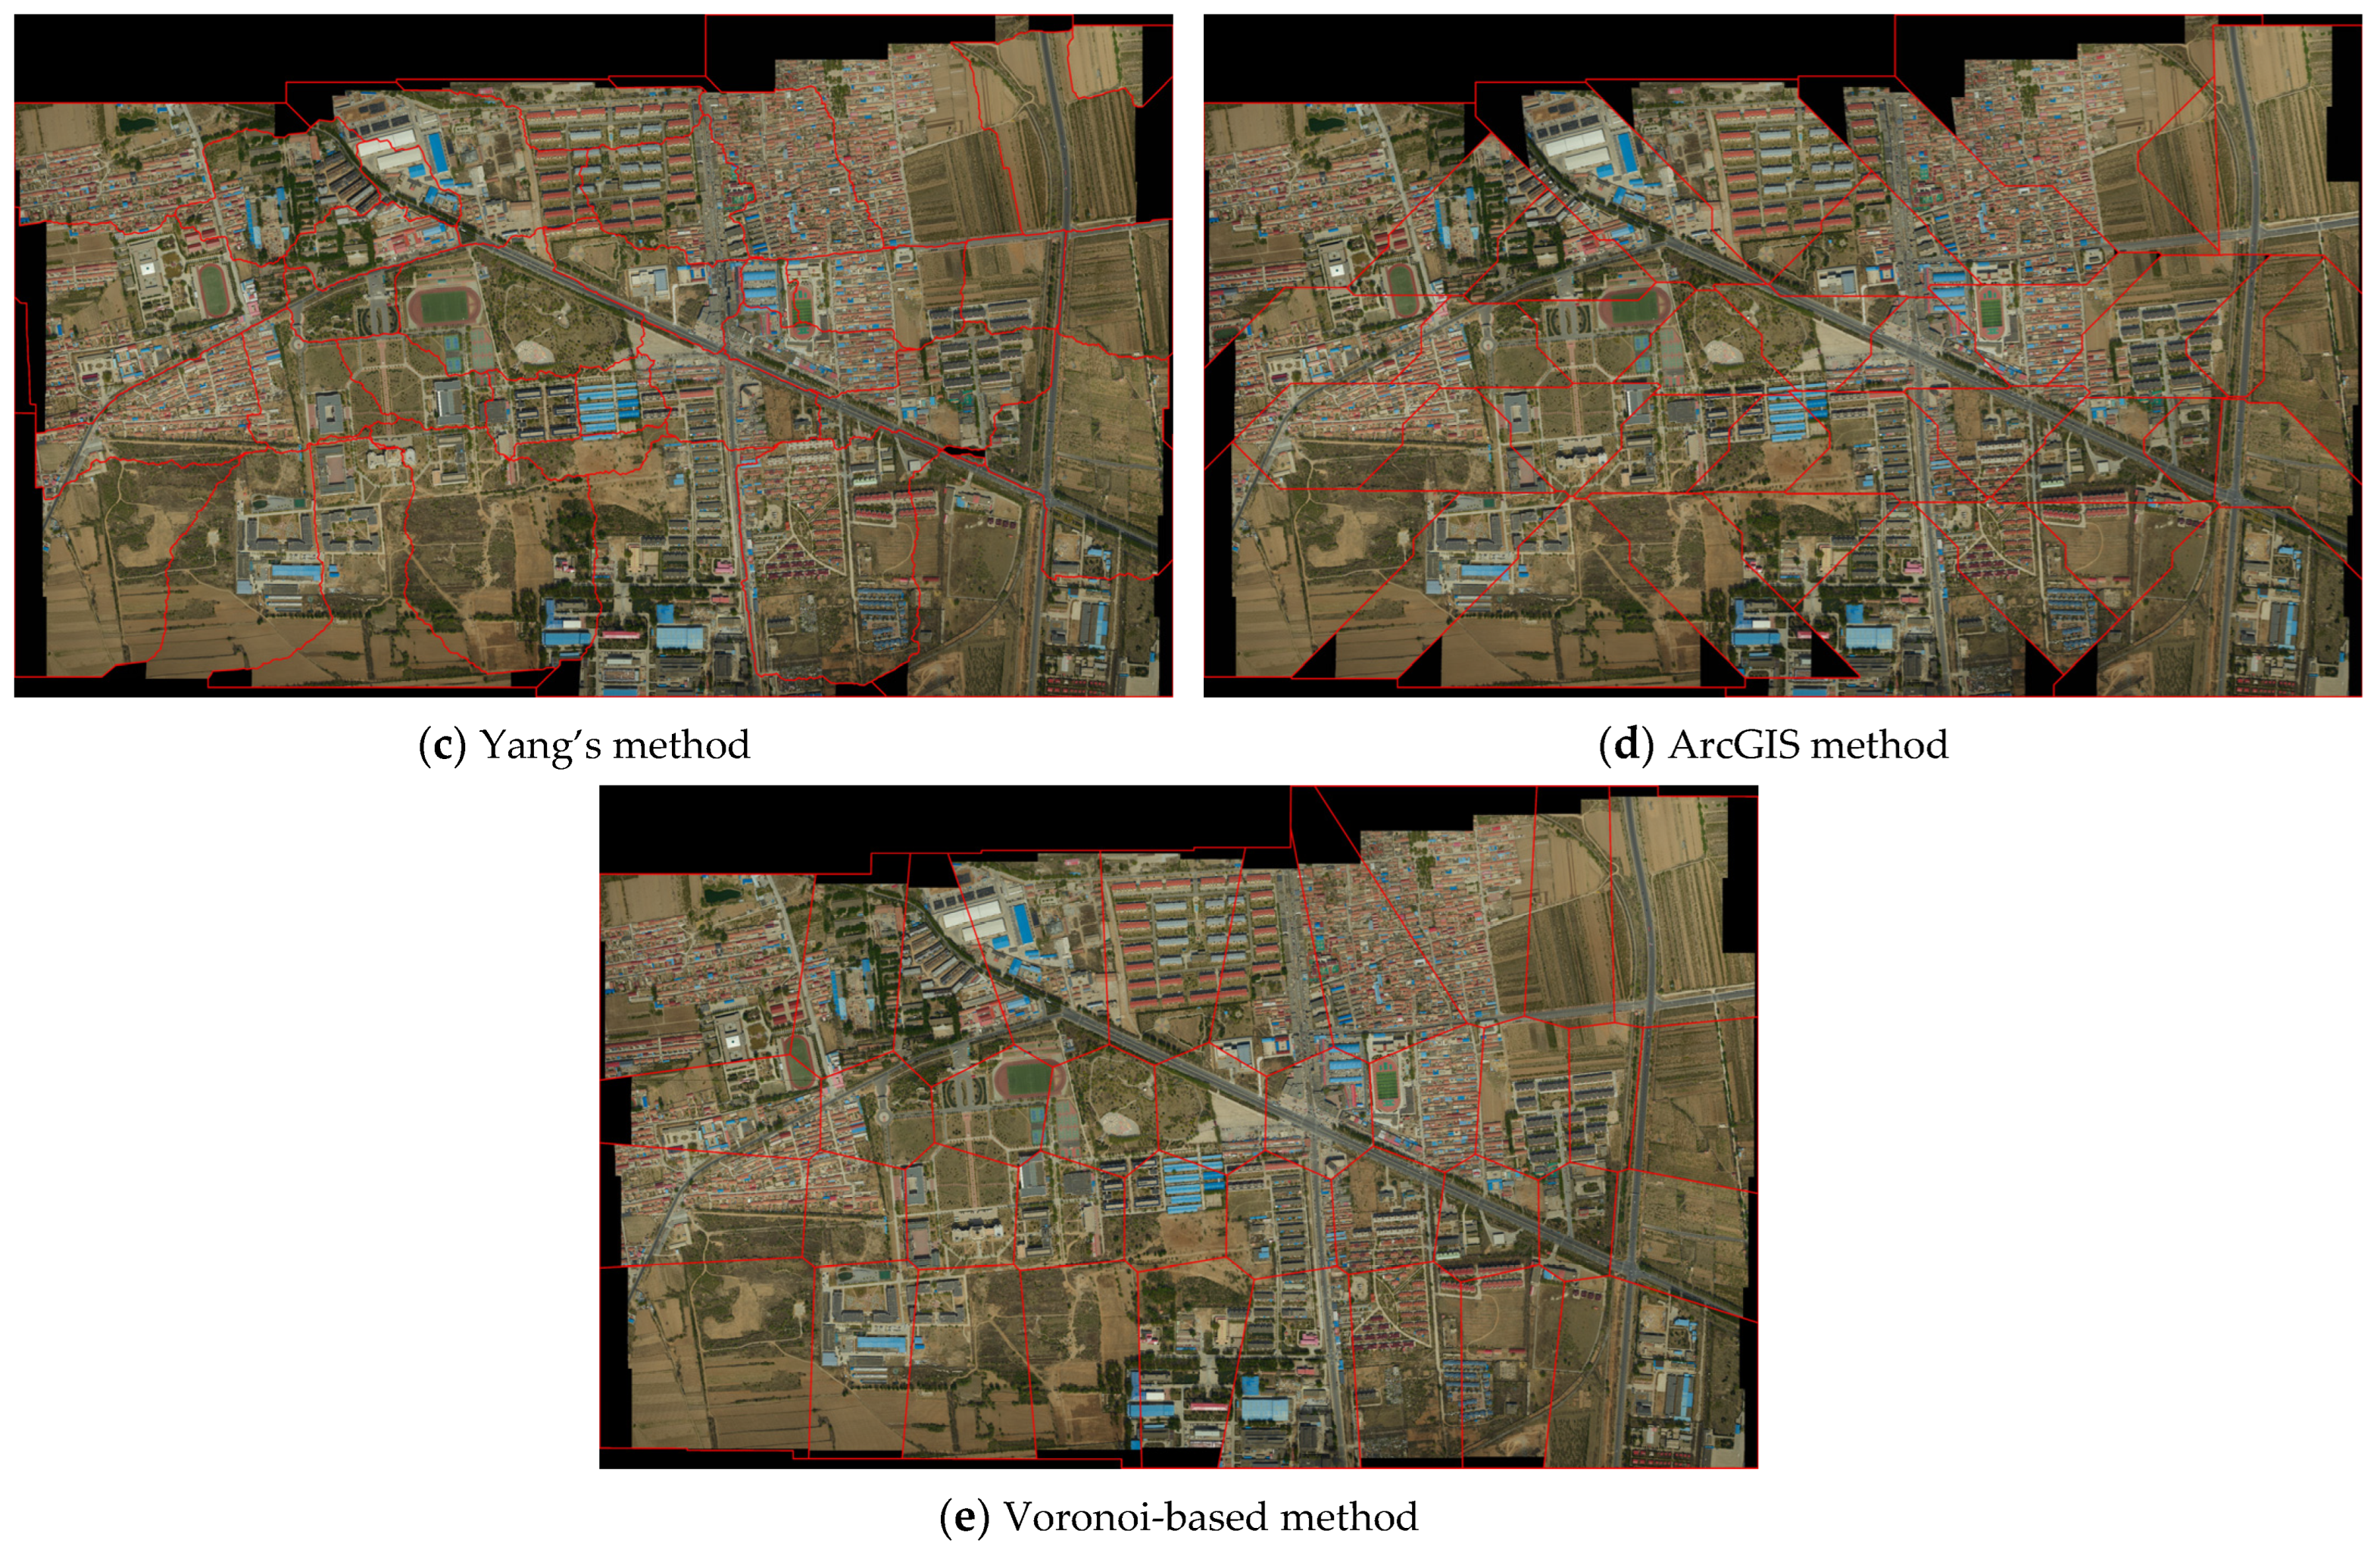
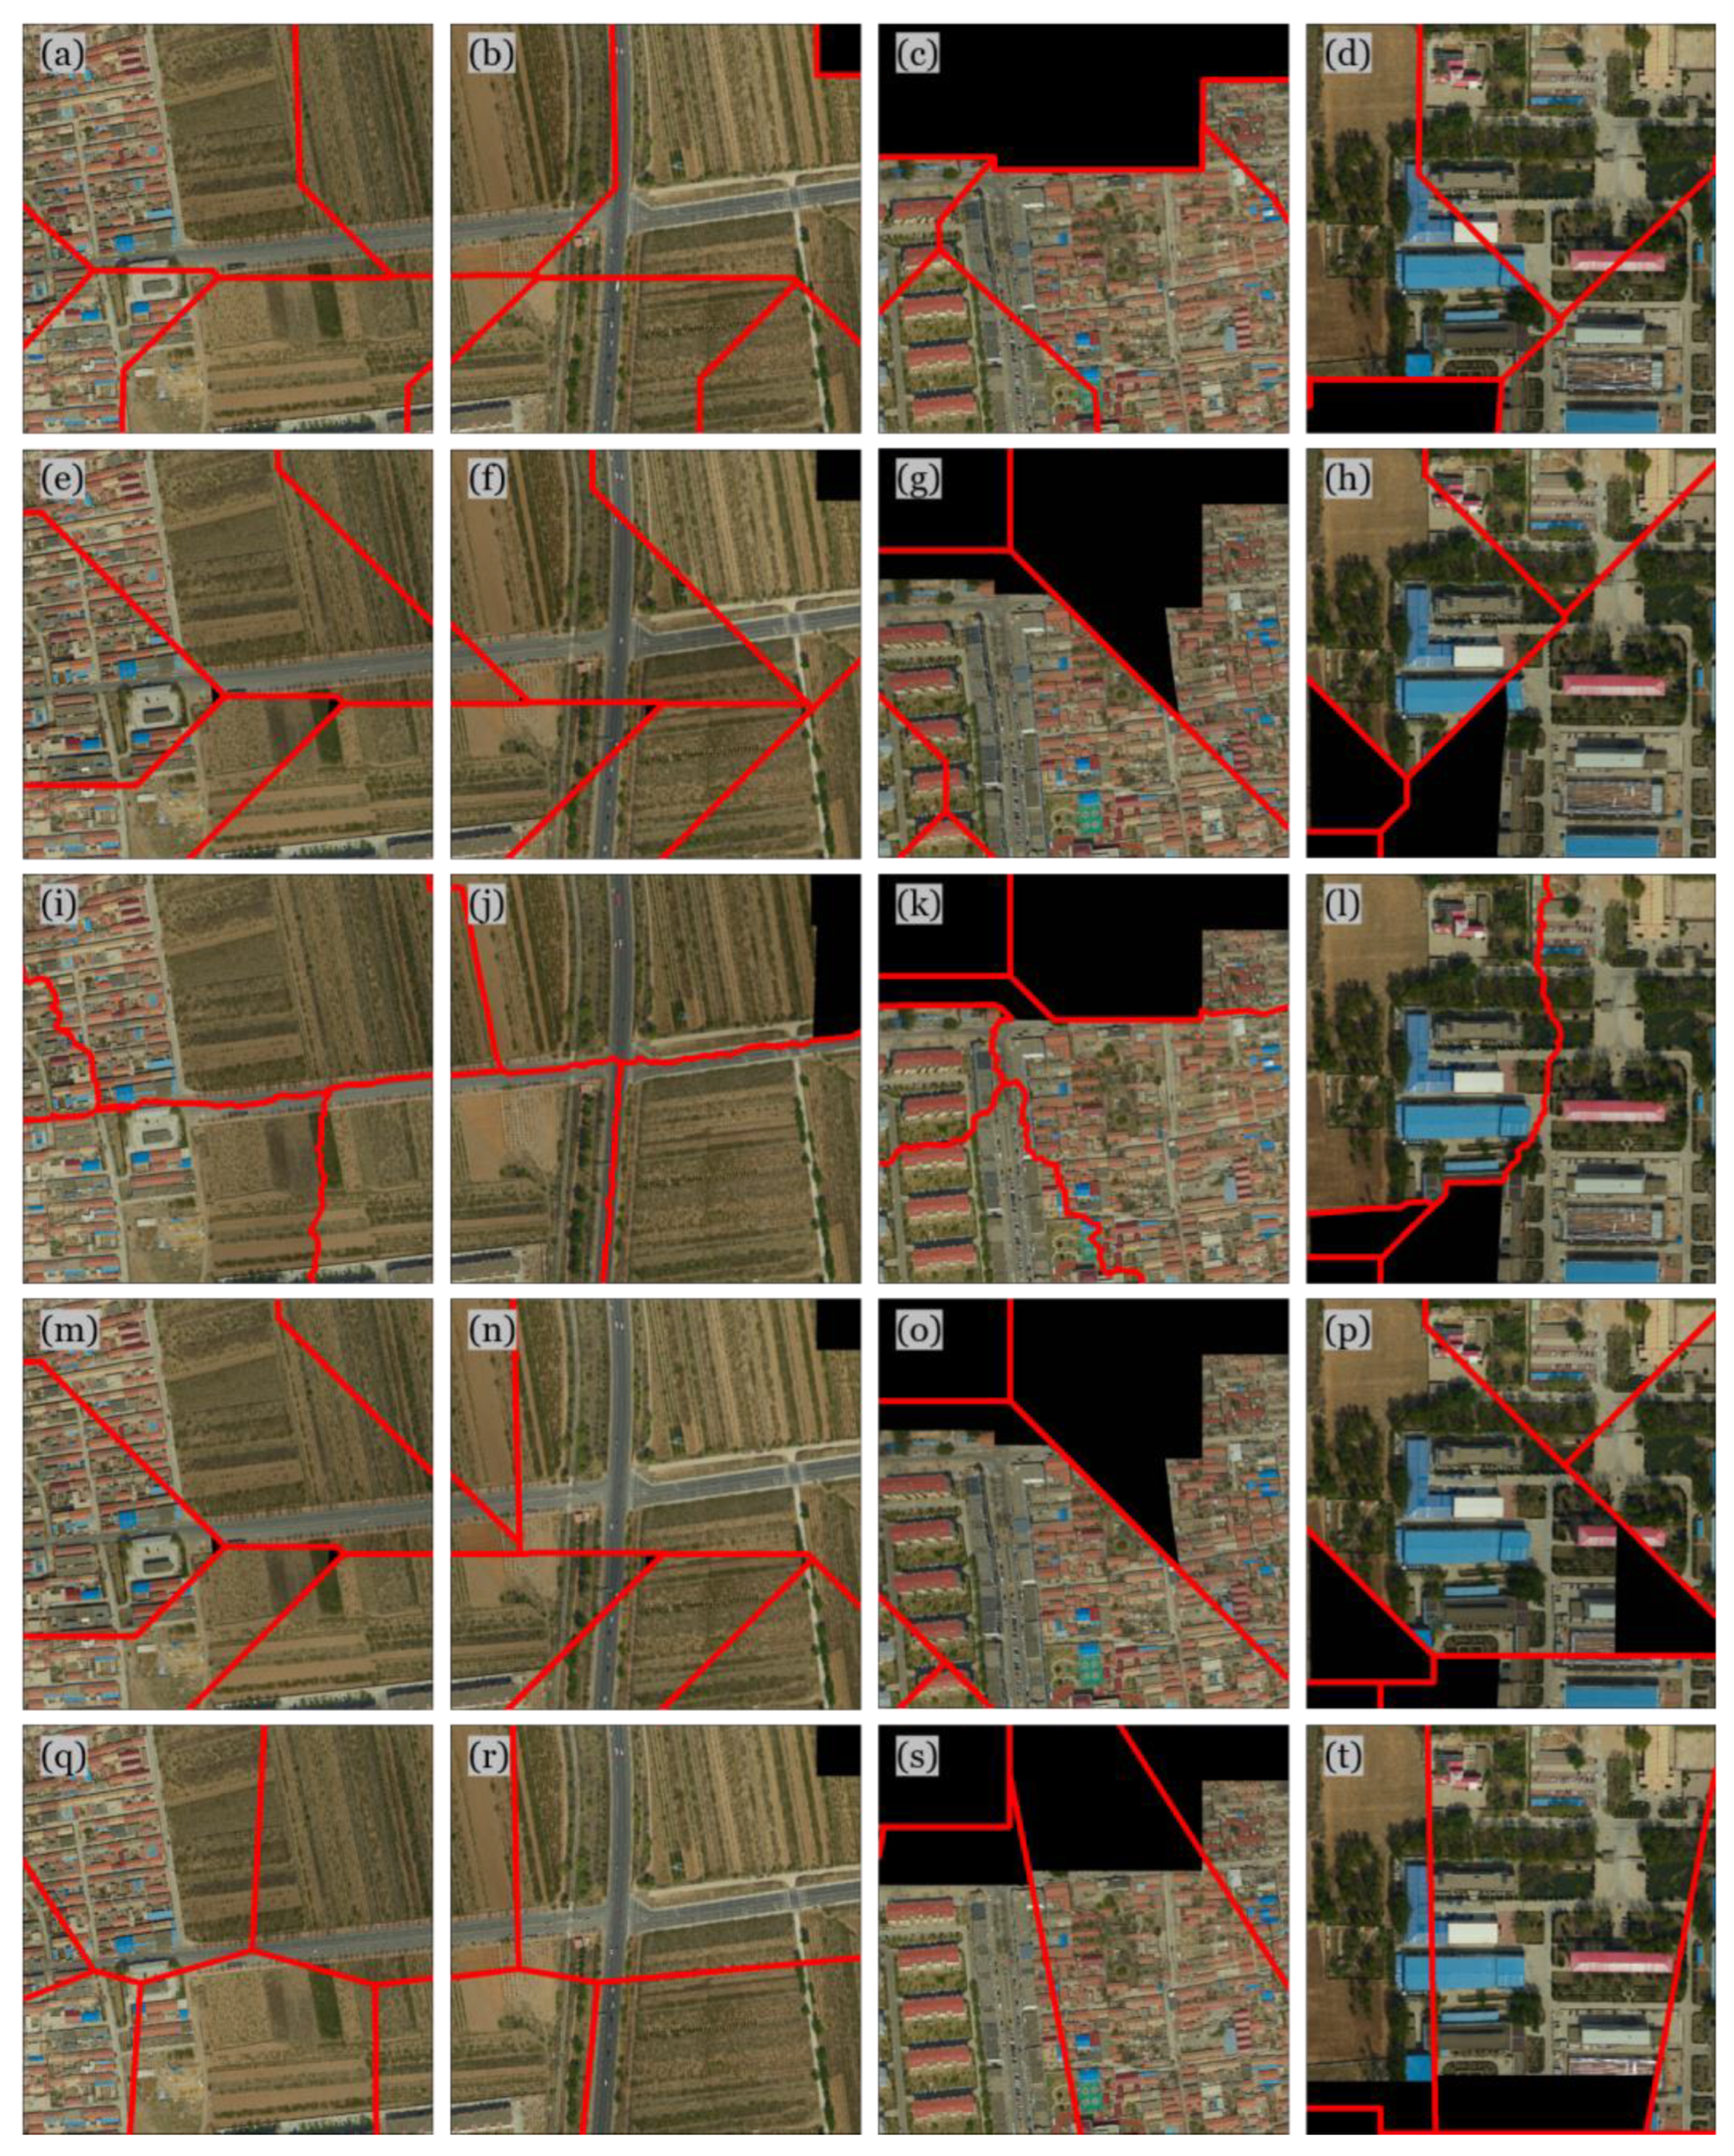
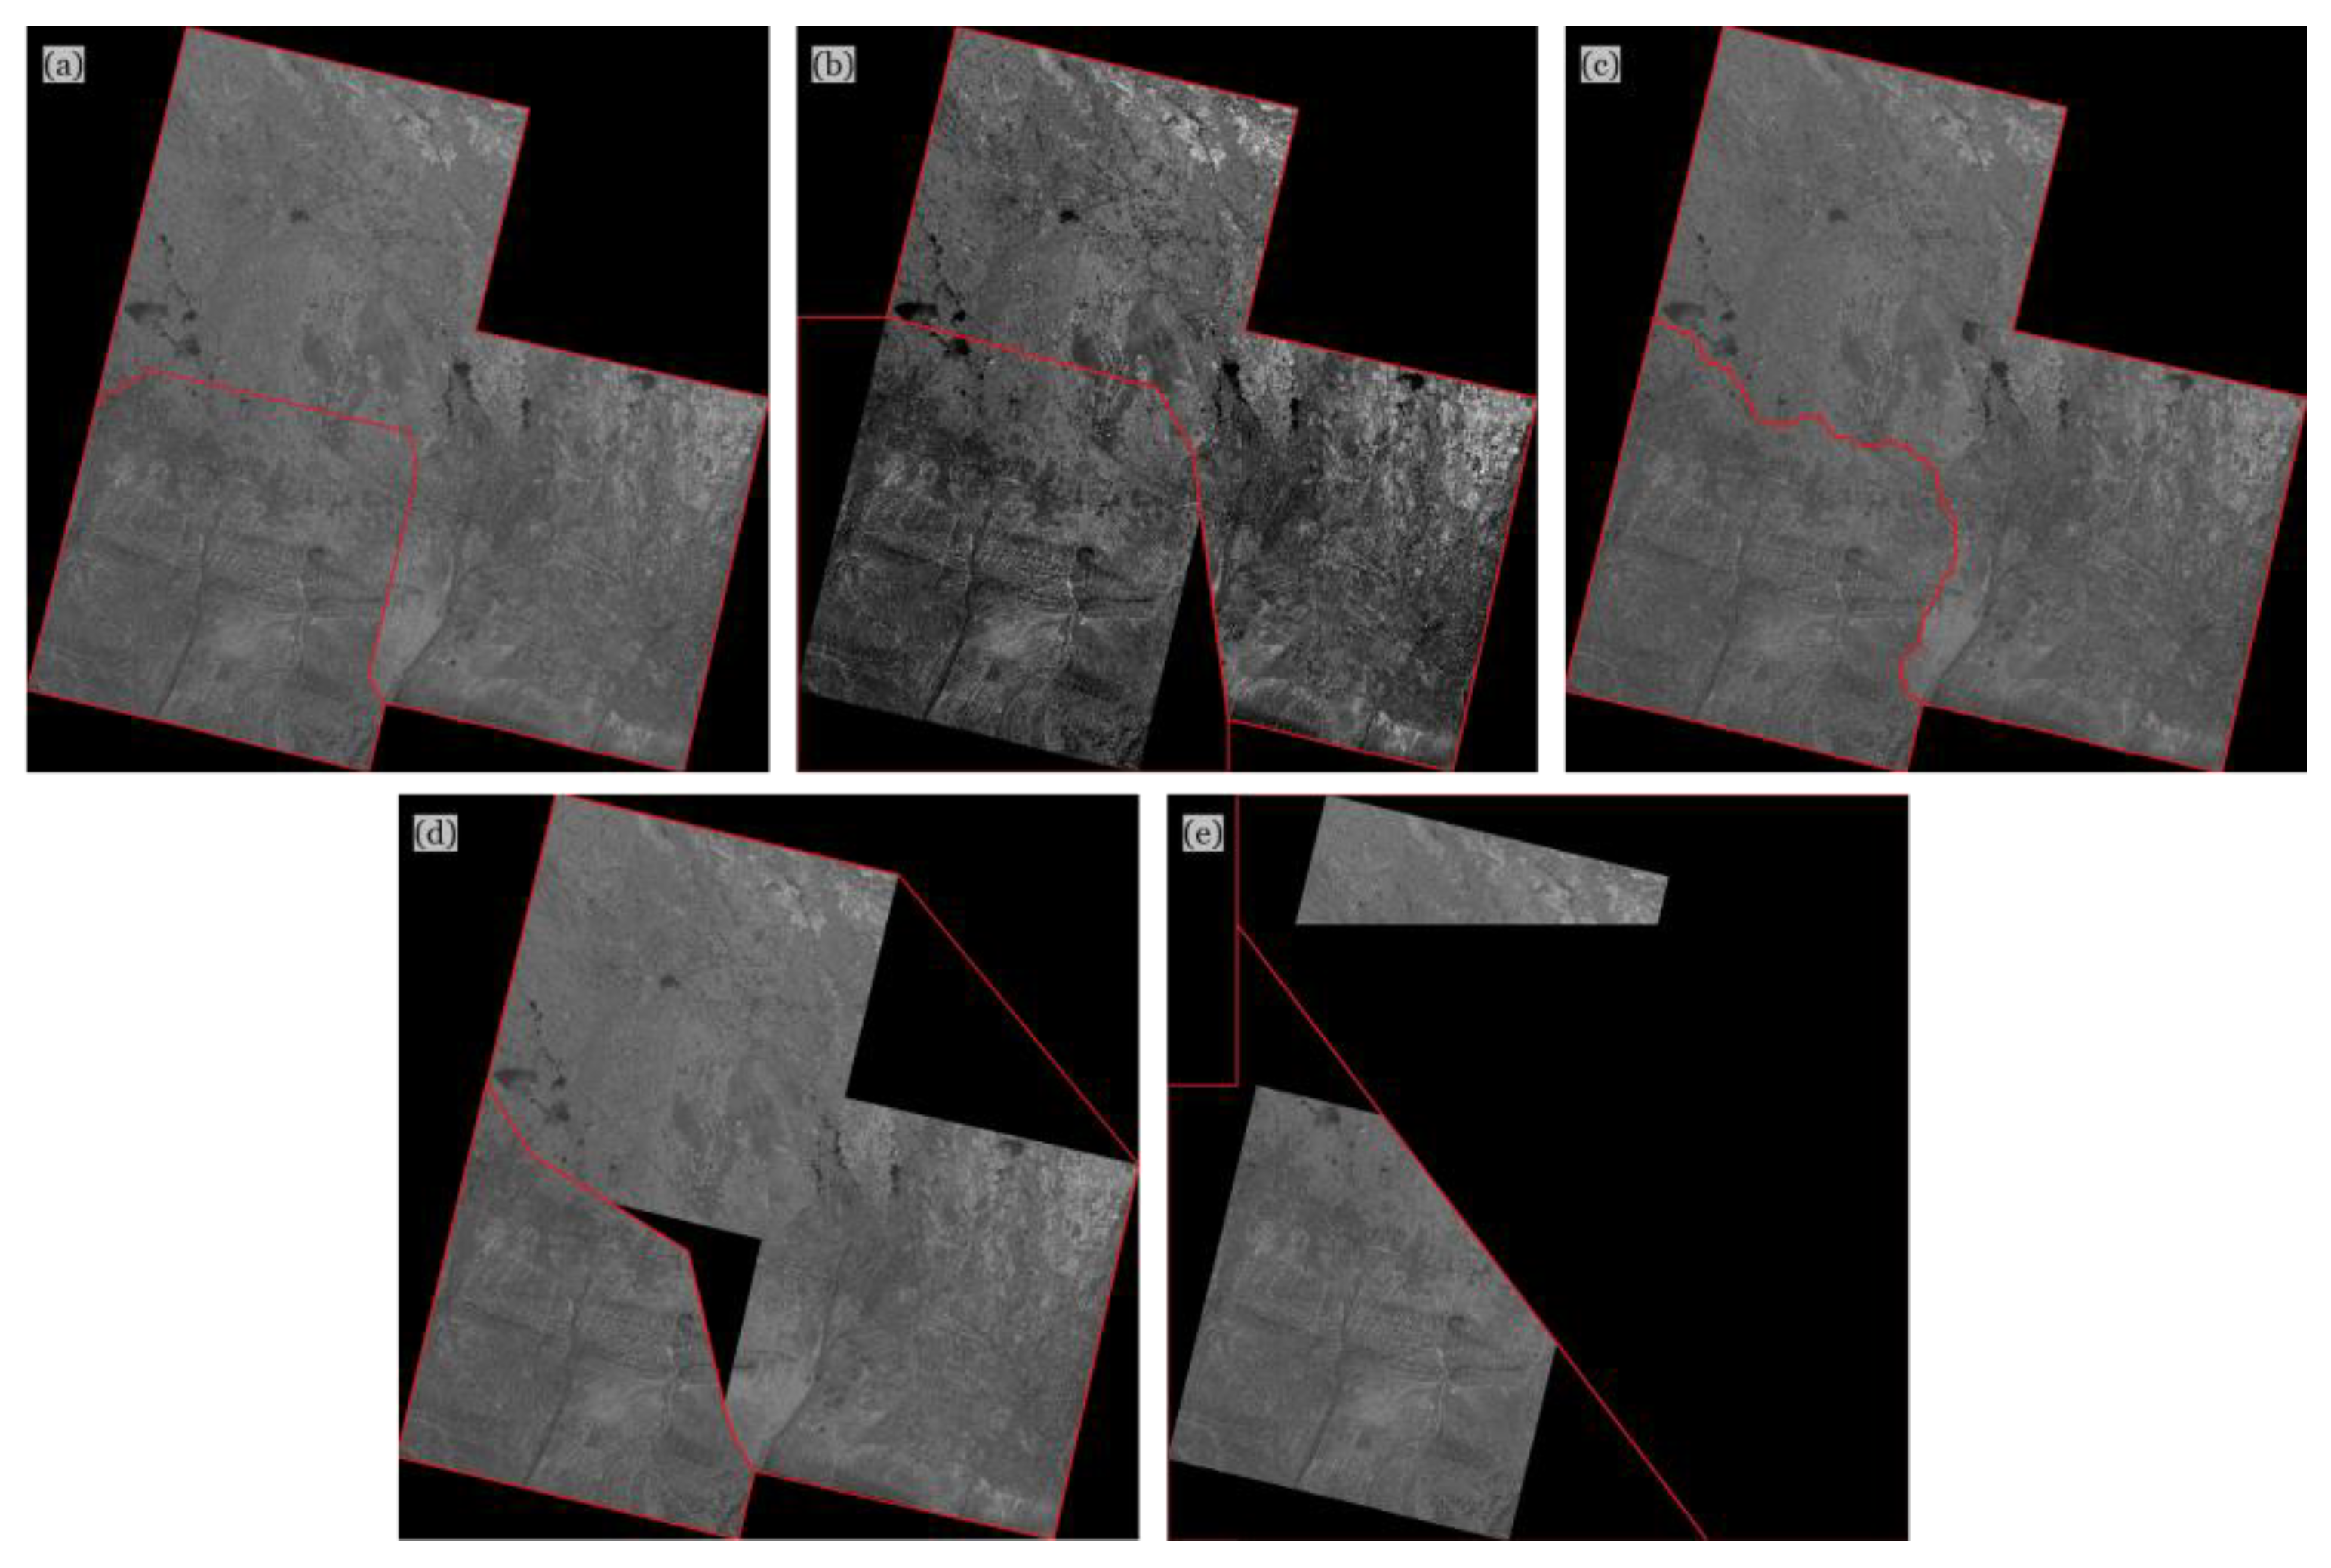
The proposed algorithm was developed using C++ in the visual studio 2022 environment, applying OpenCV 4.5.0 and boost1.76. The test machine was a 2.60 GHz Intel Core i7-10750H CPU with 16 GB RAM running Windows 11.
Two sets of comparison experiments were conducted to verify the effectiveness of the proposed method. The details of the two datasets are listed in Table 1.
The first dataset is the rectified orthoimage capture from the ZY-3 satellite in the panchromatic model. The image overlap is low, which places greater difficulty on seamline network generation. The second dataset is the orthoimages obtained by the PhaseOne aerial camera. This set of orthoimages has significant differences in image size and an uneven overlap ratio, and the geometry of the overlap area is irregular. This causes challenges for the mosaic.
Four representative methods were selected for comparison experiments: (1) the latest improved AVOD-based method proposed by Wang [17]; (2) the optimal seamline network generation method proposed by Yang [18]; (3) the well-known software ArcGIS latest build 10.8 seamline generation function; (4) the Voronoi-based method. In Wang’s approach, we used the implementation of the initial seamline network from his article. For Yang’s method, the initial seamline network generation and seamline optimization are performed simultaneously; we implemented this method based on his article and adopted its overall approach. In addition, the Voronoi-based method was implemented based on OpenCV 4.50 and Boost 1.76.
The results will be evaluated based on two metrics; the first is the mosaic coverage ratio [19,20]. This metric is calculated by dividing the pixel number in the final mosaic by the pixel number in the total valid area covered by all orthoimages, which reflects the utilization of orthoimage by the generated seamline network; the more significant the mosaic coverage ratio, the better the utilization of the orthoimage. Secondly, the ratio of the invalid pixels to total images, which reflects the accuracy of the generated seamline network. The calculation method is as follows:
Mosiac   Coverage   Ratio = PixNum Mosaiced image PixNum orthoimage coverrage
Mosaic   Invalid   Ratio = PixNum Invalid PixNum Mosaiced image
The larger the invalid mosaic ratio, the lower the accuracy of the whole seamline network, and the more invalid areas in mosaicked orthoimage that will be generated [21].

3.2. Result

Figure 9 shows the image stack of the first datasets. The valid region of the orthoimage maintains a regular quadrilateral shape. However, the overlap between some of these images is less than 15%, which can easily cause mosaicking holes.
Figure 10 shows the experimental results of the five methods for the first dataset. Overall, the results of the proposed method shown in Figure 10a, Wang’s method in Figure 10b, and Yang’s method in Figure 10c produced a seamless mosaic, and the seamline fit perfectly to the boundary of the image. Among them, Yang’s method performed seamline network generation and seamline optimization at the same time, so the seamline in the result was different from the other methods, presenting a twisted line segment.
Figure 10d is the seamline network processing result of the ArcGIS method; the seamline did not fit the edge of the valid region of the orthoimage, and there were obvious mosaic holes produced. Figure 10e is the result of the Voronoi-based method, which did not consider the valid image region. Therefore, a mosaic hole is produced at the junction of adjacent mosaic images, and the seamline network was not a perfect fit for the image boundary.
Figure 11 shows a detailed view of the seamline network generated method’s result. Judging from the details, the proposed, Wang’s and Yang’s methods produced no mosaic holes. However, the ArcGIS method and Voronoi-based method (Figure 11n,r) had a triangle-shaped mosaic hole at the intersection of the three seamlines. The reason is that the invalid area was not considered when generating the seamline network; a line was beyond the valid area of the orthoimage. This problem was concealed when the image overlap was abundant, but in dataset 1, the overlap between the two images was less than 15%. Additionally, Figure 11m,o–q,s,t does not show typical mosaic holes in the middle of the mosaicked image; although it did not cause significant visual problems to the mosaic results, it reduced the utilization of the orthoimage, which was reflected in the subsequent evaluation metrics.
Figure 12 shows the second dataset stacked. The second dataset had 39 images and a higher overlap, with an average of up to 70% in adjacent images. Still, there was also a low-overlap case due to the instability of aerial photography. Another feature was that almost all valid orthoimage regions were irregular polygons. Moreover, a certain percentage of them were concave polygons. In Figure 12, two typical orthoimages with irregular concave polygons are shown.
Figure 13a shows that the proposed method yields seamline network and mosaic results, which were hole-free, the seamlines were close to the valid region, and the inside of the seamline network did not contain any invalid pixel. For Wang’s method result shown in Figure 13b, the overall seamline did not traverse large invalid areas, but there were several small holes in the mosaic results, probably because there were quite a few concave polygons in this dataset, which were approximated as quadrilaterals during processing. Additionally, due to its optimization of network connection points, its nodes were not on obvious features. Moreover, unlike the result in the last dataset, the seamline did not fit the boundary near the edge of the mosaic image, resulting in part of the orthoimage not covering the areas that could be covered. This will reduce the mosaic coverage ratio. Yang’s method shown in Figure 13c produced one obvious mosaic hole. In addition, there was a similar problem to Wang’s method, where the boundary seamline did not fit the image edge, reducing image utilization. The ArcGIS method is shown in Figure 13d; the seamline also did not fit tightly fit the image, and four obvious mosaic holes appeared in the result. The Voronoi-based method results are shown in Figure 13e, which benefited from high image redundancy coverage, and no mosaic holes were generated despite not considering the valid image area. In addition, although the seamline did not fit the boundary of the mosaicked image, the orthoimage near the margin was used as much as possible.
The detailed view of the five methods’ results for the second dataset is shown in Figure 14. The proposed method and Voronoi-based method mosaicked image contained no mosaic holes. For Wang’s method, as shown in Figure 14e,f, there were four mosaic holes at the intersection of the seamlines. In its practical implementation, the polygon may be approximated as a quadrilateral. Moreover, there were concave polygons in this dataset, which are more difficult to process with this method. Yang’s method produced one mosaic hole, and the area was relatively large, significantly influencing the visual effect. For the ArcGIS method shown in Figure 14m,n, four mosaic holes were produced at the seamline connection. For the Voronoi-based method, due to the large image overlap in dataset 2, no mosaic holes were produced in Figure 14q,r. On the other hand, Figure 14c,d shows the seamline produced by the proposed method, which completely enclosed the image boundary at the edge of the mosaicked image, except for Figure 14g,h produced by the Wang’s method and Figure 14o,p produced by ArcGIS method, although there were no mosaic holes in these scenes. However, the seamline did not choose the best placement in the effective overlap area, resulting in a smaller effective mosaic coverage and lower utilization of orthoimages.
The statistical results of the two dataset experiments are given in Table 2. In dataset 1, the Voronoi-based method and ArcGIS produced one mosaic hole. The proposed, Wang’s and Yang’s methods achieved a perfect mosaic without holes. Regarding the invalid mosaic ratio, the Voronoi-based was 0.00277% and the ArcGIS method was 0.00266%; since the proposed, Wang’s and Yang’s methods did not produce mosaic holes, this indicator was 0%. For the mosaic coverage ratio, the proposed, Wang’s and Yang’s methods reached 100%, consistent with the effective orthoimage coverage in dataset 1. For the Voronoi-based method, the seamline network was not optimal at the image overlaps, making the area near the boundary not effectively covered in the final mosaic. Therefore, the mosaic coverage ratio was 98.76%, and for the ArcGIS method, this value was lower because its seamline did not fit the edge and crossed some invalid areas, reaching 98.3%. In terms of processing time, the Voronoi method was the fastest, requiring only 2765 ms; the proposed method was almost twice as fast, requiring 5844 ms, the ArcGIS method took 13,725 ms, and Wang’s method took the longest time, reaching 52,230 ms; for Yang’s method, because of its seamline optimization, the time significantly increased to 104,533 ms.
In dataset 2, Wang’s method produced four mosaic holes, which can be attributed to the image’s valid area irregularity and the presence of concave polygons, and the invalid mosaic ratio was 0.0261%. For Yang’s method, there was one hole in the mosaic result, the area was relatively large, and the invalid mosaic ratio was 0.0331%. The ArcGIS method produced four mosaic holes; it is worth noting that one of the areas near the edge of the image was very large, which greatly affected the visual effect, and the invalid mosaic ratio reached 0.0347%. Meanwhile, the proposed and Voronoi-based methods did not produce mosaic holes, and the mosaic invalid ratio was 0%. In this dataset, the seamline networks of Wang’s method, Yang’s method, the ArcGIS method, and the Voronoi-based method did not fit closely to the images on the boundary. They were not optimal in terms of mosaic coverage ratio, which was 98.44%, 98.81%, 98.01%, and 98.85% respectively. The proposed method was still 100%; orthoimage overlay in the dataset was fully utilized. In terms of time consumption, the Voronoi-based method was still the lowest, requiring only 9867 ms, followed by the proposed method, which took 14,892 ms, the ArcGIS method took 25,124 ms, and Wang’s method required 81,498 ms; Yang’s method took the longest at 153,391 ms.

4. Discussion

The above experiments on two data sets proved that the proposed method has advantages in terms of accuracy and effectiveness compared to the classic approach. The advantage of the proposed method is that the effective overlap of the orthoimage is used as the initial condition to generate seamlines, and independent EMPs are generated for each orthoimage. Therefore, in the case of insufficient or even very low overlap, it is ensured that the seamline does not exceed the valid image region. In the dataset 1 experiment, even the satellite images with low overlaps, the proposed (Figure 10a), Wang’s (Figure 10b), and Yang’s (Figure 10c) methods produced no mosaic holes. Meanwhile, the Voronoi-based method uses only the orthoimage centroid as the initial condition, and the ArcGIS method does not take advantage of the valid region of the image. So, in the case of insufficient overlap, mosaic holes are produced, as seen in Figure 11n and Figure 11r, since the arbitrary polygon is approximated as a quadrilateral in implementation. In dataset 2, the valid region of the orthoimage was irregular polygons and even some concave polygons. Therefore, despite sufficient overlapping redundancy, Wang’s method still produced four mosaic holes. Yang’s method produced one large mosaic hole. In addition, the ArcGIS method also produced four mosaic holes, and one of them had a large area, which greatly affected the visual effect. Additionally, due to the increase in overlap redundancy, the Voronoi-based method generated no mosaic holes even though it did not consider the valid orthoimage region. Since the proposed method improves the centerline generation method for polygon irregularities and concave and convex cases, no mosaic holes were generated in this data set as well. In all experiments, the produced mosaic holes were small compared to the mosaicked images, and therefore the invalid mosaic ratio was a small value. However, any hole in the middle of the mosaicked image will negatively impact the visual effect and needs to be corrected.
For a set of orthoimages, the ideal mosaicked result coverage is the extent to which all valid image regions overlap. In other methods, it is not considered whether the seamline network is tight to the boundary of the image. Only the periphery of the mosaicked image needs to be cropped off to avoid the mosaicked imperfections. In the dataset 1 Voronoi-based method results (Figure 11o,p) and dataset 2 Wang’s method results (Figure 14g,h), both produced a marginal gap for the seamline network not enclosing the orthoimage’s boundary. Although the mosaic coverage ratio was very high and these areas did not seriously impact the final visual effect, the shape characteristics of these gaps will lead to a large amount of wasted area when the final cut is made. As shown in Figure 15, since the proposed method had a better mosaic result without a gap at the image boundary, its cropping range was nearly 18% larger than that of Wang’s method.

Extreme Testing

The main innovation of this paper is introducing the Voronoi network to determine the centerline of overlaps as a seamline, which solves the problem of seamline generation under arbitrary polygons. To verify the advantage of the proposed algorithm under arbitrary polygons, extreme case experiments were conducted.
The case consists of two images, one stitched together from two orthoimages in dataset 1, and the other is a third image that overlaps with these two orthoimages.
As shown in Figure 16, the overlap of these two images is marked with a blue polygon. Unlike the usual case, the overlapping polygon is L-shaped, with nearly right-angle corners, and is a typical concave polygon.
For this case, three methods were used for seamline and mosaic image generation, respectively. The results are shown in Figure 17; the proposed and Yang’s method generated the correct mosaic results, and the seamline network did not exceed the overlapping polygons. Since the overlapping polygon, in this case, is L-shaped, it cannot be approximated as a quadrilateral, so the seamline produced by the Wang’s and ArcGIS method exceeded the overlapping polygon, and the ArcGIS method produced a large mosaic hole near the L-shaped overlap. The mosaic result had a large deficit. The Voronoi-based method achieved the worst results in this case, with large areas of loss in the mosaic image.

5. Conclusions

Seamline network generation is a critical step in orthoimage mosaicking, which directly affects the subsequent seamline optimization and the final mosaic results [22]. A fine seamline network needs to comply with the following principles: (1) the EMP of each image should preferably be selected near the image center; (2) the vectors in the seamline network cannot cross the invalid image region. The Voronoi-based method follows the first one but does not satisfy the second one, while the AVOD-based method satisfies all of them, but there are limitations in terms of polygon shape in the actual implementation.
In this paper, a Voronoi centerline-based seamline network generation method is proposed. The Voronoi diagram is generated by using the edge points of the orthoimage overlap as the seed; hence, the centerline of the overlap region is extracted as the cutline. Then, the cutline is used to cut each orthoimage to obtain the EMP, which is finally merged into the seamline network. Two practical dataset experimental results show that the proposed method can generate fine seamline and hole-free image mosaics. Both the invalid mosaic ratio and the mosaic coverage ratio have advantages over the comparative methods. The extreme case experiments in the discussion section also illustrate that the proposed method can handle arbitrarily shaped polygons, even in niche cases. In terms of processing efficiency, the proposed method takes twice as much time as the Voronoi-based method, but the trade-off in effect improvement is relatively worthwhile.
The proposed method ensures that the seamlines in the network do not exceed the orthoimage effective zone, and it can handle polygons of various shapes. However, there are still some weaknesses; although it can extract the centerline stably for complex polygons, the generated line segments have strange corners in some places where the Voronoi network is sparse. In addition, this paper still needs to solve the problem of optimizing the intersection of the seamline network, and there is still room for improvement in processing efficiency [23], which will be further studied in future work.

Author Contributions

All authors made significant contributions to the manuscript. Conceptualization, X.Y.; methodology, Y.C. and X.Y.; software, Y.C.; validation, Y.C.; formal analysis, Y.C.; investigation, Y.C.; resources, X.Y.; data curation, Y.C.; writing—original draft preparation, Y.C. and X.Y.; writing—review and editing, X.Y. and W.Y.; visualization, Y.C.; supervision, X.Y.; project administration, X.Y.; funding acquisition, X.Y. All authors have read and agreed to the published version of the manuscript.

Funding

This work is supported by the National Natural Science Foundation of China [Grant No. 41771479], National High-Resolution Earth Observation System (the Civil Part) [Grant No. 50-H31D01-0508-13/15], and Japan Society for the Promotion of Science (JSPS) [Grant No. 22H03573].

Data Availability Statement

Not applicable.

Conflicts of Interest

The authors declare no conflict of interest.

References

  1. Li, X.; Feng, R.; Guan, X.; Shen, H.; Zhang, L. Remote Sensing Image Mosaicking: Achievements and Challenges. IEEE Geosci. Remote Sens. Mag. 2019, 7, 8–22. [Google Scholar] [CrossRef]
  2. Yang, Y.; Gao, Y.; Li, H.; Han, Y. An Algorithm for Remote Sensing Image Mosaic Based on Valid Area. In Proceedings of the 2011 International Symposium on Image and Data Fusion, Tengchong, China, 9–11 August 2011; pp. 1–4. [Google Scholar] [CrossRef]
  3. Yuan, Y.; Fang, F.; Zhang, G. Superpixel-Based Seamless Image Stitching for UAV Images. IEEE Trans. Geosci. Remote Sens. 2021, 59, 1565–1576. [Google Scholar] [CrossRef]
  4. Zaki, N.H.M.; Chong, W.S.; Muslim, A.M.; Reba, M.N.M.; Hossain, M.S. Assessing optimal UAV-data pre-processing workflows for quality ortho-image generation to support coral reef mapping. Geocarto Int. 2022, 1–25. [Google Scholar] [CrossRef]
  5. Wei, J.; Tang, W.; He, C. Enblending Mosaicked Remote Sensing Images with Spatiotemporal Fusion of Convolutional Neural Networks. IEEE J. Sel. Top. Appl. Earth Obs. Remote Sens. 2021, 14, 5891–5902. [Google Scholar] [CrossRef]
  6. Xandri, R.; Pérez-Aragüés, F.; Palà, V.; Arbiol, R. Automatic generation of seamless mosaics over extensive areas from high resolution imagery. In Proceedings of the World Multi-Conference on Systemics, Cybernetics and Informatics (WMSCI), Orlando, FL, USA, 10–13 July 2005. [Google Scholar]
  7. Wang, D.; Cao, W.; Xin, X.; Shao, Q.; Brolly, M.; Xiao, J.; Wan, Y.; Zhang, Y. Using vector building maps to aid in generating seams for low-attitude aerial orthoimage mosaicking: Advantages in avoiding the crossing of buildings. ISPRS J. Photogramm. Remote Sens. 2017, 125, 207–224. [Google Scholar] [CrossRef]
  8. Hsu, S.; Sawhney, H.S.; Kumar, R. Automated mosaics via topology inference. IEEE Comput. Graph. Appl. 2022, 22, 44–54. [Google Scholar] [CrossRef]
  9. Song, M.; Ji, Z.; Huang, S.; Fu, J. Mosaicking UAV orthoimages using bounded Voronoi diagrams and watersheds. Int. J. Remote Sens. 2018, 39, 4960–4979. [Google Scholar] [CrossRef]
  10. Zheng, M.; Xiong, X.; Zhu, J. A novel orthoimage mosaic method using a weighted A∗ algorithm—Implementation and evaluation. ISPRS J. Photogramm. Remote Sens. 2018, 138, 30–46. [Google Scholar] [CrossRef]
  11. Li, L.; Tu, J.; Gong, Y.; Yao, J.; Li, J. Seamline network generation based on foreground segmentation for orthoimage mosaicking. ISPRS J. Photogramm. Remote Sens. 2019, 148, 41–53. [Google Scholar] [CrossRef]
  12. He, J.; Sun, M.; Chen, Q.; Zhang, Z. An improved approach for generating globally consistent seamline networks for aerial image mosaicking. Int. J. Remote Sens. 2019, 40, 859–882. [Google Scholar] [CrossRef]
  13. Pan, J.; Wang, M.; Li, D.; Li, J. Automatic Generation of Seamline Network Using Area Voronoi Diagrams with Overlap. IEEE Trans. Geosci. Remote Sens. 2009, 47, 1737–1744. [Google Scholar] [CrossRef]
  14. Mills, S.; McLeod, P. Global seamline networks for orthomosaic generation via local search. ISPRS J. Photogramm. Remote Sens. 2013, 75, 101–111. [Google Scholar] [CrossRef]
  15. Pan, J.; Wang, M.; Ma, D.; Zhou, Q.; Li, J. Seamline Network Refinement Based on Area Voronoi Diagrams with Overlap. IEEE Trans. Geosci. Remote Sens. 2014, 52, 1658–1666. [Google Scholar] [CrossRef]
  16. Pan, J.; Fang, Z.; Chen, S.; Ge, H.; Hu, F.; Wang, M. An Improved Seeded Region Growing-Based Seamline Network Generation Method. Remote Sens. 2018, 10, 1065. [Google Scholar] [CrossRef]
  17. Wang, Q.; Zhou, G.; Song, R.; Xie, Y.; Luo, M.; Yue, T. Continuous space ant colony algorithm for automatic selection of orthophoto mosaic seamline network. ISPRS J. Photogramm. Remote Sens. 2022, 186, 201–217. [Google Scholar] [CrossRef]
  18. Yang, J.; Liu, L.; Yan, Q.; Deng, F. Efficient Seamline Network Generation for Large-Scale Orthoimage Mosaicking. IEEE Geosci. Remote Sens. Lett. 2022, 19, 1–5. [Google Scholar] [CrossRef]
  19. Tian, Y.; Sun, A.; Wang, D. Seam-line determination via minimal connected area searching and minimum spanning tree for UAV image mosaicking. Int. J. Remote Sens. 2018, 39, 4980–4994. [Google Scholar] [CrossRef]
  20. Chen, Q.; Sun, M.; Hu, X.; Zhang, Z. Automatic Seamline Network Generation for Urban Orthophoto Mosaicking with the Use of a Digital Surface Model. Remote Sens. 2014, 6, 12334–12359. [Google Scholar] [CrossRef]
  21. Zhang, C.; Zhang, Y.; Guo, B.; Ren, L. Dense Optical Flow Method for Intelligently Extracting Seamline of Orthophotos. Geomat. Inf. Sci. Wuhan Univ. 2022, 47, 261–268. [Google Scholar] [CrossRef]
  22. Li, L.; Yao, J.; Xie, R.; Li, J. Edge-Enhanced Optimal Seamline Detection for Orthoimage Mosaicking. IEEE Geosci. Remote Sens. Lett. 2018, 15, 764–768. [Google Scholar] [CrossRef]
  23. Li, Y.; Yin, H.; Yao, J.; Wang, H.; Li, L. A unified probabilistic framework of robust and efficient color consistency correction for multiple images. ISPRS J. Photogramm. Remote Sens. 2022, 190, 1–24. [Google Scholar] [CrossRef]
Figure 1. An illustration of the seamline network and EMP.
Remotesensing 15 00917 g001
Figure 2. An illustration of valid orthoimage regions and overlaps.
Remotesensing 15 00917 g002
Figure 3. An illustration of the centerline extracted from a (a) rectangle, (b) concave polygon, and (c) irregular polygon.
Remotesensing 15 00917 g003
Figure 4. Workflow of the seamline network generation.
Remotesensing 15 00917 g004
Figure 5. Illustration of VOA and corresponding Voronoi network: (a) an undensified simple quadrilateral; (b) a densified simple quadrilateral; (c) an undensified concave polygon; (d) a densified concave polygon.
Remotesensing 15 00917 g005
Figure 6. Illustration of the Voronoi network constructed by different VOAs: (a) a simple quadrilateral; (b) a triangle; (c) a simple concave polygon; (d) a complex concave polygon.
Remotesensing 15 00917 g006
Figure 7. Illustration of centerline extracted from different Gvoa: (a) a simple quadrilateral; (b) a triangle; (c) a simple concave polygon; (d) a complex concave polygon.
Remotesensing 15 00917 g007
Figure 8. Illustration of the EMPi segmented by cutlinej and cutlinej+1.
Remotesensing 15 00917 g008
Figure 9. Image stack of dataset 1.
Remotesensing 15 00917 g009
Figure 10. Seamline network and mosaic result for dataset 1 generated by (a) proposed method, (b) Wang’s method, (c) Yang’s method, (d) ArcGIS method, and (e) Voronoi-based method.
Remotesensing 15 00917 g010aRemotesensing 15 00917 g010b
Figure 11. Dataset 1 detailed view of proposed method result (ad); Wang’s method result (eh); Yang’s method result (il); ArcGIS method result (mp); Voronoi-based method result (qt).
Remotesensing 15 00917 g011
Figure 12. Image stack of dataset 2.
Remotesensing 15 00917 g012
Figure 13. Seamline network and mosaic result for dataset 2 generated by (a) proposed method, (b) Wang’s method, (c) Yang’s method, (d) ArcGIS method, and (e) Voronoi-based method.
Remotesensing 15 00917 g013aRemotesensing 15 00917 g013b
Figure 14. Dataset 2 detailed view of proposed method result (ad); Wang’s method result (eh); Yang’s method result (il); ArcGIS method result (mp); Voronoi-based method result (qt).
Remotesensing 15 00917 g014
Figure 15. Maximum cropping range of dataset 1 mosaic results generated by AVOD and the proposed method.
Remotesensing 15 00917 g015
Figure 16. Image stacking schematic of extreme conditions case.
Remotesensing 15 00917 g016
Figure 17. Seamline and mosaic results of extreme case generated by (a) proposed method, (b) Wang’s method, (c) Yang’s method, (d) ArcGIS method, and (e) Voronoi-based method.
Remotesensing 15 00917 g017
Table 1. Dataset Description.
DatasetCapture PlatformFocal Length (mm)FOVImage Size (Pixel)Spectral BandNumber of ImagesOverlap
(Mean/Side)
Ground Resolution (m)
1Satellite1700 6 ° 12,961 * 13,676Pan523%/19%5
2Aerial90 34 ° 4187 * 3178R-G-B3964%/34%0.2
Table 2. Dataset 1&2 Statistical Results.
MethodNumber of Mosaic HolesMosaic Invalid RatioMosaic Coverage RatioProcess Time (ms)
Dataset 1Proposed00%100%5844
Wang’s00%100%52,230
Yang’s00%100%104,533
ArcGIS10.00266%98.3%13,725
Voronoi10.00277%98.76%2765
Dataset 2Proposed00%100%14,892
Wang’s40.0261%98.44%81,498
Yang’s10.0331%98.81%153,391
ArcGIS40.0347%98.01%25,124
Voronoi00%98.85%9867
Disclaimer/Publisher’s Note: The statements, opinions and data contained in all publications are solely those of the individual author(s) and contributor(s) and not of MDPI and/or the editor(s). MDPI and/or the editor(s) disclaim responsibility for any injury to people or property resulting from any ideas, methods, instructions or products referred to in the content.

