Abstract
The South-to-North Water Diversion (SNWD) is a multi-decadal infrastructure project in China aimed at alleviating severe water shortages in north China. It has imposed broad social, economic, environmental, and ecological impacts since 2015, particularly in the Beijing-Tianjin metropolitan area. Sentinel-1A/B Interferometric Synthetic Aperture Radar (InSAR) (2014–2021), Global Positioning System (GPS) (2010–2021), and hydraulic-head data are used to assess the impacts on ongoing land subsidence in Tianjin in this study. Additionally, the Principal Component Analysis (PCA) is employed to highlight primary factors controlling the recent land subsidence. Our results show that the reduced groundwater pumping has slowed down the overall subsidence since 2019 due to SNWD. As of 2021, the subsiding area (>5 mm/year) has reduced to about 5400 km2, approximately 85% of the subsiding area before SNWD; the areas of rapid subsidence (>30 mm/year) and extremely rapid subsidence (>50 mm/year) have reduced to 1300 km2 and 280 km2, respectively, approximately 70% and 60% of the areas before SNWD. Recent subsidence (2016–2021) was primarily contributed by the inelastic compaction of clays in deep aquifers of Aquifers III and IV ranging from approximately 200 to 450 m below the land surface. The ongoing rapid subsidence (>30 mm/year) in Tianjin is limited to border areas adjacent to large industrial cities (e.g., Langfang, Tanshan, Cangzhou) in Hebei Province. Ongoing subsidence will cease when hydraulic heads in the deep Aquifers (IV and V) recover to the new pre-consolidation head, approximately 45 m below the land surface, and subsidence will not be reinitiated as long as the hydraulic heads remain above the new pre-consolidation head. This study reveals the importance of coordinating groundwater and surface water uses at local, regional, and national scales for land subsidence mitigation.
1. Introduction
Tianjin is a municipality in north China situated on the western coast of the Bohai Sea, 130 km southeast of Beijing, comprising 2 counties and 14 districts (Figure 1). The municipality is generally flat and hilly in the far north and swampy near the coast. As of 2020, the permanent population in Tianjin has reached about 14 million, with an urbanization rate of over 80% [1]. Tianjin has a long history of groundwater withdrawal with the first pumping well installed in 1907. Land subsidence in Tianjin was first reported in the 1920s and rapid subsidence (several centimeters per year) began to occur in the 1960s [2]. Severe subsidence has been ongoing for over a half century. The primary source causing the historic and ongoing subsidence is well known—that is the long-term excessive groundwater pumping, the same reason for many other large cities in the North China Plain (NCP) [3,4,5,6].
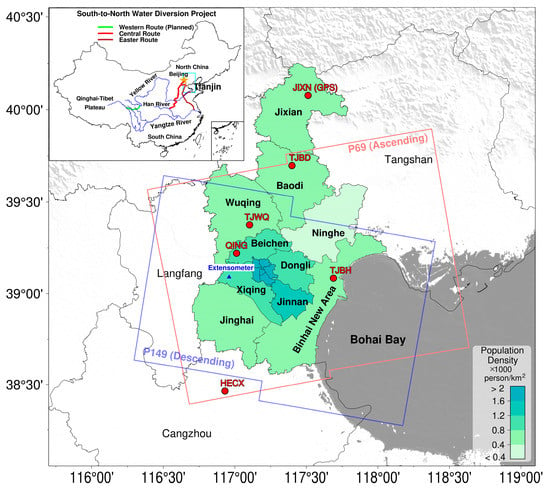
Figure 1.
The locations of three routes of the South-to-North Water Diversion (SNWD) project, the extensometer-piezometer station in Xinkou town, Xiqing District, and continuous GPS stations used in this study (JIXN, TJBD, TJWQ, QING, TJBH, and HECX). P69 and P149 indicate the areas covered by Sentinel-1 Path 69 and Path 149, respectively. The background color indicates the population density (person/km2) of Tianjin in 2021 [1].
Tectonically, Tianjin is located at a Meso-Cenozoic basin area that was filled up by continental Tertiary-Quaternary sediments, overlying the considerably fractured bedrock [7]. The Tertiary sediments are buried approximately 600 to 1100 m below the land surface. The groundwater withdrawals in Tianjin are restricted to the unconsolidated Quaternary sediments within 550 m below land surface, primarily consisting of silt and clay layers interbedded in sands irregularly. As a result, the anthropogenic subsidence is limited to the Quaternary sediments. The hydrogeological units within the Quaternary sediments are often sub-divided into five aquifer groups (Figure 2) [3,8]. Aquifer I is the unconfined aquifer while the others are confined aquifers. The hydraulic properties of sediments in Aquifers III and IV are very similar, comprising clay and sand alternate layers (Table 1). Aquifers II, III, and IV are the primary groundwater sources for domestic and industrial uses. There is not a continuous confining unit (aquitard) between upper and lower aquifers. The shallow and deep aquifers are hydrologically connected ultimately. As a consequence, long-term hydraulic-head changes in one aquifer would cause hydraulic-head changes in other aquifers.

Figure 2.
Sketch profiles of stratified aquifers: Aquifer I (40~60 m thickness), Aquifer II (25~60 m thickness), Aquifer III (30~55 m thickness), Aquifer IV (30~50 m thickness), and Aquifer V (20~30 m thickness). (a) The profiles’ location; (b) the profile from north to south; (c) the profile from west to east. (Modified from [3,8]).

Table 1.
Lithology of each aquifer ([3,8]).
To ease the water shortages in north China, particularly around the Beijing and Tianjin metropolitan region, the China government launched the South-to-North Water Diversion (SNWD) project in 2003. The mega-engineering project is a multi-decade infrastructure project, with the design capacity of channeling approximately 45 billion m3 of fresh water annually from the Yangtze River to the more arid and industrialized north through three canal systems: the Eastern Route, the Central Route, and the Western Route (Figure 1). The Eastern Route and Central Route began to transform Yangtze water to the northern at the end of 2014. The Western Route is still on the planning phase as of 2022. The Central Route transformed approximately 0.4 billion m3 water to Tianjin in 2015. This amount has been increased progressively to approximately 1.2 billion m3 in 2021, about 36% of the annual water use (approximately 3.2 billion m3 in 2015) in Tianjin. The Eastern Route began to bring water to Tianjin in the end of 2021, approximately 7 million m3. This amount is expected to increase significantly in the coming years.
Figure 3 illustrates the water supplies in Tianjin from 2010 to 2021. The water supplies are categorized as: surface water from local reservoirs, lakes, and rivers, Yangtze water from the SNWD, groundwater, and others (e.g., sewage treatment and reuse, rainwater utilization, seawater desalination). Groundwater withdrawal was 0.59 billion m3 in 2010, approximately 26% of the total water supply (~2.24 billion m3), and was 0.51 billion m3 in 2014, approximately 20% of the total water supply (~2.62 billion m3). As of 2021, the total pumping amount has reduced to 0.27 billion m3, approximately 8.4% of the total water supply (~3.23 billion m3). It needs to be noted that the maximum groundwater withdrawal in Tianjin was up to 1.2 billion m3/year during the early 1980s [9], approximately 2.5 times of the total groundwater withdrawal in 2014 (before the SNWD) and 4.5 times of the total groundwater withdrawal in 2021. The amount of groundwater withdrawal primarily comprises two components, shallow pumping primarily from Aquifer I, and deep pumping primarily from Aquifers II, III, and IV. The amount of shallow pumping was 0.30 billion m3 in 2010, 0.29 billion m3 in 2014, 0.27 billion m3 in 2018, and 0.21 billion m3 in 2021, which was relatively stable over time. The deep pumping was 0.29 billion m3 in 2010, 0.22 billion m3 in 2014, 0.15 billion m3 in 2018, and 0.06 billion m3 in 2021. Significant reductions occurred in 2018 and the following years.
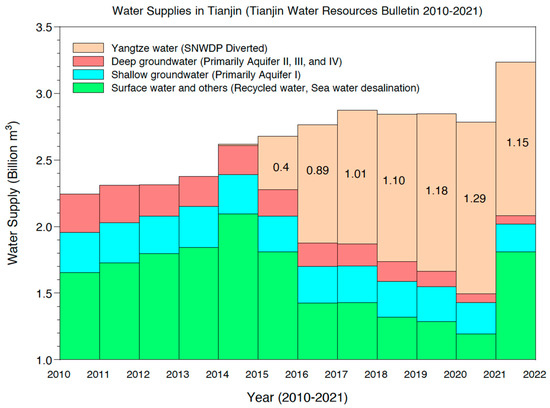
Figure 3.
Water supplies in Tianjin from 2010 to 2021. The total water supply transformed to Tianjin by the South-to-North Water Diversion (SNWD) project was approximately 7 billion m3 from 2015 to 2021. (Data source: Tianjin Water Resources Bulletins, 2010 to 2021 [10]).
Figure 4 depicts the water uses in Tianjin before (2010–2014) and after (2015–2021) the Yangtze water was available. The total amount of annual water supplies is the same as the total amount of the water uses. Water uses can be categorized as agricultural, industrial, domestic, and ecological and environmental replenishment uses. Groundwater use for ecological and environmental replenishment has dramatically increased from about 16% of the total water use in 2014 to about 35% of the total water use in 2021, largely because of the availability of Yangtze water. The ecological and environmental use mostly accounts for surface water discharging to local lakes, rivers, reservoirs, and wetlands for restoring watershed ecosystems and replenishing groundwater. As a result, the hydraulic heads in Aquifers I and II were able to remain stable since 2015, although there are enormous groundwater withdrawals from these shallow aquifers, approximately 80% of the total withdrawal in 2021.
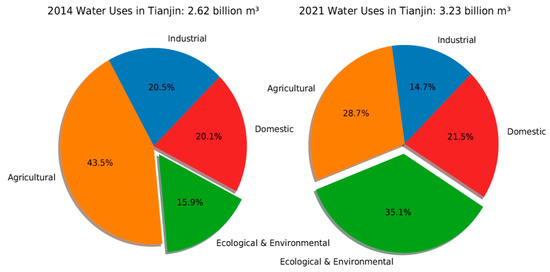
Figure 4.
Water uses in Tianjin during 2014 and 2021. The South-to-North Water Diversion (SNWD) project began to divert Yangtze water to Tianjin at the end of 2014. (Data source: Tianjin Water Resources Bulletin, 2014 and 2021 [10]).
The arriving of Yangtze water has significantly replaced the use of deep groundwater, and also increased the recharge from surface water to shallow aquifers. This study aims to assess the impact of the SNWD to land subsidence in Tianjin, specifically, quantify the change of subsidence over time and space before and after Yangtze water was available, and project future subsidence. Sentinel-1 Interferometric Synthetic Aperture Radar (InSAR) data from 2014 to 2021 are used to delineate the recent subsidence. Continuous Global Positioning System (GPS) data are used to validate the InSAR-derived subsidence time series. Hydraulic-head data and the Principal Component Analysis (PCA) are applied to highlight the primary factors controlling the recent vertical land surface deformation.
2. Data and Methods
2.1. GPS Data
GPS data (2010–2021) from six permanent stations are available for this study: JIXN, TJBD, TJWQ, TJBH, HECX, and QING (Figure 1). JIXN, TJBD, TJBH, and HECX are operated by the Crustal Movement Observation Network of China (CMONOC, 2010–2021), primarily for monitoring long-term tectonic movements and for providing stable references for nationwide land survey. Land subsidence at these sites were extensively investigated in [11]. QING is a station operated by a local institute for subsidence monitoring [12]. HECX is located in Cangzhou, Hebei Province, adjacent to Tianjin.
In general, there are two approaches for obtaining millimeter-accuracy static positions from GPS raw data: relative positioning and absolute positioning [13,14,15]. The Precise Point Positioning (PPP) is a typical method for absolute positioning [16], which does not require any ground reference GPS stations for achieving high-accuracy positioning. The newly developed PPP techniques with carrier-phase ambiguity-fixed resolution have further improved the performance of conventional PPP [17,18,19]. The PPP method is used to obtain 24-h average positions in this study, abbreviated as daily solutions. The accuracy of GPS positions is often assessed by the root-mean-squares (RMS) of the detrended displacement time series in three directions: East-West (EW), North-South (NS), and Up-Down (UD), often called ENU displacements with respect to a specific reference frame or a few individual reference points [20]. The accuracy of the daily displacements is at 3 to 4 mm in the horizontal direction and 6 to 8 mm in the vertical direction in north China [21]. The detailed methods for GPS data processing are referred to in [22].
Figure 5 depicts the daily vertical displacement time series (2011–2021) derived from GPS observations at these six sites. The displacements are aligned to the stable North China Reference Frame 2020 (abbreviated as NChina20), which is realized by long-term GPS observations at 30 permanent sites fixed on the North China tectonic plate [23]. The frame stability of NChina20 is better than 1 mm/year in all three directions. The site velocity and its uncertainty (95% confidence interval) are estimated according to the method introduced in [24,25]. The decadal displacement time series indicate that site JIXN is stable with respect to NChina20, while TJBD experiences minor subsidence of 1.5 ± 0.3 mm/year. JIXN and TJBD are located in north mountain areas, Jixian and Baodi counties, respectively. In general, the unconsolidated sediments in northern Tianjin are thinner than those in the south, and the groundwater withdrawal is insignificant in northern Tianjin compared to southern Tianjin. As a result, these two counties have not been considerably affected by subsidence.
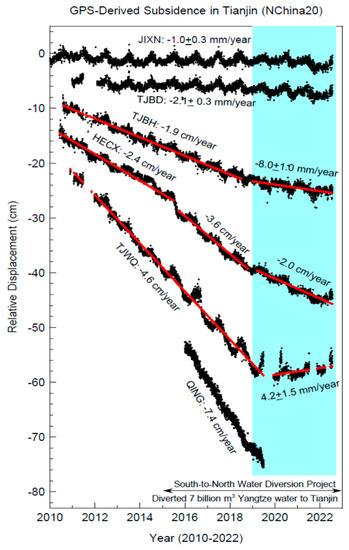
Figure 5.
GPS-derived daily subsidence time series at five sites (JIXN, TJBD, TJBH, TJWQ, QING) in Tianjin and one site (HECX) in Cangzhou, Hebei Province. The locations of these GPS sites are marked in Figure 1.
TJWQ is located in Wuqing District, bordering Beijing Municipality to the northwest and Hebei province to the north and west, where rapid subsidence has been ongoing since the 1990s. This site experienced rapid subsidence with a steady rate of 4.7 cm/year from 2010 to 2018. Amazingly, the rapid subsidence at this site ceased promptly at the end of 2018, and remarkable land rebound (~4 mm/year) has been observed since 2019. QING is located in the southern end of Wuqing District, and recorded extremely rapid land subsidence, 7.4 cm/year from 2015 to 2019. TJBH is in Binhai New District, a coastal district located on the western coast of the Bohai Gulf. TJBH recorded steady subsidence of approximately 2 cm/year from 2010 to 2018, and the subsidence rate has reduced to below 1 cm/year since 2019. HECX is located within Cangzhou, Hebei Province, 20 km south of the Tianjin border. Subsidence rate at HECX was 2.4 cm/year from 2010 to 2015, increased to 3.6 cm/year from 2016 to 2018, and reduced to 2.0 cm/year from 2019 to 2021. The reasons for subsidence changes over time at these sites will be addressed in the Discussion section.
2.2. InSAR Data and Processing
InSAR techniques have been frequently applied in land subsidence investigations in Tianjin [26,27,28,29,30]. These studies have demonstrated the success of the InSAR techniques in delineating urban subsidence over time and space. In this study, we use the available SAR images covering the Tianjin area from the Sentinel-1 satellites, including Sentinel 1-A and Sentinel 1-B. The Copernicus Sentinel-1 is operated by the European Space Agency (ESA). Sentinel-1A satellite was launched on 3 April 2014, while Sentinel-1B was launched on 22 April 2016. Both Sentinel-1A/B have a revisiting period of 12 days. ESA provides open-access Sentinel-1 data for the research community. There are three different levels of data acquired by Sentinel-1. Level-0 products are compressed and unfocused SAR raw data. Level-1 includes focused data that most data users process. These products have two types: Single Look Complex (SLC) and Ground Range Detected (GRD). GRD products mainly reflect amplitude information and lose phase information. The SLC products are used for deformation information extraction and time series analysis in this study.
We use the GMTSAR software package to generate interferograms and construct interferometric products, including phase, coherence, phase gradient, and line-of-sight (LOS) displacements in both radar and geographic coordinates. GMTSAR is an open-source InSAR processing system based on Generic Mapping Tools (GMT) [31,32]. Our raw datasets consist of SLC products of Interferometric Wide Swath (IW) beam mode from both ascending and descending paths of the Sentinel-1A/B missions. We processed 188 ascending scenes from Path 69 and 134 descending scenes from Path 149 collected between 2014 and 2021. A multi-look window of 8-by-2 in the range and azimuth directions, respectively, is applied to reduce phase noises. The consequent pixel spacing is 40-by-40 m2. The details of the parameters of the Sentinel-1 data used are listed in Table S1.
In the processing, the topographic phase was removed from these interferograms using the 1-arcsecond digital elevation model (DEM) from the Shuttle Radar Topography Mission (SRTM) [33,34]. To generate interferograms, baseline limit is set as a maximum time limit of 61 days for ascending track and 121 days for descending track, and a perpendicular baseline of 300 m for both tracks. Some additional and necessary pairs are also added to increase the density of baselines. Totally, we constructed 1112 interferograms from the ascending path and 1181 interferograms from the descending path (Figure S1). The phase unwrapping algorithm Snaphu [35] is used to recover the unambiguous phase data, where the pixel correlation threshold is set as 0.1. The ground deformation from 2014 to 2021 is then derived through coherence-based small baseline subset (SBAS) method along the LOS direction [36]. The SBAS technique retrieves displacement rates and time series of coherent targets by implementing an appropriate combination of numerous interferograms with the relevant small baselines.
The ground deformation products from the GMTSAR processing, primarily the displacement time series at each pixel, are aligned to the LOS direction. For precise long-term land subsidence study, land displacements in the vertical direction with respect to a stable regional (or local scale) reference frame are needed. Figure 6 illustrates the GPS-derived three-component (ENU) displacement time series (2020–2022) at TJBD with respect to the global reference frame, International Global Navigation Satellite Systems (GNSS) Service Reference Frame 2014 (IGS14) [37], and the regional reference frame (NChina20) [23]. Both horizontal components with respect to the regional reference frame indicate that the linear trends are below 1 mm/year. The vertical displacement time series with respect to the regional reference frame shows a linear trend of −1.5 mm/year, which is within the uncertainty level of the InSAR-derived site velocities. Thus, TJBD can be regarded as a stable site with respect to the regional reference frame. We use TJBD as a reference site to align InSAR-derived displacements to the regional reference frame. The following steps are employed to obtain the vertical displacements with respect to the regional reference frame:
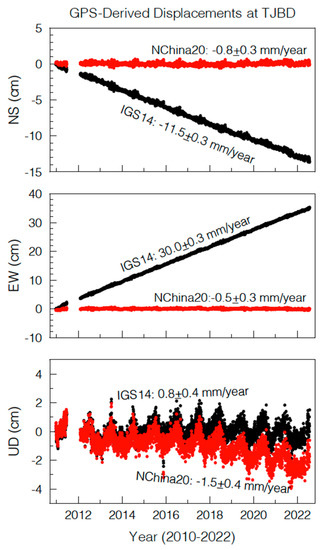
Figure 6.
GPS-derived three-component displacement time series at TJBD, with respect to the global reference frame IGS14 and the regional reference frame, stable North China reference frame (NChina20).
- (1)
- The LOS displacements are essentially referred to as a global reference frame defining the orbits of the Sentinel-1 satellites (e.g., WGS84 or IGS14). WGS84 is the reference coordinate system used by the Global Positioning System. There is no considerable difference between WGS84 and IGS14 for practical use focusing on the positional changes over time. We projected the ENU positions (IGS14) of TJBD to the LOS direction defined by the corresponding azimuth and range. This process is primarily conducted by the GMTSAR command sat_llt2rat.
- (2)
- Since the site TJBD is stable with respect to the regional reference frame, the LOS-displacement with respect to the regional reference frame should remain constant over time. That is to say, the LOS-displacement at TJBD (with respect to the global reference frame) can be regarded as a regional common movement that occurred across the entire study area. The LOS-displacements at other sites (pixels) can be transferred to the regional reference frame by subtracting the amount of LOS-displacement (with respect to the global reference frame) at TJBD. This process is applied to all interferograms. Thus, the LOS-displacement time series at all pixels have been aligned to the regional reference frame.
- (3)
- The LOS-displacement at each pixel with respect to the regional reference is then projected to the EW, NS, and UD directions. The GMTSAR command sat_look is applied to get the ENU look vector at each pixel in both the ascending and descending paths (Figure S2). Previous investigations have found that a combination of the descending and ascending time series leads to more reliable land subsidence estimates of vertical ground deformation [38,39,40]. Accordingly, the ENU datasets from both ascending and descending tracks are used to estimate the vertical displacements. The following equation is used [40]:where , , and are the LOS displacements, look vectors in the EW and vertical directions along ascending path, respectively; while , and are the LOS displacements, look vectors in the EW and vertical directions along descending path, respectively.
Figure 7 depicts the cumulative vertical displacements derived from the Sentinel-1A/B data (22 October 2014–20 December 2021) across the central and southern Tianjin area. The study area is limited in the overlap area of ascending and descending paths. The pixel size is 40-by-40 m2. The total area is about 15,500 km2, among which 10,100 km2 is within Tianjin, approximately about 85% of the total land area (~11,900 km2) of Tianjin. The subsidence outside the study area, primarily in Jixian and Baodi counties, is insignificant as illustrated by long-term GPS observations at JIXN and TJBD (Figure 5). Approximately, two thirds of the study area (10,426 km2) accumulated over 0.1 m subsidence during the past seven years (2014–2021).
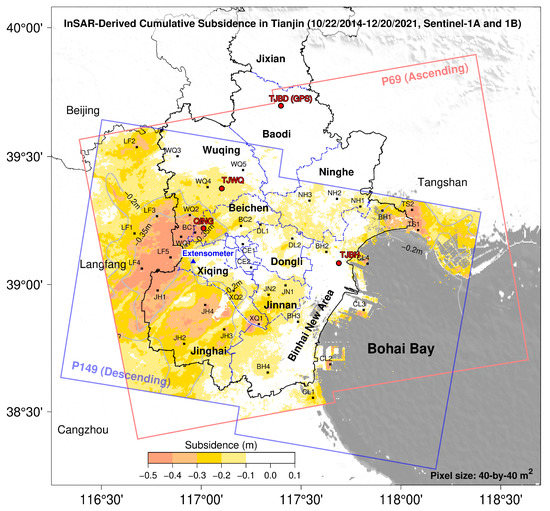
Figure 7.
The cumulative subsidence derived from Sentinel-1A/B SAR data spanning approximately seven years (22 October 2014–20 December 2021). The land area covered by both paths (P69 and P149) is approximately 15,500 km2, among which 10,100 km2 is within Tianjin, about 85% of the total land area (~11,900 km2) of Tianjin.
2.3. Validation of the InSAR-Derived Subsidence Time Series
Figure 8 depicts the comparisons of InSAR-derived and GPS-derived subsidence time series at three sites TJBH, TJWQ, and QING. The GPS time series are smoothed with a 6-day moving box. The decadal GPS-derived subsidence time series provide in situ measurements for assessing the InSAR-derived subsidence time series. The InSAR-derived subsidence shows remarkably coarse samples and large scatters before middle 2016. This can be partially explained by the fact that only Sentinel-1A data were available and the acquisition was not stable before the middle of 2016 in the study area. The average sampling rate of the InSAR-derived subsidence time series since the middle of 2016 is approximately 6 days per sample. The weekly InSAR-derived time series were not able to reveal certain short-period information superimposed into the daily GPS time series. Overall, the InSAR-derived subsidence time series retain larger scatter than the GPS-derived subsidence time series. Additionally, we conducted resampling when calculating the time series with GMTSAR because of the computing overload of more than 1000 interferograms covering a large area. So, the original seasonal signals are sort of eased. However, both datasets result in almost the identical trend over time, which validates the reliability of the InSAR-derived subsidence rates. According to the authors in [24], the 95% confidence interval (95% CI, often called as accuracy) of GPS-derived vertical site velocity is better than 1 mm/year for daily displacements spanning longer than five years. The high agreement of the InSAR and GPS time series suggests that the accuracy of InSAR-derived subsidence rate would be at a level of a few millimeters per year for three-year and longer datasets.
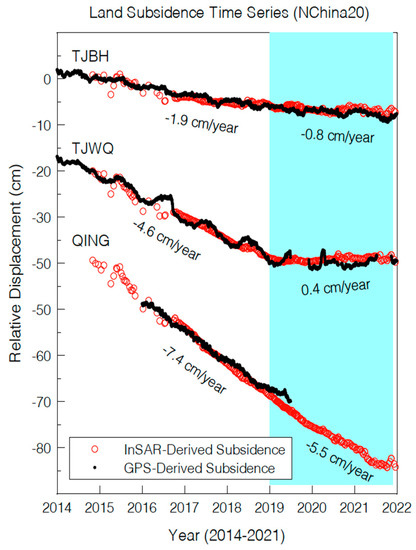
Figure 8.
Comparisons of InSAR-derived and GPS-derived subsidence time series at three GPS sites, i.e., TJBH, TJWQ, and QING. The locations of these sites are marked in Figure 1. The GPS-derived time series are smoothed with a 6-day moving box.
3. Results
3.1. InSAR-Derived Subsidence Time Series
Figure 9 illustrates the InSAR-derived subsidence time series at 37 selected sites from 2014 to 2021 in Tianjin and its adjacent areas in Hebei Province. The locations of these sites are marked in Figure 7. The majority sites show a common trend that subsidence has slowed down since approximately 2019, such as the sites in northern Dongli, central and western Ninghe (NH2, NH3), northern Jinnan, northern Binghai, southern Wuqing (WQ1, WQ2), and western Beichen (BC1) Districts. Several sites even show the occurrence of slight land rebound since around 2019, such as eastern Ninghe (NH1). The remarkable change of subsidence rates occurred approximately four years after the arriving of Yangtze water.
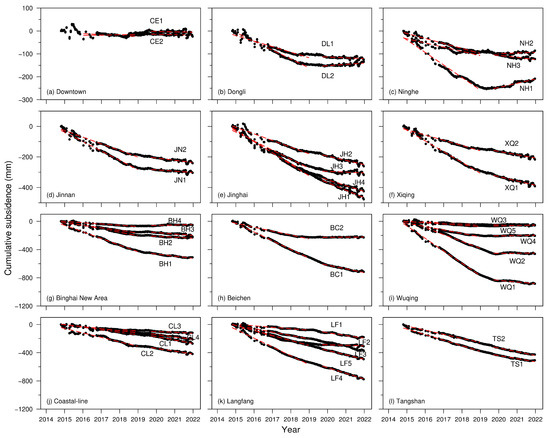
Figure 9.
InSAR-derived subsidence time series in Tianjin and its adjacent areas. The locations of these points are marked in Figure 7. The red dashed lines indicate the linear trends before and after 2019.
The onset of land rebound is often regarded as an indicator that hydraulic heads in local primary aquifers have reached the new pre-consolidation head [41]. In general, it often takes several years to observe visible land rebound after the hydraulic heads in the primary aquifers turning to recovery [42]. The time lag is further complicated by the heterogeneity of the hydrogeologic and geotechnical properties of the clays and sands within the aquifer system. The concept of pre-consolidation head will be discussed in the next section.
3.2. Subsidence Rates: 2016–2018 vs. 2019–2021
Both GPS-derived and InSAR-derived subsidence time series indicate that the subsidence rates from 2014 to 2018 were stable and the overall subsidence rates have remarkably slowed down since 2019. The statistic of water supplies also indicate that the significant reduction of deep groundwater withdrawals occurred in 2018 and following years, not immediately after the availability of Yangtze water in 2015 (Figure 3). Accordingly, we use the linear trend of the 3-year subsidence time series from 2016 to 2018 and from 2019 to 2021 to assess the impact of SNWD on the subsidence in Tianjin. The subsidence rate from 2016 to 2018 is similar to the rate before the arriving of the Yangtze water since there is not a remarkable subsidence rate change from 2014 to 2018.
Figure 10a depicts the subsidence rate from 2016 to 2018 across central and south Tianjin. Figure 10b depicts the subsidence rate from 2019 to 2021, which represents the ongoing subsidence. The subsidence rate in each pixel is obtained through a linear regression on the InSAR-derived subsidence time series over three years. A quick glance suggests that the areas of non-subsidence (<5 mm/year) have remarkably expanded since 2019. Before 2019, the entire study area was experiencing significant subsidence (>5 mm/year), except for a small area in central downtown (Figure 10a). Subsidence has been halted (<5 mm/year) since 2019 in approximately two thirds of the previous subsiding area in Tianjin (Figure 10b).
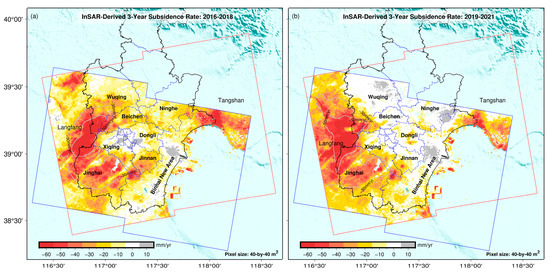
Figure 10.
Comparisons of subsidence rates before and after the SNWD. (a) InSAR-derived 3-year subsidence rates from 2016 to 2018; (b) InSAR-derived 3-year subsidence rates from 2019 to 2021. The subsidence rates from 2016 to 2018 are similar with the subsidence rates before the arriving of Yangtze water at the end of 2014.
The total area where the subsidence rate was faster than 10 mm/year was about 5200 km2 in Tianjin during 2016 to 2018, which has been reduced to about 4100 km2 during 2019 to 2021. The areas of rapid subsidence (>30 mm/year) and extremely rapid subsidence (>50 mm/year) were 1800 km2 and 440 km2 during the period from 2016 to 2018, respectively, which have been reduced to approximately 1300 km2 and 280 km2 during the period from 2019 to 2021.
Figure 11 depicts the changes of subsidence rates before and after the Yangtze water was available. The difference in each pixel is calculated by subtracting the deformation rate (2019–2021) depicted in Figure 10b from the rate (2016–2018) depicted in Figure 10a. The positive value indicates reduced-subsidence, and the negative indicates increased-subsidence. It is clear that subsidence rates within the entire study area have reduced or remained constant since 2019. The area that subsidence rate had reduced over 10 mm/year is approximately 2900 km2, about 30% of the entire study area in Tianjin, primarily in southern Wuqing, Beichen, eastern Ninhe, and Jinnan Districts. In contrast, the subsidence rates in the neighboring city Langfang (Hebei Province) continuously increase during the past six years, though Langfang also received a significant amount of Yangtze water since 2015.
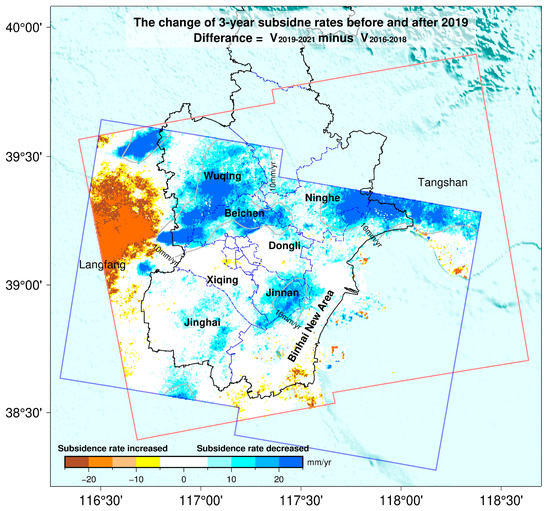
Figure 11.
The change of InSAR-derived 3-year subsidence rates before and after the beginning of 2019. The area that subsidence rate has reduced over 10 mm/year is about 2900 km2, about 30% of the overlapped study area in Tianjin (~10,100 km2).
4. Discussions
4.1. Compaction vs. Subsidence
In general, InSAR-derived subsidence represents the total vertical land deformation (subsidence or uplift), comprising compaction and expansion within the entire aquifer system including sands and clays. Land subsidence, i.e., compaction of clays, is associated with the change of pore-water pressure in the primary aquifers, which can be explained by Terzaghi’s effective stress principle [43]. An increase in the effective stress or a decrease of the pore-water pressure could cause subsidence, and the subsidence would be significant when the pore-water pressure lowers to below the pre-consolidation head in the primary aquifers. Figure 12 illustrates the changes of hydraulic heads in Tianjin within Aquifers II and III over time. The contours are digitized from the Tianjin Water Resources Bulletins. The spatial patterns of subsidence (>10 mm/year) depicted in Figure 10 can be well explained by the spatial patterns of hydraulic head in Aquifer III.
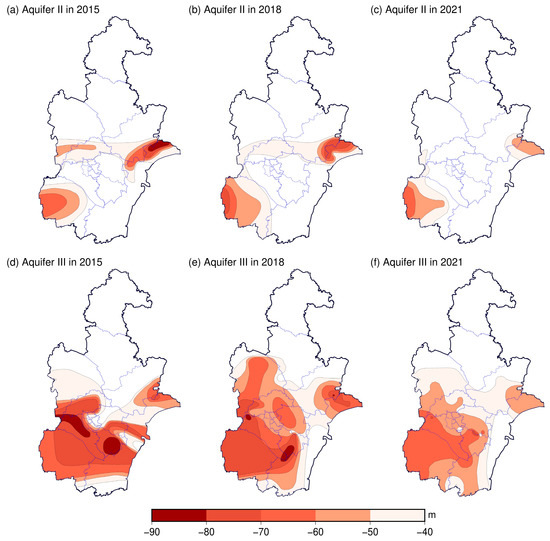
Figure 12.
The contour maps of hydraulic heads (−40 m, −50 m, −60 m, −70 m, −80 m) in Aquifers II and III in 2015, 2018, and 2021 in Tianjin. (Data source: Tianjin Water Resources Bulletins [10]).
A local institute has been operating integrated extensometers and piezometers for over one decade at a site in Xinkou town, Xiqing District, which provides critical data for addressing the relationship between aquifer deformation (compaction, expansion) and hydraulic head changes. The location of the field site is marked in Figure 1, approximately 5 km north to Jinghai District, where almost the entire district is still subsiding (>5 mm/year, Figure 10b). The Xinkou observational site comprises six borehole extensometers and four groundwater wells terminated at different depths (Figure 13a). The cumulative subsidence from 1985 to 2018 is about 1.6 m in this area [44].
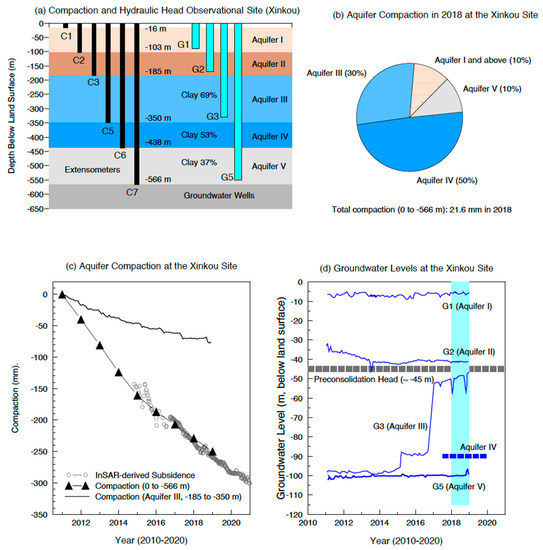
Figure 13.
The observations at the Xinkou Extensometer-Piezometer site. The location is marked in Figure 1. (a) Profile sketch of extensometers and groundwater-level measuring wells; (b) the aquifer compactions in 2018; (c) the compaction (0 to −566 m, −185 to −350 m) and subsidence (total compaction) time series; (d) the time series of hydraulic heads in Aquifers I, II, III, IV, and V. (Data from [44]).
The compaction within each aquifer can be estimated by differencing the compaction measurements obtained by two neighboring extensometers. Figure 13b depicts the compaction within each aquifer in 2018. The total compaction (0 to −566 m) was 21.6 mm. The compaction within Aquifer III was 6.2 mm, approximately 30% of the total compaction; the compaction within Aquifer IV was 10.7 mm, approximately 50% of the total compaction; the compaction within Aquifer V was 2.4 mm, approximately 10% of the total compaction. The remaining 10% could be contributed by Aquifer I and superficial soils (0 to −16 m). Aquifer II indicates a slight trend of rebound (<1 mm). The ongoing subsidence in this area are primarily contributed by Aquifers III and IV, approximately 80% of the total compaction. The ongoing subsidence rate at this site is about 20 mm/year from 2019 to 2021.
Figure 13c illustrates the aquifer compaction time series within Aquifer III (−185 to −350 m), compaction within the entire aquifers (I, II, III, IV, and V) (0 to −566 m), and the InSAR-derived land subsidence time series (2014–2021). It appears that the InSAR-derived subsidence time series agree well with the compaction from 0 to −566 m over time. Since the InSAR time series represents the total compaction below the land surface, the agreement between the InSAR time series and the compaction time series suggests that the compaction below the bottom of the aquifer system (about −566 m) would be minor even if it does occur.
Figure 13d depicts the hydraulic heads in the aquifer system. The hydraulic head in Aquifer I (G1) was stable during the past decade, fluctuating from approximately −5 m to −7 m. The hydraulic head in Aquifer II is about −40 m, showing a slight trend of decline from 2010 to 2014 (before SNWD) and a slight elevation from 2015 to 2016, and remained stable (−38 m) since 2017. The statistics of water supplies in Tianjin (Figure 3) indicate that there is a large amount of groundwater withdrawals within the shallow aquifers (I and II), mostly for agricultural irrigation uses. Aquifer II was the primary groundwater source during the 1980s, the most rapid subsidence period in the history of Tianjin [3,45]. As of 2021, agricultural use is about 29% of total groundwater use, which was approximately 44% in 2014 (Figure 4). The stableness of the groundwater levels in Aquifers I and II suggests that the recharge from surface water and pumping can be balanced. The recharge is primarily from precipitation and surface water in rivers, lakes, reservoirs, and wetlands. As of 2021, the water use for ecological and environmental restoration has been increased to 35% of total water use owing to the SNWD, which was approximately 16% of the total water use in 2014 (Figure 4). According to Tianjin Water Resources Bulletins, a very considerable portion of the Yangtze water has been discharged into local rivers, lakes, and wetlands for ecological and environmental restoration and groundwater replenishment purposes. This contributed a lot to the recovering of the shallow groundwater system.
The groundwater level measures in well G3 represents the hydraulic head changes in Aquifer III, which experienced rapid elevation in 2015 and 2017. The rapid elevations of hydraulic head were associated with the reduction of pumping in deep aquifers (III and IV) owing to the SNWD. There are no groundwater-level measures in Aquifer IV at this site. In fact, there are very few hydraulic head measures in Aquifers IV and V across the Tianjin area. The hydraulic head in Aquifer IV follows a similar temporal-spatial pattern as the hydraulic head in Aquifer III since the two aquifers are hydraulicly connected. As of 2018, the hydraulic head within Aquifers III was approaching to −50 m in Xinkou area; the hydraulic head in Aquifer IV was about −90 m. The InSAR-derived subsidence time series indicates that the ongoing subsidence rate is about 20 mm/year (2019–2021). The extensometer observations suggest that approximately 30% of the ongoing subsidence is contributed by Aquifer III. So, the compaction within Aquifer III is approximately 5 mm/year, suggesting the ending of inelastic compaction. It is most likely that the hydraulic head in Aquifer III is approaching the new pre-consolidation head in this area. The concept of the new pre-consolidation head will be further discussed in the following sections.
4.2. Identifying the Primary Factors Controlling Subsidence: Principal Component Analysis
Machine-learning algorithms has been frequently combined with InSAR-derived ground deformation to study natural hazards over time and space [46,47]. Principal Component Analysis (PCA) is one of the effective machine-learning algorithms, mathematically transforming a series of correlated variables into a new set of uncorrelated variables, i.e., Principal Components (PCs) [48,49,50]. There are different modes of PCA based on different data matrix features [51]. T-mode PCA is an efficient method for analyzing space-time distributed data, which has been commonly applied to InSAR-derived deformation data [52,53,54,55]. Each PC has its own spatial pattern and temporal evolution. In this study, we employed the T-mode PCA to explore the spatial patterns and temporal trend of land surface deformation embedded within the InSAR-derived subsidence time series. The function pca in MATLAB is used for conducting PCA analysis in this study. The details about PCA coding derivation are introduced in the Supporting Information S1.
Figure 14 illustrates the main products and analysis from the PCA based on InSAR-derived land surface deformation (vertical) time series from 2014 to 2021. The first four Principal Components (PCs) explain around 99.8% of the total land surface deformation in the vertical direction. PC1 explains over 97% of the deformation, followed by PC2, PC3, and PC4 with a percentage of 1.7%, 0.2%, and 0.1%, respectively (Figure 14a). Other subsequent components are negligible. Therefore, only the first four components are further investigated in this study. The PCA results suggest that the overall land surface deformation is almost contributed by a sole source. This is consistent with the fact that the recent ground elevation changes in Tianjin are dominated by rapid subsidence (several cm/year level) caused by groundwater withdrawals. Figure 14b illustrates the eigenvector time series of the first four PCs. Figure 14c depicts the temporal correlation between the PC4 eigenvector and the monthly precipitation.

Figure 14.
Results from the T-mode PCA on the InSAR-derived vertical displacement time series. (a) A scree plot illustrating the percentage of displacement explained by the first four PCs; (b) Temporal variations of the PC1, PC2, PC3, and PC4 eigenvectors; the gray bars show the monthly precipitation in Tianjin. The blue dashed lines indicate the derived linear trend of PC1 before and after 2019; (c) The cross-correlation between the precipitation and the eigenvector of PC4.
The PC1 score map (Figure 15a) exhibits a similar spatial pattern with the recent rapid subsidence (Figure 10b), which is similar to the groundwater depression cones in Aquifer III (Figure 12). We overlapped the −60 m contour of the hydraulic head in Aquifer III as of 2021 with PC1 score map. More than 90% of the area where the hydraulic head is lower than −60 m coincides with the PC1 bluish area. The eigenvector time series of PC1 (Figure 14b) suggests that the linear rate has been reduced since 2019, which is consistent with the reduction of overall subsidence rates since 2019, as depicted by GPS and InSAR observations (Figure 5 and Figure 10). The PC scores can be converted to deformation by multiplying the eigenvector at a given date. So, the product between the positive eigenvector values and negative scores (bluish areas) would be negative, reflecting the subsiding areas. The coincident of the spatial patterns in the PC1 score map and the groundwater depression cones in Aquifer III, as well as the compaction observations at the Xinkou Extensometer-Piezometer site (Figure 13), suggest that recent land surface deformation (2016–2021) is dominated by the compaction which occurred in deep aquifers, primarily Aquifers III and IV.
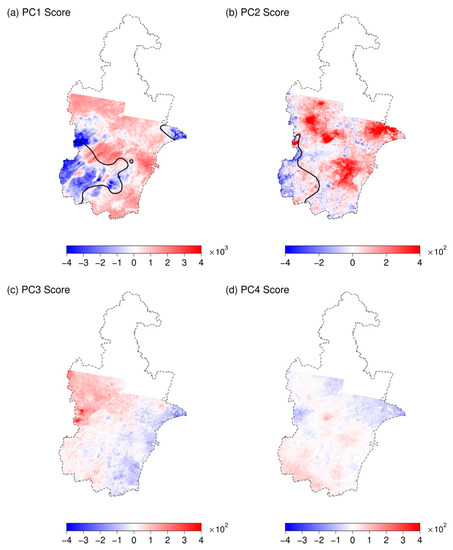
Figure 15.
The score maps of the first four PCs. (a–d) are score maps for PC1, PC2, PC3, and PC4, respectively. The black contours in (a) PC1-score map represent the −60 m contour of the hydraulic head in Aquifer III as of 2021 (Figure 12f); (b) represent the −40 m contour of the hydraulic head in Aquifer II as of 2021 (Figure 12c).
The PC2 score map (Figure 15b) shows all positive values except in the southwestern edge of Jinghai District. In general, the PC2 scores are one to two orders of magnitude smaller than the PC1 scores. The PC2 eigenvectors were negative before 2019 and turned to positive since the middle of 2019. The red patterns in the scope map of PC2 are roughly comparable with the areas with remarkable land rebound, where hydraulic head in Aquifer II are above −40 m (Figure 13). The compaction observations at Xinkou site also indicates that Aquifer II is experiencing elastic expansion. Since the product of the score and eigenvector reflect the ground deformation, PC2 corresponds to land rebound, which would be primarily contributed by the elastic expansion occurred within Aquifer II when the hydraulic head had reached or exceeded the regional pre-consolidation head (Figure 13).
The PC3 score map (Figure 15c) shows overall smooth patterns that the scores change gradually from positive to negative from the northwestern to the coastal area, which is consistent with the spatial variation of the thickness of the primary aquifers (Aquifers III and IV) from inland to coastal areas (Figure 2c). In general, the PC3 scores are about one order of magnitude smaller than the PC2 scores. The eigenvectors of PC3 show a steady trend of decreasing before the middle of 2019 and increase since the middle of 2019, suggesting that the thickness of aquifers may slightly impact the land surface deformation (subsidence or uplift) in a long run, as expected.
The PC4 score map (Figure 15d) shows minor PC scores cross over the entire area. The eigenvector time series of PC4 shows a temporal correlation with the monthly precipitation over time, which suggests that PC4 corresponds to the contribution of seasonal factors, e.g., precipitation and temperature. The temporal correlation between the PC4 eigenvector (after 2017) and the monthly precipitation (Figure 14c) indicates that there is an approximately one-month delay for the sediment deformation to respond to the precipitations as a result of the slow infiltration process. The periodical fluctuations of land surface could also be partially resulted by the periodical changes of the hydraulic heads in the primary aquifers affected by seasonal difference of groundwater recharge and pumping [40,56]. The possibility will be further investigated in our future studies.
In summary, the PCA analysis suggests that the principal contributions to the vertical land surface elevation changes can be explained by a combination of PC1 and PC2, which account for over 99% of the total vertical deformation. PC1 corresponds to the total compaction primarily contributed by inelastic compaction of clay layers within deep aquifers (Aquifers III and IV); PC2 corresponds to land rebound, primarily contributed by the elastic expansion of sand layers within Aquifer II. The variance of thickness of total aquifers (PC3) and seasonal factors (PC4), such as fluctuations of temperature and precipitation, may slightly contribute to land surface elevation changes.
4.3. Projecting Future Subsidence
In general, a confined aquifer system comprises aquifers (primarily sands) and aquitards (primarily clays). The volume change in sands is dominated by elastic (recoverable) deformation and the volume change in clays is dominated by inelastic (unrecoverable) deformation. The clays in an aquifer system are able to memorize the maximum effective overburden stress that the clays had sustained in its history, which is called pre-consolidation stress [57]. The hydraulic head in the aquifer system corresponding to the pre-consolidation stress is called the pre-consolidation head. In Tianjin, rapid subsidence dominated by inelastic compaction of the clays began in the 1960s. The hydraulic head in the deep aquifers was about 15 m to 20 m below land surface at the end of the 1950s [9], which would approach to the historical pre-consolidation head in Tianjin. The historical pre-consolidation head was formed during a long period (century or longer) and pore-water pressures within clays and sands were fully equalized. So, the historical pre-consolidation head is often regarded as regional-specific.
Following the long-term excessive pumping since the 1950s, the ‘effective stress’ exserted on the skeleton of grains within the aquifer system had increased progressively before the recovery of hydraulic heads in the deep aquifers since 2019. A maximum effective stress has been preserved in the clays when the pore-water pressure in the sands and clays equivalized again. The hydraulic head corresponding to the newly established equilibrium of pore-water pressure in the aquifer system is called new pre-consolidation head [41]. The sand lays will experience certain elastic expansion when the hydraulic head exceeded the pre-consolidation head. The onset of land rebound is often regarded as the indicator that the hydraulic heads have reached the new pre-consolidation head. The new pre-consolidation head is often local-specific (towns, districts) because different areas experienced different subsidence within a time scale from several years to multi-decades. It deserves to note that the groundwater levels measured in wells often reflect the hydraulic head in the sand layers because most wells were screened in sand layers to get sufficient water. In general, the hydraulic head in the sands are lower than the hydraulic heads in the clays before the inelastic compaction is ceased. This explains why subsidence (compaction) continues for several years after the measured hydraulic heads turned to rise. The inelastic compaction in clays will ultimately cease when the hydraulic head has reached to the new pre-consolidation head, and significant compaction will not be reinitiated as long as the hydraulic head remains above the new pre-consolidation head. Accordingly, the new pre-consolidation head is a critical threshold for projecting the future subsidence.
Recent land subsidence map (Figure 10) and hydraulic heads in primary aquifers (II, III) (Figure 13) indicate that significant subsidence (>10 mm/year) is primarily limited within the areas where the hydraulic heads (Aquifers II and III) are below −50 m. Subsidence within the area where the hydraulic heads are above −40 m has been halted (<5 mm/year) or even showed a slight rebound. According to the InSAR-derived subsidence maps (Figure 10b), the total area with an ongoing subsidence rate larger than 5 mm/year (2019–2021) is about 6000 km2, which is slightly smaller than the total area of the groundwater depression cone (below 40 m) in Aquifers III, approximately 6700 km2 as reported in the 2021 Tianjin Water Resources Bulletin. It appears that the hydraulic heads in the primary aquifers need to be elevated to above −50 m before the subsidence can be halted. Accordingly, the new pre-consolidation head in the primary aquifers (III and IV) would be at approximately from −50 m to −40 m. In general, the new pre-consolidation head is often regarded as local-specific (towns, districts). Unfortunately, we do not have dense and long-term groundwater level measures for this study. So, a single number (−45 m) is used to estimate the new pre-consolidation head in the primary aquifers (Aquifer III and IV) in Tianjin. The subsidence will continue until the hydraulic heads in the primary aquifers recover to the new pre-consolidation head.
As of 2021, the total area of groundwater depression cone (below −40 m) in Aquifer III is about 6700 km2, about 300 km2 smaller than the area in 2020, which in turn is about 200 km2 smaller than the area of 2019; the maximum depth of the depression cone in Aquifer III is approximately at −75 m, about 5 m higher than the maximum depth of 2020, which in turn is about 7 m higher than the maximum depth of 2019 [10]. So, the area of the cone of depression reduces about 200 to 300 km2 per year and the bottom elevates a few meters per year. The amount of deep groundwater withdrawals has been reduced to 0.06 billion m3 in 2021, approximately 22% of the total groundwater withdrawal (0.27 billion m3) and 2% of the total water use (3.23 billion m3) in Tianjin (Figure 3). According to the 14th Five-Year Plan for Tianjin Ecological Environmental Protection (https://sthj.tj.gov.cn (accessed on 1 February 2023)), the withdrawal from the deep aquifers will be further reduced from 2021 to 2025. The Eastern Route of the SNWD project began to transfer water to Tianjin area in the end of 2021 and will transfer more water to Tianjin in the following years. Most likely, the recovery of the overall hydraulic heads in the deep aquifers will be accelerated in the coming years. Assuming the area of depression reduces by ~500 km2 per year, it may take a decade or even longer to recover the overall hydraulic levels to the regional new pre-consolidation head (about −45 m) and finally cease the land subsidence.
Two issues may add significant uncertainties for predicting future subsidence in Tianjin. As mentioned earlier, there is not a continuous confining unit between each of the two neighboring aquifers in the Tianjin area. So, the aquifers are hydraulically connected in the long run. As of 2021, the hydraulic heads in Aquifer II are above the pre-consolidation head and cross over the Tianjin area. The hydraulic heads in Aquifers III and IV have been elevating since around 2018. However, the hydraulic head in Aquifer V remains significantly below the pre-consolidation head. It has been at approximately −100 m for decades in western Tianjin (Figure 13). The observations at the Xinkou site indicates that Aquifers IV and V contribute about 50% and 10% of the ongoing subsidence, respectively. So, the termination of ongoing subsidence in Tianjin will be decided ultimately by the recovery of hydraulic heads in Aquifers IV and V. However, there are very limited groundwater-level measures within Aquifers IV and V. As a consequence, it is hard to track the recovery of deep hydraulic heads; in turn, it is difficult to project the termination of ongoing subsidence.
The InSAR-derived subsidence map suggests that the ongoing rapid subsidence (>30 mm/year) is largely limited to the areas adjacent to Langfang and Tangshan (Figure 11), two large industrial cities in Hebei Province. Langfang is a high-tech manufacturing hub, located approximately midway between Beijing and Tianjin. Tangshan is the largest steel-producing city in China. Both Langfang and Tangshan have been experiencing severe subsidence problems for several decades. Though groundwater pumping in Tianjin has been significantly reduced by the enforcement of strict groundwater regulations and the availability of Yangtze water, groundwater is still a major water source for these neighboring industrial cities in Hebei Province. Certainly, groundwater pumping in these neighboring cities will result in groundwater depletion in the border areas of Tianjin. Subsidence in the border areas will not be halted before the hydraulic heads in these neighboring cities recover to the new pre-consolidation head. That is to say, the termination of ongoing subsidence in Tianjin is partially decided by the groundwater regulations and conservations in its neighboring cities.
5. Conclusions
This study employs the SBAS-InSAR technique to delineate the recent land subsidence in Tianjin. The InSAR-derived subsidence time series are validated with the GPS-derived ones. We applied PCA to the InSAR-derived displacement time series to highlight the primary contributions to the vertical ground deformation. This study reveals that human activities, such as excessive pumping of groundwater and long-distance transfer of surface water, can exert significant impacts on the hydraulic heads in the regional aquifer system, thus, could result in land surface deformation in both regional and local scales. The following results are concluded from this study:
- (1)
- The SNWD project had transferred approximately 7 billion m3 Yangtze water to the Tianjin area from 2015 to 2021. The availability of Yangtze water has significantly replaced deep groundwater withdrawals and increased recharge from surface water to the regional aquifer system. As a result, the hydraulic heads in the primary Aquifers (II, III, IV) have turned to recover since 2018, and the subsidence rates across Tianjin have slowed down remarkably since 2019. As of 2021, the significant subsiding area (>10 mm/year) in Tianjin has reduced to approximately 4100 km2, approximately 80% of the area (~5200 km2) before the arriving of the Yangtze water. Furthermore, approximately 700 km2 area has shown a slight land rebound (>3 mm/year) since 2019.
- (2)
- The Principal Component Analysis and the collocated extensometer-piezometer observations suggest that recent subsidence (2014–2021) is dominated by the aquifer compaction within deep aquifers (primarily Aquifers III and IV), ranging from approximately 200 to 450 m below the land surface; the minor land rebound which occurred since around 2019 is primarily contributed by Aquifer II.
- (3)
- The new pre-consolidation heads of the deep Aquifers (II, III, IV) are about 45 m below land surface. The recovery of hydraulic heads in the deep aquifers will be accelerated because of the reduction of pumping from deep aquifers and the increase of recharge from surface water to groundwater. As of 2021, the hydraulic head in Aquifer II has recovered to the pre-consolidation head level; the hydraulic head in Aquifer III within the majority area is approaching the pre-consolidation head; the hydraulic head in Aquifer IV is still below the pre-consolidation head in those areas where significant subsidence is ongoing. Subsidence will cease when the hydraulic heads in the deep aquifers (III, IV) recover to the new pre-consolidation head and significant subsidence will not be reinitiated as long as the hydraulic heads remain above the new pre-consolidation head. It may take a decade or longer to finally halt the subsidence in Tianjin.
- (4)
- The ongoing rapid subsidence (>30 mm/year) in Tianjin is largely limited to areas adjacent to Langfang and Tangshan, two large industrial cities in Hebei Province. In general, the cities in Hebei Province do not enforce strict groundwater regulations as Tianjin does. Since groundwater movements do not obey administrative boundaries, excessive groundwater withdrawals in these neighboring cities will definitely slow down the recovery of hydraulic heads in border areas in Tianjin. To halt subsidence across entire Tianjin, it is essential for the administrators of Tianjin to work together with neighboring cities to coordinate groundwater and surface water uses.
Supplementary Materials
The following supporting information can be downloaded at: https://www.mdpi.com/article/10.3390/rs15061647/s1, Text S1 explains the details of Principal Component Analysis coding process and steps. Table S1 shows the parameters of the Sentinel-1 dataset applied in the study. Figure S1 shows the interferogram baseline network. Figure S2 shows the look vector map in east-west, north-south, and vertical direction for both tracks.
Author Contributions
Conceptualization, X.Y., X.H. and G.W.; methodology, X.Y., X.H. and Y.L.; data analysis, X.Y., X.H. and G.W.; writing and revision—X.Y., G.W., X.H. and Y.B. All authors have read and agreed to the published version of the manuscript.
Funding
This research received no external funding.
Data Availability Statement
The Copernicus Sentinel-1 data (https://scihub.copernicus.eu/ (accessed on 1 February 2023)) is collected by the European Space Agency. Groundwater resources data, aquifer distribution, and monthly precipitation data are from Annual Tianjin Water Resources Bulletin compiled by Tianjin Water Affairs Bureau. All the data from Tianjin Water Resources Bulletin, together with the GPS-derived ENU displacement time series processed, are archived at the Zenodo site (https://doi.org/10.5281/zenodo.7332586 (accessed on 1 February 2023)). All figures and SAR imagery data processing are based on the open-source software GMT (https://www.generic-mapping-tools.org/ (accessed on 1 February 2023)) and GMTSAR (https://topex.ucsd.edu/gmtsar/ (accessed on 1 February 2023)).
Acknowledgments
The authors acknowledge the Crustal Movement Observation Network of China (CMONOC) for providing the GPS data and the Hewlett Packard Enterprise Data Science Institute at the University of Houston for providing the high-performance computing cluster.
Conflicts of Interest
The authors declare no conflict of interest.
References
- China Statistics Press. Tianjin Statistics Bureau; Tianjin Statistical Yearbook; China Statistics Press: Beijing, China, 2021. [Google Scholar]
- Hu, R.; Yue, Z.; Wang, L.; Wang, S. Review on current status and challenging issues of land subsidence in China. Eng. Geol. 2004, 76, 65–77. [Google Scholar] [CrossRef]
- Yi, L.; Zhang, F.; Xu, H.; Chen, S.; Wang, W.; Yu, Q. Land subsidence in Tianjin. China. Environ. Earth Sci. 2010, 62, 1151–1161. [Google Scholar] [CrossRef]
- Zhu, L.; Gong, H.; Li, X.; Wan, R.; Chen, B.; Dai, Z.; Teatini, P. Land subsidence due to groundwater withdrawal in the northern Beijing plain, China. Eng. Geol. 2015, 193, 243–255. [Google Scholar] [CrossRef]
- Ye, S.; Xue, Y.; Wu, J.; Yan, X.; Yu, J. Progression and mitigation of land subsidence in China. Hydrogeol. J. 2016, 24, 685–693. [Google Scholar] [CrossRef]
- Gong, H.; Pan, Y.; Zheng, L.; Li, X.; Zhu, L.; Zhang, C.; Huang, Z.; Li, Z.; Wang, H.; Zhou, C. Long-term groundwater storage changes and land subsidence development in the North China Plain (1971–2015). Hydrogeol. J. 2018, 26, 1417–1427. [Google Scholar] [CrossRef]
- Zheng, Z.; Yin, H.; Zeng, X. Thermal reservoir models and heat flow characteristics of geothermal field in Tianjin. Bull. Inst. Hydrogeol. Eng. Geo. 1990, 6, 25–42. (In Chinese) [Google Scholar]
- Wu, Y.; Lyu, H.; Shen, J.; Arulrajah, A. Geological and hydrogeological environment in Tianjin with potential geohazards and groundwater control during excavation. Environ. Earth Sci. 2018, 77, 392. [Google Scholar] [CrossRef]
- Zhang, Q. Preliminary Insights from the investigation on land subsidence in Tianjin. Shanghai Geol. 1981, 1, 55–67. (In Chinese) [Google Scholar]
- Tianjin Water Resources Bulletins. Available online: https://swj.tj.gov.cn/zwgk_17147/xzfxxgk/fdzdgknr1/tjxx/ (accessed on 1 February 2023).
- Zhao, R.; Wang, G.; Yu, X.; Sun, X.; Bao, Y.; Xiao, G.; Gan, W.; Shen, S. Rapid land subsidence in Tianjin, China derived from continuous GPS observations (2010–2019). Proc. Int. Assoc. Hydrol. 2020, 382, 241–247. [Google Scholar] [CrossRef]
- Tang, W.; Zhan, W.; Jin, B.; Motagh, M.; Xu, Y. Spatial variability of relative Sea-Level Rise in Tianjin, China: Insight from InSAR, GPS, and Tide-Gauge Observations. IEEE J. Sel. Top. Appl. Earth Obs. Remote Sens. 2021, 14, 2621–2633. [Google Scholar] [CrossRef]
- Herring, T.; Melbourne, T.; Murray, M.; Floyd, M.; Szeliga, W.; King, R.; Phillips, D.; Puskas, C.; Santillan, M.; Wang, L. Plate boundary observatory and related networks: GPS data analysis methods and geodetic products. Rev. Geophys. 2016, 54, 759–808. [Google Scholar] [CrossRef]
- Bao, Y.; Guo, W.; Wang, G.; Gan, W.; Zhang, M.; Shen, J.S. Millimeter-accuracy structural deformation monitoring using stand-alone GPS: Case study in Beijing, China. J. Surv. Eng. 2017, 144, 05017007. [Google Scholar] [CrossRef]
- Wang, G.; Turco, M.J.; Soler, T.; Kearns, T.J.; Welch, J. Comparisons of OPUS and PPP solutions for subsidence monitoring in the greater Houston area. J. Surv. Eng. 2017, 143, 05017005. [Google Scholar] [CrossRef]
- Zumberge, J.; Heflin, M.; Jefferson, D.; Watkins, M.; Webb, F. Precise point positioning for the efficient and robust analysis of GPS data from large networks. J. Geophys. Res. Solid Earth. 1997, 102, 5005–5017. [Google Scholar] [CrossRef]
- Ge, M.; Gendt, G.; Rothacher, M.; Shi, C.; Liu, J. Resolution of GPS carrier-phase ambiguities in precise point positioning (PPP) with daily observations. J. Geod. 2007, 82, 389–399. [Google Scholar] [CrossRef]
- Bertiger, W.; Desai, S.; Haines, B.; Harvey, N.; Moore, A.; Owen, S.; Weiss, J. Single receiver phase ambiguity resolution with GPS data. J. Geod. 2010, 84, 327–337. [Google Scholar] [CrossRef]
- Geng, J.; Chen, X.; Pan, Y.; Mao, S.; Li, C.; Zhou, J.; Zhang, K. PRIDE PPP-AR: An open-source software for GPS PPP ambiguity resolution. GPS Solut. 2019, 23, 91. [Google Scholar] [CrossRef]
- Soler, T.; Wang, G. Interpreting OPUS-Static results accurately. J. Surv. Eng. 2016, 142, 05016003. [Google Scholar] [CrossRef]
- Wang, G.; Bao, Y.; Gan, W.; Geng, J.; Xiao, G.; Shen, J.S. NChina16: A stable geodetic reference frame for geological hazard studies in North China. J. Geodyn. 2018, 115, 10–22. [Google Scholar] [CrossRef]
- Bao, Y.; Yu, X.; Wang, G.; Zhou, H.; Ding, X.; Xiao, G.; Shen, S.; Zhao, R.; Gan, W. SChina20: A stable geodetic reference frame for ground movement and structural deformation monitoring in South China. J. Surv. Eng. 2021, 147, 04021006. [Google Scholar] [CrossRef]
- Bao, Y.; Wang, G.; Yu, X.; Xiao, G.; Ding, X.; Zhao, R.; Gan, W. Establishment and application of the stable North China reference frame: NChina20. Earthq. Res. China 2020, 36, 788–805. (In Chinese) [Google Scholar]
- Wang, G. The 95% confidence interval for the GNSS-derived site velocities. J. Surv. Eng. 2022, 148, 04021030. [Google Scholar] [CrossRef]
- Cornelison, B.; Wang, G. GNSS_Vel_95CI.py: A Python module for calculating the uncertainty of GNSS-derived site velocity. J. Surv. Eng. 2023, 149, 06022001. [Google Scholar] [CrossRef]
- Liu, P.; Li, Q.; Li, Z.; Hoey, T.; Liu, G.; Wang, C.; Hu, Z.; Zhou, Z.; Singleton, A. Anatomy of subsidence in Tianjin from time series InSAR. Remote Sens. 2016, 8, 266. [Google Scholar] [CrossRef]
- Li, D.; Hou, X.; Song, Y.; Zhang, Y.; Wang, C. Ground subsidence analysis in Tianjin (China) based on Sentinel-1A data using MT-InSAR methods. Appl. Sci. 2020, 10, 5514. [Google Scholar] [CrossRef]
- Zhou, C.; Gong, H.; Chen, B.; Gao, M.; Cao, Q.; Cao, J.; Duan, L.; Zuo, J.; Shi, M. Land subsidence response to different land use types and water resource utilization in Beijing-Tianjin-Hebei, China. Remote Sens. 2020, 12, 457. [Google Scholar] [CrossRef]
- Shi, X.; Zhu, T.; Tang, W.; Jiang, M.; Jiang, H.; Yang, C.; Zhan, W.; Ming, Z.; Zhang, S. Inferring decelerated land subsidence and groundwater storage dynamics in Tianjin–Langfang using Sentinel-1 InSAR. Int. J. Digit. Earth 2022, 15, 1526–1546. [Google Scholar] [CrossRef]
- Zhou, L.; Zhao, Y.; Zhu, Z.; Ren, C.; Yang, F.; Huang, L.; Li, X. Spatial and temporal evolution of surface subsidence in Tianjin from 2015 to 2020 based on SBAS-InSAR technology. J. Geod. Geoinf. Sci. 2022, 5, 60–72. [Google Scholar] [CrossRef]
- Sandwell, D.; Mellors, R.; Tong, X.; Wei, M.; Wessel, P. Open radar interferometry software for mapping surface deformation. EOS 2011, 92, 234. [Google Scholar] [CrossRef]
- Wessel, P.; Luis, J.F.; Uieda, L.; Scharroo, R.; Wobbe, F.; Smith, W.H.F.; Tian, D. The Generic Mapping Tools Version 6. Geochem. Geophys. Geosyst. 2019, 20, 5556–5564. [Google Scholar] [CrossRef]
- Farr, T.G.; Rosen, P.A.; Caro, E.; Crippen, R.; Duren, R.; Hensley, S.; Kobrick, M.; Paller, M.; Rodriguez, E.; Roth, L.; et al. The shuttle radar topography mission. Rev. Geophys. 2007, 45. [Google Scholar] [CrossRef]
- Hanssen, R.F. Radar Interferometry: Data Interpretation and Error Analysis; Springer Science & Business Media: New York, NY, USA, 2001. [Google Scholar] [CrossRef]
- Chen, C.W.; Zebker, H.A. Two-dimensional phase unwrapping with use of statistical models for cost functions in nonlinear optimization. J. Opt. Soc. Am. 2001, 18, 338–351. [Google Scholar] [CrossRef] [PubMed]
- Berardino, P.; Fornaro, G.; Lanari, R.; Sansosti, E. A new algorithm for surface deformation monitoring based on small baseline differential SAR interferograms. IEEE Trans. Geosci. Remote Sens. 2002, 40, 2375–2383. [Google Scholar] [CrossRef]
- Rebischung, P.; Altamimi, Z.; Ray, J.; Garay, B. The IGS contribution to ITRF2014. J. Geod. 2016, 90, 611–630. [Google Scholar] [CrossRef]
- Pepe, A.; Calo, F. A review of Interferometric Synthetic Aperture Radar (InSAR) multi-track approaches for the retrieval of Earth’s surface displacements. Appl. Sci. 2017, 7, 1264. [Google Scholar] [CrossRef]
- Fuhrmann, T.; Garthwaite, M.C. Resolving three-dimensional surface motion with InSAR: Constraints from multi-geometry data fusion. Remote Sens. 2019, 11, 241. [Google Scholar] [CrossRef]
- Cigna, F.; Ramirez, R.E.; Tapete, D. Accuracy of Sentinel-1 PSI And SBAS-InSAR displacement velocities against GNSS And geodetic leveling monitoring data. Remote Sens. 2021, 13, 4800. [Google Scholar] [CrossRef]
- Wang, G. New Preconsolidation heads following the long-term hydraulic-head decline and recovery in Houston, Texas. Groundwater 2022. [Google Scholar] [CrossRef]
- Wang, G. Seasonal subsidence and heave recorded by borehole extensometers in Houston. J. Surv. Eng. 2023, 149, 04022018. [Google Scholar] [CrossRef]
- Terzaghi, K. Principles of soil mechanics: I-Phenomena of cohesion of clays. ENR 1925, 95, 742–746. [Google Scholar]
- Zhang, J.; Niu, W.; Lv, X.; Liu, Y.; Li, Z. Characteristics of land subsidence in an area of long-term groundwater mining in Tianjin. Shanghai Land Resour. 2019, 40, 77–80. (In Chinese) [Google Scholar] [CrossRef]
- Ha, D.; Zheng, G.; Loáiciga, H.; Guo, W.; Zhou, H.; Chai, J. Long-term groundwater level changes and land subsidence in Tianjin, China. Acta Geotech. 2020, 16, 1303–1314. [Google Scholar] [CrossRef]
- Hu, X.; Bürgmann, R.; Xu, X.; Fielding, E.; Liu, Z. Machine-Learning characterization of tectonic, hydrological and anthropogenic sources of active ground deformation in California. J. Geophys. Res. Solid Earth 2021, 126, e2021JB022373. [Google Scholar] [CrossRef]
- Yu, X.; Hu, X.; Wang, G.; Wang, K.; Chen, X. Machine-Learning estimation of snow depth in 2021 Texas statewide winter storm using SAR imagery. Geophys. Res. Lett. 2022, 49, e2022GL099119. [Google Scholar] [CrossRef]
- Tabachnick, B.G.; Fidell, L.S. Using Multivariate Statistics, 7th ed.; Pearson: New York, NY, USA, 2019; ISBN 9780134790541. [Google Scholar]
- Lischeid, G. Non-linear visualization and analysis of large water quality data sets: A model-free basis for efficient monitoring and risk assessment. Stoch. Environ. Res. Risk Assess. 2009, 23, 977–990. [Google Scholar] [CrossRef]
- Jolliffe, I.T.; Cadima, J. Principal component analysis: A review and recent developments. Philos. Trans. Royal Soc. 2016, 374, 20150202. [Google Scholar] [CrossRef]
- Richman, M. Rotation of principal components. J. Climatol. 1986, 6, 293–335. [Google Scholar] [CrossRef]
- Ji, K.; Herring, T. Transient signal detection using GPS measurements: Transient inflation at Akutan volcano, Alaska, during early 2008. Geophys. Res. Lett. 2011, 38. [Google Scholar] [CrossRef]
- Rudolph, M.; Shirzaei, M.; Manga, M.; Fukushima, Y. Evolution and future of the Lusi mud eruption inferred from ground deformation. Geophys. Res. Lett. 2013, 40, 1089–1092. [Google Scholar] [CrossRef]
- Chaussard, E.; Bürgmann, R.; Shirzaei, M.; Fielding, E.J.; Baker, B. Predictability of hydraulic head changes and characterization of aquifer-system and fault properties from InSAR-derived ground deformation. J. Geophys. Res. Solid Earth 2014, 119, 6572–6590. [Google Scholar] [CrossRef]
- Shi, G.; Ma, P.; Hu, X.; Huang, B.; Lin, H. Surface response and subsurface features during the restriction of groundwater exploitation in Suzhou (China) inferred from decadal SAR interferometry. Remote Sens. Environ. 2021, 256, 112327. [Google Scholar] [CrossRef]
- Chen, X.; Hu, Q. Groundwater influences on soil moisture and surface evaporation. J. Hydrol. 2004, 297, 285–300. [Google Scholar] [CrossRef]
- Casagrande, A. Determination of the Pre-consolidation Load and Its Practical Significance. In Proceedings of the 1st International Conference on Soil Mechanics, Cambridge, MA, USA, 22–26 June 1936; Volume 3, pp. 60–64. Available online: https://cir.nii.ac.jp/crid/1570572699742285056 (accessed on 5 February 2023).
Disclaimer/Publisher’s Note: The statements, opinions and data contained in all publications are solely those of the individual author(s) and contributor(s) and not of MDPI and/or the editor(s). MDPI and/or the editor(s) disclaim responsibility for any injury to people or property resulting from any ideas, methods, instructions or products referred to in the content. |
© 2023 by the authors. Licensee MDPI, Basel, Switzerland. This article is an open access article distributed under the terms and conditions of the Creative Commons Attribution (CC BY) license (https://creativecommons.org/licenses/by/4.0/).