Article

Breach Progression Observation in Rockfill Dam Models Using Photogrammetry

by
Geir Helge Kiplesund
*,
Fjola Gudrun Sigtryggsdottir
and
Leif Lia
Department of Civil and Environmental Engineering, Norwegian University of Science and Technology, 7491 Trondheim, Norway
*
Author to whom correspondence should be addressed.
Remote Sens. 2023, 15(6), 1715; https://doi.org/10.3390/rs15061715
Submission received: 6 February 2023 / Revised: 10 March 2023 / Accepted: 17 March 2023 / Published: 22 March 2023

Abstract

:
Dam failures are examples of man-made disasters that have stimulated investigation into the processes related to the failure of different dam types. Embankment dam breaching during an overtopping event is one of the major modes of failure for this dam type, comprising both earthfill and rockfill dams. This paper presents the results of a series of laboratory tests on breach initiation and progression in rockfill dams. Especially eight breaching tests of 1 m-high 1:10 scale embankment dams constructed of scaled well-graded rockfill were conducted. Tests were performed with and without an impervious core and under different inflow discharges. Controlling instrumentation includes up to nine video cameras used for image analysis and photogrammetry. A previously little-used technique of dynamic 3D photogrammetry has been applied to prepare 3D models every 5 s throughout the breaching process, allowing us to track in detail breach development. These dynamic 3D models along with pressure sensor data, flow data, and side-view video are used to provide data on erosion rates throughout the breaching process. One important purpose of this research is to test methods of observing a rapidly changing morphology such as an embankment dam breach that can easily be scaled up to large-scale and prototype-scale tests. The resulting data sets are further intended for the verification of existing empirical and numerical models for slope stability and breach development as well as the development of new models.

1. Introduction

Dam failures are examples of man-made disasters that have stimulated further investigation into the processes related to the failure of different dam types. Erosion and breaching due to overtopping is one of the major modes of failure for embankment dams [1]. The vulnerability to overtopping arises from the fact that embankment dams are mainly constructed of erodible material. The erosion processes that develop during overtopping may ultimately lead to the breaching of the embankment dam and consequent catastrophic breakout flood. While there are numerous experimental studies on the breaching of earthfill dams, dams of coarser material used in rockfill dams have been less studied. Rockfill dams differ from earthfill dams in that the main building material is pervious, coarse-grained natural, crushed or blasted rock, normally quarried near the dam site, whereas in an earthfill dam, the main volume comprises locally sourced fine-grained soil material. These differences result in quite different material properties and thus behaviour during a breach. Empirical models used to assess the severity of the dam breach outflow are mainly based on historical failures, the majority of which are earthfill dams [2]. Nevertheless, empirical models such as those described in [3], along with other types of models, are used in many countries to assess the breaching of rockfill dams and the resulting flooding.
The World Register of Large Dams [4] counts 7745 rockfill dams, which is about 13% of all the large dams (H > 15 m) in the world. In addition to the existing rockfill dams, many new rockfill dams are being constructed, with the planned 335 m-tall Rogun Dam in Tajikistan set to become the world’s tallest dam when finished, while the 145 m-tall Çetin Dam in Türkiye and 150 m-tall Moglicë Dam in Albania are two recently completed examples of large rockfill dams. Hence, understanding how these dams perform under extreme loading conditions and how they fail is a topic of interest in many countries, particularly with the advent of climate changes which are believed to lead to increased flood magnitudes and frequency in many regions, see for example [5]. According to ICOLD [1], floods larger than expected represent a major cause of failure of embankment dams as they are vulnerable to overtopping of the core and crest.
The research presented here investigates the process of failure when rockfill dams are overtopped. Overtopping events could be caused by reduced spillway capacity and increased floods exceeding the spillway capacity, and it could also be the result of intentional damage to the dam crest. The work is focused on embankment dams with coarse, compacted rockfill and steep slopes. During overtopping, rockfill dams are subjected to two main failure mechanisms, mass sliding and surface erosion/particle dragging, as described in [6], where the results of 114 physical model tests on the failure of the downstream shoulder of rockfill dams are presented. Detailed descriptions of the breach process can also be found in [7,8]. Commonly, overtopping modelling is performed on uniformly graded materials, either sands or gravels, and there are far fewer tests available on overtopping of well-graded crushed rock embankments; some of the tests previously mentioned in [6] were, however, performed on more well-graded gravels. Rockfill dams are also compacted during construction, and this will affect breach development. In [9], the effect of compaction levels on breach development in sand embankments is investigated experimentally. This is also touched upon in several other publications such as [10,11]. There is also available research on landslide dams [12,13,14] as well as glacial moraine dams [15] that have looked at more well-graded materials. One research project of particular interest is the IMPACT project, where a series of large-scale tests were conducted on various rockfill, moraine and clay dams [11,16].
Photogrammetry is well established as a method for measuring morphology and morphological changes; however, it is not much used in dam break research. Stereo vision usage has been applied in dam breach research through the use of Kinect sensors [17]. This is, however, a quite different approach from what is later described in this paper. A good general guideline for using structure from motion photogrammetry for this kind of research can be found in [18]. See [19,20,21] for further description of the method and examples of the application of 4D photogrammetry.
The aim of the present work is (1) to investigate new instrumentation for dam breach models based on dynamic photogrammetric methods that can also be scaled up to prototype scale tests, (2) to investigate the breaching of rockfill dams and (3) to establish a baseline for further model tests on breaching of riprap protected dams using the same rockfill shell material and dimensions while adding a filter and riprap layer. Some results of this work on riprap-protected dams can be found in [22], and further work is in progress.

2. Methods and Materials

The physical model tests described here are the continuation of a long series of laboratory investigations into the stability of riprap and/or rockfill dams subjected to overtopping, continuously ongoing since 2013. For this reason, the model scale was decided to be unchanged from previous models tested in the same facility (Figure 1) to facilitate the comparison of results from the different tests. The choice of scale and other design principles for the series of tests is discussed in [23]. The size of the model is primarily determined by the dimensions of the testing facility. The model is a conceptual model of a rockfill dam. The model design considers the typical geometry of rockfill dams currently being built. The model is constructed at a scale of 1:10 assuming Froude similarity. The model was designed to be tested both with and without an impermeable core. The model tests of the present study are listed in Table 1. In addition, there were three trial tests carried out in the process of selecting core material, favouring realistic modelling of the breach formation in the rockfill, as well as refining the testing procedure. The selection of material in the dam considered restrictions on the use of fines in the flume due to the water circulation system of the laboratory.
Methodology, instrumentation, material properties and testing procedure adopted for the physical modelling studies are explained in this chapter. The process relating to image analysis and photogrammetry is also explained.

2.1. Physical Model Description

An overview of the model setup has previously been described in [24]. Important information is repeated here and expanded. The tests have been conducted in a flume at the Hydraulic Laboratory at the Norwegian University of Science and Technology (NTNU). The flume itself is horizontal with a total length of 25 m, a width of 1 m and a depth of 2 m (Figure 1). The dam model location in the flume was at a 4 m-long section of the flume with glass walls.

2.1.1. The Dam Model

The dam model is placed on a 0.35 m-high, 1 m-wide and 5 m-long platform along a 4 m-long section of glass wall in the upper part of the flume. The glass wall facilitates visual observation of the breach. Downstream of the raised platform, a 7 m-long ramp with a slope of 1:20 was installed, the purpose of which was to ensure predictable downstream conditions. The first trials revealed that during the breaching process backwater effects would start affecting the flow once erosion material had filled up the 0.35 m drop.
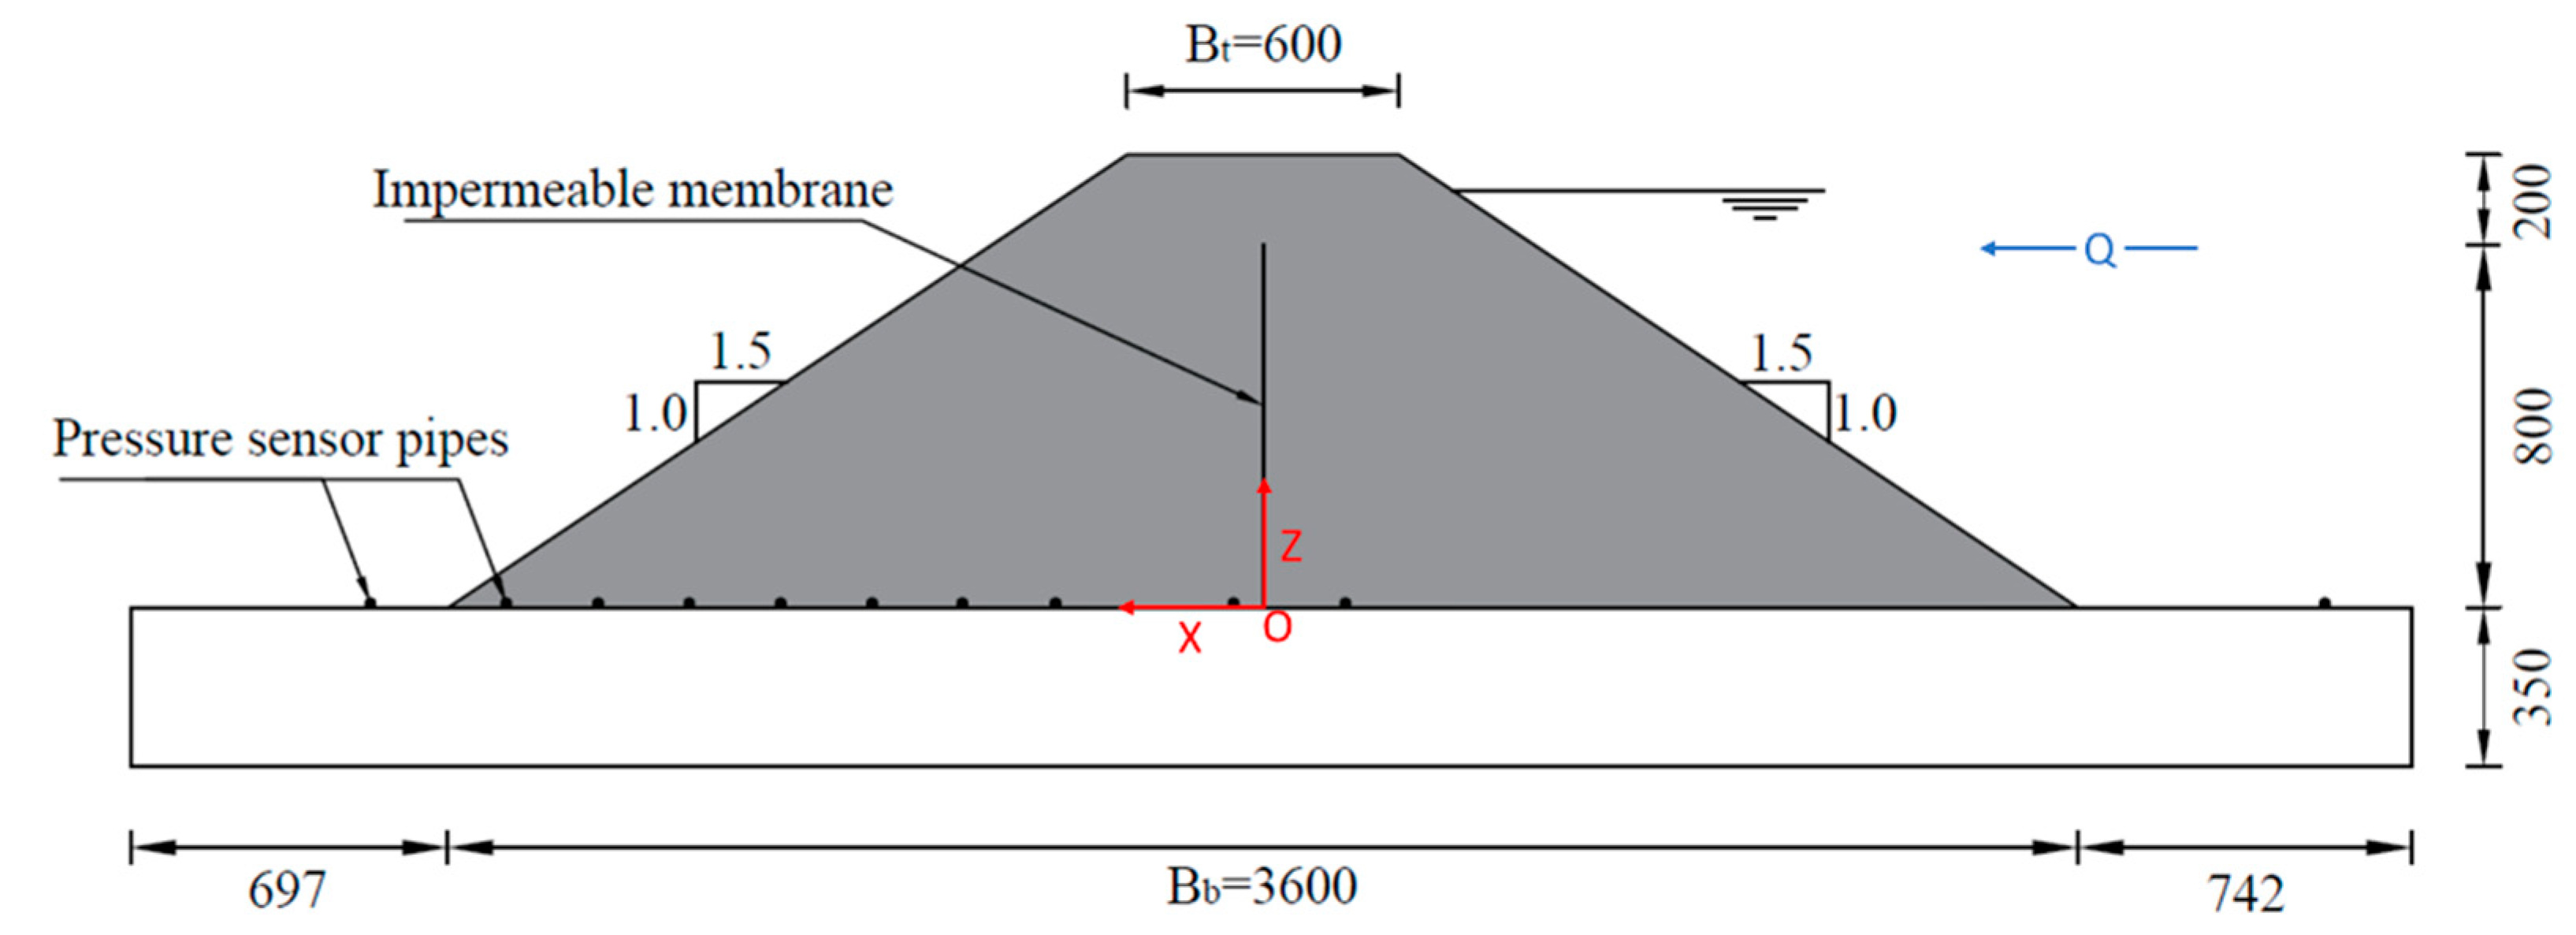
The dam model (Figure 2) has a height Hd = 1 m, bottom width Bb = 3.6 m, top width Bt = 0.6 m and transverse length Ld = 1 m, which is equal to the flume width (Figure 1). The upstream and downstream slopes were chosen at Zdss = Zuss = 1.5 (1.5H:1V), which is a common slope when building with rockfill with an angle of repose around 45°.
A horizontal pilot channel was constructed on the crest of the dam models towards the glass wall. The pilot channel had a depth of 0.1 m, bottom width of 0.1 m and top width of 0.2 m. The pilot channel was there to ensure that the breach would initiate on the glass wall side, enabling video recording of the breach development from the outside.
For dam models with a central core, the thickness of the rockfill layer above the core, that is, the distance from the top of the core to the crest of the dam, was chosen as 0.2 m. This is per the requirements in [25] for rockfill dams with a central moraine core. The requirement considers for a prototype dam a minimum of 2 m of frost-safe material above the clay or moraine core. While this requirement is not in place for other core materials such as a flexible membrane, concrete wall or asphalt core, the crest thickness was kept at 0.2 m (2 m in prototype) to keep the present tests comparable with previous tests [26] and future planned tests.
The coordinate system defined for these tests was a right-handed cartesian X-Y-Z coordinate system with its origin at the base of the dam, at the right-hand end of the centre line seen in the direction of flow. Figure 2 shows the X and Z axes, and Figure 3b shows all the axes.

2.1.2. Sensor Data Collection

The maximum inflow capacity of the pump system feeding the flume is 0.5 m3/s fed through three separate inlet pipes, each independently valve-controlled and instrumented, and these are connected to a circulation system with an upper storage reservoir providing constant pressure. Inflow is measured with Siemens SITRANS FM Mag 5100 W sensors with Siemens SITRANS FM Mag 5000 transmitters with a flow rate measurement accuracy of ±0.4%; for these tests, only one of the inflow pipes was used at a time.
For measurement of pore pressures within the dam model and water pressure upstream of the model, a total of 11 steel pipes with a diameter of 10 mm each with nine holes of 1 mm diameter drilled into them evenly distributed along the width of the flume are installed; the pipes are numbered P1 to P11 from upstream to downstream. These pipes, apart from P11, which was not in use for the tests described here, were connected with flexible plastic pipes to pressure sensors installed outside the flume. Two SIEMENS SITRANS P210, 0 to 2450 mmWC pressure sensors were connected to pipes P1 and P2, and eight SIEMENS SITRANS P210, 0 to 1570 mmWC sensors were connected to pipes P3 to P10. These sensors have a typical accuracy of 0.25% (maximum 0.5%) of the full-range value, which translates to ±6 mmWC for P1 and P2 and ±4 mmWC for P3 to P10. The water level upstream of the model is, in addition to pressure sensor P1 described above, also recorded by an acoustic water level sensor, a Microsonic mic + 340 sensor with an accuracy of ±1%. All sensors are connected to an Agilent U2355A device controlled by a computer; input voltage from each sensor is recorded at 100 Hz and stored on the computer.

2.1.3. Video Cameras Setup and Type

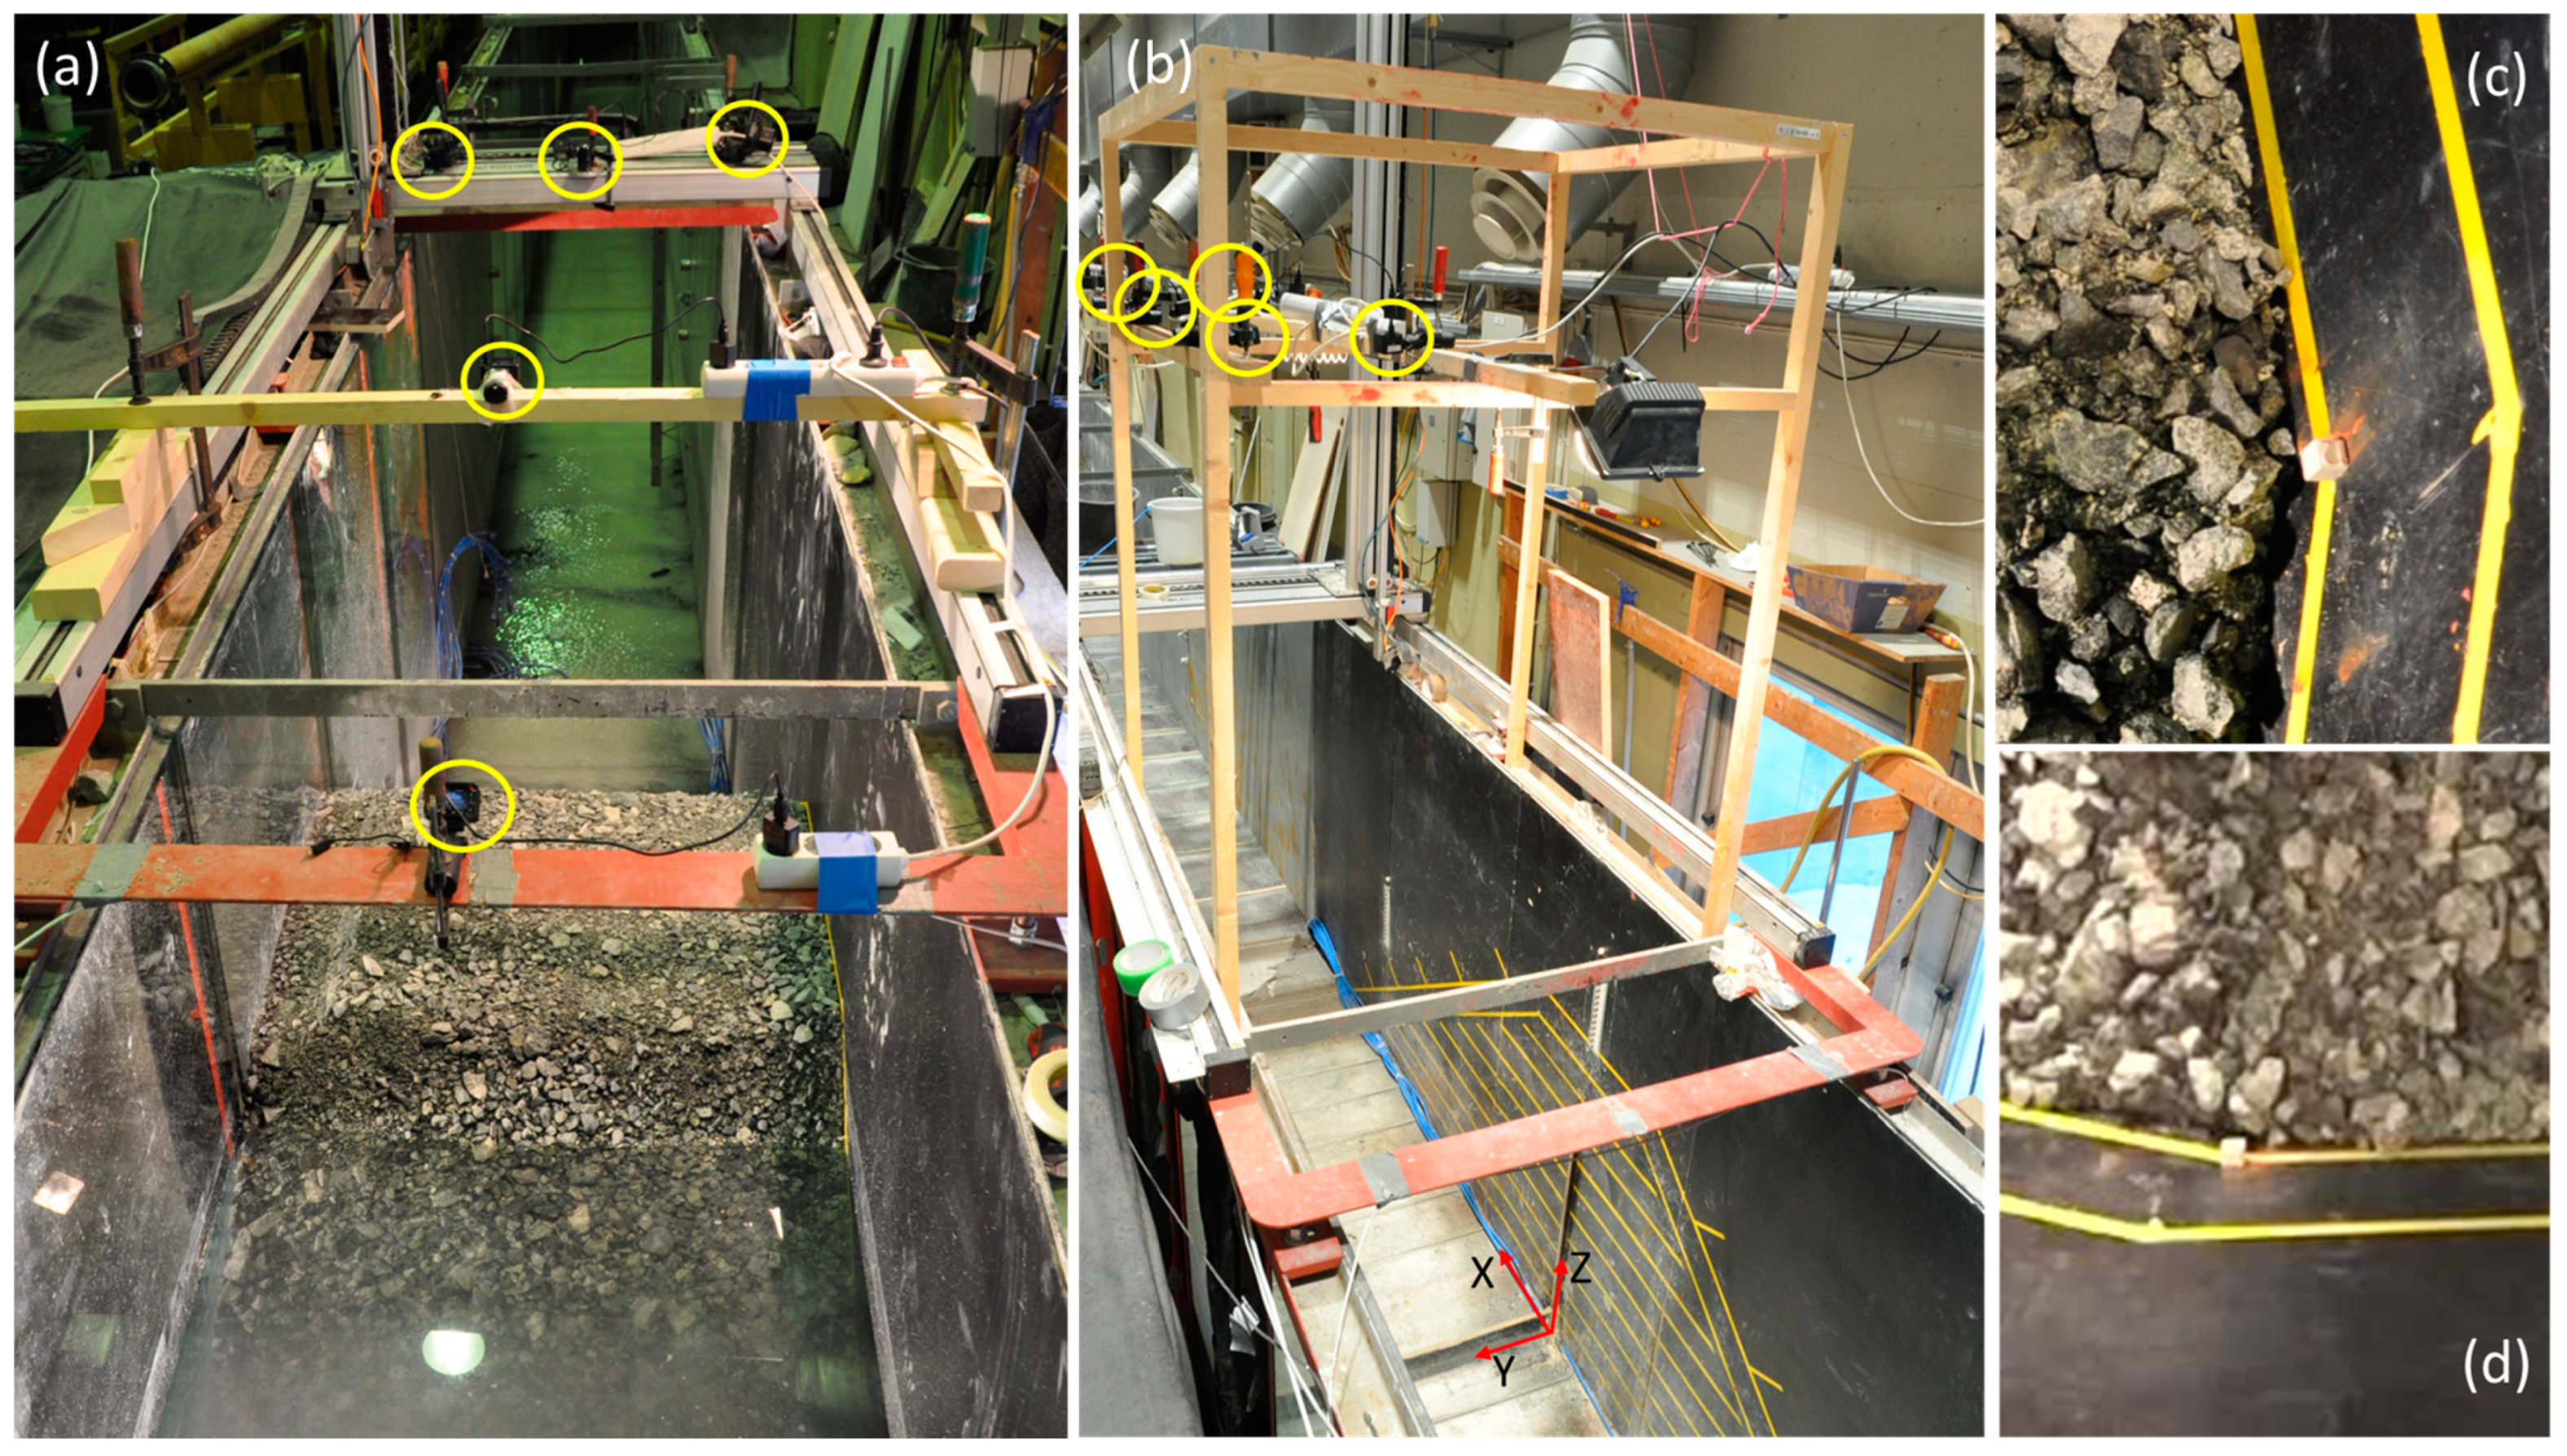
Several video cameras were placed around the model to record the whole breaching process. The number of cameras for each model test is listed in Table 1. In addition to those listed in the table, there were three trial tests (HT1, CT1, CT2). Examples of the camera rig setups are shown in Figure 3.
Four cameras were used in the first trial test (HT1). One camera was placed to the side of the flume recording breach development through the glass wall and above the model, and three cameras were installed. Before the second trial test (CT1), two cameras were added above the model. This camera setup with six cameras was kept for the last trial test (CT2) as well as for the first model tests (U1, U2 and U3). The arrangement of the cameras was again changed between tests U3 and U4. The cameras were moved further away from the model to provide more overlap between images, and additional lighting was also installed on the camera rig. For tests U5, H1, H2 and H3, a further three cameras were added, resulting in a total of nine cameras. Two cameras observed the test from the side and seven from above the model.
The cameras were of the models Sony Cybershot RX0 and Sony Cybershot RX0 II; these are waterproof and shockproof cameras of the “Action Cam” type, which are quite well suited for rough laboratory conditions as well as for outdoor use. The recording was performed at a 1920 × 1080 pixel resolution at 50 frames per second for the overhead cameras and partly 100 frames per second and partly 50 frames per second for the side-view camera. 4k video is possible with these cameras but was not applicable in our case due to video length limitations on 4k recording.
Figure 3 shows photographs of the flume with cameras installed for models U1-U3 and U4-H3, respectively. Note that image (b) shows the camera setup for model U4. It is, however, identical to that used for U5 and H1-H3 as well, except for two additional cameras mounted on the same framework for those setups, with one camera added on the left beam and one on the centre beam. GCP cube placement from DSLR and Video images, respectively, are shown in (c) and (d).

2.2. Materials

2.2.1. Core Material

Table 1 lists the core material used for the different models that had a central core. The trial models CT1 and CT2 had a core of XPS foam squares and rectangles with different sealing materials. However, this core material was unsatisfactory due to high leakage flows before overtopping as well as undesirable effects on the breaching development. Models U1 to U5 had a core of 1 mm-thick styrene butadiene rubber (SBR 1729) with fibre reinforcement, which was fixed to the bottom and side walls using tape. The rubber sheet provided the best sealing against leakage through the core and fulfilled predefined criteria. Criteria for the selection of core material included, a realistic phreatic line prior to and during the overtopping situation, acceptable effect of the watertight membrane on the breaching, reproducibility and consistency between tests, ease of construction as well as ease of separating the core material from the rockfill remains after the end of each test.
The rubber sheet is easy to work with and can be subject to the compaction of surrounding material without rupturing as well as accidental impacts during construction. Geomembranes have also been used in dam construction, as detailed in [27]. This includes internal placement as in our model, and several examples are listed in [28], such as the Atbashinsk dam in Kyrgysztan. The model dams with a rubber membrane core can also be related to rockfill dams with a central core of asphalt [29,30] or concrete. While the rubber sheet may be similar in appearance to the type of geomembrane used on dams, it is not a scale model of its behaviour.

2.2.2. Rockfill

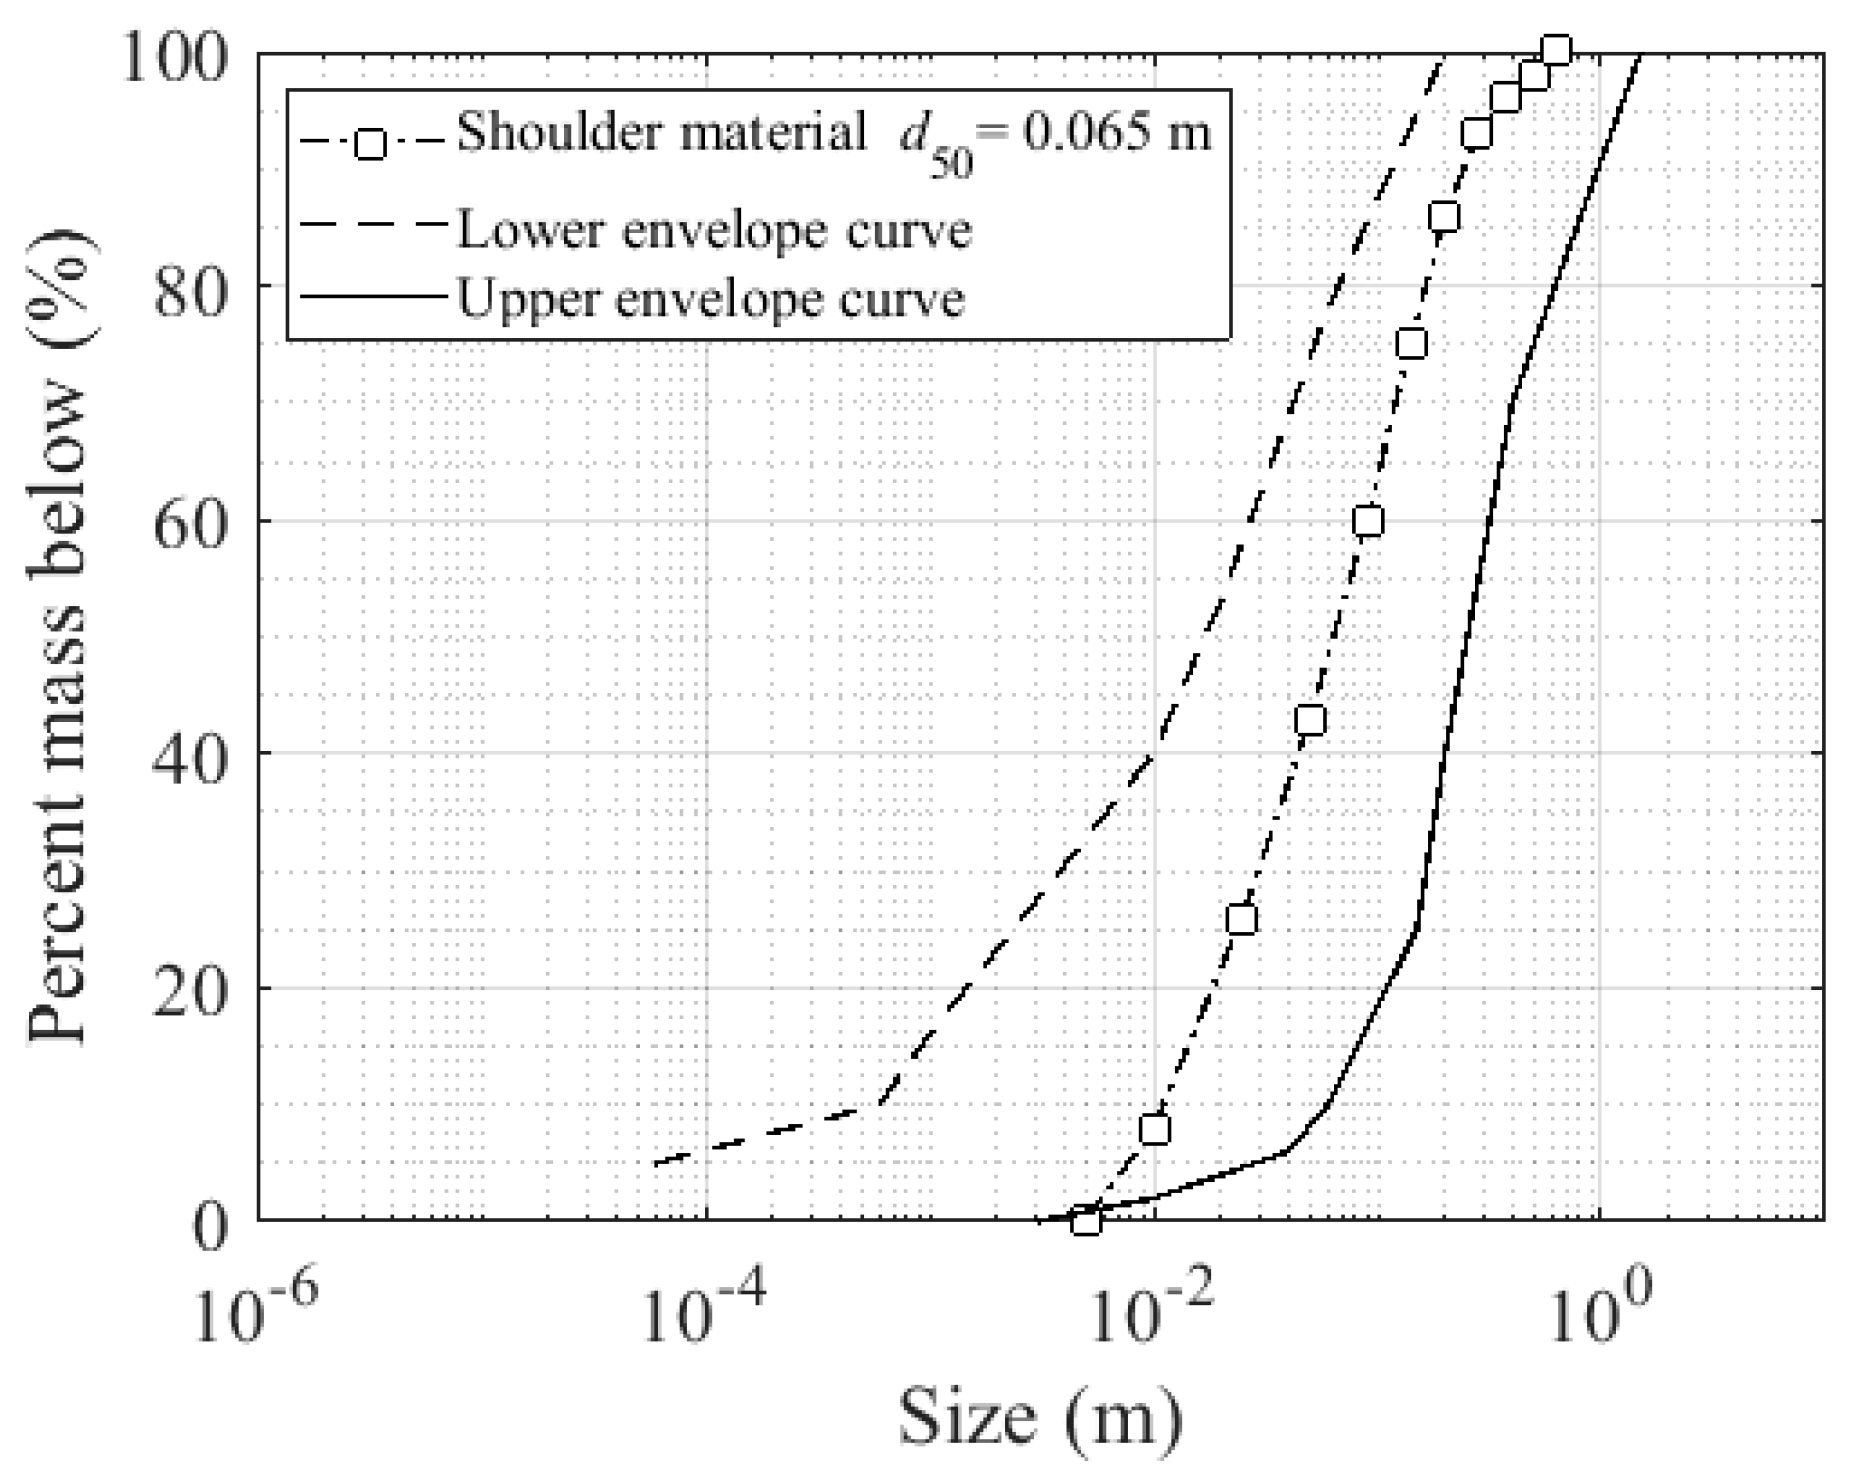
The rockfill material used for the present tests is identical to that used in earlier models described in [26]. The shell or shoulder material of the model dam consists of well-graded rockfill material of density ρr = 2720 kg/m3, median particle size d50 = 6.5 mm, coefficient of uniformity of Cu = 7.5 and porosity of n = 0.35. The choice of rockfill material was based on a data base of gradation curves from rockfill dam construction. The database contained data on large Norwegian rockfill dams such as Strandevatn, Aura, Skjellingavatn, Homstøl and Tunsbergdalen [31]. Figure 4 presents the upper and lower boundary envelopes of rockfill gradations in the database of dams used for determining the sizing of the rockfill shell material.
As can be seen from Figure 4, the gradation is biased towards the coarser range of the curves found in the database, and all particles smaller than 0.5 mm were washed out of the final mix. This was performed due to restrictions on materials used in the flume to protect the pump system in the laboratory. The gradation curve is also evaluated against filter criteria recommendations as described by NVE and USDA [25,32], and further details on these calculations can be found in [26]. The material was produced by mixing appropriate amounts of various commercially available crushed rock gradations to obtain the desired gradation curve. The total mass of the rockfill shell for these models was 4500 kg.
The rockfill dam shoulder was constructed in layers 0.1 m thick, which were compacted by hand using a 0.2 m × 0.2 m tamper weighing 4.54 kg. The tamper was dropped a vertical distance of 0.1 m 10 times at each location in an overlapping pattern to achieve uniform energy of compaction over the entire experimental testing program. The choice of compaction method and energy is not an attempt to replicate any specific compaction energy or construction method in prototype but rather to ensure reproducibility and consistency between models. The shell material was also kept moist during construction by spraying water on it to ensure consistent compaction as well as to avoid airborne dust during construction.

2.3. Testing Procedure

A total of 8 model tests are described here (see Table 1). In addition, there were three trial tests investigating model setup, camera placement, boundary conditions and materials, but the results from these are not presented further in this article.
For the tests of rockfill dams with a core (tests U1 to U5), a base test inflow of 5 L/s was applied, which was chosen based on earlier test results documented in [26] as well as the trial tests. The earlier tests demonstrated that this discharge (5 L/s) was sufficiently large to cause reliable overtopping of the crest of the dam and lead to failure from overtopping. In addition to the trial test, three tests (U1, U2 and U4) were performed with this discharge. Two additional tests at 10 L/s (U3) and 15 L/s (U5) were executed to observe the dependence of overtopping discharge on breach development. For the tests on homogeneous rockfill (H1, H2, H3) without a core, a discharge of 15 L/s was applied for two of the tests (H1 and H3), and one test (H2) was run at 20 L/s. This higher inflow of 15 and 20 L/s was chosen to reduce the amount of erosion of the downstream slope (small surface slides) due to throughflow, while the reservoir water level increased behind the dam, and before overtopping of the crest occurred, thus initiating breaching in the pilot channel.
After the dam model was constructed, white cubes with dimensions 10 mm × 10 mm × 10 mm were placed at known coordinates around the model to serve as ground control points (GCPs) for subsequent analysis (see Table 1 for number of GCPs); occasionally, other known points around the flume were also used as GCPs. For verification, four 20 cm scale bars were added to the flume in addition to a more permanent 1 m-long scale bar; several other identifiable points in the flume also had their position measured. Measurements in the flume were taken using measuring sticks, steel tape measures and lasers with the aid of self-levelling cross-line lasers, and measurements were taken based on the pre-defined origin.
Photographs of the model before and after the test were taken with a Nikon D90 digital single lens reflex (DSLR) camera mounting a Nikkor 16–85 mm zoom lens fixed at 16 mm focal length for all images. The jpeg images generated by this camera have a resolution of 4288 × 2484 pixels.
For the models with a core, a leakage test was first executed by filling the upstream part of the flume up to a level approximately 20 mm below the top of the core and stopping the inflow for some time to assess leakage through the core by measuring the drop in water level. After the leakage test was completed, the inflow was increased to the desired test discharge and kept constant until the test was completed.
For the tests without a core, the inflow was set at the desired discharge throughout the test from the start of filling. There will be a slight increase in inflow as the water level in the flume drops throughout the breaching process due to a higher driving pressure differential from the upper reservoir.
The test was considered completed when erosion in the breach opening had reduced to a low level but still with parts of the dam standing. The tests were not run till a steady state had been achieved, as that would be entirely dependent on the inflow, with some tests experiencing significant erosion over time, while others would see very little erosion.

2.4. Sensor Data Analysis

As described above, water pressure was recorded in 10 sections along the dam foundation, along with the upstream water level and inflow to the flume. The raw voltage data from the sensors were processed using a script developed in the R programming language [33]. The voltage data series were transformed to their respective metrics for pressure, elevation and discharge. The transformed data series were averaged over 100 time steps to obtain data series for each sensor with a time resolution of 1 s.
The inflow discharges and upstream water levels were utilised for calculating first leakage flow and then breach outflow using a simple mass balance equation,
Qout = Qin + ΔV
where Qout is the breach outflow, Qin is the inflow and ΔV is the volume change.
Breach outflow also includes a very small amount of leakage flow, which is, however, insignificant compared to the breach outflow. The volume change (ΔV) was derived from a reservoir curve (Figure 5) developed for these models based on a detailed 3D model of the upstream part of the flume. To facilitate a precise estimate of leakage flows, the reservoir curve also accounts for the pore volume in the upstream half of the dam model based on the measured porosity of the supporting fill material. This calculation was based on an idealised geometry of the dam and does not account for any minor construction deviations from the desired geometry in the individual model dams.

2.5. Image Analysis and Photogrammetry

The process applied to generating 3D models from images and video files has previously been described in [24] but is expanded upon here. An example of video files can be found in the Supplementary Materials videos. As described above, still images, as well as video recordings, were collected from each test, and about 600 GB of images and video was recorded over the seven tests described here. The video material was processed using self-developed R [33] scripts combined with the FFMPEG video processing software [34]. Photos taken with the DSLR were used directly as captured in jpeg format without any further post-processing. The video files required some post-processing before they could be used in the generation of 3D models through photogrammetry and for a side-view image analysis later described.
The videos were all synchronized by use of a stopwatch timed to the data logging being held in the image frame at the start of video recording, from this the start time of each video file could be calculated. The timing offset error between videos by using this method is 0–0.7 s (three to four frames at 50 FPS); this could have been reduced by counting frames to the next stopwatch tick, but this was not deemed necessary. Using the calculated start times for each video file, shorter video clips of the main breaching event were extracted for each camera. The length of the extracted synchronized clips was between 9 and 14 min for tests U1 to U5, and 3 to 5 min for tests H1 to H3. The total recording time was around 0.5 to 1.5 h. Images were extracted every 5 s from these synchronised videos.
Since the video files are synchronized, each set of six images shows the model from six different viewpoints at that time. Correct synchronisation of images is important. A mismatch in timing may result in the photogrammetric process not producing any data for the breaching area, as the images would not display the same geometry in the areas of active erosion, and no tie points would be found in that area.
The 5 s frame rate was chosen as a practical compromise between detailed time resolution and required processing time; a shorter frame rate could have been chosen, limited only by the video frame rate, but processing times would increase without yielding very much additional information on the processes being studied.
Figure 6 shows an example of six images of test U4 extracted at 3170 s after start of test, 470 s from start of synchronised video sequence. A detailed inspection of the images will reveal some small differences in the water surface due to small timing offsets since the synchronisation is not hardware based but rather by post processing; the solid surface, however, is unchanged.
The photos taken with the DSLR camera, as well as the images extracted from video files, were processed using the commercial photogrammetric software Agisoft Metashape Professional Edition [35] versions 1.7 and 1.8, developed by the software company Agisoft LLC. This software was chosen primarily because it has inbuilt support for dynamic (4D) photogrammetry and already was in use by the research group for other applications. The software is based on the methods Structure from Motion (SfM), which is used to determine camera location and optical parameters, and Multi View Stereo (MVS), which is used to generate a 3D model from images taken from multiple known locations [36,37]. As discussed in [24], the precise algorithms used are not published as the software is not open source; however, Agisoft reference some papers on the methods used for building a digital elevation model (DEM) / digital surface model (DSM) and a 3D model using depth maps [38,39]. A significant number of publications can be found on the accuracy of these photogrammetric methods in general, and for a comparison of Agisoft Metashape with other similar software, see [40,41], for example.
Photogrammetric processing with Agisoft Metashape is performed in a series of steps; we will not describe in detail the entire process but refer to [35] for detailed instructions, as there are many smaller steps within this process. We have prepared a flow chart (Figure 7) to show the major steps of the processing workflow applied for this research. This includes the video pre-processing providing images for both a 2D side-view analysis later described, as well as for further analysis in Agisoft Metashape.
(1) Step 1 in the Agisoft analysis, the alignment step, requires the images from the video pre-processing, as well as ground control points (GCP) data and DSLR photos. In this step, areas of the images can be masked out to prevent it from being processed; this was considered here for masking water surfaces but was in the end skipped since it would require significant work adjusting the masks as the breach opens up. Moreover, the main focus of the present study is to identify changes in the dam surface, and hence, accurate surface measurement of the water is not of direct interest. The alignment step consists of what is termed bundle block adjustment. Here, the software searches for recognisable features in the images and tries to match these between images; the resulting feature matches are referred to as tie points in the software. In this step, the position of each camera is determined, and camera calibration parameters are refined. The camera calibration parameters can also be found initially by photographing a calibration pattern displayed on a screen. This is not a prerequisite for running the analysis, but a pre-calibration was performed in this case. The output from this stage is a sparse point cloud and camera positions. The sparse point clouds typically had 30,000 to 100,000 points for the start and end models, and the dynamic models had around 3000 to 8000 points. (2) The second step of the process produces a dense point cloud and a depth map based on the output of the first step. The dense point clouds for the start and end models were in the range of 7 to 50 million points, and the dynamic models typically had around 800,000 points. (3) A three-dimensional surface can be generated in the form of a 3D mesh or a digital elevation model (DEM) based on the output of the previous step. This is the primary output used for this research. (4) A further step of processing is also possible with the generation of either (4a) an orthomosaic by projecting the photos or video images to represent the model seen from directly above or (4b) a textured 3D model with the images draped onto the 3D mesh.
When analysing images over multiple time steps, a process denoted 4D-SFM photogrammetry is applied. Through this method, images are processed together across all time steps. The images are all processed in the structure from motion step (Step 1) in such a way that camera locations and camera calibration parameters are determined across the whole data set, tie points are found over multiple time steps and ground control points (GCPs) are applied over all time steps. This method provides better accuracy and consistency between time steps, lower computing time as well as much less need for manual operations compared to a sequential process where the whole process is executed for each time step independently.
The primary outputs of the photogrammetric analysis process are (1) the generation of a high-resolution 3D model and DEM of the model before and after the breach based on DSLR imagery and (2) a dynamic low-resolution 3D model and DEM for each time slice throughout the breaching process extracted from the video files. All digital elevation models have been exported to TIF files with a grid resolution of 1 mm.
As described above, we have extracted images every 5 s from the video recorded through the glass wall with the same timings as images extracted from the top view cameras. These were used for the 2D side-view analysis. These images were georeferenced and rectified using the QGIS software [42] using the ‘projective’ transformation, and residuals were typically around 2 pixels, indicating that the transformation performs well. Lines indicating the breach bottom were then traced using QGIS and saved as ESRI shapefiles. The accuracy of the traced profiles is not independently checked and is challenging to estimate; the largest uncertainty resides in the fact that the breach bottom is not fixed, and it is here defined as the transition between water and solids, but there will inevitably be regions where the bed-load is significant, and identification of the bottom is challenging. We estimate the uncertainty to be in the range of 2 mm to 10 mm. The breach bottom shapefiles were analysed using R scripts. For the breach expansion analysis, a simple filtering process prevented random ‘spikes’ in the DEM due to random errors on the water surface profiles to move the breach edge back. This approach gave results that conformed well with visual observation, and any further refinement of this somewhat crude approach was not deemed necessary.
The quality of the high-resolution start and end 3D models was evaluated using check scale bars placed around the model on the flume side walls. For tests U1 to U3, one 1-metre-long scale bar was used, and for the remaining tests, a further four 20 cm scale bars were added.
For all these analyses, a breach progression timescale has been defined to ease comparison between tests, where T = 0 s is defined as the last 5 s frame before erosion can be visibly observed from the side in the pilot channel.

3. Results

In this chapter, visual observations will first be presented followed by results from side-view video analysis. Consequently, results from the analysis of the 3D models obtained through the image analysis will be accounted for. Profiles from the 3D models are presented, as well as results from a breach edge tracking and volume change extraction. Finally, validation of the DEMs is carried out.

3.1. Visual Observation

In the following, an overview will be provided of the breaching process as observed visually and from videos. Models U4 and H1 are used as an example for, respectively, dam models with a central core and without a core. The same observations can be made from the other tests with only minor variations.

3.1.1. Dam Model with a Central Core

While filling up the water behind the dam model, some minor leakage can be observed around the edges of the impermeable core, and further at the downstream toe. The leakage flow is, however, insufficient to cause any visible erosion of the shell material, and leakage flow was calculated to be 0.2 L/s. Following the leakage test, the discharge was increased to the desired 5 L/s. This led to an increase in the upstream water level and an overtopping of the pilot channel level. The increased water level also led to the entire dam shell being saturated with water.
The discharge through the pilot channel resulted in an initial erosion at the downstream end of the pilot channel. This erosion progressed in the form of surface erosion (primarily at the breach bottom) and slides (downstream slope and side lopes), gradually progressing down and upstream. (See Figure 8 for a visual depiction of the breaching process of Model U4 as seen from the side.) Only just over two minutes after the initial erosion did the erosion also start progressing laterally beyond the pilot channel. The erosion progressed steadily for another 30 s until erosion of the channel had progressed upstream to the upper end of the pilot channel, from this point on, the flow through the breach opening increased significantly, and consequently, the erosion accelerated. Around the same time, erosion along the centreline of the dam had also reached down to the core level at 0.8 m above the base. From here on, some influence from the core can be observed in the erosion of the dam as the core provides some added resistance against erosion. The core is, however, quite loosely attached to the glass wall and quickly comes loose.
A scour hole develops in the downstream part of the breach channel; however, it is not fixed in location and moves over time, reaching its greatest extent around 3.5 min after initial erosion, after which it starts filling in again as the slope and water velocities reduce.

3.1.2. Dam Model without a Core

Testing of the dam model without a core was performed without a throughflow testing stage as this would result in some erosion of the lower part of the downstream slope due to throughflow. As inflow was higher than for test U4, the water level rose more quickly, rapidly filling up the shell of the dam. The lack of an impermeable core resulted in significantly higher throughflow, resulting in destabilisation and shallow sliding failures of the downstream slope from approximately 5 min before overtopping of the pilot channel and subsequent surface erosion. Once the breach had initiated the breach opening, the rockfill eroded rapidly forming a fairly straight slope defined by the upstream edge of erosion, and at the downstream end, by the deposition and erosion of shell materials transported downstream by the breach flow. No significant scour holes like those seen in the dams with a core were observed. Some temporary deviations from a straight slope were observed following slides from the breach side slope and some larger, more erosion-resistant rocks, thus creating temporary limitations on the vertical erosion.

3.2. Side-View Video Analysis

Figure 8 shows the breach progression as seen through the side window for model U4, while Figure 9 shows the same for model H1. As previously described, T = 0 s is defined as the last 5 s frame before erosion can be visibly observed from the side. The side-view track clearly shows the erosion process described above for these two tests of models with and without a core.
The vertical erosion development was tracked for several sections of the side-view in Figure 8 and throughout the breaching process of test U4. Figure 10 shows a plot of breach bottom elevation (the y elevation) versus time at four different locations along the flume, X = −0.5 (upstream), X = 0 (centre line), X = 0.5 (downstream) and X = 1.0 (downstream).
Looking at breach development in the centreline, X = 0 m, in Figure 10, we can see that the breach bottom stays at 0.9 m for two minutes, while the breach is developing (by surface erosion and slides) as described from visual observations in the downstream end of the pilot channel and on the downstream slope. This can be observed in X = 0.5 m on the slope just downstream of the pilot channel. Further downstream, at X = 1.0 m, there is an increase in elevation due to slides from the top of the slope building up material here.
Once erosion initiates at the centreline (X = 0 m) it progresses rapidly before slowing down significantly as the upstream reservoir drains and the outflow reduces to equal the inflow. The average vertical erosion rate in the most active phase (here, we have defined that as the time steps where the erosion rate is over 1 mm/s) is about 5 mm/s based on the erosion rate in the centreline with a lowering of the bottom elevation of 0.57 m over a period of 120 s, the peak erosion rate over 30 s is 8 mm/s.
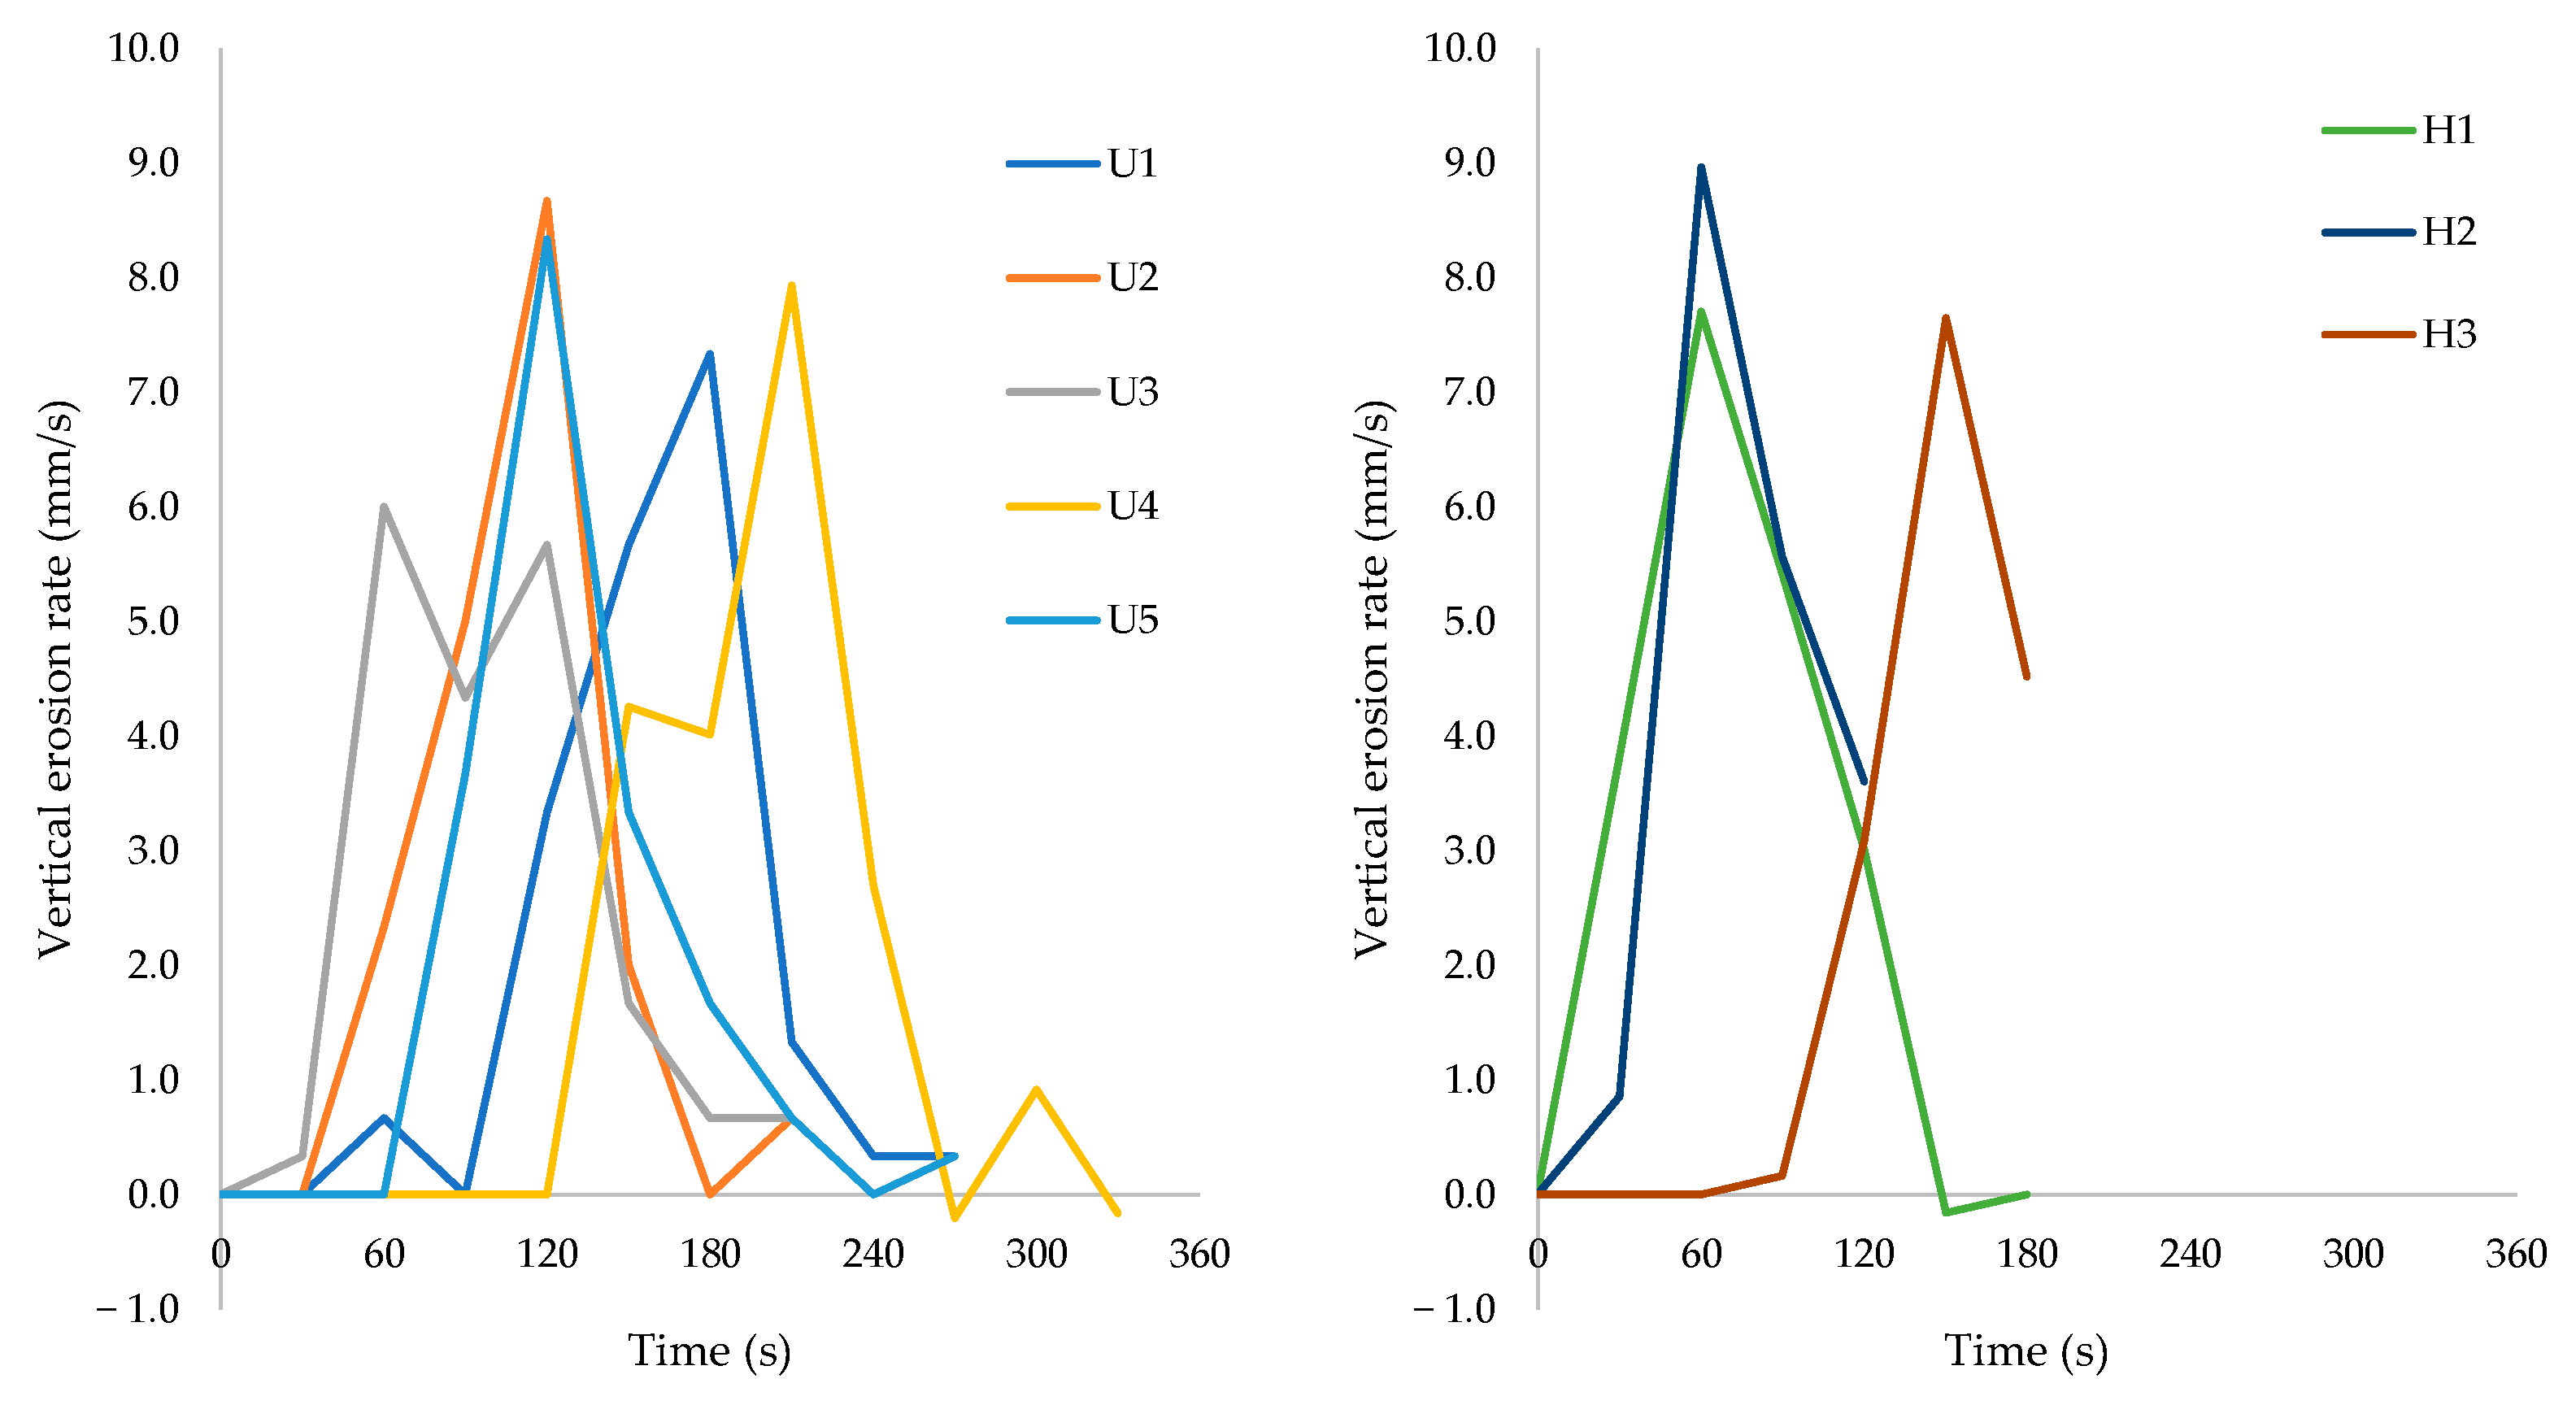
Similar breach development can be seen in the other tests as well; however, the homogeneous tests without core (H1 to H3) generally showed a somewhat quicker breach development. Figure 11 shows the vertical erosion rate Ev throughout the breaching process for the 8 different tests. Ev is calculated as
E v =   Δ H Δ T
where ΔH is the vertical difference in dam slope surface (eroded surface) within time step ΔT (see Figure 10).

3.3. Analysis of 3D Models

3.3.1. Profiles from DEM Models

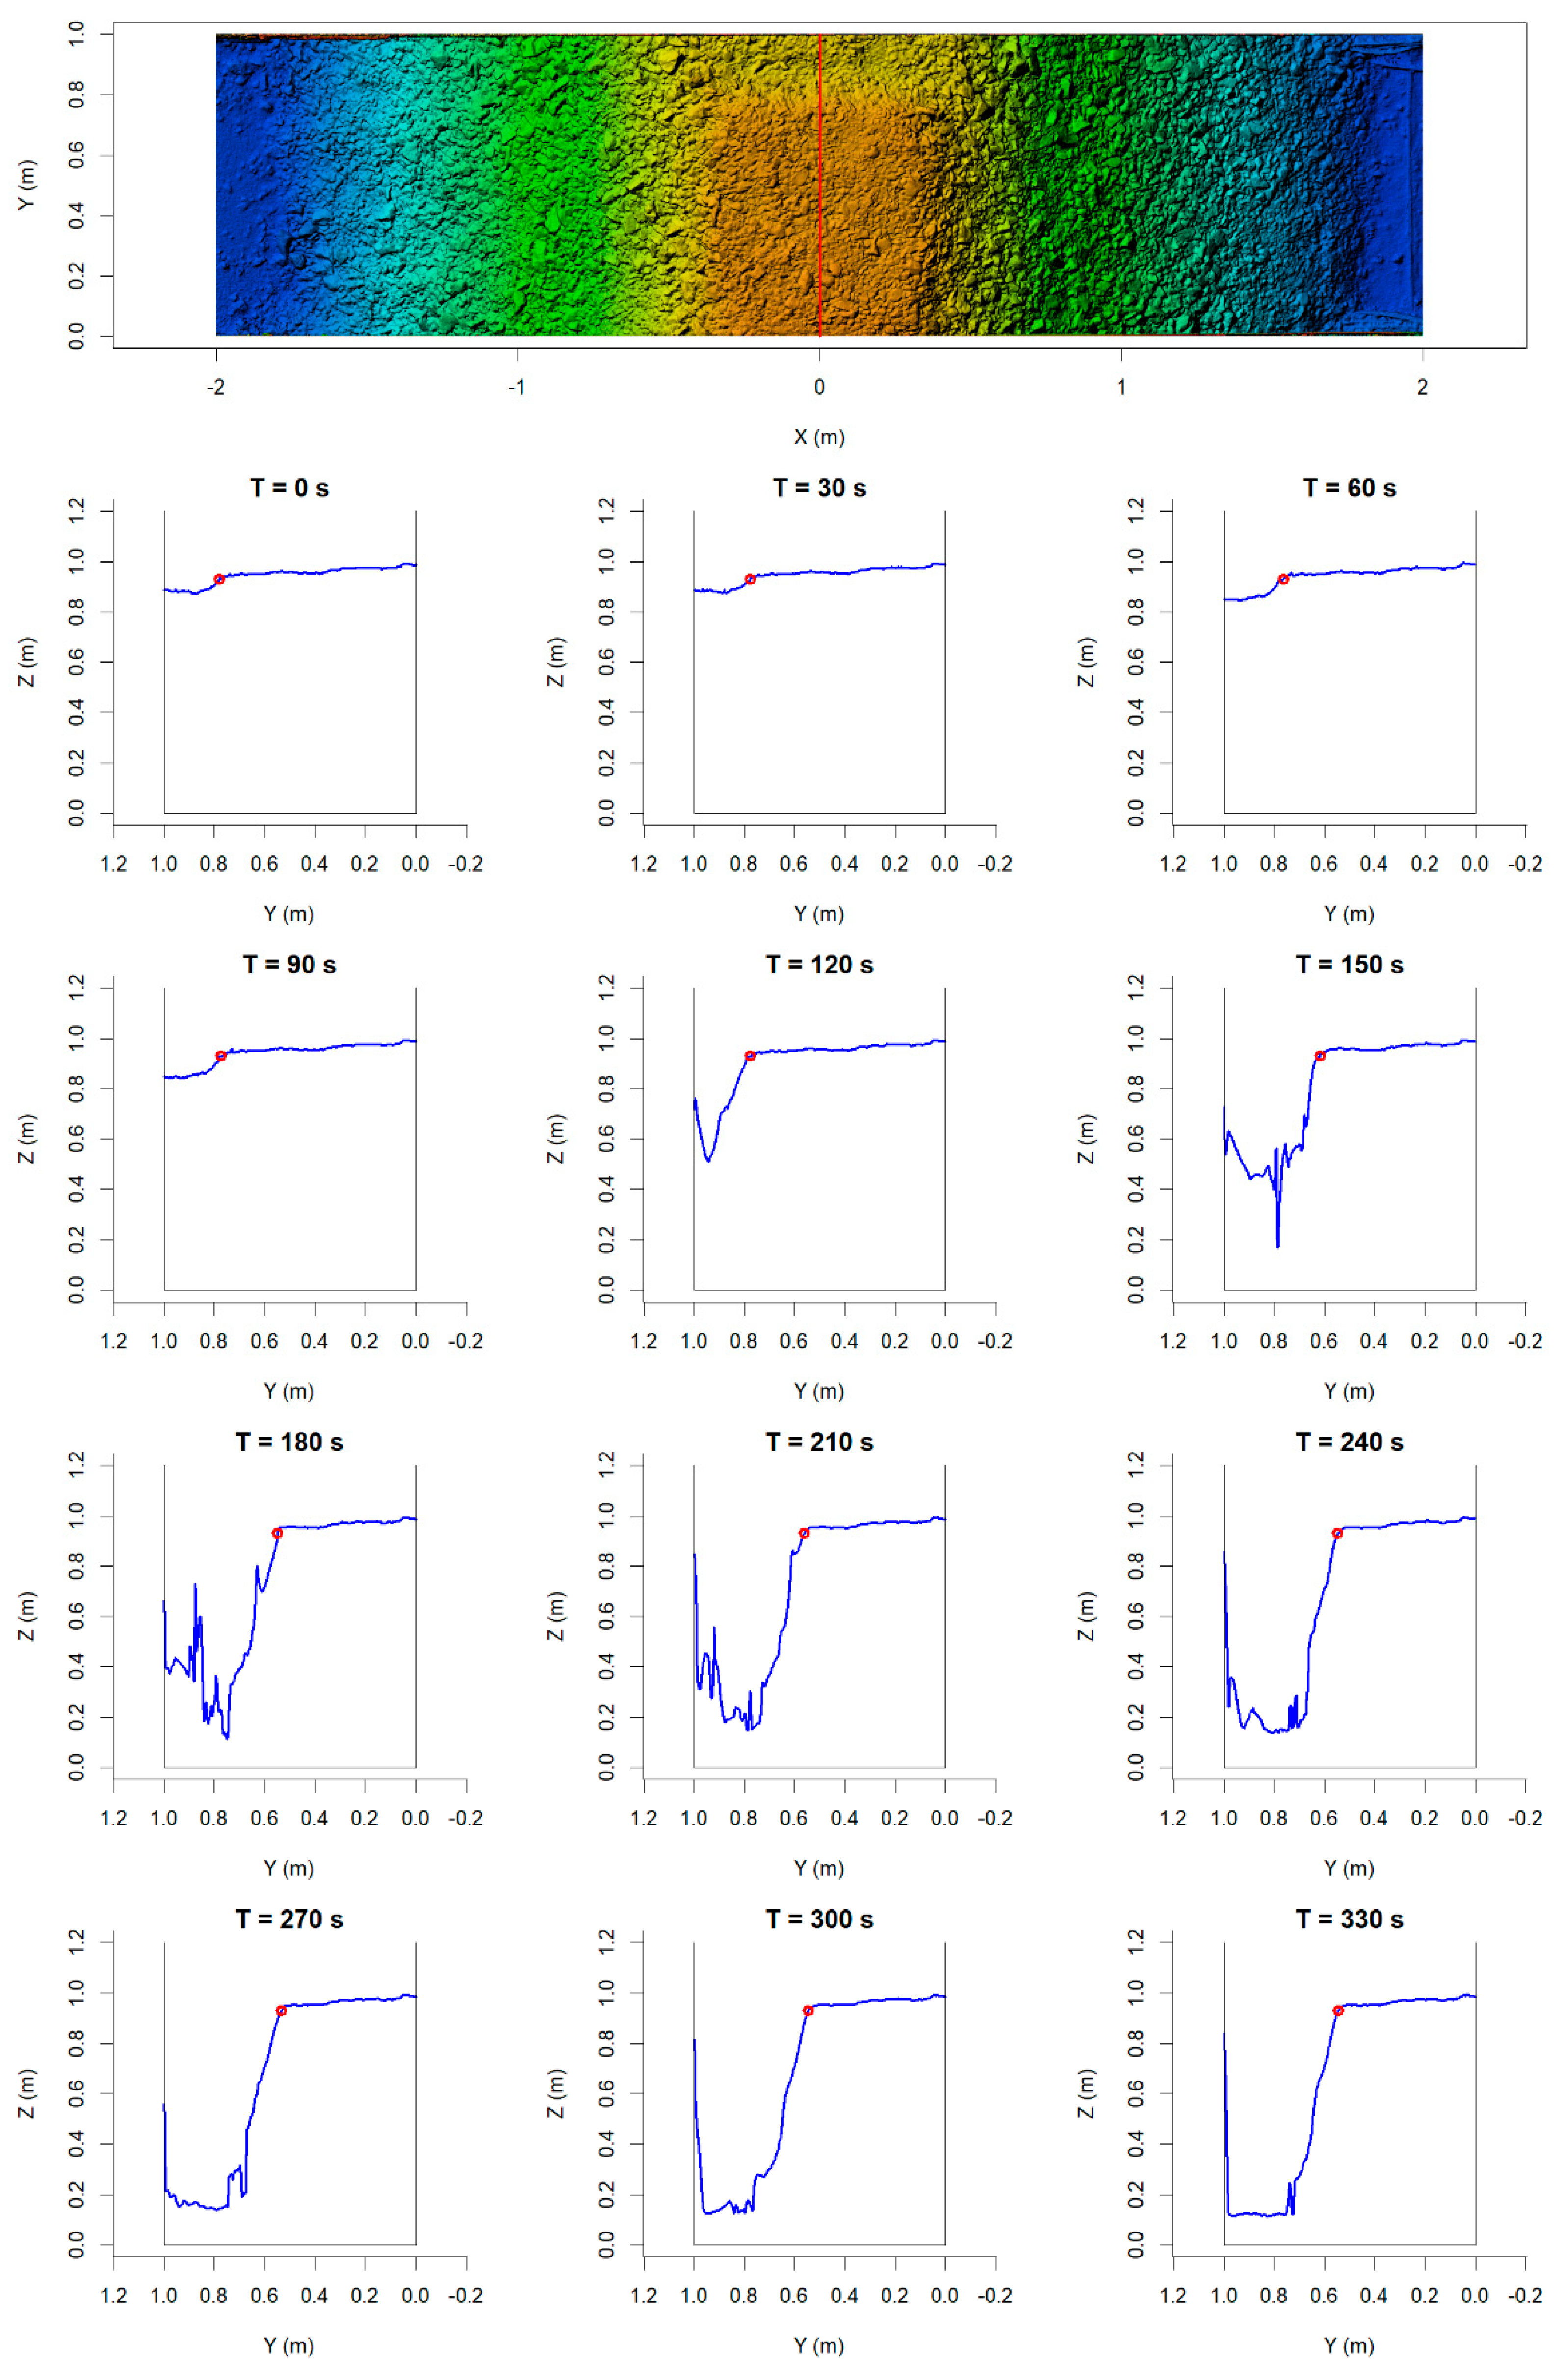
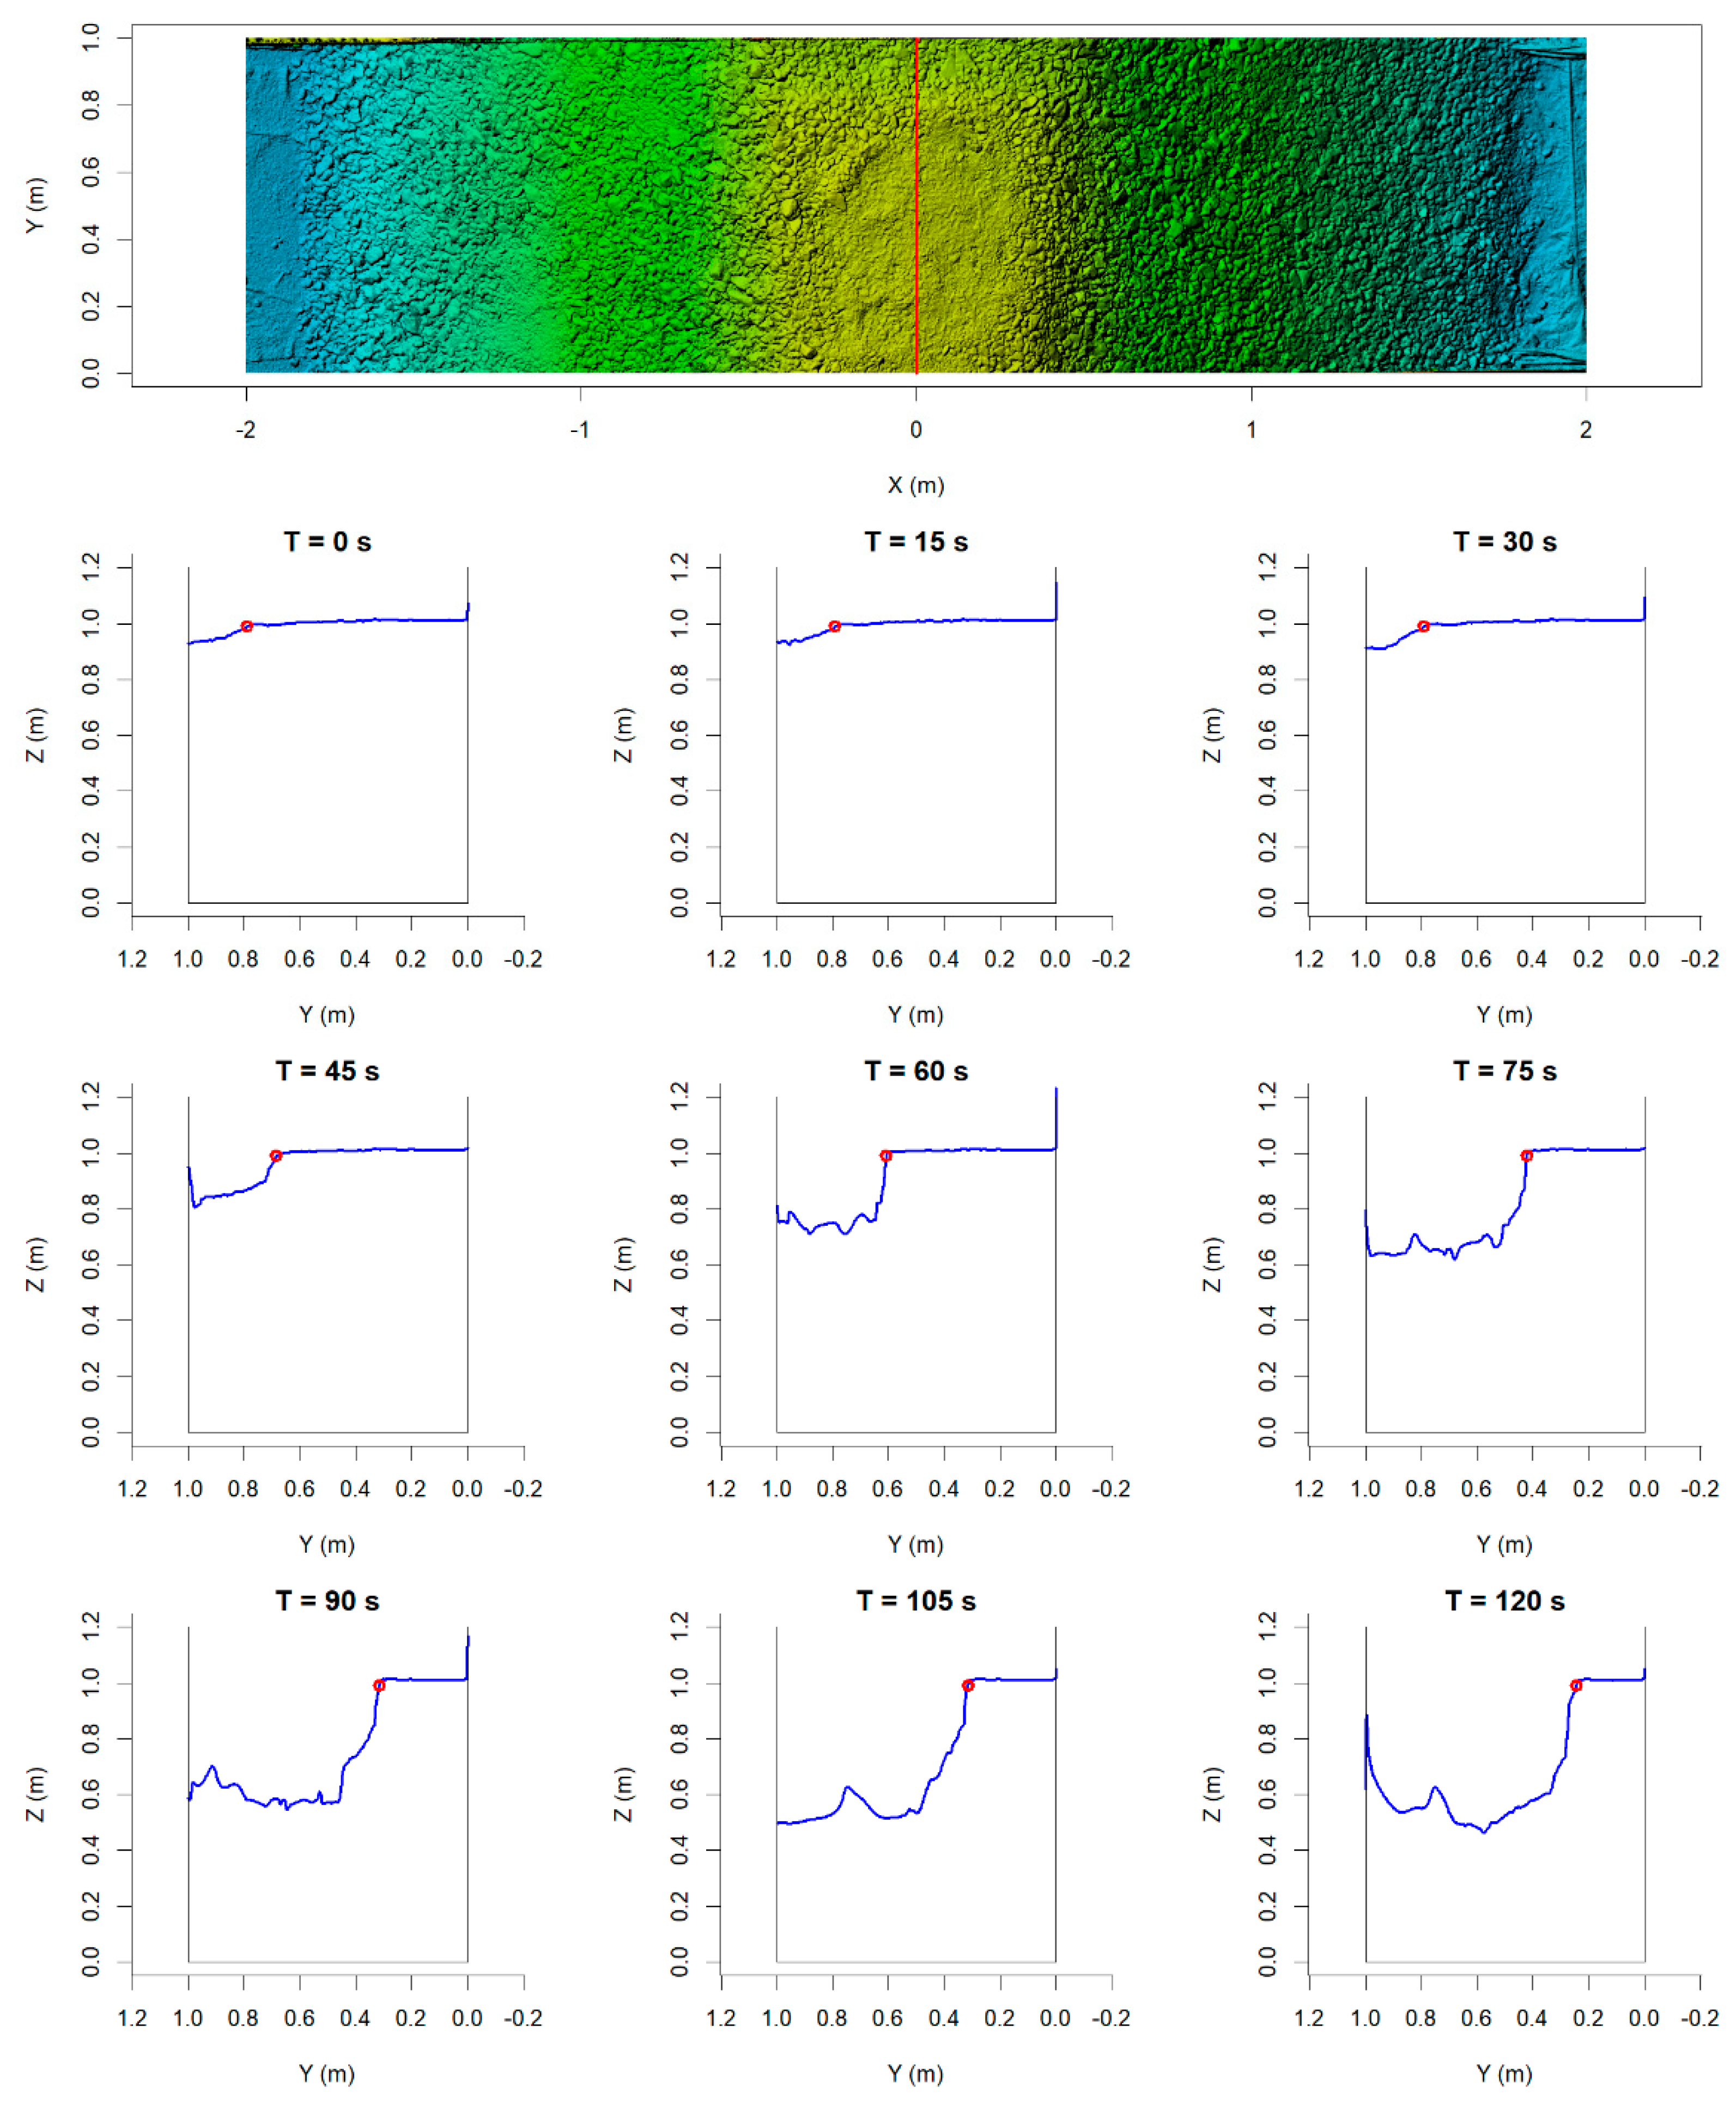
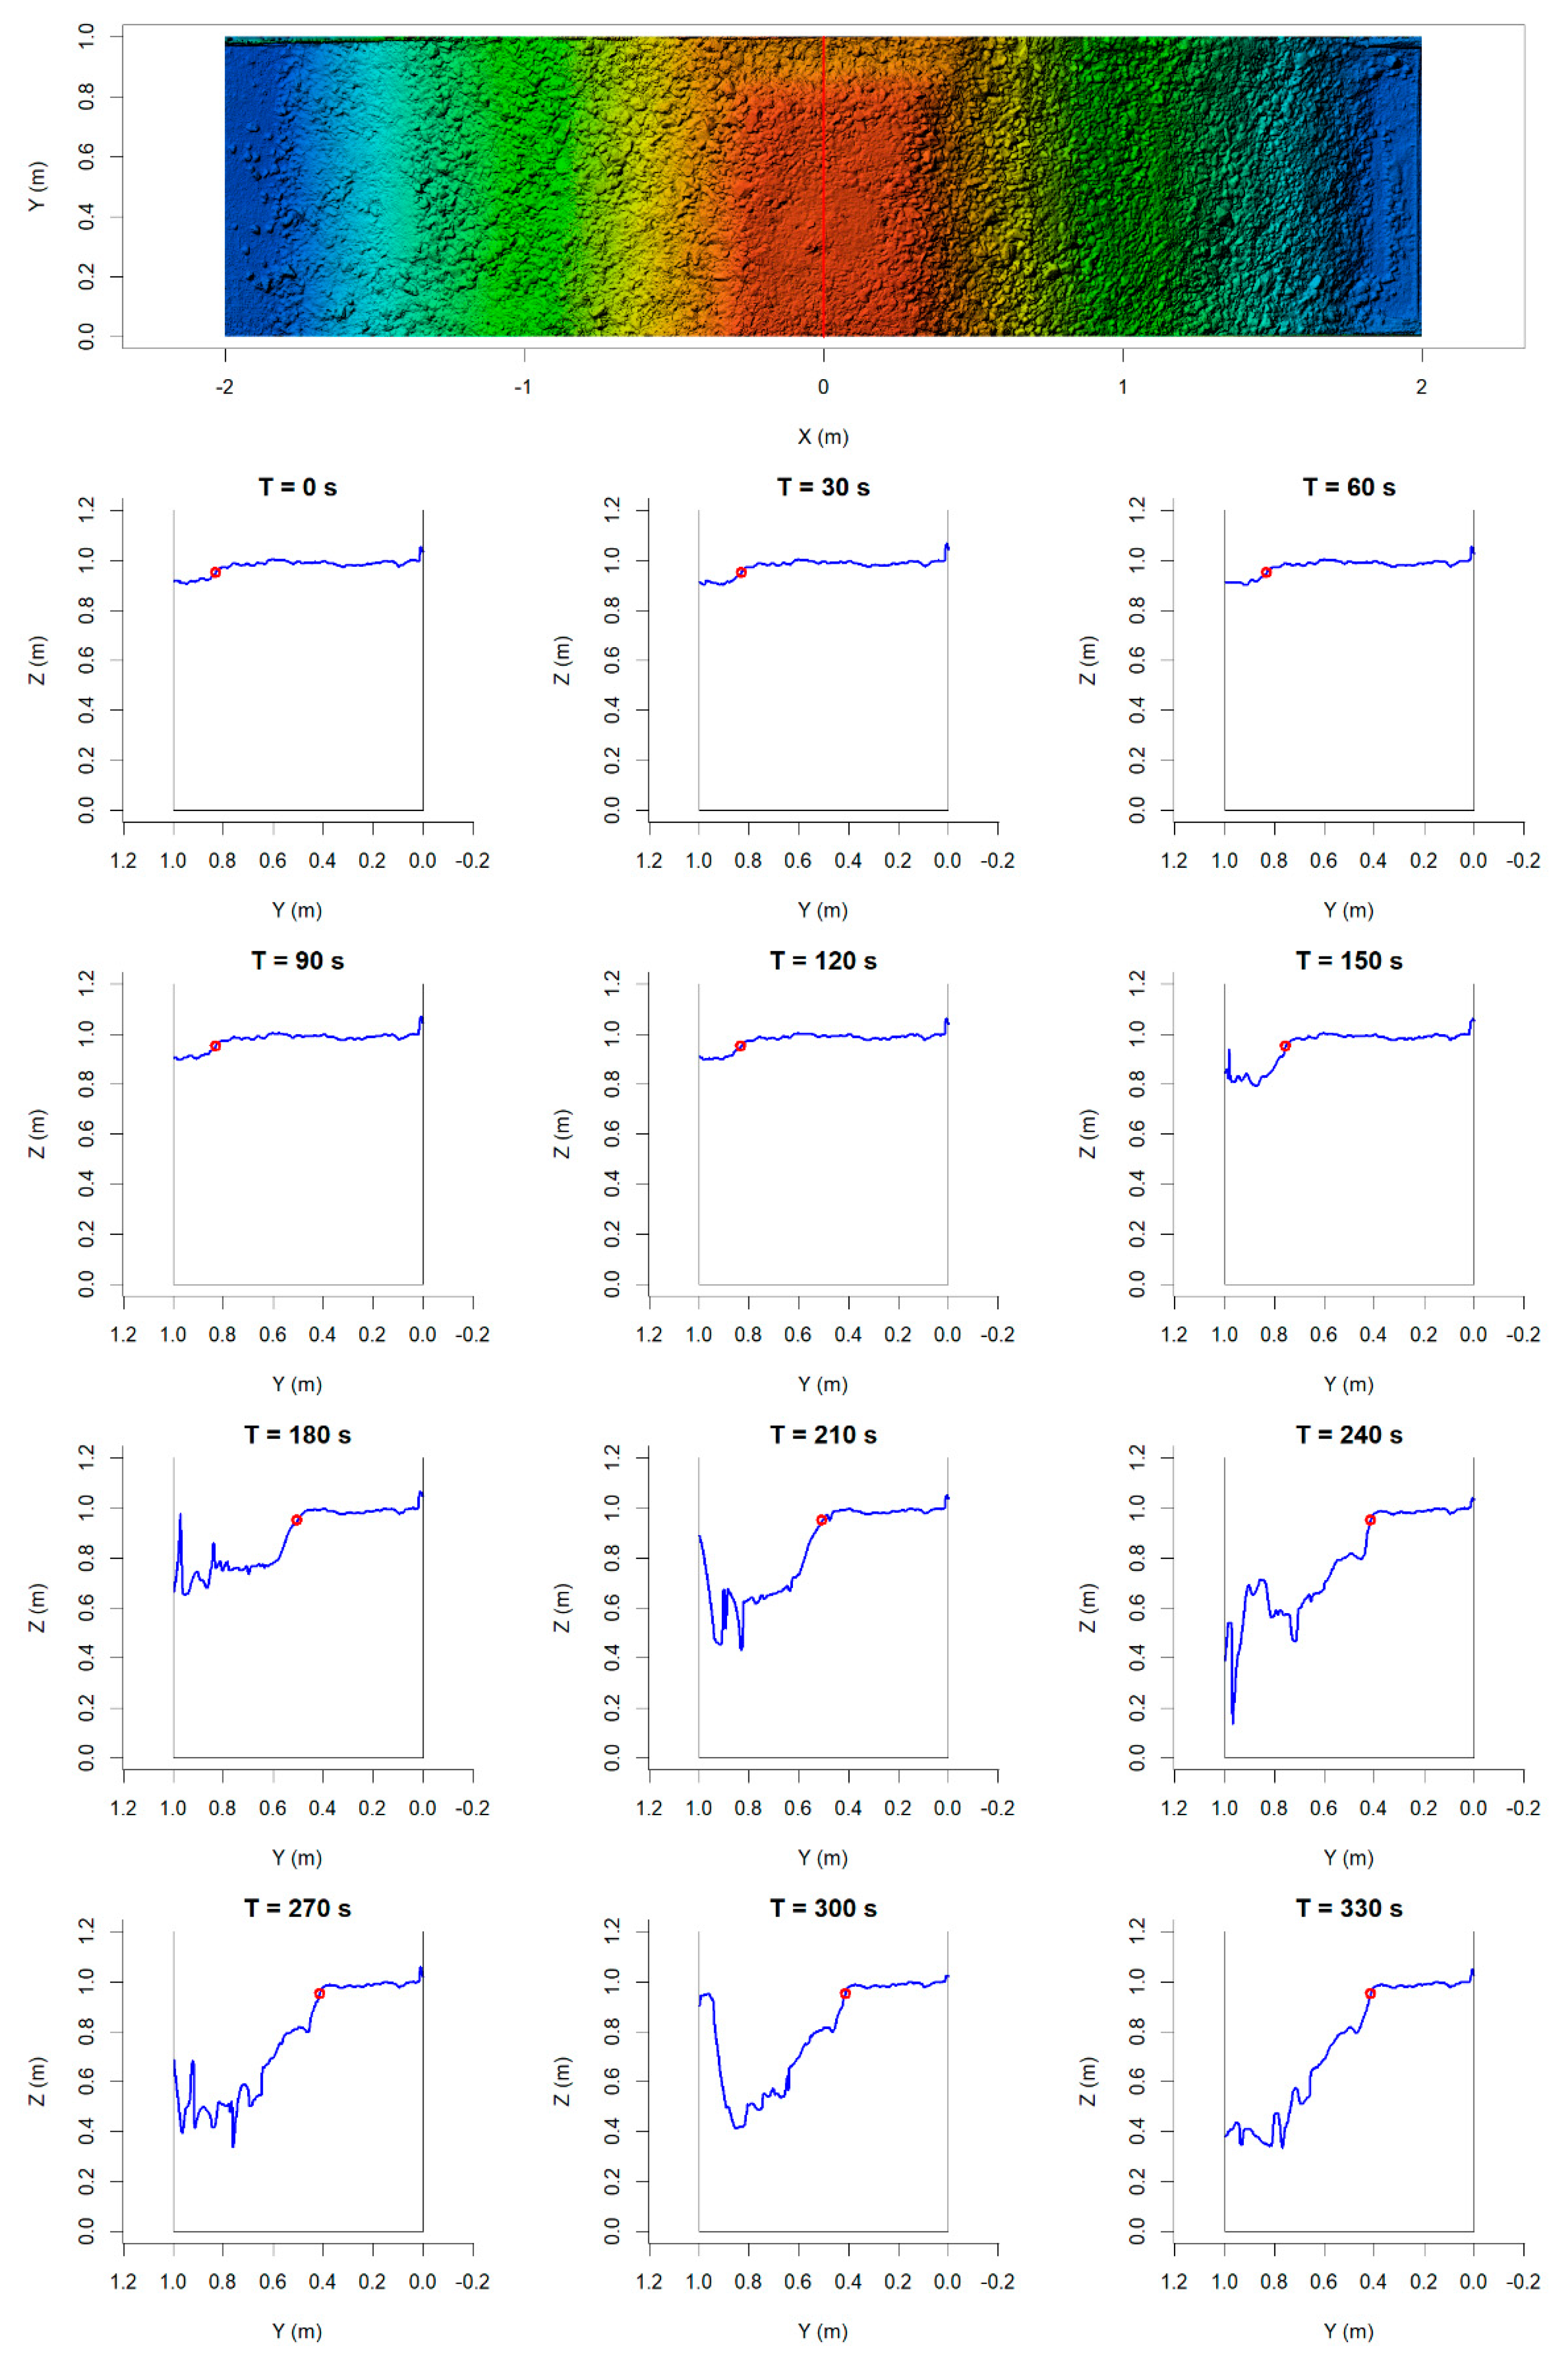
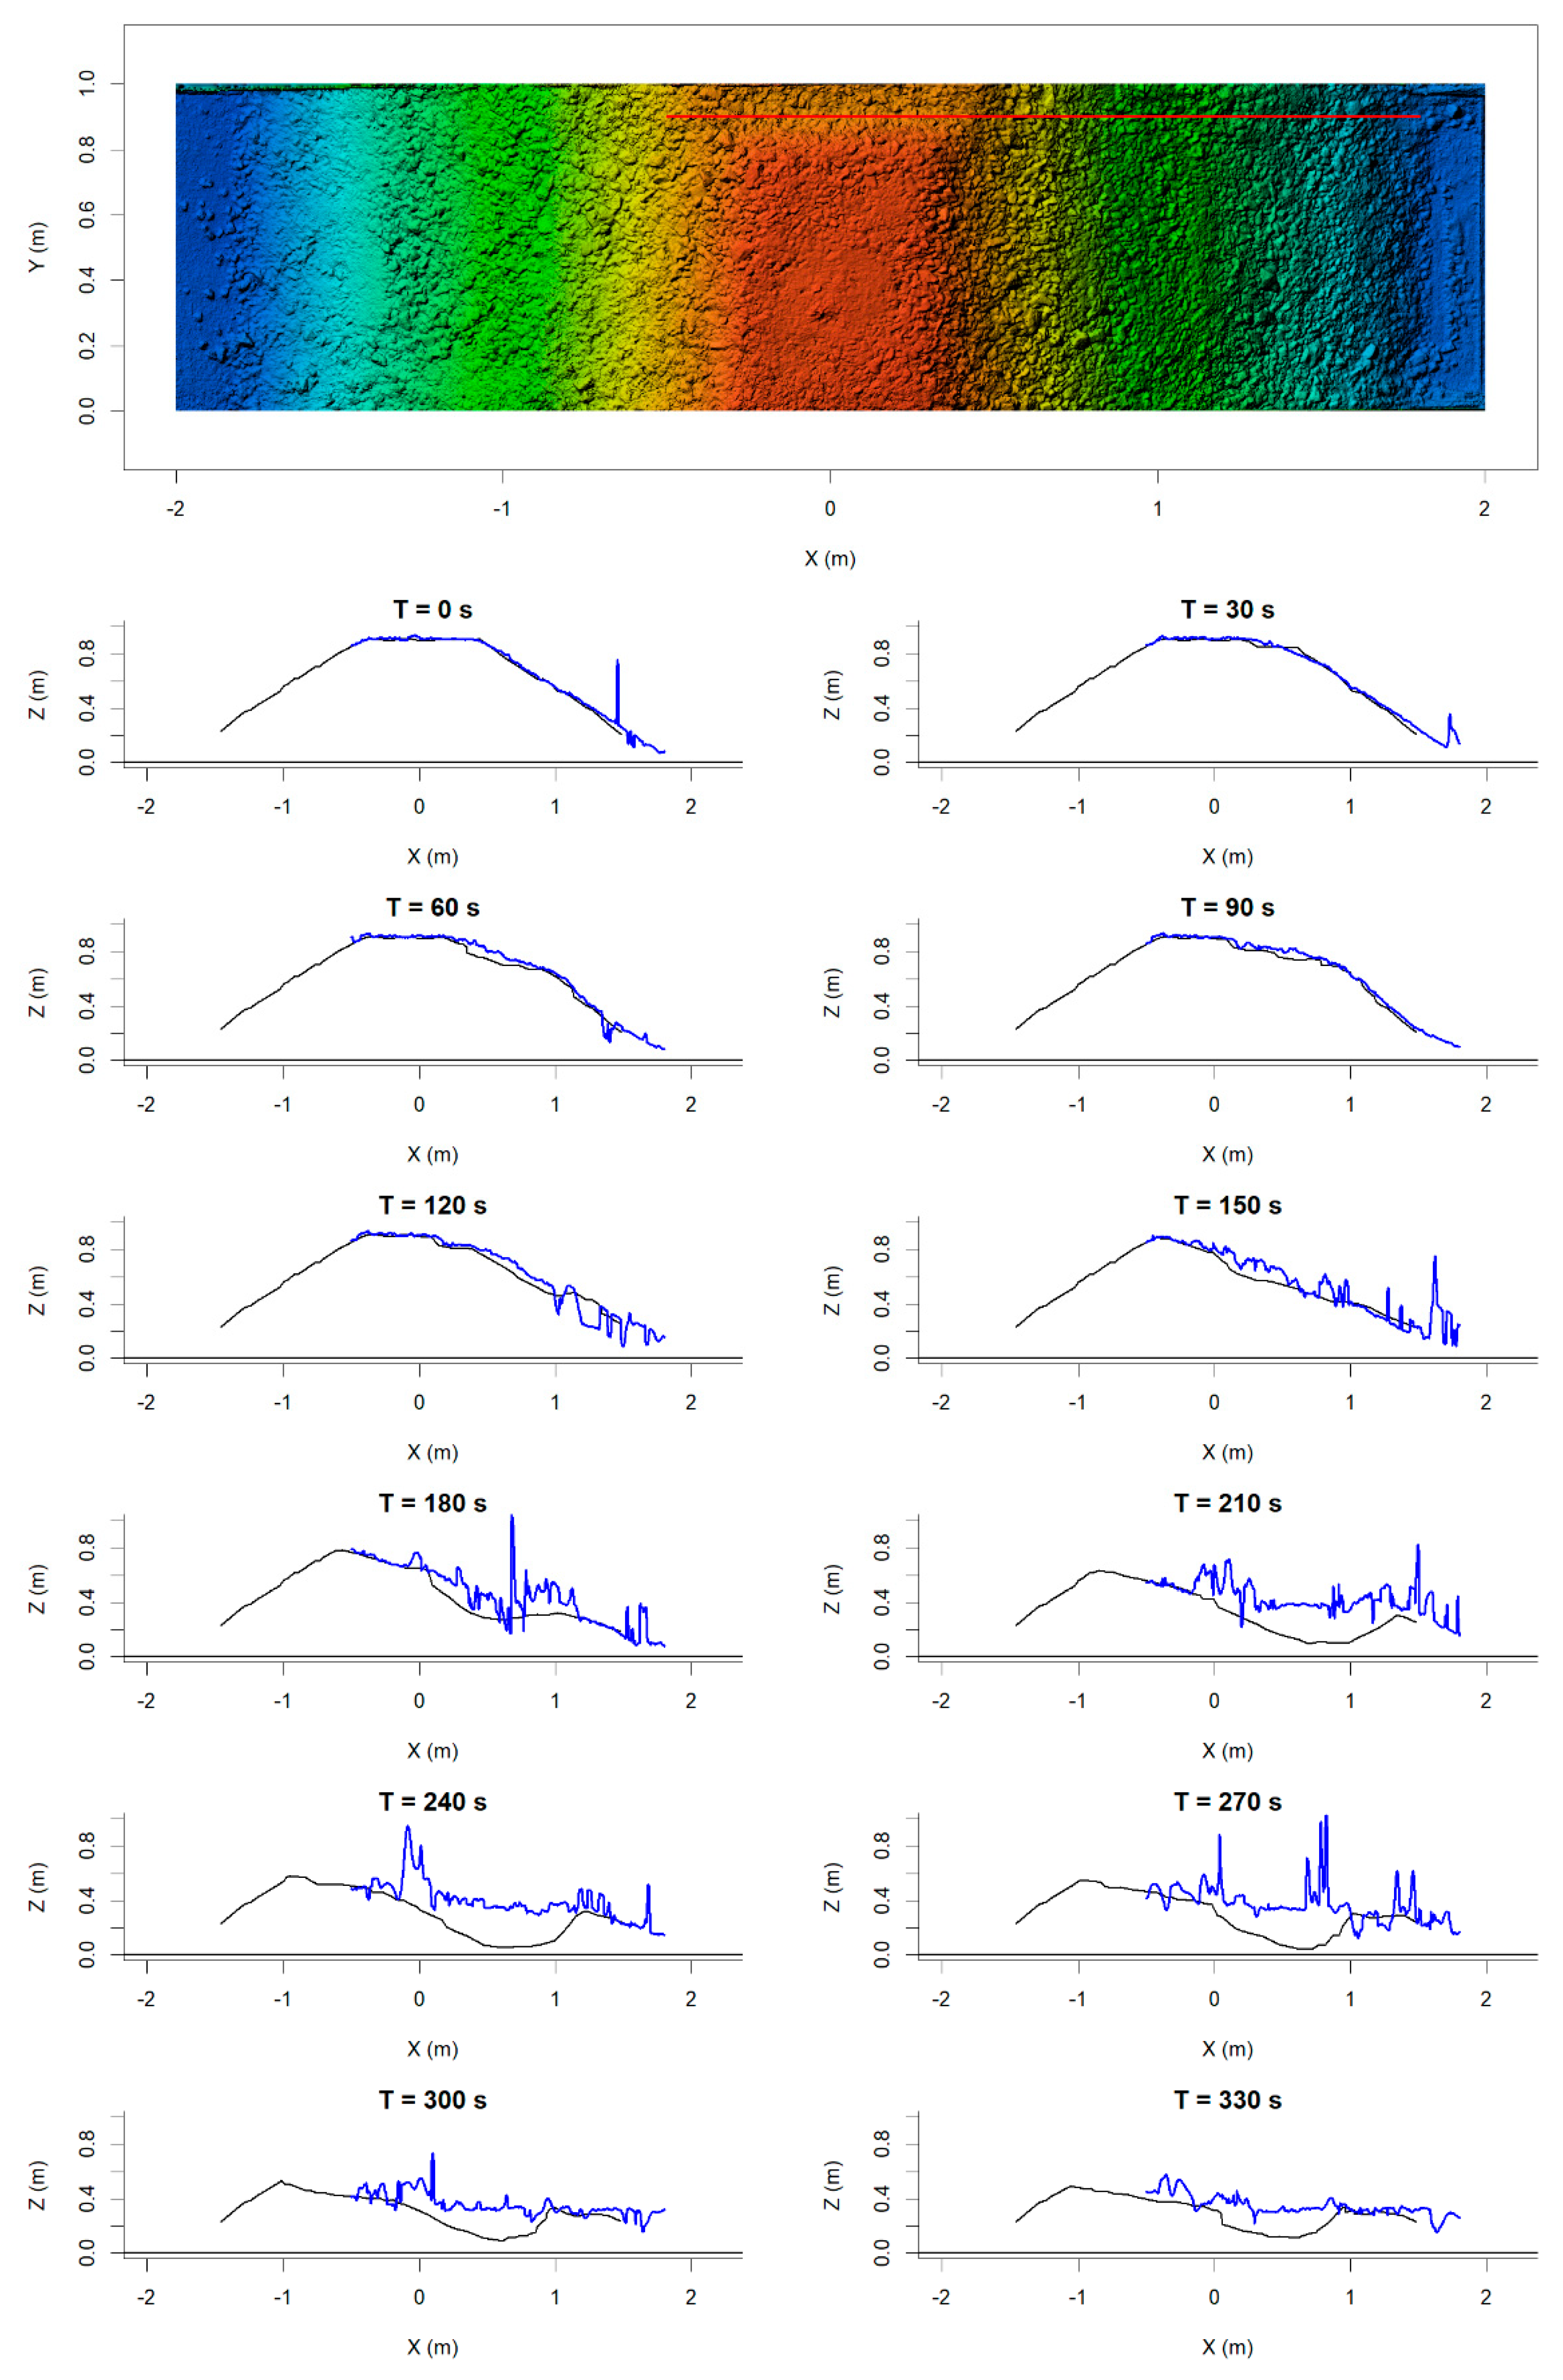
In the following section are examples of cross-sections across the flume and profiles for test U4. Timing is identical to that used for the side-view tracking in Figure 8, with T = 0 s being immediately before the first visually observed movement of material in the pilot channel. Figure 12 shows cross-section profiles through the flume at the dam’s centreline (X = 0 m) (longitudinal section of the dam). The outline of the flume is denoted with grey lines, i.e., the lines at Y = 0 and Y = 1.0 represent the flume wall, and Z = 0.0 represents the platform level (0.35 m above the flume bottom). The dam surface (at X = 0) is shown with a blue colour. At the top of Figure 12 is a plot of the DEM with a hillshading of the dam and a red line indicating the cross-section location at X = 0. In the DEM on Figure 12, the blue colour represents surfaces at an elevation around Z = 0, while the red-orange colour (e.g., at X = 0) represents surface elevation around Z = 1. Such profiles of all the tested dams can be found in Appendix A. Figure 13 shows profiles along the flume parallel to the X-axis. The blue line indicates the dam surface as derived from the dynamic DEM at the time indicated (T = 0, T = 30, …, T = 330), the black line indicates the breach bottom as identified in the side-view tracking, as shown in Figure 8. Again, the red line on the DEM indicates section location, here at Y = 0.9 m.

3.3.2. Breach Edge Tracking

To quantify the lateral breach development (i.e., in the Y-direction) a simple algorithm was created and employed to track the top edge of the breach opening as it moves from the pilot channel towards the back wall; this follows a point along the Y-axis somewhere in the interval Z = 0.95 m to Z = 0.98 m, and the elevation of the tracked point was chosen individually for each test. This gives us the position of the breach edge every 5 s throughout the entire breaching process. This analysis can be performed for any cross-section of the dam, but here, we have chosen to show results for the centre line profile, i.e., at X = 0.
Figure 12 above shows profiles across the flume and also shows a red circle indicating the breach edge defined by the above-mentioned algorithm. The breach edge tracking was further analysed to estimate the lateral breach erosion rate.
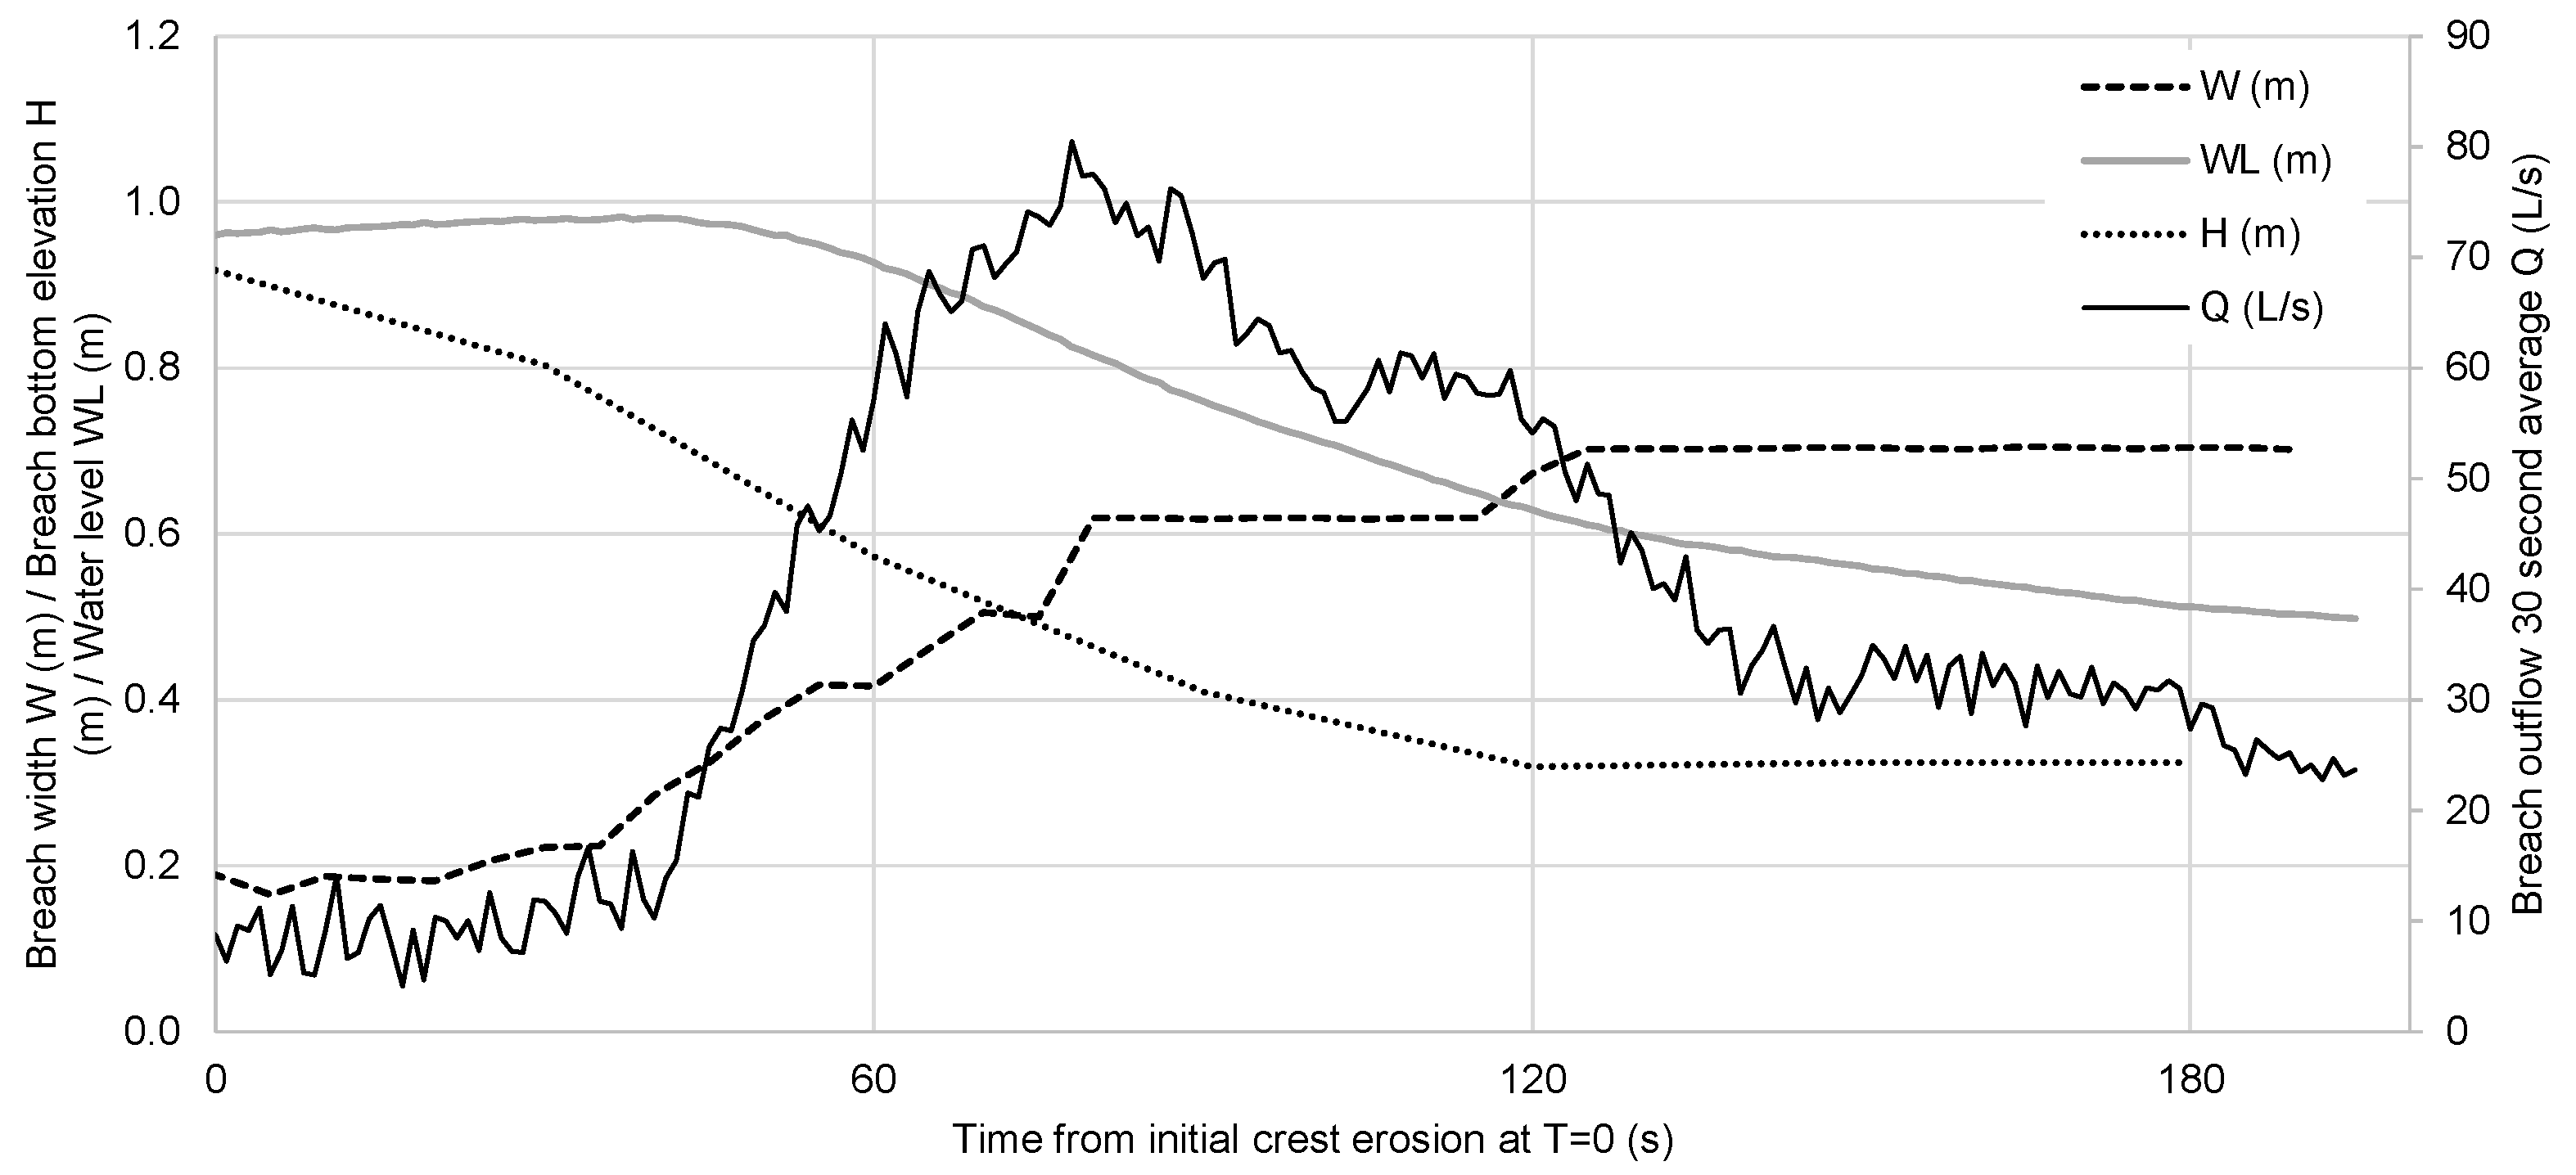
Figure 14 and Figure 15 below show the lateral and vertical breach development, respectively, for tests U4 and H1 plotted against upstream water level and calculated breach discharge. W is the breach width calculated as the distance between the flume glass wall and the top of the breach edge, H is the Z coordinate of the breach bottom as seen from the side, WL is the measured upstream water level and Q is the calculated breach outflow discharge. Note that breach outflow also includes some leakage flow as well as some flow through the crest above the impermeable core when the water level is above the core level.
The breach outflow in Figure 15 and Figure 16 was calculated based on measured flume inflow and measured upstream water level. For plotting and further usage breach outflow has been calculated on a one-second time resolution, as this will show significant fluctuations due to fluctuations in the upstream water level moving averages have also been calculated. The plots show a 30 s moving average calculated breach outflow.
A clear pattern can be noted from joint observation of the breach edge in Figure 12 and the breach width in Figure 14. The breach edge moves laterally out from the pilot channel (Figure 12) and the breach width increases (Figure 14). The lateral movement of the breach edge (and widening of the breach) occurs in discrete increments, as seen by the plot of W in Figure 14. Each incremental widening is followed by a fairly steady state during which gradual erosion of the channel bottom occurs. This erosion results in the undercutting of the side slope, which then slides down and increases the breach width further. This erosion process is repeated in discrete events.
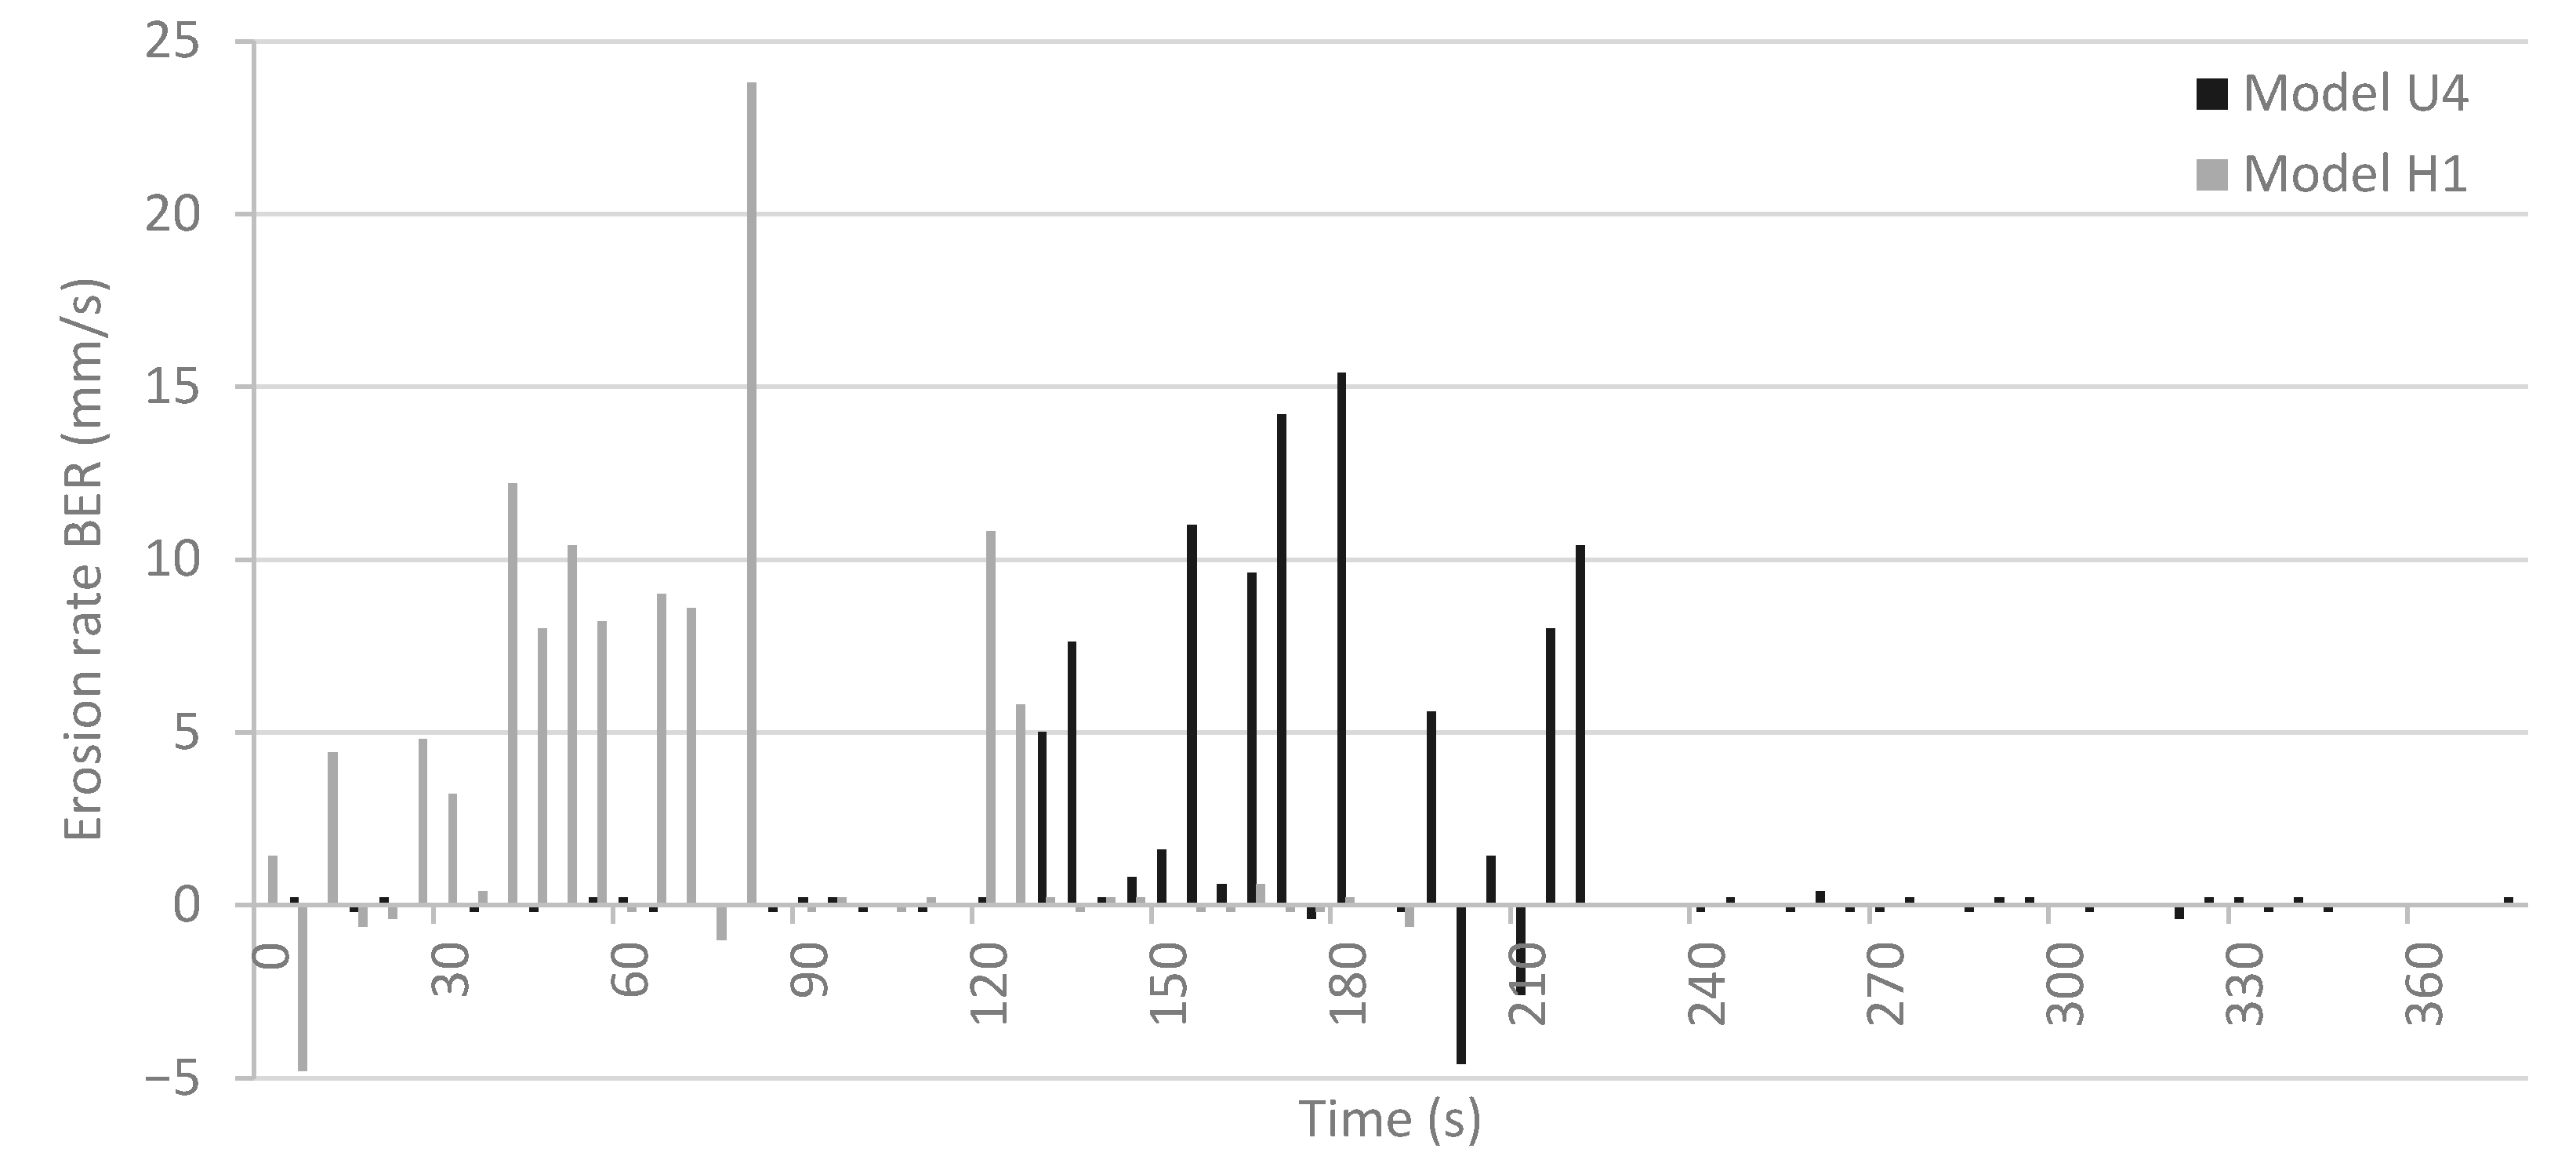
For all the tests, we have calculated the rate with which the breach opening expands, the lateral erosion rate, for both 5 s and 30 s intervals, as well as the average over the period from the time the breach expands outside the pilot channel until the breach expansion stops. Figure 16 shows the calculated 5 s erosion rates for tests U4 and H1. In some cases, small slides occurred some minutes after the main breaching process was over, and these were not considered part of the main breaching and were not included in the calculation. The breach expansion rate is here defined as BER = Δ W Δ T [mm/s], where ΔW is change in breach width, and ΔT is the length of the time step that the breach width change is calculated for (here, 5 s). In a few time steps, there is a negative erosion rate, which is a result of a poorly resolved 3D model for that time step where the breach opening apparently jumps back; this could be filtered out by using longer time steps for the calculation.

3.3.3. Volume Change

The DEM generated for the various model tests can also be used for establishing the amount of material removed from the dam throughout the test. For each test, the DEM before the start and after the end of a test were compared, and the volume difference was calculated. The area considered is from X= −1.8 m to X = 1.8 m over the width of the flume; this corresponds to the entire footprint of the dam before the test. There will be a small volume of material that is displaced but only moved within the considered area, but this error is considered acceptable for the present use.
Here, we can see a clear correlation (R = 0.97 and 0.99) between volume difference and test discharge, clearly demonstrating how much inflow and/or reservoir volume affects breach development. Table 2 also shows breach formation time, which is the elapsed time from breach initiation (T = 0) to the end of the active erosion phase as described in the previous section. There is a much weaker correlation between breach time and inflow, indicating that there are multiple factors at play affecting the observed breach progression.
It should be noted that while the tests with a lower inflow ran over some time with very little additional erosion the high inflow tests were stopped while there was still some erosion and would probably have developed further. The focus of these tests was the main breach event and not the quasi-steady state erosion that could be observed after the reservoir had emptied and the breach bottom stabilised.

3.4. Dynamic DEM Validation

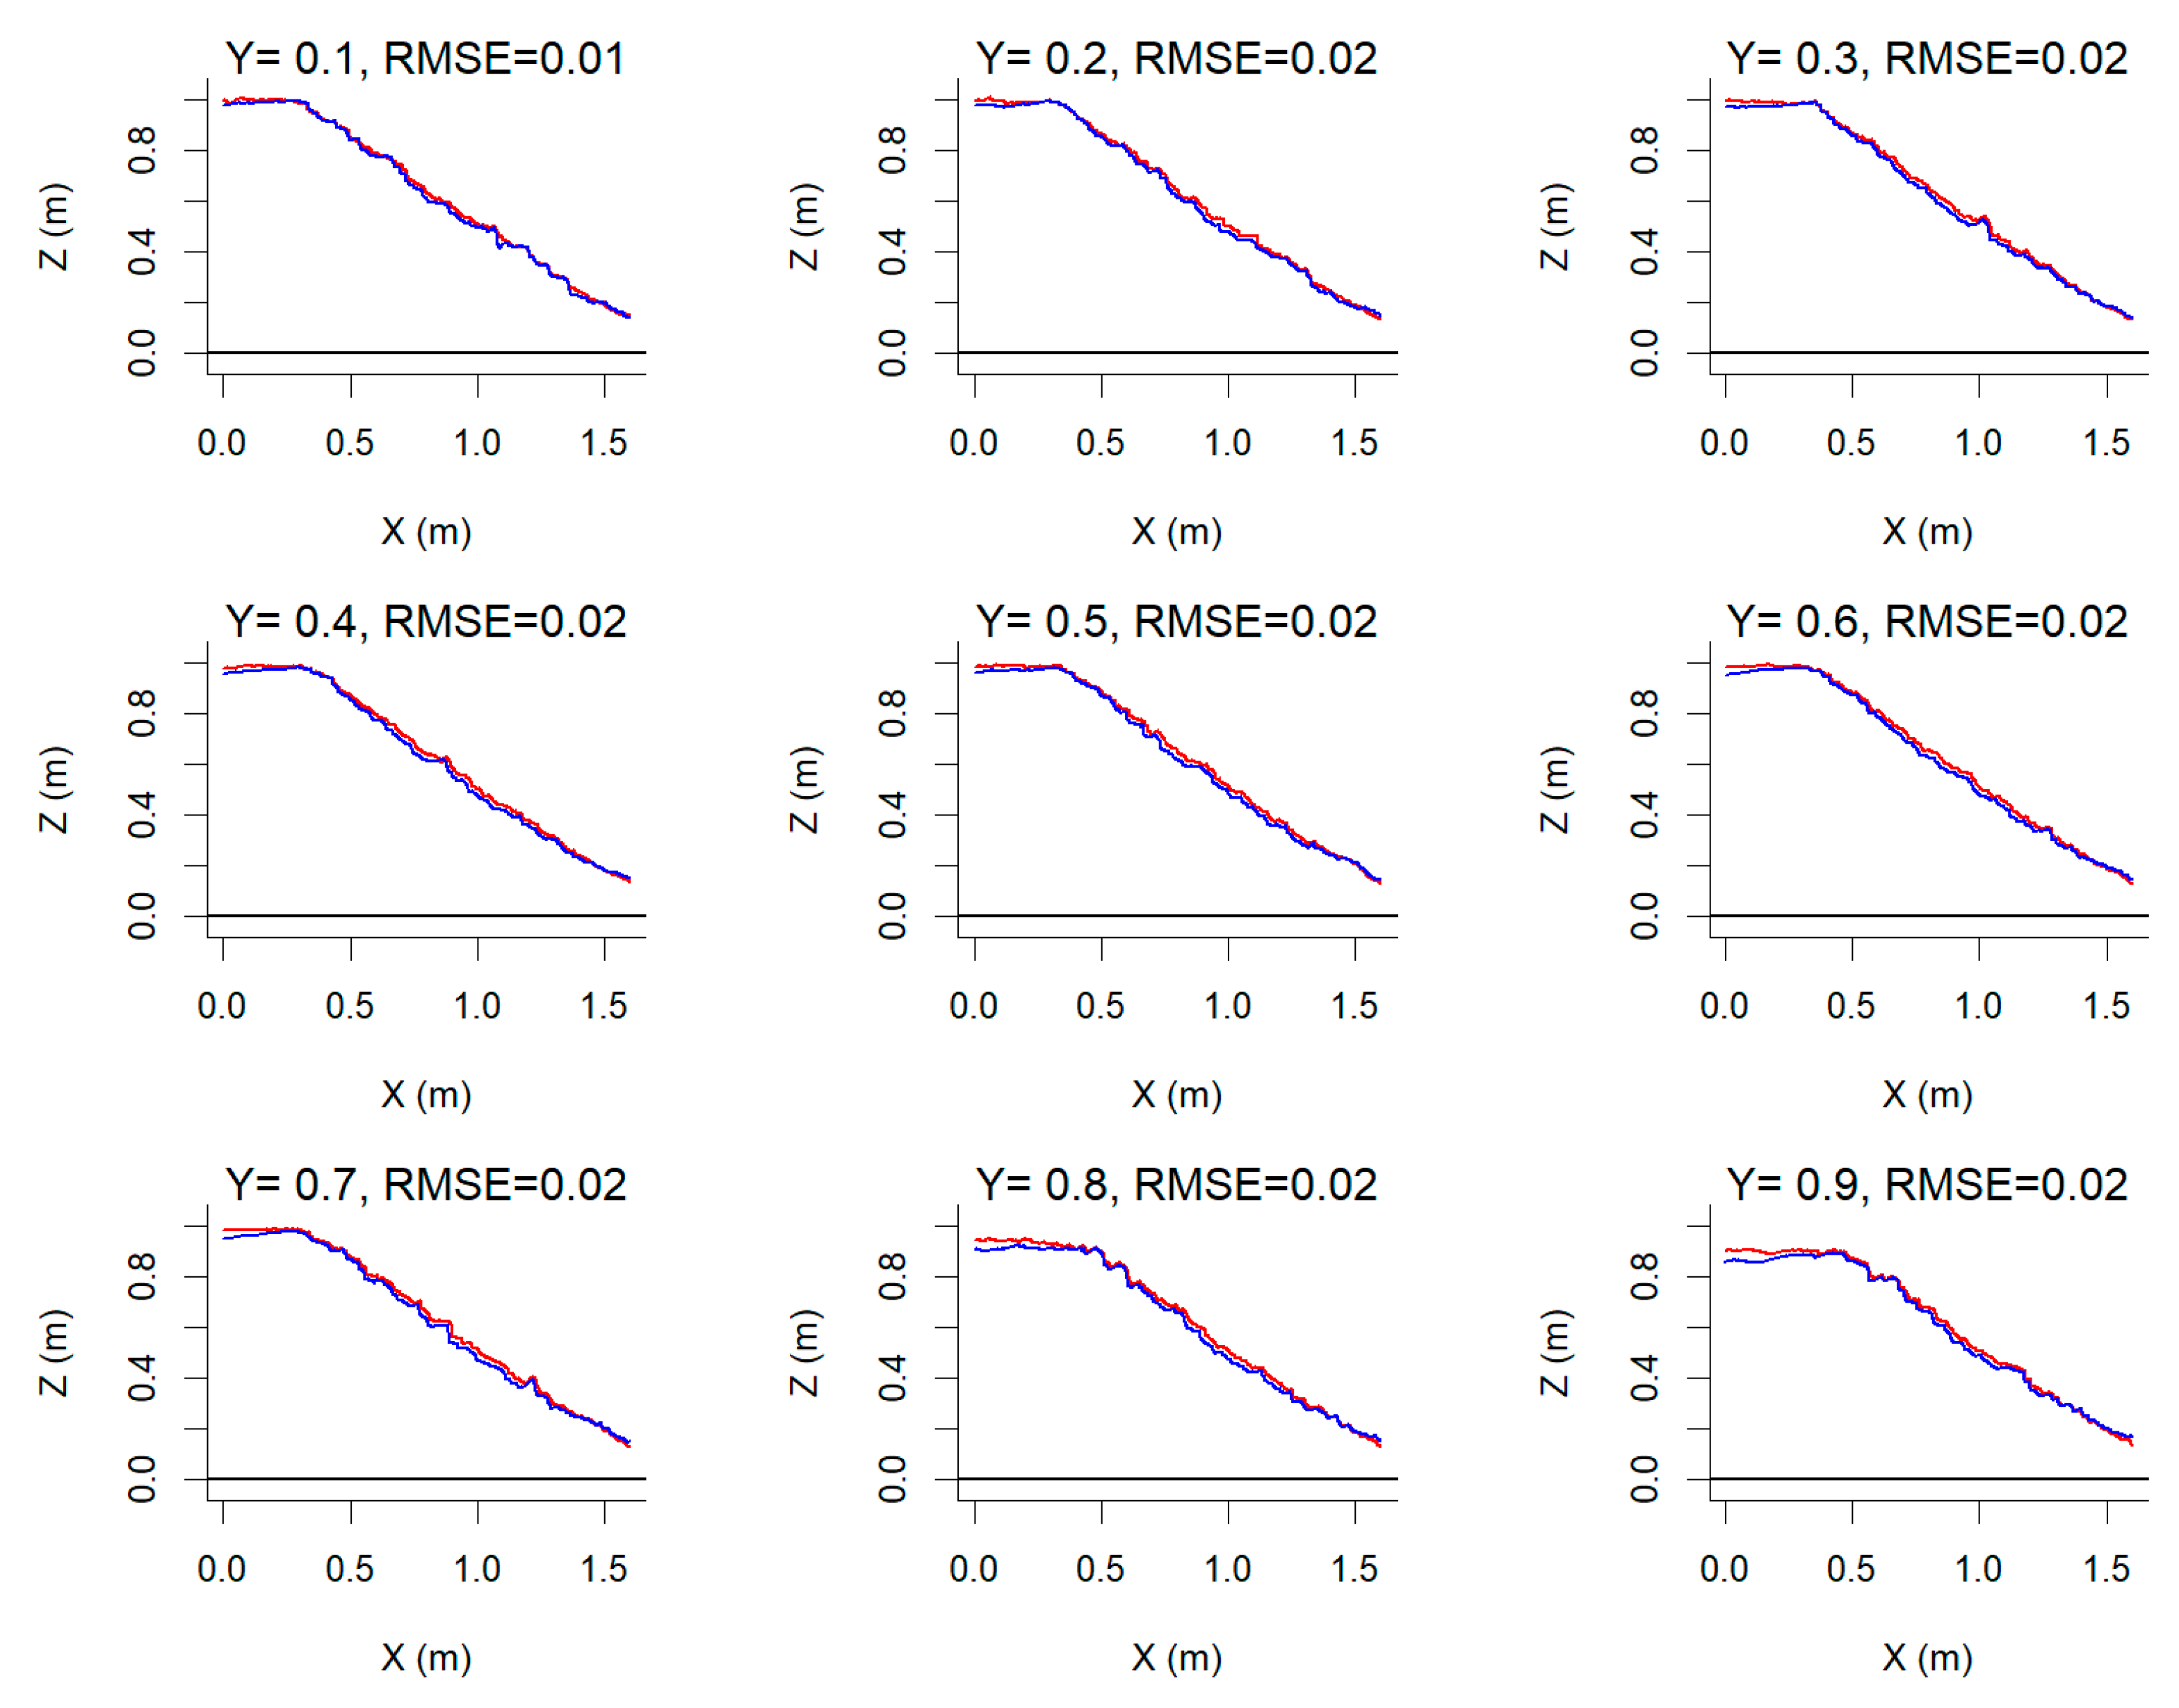
To verify the validity of the low-resolution dynamic DEM, the dynamic DEM for the first frame was compared with the high-resolution/accuracy pre-test DEM. The accuracy of the high-resolution DEM was checked by the use of scale bars placed around the model on the flume walls; for the first three tests, just a single scale bar of 1 m length was used for checking; for the remaining tests, four additional scale bars of 0.2 m length were placed around the model. The total error from check scale bars was 3 to 6 mm for tests U1 to U3, and for the remaining tests, the total error was from 0.9 mm to 1.9 mm. Scale bars could not be used directly to verify the accuracy of the dynamic models since they were either not visible or very poorly resolved in the video images due to the viewing angle. This indicates that the 3D models developed from images captured before and after testing are sufficiently accurate for the purpose, and the data are not millimetre precise, but that is not required. The comparison between dynamic DEM and high-resolution DEM was performed by evaluating nine longitudinal profiles every 0.1 m across the dam, Root Mean Square Error (or Root Mean Square Deviation) was calculated for each profile with one data point every 1 mm. The RMSE is calculated by the following formula.
RMSE = 1 n i = 1 n ( Z A , i Z B , i ) 2
where n is the number of points, here 1 point per mm, ZA is dynamic DEM elevation and ZB is the start DEM elevation. These profiles and the resulting calculated RMSE are shown in Figure 17 and Figure 18 for tests U1 and U4, respectively.

4. Discussion

4.1. Advantages and Limitations of Photogrammetric Methods

Photogrammetry and the construction of dynamic 3D models/Digital Elevation Models (DEM), as in the present study, provide new possibilities for analysis of the breaching process both in the laboratory and on field sites. For instance, tracing of the lateral breach development at different places within the dam was performed automatically from the dynamic DEM models using a simple programming routine (see Figure 14 and Figure 15). Furthermore, cross-sectional and longitudinal profiles are easily extracted for further analyses (see Figure 12 and Figure 13). Similarly, the volume change can be easily calculated from the 3D models before and after the overtopping event. The perhaps greatest advantage of this method is that these kinds of detailed geometric data can be extracted for a great number of points in time and with time resolutions even finer than the 5 s used here; if that is needed to accurately describe the process being studied, this is only limited by imaging frame rate, the precision of camera synchronisation and available processing power.
The validation shown in the previous chapter provided evidence that the lower accuracy DEM generated from a small number of images (two cameras for test U1 and five cameras for test U4) extracted from video files does not significantly deviate from the more accurate high-resolution DEM generated from a much larger number of images taken before the test with a DSLR camera with significantly higher resolution than that of the video files. Some systematic deviation can be observed towards the upstream edge of the model for test U1 and towards the toe of the downstream slope for model U4. This leads to the conclusion that this method provides geometric data of acceptable quality for the purposes. Nevertheless, care must be taken, especially when using data near the edges of the model, there is also still significant room for optimisation of the photogrammetric setup.
There are certain limitations to photogrammetric methods such as that described here. (1) Observations through water are not reliable and become impossible once the water becomes turbid; this means that breach bottom development, especially in the downstream part of the breach, cannot be observed using these methods. There are methods for correcting for refraction through water, but those are not applicable to this kind of situation, and no attempt was made at this. (2) Photogrammetry requires significant overlap between images resulting in a need to optimise the number of cameras versus distance from object/optical resolution. The first tests of the present study were performed with the cameras quite close to the model; however, this led to issues with insufficient image overlap and challenges with developing a complete 3D model incorporating data from all cameras. Thus, for later tests, cameras were moved further away from the model, losing some optical resolution but markedly improving the outputs of the photogrammetric processing.

4.2. Breaching Process Compared to the Literature

On the analysis results of the dams without core (H1 to H3), we observe that breach development from these tests follows well the pattern previously described on similar models with homogeneous well-graded rockfill, such as those described in [6,10,11] and many others. The primary initial erosion process observed is ‘mass sliding’ since the downstream slope is steeper than the slope where ‘particle dragging’ dominates. Particle dragging occurs below a slope 1:Zdss, where Zdss varies between 2.0 to 2.5 [6], whereas these models had a Zdss of 1.5, where the steep slope means mass sliding dominates the erosion process.
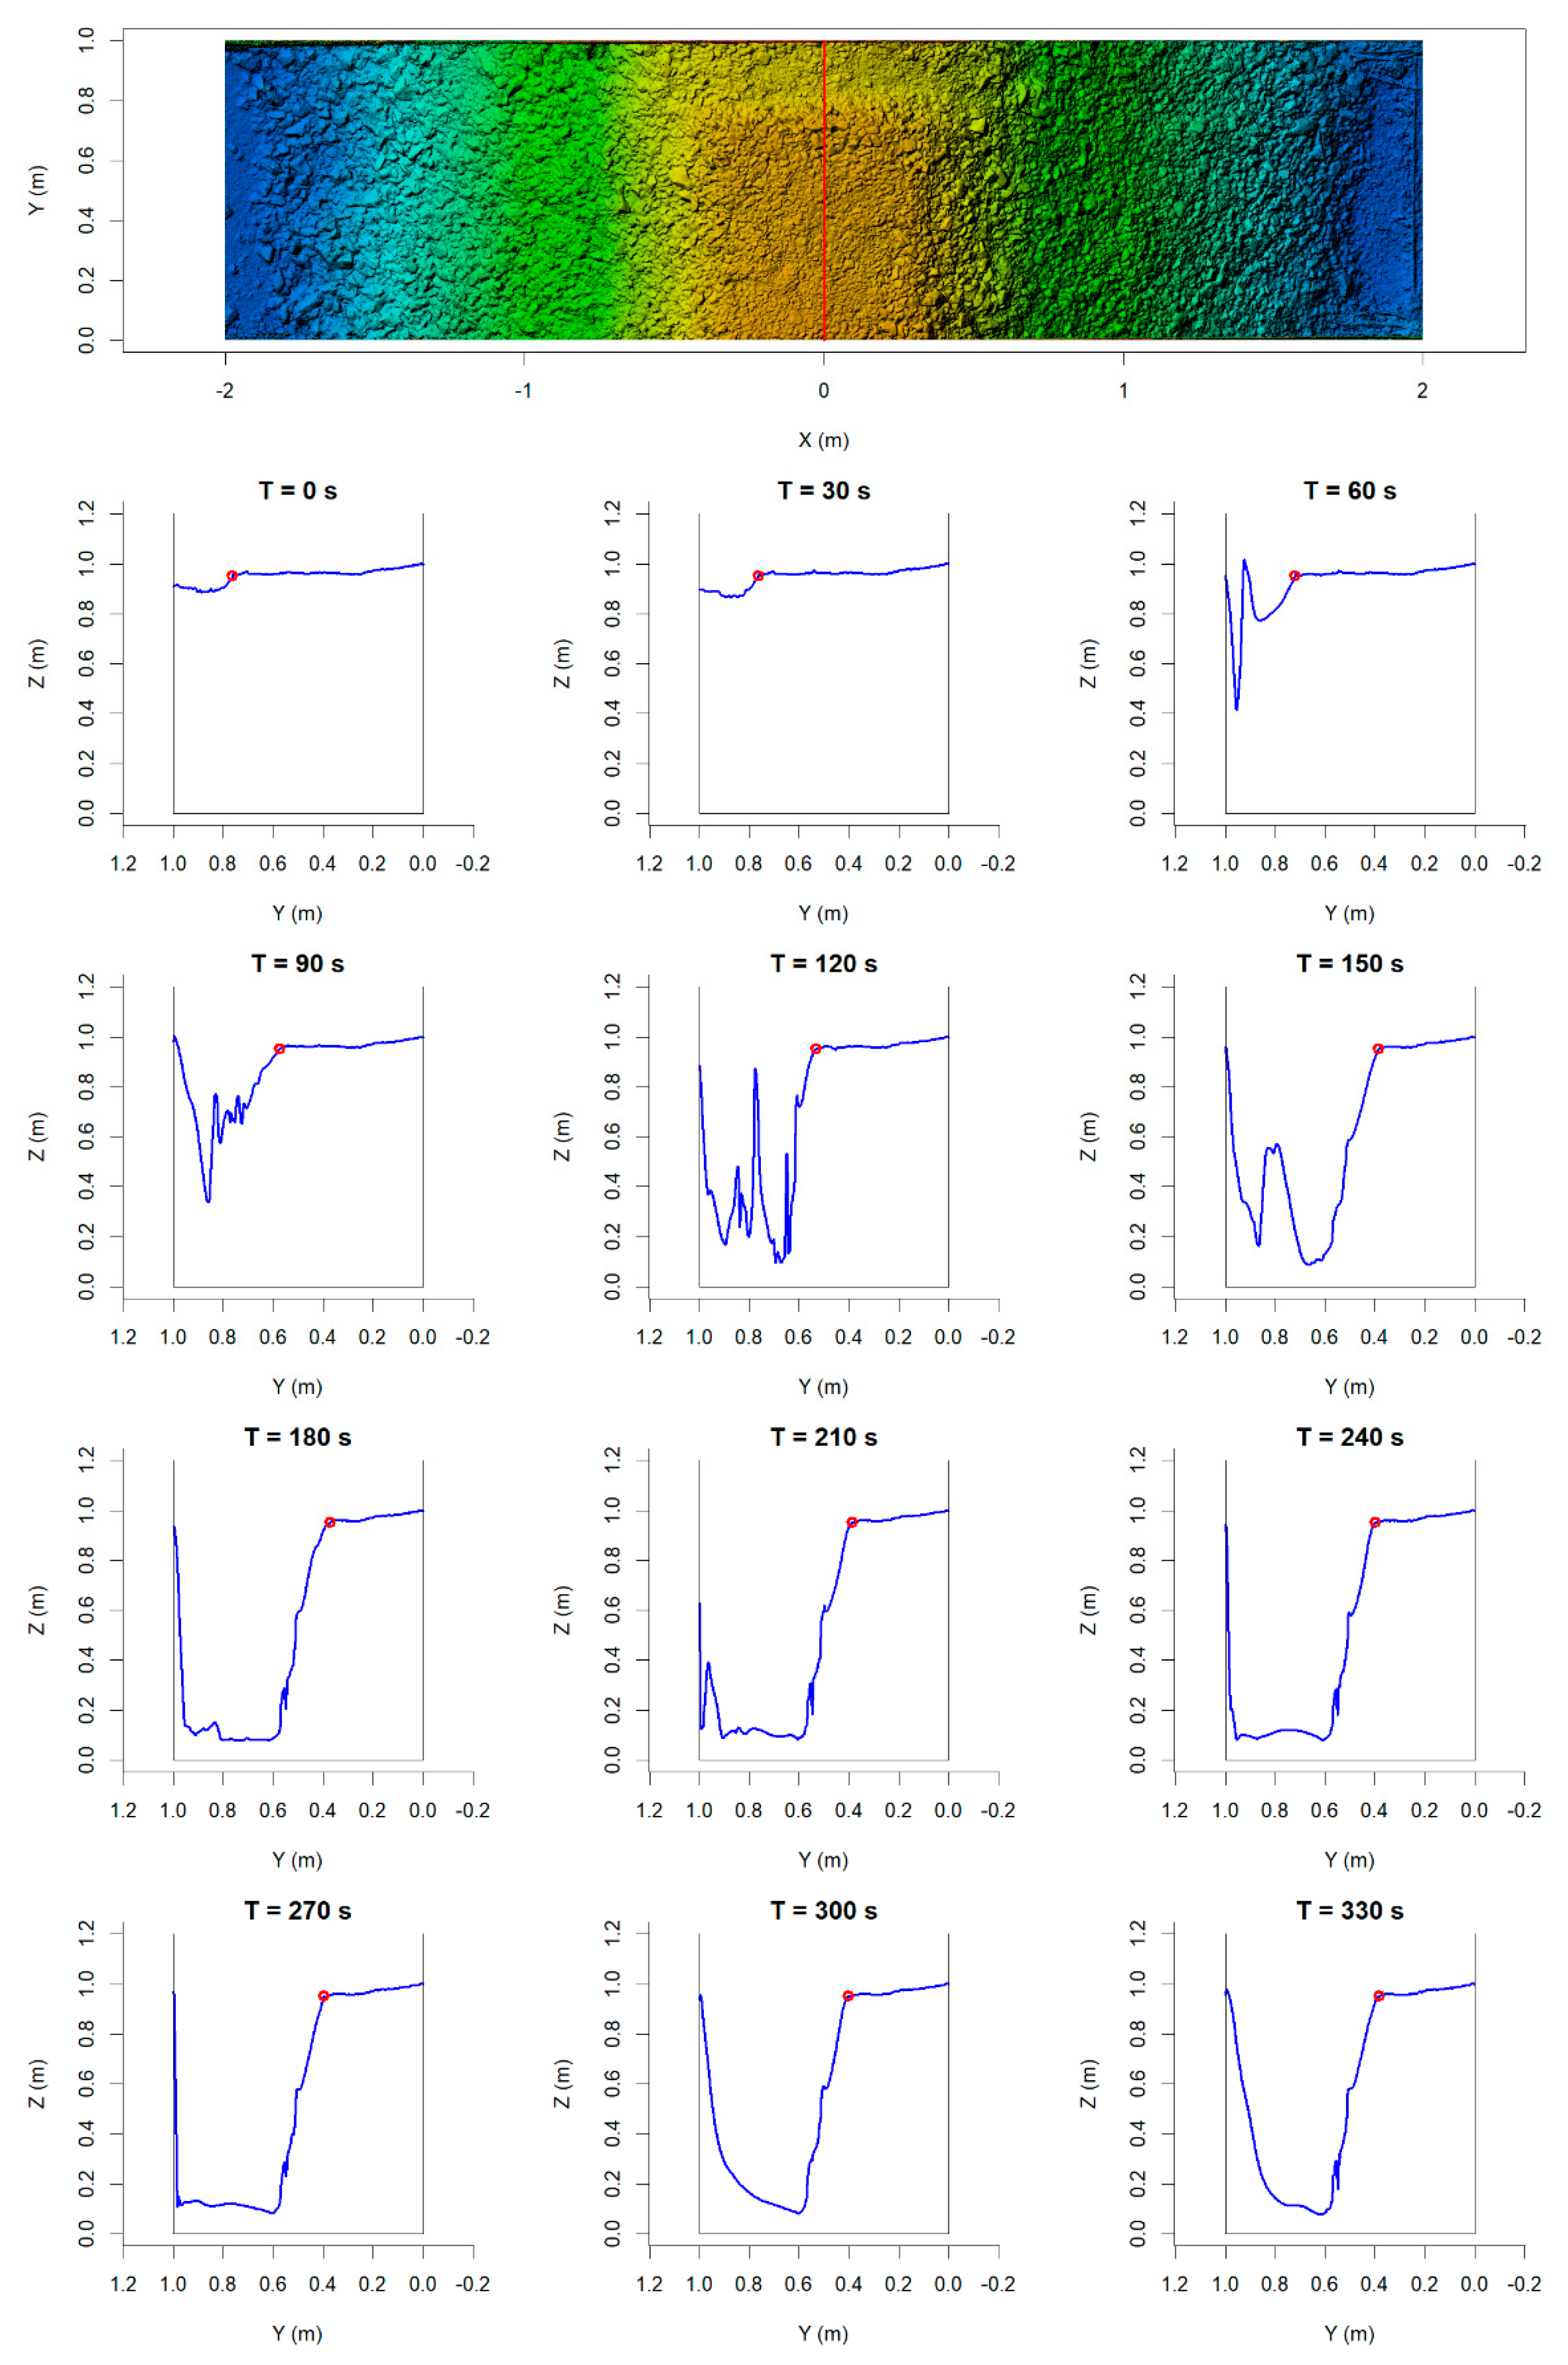
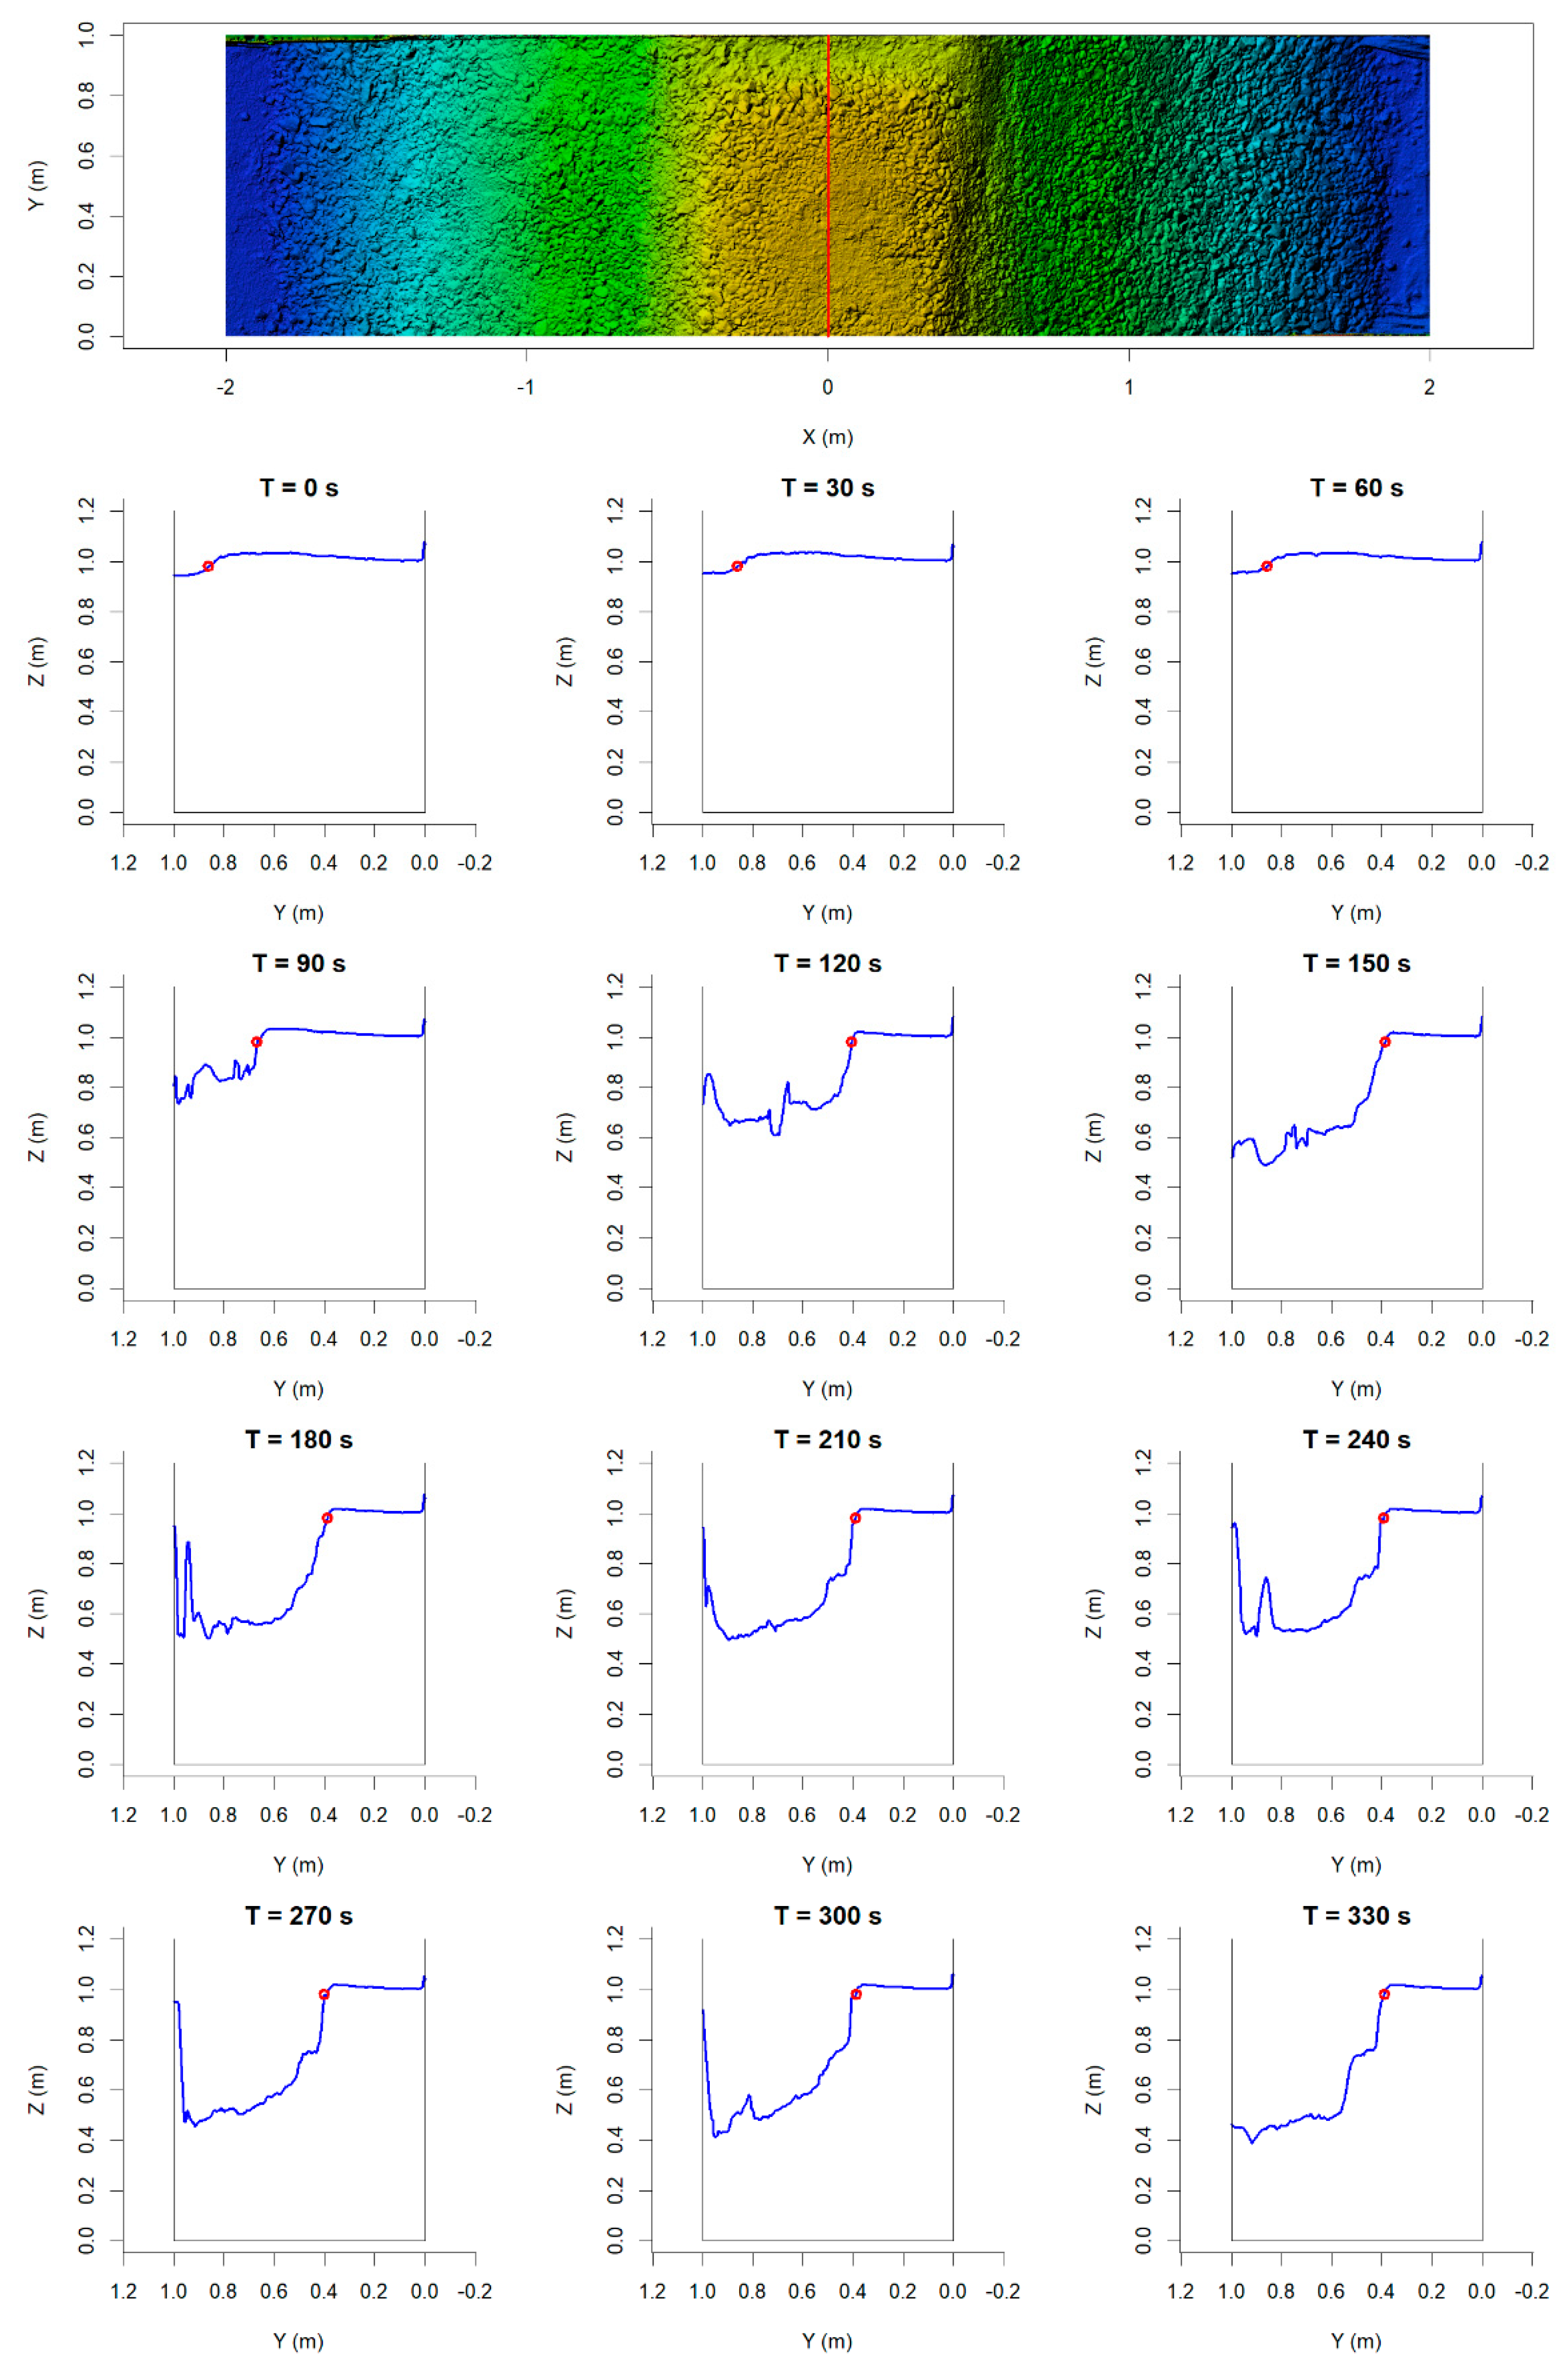
Most earlier model tests with an impermeable core have used either a central core of clay or moraine such as that described in [11,43] or an upstream sealing such as the paper and plastic membrane described in [44], with the latter behaving more similarly to dams without a core and the former showing a very different breaching process where the cohesive properties of the core material limits erosion until the downstream supporting fill is sufficiently eroded to allow for larger blocks of the core material to dislodge. The tests with a core described in this paper (Figure 8) behave quite similarly to the tests without a core (Figure 9) until the breach bottom at the core location reaches the top of the core. When this occurs, a scour hole starts to develop; furthermore, the core within the breach opening is gradually lowered as the core membrane loosens from the glass wall at one end. The top elevation of the core is not even after the loosening at the glass wall begins since the other end within the breach opening is embedded in the part of the dam that is unaffected by the breach. The closest comparison between a test with a core and without a core in this series can be found in Figure A5 (Model U5) and A6 (Model H1), both were tested at the same inflow discharge of 15 L/s.

4.3. Comparison between Models of the Present Study

Erosion rates for the different models have been summarised briefly in Table 3, showing the erosion rate in the centreline of the model with vertical erosion rate found from the side-view tracking and lateral erosion rate taken from dynamic DEM analyses. The vertical and lateral erosion rates appear to be quite similar in magnitude with the lateral erosion rate being on average somewhat larger, both in peak values and in average over the test. No very clear correlations can be seen between erosion rates and inflow or outflow but with a slight skew of higher erosion rates in tests with higher average inflow, which would seem reasonable, especially towards the end of the test when the reservoir is empty and breach outflow approximately equals inflow.

4.4. Limitation of the Breaching Results

The pilot channel was incorporated into the dam models to ensure the initiation of the breaching process along the glass wall to enable observation from the side. The initiation of breaching along the wall has some consequences for the applicability of the results. The breach development will be representative of a breach occurring along a structure such as a retaining wall adjacent to a spillway. It will, however, not fully represent conditions through the centre of a breach in an unconstrained part of the dam, as flow conditions in such a breach are not necessarily fully symmetrical. In addition, there is some wall friction affecting the flow. These drawbacks are, however, considered acceptable in this case. There are scale effects that limit the applicability of results from the present study, but none of the possible mitigating measures such as using lightweight materials or using a centrifuge were considered feasible for these tests. Additionally, the rubber sheet used as a water-tight element (the core) is not a scale model of any actual core element used in embankment dams. Finally, the breaching tests have a very small upstream reservoir resulting in a quick reservoir drawdown. This could have been counteracted by a water level-controlled inflow to the flume. However, such control was not possible with an acceptable level of accuracy with the current facilities. Thus, the inflow was kept constant throughout the tests.

4.5. Further Work

The pore pressure data that have been gathered have not been analysed here. Such observations are not essential to the understanding of the breaching process. It will, however, be of interest in future work analysing the stability and movement of the dam material. The pressure data from tests U1 to U5 (models with a rubber sheet core) compared well to previous tests presented in [26]. In [26], a detailed analysis of pore pressure distribution is presented on earlier models in this series of laboratory tests using the same materials and pore pressure measurement setup as in the present study.
The tests of the present study provide an extensive data set on breach development that can be of use for validation and calibration of empirical and numerical breach development models; work on comparing results using several existing models with observations from this series of tests is ongoing. Further work may include analyses of tests involving identical models but with added filter and riprap layers. The results from the present study provide a baseline for evaluating the effects of riprap on the breaching process, and further analysis on this is ongoing. The possibility of large-scale and prototype-scale tests is under consideration as a continuation of the current work and the methods described here are considered a quite robust and scalable alternative for such tests.

5. Conclusions

This article describes the results of eight laboratory tests breaching 1 m-high rockfill dam models, with and without a core. These tests were conducted over the period 2020 to 2022 in the hydraulic laboratories of the Norwegian University of Science and Technology (NTNU). The results from these tests provide a good indication that the photogrammetric methods described here for observing a rapidly changing geometry such as a dam breach provide data of a quality sufficient for these kinds of analyses. Furthermore, photogrammetry provides possibilities for observing the phenomena at work in greater detail and higher time resolution compared to post-breach analyses or 2D breach observation of past experimental studies.
The model tests described here for homogeneous rockfill dams show a breach development in line with what has been described in earlier research [7,8]. The tests on dams with a central breachable core showed a breach development quite similar to that for homogeneous dams without a core, while the breach bottom is positioned above the top of the core. However, influences from the core could be observed as the breach continued, such as with the development of a scour hole downstream. Data from these tests will be used for verification and calibration of both parametric models and more complicated numerical models.

Supplementary Materials

The following supporting information can be downloaded at: https://www.mdpi.com/article/10.3390/rs15061715/s1, Video S1: Breach of Model U4, Video S2: Breach of Model H1.

Author Contributions

Conceptualization, G.H.K., F.G.S. and L.L.; methodology, G.H.K. and F.G.S.; software, G.H.K.; validation, G.H.K.; formal analysis, G.H.K.; investigation, G.H.K.; resources, G.H.K. and F.G.S.; data curation, G.H.K.; writing—original draft preparation, G.H.K.; writing—review and editing, G.H.K., F.G.S. and L.L.; visualization, G.H.K.; supervision, F.G.S. and L.L.; project administration, F.G.S.; funding acquisition, F.G.S. All authors have read and agreed to the published version of the manuscript.

Funding

This research was financially supported by the Norwegian Research Council [grant number 257588], Norwegian Research Centre for Hydropower Technology (HydroCen), Work Package WP 1.2.

Data Availability Statement

The full data set is still undergoing analyses and further processing for further publication as indicated in the article. Once this is published, the full data set will also be made publicly available.

Acknowledgments

We would like to thank the former MSc students (in chronological order of involvement) Styrmir Sigurjónsson, Ghaith Essam Alkholossi, Nisal Deelaka Halaba A. Senarathna, Saroj Sapkota and Raj Kumar KC for their participation in these model tests.

Conflicts of Interest

During the period this research was conducted as part of PhD studies, Geir Helge Kiplesund received stipends from the consulting company Multiconsult Norge AS and renewable energy industry organisation Energy Norway (now Renewables Norway), both are participating organisations in the HydroCen research centre. Mr Kiplesund was employed by Multiconsult Norge AS after concluding work at NTNU. The remaining authors declare no conflict of interest. The funders had no role in the design of the study; in the collection, analyses, or interpretation of data; in the writing of the manuscript; or in the decision to publish the results.

Nomenclature

The following symbols and acronyms are used in this paper:
BbBottom width of dam (fundamental units L)
BtTop width of dam (fundamental units L)
BERBreach expansion rate (fundamental units L·T−1)
CuCoefficient of uniformity, the ratio D60/D10 where D60 and D10 are the sieve sizes through which 60% and 10% of the material passes (dimensionless)
CVCoefficient of variation
D50Sieve size passing 50% of the particles (fundamental units L)
DEMDigital Elevation Model
DSMDigital Surface Model
gAcceleration of gravity (fundamental units L·T−2)
HdHeight of the dam (fundamental units L)
LLength, fundamental dimension
LdTransverse length of the embankment (fundamental units L)
MMass, fundamental dimension
MVSMulti View Stereo (photogrammetric method)
nPorosity (dimensionless)
QDischarge (fundamental units L3·T−1)
RCorrelation coefficient
RMSE Root mean square error
ρDensity (fundamental units M·L−3)
SFMStructure from Motion (photogrammetric method)
SPHSmoothed Particle Hydrodynamics (numerical simulation technique)
TTime, fundamental dimension
VVolume (fundamental units L3)
VdiffVolume difference (fundamental units L3)
WBreach top width (fundamental units L)
WLWater level (fundamental units L)
XCoordinate system axis (fundamental units L)
YCoordinate system axis (fundamental units L)
ZCoordinate system axis (fundamental units L)
ZdssSlope of the downstream rockfill shoulder (dimensionless)
ZussSlope of the upstream rockfill shoulder (dimensionless)

Appendix A

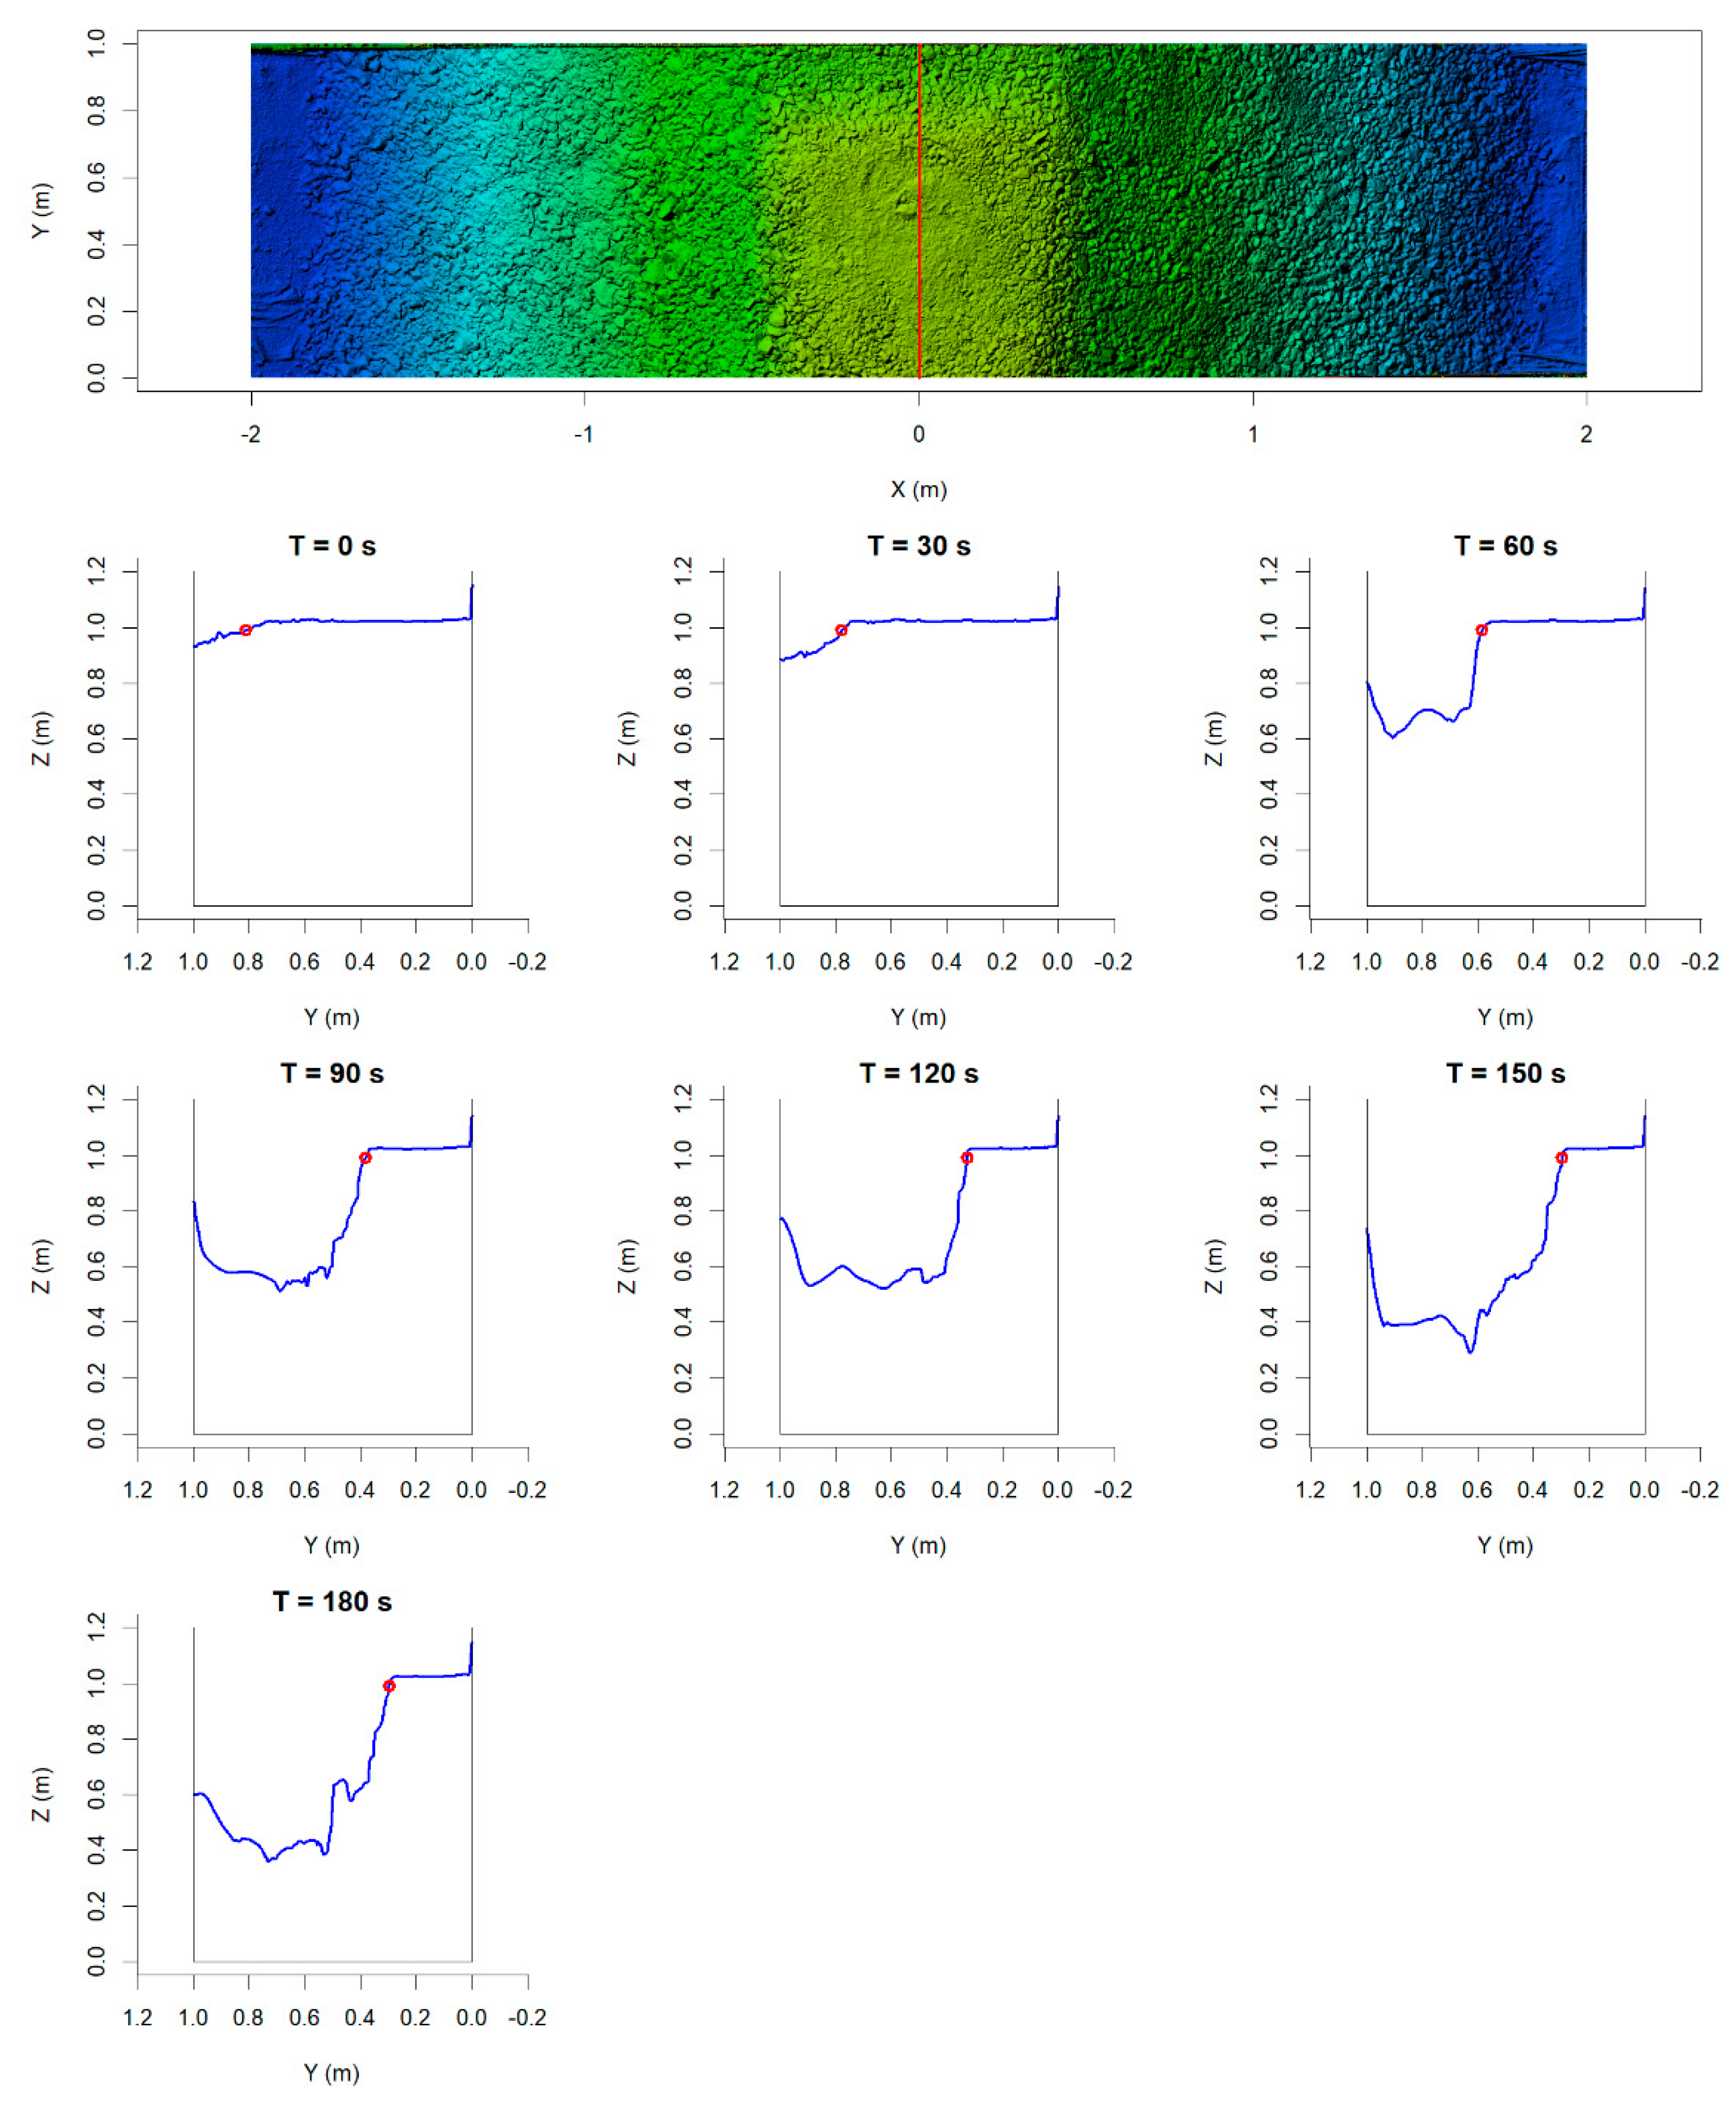
This appendix contains cross-section profiles for all the described tests. T = 0 s is defined as being at the frame immediately before initial observed erosion at the downstream edge of the pilot channel, thus between 0 and 5 s before the first movement. The red circle indicates the breach edge as used in further analyses.
Figure A1. Cross-section profiles for X = 0 m (centre line) extracted from U1 dynamic 3D model; T = 0 s is immediately before initial observed erosion at downstream edge of crest; red circle indicates breach edge as used in further analyses.
Remotesensing 15 01715 g0a1
Figure A2. Cross-section profiles for X = 0 m (centre line) extracted from U2 dynamic 3D model; T = 0 s is immediately before initial observed erosion at downstream edge of crest; red circle indicates breach edge as used in further analyses.
Remotesensing 15 01715 g0a2
Figure A3. Cross-section profiles for X = 0 m (centre line) extracted from U3 dynamic 3D model; T = 0 s is immediately before initial observed erosion at downstream edge of crest; red circle indicates breach edge as used in further analyses.
Remotesensing 15 01715 g0a3
Figure A4. Cross-section profiles for X = 0 m (centre line) extracted from U4 dynamic 3D model; T = 0 s is immediately before initial observed erosion at downstream edge of crest; red circle indicates breach edge as used in further analyses.
Remotesensing 15 01715 g0a4
Figure A5. Cross-section profiles for X = 0 m (centre line) extracted from U5 dynamic 3D model; T = 0 s is immediately before initial observed erosion at downstream edge of crest; red circle indicates breach edge as used in further analyses.
Remotesensing 15 01715 g0a5
Figure A6. Cross-section profiles for X = 0 m (centre line) extracted from H1 dynamic 3D model; T = 0 s is immediately before initial observed erosion at downstream edge of crest; red circle indicates breach edge as used in further analyses.
Remotesensing 15 01715 g0a6
Figure A7. Cross-section profiles for X = 0 m (centre line) extracted from H2 dynamic 3D model; T = 0 s is immediately before initial observed erosion at downstream edge of crest; red circle indicates breach edge as used in further analyses.
Remotesensing 15 01715 g0a7
Figure A8. Cross-section profiles for X = 0 m (centre line) extracted from H3 dynamic 3D model; T = 0 s is immediately before initial observed erosion at downstream edge of crest; red circle indicates breach edge as used in further analyses.
Remotesensing 15 01715 g0a8

References

  1. ICOLD. ICOLD Incident Database Bulletin 99 Update Statistical Analysis of Dam Failures; ICOLD: Paris, France, 2019. [Google Scholar]
  2. Sigurjonsson, S.; Sigtryggsdottir, F.G.; Kiplesund, G.H. Pertinence of parametric based breach models for rockfill dams. In Proceedings of the 20th International Conference on Soil Mechanics and Geotechnical Engineering, Sydney, Australia, 1–5 May 2022; Australian Geomechanics Society: Sydney, Australia; SIMSG; ISSMGE: London, UK, 2022; pp. 2753–2758. [Google Scholar]
  3. West, M.; Morris, M.; Hassan, M. A Guide to Breach Prediction; HR Wallingford: Oxford, UK, 2018. [Google Scholar]
  4. ICOLD World Register of Dams-General Synthesis. Available online: https://www.icold-cigb.org/GB/world_register/general_synthesis.asp (accessed on 26 September 2022).
  5. Pörtner, H.; Roberts, D.; Tignor, M.; Poloczanska, E.; Mintenbeck, K.; Alegría, A.; Craig, M.; Langsdorf, S.; Löschke, S.; Möller, V.; et al. Climate Change 2022: Impacts, Adaptation and Vulnerability Working Group II Contribution to the IPCC Sixth Assessment Report; IPCC: Geneva, Switzerland, 2022; ISBN 9781009325844. [Google Scholar]
  6. Monteiro-Alves, R.; Toledo, M.Á.; Moran, R.; Balairón, L. Failure of the Downstream Shoulder of Rockfill Dams Due to Overtopping or Throughflow. Water 2022, 14, 1624. [Google Scholar] [CrossRef]
  7. Larese, A.; Rossi, R.; Oñate, E.; Toledo, M.Á.; Morán, R.; Campos, H. Numerical and Experimental Study of Overtopping and Failure of Rockfill Dams. Int. J. Geomech. 2015, 15, 04014060. [Google Scholar] [CrossRef]
  8. Chinnarasri, C.; Jirakitlerd, S.; Wongwises, S. Embankment dam breach and its outflow characteristics. Civ. Eng. Environ. Syst. 2004, 21, 247–264. [Google Scholar] [CrossRef]
  9. Asghari Tabrizi, A.; Elalfy, E.; Elkholy, M.; Chaudhry, M.H.; Imran, J. Effects of compaction on embankment breach due to overtopping. J. Hydraul. Res. 2017, 55, 236–247. [Google Scholar] [CrossRef]
  10. Wahl, T.L. Erosion Testing of Zoned Rockfill Embankments; United States Bureau of Reclamation: Washington, DC, USA, 2019.
  11. Morris, M.W.; Hassan, M.A.A.M.; Vaskinn, K.A. Breach formation: Field test and laboratory experiments. J. Hydraul. Res. 2007, 45, 9–17. [Google Scholar] [CrossRef]
  12. Cao, Z.; Yue, Z.; Pender, G. Landslide dam failure and flood hydraulics. Part I: Experimental investigation. Nat. Hazards 2011, 59, 1003–1019. [Google Scholar] [CrossRef]
  13. Jiang, X.; Wei, Y.; Wu, L.; Lei, Y. Experimental investigation of failure modes and breaching characteristics of natural dams. Geomat. Nat. Hazards Risk 2018, 9, 33–48. [Google Scholar] [CrossRef]
  14. Shi, Z.; Zhang, G.; Peng, M.; Zhang, Q.; Zhou, Y.; Zhou, M. Experimental Investigation on the Breaching Process of Landslide Dams with Differing Materials under Different Inflow Conditions. Materials 2022, 15, 2029. [Google Scholar] [CrossRef]
  15. Awal, R.; Nakagawa, H.; Fujita, M.; Kawaike, K.; Baba, Y.; Zhang, H. Experimental Study on Glacial Lake Outburst Floods Due to Waves Overtopping and Erosion of Moraine Dam. Annu. Disas. Prev. Res. Inst. Kyoto Univ. 2010, 53, 583–594. [Google Scholar]
  16. Vaskinn, K.A.; Løvoll, A.; Höeg, K.; Morris, M.; Hanson, G.J.; Hassan, M.A. Physical modeling of breach formation: Large scale field tests. Proc. Dam Saf. 2004, 1–16. [Google Scholar]
  17. Amaral, S.; Viseu, T.; Ferreira, R. Experimental methods for local-scale characterization of hydro-morphodynamic dam breach processes. Breach detection, 3D reconstruction, flow kinematics and spatial surface velocimetry. Flow Meas. Instrum. 2019, 70, 101658. [Google Scholar] [CrossRef]
  18. James, M.R.; Chandler, J.H.; Eltner, A.; Fraser, C.; Miller, P.E.; Mills, J.P.; Noble, T.; Robson, S.; Lane, S.N. Guidelines on the use of structure-from-motion photogrammetry in geomorphic research. Earth Surf. Process. Landf. 2019, 44, 2081–2084. [Google Scholar] [CrossRef]
  19. Eltner, A.; Kaiser, A.; Abellan, A.; Schindewolf, M. Time lapse structure-from-motion photogrammetry for continuous geomorphic monitoring. Earth Surf. Process. Landf. 2017, 42, 2240–2253. [Google Scholar] [CrossRef]
  20. Cucchiaro, S.; Maset, E.; Fusiello, A.; Cazorzi, F. 4D-SFM photogrammetry for monitoring sediment dynamics in a debris-flow catchment: Software testing and results comparison. In Proceedings of the International Archives of the Photogrammetry, Remote Sensing and Spatial Information Sciences; International Society for Photogrammetry and Remote Sensing, Istanbul, Turkey, 18–21 March 2018; Volume 42, pp. 281–288. [Google Scholar]
  21. Pacheco-Ruiz, R.; Adams, J.; Pedrotti, F. 4D modelling of low visibility Underwater Archaeological excavations using multi-source photogrammetry in the Bulgarian Black Sea. J. Archaeol. Sci. 2018, 100, 120–129. [Google Scholar] [CrossRef] [Green Version]
  22. Dezert, T.; Kiplesund, G.H.; Sigtryggsdóttir, F.G. Riprap Protection Exposed to Overtopping Phenomena: A Review of Laboratory Experimental Models. Water 2022, 14, 2722. [Google Scholar] [CrossRef]
  23. Hiller, P.H.; Aberle, J.; Lia, L. Displacements as failure origin of placed riprap on steep slopes. J. Hydraul. Res. 2018, 56, 141–155. [Google Scholar] [CrossRef] [Green Version]
  24. Kiplesund, G.H.; Sigtryggsdóttir, F.G. Laboratory Investigations into Stability and Breaching of Rockfill Dams Using Dynamic Structure from Motion. In Proceedings of the 39th IAHR World Congress, Granada, Spain, 19–24 June 2022; IAHR: Granada, Spain, 2022; pp. 5079–5088. [Google Scholar]
  25. Hyllestad, E.; Andersen, R.; Østvold, H.M.; Rystad, V. Veileder for Fyllingsdammer; NVE: Oslo, Norway, 2012. [Google Scholar]
  26. Kiplesund, G.H.; Ravindra, G.H.R.; Rokstad, M.M.; Sigtryggsdóttir, F.G. Effects of toe configuration on throughflow properties of rockfill dams. J. Appl. Water Eng. Res. 2021, 9, 277–292. [Google Scholar] [CrossRef]
  27. ICOLD. Geomembrane Sealing Systems for Dams—Design Principles and Review of Experience Bulletin 135; International Commission on Large Dams: Paris, France, 2010. [Google Scholar]
  28. Demirdogen, S.; Gunaratne, M. Stability analysis of embankment dams with defective internal geomembrane liners. Int. J. Geotech. Eng. 2022, 16, 1165–1175. [Google Scholar] [CrossRef]
  29. Wang, W.; Höeg, K. Simplified material model for analysis of asphalt core in embankment dams. Constr. Build. Mater. 2016, 124, 199–207. [Google Scholar] [CrossRef]
  30. Høeg, K. Asphaltic Concrete Cores for Embankment Dams; Norwegian Geotechnical Institute: Oslo, Norway, 1993; ISBN 82-546-0163-1. [Google Scholar]
  31. NTNU. Course Compendium for VM6001-Dam Safety; Department of Civil and Environmental Engineering, NTNU: Singapore, 2020. [Google Scholar]
  32. USDA. Natural Resources Conservation Service Gradation Design of Sand and Gravel Filters. In National Engineering Handbook Part 633; USDA: Washington, DC, USA, 2017. [Google Scholar]
  33. R Core Team R: A Language and Environment for Statistical Computing. Available online: https://www.r-project.org/ (accessed on 20 September 2022).
  34. FFmpeg Developers FFmpeg. Available online: https://ffmpeg.org/ (accessed on 16 September 2022).
  35. Agisoft LLC. Agisoft Metashape User Manual Professional Edition, Version 2.0.; Agisoft LLC: St. Petersburg, Russia, 2022; p. 160. [Google Scholar]
  36. Fonstad, M.A.; Dietrich, J.T.; Courville, B.C.; Jensen, J.L.; Carbonneau, P.E. Topographic structure from motion: A new development in photogrammetric measurement. Earth Surf. Process. Landf. 2013, 38, 421–430. [Google Scholar] [CrossRef] [Green Version]
  37. Hendrickx, H.; Vivero, S.; De Cock, L.; De Wit, B.; De Maeyer, P.; Lambiel, C.; Delaloye, R.; Nyssen, J.; Frankl, A. The reproducibility of SfM algorithms to produce detailed Digital Surface Models: The example of PhotoScan applied to a high-alpine rock glacier. Remote Sens. Lett. 2018, 10, 11–20. [Google Scholar] [CrossRef] [Green Version]
  38. Pock, T.; Zebedin, L.; Bischof, H. TGV-Fusion. In Rainbow of Computer Science. Lecture Notes in Computer Science; Calude, C.S., Rozenberg, G., Salomaa, A., Eds.; Springer: Berlin/Heidelberg, Germany, 2011; Volume 6570, pp. 245–258. ISBN 9783642193903. [Google Scholar]
  39. Poliarnyi, N.; Agisoft, L. Out-of-Core Surface Reconstruction via Global T GV Minimization. In Proceedings of the IEEE/CVF International Conference on Computer Vision (ICCV), Montreal, BC, Canada, 11–17 October 2021; pp. 5641–5650. [Google Scholar]
  40. Kingsland, K. Comparative analysis of digital photogrammetry software for cultural heritage. Digit. Appl. Archaeol. Cult. Herit. 2020, 18, e00157. [Google Scholar] [CrossRef]
  41. Kloc, B.; Mazur, A.; Szumiło, M. Comparison of Free and Commercial Software in the Processing of Data Obtained from Non-Metric Cameras. J. Ecol. Eng. 2021, 22, 213–225. [Google Scholar] [CrossRef]
  42. QGIS Development Team QGIS Software. Available online: https://www.qgis.org/ (accessed on 20 September 2022).
  43. Pugh, C.A. Report No. REC-ERC-85-7, “Hydraulic Model Studies of Fuse Plug Embankments”; USBR: Denver, CO, USA, 1985.
  44. Franca, M.J.; Almeida, A.B. Experimental Tests on Rockfill Dam Breaching Process. In Proceedings of the IAHR-International Symposium on Hydraulic and Hydrological Aspects of Reliability and Safety Assessment of Hydraulic Structures, St. Petersburg, Russia, 29 May–2 June 2002. [Google Scholar]
Figure 1. Hydraulic flume at NTNU (units in mm) flow from right to left.
Remotesensing 15 01715 g001
Figure 2. Model setup including core and axis system (units in mm) Y-axis out of paper plane.
Remotesensing 15 01715 g002
Figure 3. Camera rig setups (a) Model U1-U3 (b) Model U4-H3, camera locations indicated by yellow circles, coordinate system definition shown on (b) with red arrows and axis labels (c) shows DSLR image of a GCP cube (d) shows video frame of the same GCP cube.
Remotesensing 15 01715 g003
Figure 4. Grain size distribution enveloping curves from dam database and for chosen shell material (scaled up 10:1 to prototype scale) previously presented in [26].
Remotesensing 15 01715 g004
Figure 5. Reservoir curve for model tests.
Remotesensing 15 01715 g005
Figure 6. Example set of synchronised images from test U4—3170 s from start of test.
Remotesensing 15 01715 g006
Figure 7. Photogrammetry and image analysis workflow.
Remotesensing 15 01715 g007
Figure 8. Side-view tracking of breach progression of model U4 (central core); direction of flow is right to left; white line indicates traced solid surface.
Remotesensing 15 01715 g008
Figure 9. Side-view tracking of breach progression of model H1 (no core); direction of flow is right to left; white line indicates traced solid surface.
Remotesensing 15 01715 g009
Figure 10. Vertical breach development model U4 (central core). The bottom elevation on the vertical axis is the Z coordinate from the DEM.
Remotesensing 15 01715 g010
Figure 11. Vertical breach erosion rate Ev at X = 0 m from traced side-view profiles (mm/s).
Remotesensing 15 01715 g011
Figure 12. Cross-section profiles for X = 0 m (centre line) extracted from U4 (central core) dynamic 3D model; T = 0 s is immediately before initially observed erosion at the downstream edge of the crest; red circle indicates breach edge as used in further analyses.
Remotesensing 15 01715 g012
Figure 13. Longitudinal profiles of test U4 from low-resolution dynamic DEM at Y = 0.9 m (blue) and side-view tracking (black) throughout the breaching process; direction of flow is left to right; T = 0 s is last frame before initial observed erosion at downstream end of pilot channel.
Remotesensing 15 01715 g013
Figure 14. Breach width (W) and breach bottom elevation (H) for model U4 (central core) plotted against breach outflow (Q) and upstream water level (WL).
Remotesensing 15 01715 g014
Figure 15. Breach width (W) and breach bottom elevation (H) for model H1 (no core) plotted against breach outflow (Q) and upstream water level (WL).
Remotesensing 15 01715 g015
Figure 16. Lateral erosion rates (BER) over 5 s time steps (mm/s) at X = 0 m for tests U4 (central core) and H1 (no core).
Remotesensing 15 01715 g016
Figure 17. Longitudinal profiles of test U1; high-resolution DEM (red) and low-resolution DEM (blue); nine different profiles, with 0.1 being close to the back wall and 0.9 being near the glass wall (with pilot channel visible); calculated RMSE is shown for each profile.
Remotesensing 15 01715 g017
Figure 18. Longitudinal profiles of test U4; high-resolution DEM (red) and low-resolution DEM (blue); nine different profiles, with 0.1 being close to the back wall and 0.9 being near the glass wall (with pilot channel visible); calculated RMSE is shown for each profile.
Remotesensing 15 01715 g018
Table 1. Overview of model tests with key parameters.
ModelDateCore
Material
Leakage Flow
(L/s)
Inflow (L/s)No. of Cameras
Total/SFM
Ground Control PointsNo. of Dynamic FramesNo. of Start
Images
No. of End
Images
U12020-10-01Rubber15.16/381203852
U22020-10-10Rubber0.75.16/381683454
U32021-01-05Rubber0.710.36/381203948
U42021-08-10Rubber0.25.06/571323488
U52022-01-14Rubber0.315.29/771084867
H12022-02-03NoneNA15.09/76606292
H22022-02-10NoneNA20.59/76364990
H32022-02-23NoneNA15 *9/764864103
* Discharge measurements corrupted; inflow is based on visual observation of valve display when setting desired discharge.
Table 2. Volume difference above dam footprint before and after testing.
TestTest Inflow (L/s)Vdiff (m³)Breach Time (s)
U15.10.45170
U25.10.47145
U310.30.5985
U450.49220
U515.20.64120
Coefficient of correlation (R)0.97−0.66
H1150.69125
H220.50.75120
H3150.70175
Coefficient of correlation (R)0.99−0.57
Table 3. Summary of results on erosion rates.
Model U1Model U2Model U3Model U4Model U5Model H1Model H2Model H3
Max 30 s vertical erosion rate (mm/s)7.38.76.07.98.37.36.06.3
Average vertical erosion rate (mm/s)4.44.54.44.74.36.25.14.3
Max 30 s lateral erosion rate (mm/s)7.65.213.08.88.77.311.39.7
Average lateral erosion rate (mm/s)4.44.211.44.77.16.26.27.2
Average inflow (L/s)5.15.110.35.015.215.020.5Ca 15
Max 30 s outflow (L/s)55.856.556.060.973.980.481.3NA
Disclaimer/Publisher’s Note: The statements, opinions and data contained in all publications are solely those of the individual author(s) and contributor(s) and not of MDPI and/or the editor(s). MDPI and/or the editor(s) disclaim responsibility for any injury to people or property resulting from any ideas, methods, instructions or products referred to in the content.