Article

UAV-Based Remote Sensing for Detection and Visualization of Partially-Exposed Underground Structures in Complex Archaeological Sites

1
Department of Geoinformation Engineering, Sejong University, Seoul 05006, Republic of Korea
2
Lyles School of Civil Engineering, Purdue University, West Lafayette, IN 47907, USA
3
Art History, Mimar Sinan Fine Arts University, Istanbul 34427, Turkey
4
College of Liberal Arts, Purdue University, West Lafayette, IN 47907, USA
*
Author to whom correspondence should be addressed.
Remote Sens. 2023, 15(7), 1876; https://doi.org/10.3390/rs15071876
Submission received: 11 February 2023 / Revised: 19 March 2023 / Accepted: 30 March 2023 / Published: 31 March 2023
(This article belongs to the Special Issue Application of Remote Sensing in Cultural Heritage Research)

Abstract

:
The utilization of remote sensing technologies for archaeology was motivated by their ability to map large areas within a short time at a reasonable cost. With recent advances in platform and sensing technologies, uncrewed aerial vehicles (UAV) equipped with imaging and Light Detection and Ranging (LiDAR) systems have emerged as a promising tool due to their low cost, ease of deployment/operation, and ability to provide high-resolution geospatial data. In some cases, archaeological sites might be covered with vegetation, which makes the identification of below-canopy structures quite challenging. The ability of LiDAR energy to travel through gaps within vegetation allows for the derivation of returns from hidden structures below the canopy. This study deals with the development and deployment of a UAV system equipped with imaging and LiDAR sensing technologies assisted by an integrated Global Navigation Satellite System/Inertial Navigation System (GNSS/INS) for the archaeological mapping of Dana Island, Turkey. Data processing strategies are also introduced for the detection and visualization of underground structures. More specifically, a strategy has been developed for the robust identification of ground/terrain surface in a site characterized by steep slopes and dense vegetation, as well as the presence of numerous underground structures. The derived terrain surface is then used for the automated detection/localization of underground structures, which are then visualized through a web portal. The proposed strategy has shown a promising detection ability with an F1-score of approximately 92%.

Graphical Abstract

1. Introduction

Archaeology is the study of previous human activities and cultures through the recovery, documentation, and analysis of material remains and the environment when used, modified, and perceived by people [1,2,3]. The accurate, detailed documentation of cultural heritage sites is a crucial aspect of archaeology. The majority of documentation strategies are based on labor and involve time-intensive, and sometimes invasive and hazardous, site surveys [4,5,6]. Therefore, remote sensing technologies have emerged as a more practical approach to obtaining a detailed understanding of archaeological sites. More specifically, the emergence of passive and active remote sensing modalities operating in different portions of the electromagnetic spectrum allows for the derivation of a rich set of information, which is useful for the detection and mapping of archaeological remains. Improvements in direct georeferencing technologies, and lower-cost technologies, i.e., integrated Global Navigation Satellite Systems/Inertial Navigation Systems (GNSS/INS), which allow for the control-free mapping of such sites. This makes the remote sensing of archaeological sites a more attractive option for their documentation. Remote sensing data have traditionally been acquired by spaceborne and airborne platforms [7,8,9,10,11,12]. In spite of their ability to improve performance, these remote sensing systems do not provide reasonable resolution at an affordable cost [10]. Over the last decade, uncrewed aerial vehicles (UAVs) have emerged as promising remote sensing platforms. The use of UAVs is motivated by their low cost, ease of deployment, autonomous operation, ability to fly under cloud cover, and ability to fill an important gap between airborne and terrestrial sensing modalities [13,14,15,16,17]. The recent availability of miniaturized sensing modalities and direct georeferencing technologies, together with the improved payload capacity of modern UAVs, are other factors that promote the use of such platforms in a wide range of applications, including archaeology [4].
In terms of remote sensing modalities, imagery has been used for the derivation of high-resolution orthophotos, which are quite useful for the 2D mapping of archaeological sites. With the recent developments in Structure from Motion (SfM) algorithms, we are able to generate dense point clouds that can cover a site, allowing for its 3D mapping [18,19,20,21]. However, for sites with heavy vegetation cover, image-based documentation fails to provide useful information below canopy (e.g., hidden walls, and underground structures). In this regard, Light Detection and Ranging (LiDAR) provides a viable alternative for under-canopy mapping due to its ability to travel through tiny gaps while delivering results pertaining to hidden structures. Thus, Terrestrial Laser Scanning (TLS) has been used as a surveying tool in archaeology [22]. However, mapping an extensive archaeological site with TLS is a time-intensive and data-heavy operation. Furthermore, vegetation cover is a significant impediment to an accurate recording. This leads to the need for expensive post-processing for registration and information extraction from the derived point clouds [23,24,25,26]. Therefore, TLS is often preferred for smaller, unwooded areas as well as architectural remains. Considering this, the use of LiDAR units onboard UAVs is becoming an interesting concept for the mapping of archaeological sites [27,28,29].
In spite of its advantages, LiDAR-based remote sensing lacks the important information necessary for understanding acquired scenes (e.g., lack of spectral information). With the improved payload capabilities of modern UAVs, both camera and LiDAR systems can be mounted on the platform, allowing for the simultaneous acquisition of image and point cloud data. Incorporating a digital camera onboard UAVs provides more capabilities, which enhances the processes of feature extraction, scene understanding, and the visualization of derived products. The synergistic characteristics of image and LiDAR mapping technologies allow for a more complete mapping/documentation. Table 1 provides a brief summary of these complementary characteristics, which are illustrated in Figure 1.
In spite of the above characteristics of LiDAR data, the detection of underground structures (including cisterns) from point clouds remains a challenging task, especially when dealing with complex archaeological sites exhibiting steep slopes and dense vegetation [32,33,34]. The detection of cisterns is quite important for some archaeological sites, especially those in areas with limited access to fresh water. Inhabitation of such sites is only sustainable if a provision of fresh water is created. Having information about such structures is important for: (1) identifying the maximum population that can be sustained, (2) differentiating between private and public spaces, (3) the identification of the functions of damaged buildings, and (4) providing insight into the settlement layout and phases of occupation. For instance, on Dana Island, where a large maritime village developed from the first through the eighth century CE, cisterns were critical not only for resident population but also for supplying the maritime vessels that used the island as a way station [35]. Using UAV LiDAR, researchers are able to answer fundamental archaeological questions such as the volume of quarrying, the spatial relationship between quarries and inhabitation, and the transformation of the natural terrain into a highly modified industrial settlement. Moreover, it can address environmental concerns about denuding the island of its natural flora while drastically reducing the labor and finances required to map such a complex site. Therefore, this manuscript focuses on establishing a UAV system equipped with imaging and LiDAR remote sensing technologies aided by an integrated GNSS/INS unit to provide useful geospatial data for the detection of underground structures in general, and cisterns in particular.
Much of the current UAV LiDAR-based archeological work focuses on the descriptive interpretation of results [36]. Some of the most famous recent studies typically present archaeological layers covered by vegetation, partial human-based reconstruction of missing features, or broad framework outlines for a study area [37]. Our research pushes the boundaries of research by quantitatively interpreting LiDAR signals to recognize archaeological features that are hard to survey and analyze at scale by human observation alone. Our work also opens the way for more sophisticated analytic projects, which could infer the degree and type of human occupation, leading to important socio-cultural conclusions about the historical processes around the area of interest.
The detection of underground structures from UAV-based point clouds requires a crucial ground-filtering step. Such UAV datasets could prove challenging due to the presence of above ground objects, land features of different sizes, and varying point densities [38]. Ground filtering algorithms for LiDAR point clouds can be categorized into three main groups: (1) morphology-based, (2) slope-based, and (3) surface-based approaches. Morphology-based filtering separates above-ground and bare-earth points using an opening operation [39,40,41], and it is robust in steep areas while removing smaller non-ground features. Slope-based strategies [42,43,44] aim to distinguish bare-earth points from above-ground points by detecting inconsistent slope changes. Hence, they are more effective in flat areas but less so in areas with drastic terrain changes. The goal of surface-based filtering [45,46,47] is to approximate bare-earth points using a mathematical description of a Digital Terrain Model (DTM); however, it tends to ignore terrain details. Given the characteristics of UAV LiDAR data in archaeological sites (e.g., steep areas with land features of different sizes), surface-based filtering will likely be most suitable for this study.
Specifically, the cloth simulation filtering algorithm has frequently been compared with other filtering approaches in previous studies. Serifoglu Yilmaz et al. [48] evaluated the performance of seven commonly used ground-filtering algorithms [45,49,50,51,52,53,54] for UAV-based point clouds. Their results showed that the cloth simulation filtering algorithm [45] produces the best results since it has the advantage of requiring only a few, easily adjustable parameters. Bolkas et al. [55] compared the use of UAV photogrammetry and TLS for examining the performance of two ground-filtering algorithms (i.e., Agisoft Metashape classification and cloth simulation filtering algorithms). They found that vegetation density has a major impact on surface change estimation due to the varying levels of penetration, while both ground-filtering algorithms provide acceptable results in areas with low vegetation density. In summary, among the existing ground-filtering algorithms, cloth simulation shows great promise in handling data obtained from UAVs. However, modifications are necessary to address challenges posed by noise and outliers in point clouds, as well as the dense vegetation, sudden elevation changes, and/or underground structures that might be frequent in archaeological sites.
In addition to using remote sensing technologies to develop algorithms capable of archaeological site documentation, there is a lack of easy-to-use visualization tools considering the massive amount of captured data, especially LiDAR point clouds. There are some commercial and opensource tools for remote sensing data visualization—e.g., CloudCompare (http://www.cloudcompare.org/, accessed on 10 February 2023), VisionLidar (https://geo-plus.com/point-cloud-software/, accessed on 10 February 2023), and Veesus (https://veesus.com/, accessed on 10 February 2023). However, such software programs rely on the availability of large amounts of computer memory storage and are limited by the computational performance of the used hardware. With recent improvements in internet speed, several web portals have been developed, allowing end-users to access point clouds without prerequisite installation and data downloading [56,57,58]. However, a visualization tool capable of integrating both image and point cloud data while providing end-users with interactive means for the manipulation of such data (e.g., forward and backward projection between 2D images and 3D point clouds) is still lacking. Therefore, another objective of the proposed research is to develop a web portal for managing/visualizing the collected UAV imagery and LiDAR data as well as the derived products. The main objectives/contributions of this study can be summarized as follows:
  • Develop a UAV-based remote sensing platform for the acquisition of image and LiDAR data for the documentation of isolated, complex archaeological sites rich in underground structures, such as cisterns and the basements of buildings.
  • Develop a robust terrain model generation strategy that can handle rugged terrains with sudden elevation changes, dense vegetation cover, and/or the presence of underground structures.
  • Develop a detection strategy for identifying underground structures in LiDAR point clouds.
  • Develop a web-based visualization portal for illustrating image and LiDAR data together with derived products while providing the end-users with easy-to-use switching between imaging and LiDAR data.
  • Illustrate the performance of the developed strategies using real datasets captured over a complex archaeological site.
The remainder of this paper is organized as follows: Section 2 introduces the utilized UAV system, study site, and acquired datasets; Section 3 presents the mathematical models for LiDAR/image-based 3D point positioning (which are necessary for subsequent data processing), proposed terrain model generation and underground structure detection approaches, together with the developed web-visualization portal and its use in establishing a reference dataset; experimental results are then reported and discussed in Section 4; finally, the conclusions and recommendations for future work are summarized in Section 5.

2. Data Acquisition System, Study Site, and Dataset Description

One of the objectives of the proposed research is to develop and deploy a UAV-based remote sensing system equipped with a digital camera and LiDAR remote sensing modalities assisted by an integrated GNSS/INS unit. The system will be used for data acquisition over a complex archaeological site. The following subsections outline the specifications of the used UAV and provide details about the study site and acquired datasets.

2.1. UAV-Based Mobile Mapping System

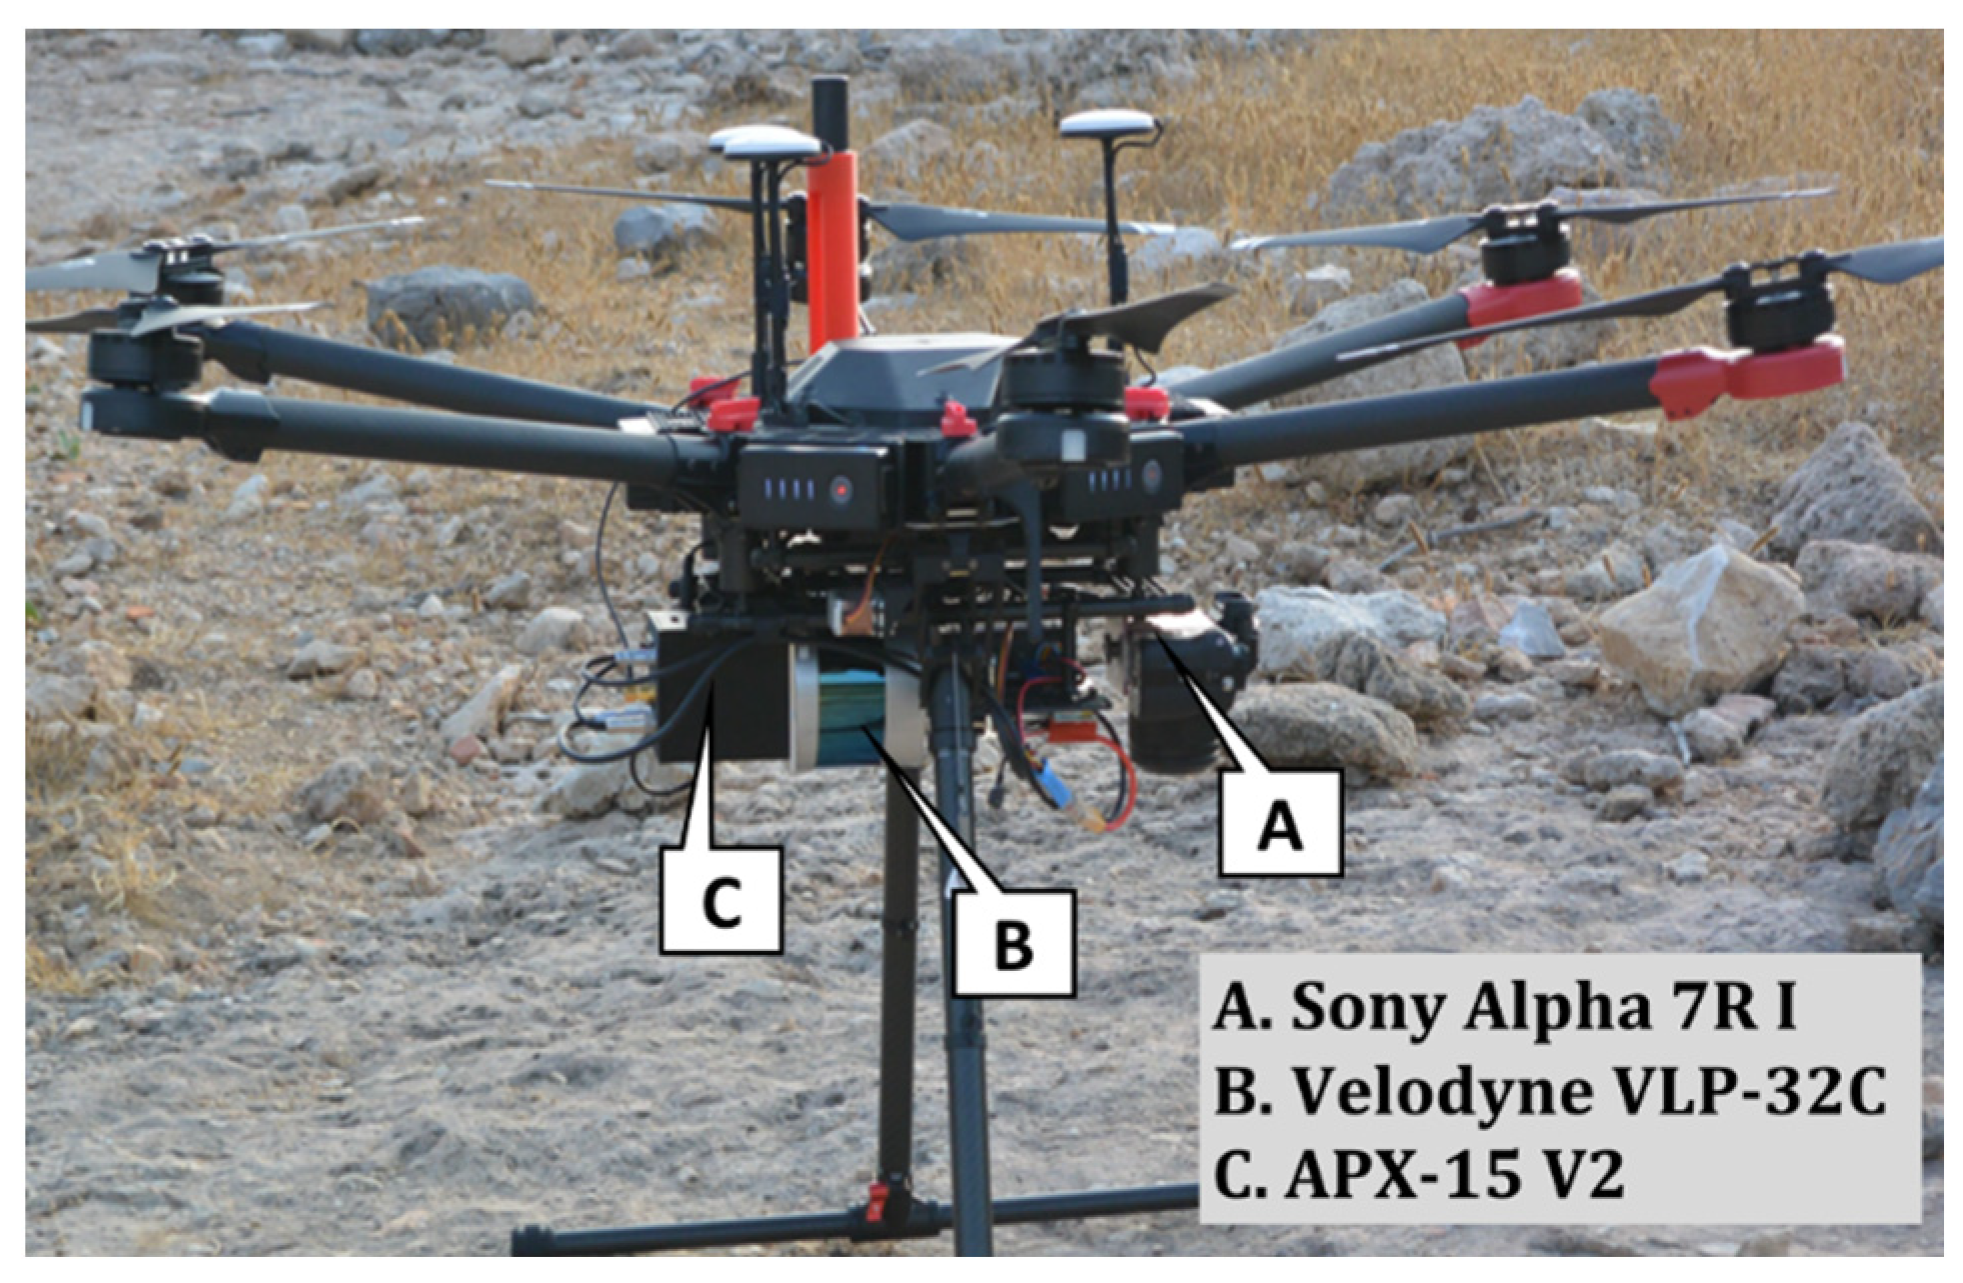
An in-house-developed UAV mobile mapping system (MMS) was used in this study. The UAV, as shown in Figure 2, was equipped with a LiDAR scanner—Velodyne VLP-32C, a digital camera—Sony Alpha ILCE-7R, and an Applanix APX-15 UAV V2 GNSS/INS unit. The LiDAR scanner has 32 laser beams that are radially aligned in a vertical plane with a 40° Field of View (FOV) at an angular resolution of 0.33°. The laser beam assembly is rotated around the unit’s vertical axis to provide a 360° horizontal FOV with an angular resolution between 0.1° and 0.4°. The VLP-32C emits 600,000 pulses per second for a maximum measurement range of 200 m and ±3 cm range accuracy [59]. The LiDAR unit was mounted on the UAV with its vertical axis parallel to the flight direction. The Sony Alpha ILCE-7R is a 36.4-megapixel off-the-shelf camera with a frame size of 7360 × 4912 pixels and 4.86 μm pixel size [60]. The nominal focal length of the used lens is 35 mm. The camera, which was set up on the UAV with its optical axis pointing in the nadir direction, is triggered by an Arduino Micro microcontroller at a frame period of 1.5 s. The LiDAR and camera units were directly georeferenced by the APX-15 UAV V2 GNSS/INS system [61], whose data were post-processed using POSPac [62] to provide the position and orientation of the body frame associated with the INS’ Inertial Measurement Unit (IMU) at 200 HZ. Under open-sky conditions with good accessibility for the GNSS signal, the post-processing positional accuracy of the GNSS/INS system ranged from ±2 to ±5 cm, and the roll/pitch and heading accuracy were ±0.025° and ±0.08°, respectively.

2.2. Study Site and Dataset Description

The study site was Dana Island (36°11′91″N, 33°46′27″E), which was part of the ancient Rough Cilicia (roughly rectangular in shape with dimensions of 2.7 km × 0.8 km) in southern Turkey. Located 2 km off the Mediterranean coast, this rich archaeological landscape includes a maritime village of the early Byzantine period and a hilltop occupation that goes back to the Iron Age [35]. The coastal village along the western shoreline includes houses, shops, hostels, baths, six churches, and other buildings related to seaborne travel. This was also the site of a major quarrying operation, as evidenced by the extensive limestone quarries across the settlement, and the infrastructure for exporting stone blocks via maritime vessels. These materials provide a wealth of information about the social, economic, political, and religious structures of the communities that lived on the island. Dana Island is known for its rugged terrain, hot and arid environment, and limited access to fresh water. Therefore, inhabitation was only possible by establishing a dense set of cisterns, which were not only used by the resident population but also to supply the maritime vessels that used Dana Island as a way station. The steep slope, rugged terrain, dense vegetation cover, and availability of numerous underground structures in the island make it an excellent site for testing the ability to use UAV LiDAR to detect and visualize such structures.
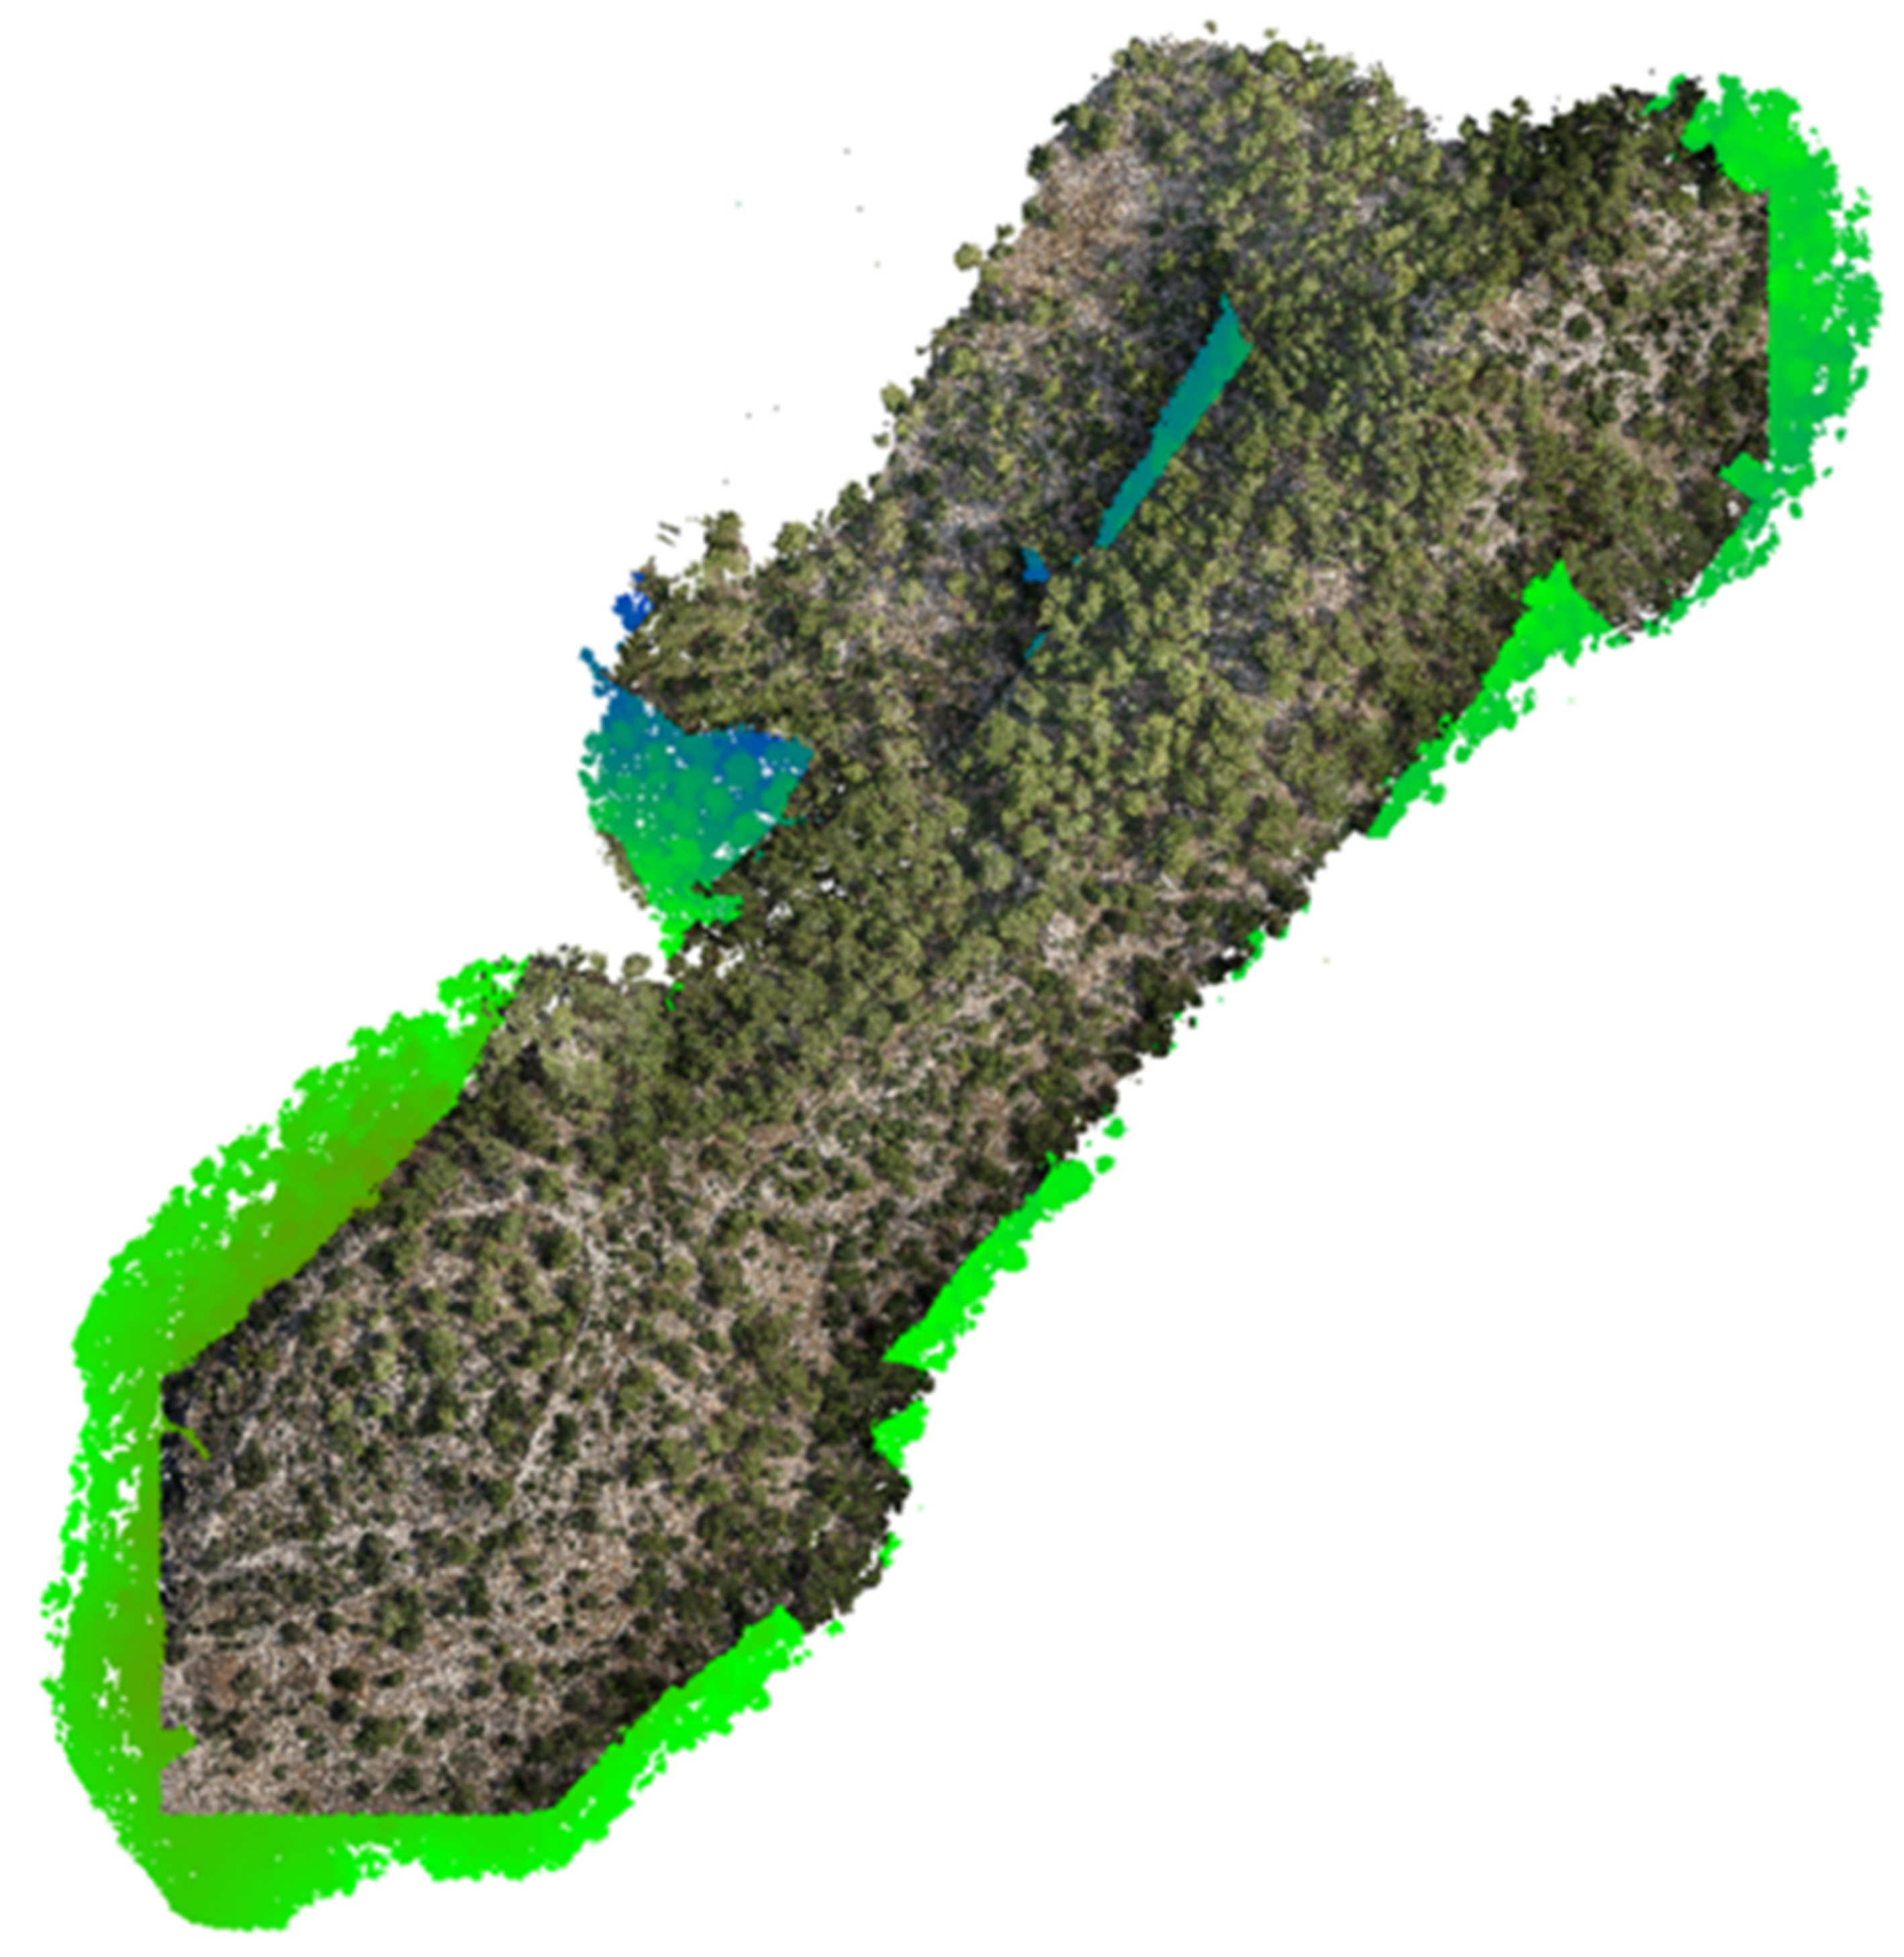
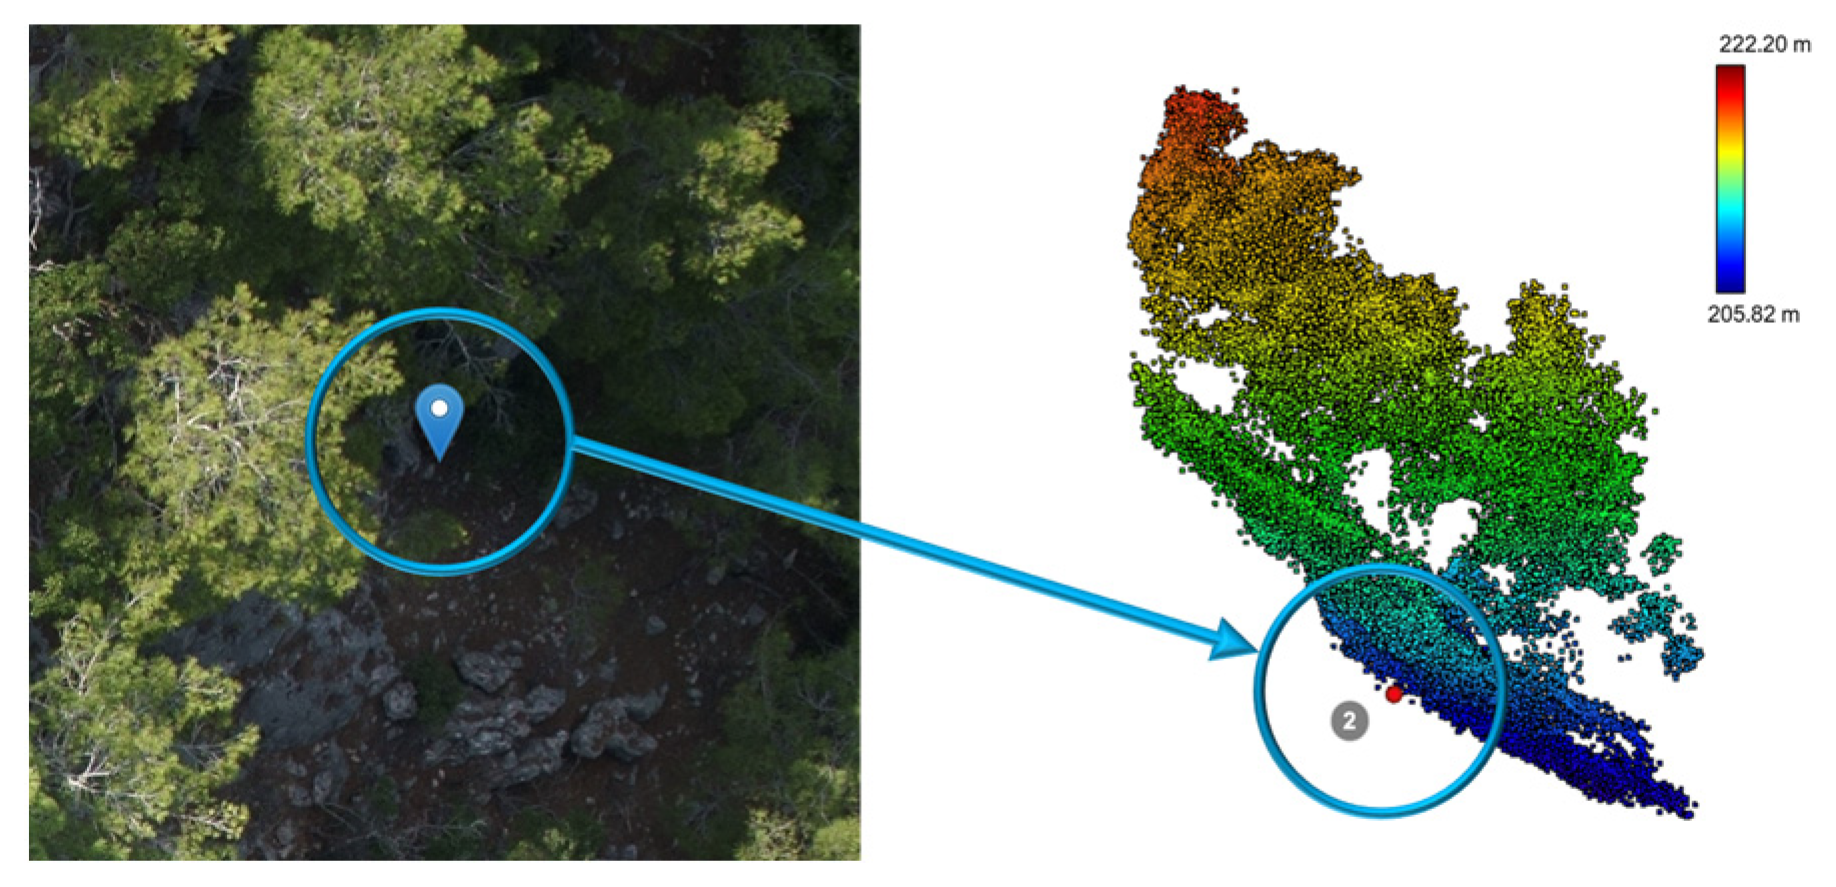
The west coast of Dana Island, where most archaeological sites are located, was covered by ten flight missions between 26 and 29 July 2019. Due to the isolated location of the island, a local Trimble base station (SPS585) was established for differential GNSS post-processing. The conducted missions, together with the local base station, are shown in Figure 3. As an example, Figure 4 illustrates a color-coded point cloud over the area covered by mission #2 (collected on 27 July). Since the LiDAR system allows for a wider swath coverage across the flight line than the onboard camera, some of the LiDAR points are not color-coded. The collection date, flying height, average speed, flight time, and collected data of each mission are listed in Table 2.

3. Methodology

The methodology developed in this work starts by using LiDAR data from different missions for the detection of underground structures. Original point clouds, acquired imagery, and detected objects are then incorporated in a web-visualization portal allowing for interactive switching between 3D LiDAR data and 2D imagery. This section starts with the mathematical models used for deriving 3D coordinates using LiDAR and imaging systems, as well as establishing the 2D-to-3D transformation between image and point cloud data. The methodology for underground structure detection is then explained, followed by coverage of the web-visualization portal. Finally, we will introduce the utilization of the developed portal for establishing a reference dataset, which will be utilized to assess the performance of the underground structure detection approach.

3.1. Point Positioning Equations for GNSS/INS-Assisted LiDAR and Imaging Systems

The success of any multi-modal geospatial data-processing/integration activity is contingent on ensuring the positional quality of such data (e.g., proper georeferencing of the used sensors, together with a comprehensive modeling of the point-positioning equations, relating their measurements to the respective ground coordinates). In general, establishing the point-positioning equations for either LiDAR or imaging systems requires two steps. First, we need to define the laser beam or imaging ray relative to the sensor coordinate system. This definition is based on the sensor measurements (i.e., laser range and pointing direction for a LiDAR and image coordinate measurements for a camera), together with the Interior Orientation Parameters (IOP) of the used sensor (i.e., parameters describing the encoder mechanism for a LiDAR or principal point coordinates, principal distance, and distortion parameters for a camera). Second, the position and orientation of the laser beam or imaging ray relative to the mapping frame are established through the Exterior Orientation Parameters (EOP) that describe the position and orientation of the sensor relative to the mapping frame.
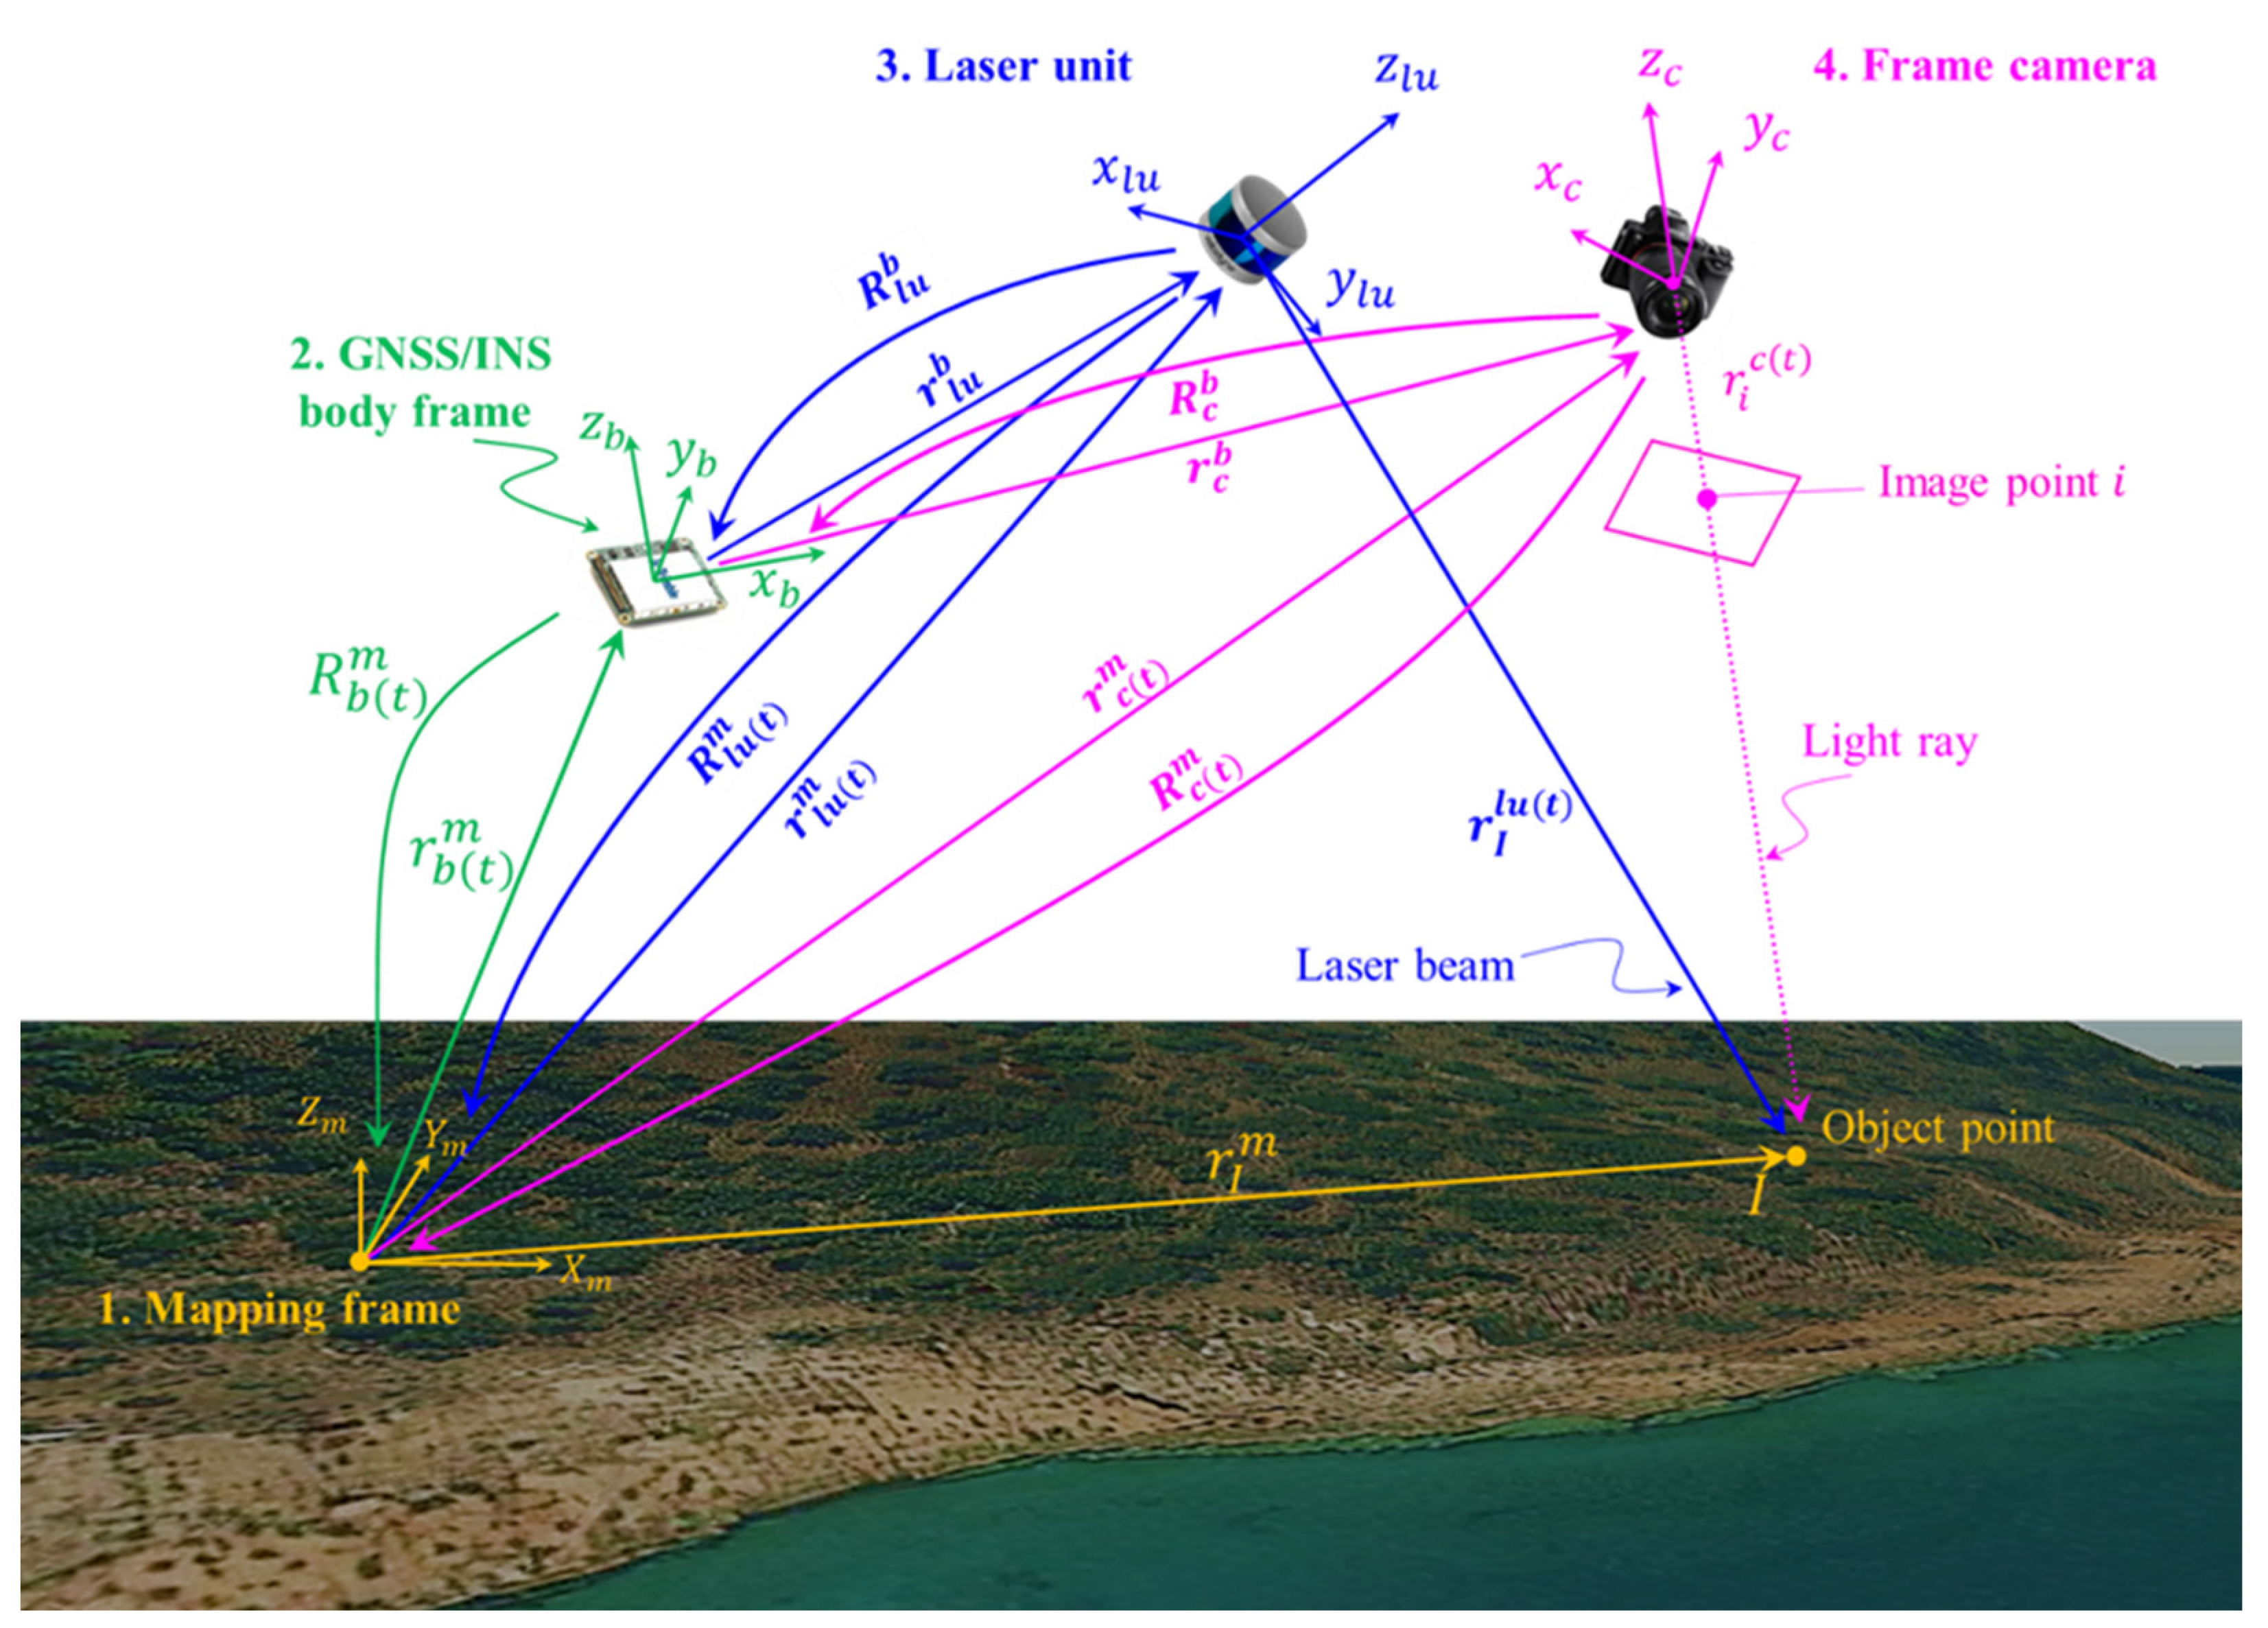
The point positioning models for LiDAR and camera units are described in Equations (1) and (2), respectively. In Equation (1), r I l u t denotes the position of the footprint of a laser beam, emitted at time t , relative to the laser unit frame, while, r l u t m and R l u t m are the position and orientation information of the laser unit frame relative to the mapping frame at time t —i.e., the EOP of the laser unit. The derivation of r I l u t is based on the range and pointing direction measurements of the LiDAR unit as well as its IOP. For a GNSS/INS-assisted system, the estimation of r l u t m and R l u t m can be derived according to Equation (3), which is graphically explained in Figure 5, where r b t m and R b t m are derived from the GNSS/INS-data processing to define the position and orientation of the IMU body frame relative to the mapping frame at time t ; r l u b and R l u b represent the lever arm and boresight rotation matrix relating the laser unit and IMU body frame coordinate systems. Thus, for a LiDAR system, the coordinates of an object point I in the mapping frame ( r I m ) can be derived through Equations (1) and (3).
The point positioning for an imaging system, on the other hand, is shown in Equation (2), where r i c t represents the imaging ray for point i relative to the camera coordinate system at time t . This term is derived from the image coordinates of point i ( x i   and y i   ) and the camera IOP, including the principal point coordinates of the used camera ( x p   and y p   ), principal distance ( f ), as well as distortions in the x and y coordinates for image point i ( d i s t x i and d i s t y i ). Similarly, the position and orientation information of the camera frame relative to the mapping frame ( r c t m and R c t m ) are estimated using the GNSS/INS trajectory information ( r b t m / R b t m ) and mounting parameters relating to the camera frame and IMU body frame ( r c b and R c b ), as shown in Equation (4) and Figure 5. Different from LiDAR, image-based 3D reconstruction involves an unknown scale factor ( λ i , c , t for image point i captured by camera c at time t ), which needs to be estimated.
r I m = r l u t m + R l u t m r I l u t
r I m = r c t m + λ i , c , t R c t m   r i c t ,   r i c t =   x i   x p   d i s t x i y i   y p   d i s t y i f
r l u t m = r b t m + R b t m r l u b   &   R l u t m = R b t m R l u b
r c t m = r b t m + R b t m r c b   &   R c t m = R b t m R c b
From the LiDAR/image-based point positioning equations (i.e., Equations (1)–(4)), it is evident that accurate trajectory information and system calibration parameters (including sensor IOP and mounting parameters) are critical for producing properly georeferenced data from LiDAR and imaging systems. Considering that the utilized UAV-based MMS was flown above the canopy under an open-sky condition without GNSS signal outages, the post-processed trajectory is expected to be accurate. As for the system calibration parameters, the IOP of a LiDAR unit is usually provided by the manufacturer and is relatively accurate/stable. Camera IOP and mounting parameters relating the LiDAR/camera sensor frames to the IMU body frame were estimated through a system calibration procedure [63].
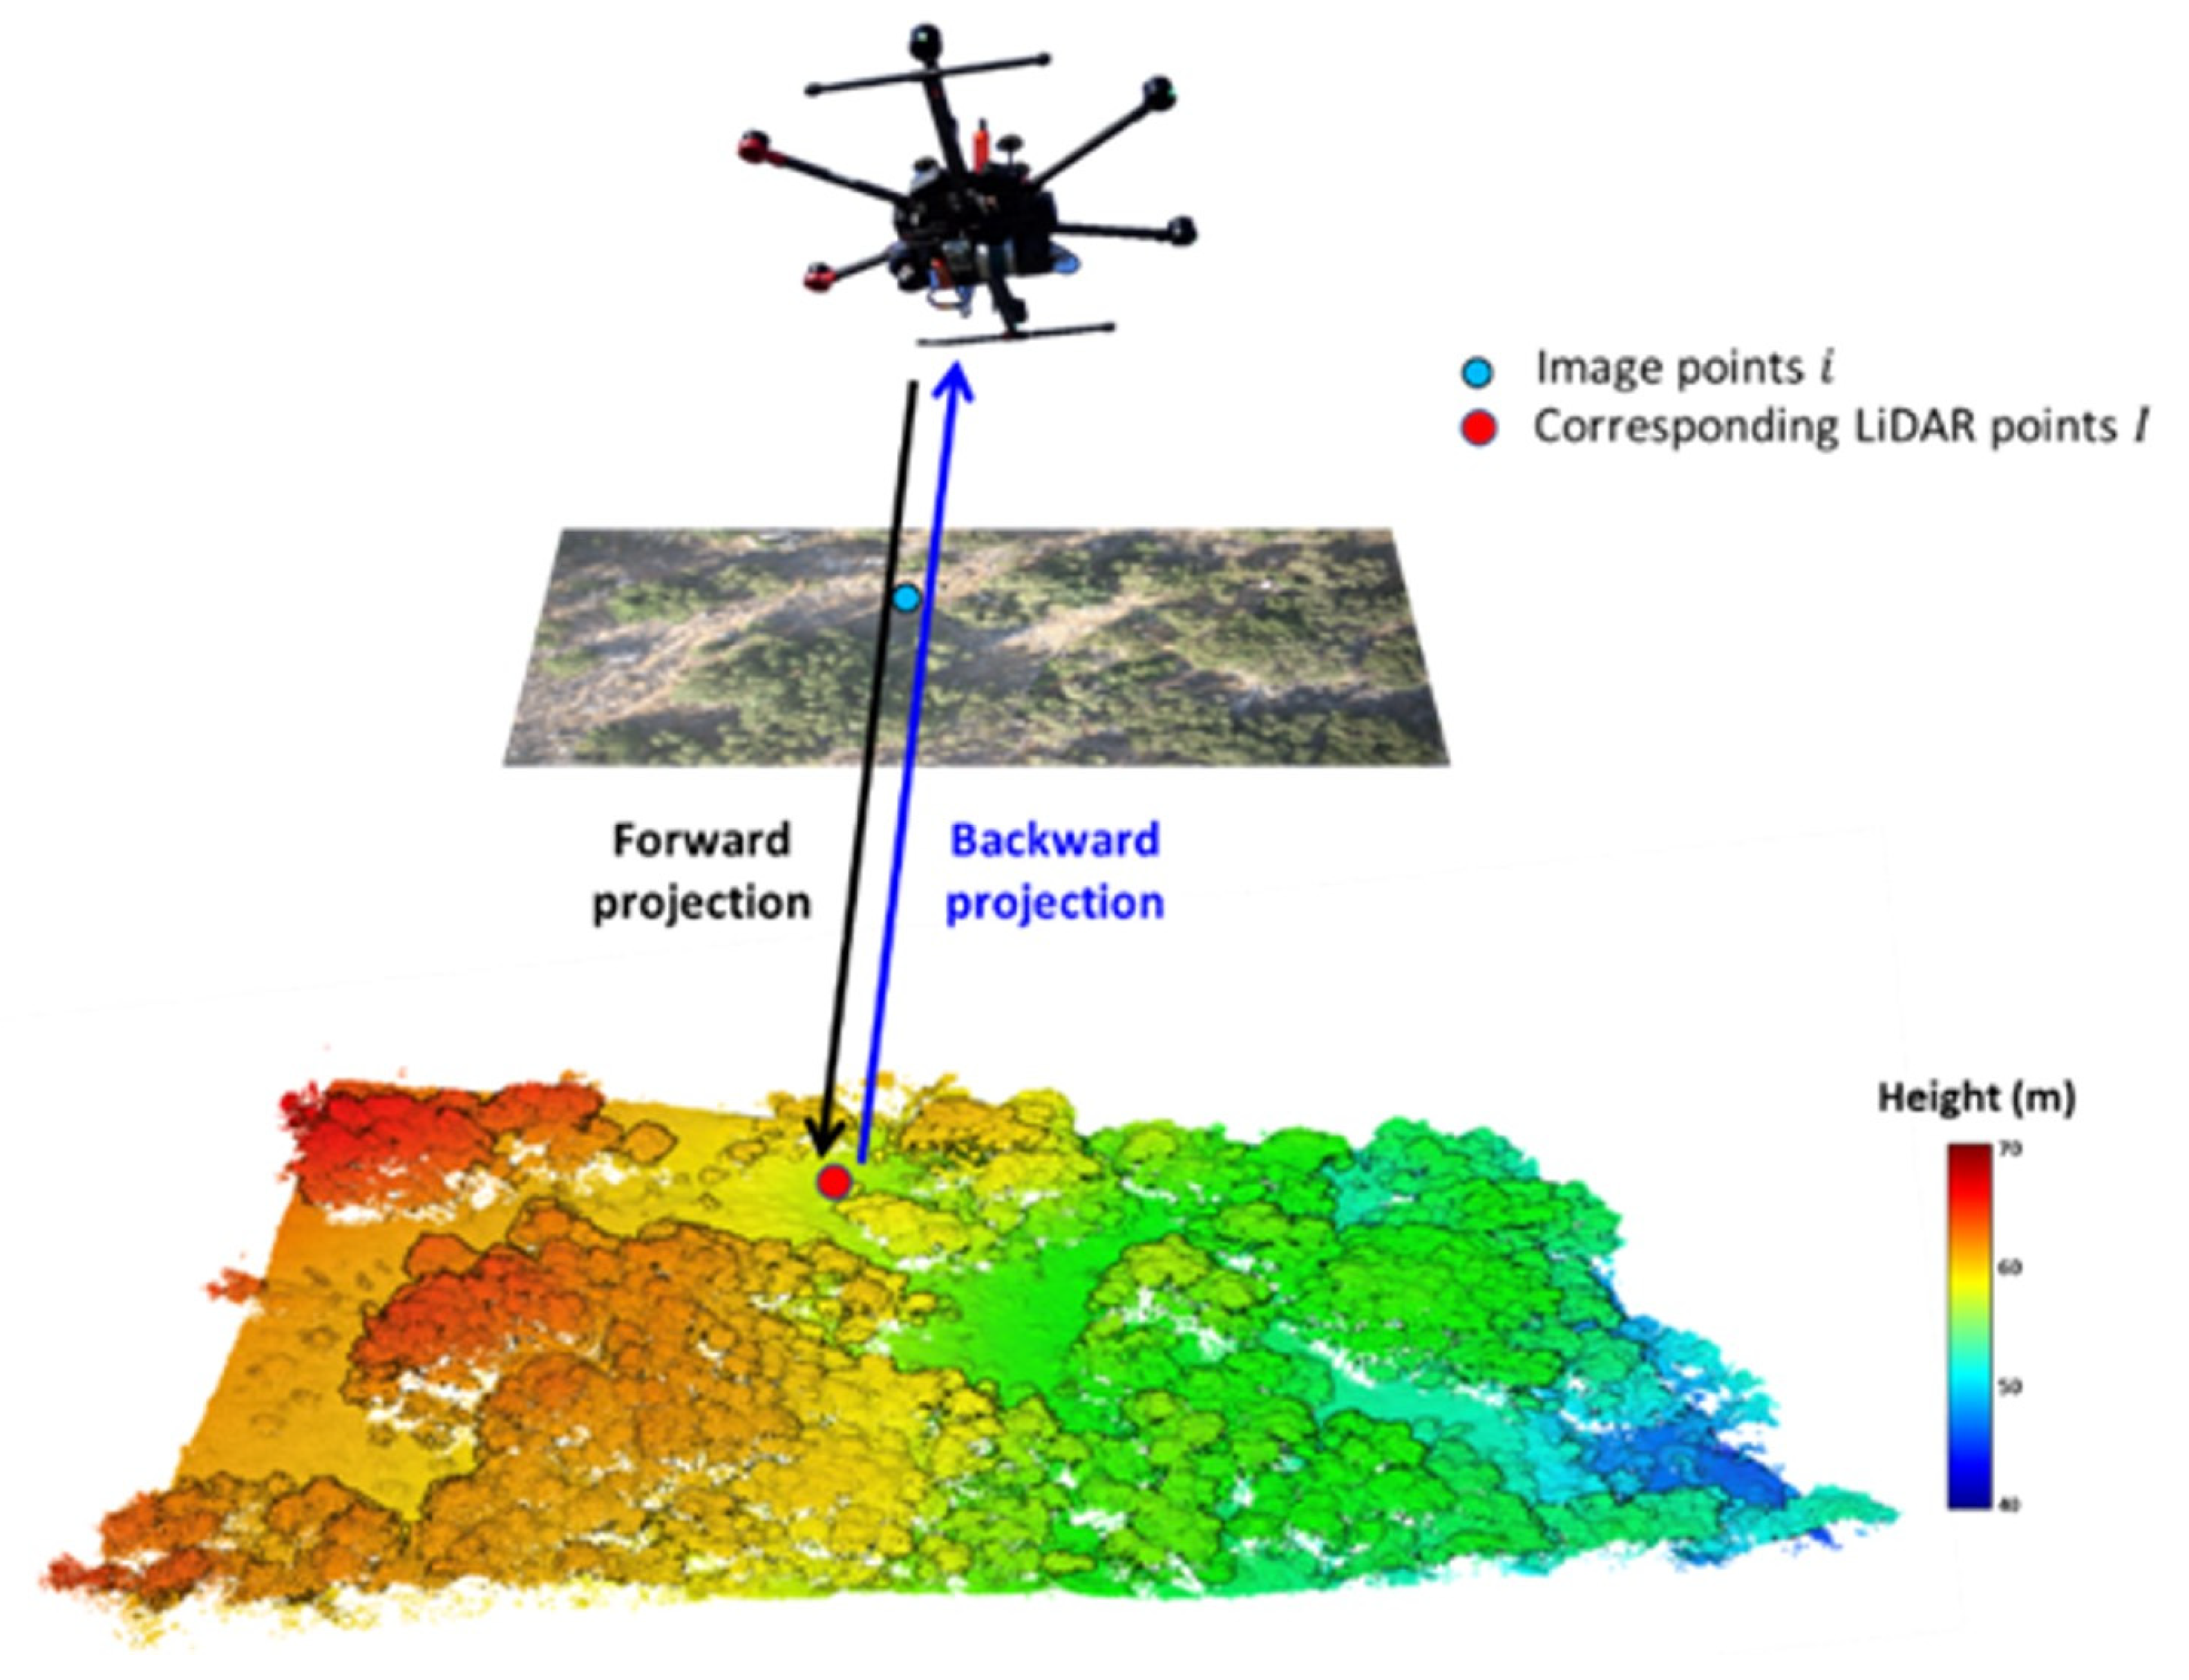
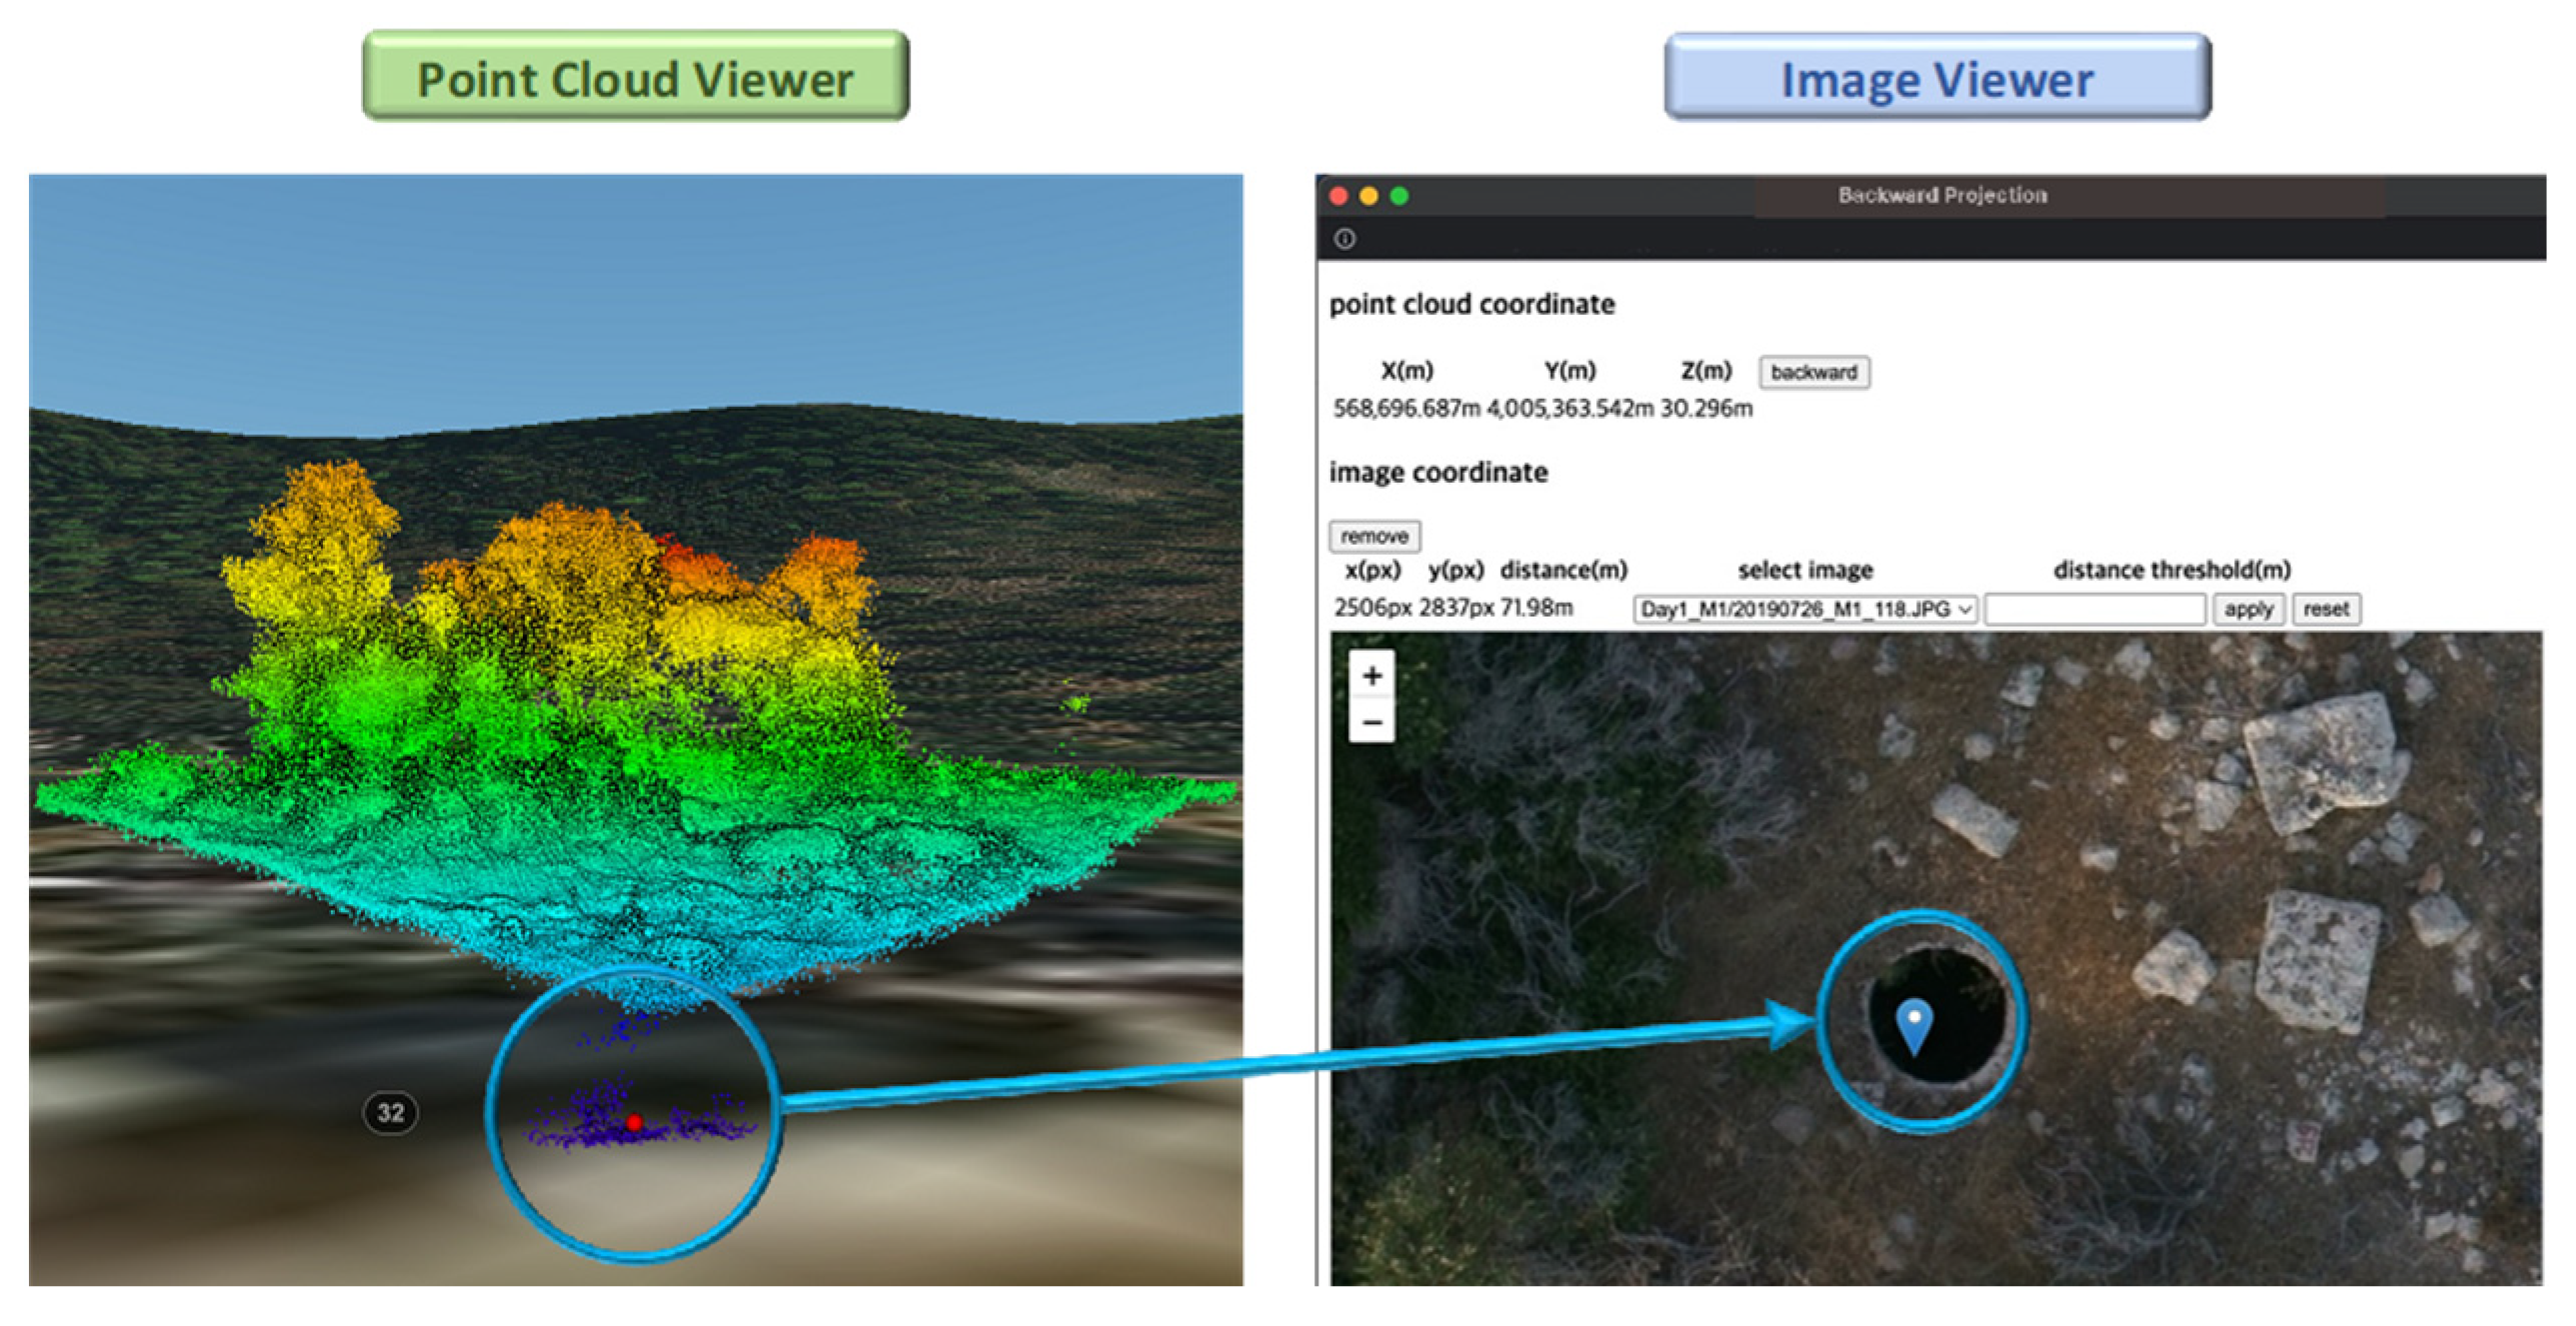
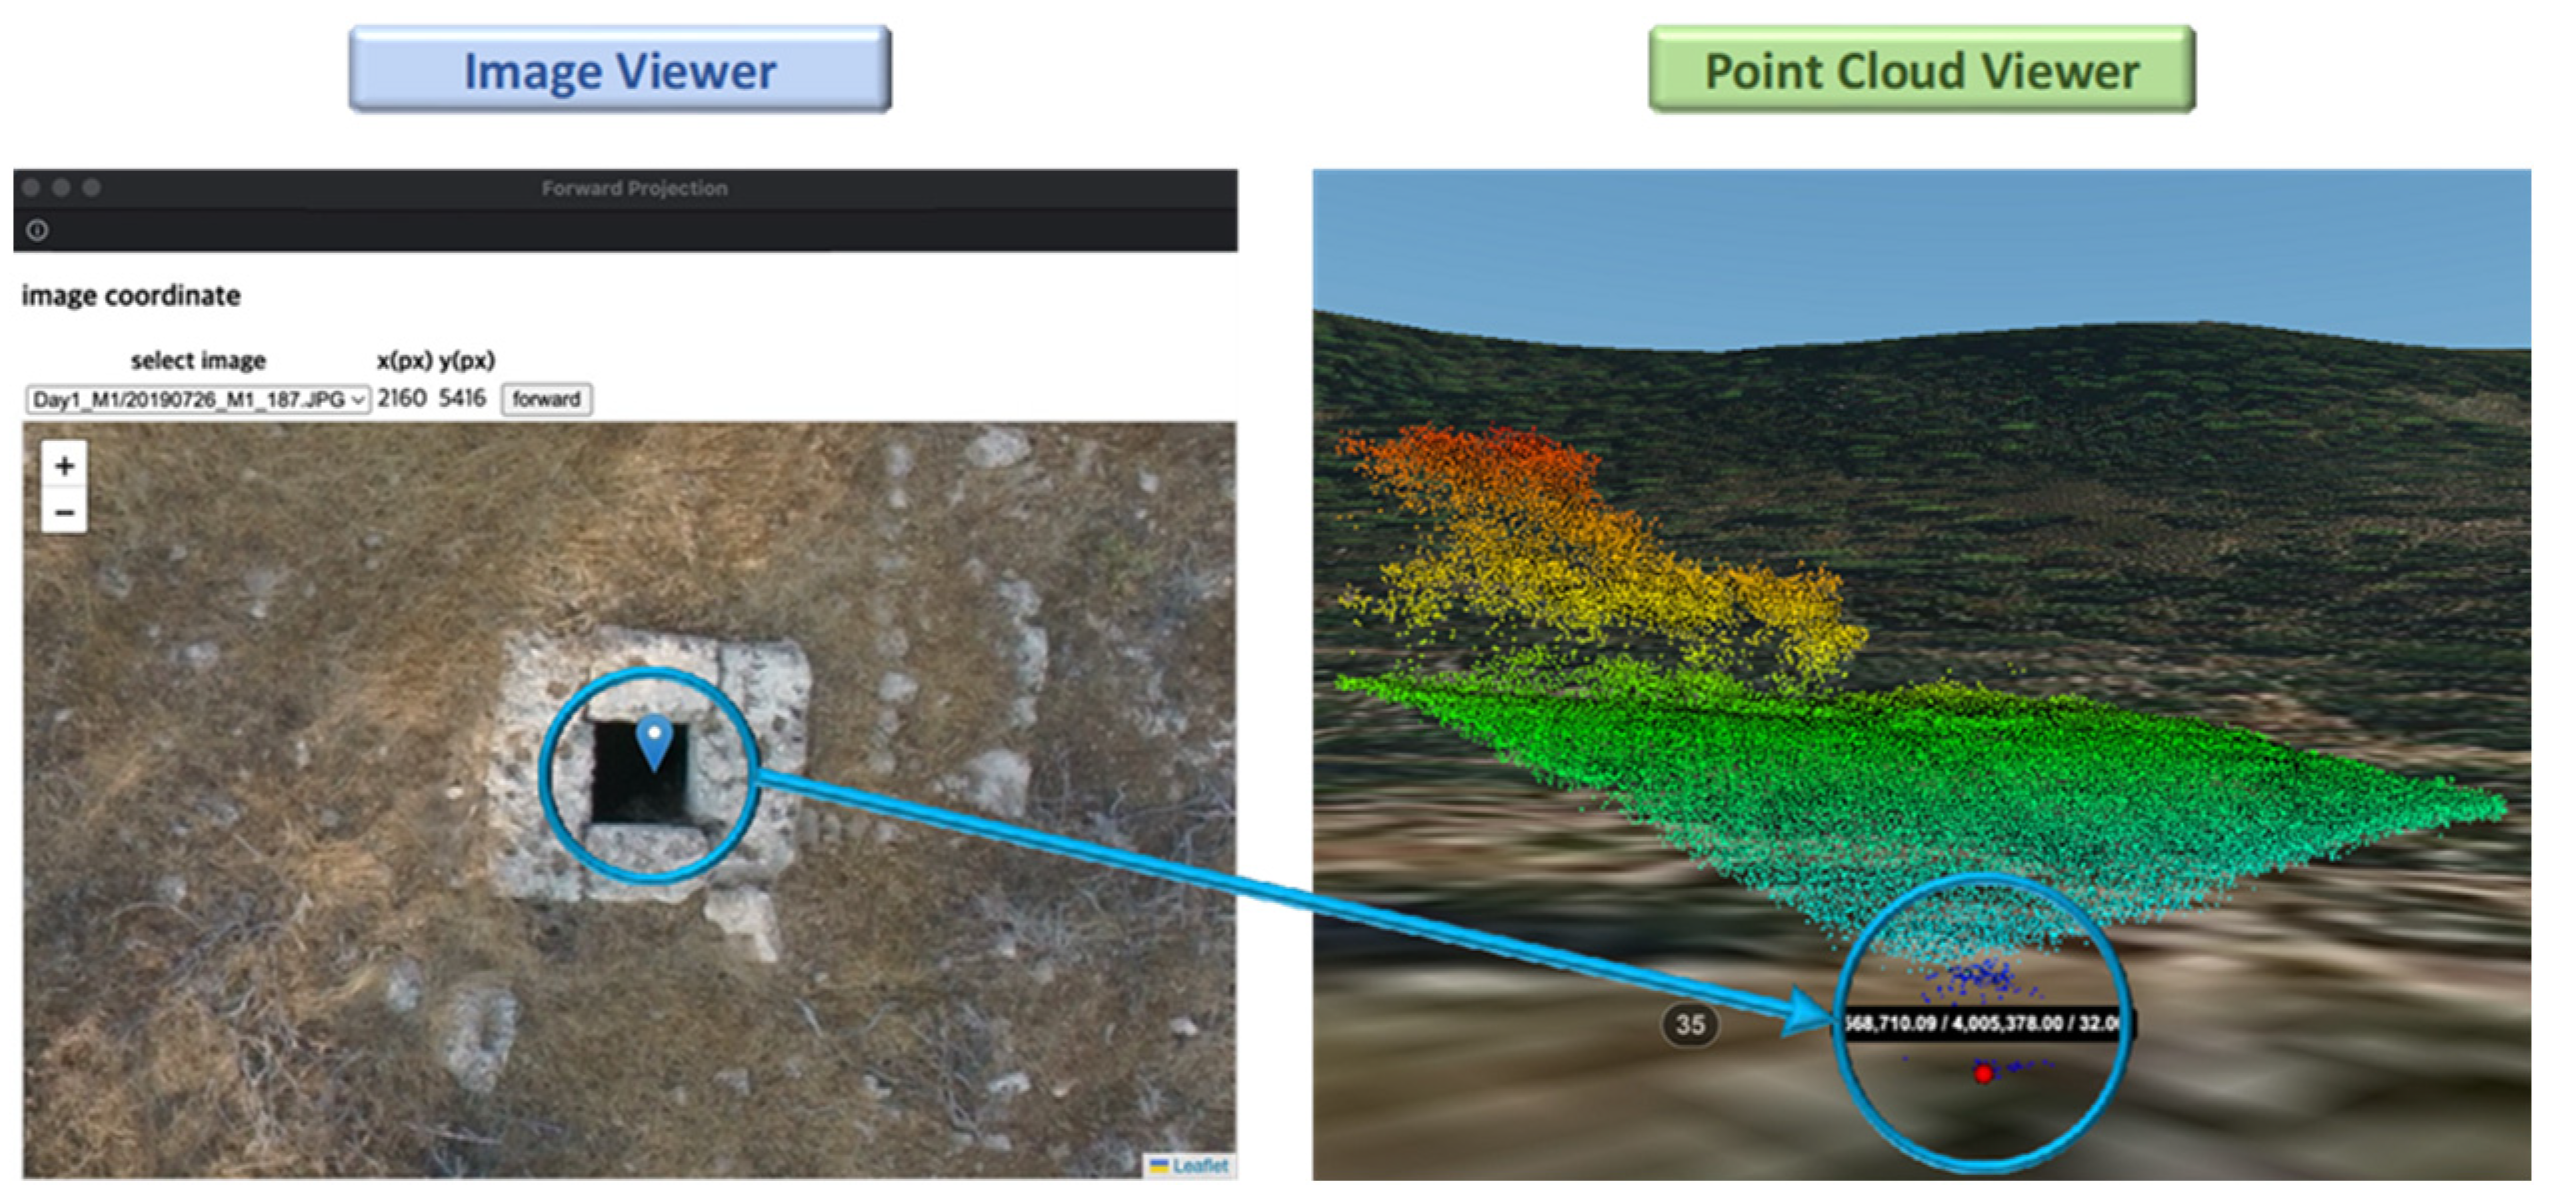
Based on the point positioning equation (Equations (1) and (3)), a LiDAR point cloud was directly reconstructed. In this study, a LiDAR point was reconstructed only when the direction of the corresponding laser beam was less than ± 70 ° from the nadir direction. In this study, imagery acquired by the onboard camera was used for visualization through interactive backward and forward projection between 2D images and 3D LiDAR point clouds. Such image-based visualization involves two main processes: (i) for a 3D object identified in the point cloud, one should derive the corresponding point in an image where it is visible (i.e., denoted as backward projection; (ii) for a selected feature point in an image, we need to identify the corresponding location in a LiDAR point cloud (i.e., the location denoted as forward projection). In other words, backward/forward projection processes establish the link between the 2D imagery and 3D LiDAR point cloud, as shown in Figure 6.
In the backward projection of an object point I in the LiDAR point cloud, its corresponding image point x i ,   y i can be directly evaluated. More specifically, the image point positioning equations (Equations (2) and (4)) can be reformulated into Equation (5), where the image coordinates are represented as a function of known parameters—GNSS/INS trajectory information, camera IOP, camera mounting parameters, and ground coordinates of the object point—and the unknown scale factor λ i , c ,   t . To eliminate the unknown scale factor in this equation, the first and second rows are divided by the third one, and the image point coordinates x i ,   y i are expressed as per Equations (6) and (7).
r i c t = 1 λ i , c , t   R b c R m b t r I m r b t m R b t m r c b = 1 λ i , c , t N x N y D  
x i = c N x D + x p + d i s t x i
y i = c N y D + y p + d i s t y i
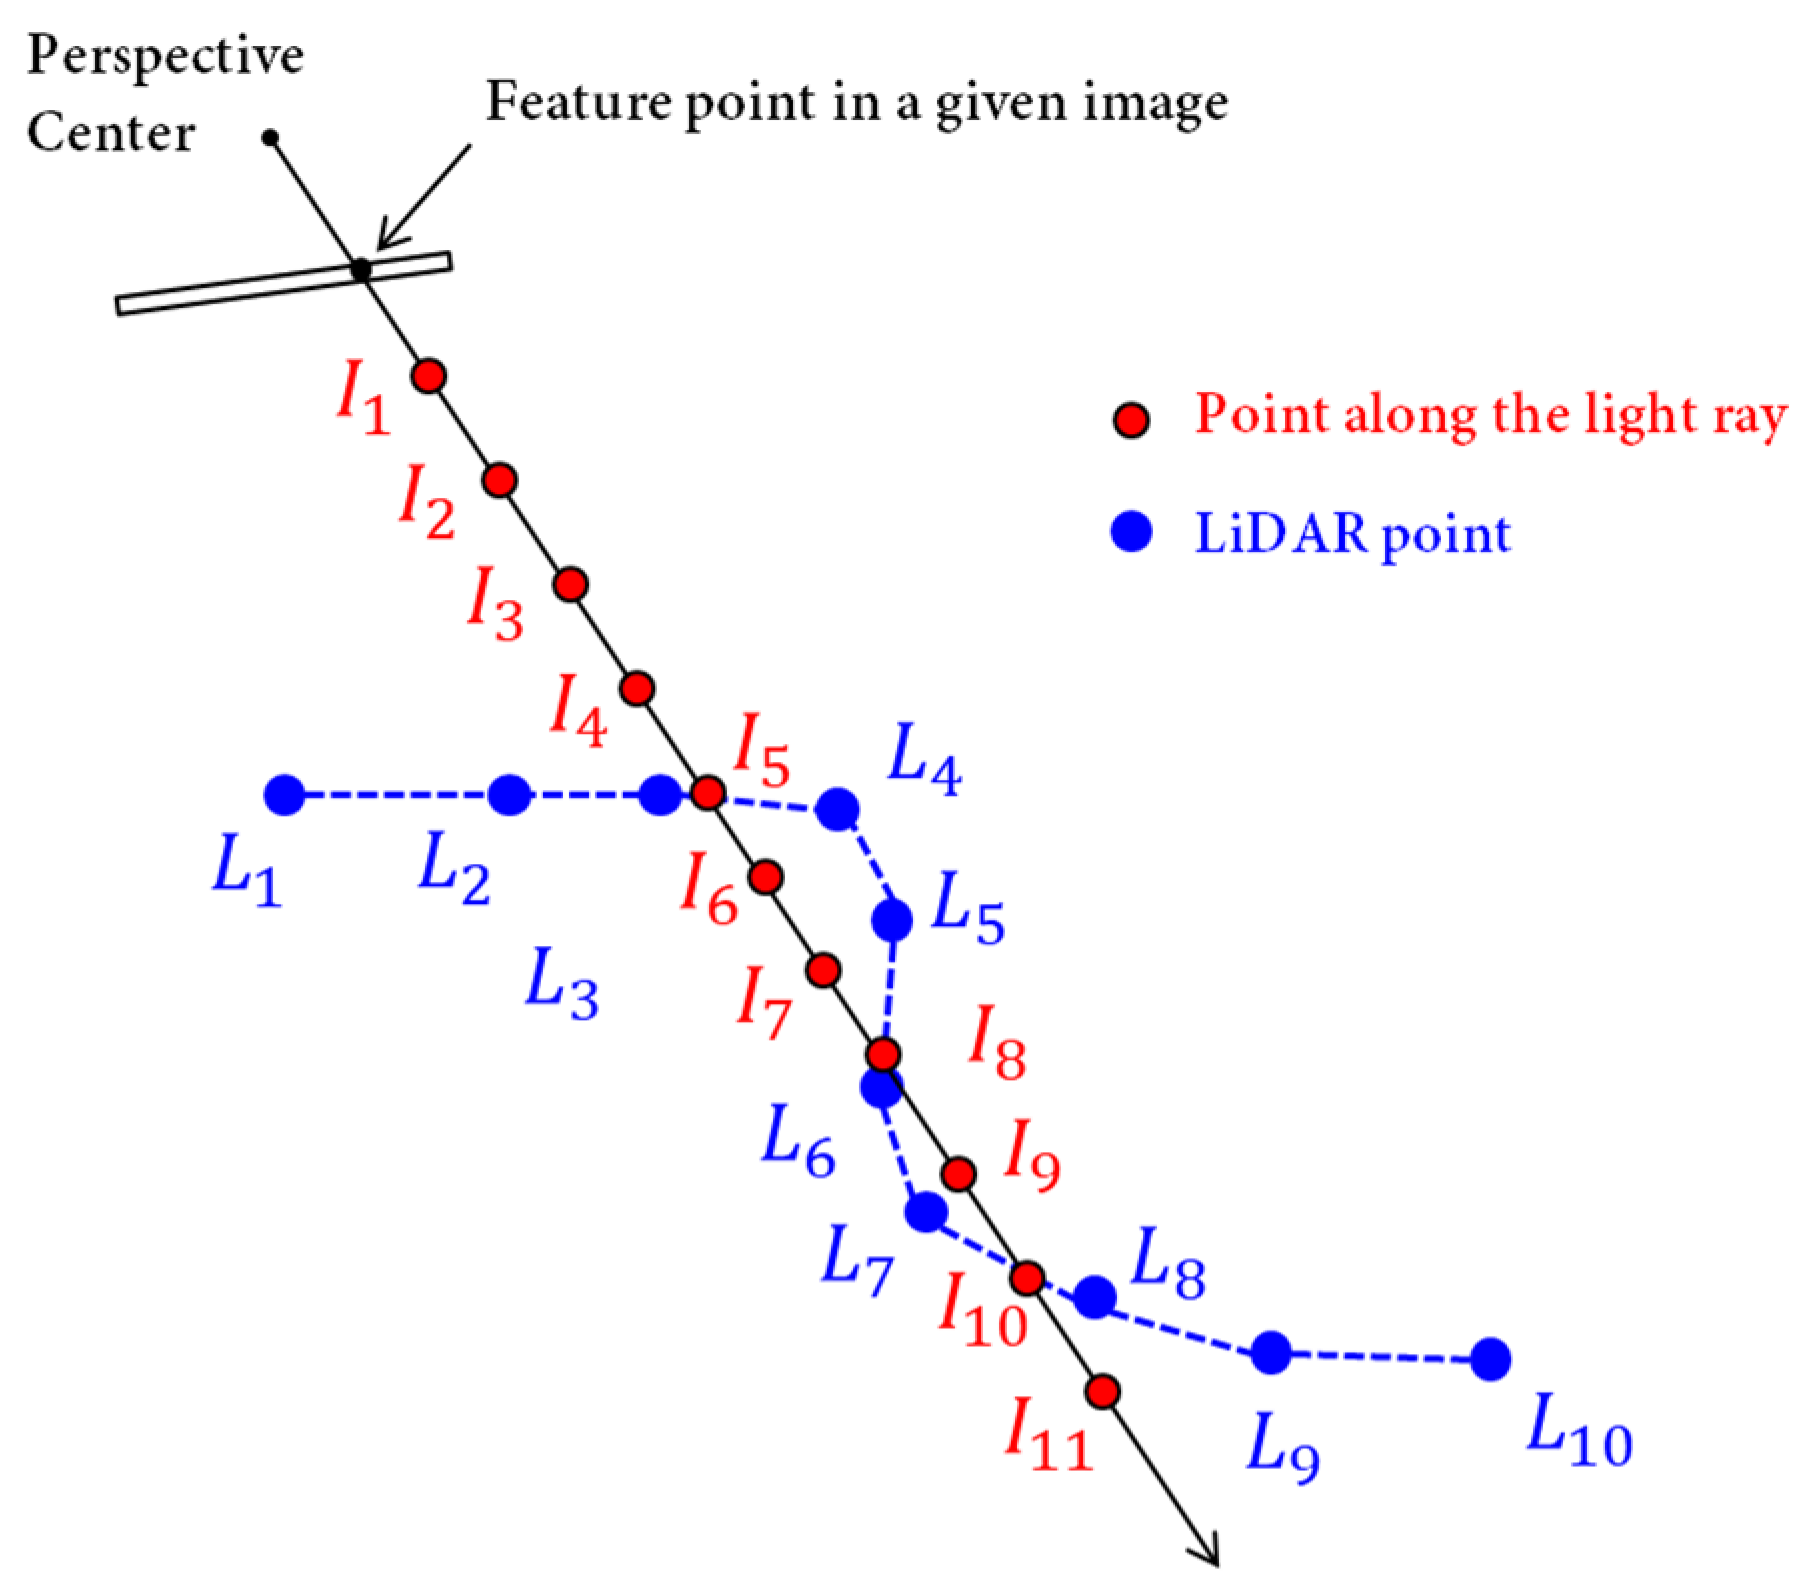
For the forward projection of an image point x i ,   y i , its corresponding 3D coordinates are estimated by finding the intersection between the imaging ray and the 3D surface defined by the LiDAR data. In particular, the unknown scale factor λ i , c , t in Equation (2) is solved for in this process. To solve this scale factor in this work, an octree-based ray tracing algorithm similar to the one proposed by Revelles et al. [64] was adopted. More specifically, an octree of LiDAR points was first built. Then, a set of points was generated at equal distances along the imaging ray. For each point along the light ray I , its closest point in the LiDAR octree tree L was identified and the distance between these two points d was computed. Next, starting from the point I 1 that is closest to the perspective center, the first point I i that meets the following criteria was identified: (i) the distance d i was smaller than a threshold (e.g., 0.2 m) and (ii) the distance d i was smaller than the distance from the next point d i + 1 . These conditions guarantee that the intersection of the light ray with the closest LiDAR surface (i.e., the visible surface) is identified. Finally, the forward projection solution was derived by projecting the closest LiDAR point to I i onto the imaging ray. This process is schematically illustrated in Figure 7.

3.2. Underground Structure Detection

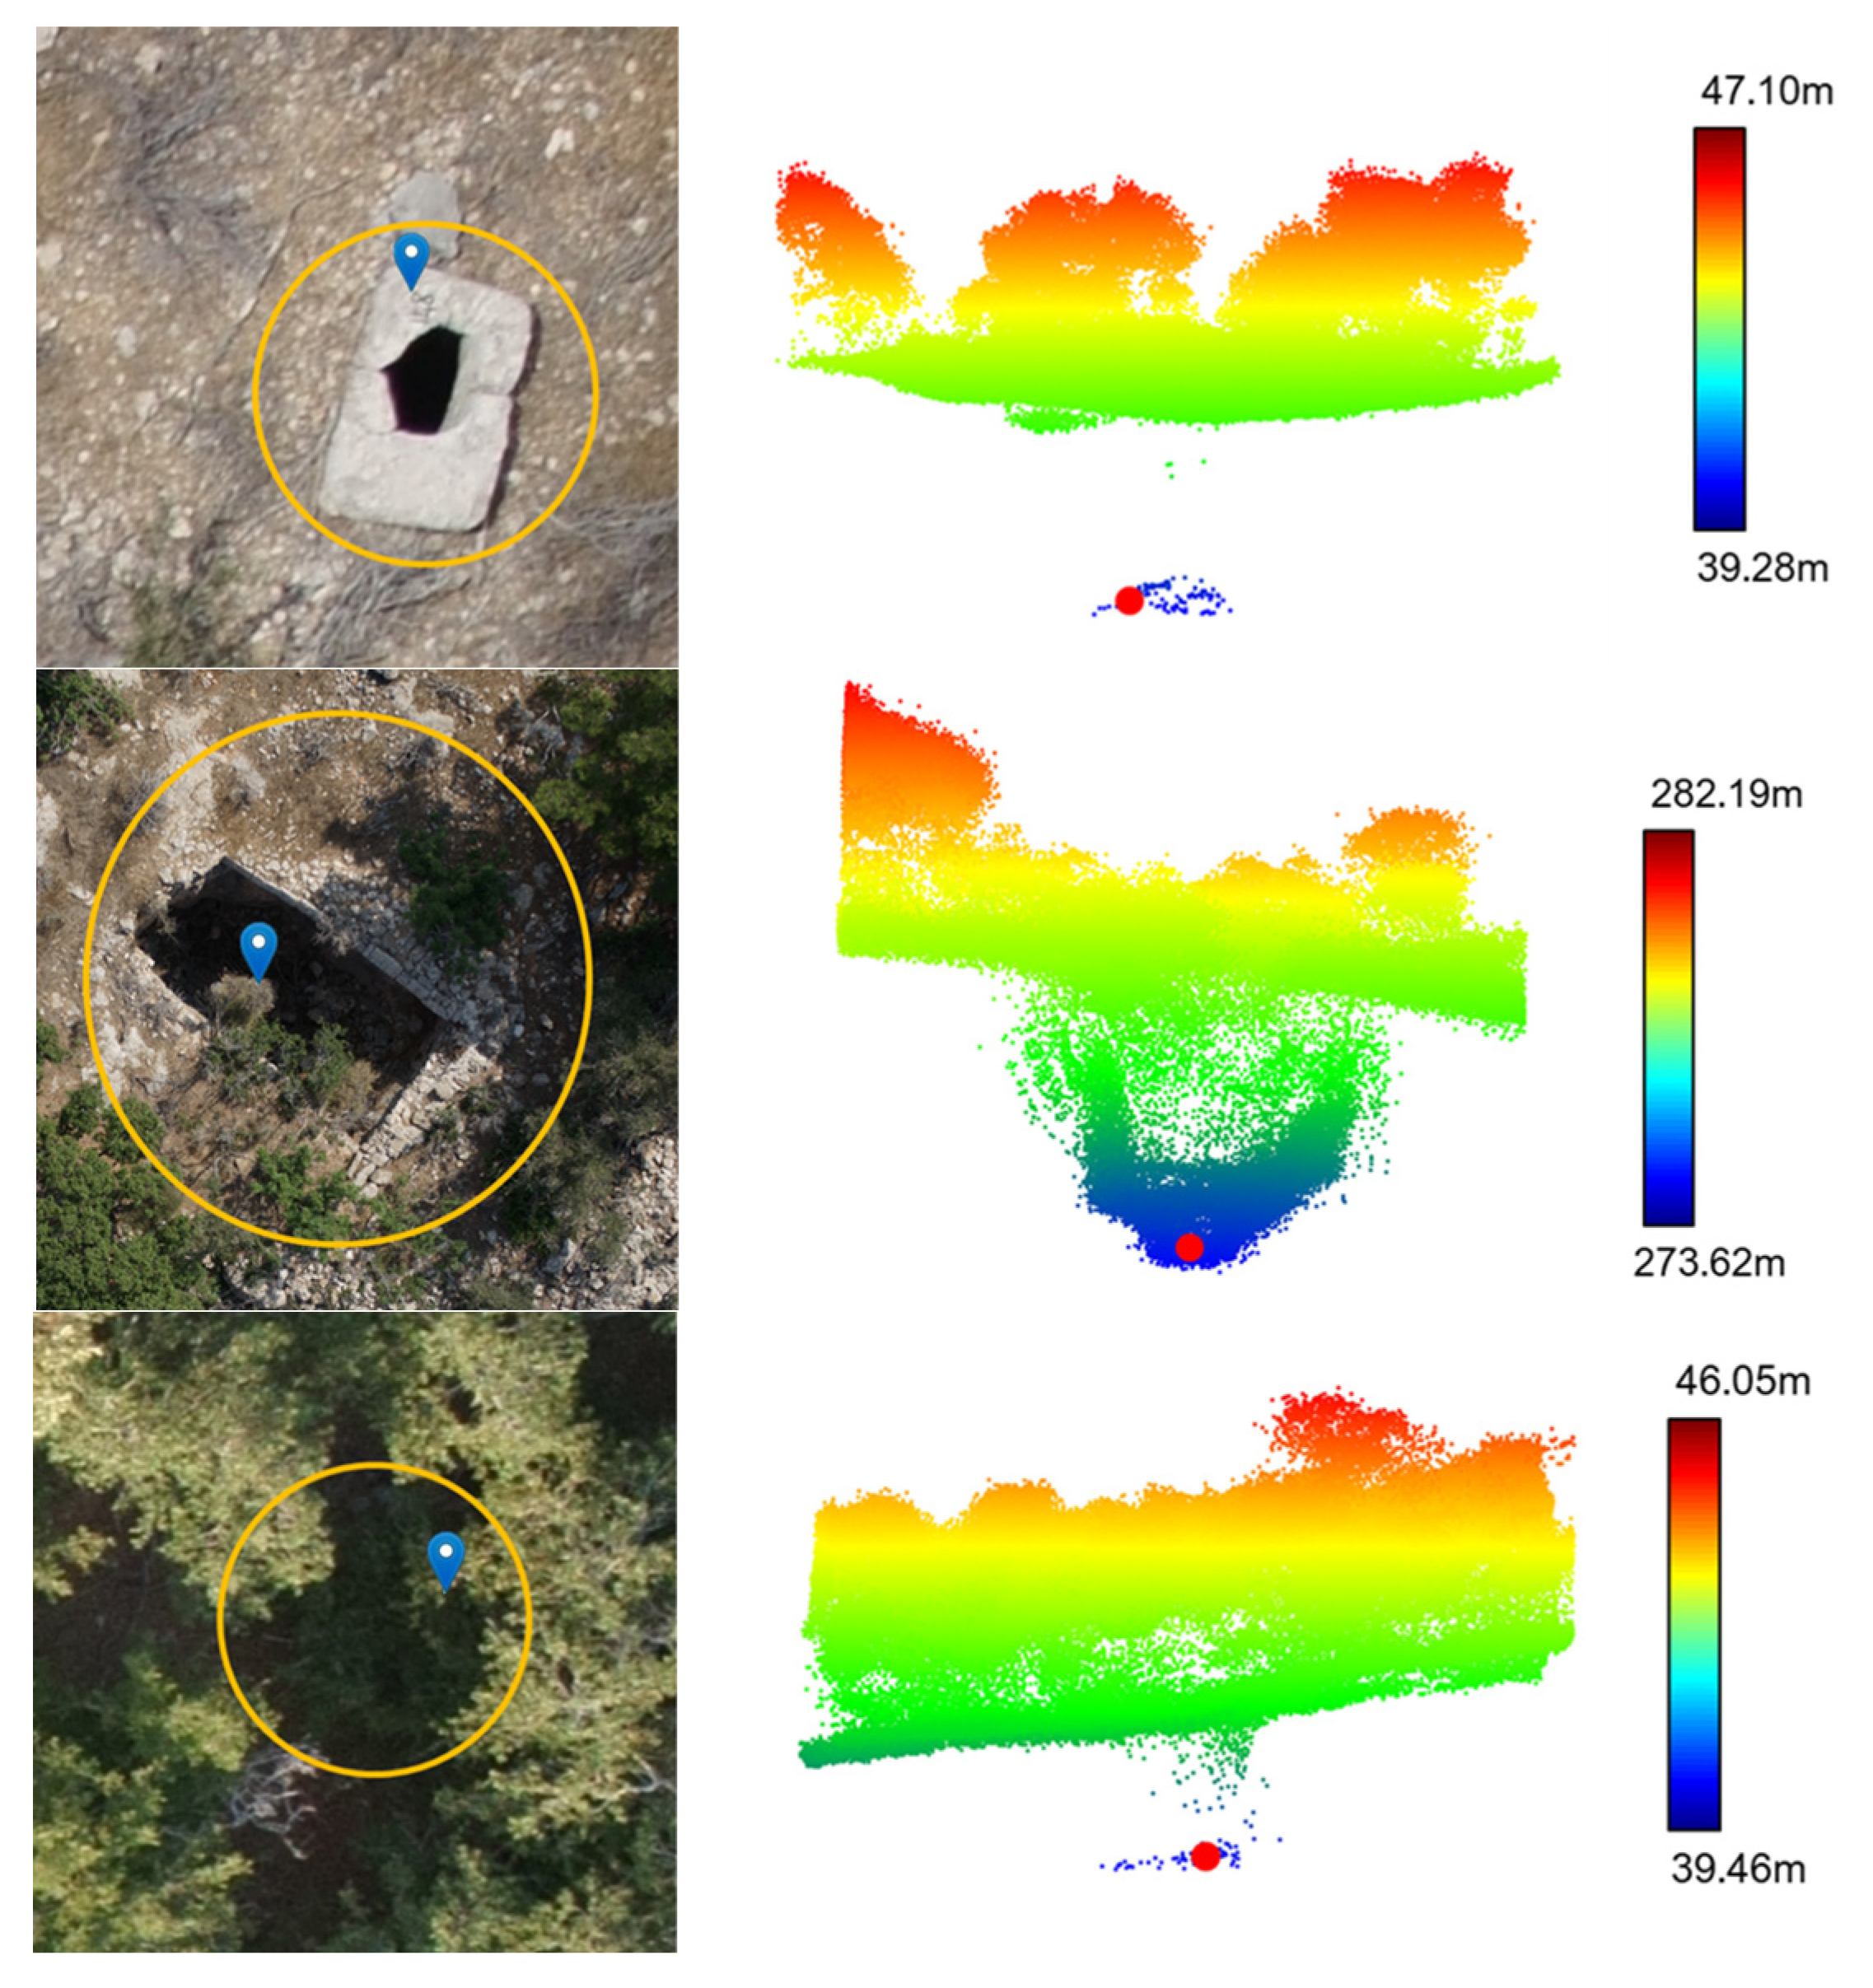
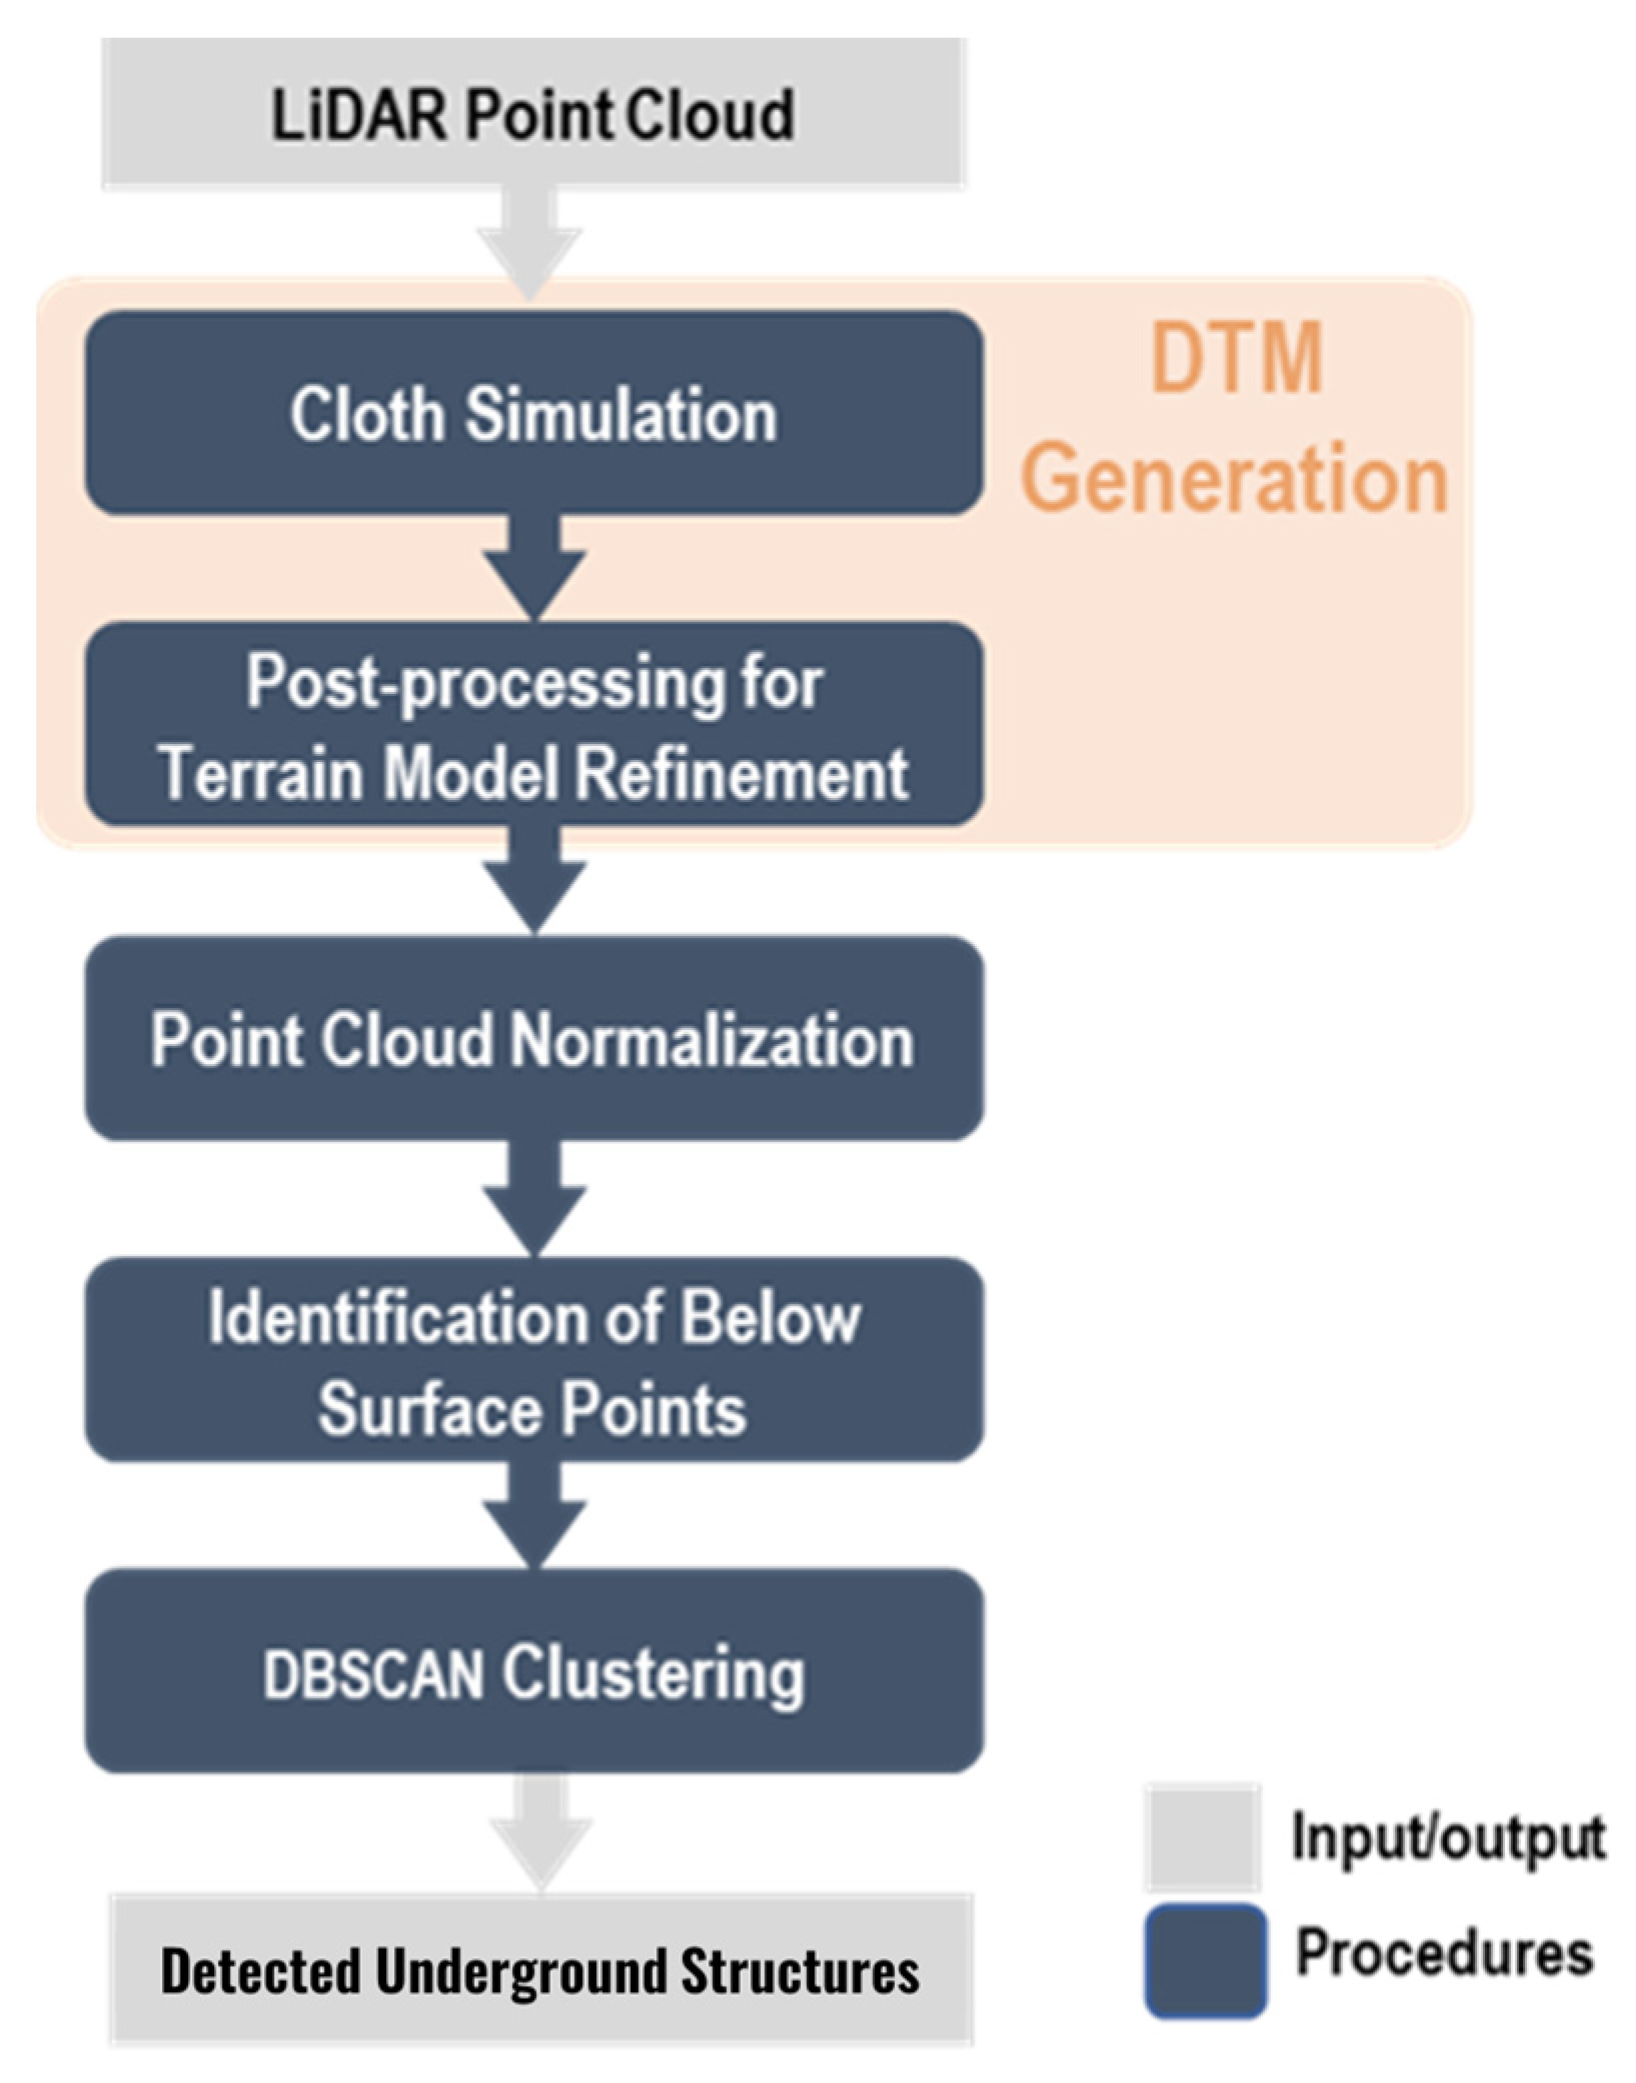
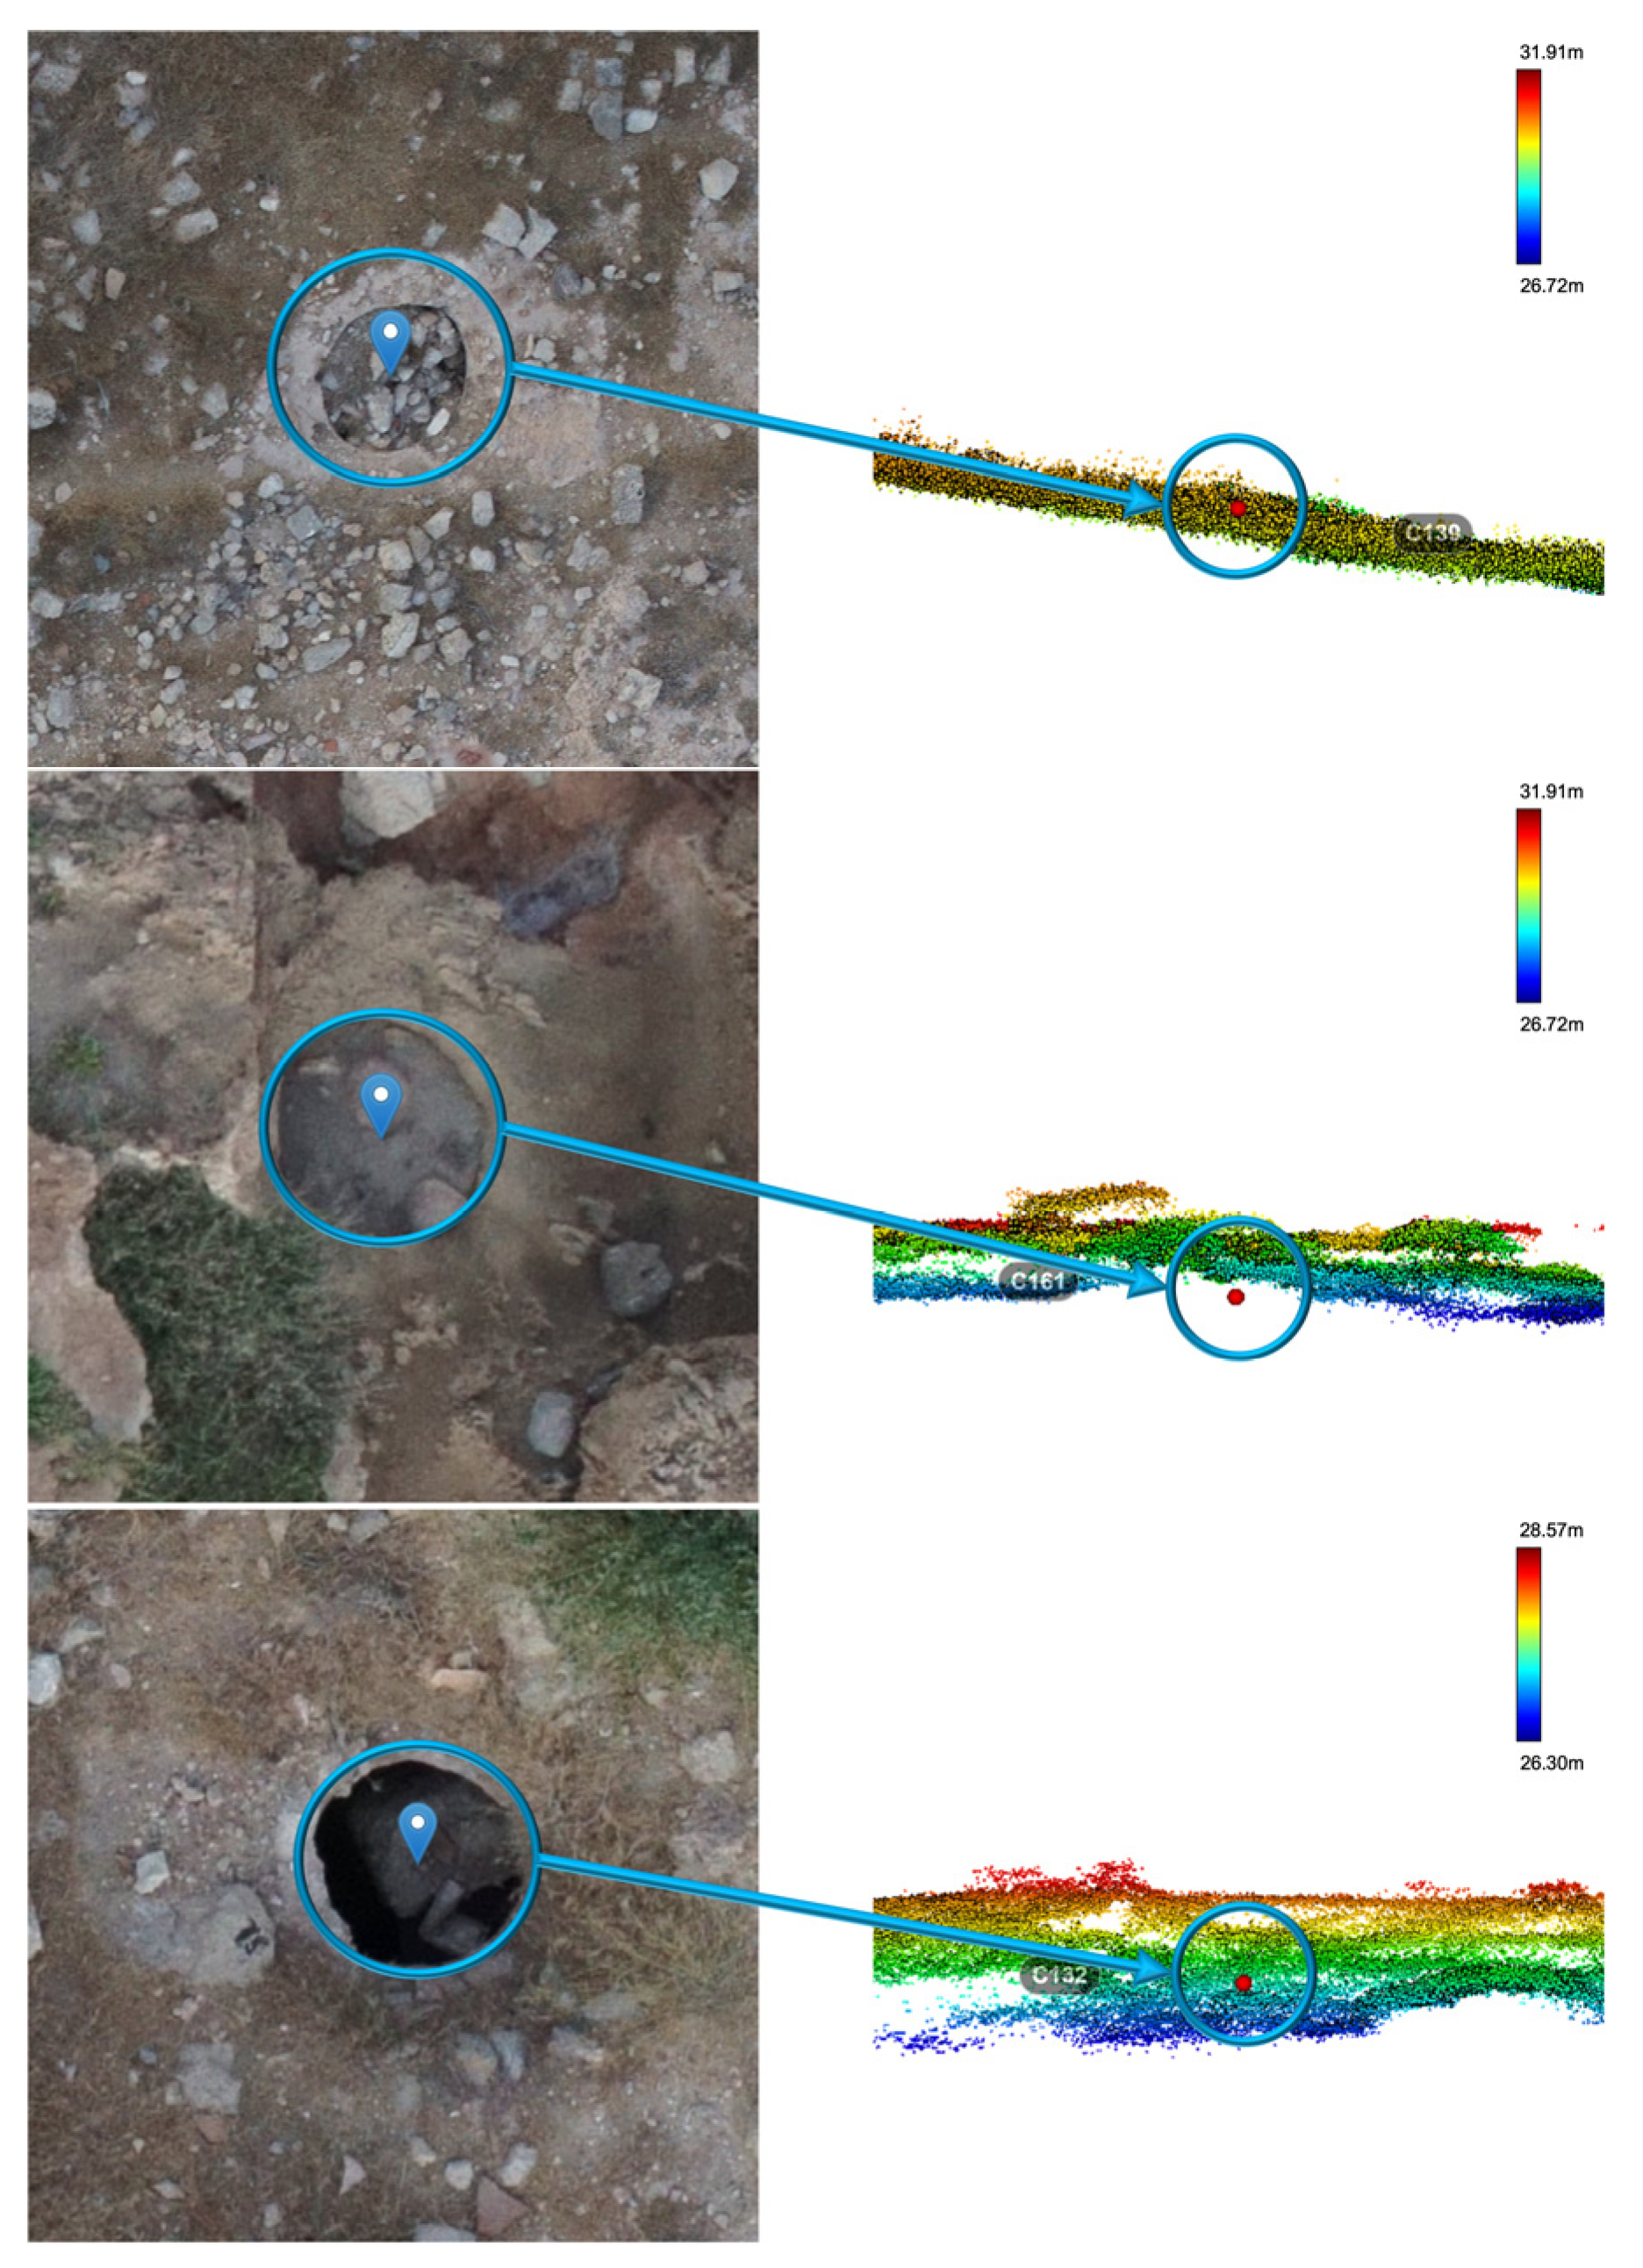
The second objective of the proposed work in this study is to develop a robust, automated strategy for the detection of underground structures similar to those in Figure 8. The top two rows in this figure show situations where objects of interest can be detected from imagery. However, the last row shows a situation where the underground structure cannot be detected in the image due to canopy cover, although it is visible in the LiDAR point cloud. Therefore, the proposed methodology is based on the utilization of LiDAR data to detect these objects. As can be seen in Figure 8, for underground structures, LiDAR returns below the ground. Therefore, a terrain model comprising the bare-earth point cloud can be used for the identification of below-earth points, which could be grouped into clusters that are hypothesized as underground structures. The flowchart of the proposed methodology is shown in Figure 9.
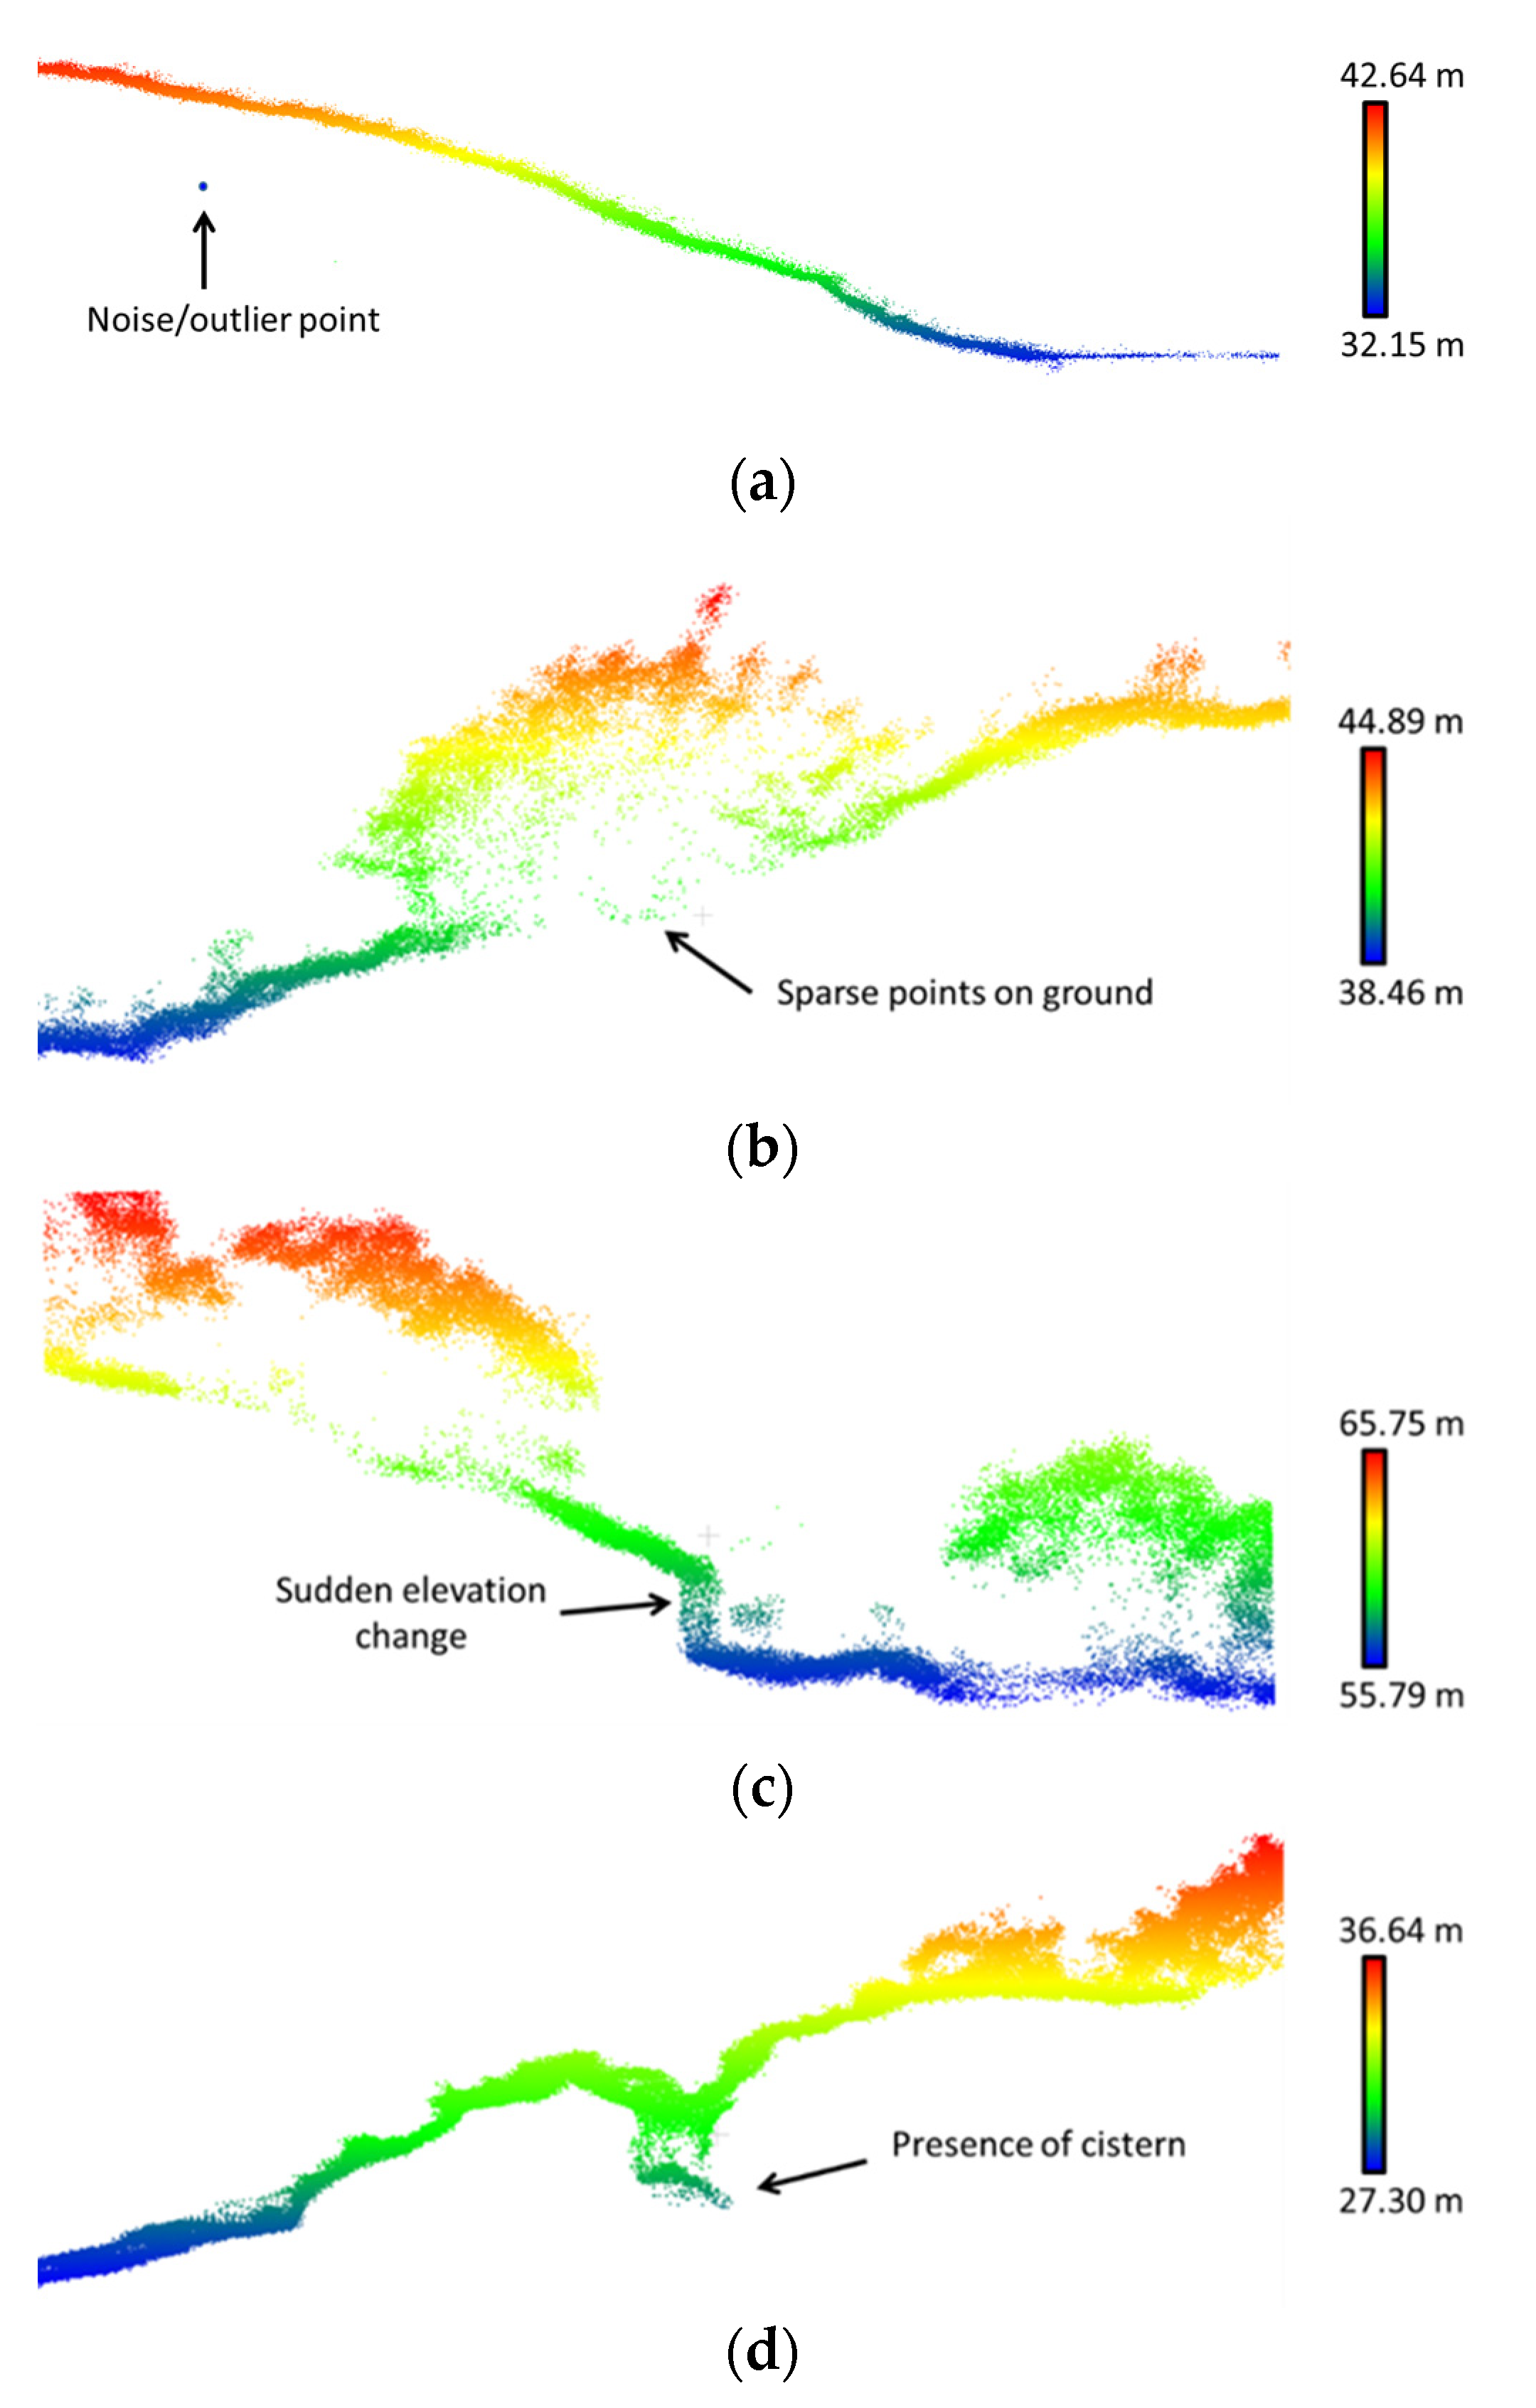
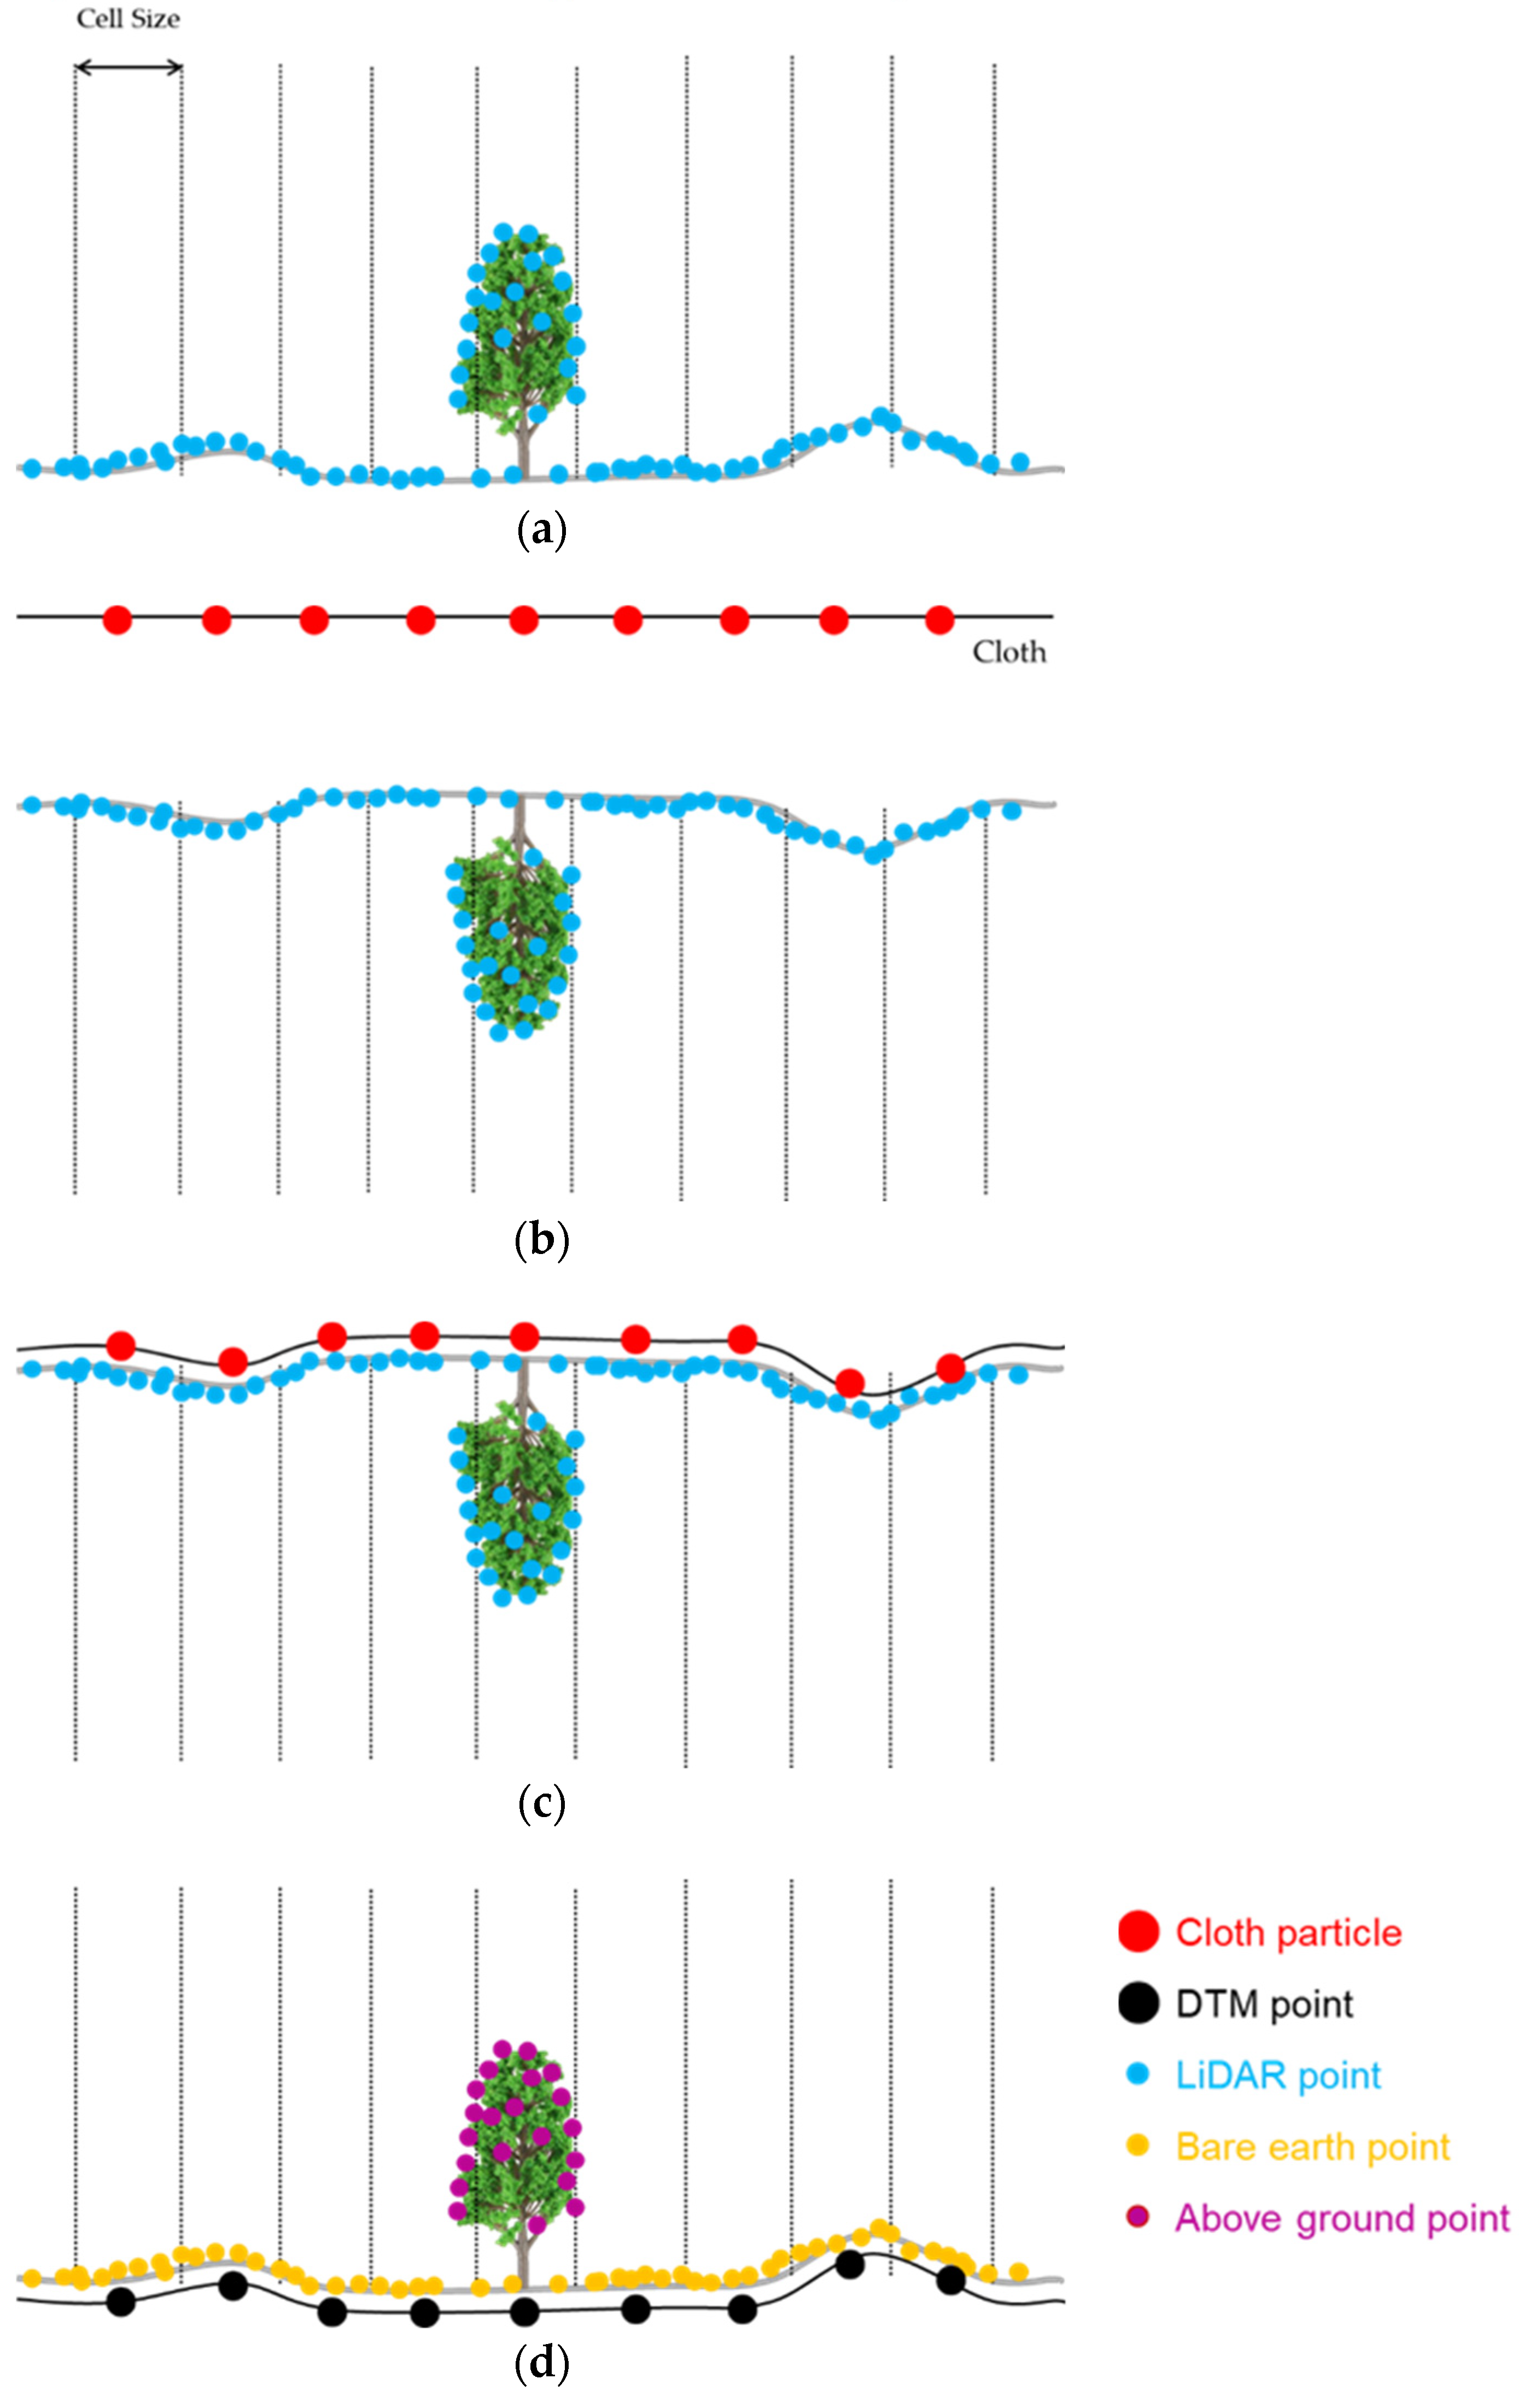
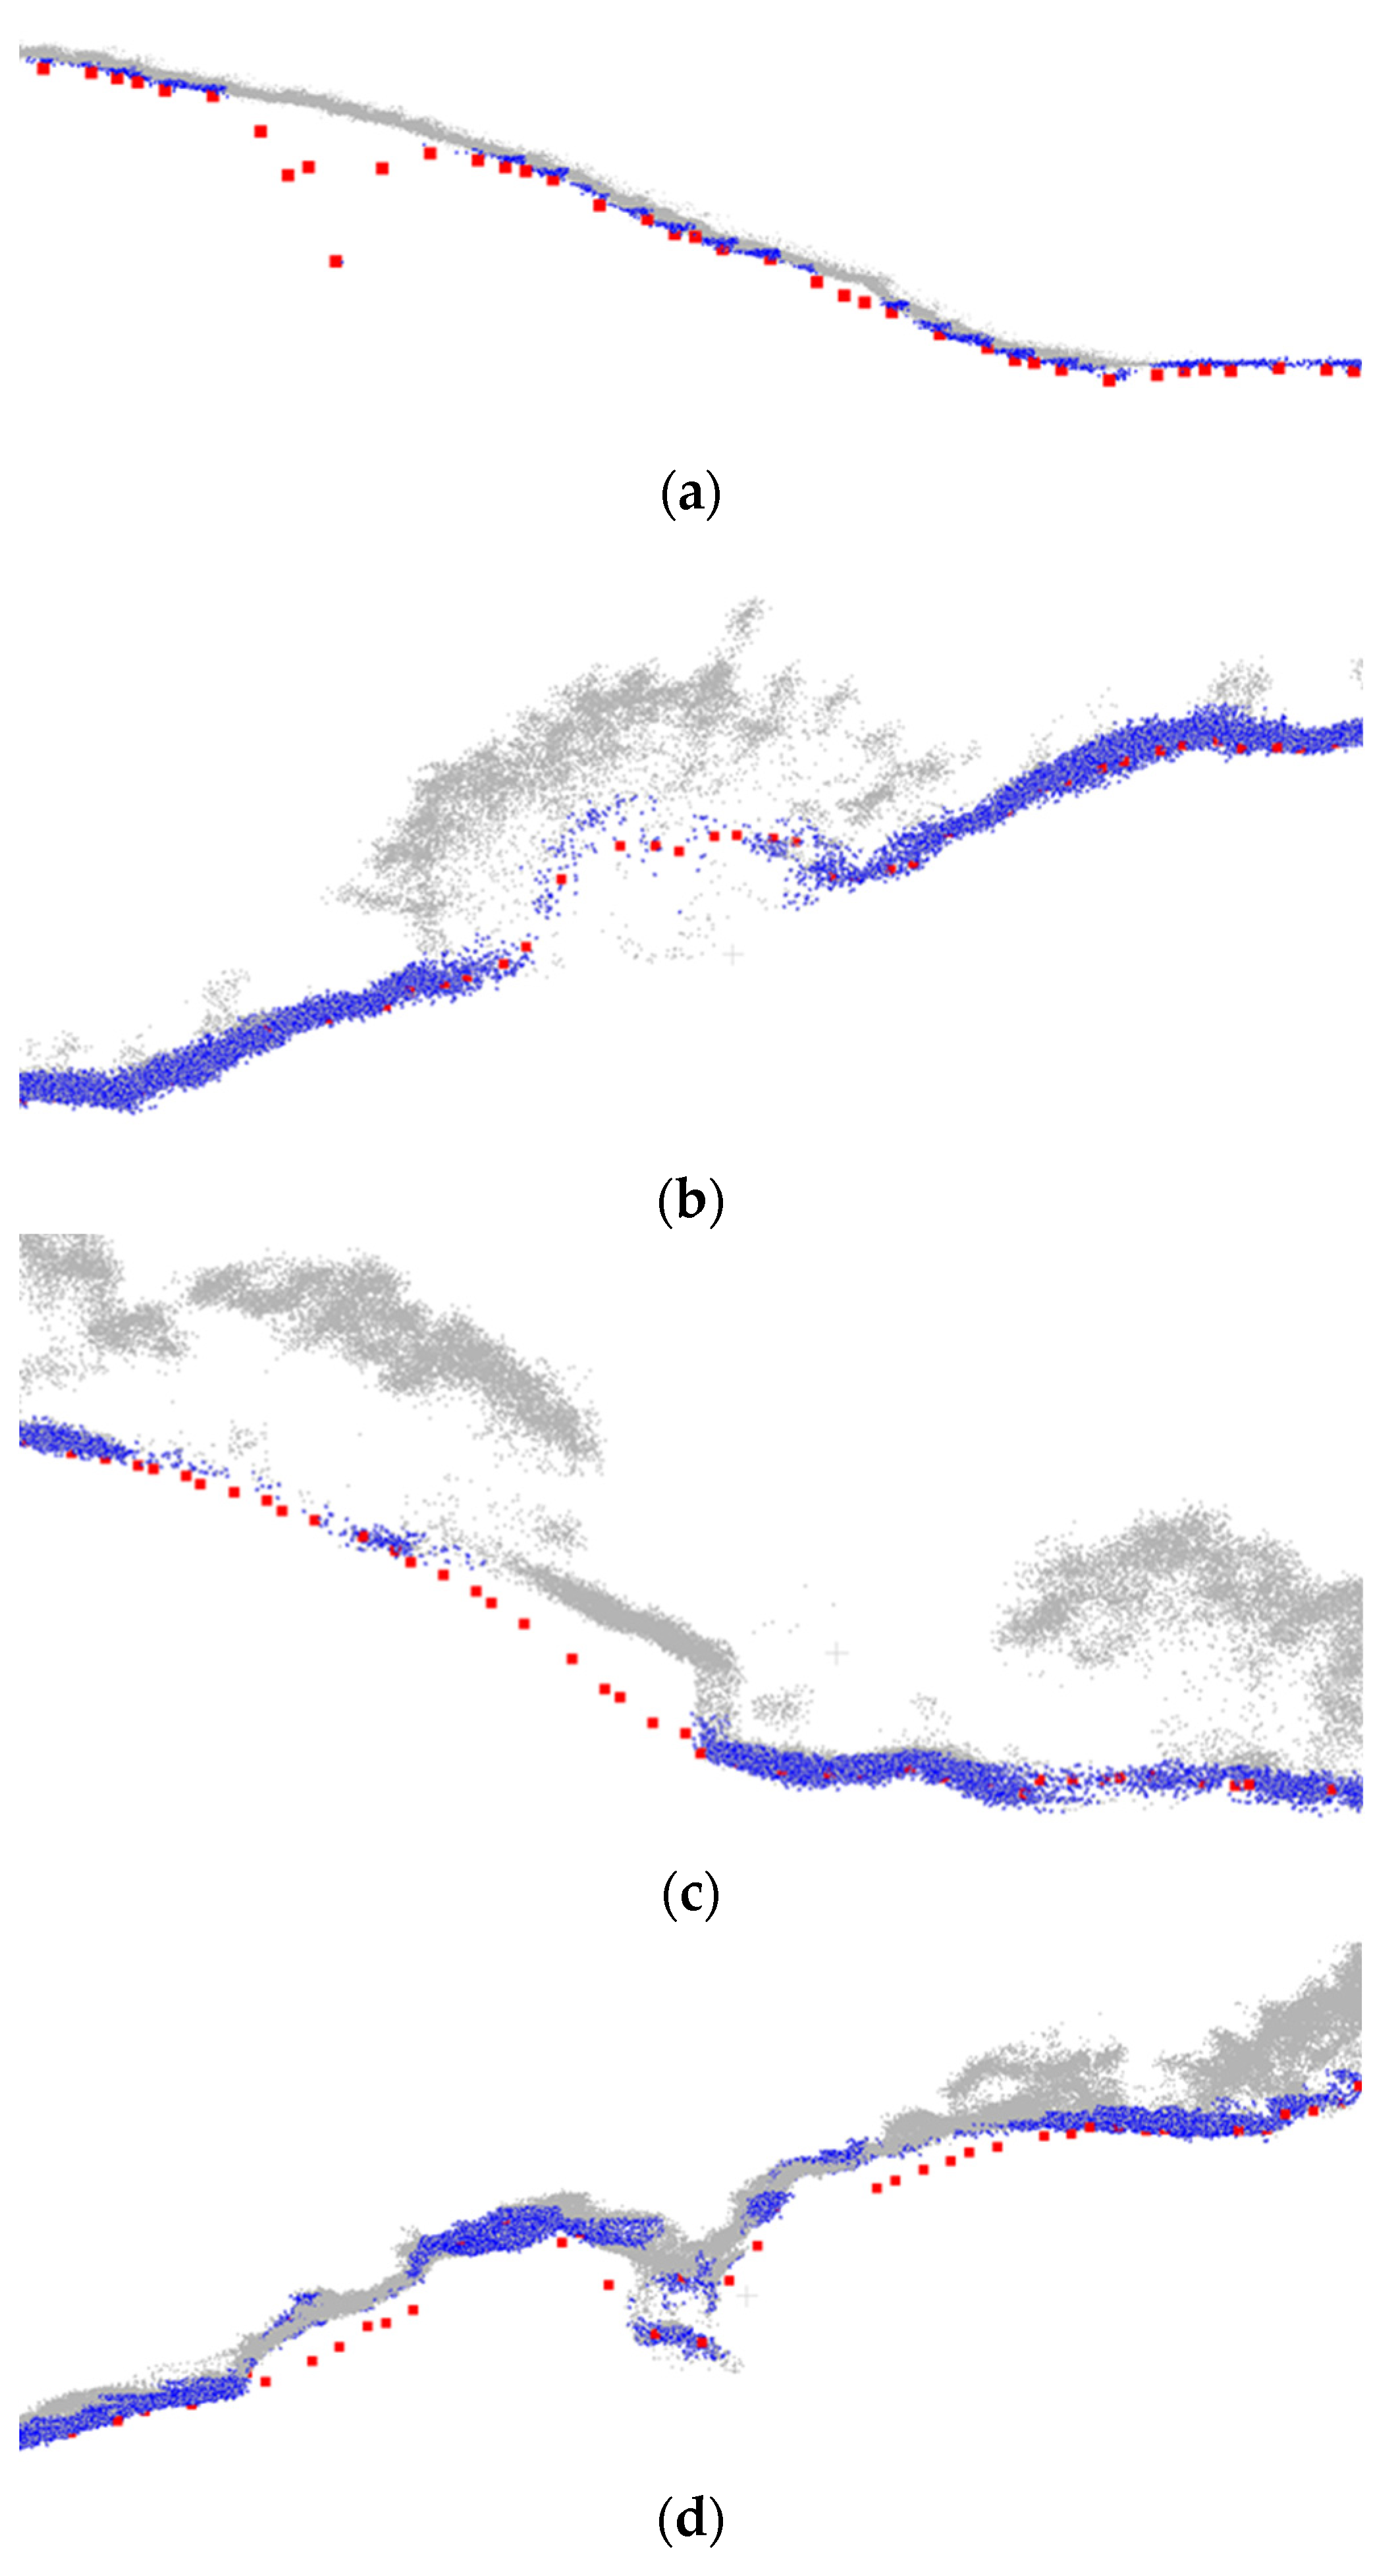
The main challenges in deriving a reliable terrain model from LiDAR data over a complex site such as Dana Island include (as can be seen in Figure 10): (1) the presence of some noise/outliers in the point cloud; (2) dense vegetation that would lead to sparse points below canopy; (3) rugged terrain with sudden elevation changes; and (4) the presence of underground structures. Among the existing terrain model generation strategies, the cloth simulation algorithm has been repeatedly used in the prior literature [65,66,67]. A schematic diagram of the cloth simulation strategy is shown in Figure 11, which proceeds according to four steps: (i) turn the point cloud upside down, (ii) define a cloth (consisting of particles and their interconnections) with some rigidness, and place it above the point cloud, (iii) let the cloth drop under the influence of gravity and designate the final shape of the cloth as the DTM, and (iv) use the DTM to filter ground (i.e., bare earth points) from above-ground points. In spite of this simple yet sound procedure, the cloth simulation would result in less-desirable results for the derived DTM and bare-earth points when dealing with a complex environment. To illustrate the resulting artifacts, Figure 12 shows the derived terrain model and bare-earth points for the scenarios depicted in Figure 10 (one can see that the derived terrain model does not represent the actual ground surface). To produce more reliable results, the cloth simulation strategy has been modified as discussed below.
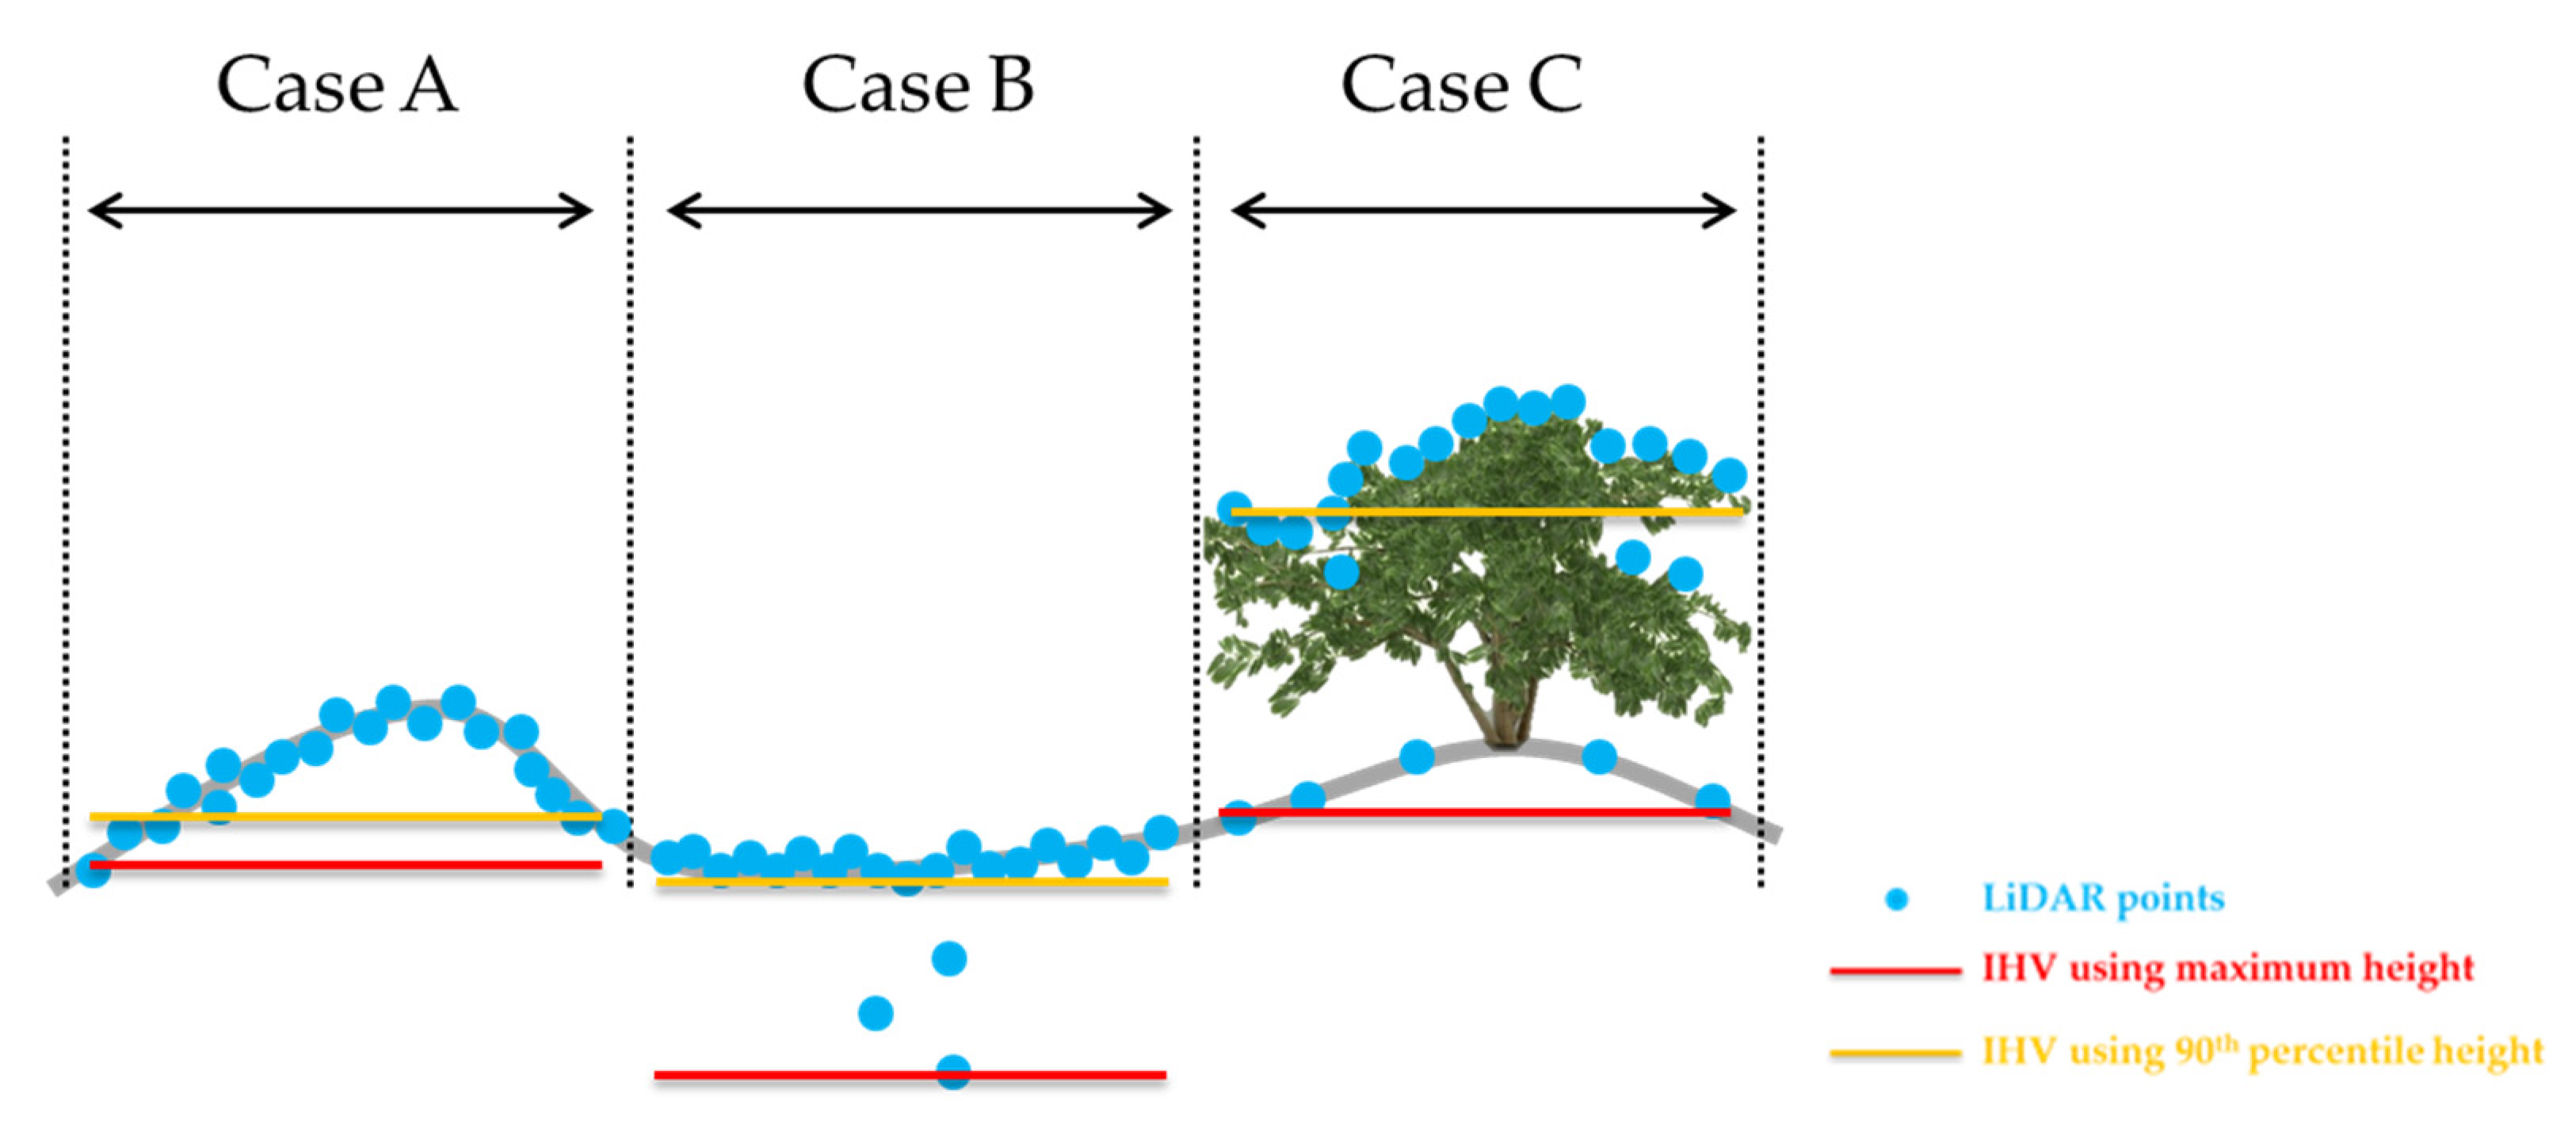
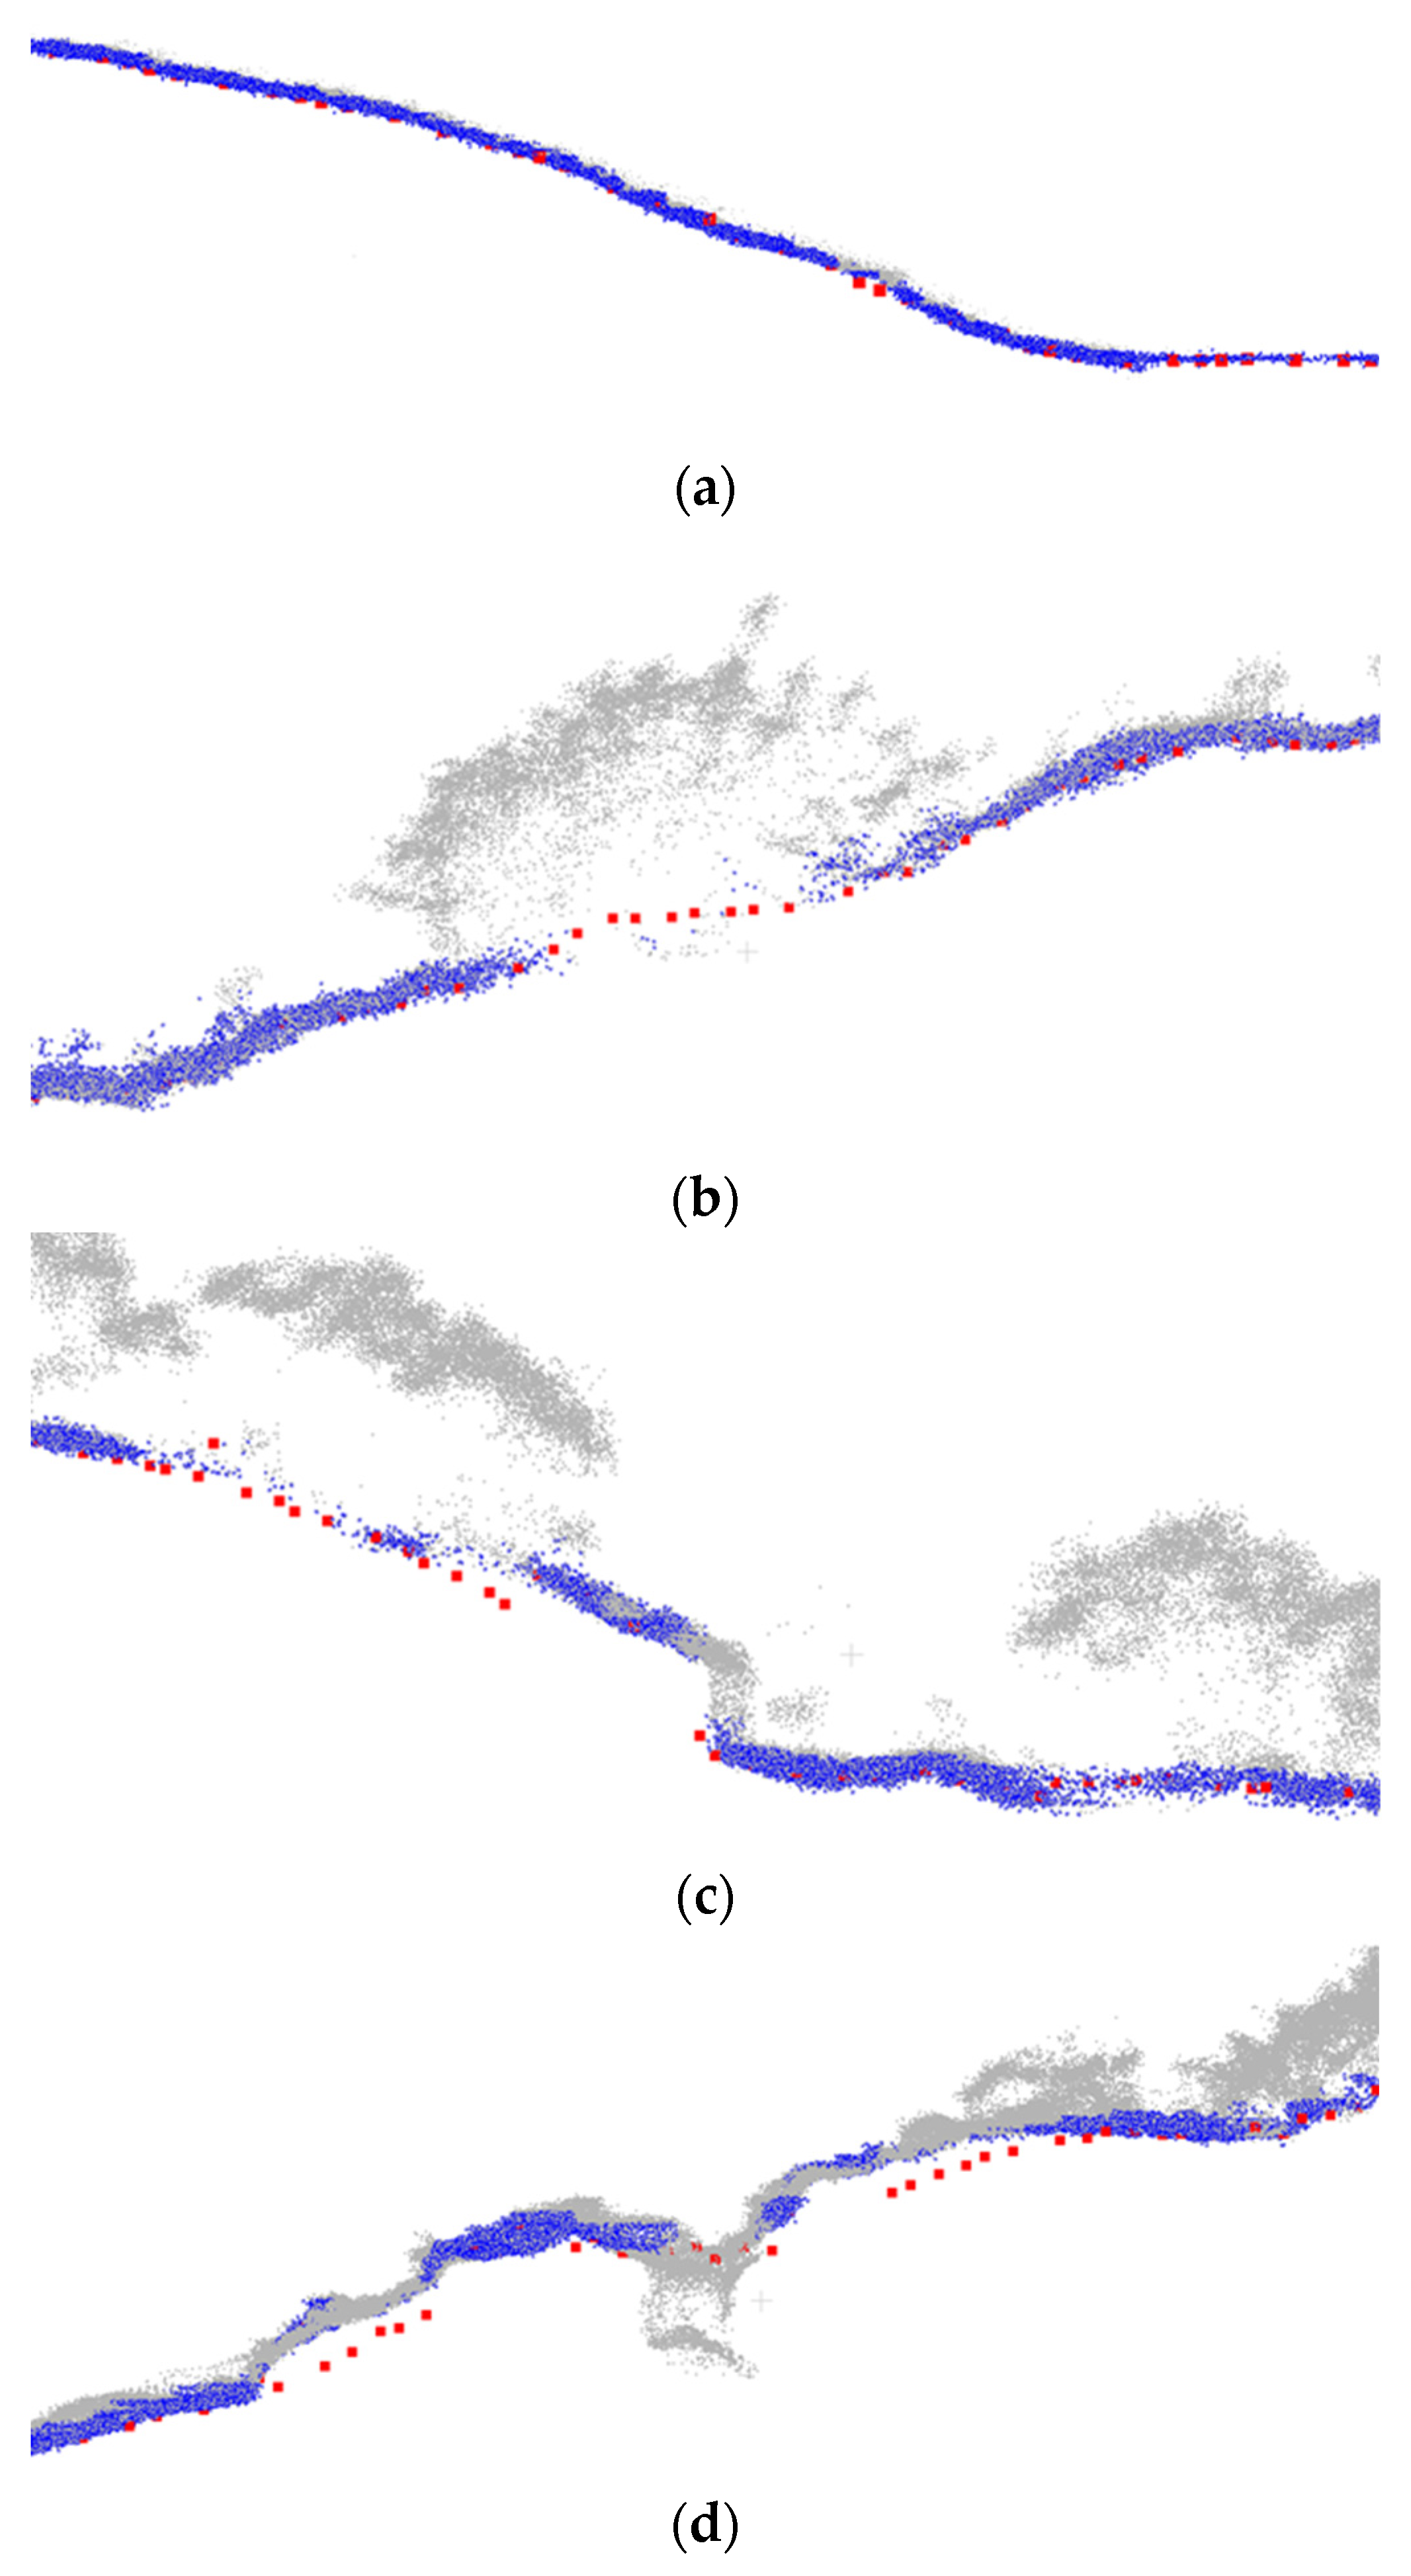
Mitigation of noise/outlier points: In the original cloth simulation, the resting place of the cloth particles is defined by what is known as the intersection height value (IHV). For a given cloth particle, the IHV is established as the nearest LiDAR point to that particle in 2D (i.e., the highest point in the inverted point cloud). Such a definition makes the derived DTM sensitive to the noise level and presence of outliers in the point cloud (Figure 12a). To reduce the sensitivity to the presence of noisy/outlier points, we redefined the IHV as the 90th percentile of the elevations at the 2D vicinity for the particle in question (Figure 13—Case B). The impact of this change is shown in Figure 14a.
Mitigation of sparse points along the ground: In situations where gaps can be found along the ground due to the presence of above-ground structures and/or vegetation, the resting place of the cloth will show sags (illustrated in Figure 13—Case C), which will manifest as artificial peaks in the derived DTM (refer to Figure 12b). To reduce these artificial peaks, we conducted an iterative cloth simulation procedure, which has been presented in our previous work [46], where the rigidity of the inter-particle connections is modified according to the defined bare earth in the previous iteration (i.e., the rigidity is increased for particles that fall in areas with sparse bare-earth points as defined by the first iteration). The impact of adopting such a mitigation strategy can be seen in Figure 14b.
Mitigation of erroneous terrain model at locations with sudden elevation changes: In such situations, the cloth will smoothly change its elevation on both sides of the cliff, leading to erroneous DTM and missing bare-earth points on one side of the cliff (Figure 12c). This problem was handled through a post-processing strategy. After the generation of the bare-earth points from the adaptive cloth simulation, we generated a raster grid with the same DTM resolution. Then, we identified whether each cell included bare-earth points. Cells with no associated bare-earth points were denoted as empty cells. For each of the empty cells, we identified the neighboring non-empty cells and evaluated the minimum/maximum elevations of the bare-earth points in these cells. For the empty cell in question, we searchd for above-ground points whose elevations were within the bare-earth range of neighboring non-empty cells. If such points existed, they were added as bare-earth points to that cell, and the corresponding DTM elevation was adjusted to the average elevation of such points. The improvement in the DTM generation and bare-earth classification after considering this modification is shown in Figure 14c.
Mitigation of erroneous terrain model at locations of underground structures: As can be seen in Figure 12d, the presence of underground structures with a considerable amount of LiDAR returns at the base of these objects will lead to an erroneous DTM that dips at those locations. In addition to the dips, we will miss a set of bare-earth points at both sides of the structure. These missing points were handled through the previous mitigation strategy, leaving the erroneous DTM elevation and bare-earth points at the base of the underground structure. To mitigate such artifacts, we started by defining a raster grid of the same resolution as the cloth simulation DTM. Then, we identified the bare-earth points associated with each cell. For underground structures, the elevation of bare-earth points will be significantly less than those outside the structure. Therefore, we started by identifying cells that exhibited a lower elevation relative to their neighbors. These cells were then clustered through a region-growing strategy. Clustered regions with a size that does not exceed a predefined threshold, which depends on the expected size of underground structures, were hypothesized to belong to non-ground objects. The bare-earth classification of points in these cells was nullified, and the DTM elevation at their location was redefined as the average elevation of neighboring DTM cells. The improvement in the ground-filtering results obtained following this mitigation strategy can be seen in Figure 14d.
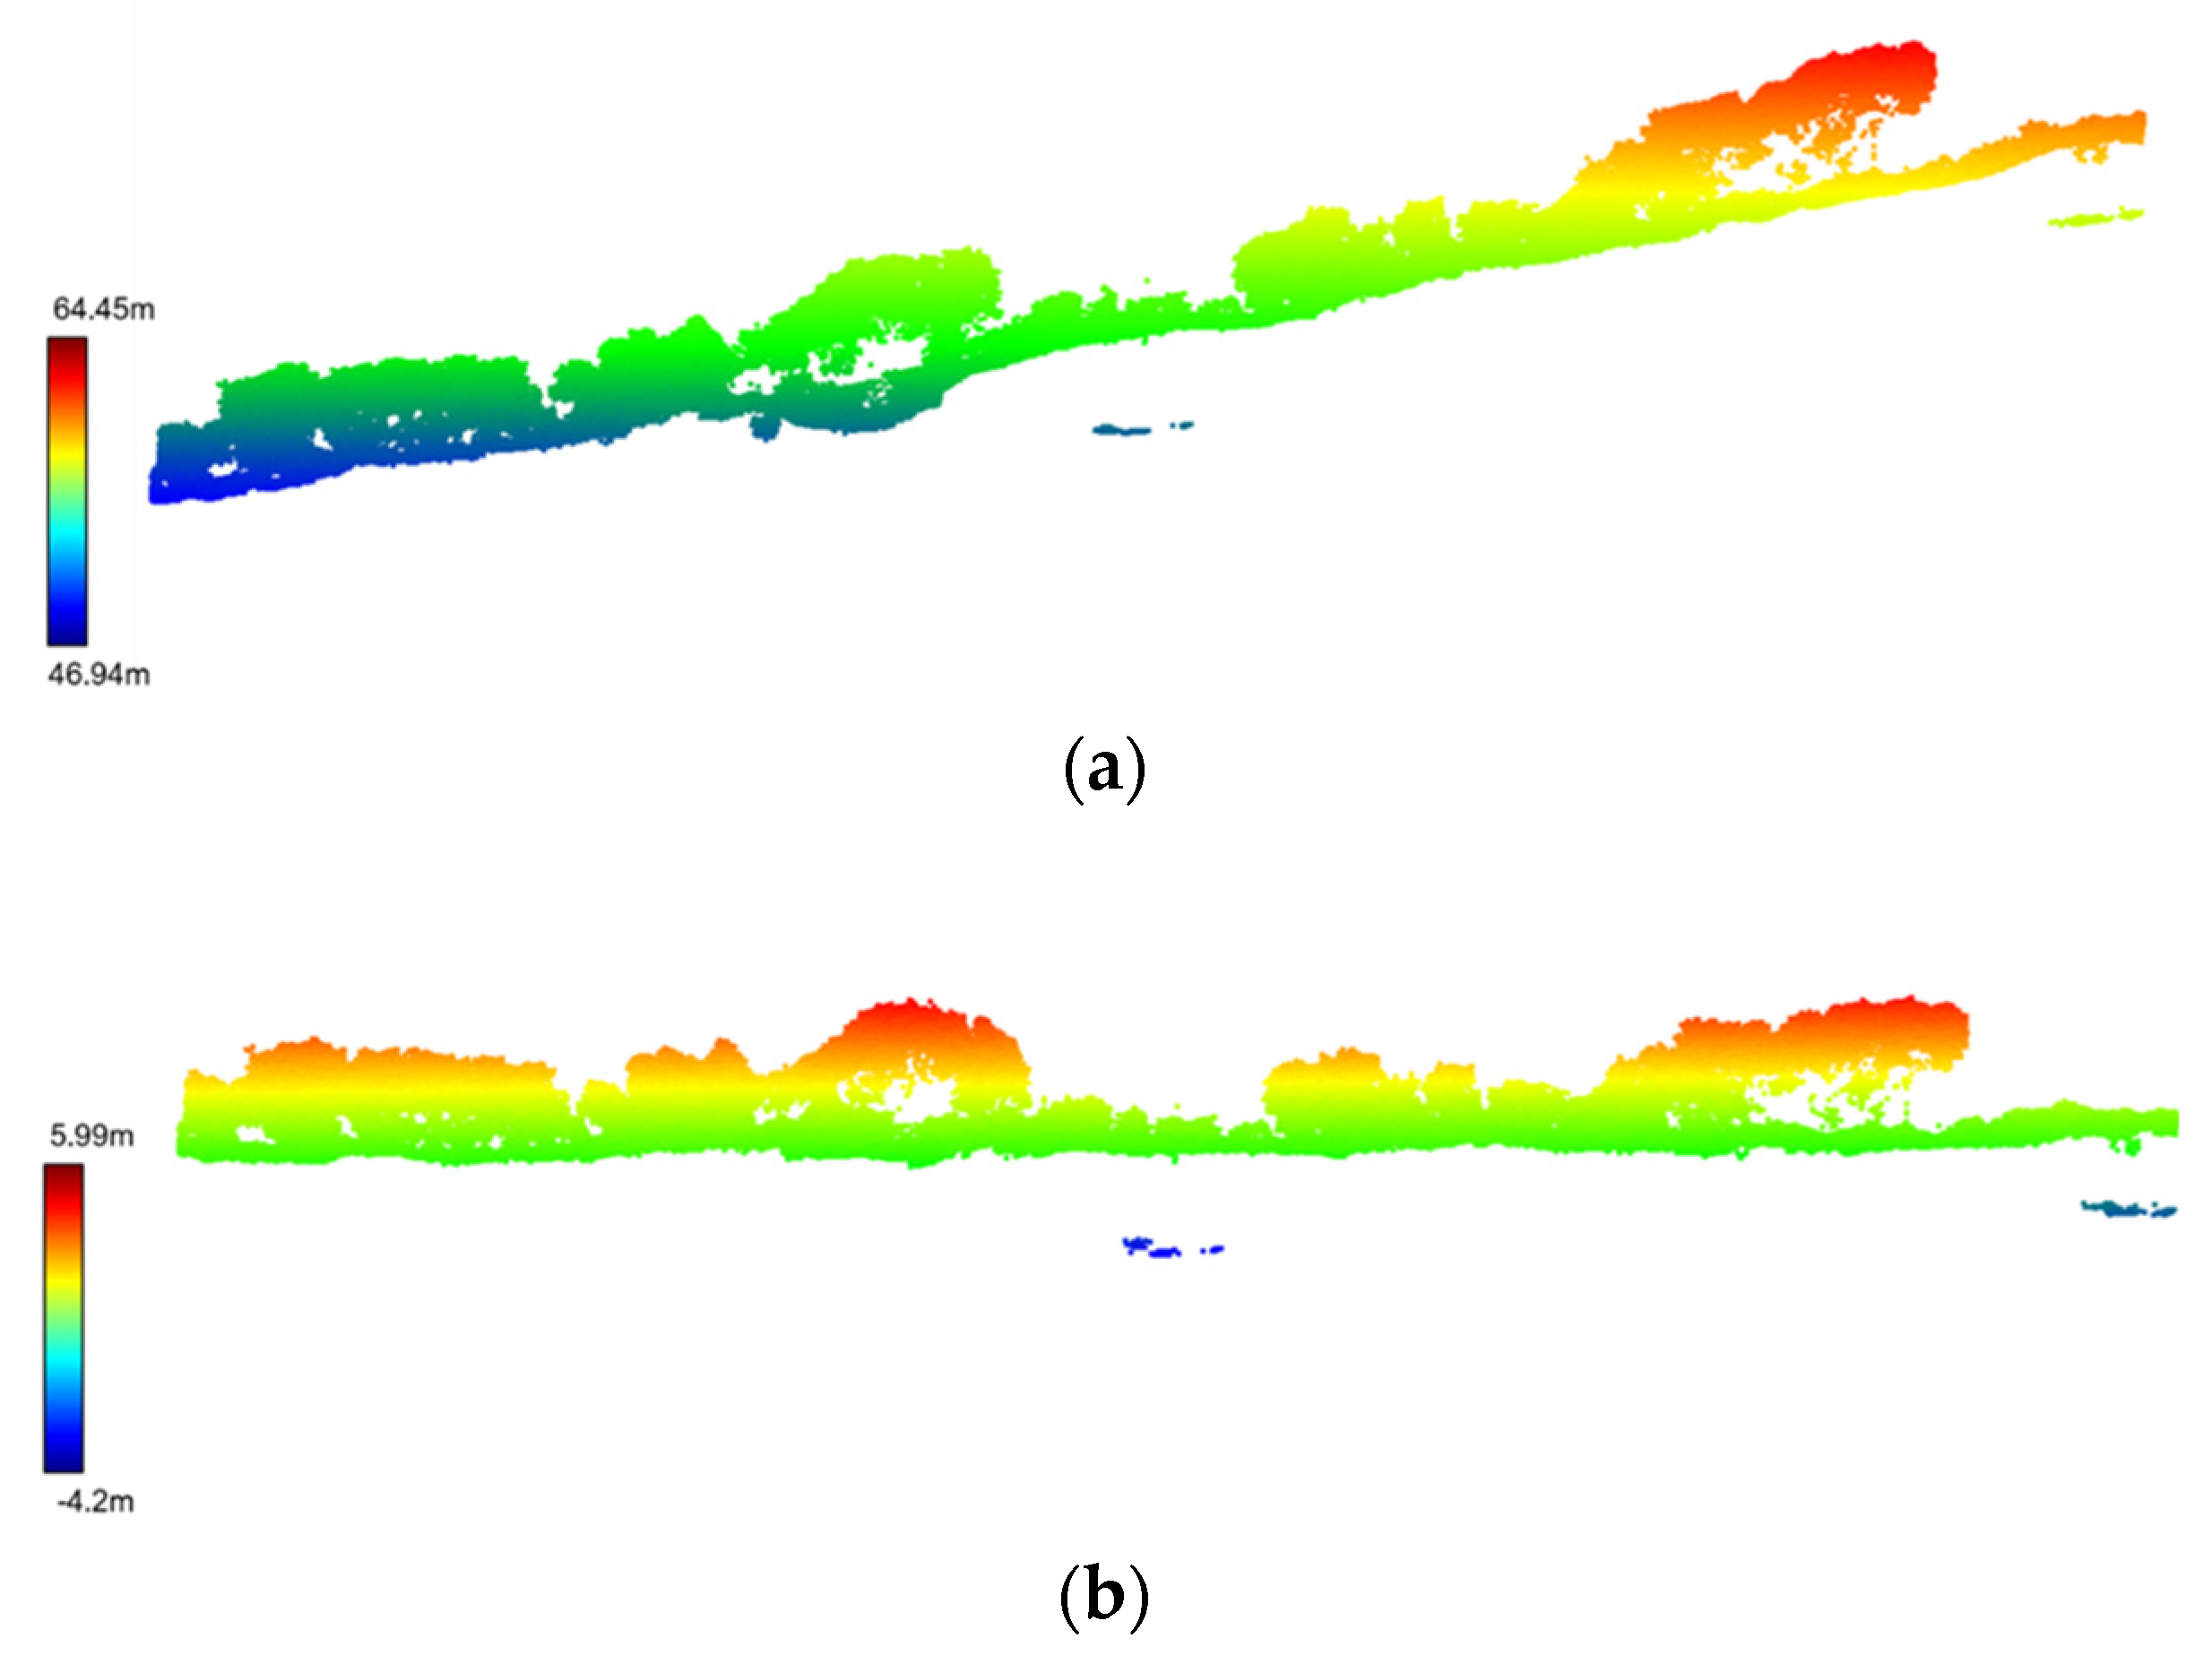
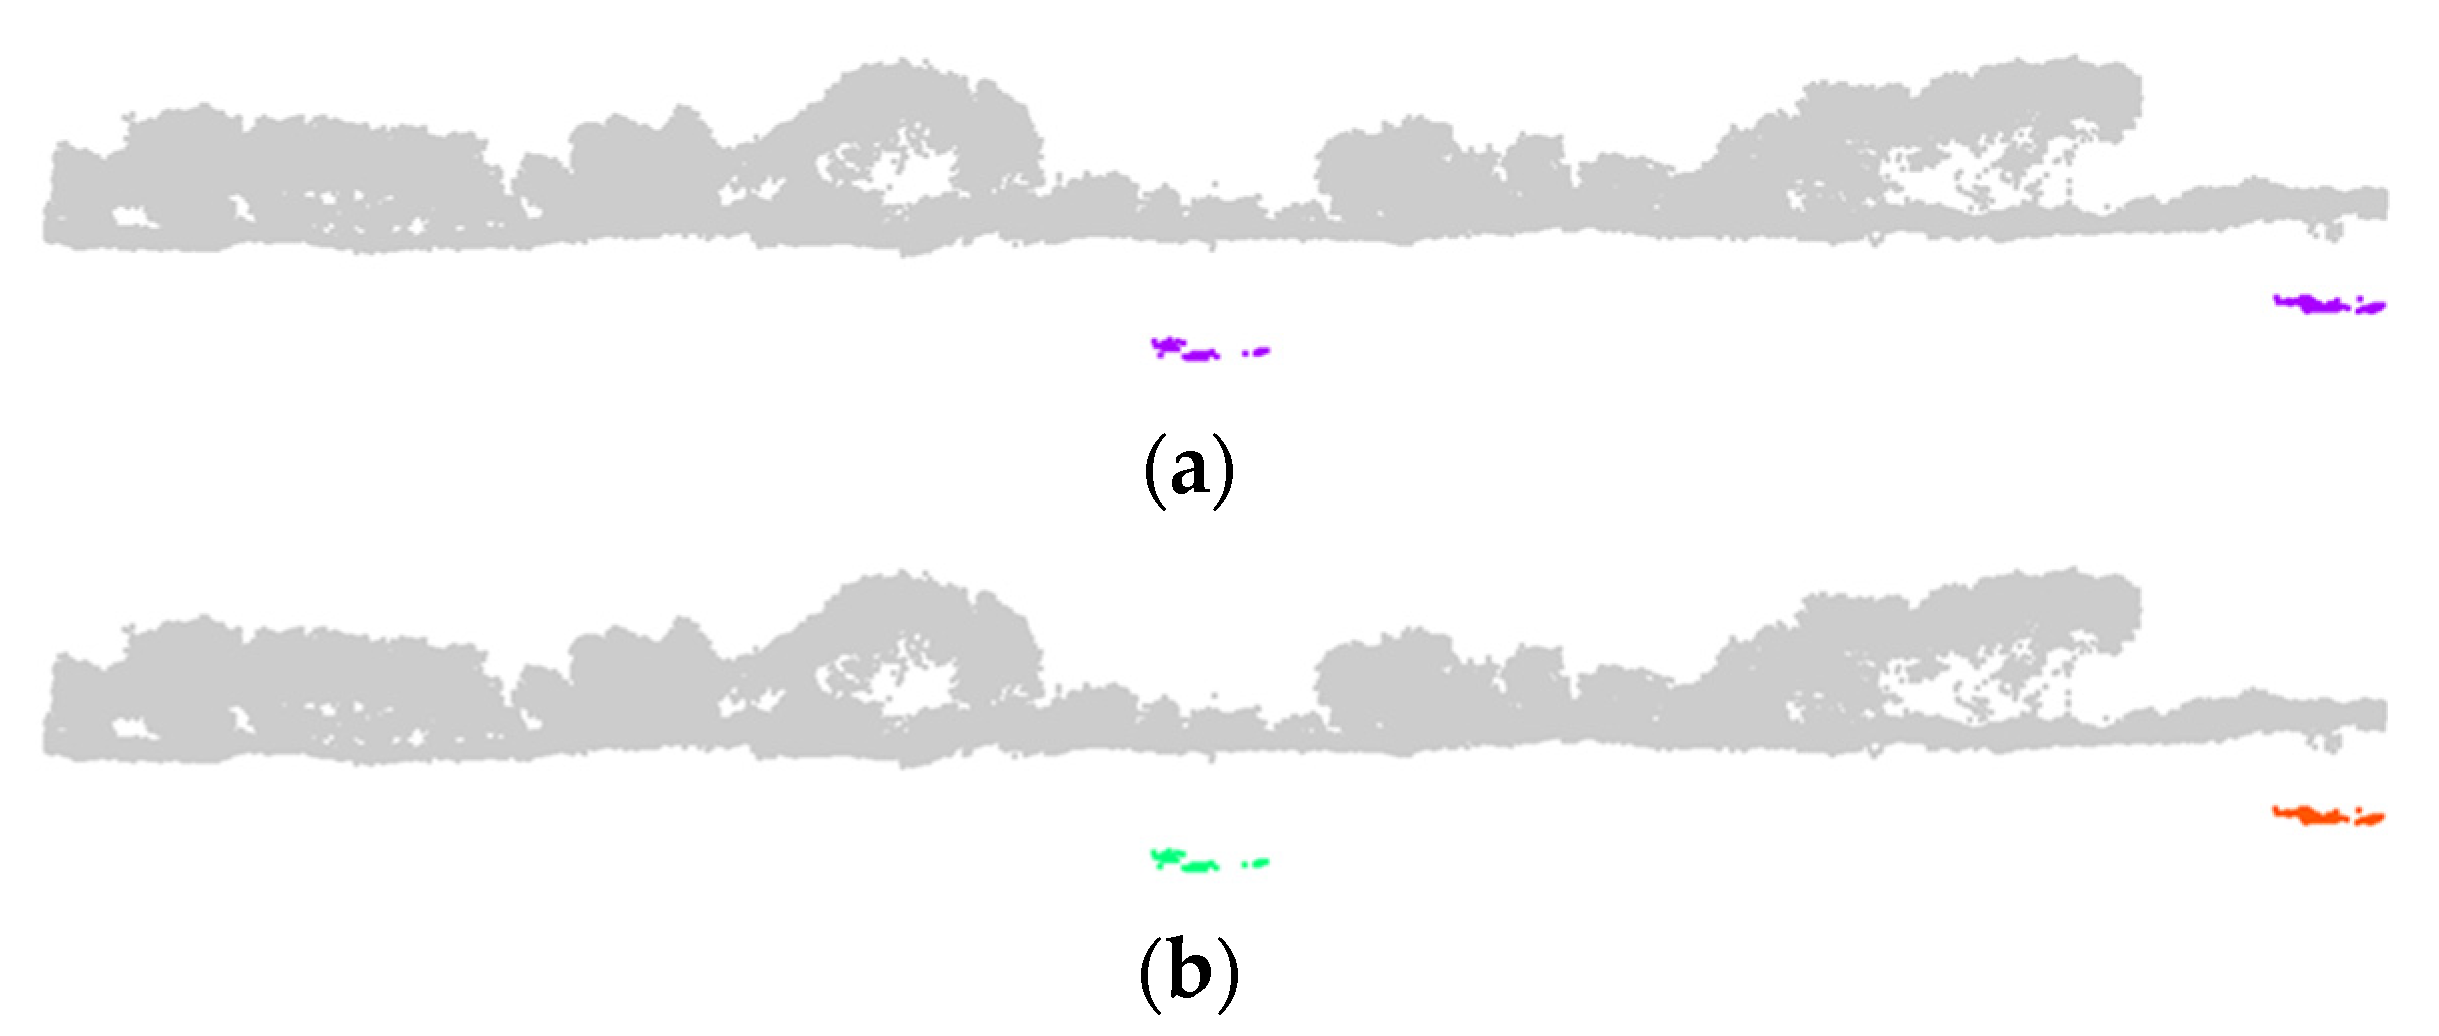
Once the DTM was generated from the modified cloth simulation, together with the proposed post-processing mitigation strategies, the elevations of the LiDAR point cloud were normalized by subtracting the DTM elevation (Figure 15). Following the normalization, below-surface points were identified and clustered into groups using the density-based spatial clustering of applications with noise (DBSCAN) algorithm [68]. Each of these clusters was hypothesized to correspond to an underground structure (Figure 16).

3.3. Web-Visualization Portal

The last objective of this study is to develop a web-visualization portal that can be used by archaeologists to navigate through LiDAR point clouds, UAV images, and detected underground structures. The design criteria for the visualization portal include: (1) the ability to show a massive number of points and images; (2) not requiring local data storage (i.e., it could use data stored in a cloud server); (3) not requiring software installation; (4) providing some annotation tools; and (5) being amenable to developing other tools, such as forward and backward projection between 2D images and 3D point cloud data. In this work, Potree [69] was chosen for the development of the prototype web-visualization portal since it meets the above design requirements. Potree is an open-source code (http://www.potree.org), which can efficiently render a huge point cloud (>109 points) through a web browser without the need for software installation or data downloading [70]. It is also capable of displaying georeferenced meshes (either in ASCII or binary format), shapefiles, and images. However, there is no built-in function for backward/forward projection between imagery and point cloud data. Thus, as part of this work, we developed backward/forward projection functions within the Potree web-visualization portal. The portal architecture and developed backward/forward projection functions are briefly discussed in the next paragraphs.
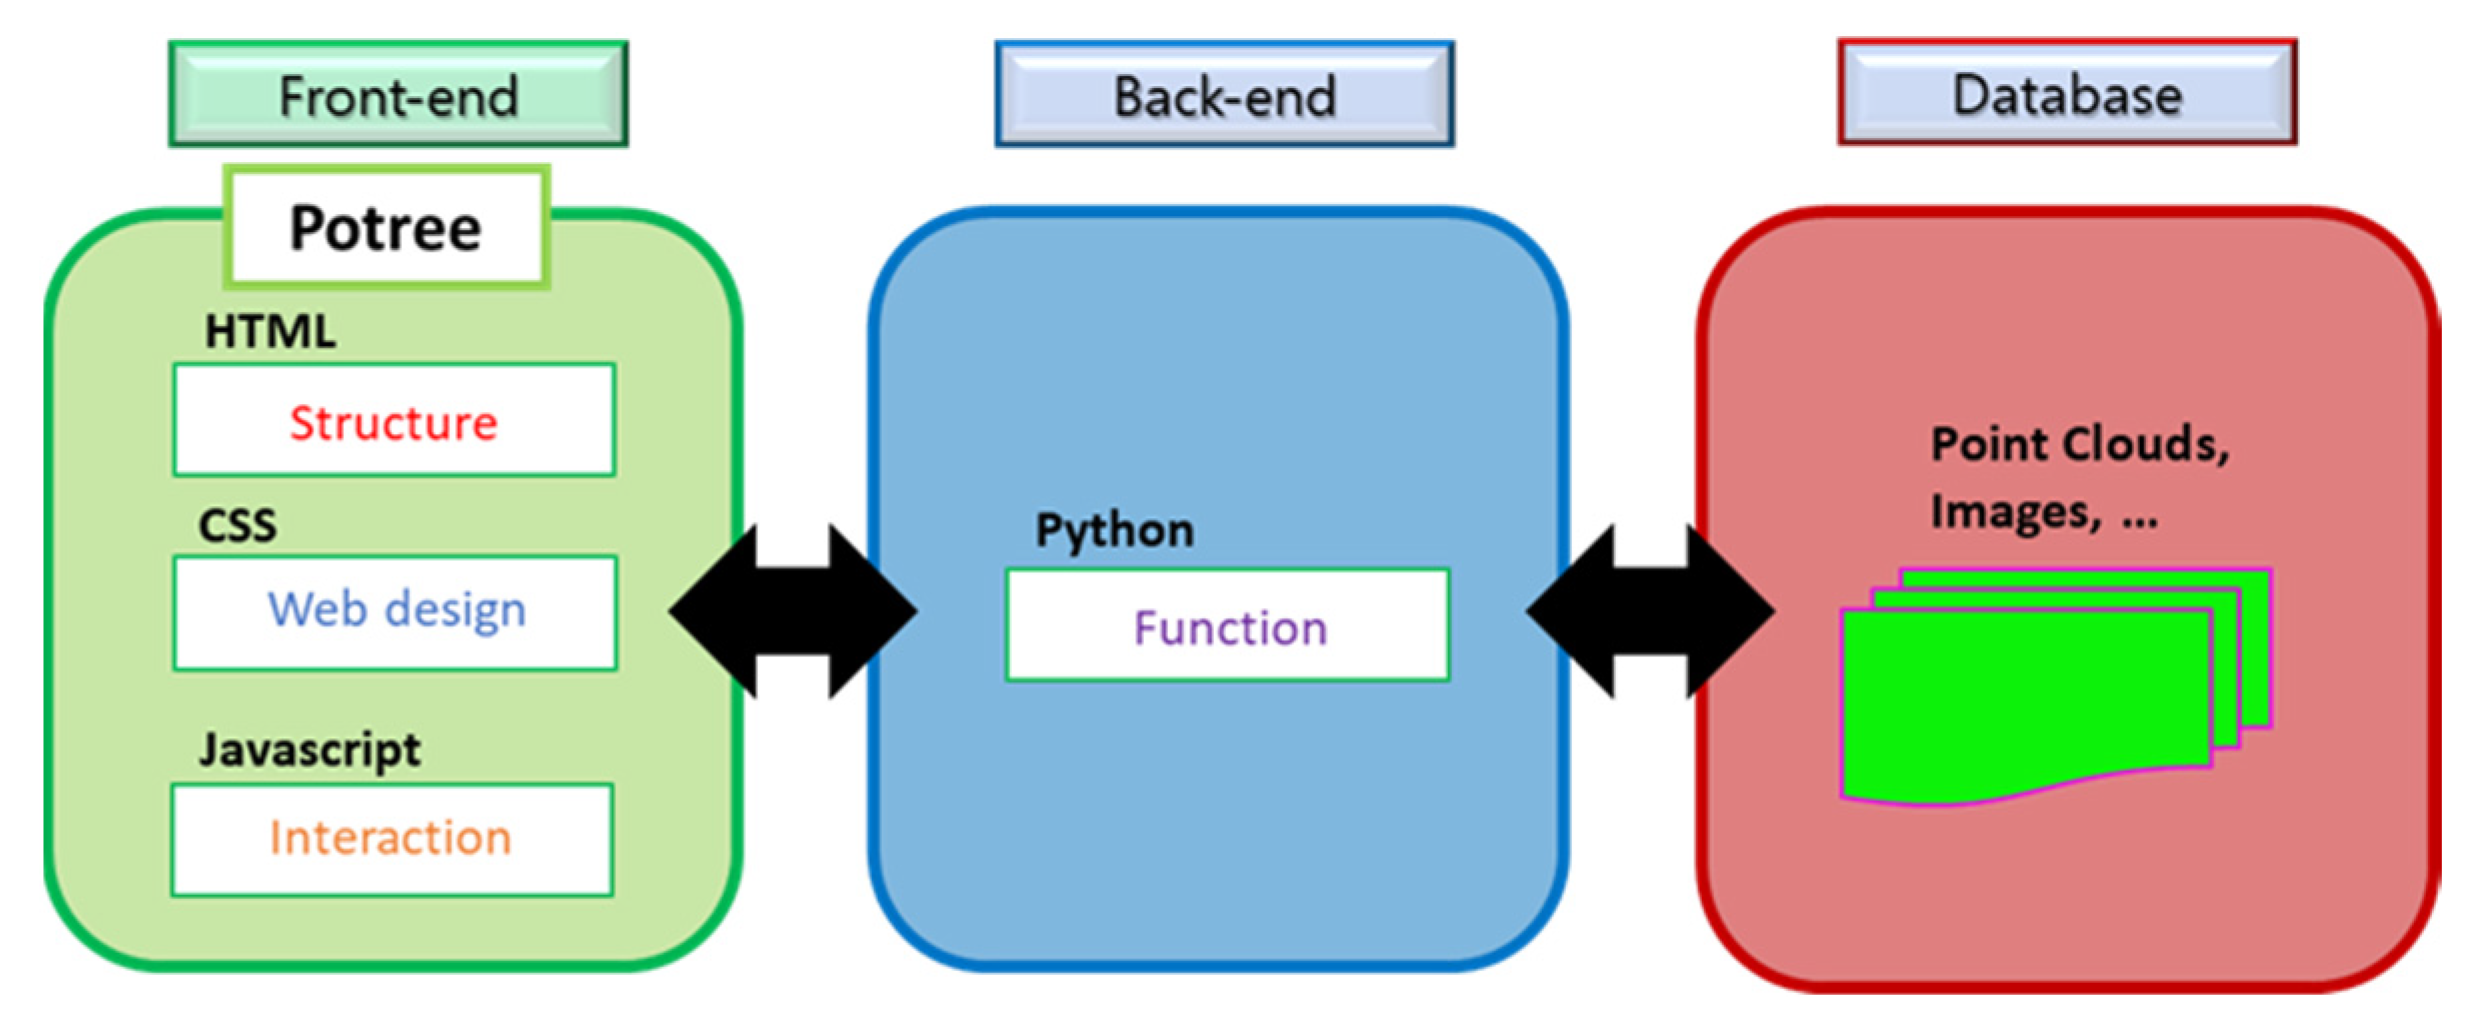
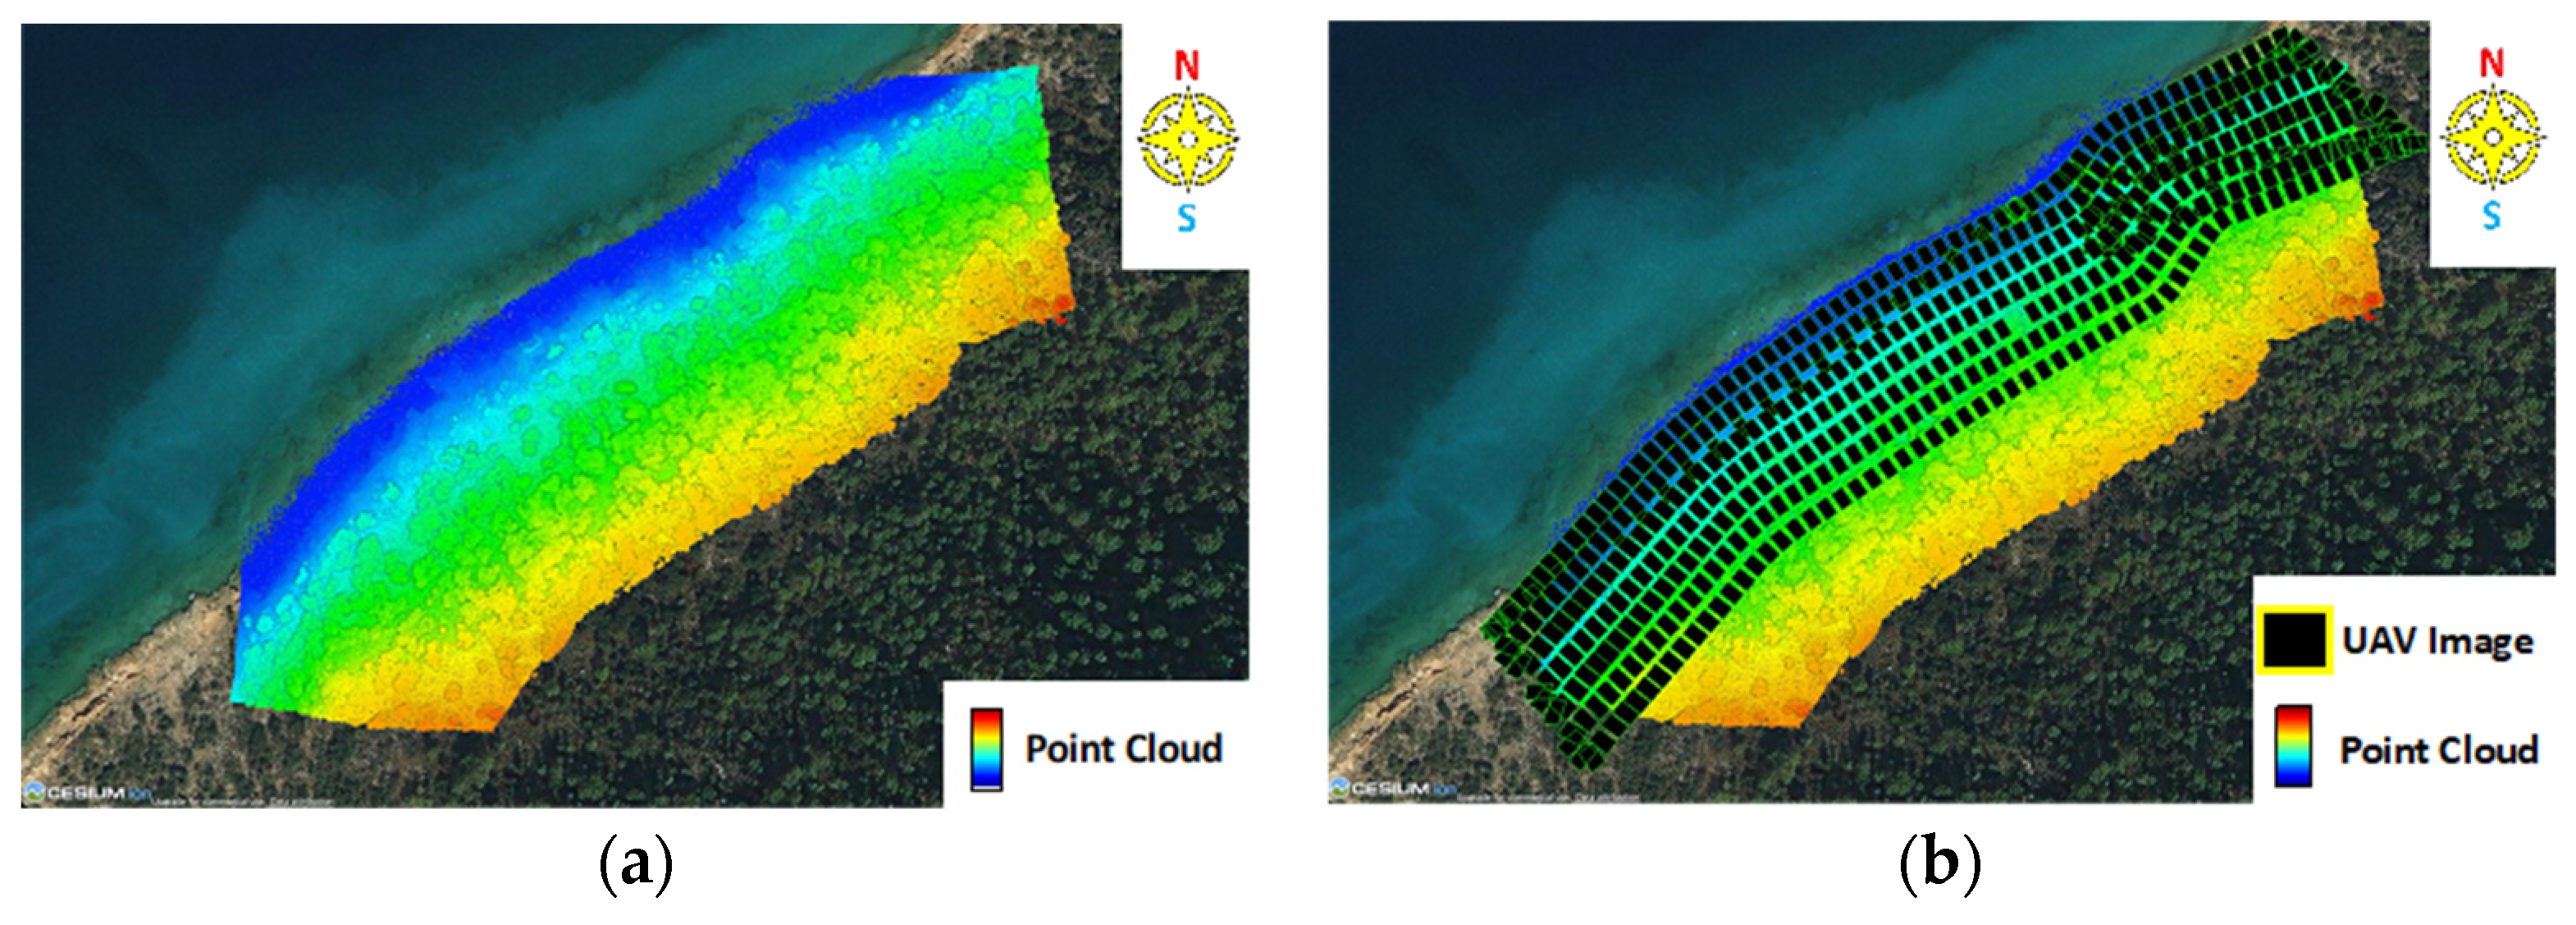
Potree Web-visualization Portal: The established structure of the portal is illustrated in Figure 17. The front-end is the graphical user interface used to visualize the georeferenced data, such as point clouds and images. The back-end consists of various visualization and/or computational functions that enable end-users to manipulate the georeferenced data. Figure 18 shows a Cesium base map (https://cesium.com/, accessed on 10 February 2023) and UAV LiDAR point cloud covering the study site (Dana Island), together with the captured images. Since the georeferencing parameters of the imagery are available from the UAV GNSS/INS trajectory and system calibration parameters (Equation (4)), the displayed imagery is shown in the proper position and orientation relative to the point cloud data. Finally, the georeferenced data (point cloud, imagery, and metadata) of the web portal are stored in a database. As shown in Figure 17, the back-end receives client requests from the front-end and processes them by coordinating with the database using the visualization and/or computational functions. For example, in this study, the backward/forward projection functions are realized through the back-end, which interacts with the front-end and database.
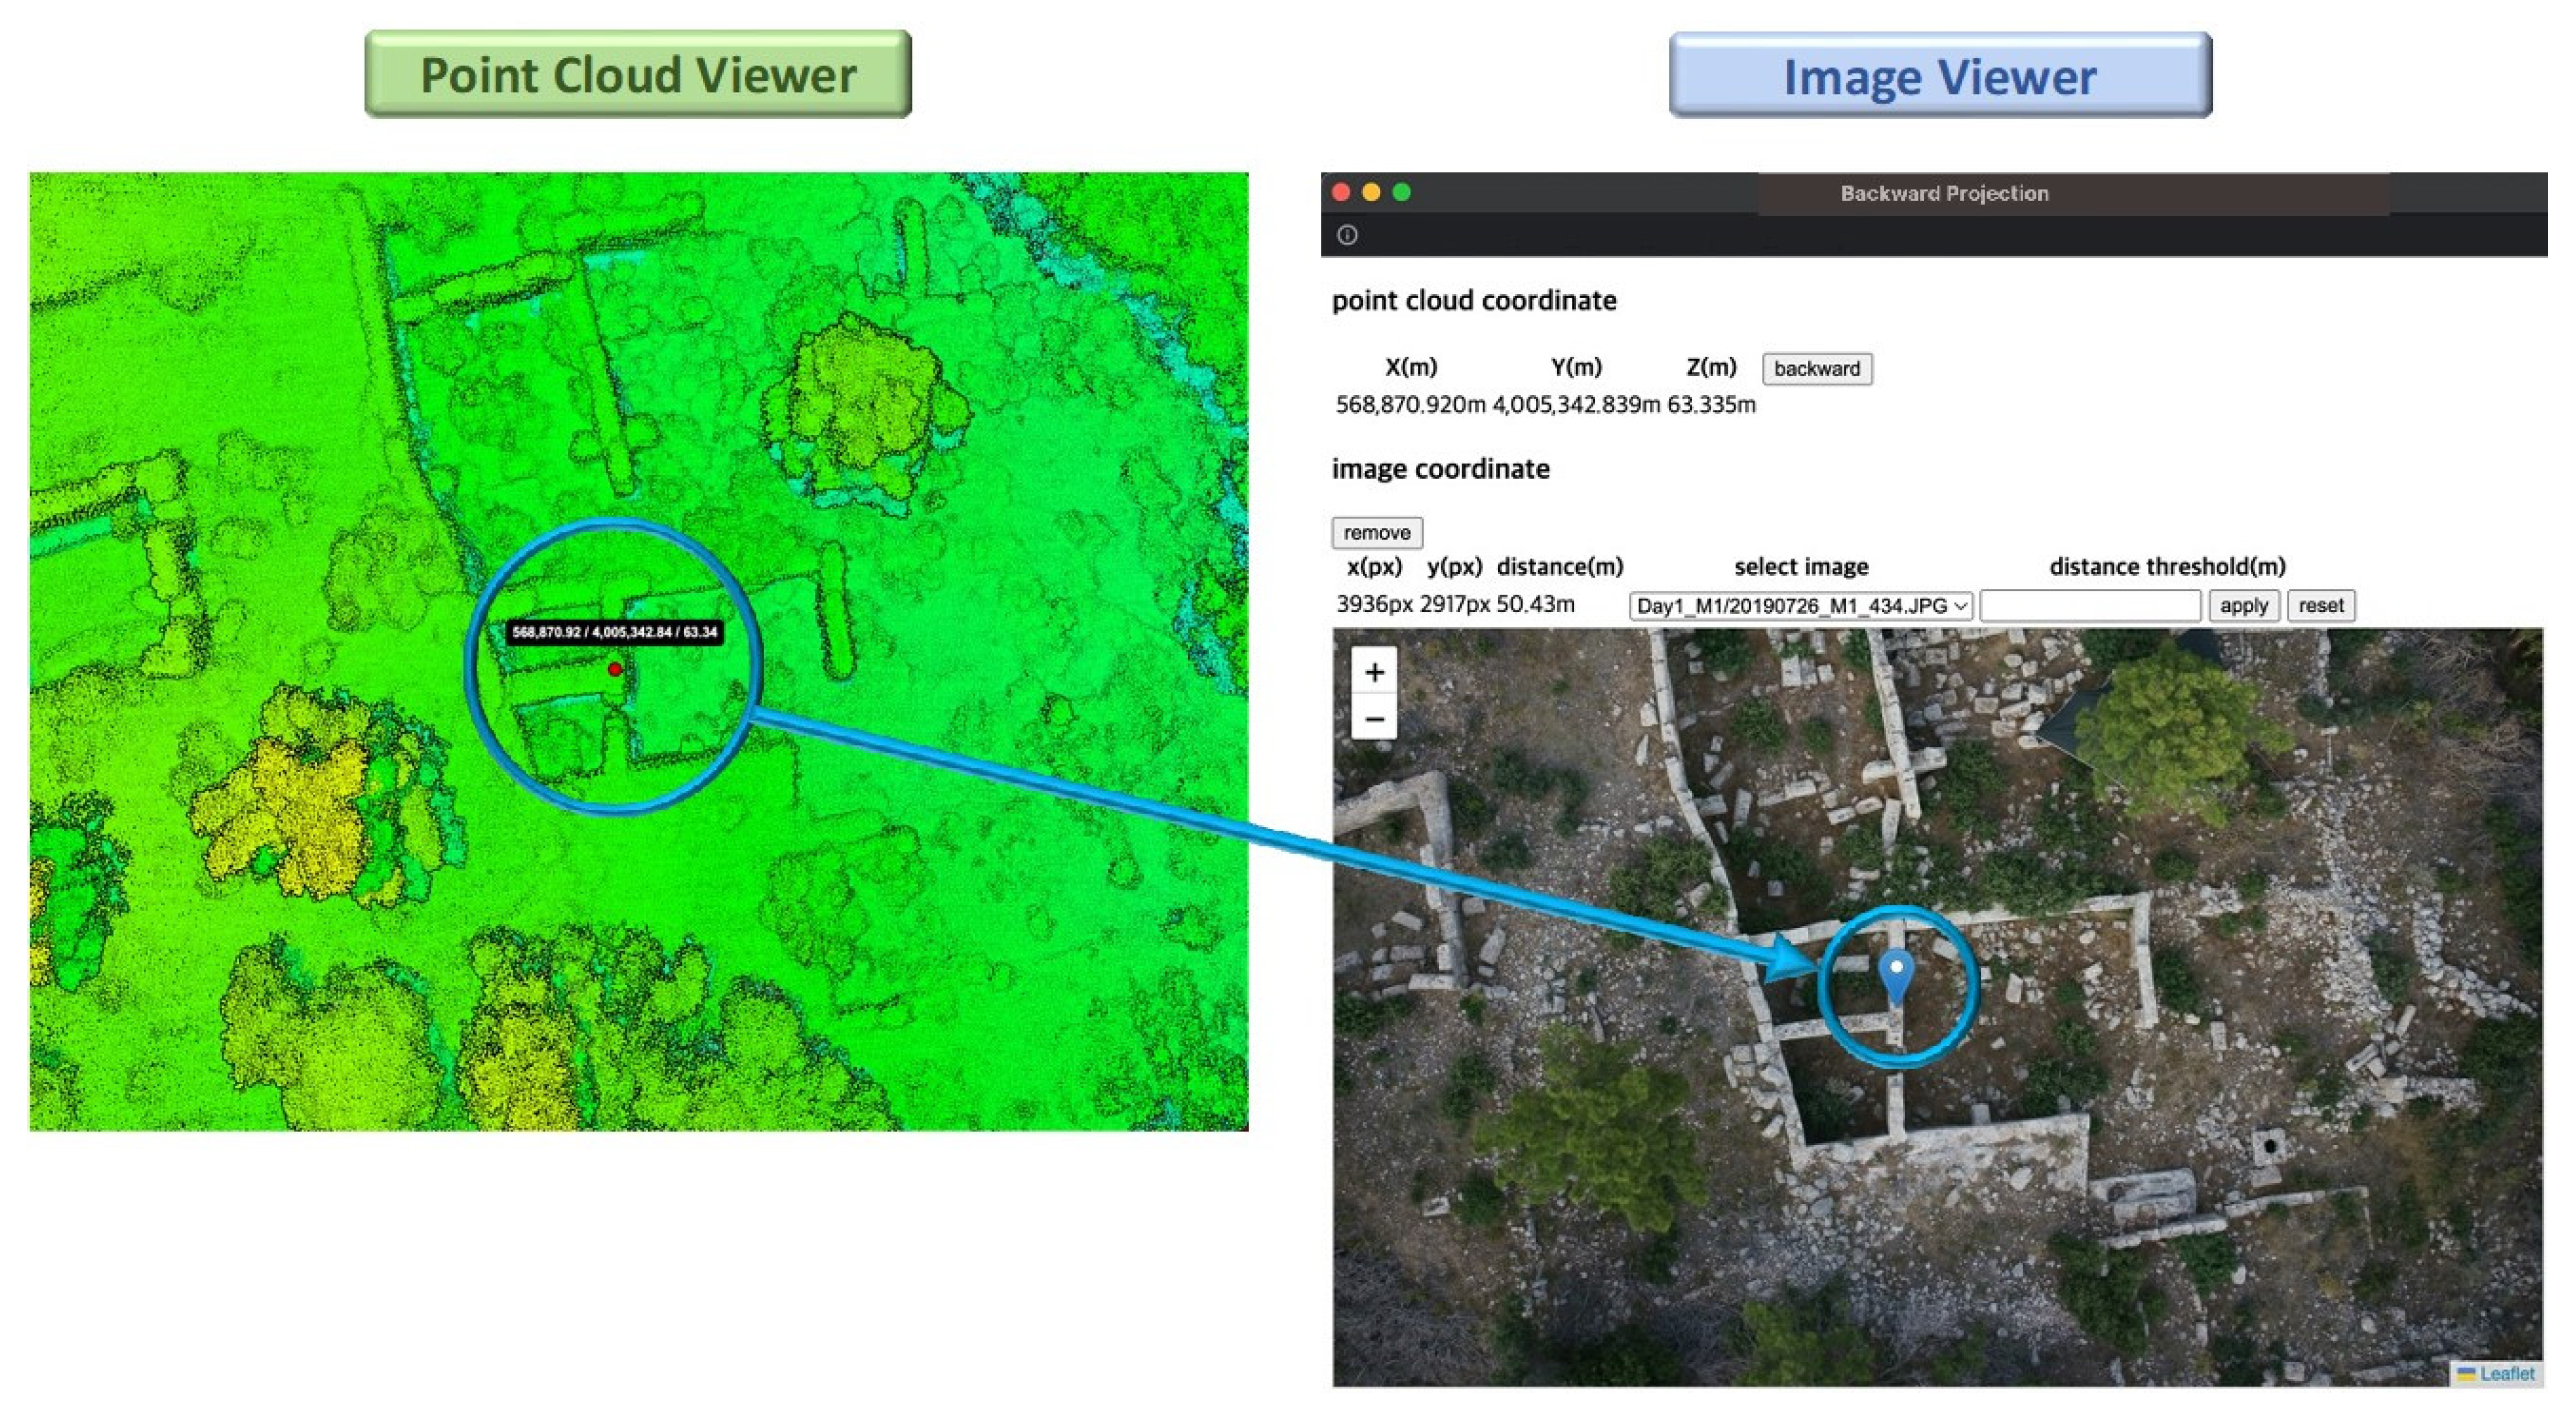
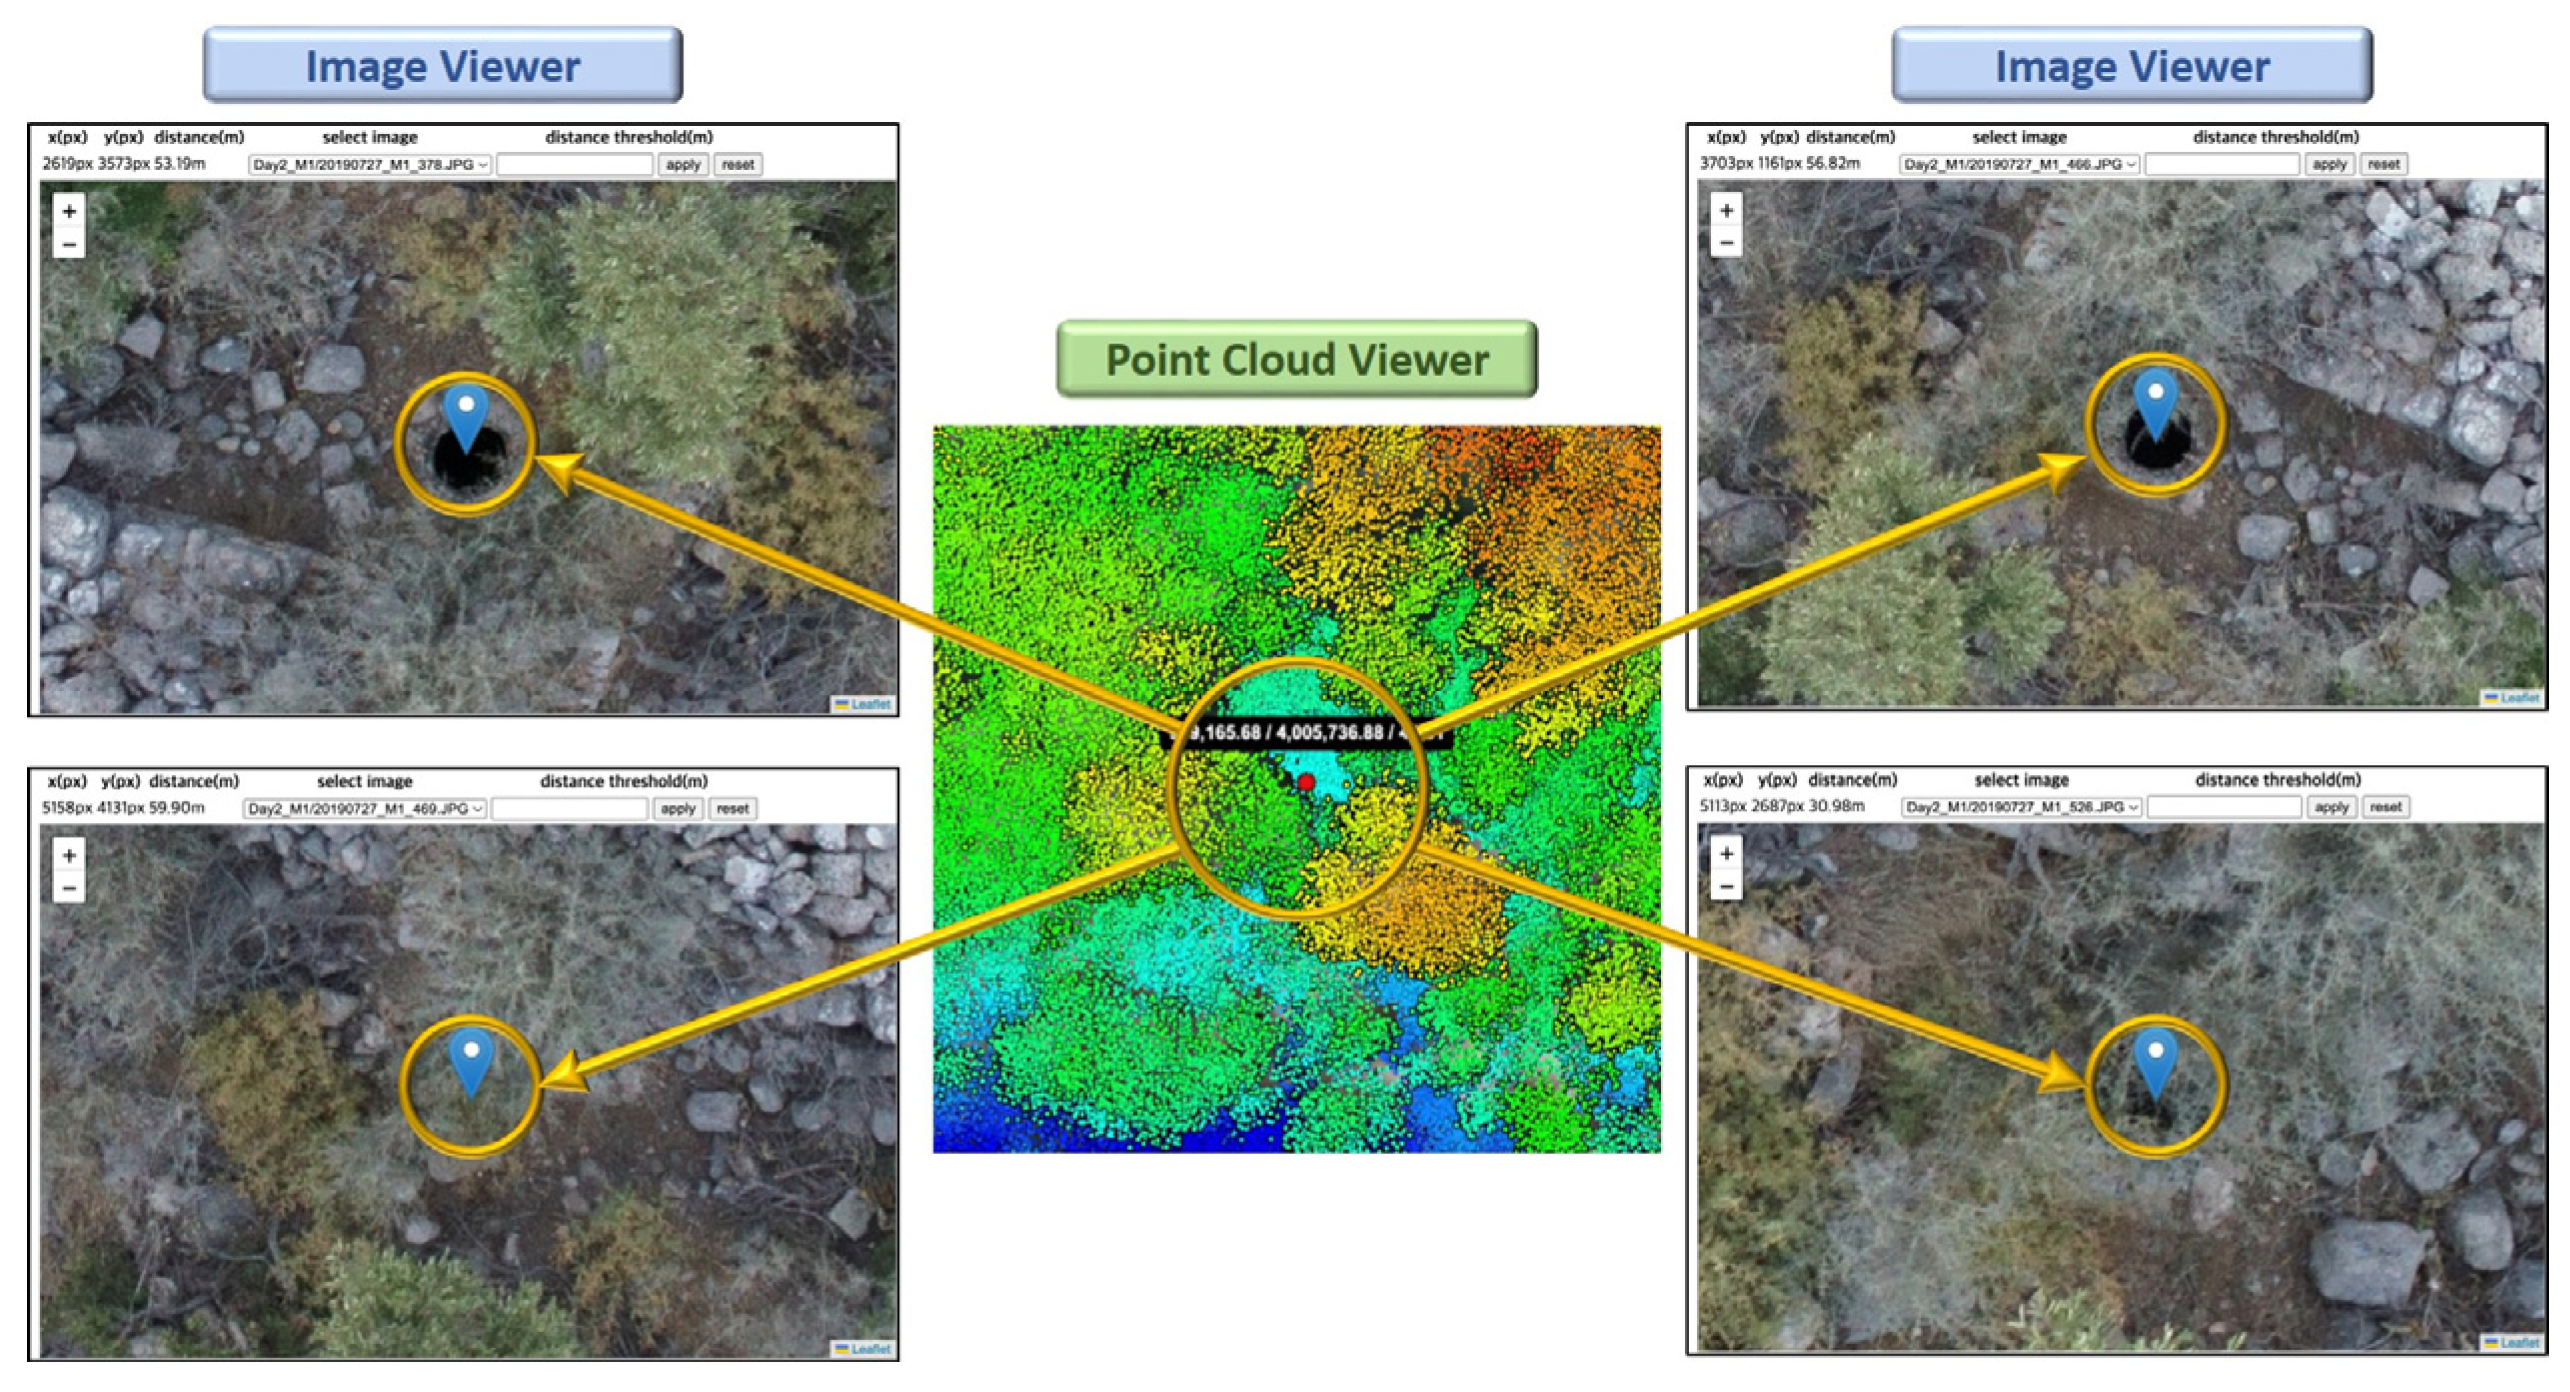
Backward/Forward Projection Functions: As shown in Figure 18, multiple georeferenced data acquired by different sensors can be rendered in the Potree web-visualization portal. To provide the user with the ability to visualize corresponding features in both image and point cloud data, backward/forward projection functions are established, as described in Section 3.1. Figure 19 shows the point cloud and image viewers with a chosen point (red dot) in the former and corresponding point (blue placemark) in the latter. For backward projection, an object point selected in the LiDAR data is projected onto the closest image where the point is visible. The backward projection function also allows for visualization of the same object point in multiple images where the former is visible. This could be useful in scenarios where an object point is not visible in one image while being visible in others (this could happen in sites with elevation variations, which are responsible for relief displacement, as can be seen in Figure 20). Figure 21 illustrates the forward projection, where a selected point in an image is projected onto the LiDAR point cloud, and the blue placemark in the former is projected as a red dot in the latter. Through these projection functions, end-users can visualize and navigate between properly georeferenced, multi-modal remote sensing data captured at the same time/different times by the same platform/different platforms.

3.4. Establishing a Reference Dataset and Accuracy Assessment

In order to evaluate the potential of UAV LiDAR as well as the proposed detection approach, a reference dataset with all existing underground structures is needed. Having these reference data, together with the detection results, precision, recall, and F1-score metrics, can be evaluated using Equations (8)–(10), where TP, FP, and FN are the true positives, false positives, and false negatives, respectively. The precision metric represents the proportion of truly detected underground structures among all identified ones using the proposed strategy. The recall signifies the ability of the proposed methodology to detect all existing underground structures in the site. The F1-score is the harmonic mean of precision and recall (i.e., it could be used as the overall evaluation metric).
Precision = TP TP + FP
Recall = TP TP + FN
F 1 - score = 2 × Precision × Recall Precision + Recall
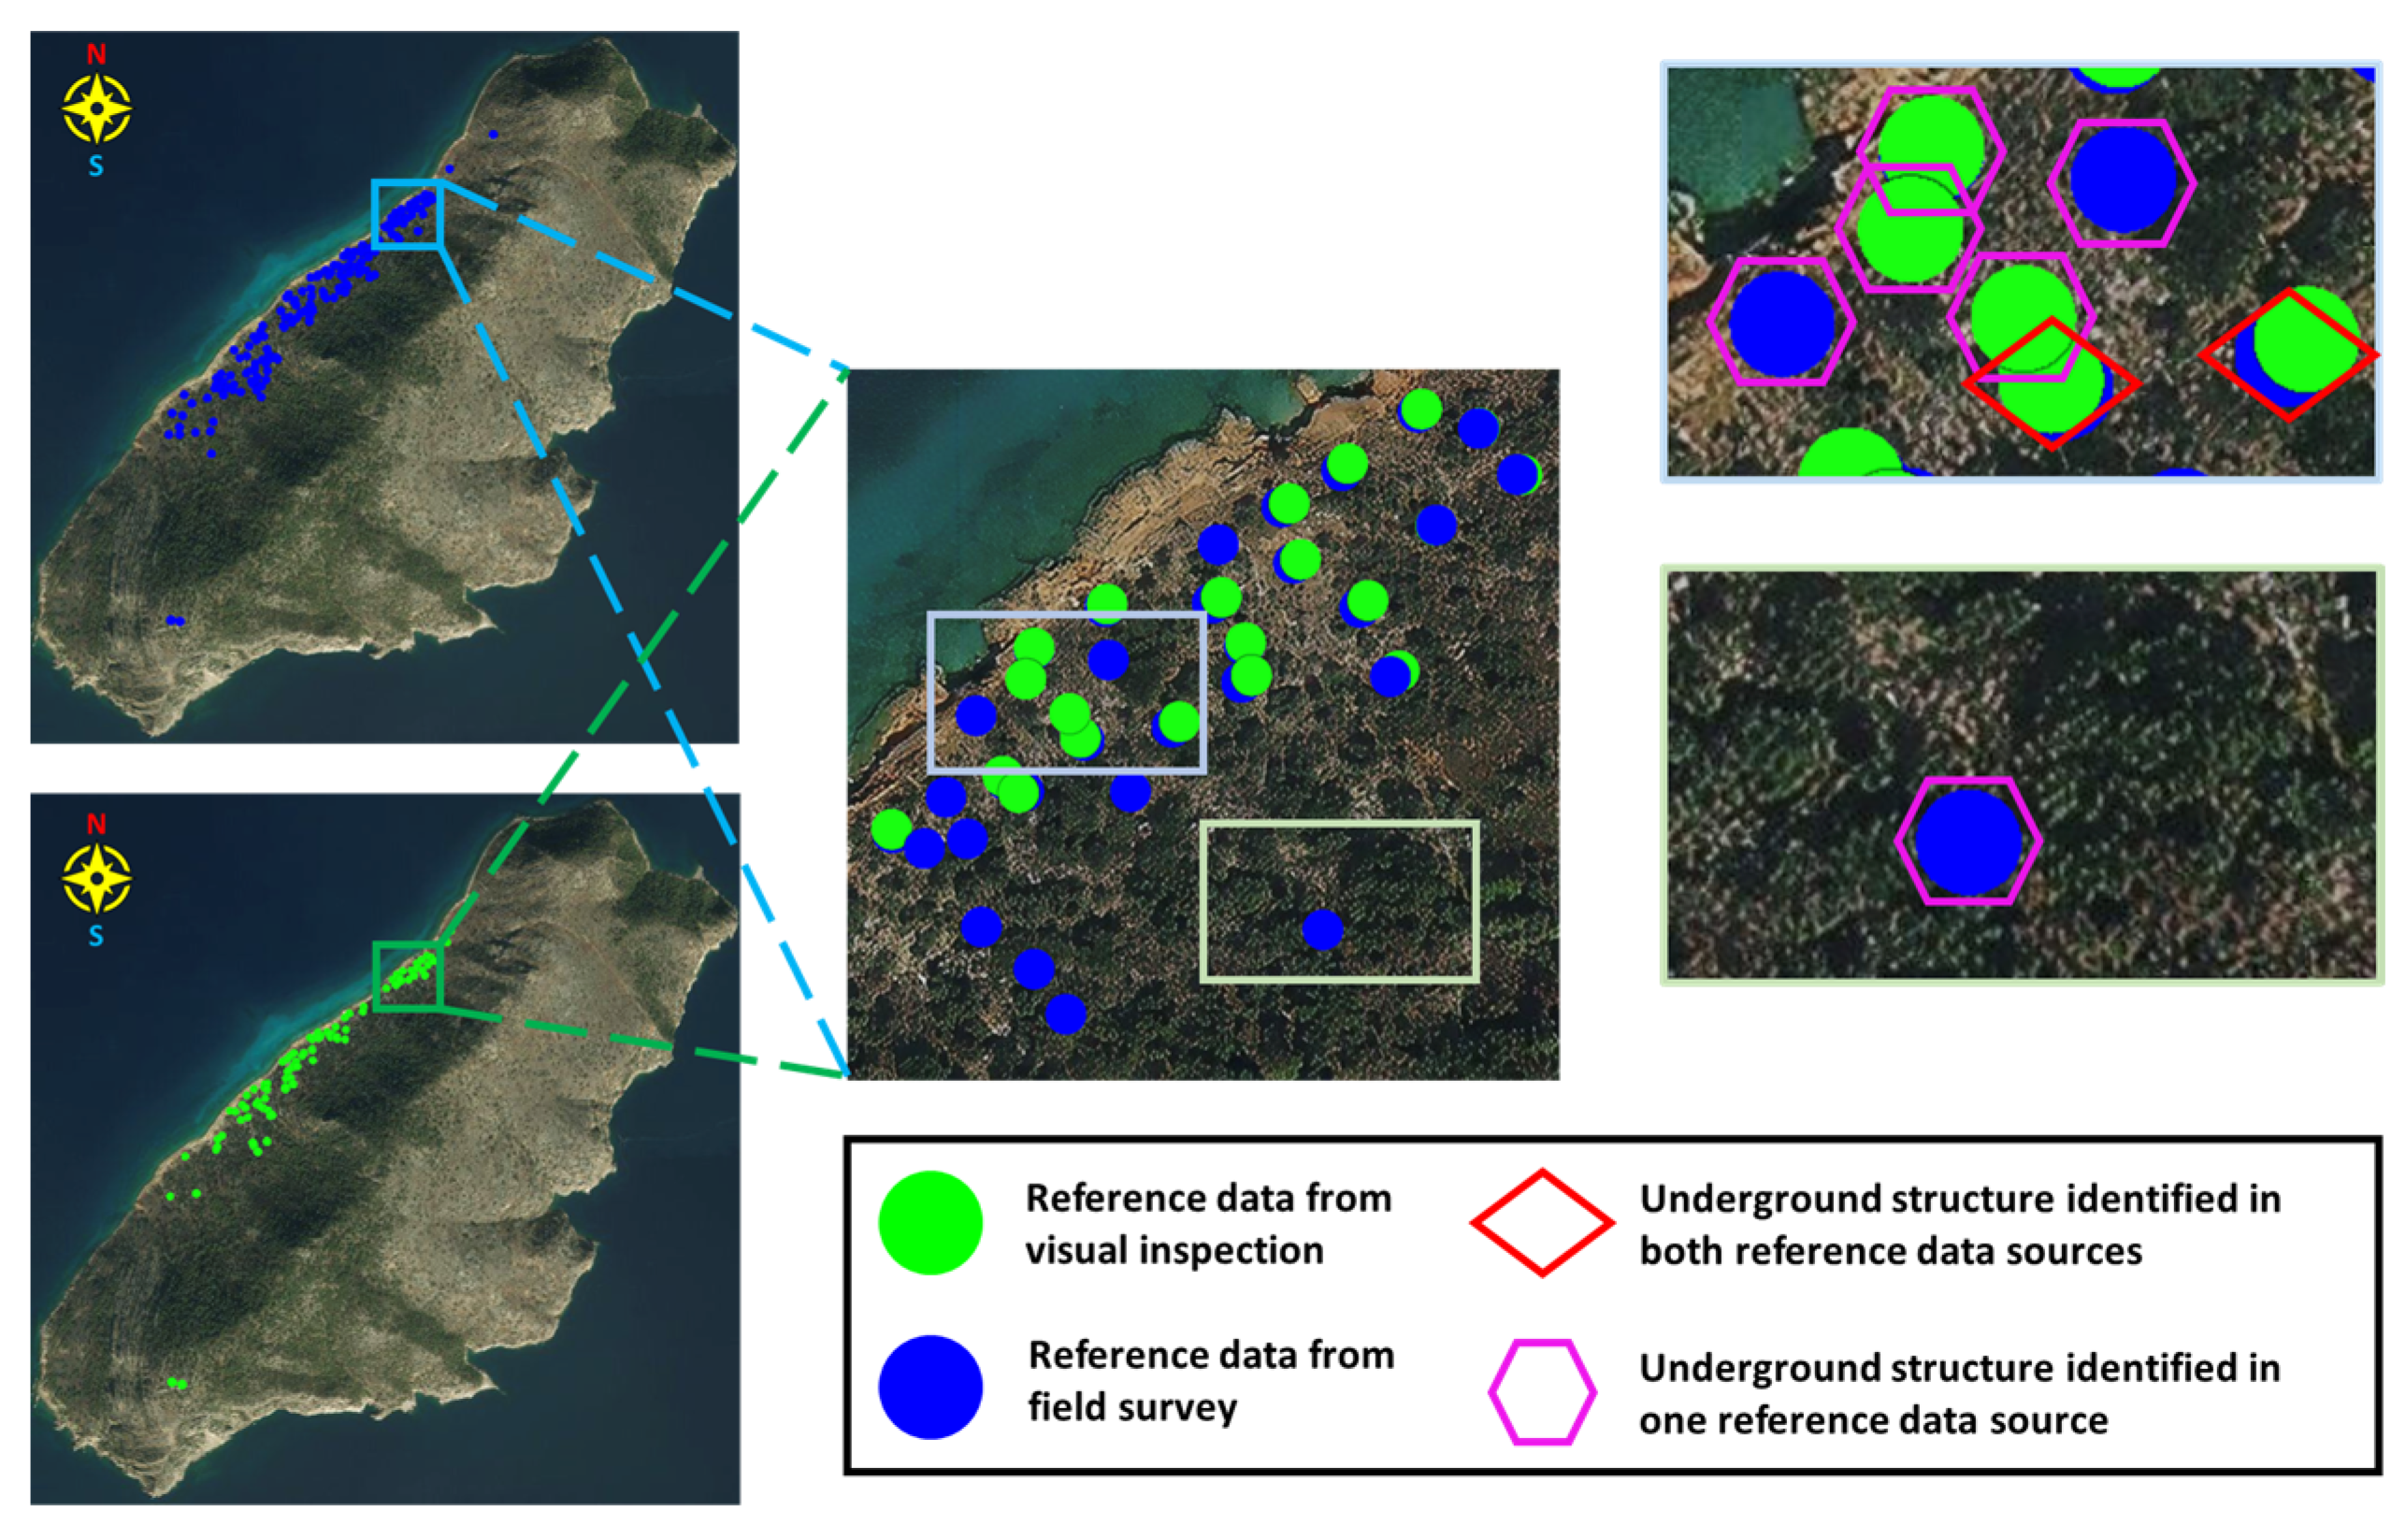
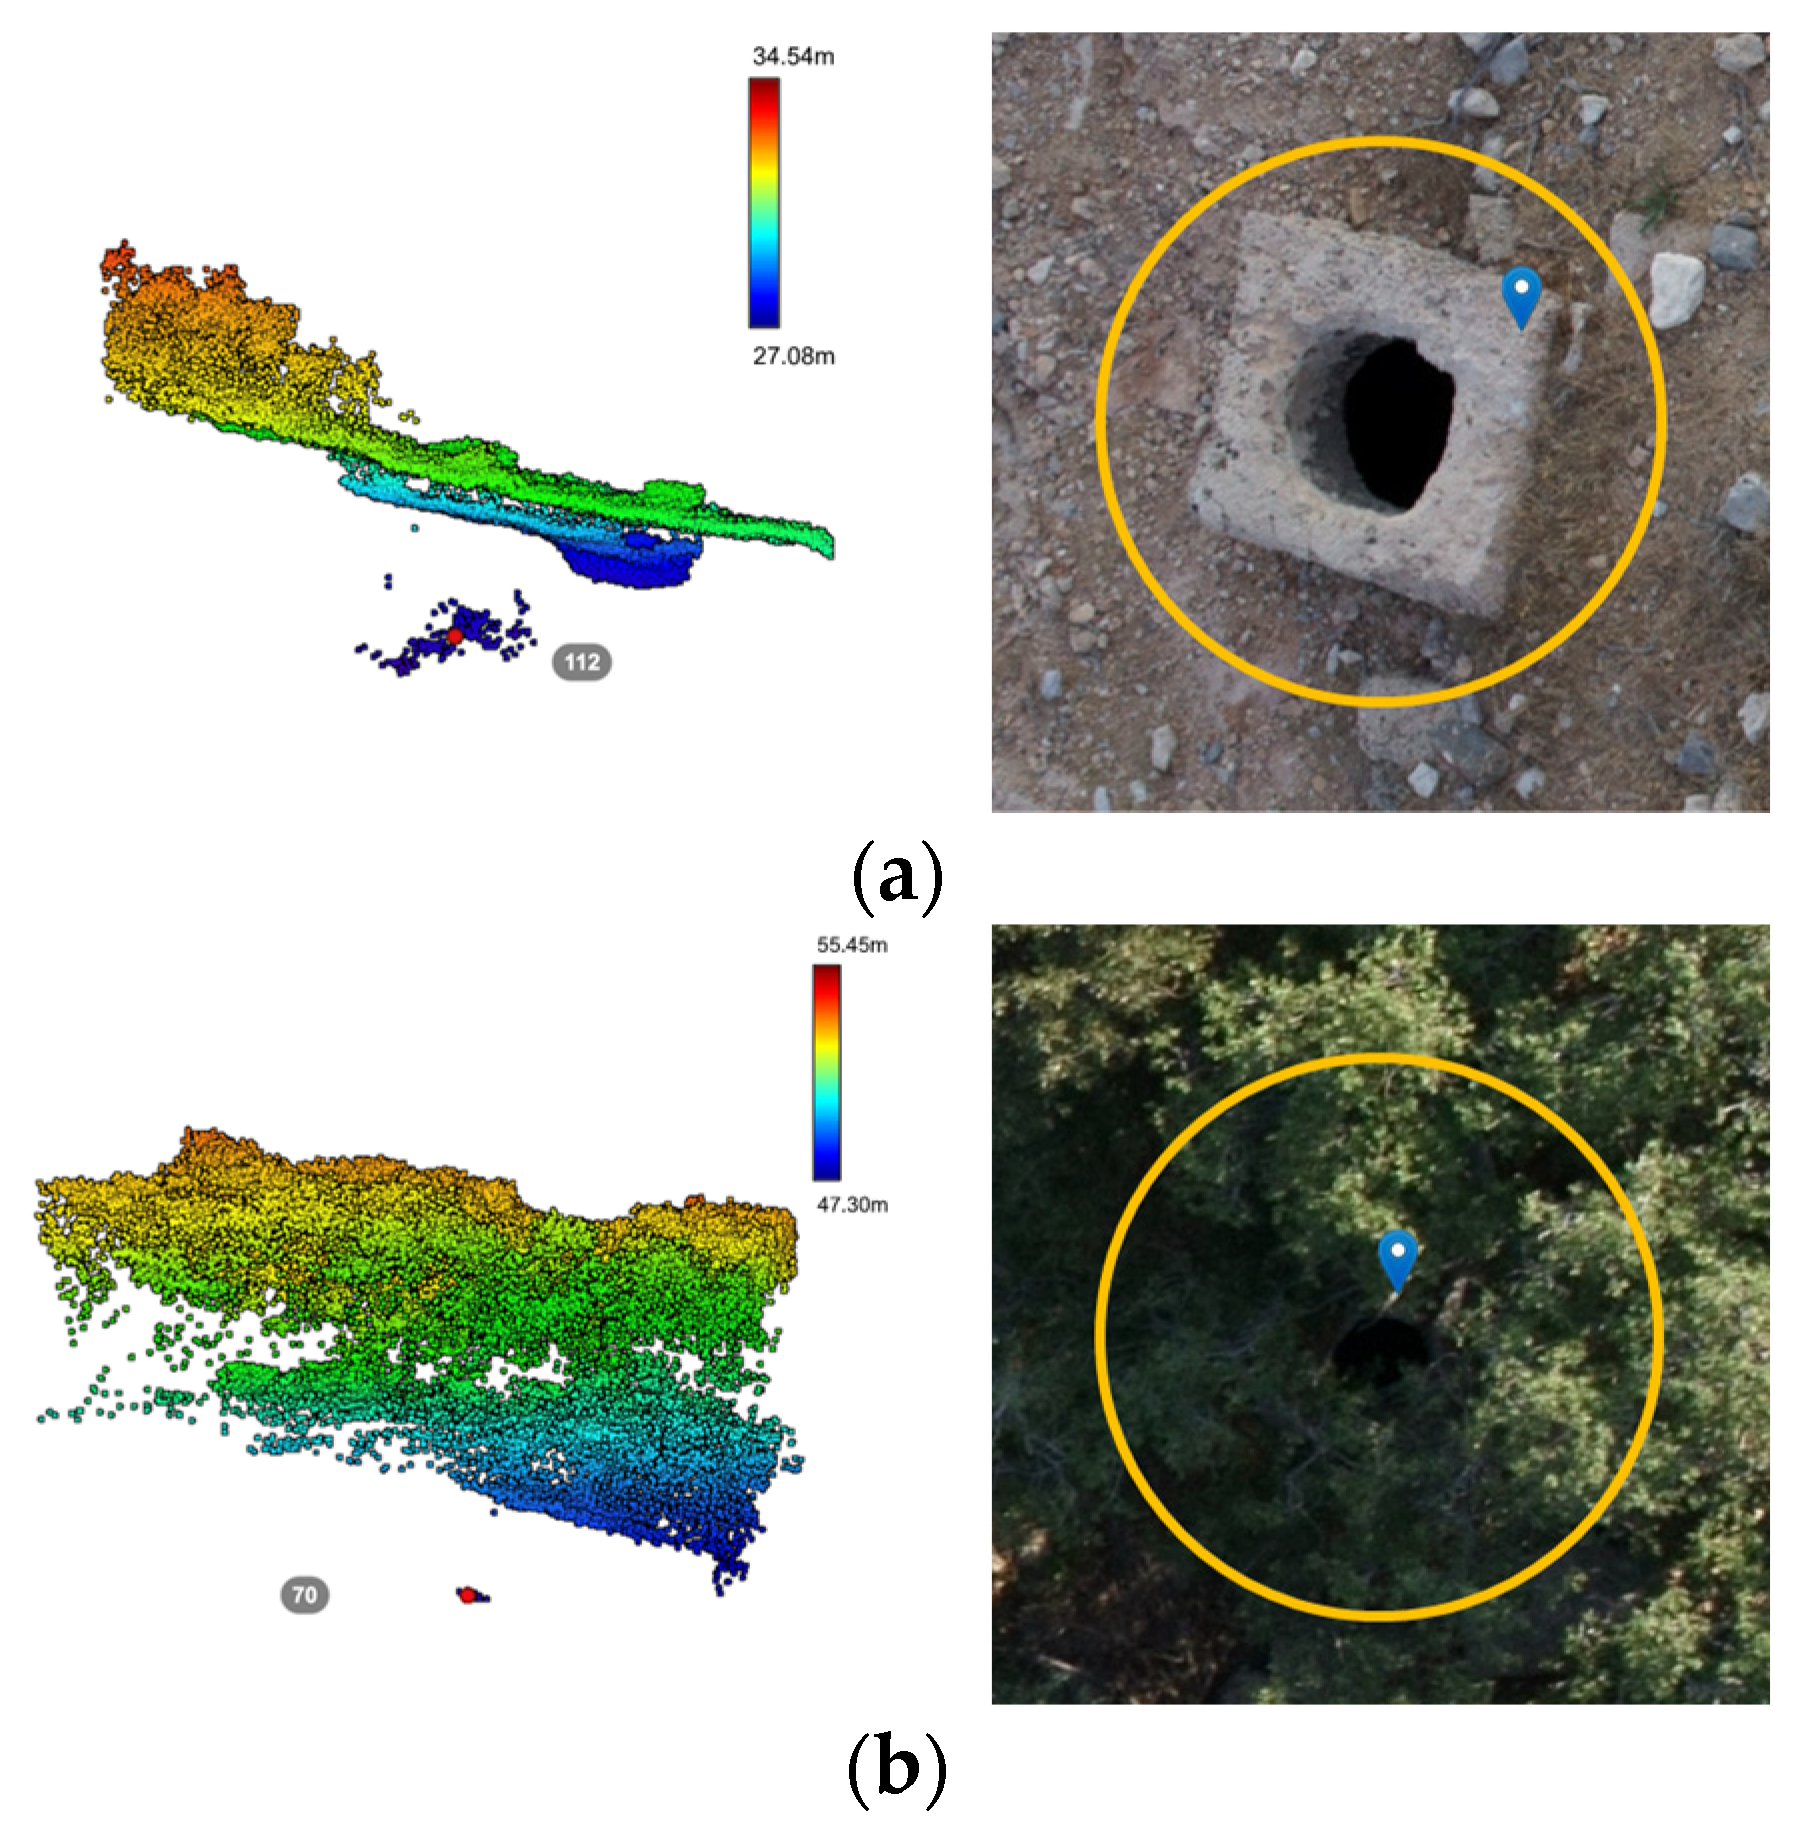
Curating a reference dataset for this study was quite challenging. Therefore, we had to use a variety of sources to generate a reference dataset that is as complete as possible. A portion of the reference data was available through multi-year field survey missions by archaeologists on the site. Another set was derived through manual inspection of the LiDAR point cloud and imagery data, which were manipulated through the developed web-visualization portal. More specifically, the LiDAR data were carefully inspected to determine potential underground structure locations. These potential locations were then back-projected onto the imagery for verification. Alternatively, the operator could navigate through the images and whenever an underground structure is identified, it could be forward-projected onto the point cloud to derive its 3D location. Through this image-aided LiDAR identification strategy, underground structures are classified into three categories: (i) easy to see in the images, (ii) hard to see in the images, and (iii) no image available (hereafter denoted as “easy_img”, “hard_img”, and “no_img”). Figure 22 shows sample cistern point clouds and their corresponding images for the easy_img, hard_img, and no_img categories. Figure 23 illustrates the reference dataset generated from manual inspection and field survey.

4. Experimental Results and Discussion

This section illustrates the feasibility of the proposed strategy for the detection/visualization of underground structures using UAV LiDAR data. The assessment process will be conducted through both qualitative and quantitative analyses, which are covered in the following subsections.

4.1. Qualitative Evaluation

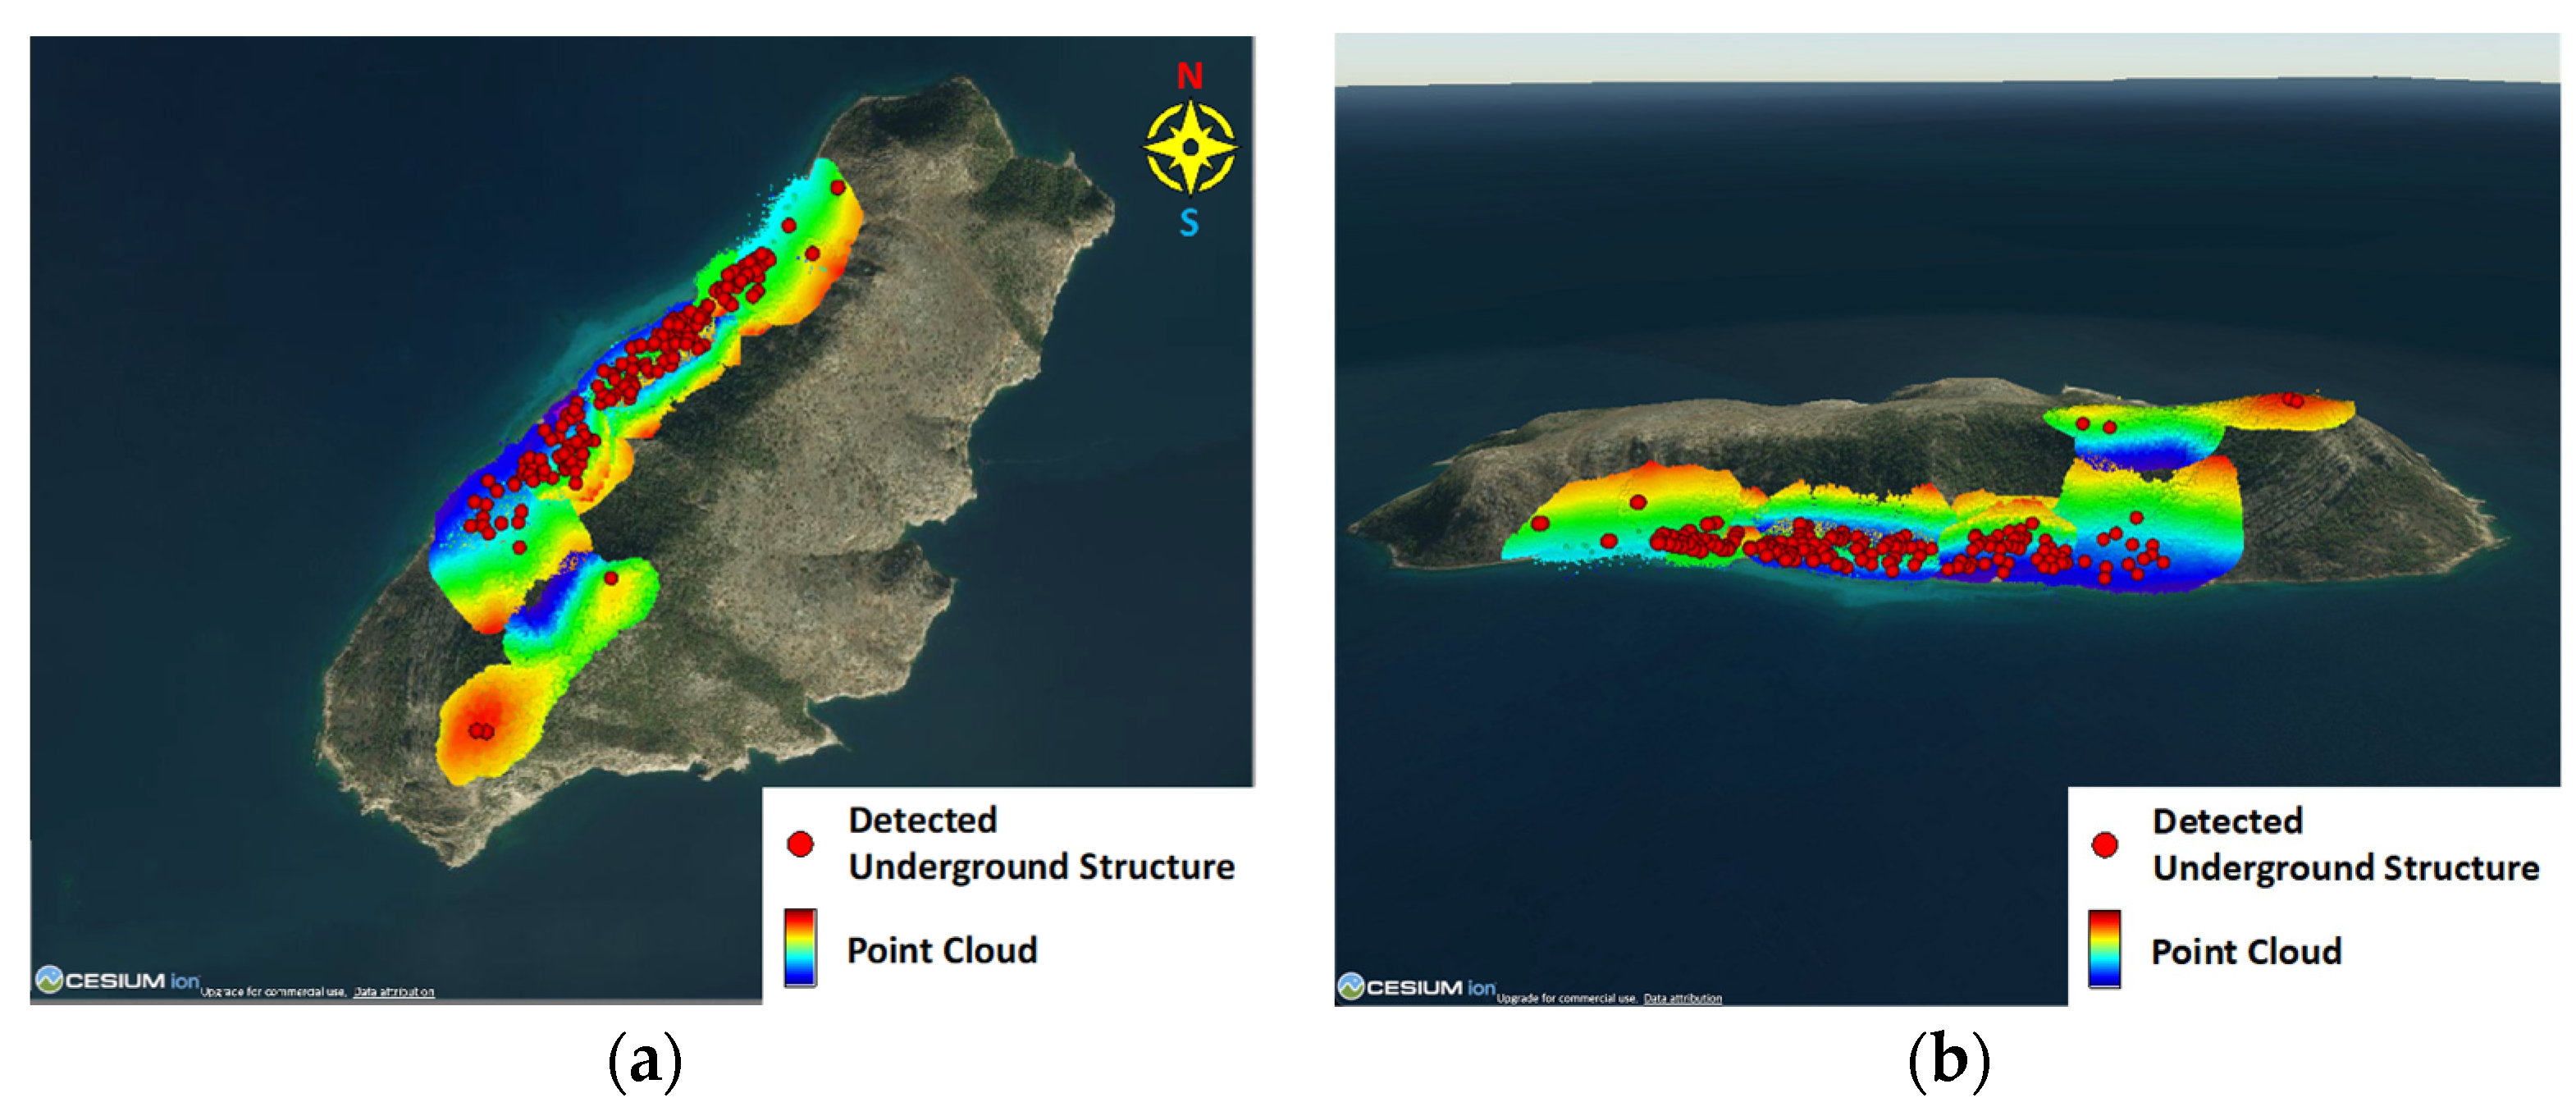
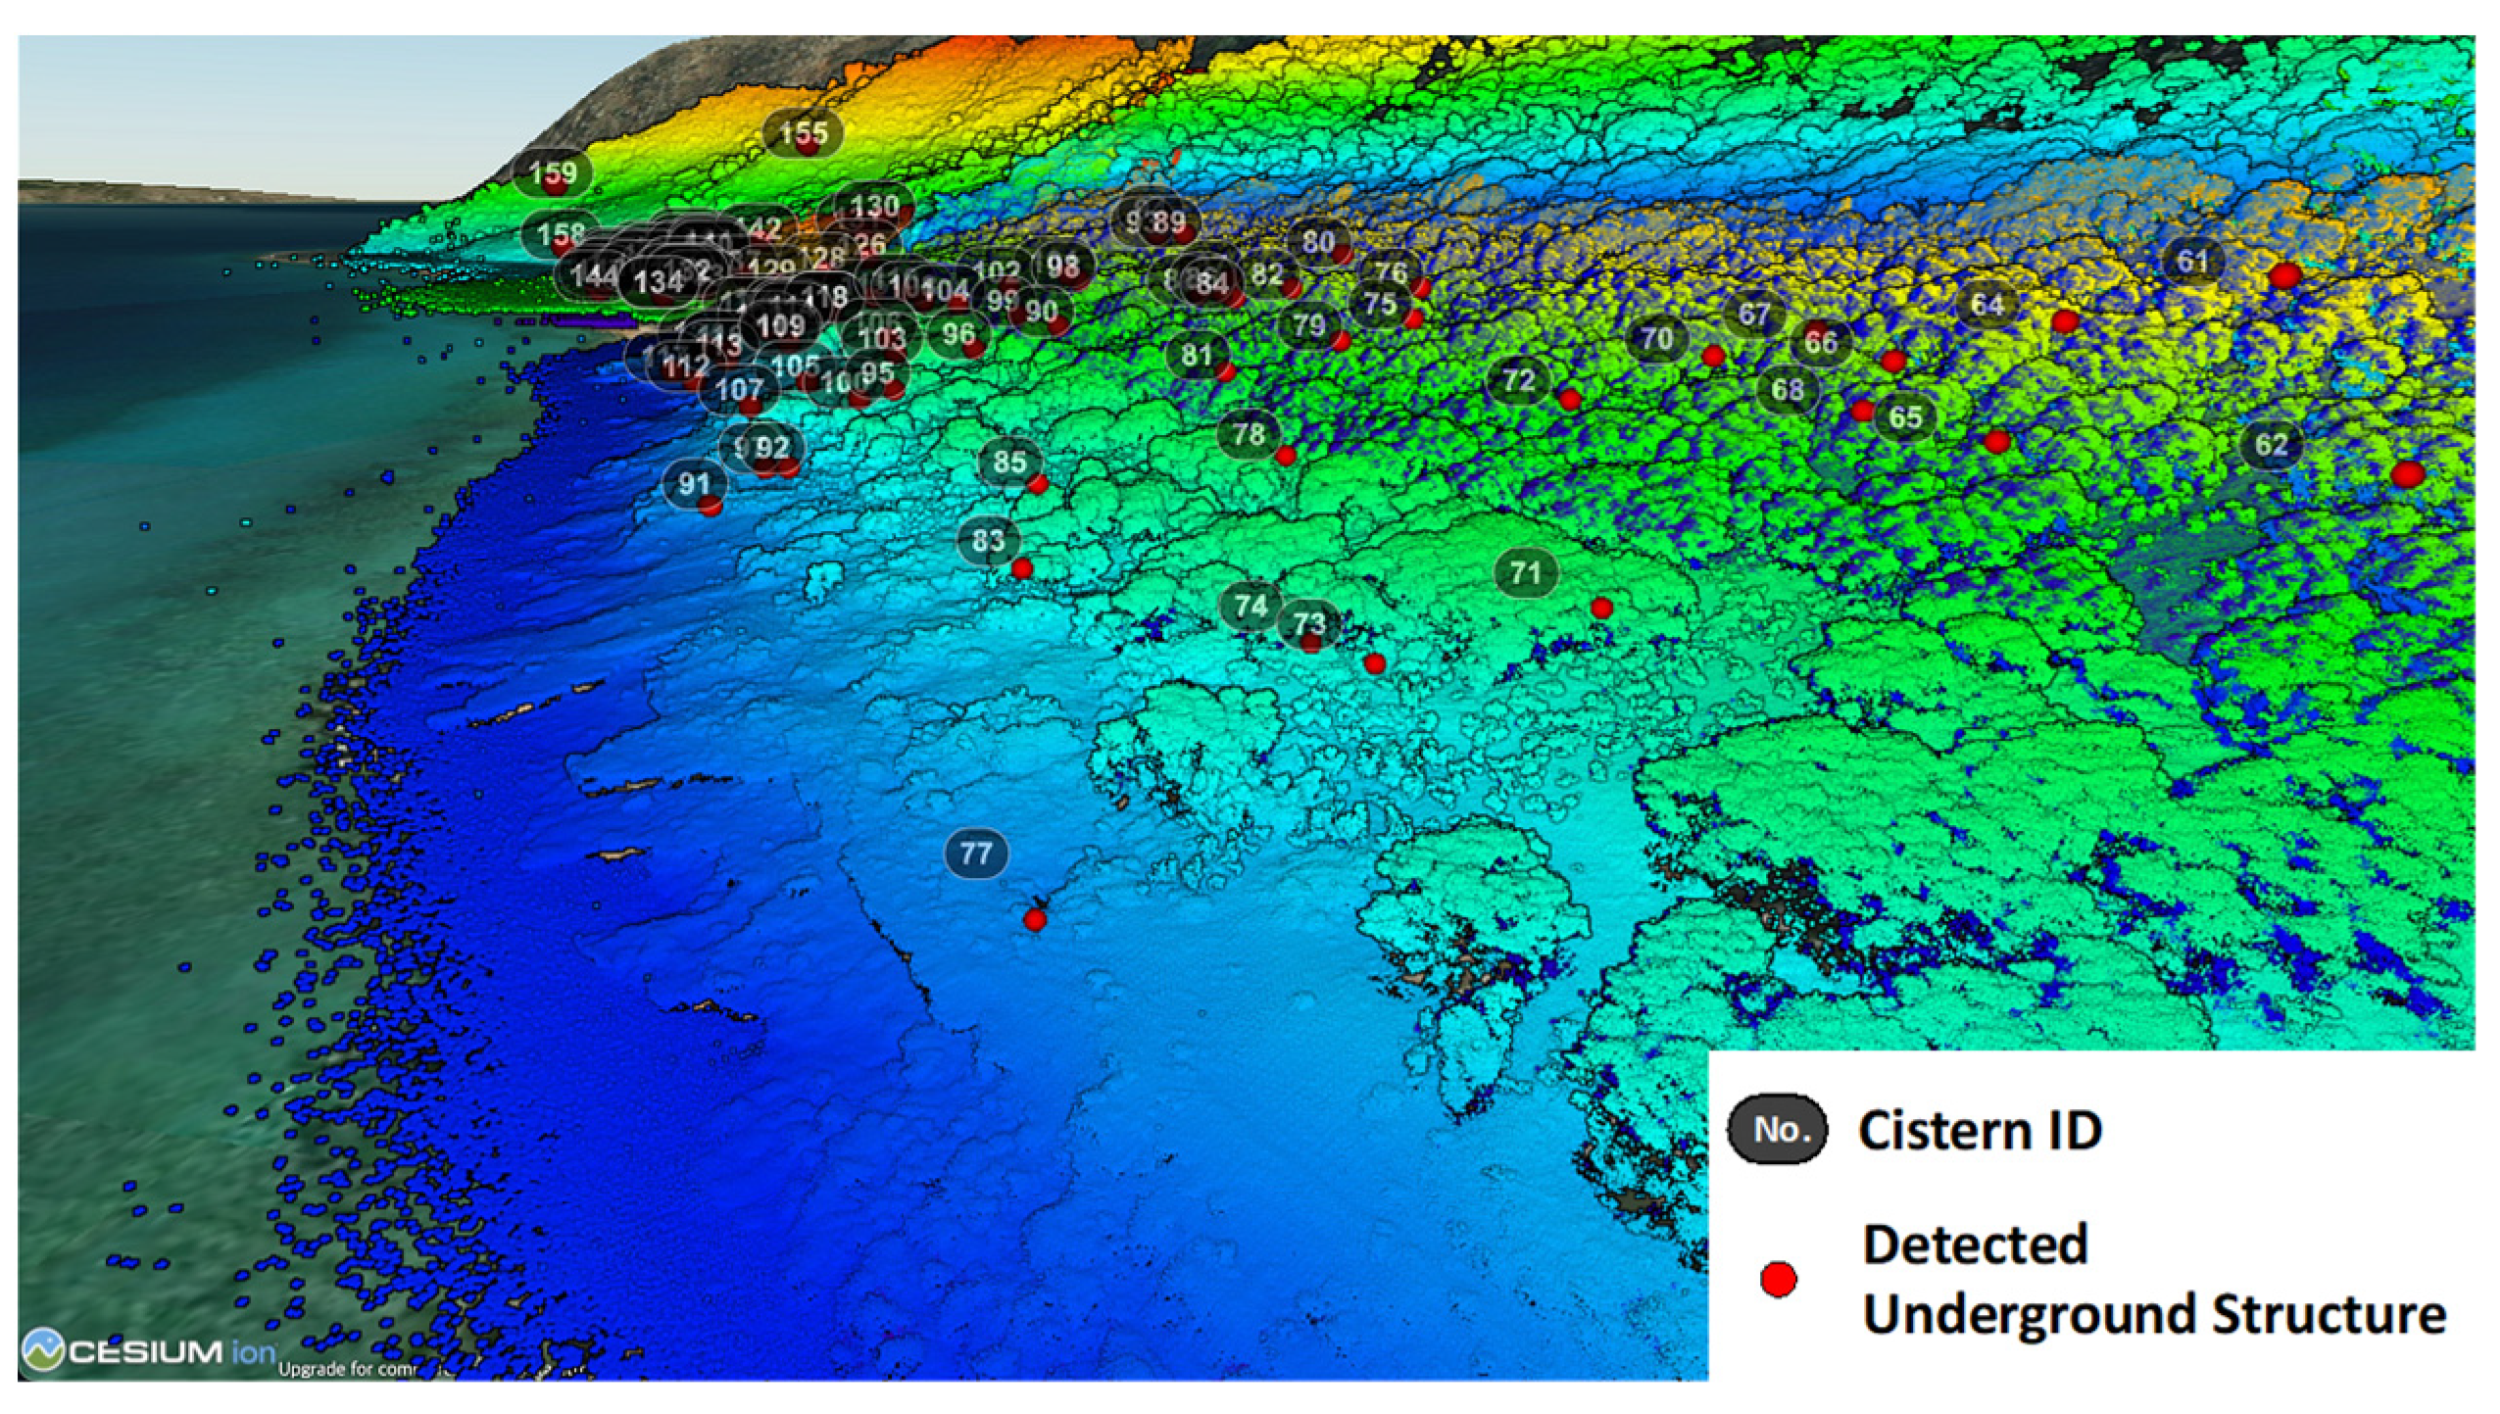
As shown in Table 1, a total of 5965 UAV images and roughly 931 million LiDAR points were collected through ten missions over four days. The proposed underground structure detection strategy was applied to these missions, and a total of 169 underground structures were detected. For the qualitative evaluation of the detection results, we mainly relied on the developed Potree web-visualization portal. The image and point cloud datasets were rendered by the portal in less than ten seconds. Figure 24 demonstrates the Cesium base maps overlaid with the LiDAR point clouds and UAV imagery from the ten missions. In addition to the imagery and LiDAR data, detected underground structures can also be visualized and annotated through the portal, as shown in Figure 25. The portal allows for end-users to interact with the rendered data using its built-in functions (i.e., rotate, zoom-in/out, move) without experiencing any lag, as shown in Figure 25b.
The detected underground structures can be simultaneously visualized in the imagery and LiDAR data through the developed forward- and backward-projection functions. Figure 26 illustrates a perspective view of annotated underground structure locations on the UAV LiDAR data. The backward projection function enables the user to visualize a specific underground structure location on all UAV images where it is visible (i.e., where its back-projection lies within the image frame), as shown in Figure 27. Conversely, for a given UAV image capturing an underground structure, its image coordinates can be forward-projected onto the LiDAR data, as shown in Figure 28. These backward and forward projections can be used to qualitatively evaluate the validity of detected underground structures. Figure 29 shows examples of detected cisterns in the LiDAR point cloud and corresponding images in which they are supposed to be visible while highlighting situations where a cistern is clearly visible (Figure 29a) or not visible (Figure 29b) in an image.

4.2. Quantitative Evaluation

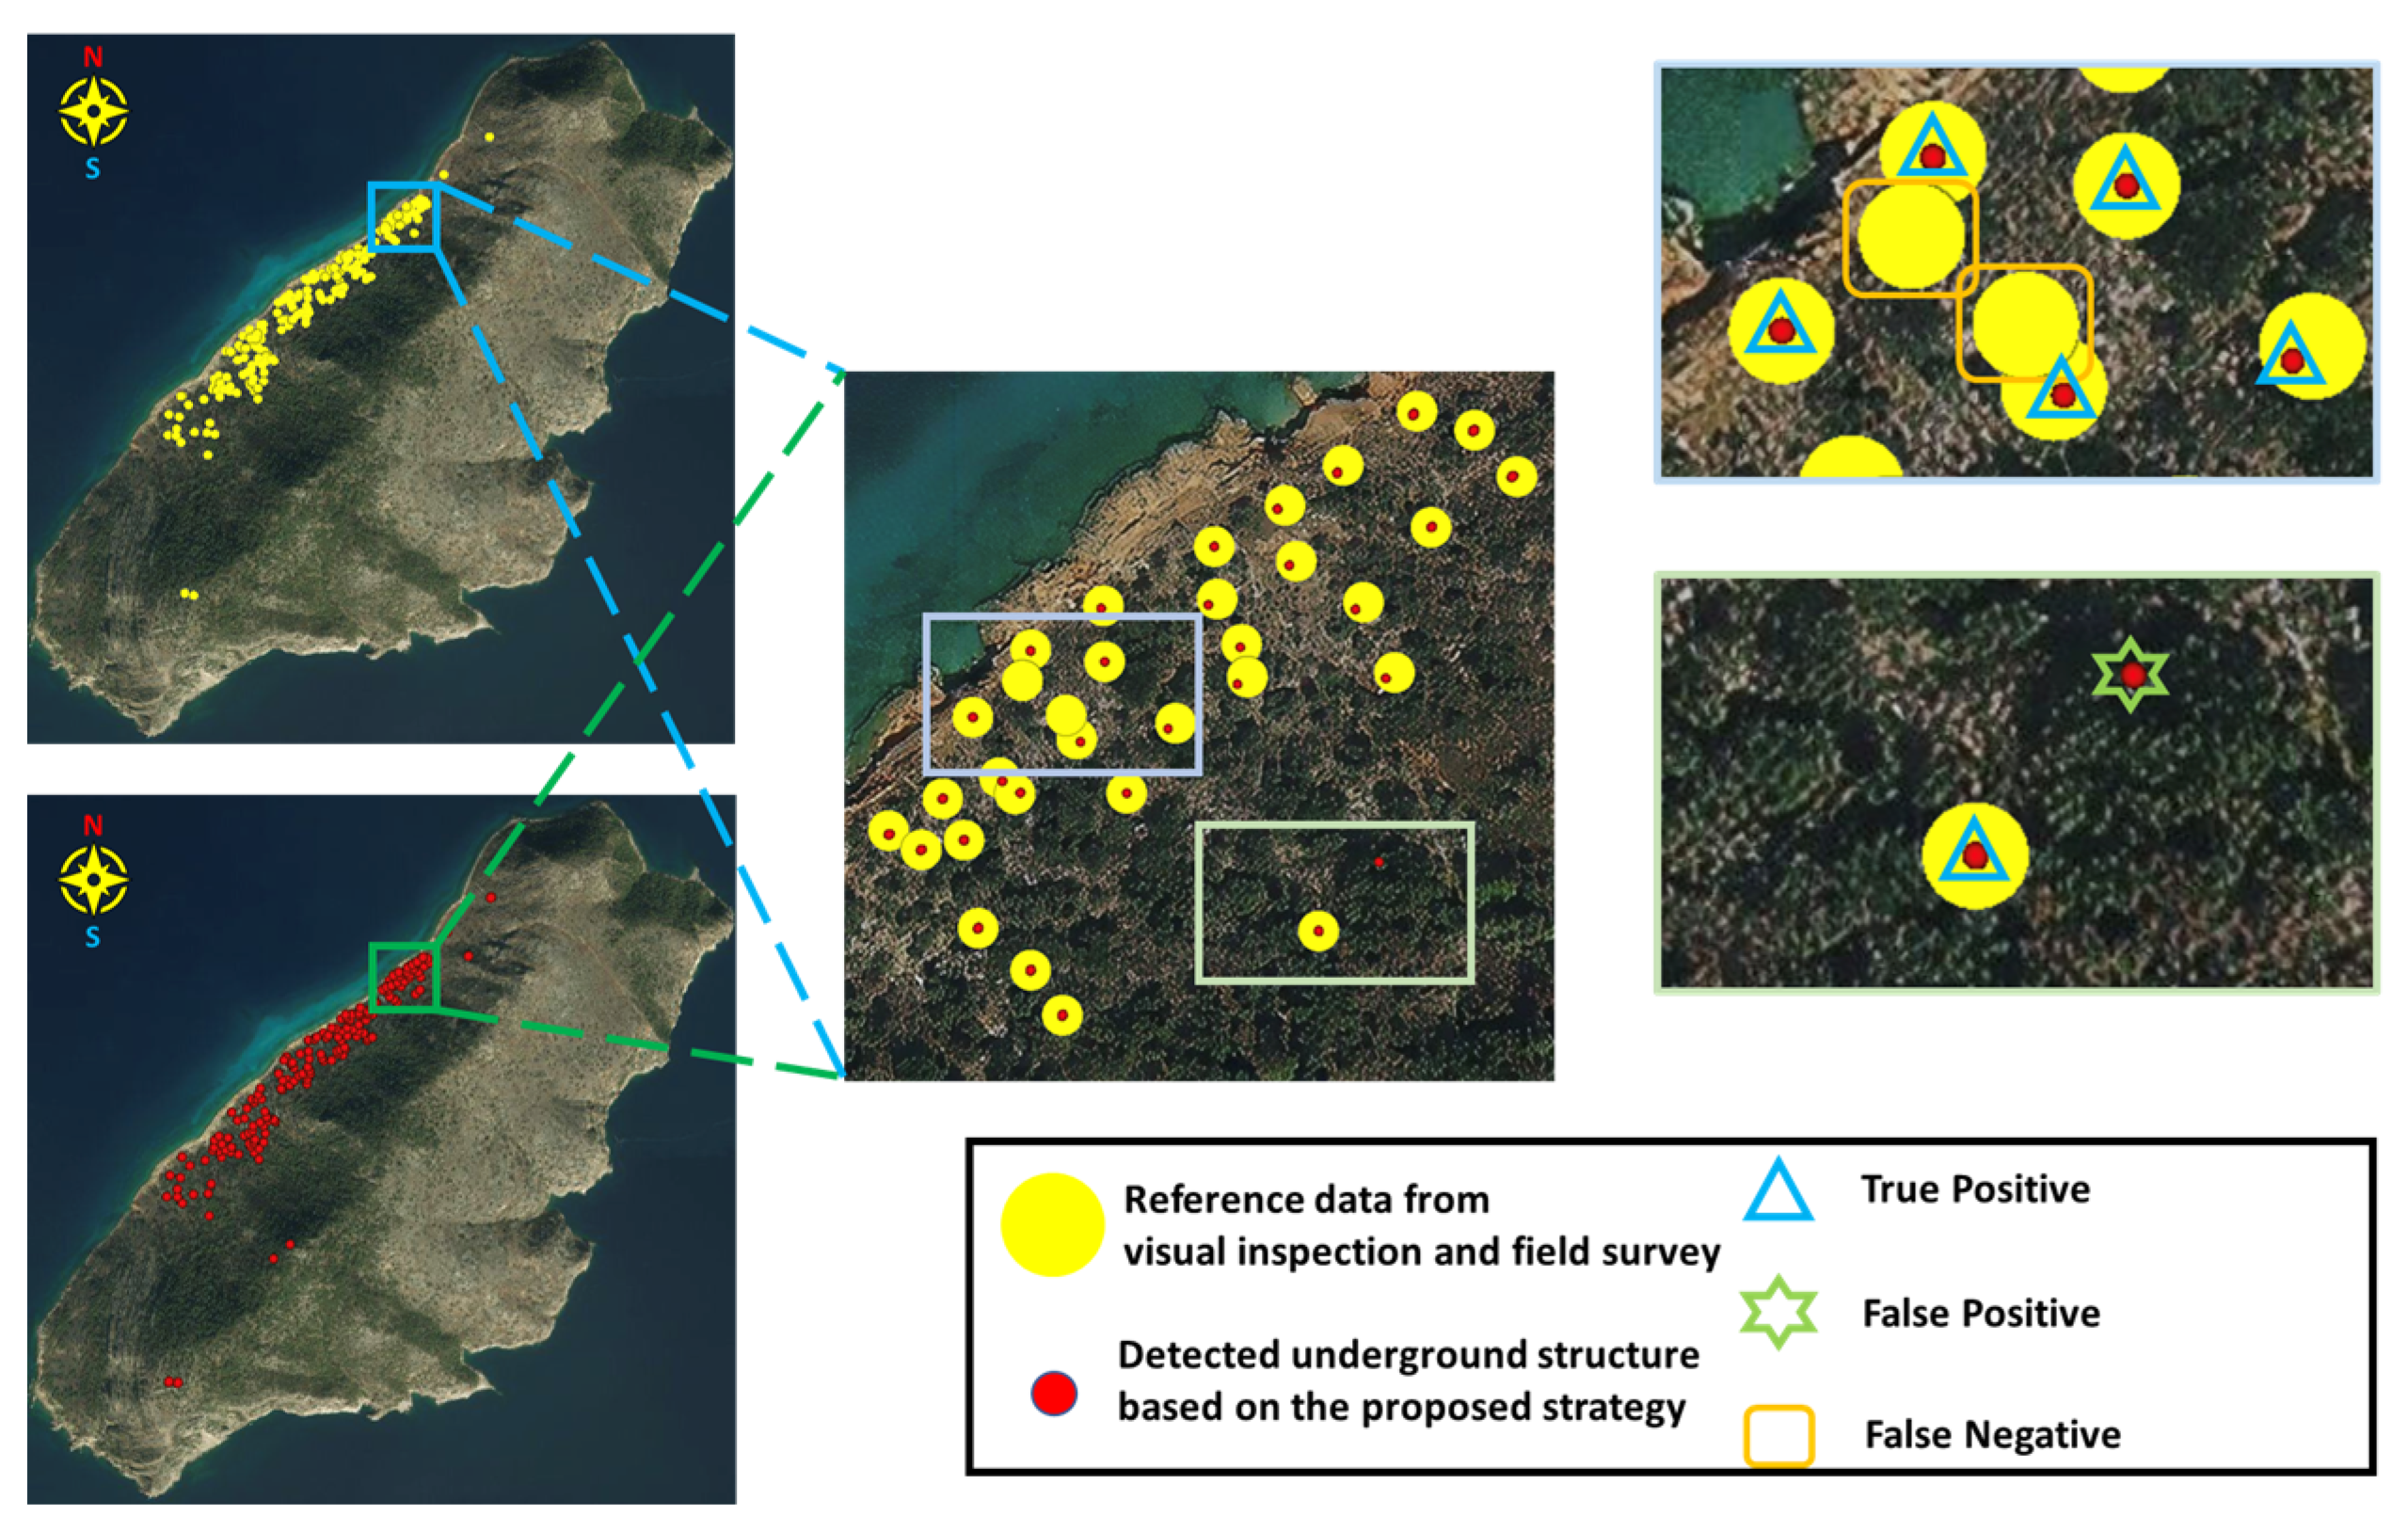
A total of 169 underground structures (the majority of which is cisterns) were detected in the LiDAR data by the proposed methodology. As already mentioned, these detected underground structures were verified through backward projection and categorized according to whether they are clearly visible in the images. Of the detected underground structures, a total of 70 were difficult to identify in the imagery; however, these structures are clearly visible in the LiDAR data as below-terrain surface objects. On the other hand, 93 underground structures were clearly visible in the image and LiDAR point cloud data. Using manual inspection and field survey to curate the reference data, a total of 188 reference underground structures were generated. It should be noted that the number and locations of the underground structures in the reference data are based on our best efforts to obtain as complete a dataset as possible. Figure 30 illustrates the detected underground structures and those existing in the reference dataset. The TP, FP, and FN values are reported in Table 3. Figure 31 shows a sample situation with a false-positive detection. This case shows a sudden terrain elevation change coupled with above-ground canopy. Although the modified cloth simulation and proposed post-processing steps can handle each of these scenarios individually, they fail to simultaneous addressing both scenarios. A false-negative situation is shown in Figure 32. This false negative is caused by a cistern that is filled with debris (i.e., points inside the cistern were not deep enough below the local terrain surface to be detected as a below-ground object). Based on the reported values in Table 3, the precision, recall, and F1-score are 0.97, 0.87, and 0.92, respectively.

5. Conclusions

This paper investigated the potential of deploying a UAV system equipped with GNSS/INS-assisted imaging and LiDAR units for the documentation of archaeological sites. To ensure practical access to acquired data and potential products, a web-visualization portal was developed without the need for high-end computational resources and the installation of a dedicated software. In addition, a methodology was developed for the detection of underground structures in complex archaeological sites. An example of such a site, Dana Island, Turkey, was selected for this study due to its rich archaeological landscape and presence of steep terrain with sudden elevation changes, which are sometimes covered by vegetation. Image and LiDAR data from a total of ten UAV missions captured over four days were used in this study. The acquired data showed a high level of detail and synergistic characteristics in imagery and LiDAR point clouds. A Potree web-visualization portal was successful in rendering large imagery and LiDAR data. Moreover, the implemented forward/backward projection capabilities of the portal confirmed the georeferencing quality of the acquired data. The proposed underground structure detection strategy focused on the derivation of a reliable terrain model in a complex environment containing: (1) noisy/outlier points, (2) sparse ground points due to canopy cover, (3) the presence of rugged terrain with sudden elevation change, and (4) the presence of numerous below ground objects. The detection strategy showed a good performance with an F1-score of 92%. However, we still obtained a few false positives and false negatives. The false negatives were mainly attributed to cisterns filled with debris.
Furthermore, the quantitative evaluation of results in this paper highlights the importance of incorporating field observations in future research. Although LiDAR sensing technology can successfully detect the vast majority of underground structures, it is unable to capture fully covered cisterns. Therefore, future research will investigate the use of Ground-Penetrating Radar (GPR).
For LiDAR-based algorithms, current and future work will focus on refining the terrain model generation strategies to handle situations where we have a combination of challenging factors. One such combination was the cause of the detected false positives. Regarding the false negatives obtained for those cisterns filled with debris, a hybrid strategy that utilizes both imagery and LiDAR data will be proposed. Moreover, the expansion of the data analytics to automatically detect other archaeological objects of interest (walls, quarry cuts, building layout, etc.) will be also addressed. The Potree web-visualization portal will be augmented by 2D- and 3D-plotting tools for the generation of precise sketches of archaeological artifacts. Finally, the developed terrain extraction methodology will be also investigated for the derivation of a reliable terrain model from UAV LiDAR data in natural forests with a complex terrain (i.e., steep ravines, debris, and canopy undergrowth). A reliable terrain model will be valuable for the precise determination of tree heights, which is important for the management of forest ecosystems.

Author Contributions

Conceptualization, G.V., N.K.R., S.A.M. and A.H.; formal analysis, investigation, methodology, and validation, Y.-H.S., S.-Y.S., H.R., Y.-T.C., T.Z., J.L., C.Z. and A.H.; software, Y.-H.S., S.-Y.S., H.R., Y.-T.C., T.Z., J.L. and C.Z.; writing—original draft preparation Y.-H.S., S.-Y.S., H.R., Y.-T.C., T.Z., J.L., C.Z. and A.H.; writing—review and editing, Y.-H.S., S.-Y.S., H.R., Y.-T.C., T.Z., J.L., C.Z., G.V., N.K.R., S.A.M. and A.H.; supervision, G.V., N.K.R., S.A.M. and A.H. All authors have read and agreed to the published version of the manuscript.

Funding

The work was partially supported by Koç University Stavros Niarchos Foundation Center for Late Antique and Byzantine Studies (GABAM) and Mimar Sinan Fine Arts University Scientific Research Fund. The work was partially conducted within the Purdue’s interdisciplinary ROSETTA (Remote Observation and Sensing Technologies and Technique in Archaeo-Anthropology) initiative and the Civil Engineering Center for Applications of UAS for a Sustainable Environment (CE-CAUSE). The work was partially supported by multiple Purdue University grants and awards, including the Laboratory & University Core Facility Research Equipment Program Grant that funded the drone and LiDAR equipment, the College of Liberal arts Aspire program for travel support, and the Humanities Without Walls seed grant administered by Purdue University for research activities. It was also partially supported by the Republic of Korea’s MSIT (Ministry of Science and ICT), under the High-Potential Individuals Global Training Program (Task No. RS-2022-00155232) supervised by the IITP (Institute of Information and Communications Technology Planning & Evaluation). The views and opinions of the authors expressed herein do not necessarily state or reflect those of the Turkish/United States/Korean Government or any agency thereof.

Data Availability Statement

Data sharing is not applicable to this paper.

Acknowledgments

We would like to thank Truman Parrish for facilitating the manual inspection of LiDAR data acquisition on Dana Island. The contents of this paper reflect the views of the authors, who are responsible for the facts and accuracy of the data presented herein, and do not necessarily reflect the official views or policies of the sponsoring organizations or data vendors. These contents do not constitute a standard, specification, or regulation.

Conflicts of Interest

The authors declare no conflict of interest.

References

  1. Binford, L.R. Archaeology as anthropology. In American Antiquity; Society for American Archaeology: Washington, DC, USA, 1962; Volume 28, pp. 217–225. [Google Scholar]
  2. Butzer, K.W. Environment and Archaeology; Aldine: Chicago, IL, USA, 1964. [Google Scholar]
  3. Clarke, D.L. Analytical Archaeology; Routledge: London, UK, 2014. [Google Scholar]
  4. Argyrou, A.; Agapiou, A. A Review of Artificial Intelligence and Remote Sensing for Archaeological Research. Remote Sens. 2022, 14, 6000. [Google Scholar] [CrossRef]
  5. Herz, N.; Garrison, E.G. Geological Methods for Archaeology; Oxford University Press: Oxford, UK, 1997. [Google Scholar]
  6. Renfrew, C.; Bahn, P. Archaeology: Theories, Methods and Practice; Thames and Hudson: London, UK, 2012. [Google Scholar]
  7. Chen, F.; You, J.; Tang, P.; Zhou, W.; Masini, N.; Lasaponara, R. Unique performance of spaceborne SAR remote sensing in cultural heritage applications: Overviews and perspectives. Archaeol. Prospect. 2018, 25, 71–79. [Google Scholar] [CrossRef]
  8. Lozić, E. Application of Airborne LiDAR Data to the Archaeology of Agrarian Land Use: The Case Study of the Early Medieval Microregion of Bled (Slovenia). Remote Sens. 2021, 13, 3228. [Google Scholar] [CrossRef]
  9. Štular, B.; Lozić, E.; Eichert, S. Airborne LiDAR-derived digital elevation model for archaeology. Remote Sens. 2021, 13, 1855. [Google Scholar] [CrossRef]
  10. Luo, L.; Wang, X.; Guo, H.; Lasaponara, R.; Zong, X.; Masini, N.; Wang, G.; Shi, P.; Khatteli, H.; Chen, F.; et al. Airborne and spaceborne remote sensing for archaeological and cultural heritage applications: A review of the century (1907–2017). Remote Sens. Environ. 2019, 232, 111280. [Google Scholar] [CrossRef]
  11. Orcutt, J. Earth System Monitoring, Introduction. In Earth System Monitoring: Selected Entries from the Encyclopedia of Sustainability Science and Technology; Springer: New York, NY, USA, 2013; pp. 1–5. [Google Scholar]
  12. Zaina, F.; Tapete, D. Satellite-Based Methodology for Purposes of Rescue Archaeology of Cultural Heritage Threatened by Dam Construction. Remote Sens. 2022, 14, 1009. [Google Scholar] [CrossRef]
  13. Lin, J.; Wang, M.; Yang, J.; Yang, Q. Landslide identification and information extraction based on optical and multispectral uav remote sensing imagery. IOP Conf. Ser. Earth Environ. Sci. 2017, 57, 012017. [Google Scholar] [CrossRef] [Green Version]
  14. Matese, A.; Toscano, P.; Di Gennaro, S.F.; Genesio, L.; Vaccari, F.P.; Primicerio, J.; Belli, C.; Zaldei, A.; Bianconi, R.; Gioli, B. Intercomparison of UAV, aircraft and satellite remote sensing platforms for precision viticulture. Remote Sens. 2015, 7, 2971–2990. [Google Scholar] [CrossRef] [Green Version]
  15. Osco, L.P.; Marcato, J., Jr.; Ramos, A.P.M.; de Castro Jorge, L.A.; Fatholahi, S.N.; de Andrade Silva, J.; Matsubara, E.T.; Pistori, H.; Gonçalves, W.N.; Li, J. A review on deep learning in UAV remote sensing. Int. J. Appl. Earth Observ. Geoinf. 2021, 102, 102456. [Google Scholar] [CrossRef]
  16. Sothe, C.; Dalponte, M.; Almeida, C.M.D.; Schimalski, M.B.; Lima, C.L.; Liesenberg, V.; Miyoshi, G.T.; Tommaselli, A.M.G. Tree species classification in a highly diverse subtropical forest integrating UAV-based photogrammetric point cloud and hyperspectral data. Remote Sens. 2019, 11, 1338. [Google Scholar] [CrossRef] [Green Version]
  17. Zang, W.; Lin, J.; Wang, Y.; Tao, H. Investigating small-scale water pollution with UAV remote sensing technology. In Proceedings of the World Automation Congress 2012, Puerto Vallarta, Mexico, 24–28 June 2012. [Google Scholar]
  18. Lo Brutto, M.; Burruso, A.; D’Argenio, A. Uav Systems for Photogrammetric Data Acquisition of Archaeological Sites. Int. J. Herit. Digit. Era 2012, 1 (Suppl. S1), 7–13. [Google Scholar] [CrossRef] [Green Version]
  19. Ebolese, D.; Lo Brutto, M.; Dardanelli, G. UAV Survey for the Archaeological Map of Lilybaeum (Marsala, Italy). Int. Arch. Photogramm. Remote Sens. Spatial Inf. Sci. 2019, XLII-2/W11, 495–502. [Google Scholar] [CrossRef] [Green Version]
  20. Muñoz-Nieto, A.L.; Rodriguez-Gonzalvez, P.; Gonzales-Aguilera, D.; Fernandez-Hernandez, J.; Gomez-Lahoz, J.; Picon-Cabrera, I.; Herrero-Pascual, J.S.; Hernandez-Lopez, D. UAV Archaeological Reconstruction: The Study Case of Chamartin Hillfort (Avila, Spain). ISPRS Ann. Photogr. Remote Sens. Spatial Inf. Sci. 2014, II-5, 259–265. [Google Scholar] [CrossRef] [Green Version]
  21. Fernndez-Hernndez, J.; Gonzlez-Aguilera, D.; Rodrguez-Gonzlvez, P.; Juan, M.-T. Image-Based Modelling from Unmanned Aerial Vehicle (UAV) Photogrammetry: An Effective, Low-Cost Tool for Archaeological Applications. Archaeometry 2015, 57, 128–145. [Google Scholar] [CrossRef]
  22. Peña-Villasenín, S.; Gil-Docampo, M.; Juan, O.-S. Professional SfM and TLS vs a simple SfM photogrammetry for 3D modelling of rock art and radiance scaling shading in engraving detection. J. Cult. Herit. 2019, 37, 238–246. [Google Scholar] [CrossRef]
  23. Levick, S.R.; Whiteside, T.; Loewensteiner, D.A.; Rudge, M.; Bartolo, R. Leveraging TLS as a calibration and validation tool for MLS and ULS mapping of savanna structure and biomass at landscape-scales. Remote Sens. 2021, 13, 257. [Google Scholar] [CrossRef]
  24. Shao, J.; Zhang, W.; Mellado, N.; Grussenmeyer, P.; Li, R.; Chen, Y.; Wan, P.; Zhang, X.; Cai, S. Automated markerless registration of point clouds from TLS and structured light scanner for heritage documentation. J. Cult. Herit. 2019, 35, 16–24. [Google Scholar] [CrossRef] [Green Version]
  25. Taddia, Y.; Stecchi, F.; Pellegrinelli, A. Coastal mapping using DJI Phantom 4 RTK in post-processing kinematic mode. Drones 2020, 4, 9. [Google Scholar] [CrossRef] [Green Version]
  26. Zang, Y.; Yang, B.; Li, J.; Guan, H. An accurate TLS and UAV image point clouds registration method for deformation detection of chaotic hillside areas. Remote Sens. 2019, 11, 647. [Google Scholar] [CrossRef] [Green Version]
  27. Monterroso-Checa, A.; Moreno-Escribano, J.C.; Gasparini, M.; Conejo-Moreno, J.A.; Domínguez-Jiménez, J.L. Revealing Archaeological Sites under Mediterranean Forest Canopy Using LiDAR: El Viandar Castle (husum) in El Hoyo (Belmez-Córdoba, Spain). Drones 2021, 5, 72. [Google Scholar] [CrossRef]
  28. Masini, N.; Abate, N.; Gizzi, F.T.; Vitale, V.; Amodio, A.M.; Sileo, M.; Biscione, M.; Lasaponara, R.; Bentivenga, M.; Cavalcante, F. UAV LiDAR Based Approach for the Detection and Interpretation of Archaeological Micro Topography under Canopy—The Rediscovery of Perticara (Basilicata, Italy). Remote Sens. 2022, 14, 6074. [Google Scholar] [CrossRef]
  29. Schroder, W.; Murtha, T.; Golden, C.; Scherer, A.K.; Broadbent, E.N.; Zambrano, A.M.A.; Herndon, K.; Griffin, R. UAV LiDAR Survey for Archaeological Documentation in Chiapas, Mexico. Remote Sens. 2021, 13, 4731. [Google Scholar] [CrossRef]
  30. Doyle, C.; Luzzadder-Beach, S.; Beach, T. Advances in remote sensing of the early Anthropocene in tropical wetlands: From biplanes to lidar and machine learning. Prog. Phys. Geogr. Earth Environ. 2022, 03091333221134185. [Google Scholar] [CrossRef]
  31. Kadhim, I.; Abed, F.M. The Potential of LiDAR and UAV-Photogrammetric Data Analysis to Interpret Archaeological Sites: A Case Study of Chun Castle in South-West England. ISPRS Int. J. Geo-Inf. 2021, 10, 41. [Google Scholar] [CrossRef]
  32. Enríquez, C.; Jurado, J.M.; Bailey, A.; Callén, D.; Collado, M.J.; Espina, G.; Marroquín, P.; Oliva, E.; Osla, E.; Ramos, M.I.; et al. The UAS-based 3D image characterization of Mozarabic church ruins in Bobastro (Malaga), Spain. Remote Sens. 2020, 12, 2377. [Google Scholar] [CrossRef]
  33. Temizer, T.; Nemli, G.; Ekizce, E.G.; Ekizce, A.E. 3D documentation of a historical monument using terrestrial laser scanning case study: Byzantine Water Cistern, Istanbul. Int. Arch. Photogramm. Remote Sens. Spatial Inf. Sci. 2013, 5, W2. [Google Scholar] [CrossRef] [Green Version]
  34. Willis, A.; Sui, Y.; Ringle, W.; Galor, K. Design and implementation of an inexpensive LIDAR scanning system with applications in archaeology. In Three-Dimensional Imaging Metrology; SPIE: Bellingham, WA, USA, 2009. [Google Scholar]
  35. Varinlioğlu, G.; Kaye, N.; Jones, M.R.; Ingram, R.; Rauh, N.K. The 2016 Dana Island Survey: Investigation of an Island Harbor in Ancient Rough Cilicia by the Boğsak Archaeological Survey. Near East. Archaeol. 2017, 80, 50–59. [Google Scholar] [CrossRef]
  36. LiDAR and Archaeology. 2022. Available online: https://education.nationalgeographic.org/resource/lidar-and-archaeology/ (accessed on 18 March 2023).
  37. Exclusive: Laser Scans Reveal Maya “Megalopolis” Below Guatemalan Jungle. 2018. Available online: https://www.nationalgeographic.com/history/article/maya-laser-lidar-guatemala-pacunam (accessed on 18 March 2023).
  38. Yan, L.; Liu, H.; Tan, J.; Li, Z.; Chen, C. A multi-constraint combined method for ground surface point filtering from mobile lidar point clouds. Remote Sens. 2017, 9, 958. [Google Scholar] [CrossRef] [Green Version]
  39. Hui, Z.; Hu, Y.; Yevenyo, Y.Z.; Yu, X. An improved morphological algorithm for filtering airborne LiDAR point cloud based on multi-level kriging interpolation. Remote Sens. 2016, 8, 35. [Google Scholar] [CrossRef] [Green Version]
  40. LI, H. LiDAR point cloud morphological filtering based on adaptive slope. Site Investig. Sci. Technol. 2017, 2, 26–29. [Google Scholar]
  41. Xiao-Qian, C.; Hong-Qiang, Z. Lidar Point Cloud Data Filtering based on Regional Growing. Remote Sens. Nat. Res. 2009, 20, 6–8. [Google Scholar]
  42. Vosselman, G. Slope based filtering of laser altimetry data. Int. Arch. Photogramm. Remote Sens. 2000, 33, 935–942. [Google Scholar]
  43. Sithole, G.; Vosselman, G. Filtering of laser altimetry data using a slope adaptive filter. Int. Arch. Photogramm. Remote Sens. Spatial Inf. Sci. 2001, 34, 203–210. [Google Scholar]
  44. Geng, J.; Yu, K.; Xie, Z.; Zhao, G.; Ai, J.; Yang, L.; Yang, H.; Liu, J. Analysis of spatiotemporal variation and drivers of ecological quality in Fuzhou based on RSEI. Remote Sens. 2022, 14, 4900. [Google Scholar] [CrossRef]
  45. Zhang, W.; Qi, J.; Wan, P.; Wang, H.; Xie, D.; Wang, X.; Yan, G. An easy-to-use airborne LiDAR data filtering method based on cloth simulation. Remote Sens. 2016, 8, 501. [Google Scholar] [CrossRef]
  46. Lin, Y.-C.; Manish, R.; Bullock, D.; Habib, A. Comparative analysis of different mobile LiDAR mapping systems for ditch line characterization. Remote Sens. 2021, 13, 2485. [Google Scholar] [CrossRef]
  47. Ren, L.; Tang, J.; Cui, C.; Song, R.; Ai, Y. An Improved Cloth Simulation Filtering Algorithm Based on Mining Point Cloud. In Proceedings of the 2021 International Conference on Cyber-Physical Social Intelligence (ICCSI), Beijing, China, 18–20 December 2021. [Google Scholar]
  48. Serifoglu Yilmaz, C.; Yilmaz, V.; Güngör, O. Investigating the performances of commercial and non-commercial software for ground filtering of UAV-based point clouds. Int. J. Remote Sens. 2018, 39, 5016–5042. [Google Scholar] [CrossRef]
  49. Zhang, K.; Chen, S.-C.; Whitman, D.; Shyu, M.-L.; Yan, J.; Zhang, C. A progressive morphological filter for removing nonground measurements from airborne LIDAR data. IEEE Trans. Geosci. Remote Sens. 2003, 41, 872–882. [Google Scholar] [CrossRef] [Green Version]
  50. Zhang, K.; Whitman, D. Comparison of three algorithms for filtering airborne lidar data. Photogramm.Eng. Remote Sens. 2005, 71, 313–324. [Google Scholar] [CrossRef] [Green Version]
  51. Axelsson, P. DEM generation from laser scanner data using adaptive TIN models. Int. Arch. Photogramm. Remote Sens. 2000, 33, 110–117. [Google Scholar]
  52. Evans, J.S.; Hudak, A.T. A multiscale curvature algorithm for classifying discrete return LiDAR in forested environments. IEEE Trans. Geosci. Remote Sens. 2007, 45, 1029–1038. [Google Scholar] [CrossRef]
  53. Streutker, D.R.; Glenn, N.F. LiDAR measurement of sagebrush steppe vegetation heights. Remote Sens. Environ. 2006, 102, 135–145. [Google Scholar] [CrossRef]
  54. Mongus, D.; Žalik, B. Parameter-free ground filtering of LiDAR data for automatic DTM generation. ISPRS J. Photogramm. Remote Sens. 2012, 67, 1–12. [Google Scholar] [CrossRef]
  55. Bolkas, D.; Naberezny, B.; Jacobson, M. Comparison of sUAS Photogrammetry and TLS for Detecting Changes in Soil Surface Elevations Following Deep Tillage. J. Surv. Eng. 2021, 147, 04021001. [Google Scholar] [CrossRef]
  56. Bohak, C.; Slemenik, M.; Kordež, J.; Marolt, M. Aerial LiDAR data augmentation for direct point-cloud visualisation. Sensors 2020, 20, 2089. [Google Scholar] [CrossRef] [PubMed] [Green Version]
  57. Maravelakis, E.; Konstantaras, A.; Kabassi, K.; Chrysakis, I.; Georgis, C.; Axaridou, A. 3DSYSTEK web-based point cloud viewer. In Proceedings of the IISA 2014, The 5th International Conference on Information, Intelligence, Systems and Applications, Chania, Greece, 7–9 July 2014. [Google Scholar]
  58. Sehnal, D.; Bittrich, S.; Deshpande, M.; Svobodová, R.; Berka, K.; Bazgier, V.; Velankar, S.; Burley, S.K.; Koča, J.; Rose, A.S. Mol* Viewer: Modern web app for 3D visualization and analysis of large biomolecular structures. Nucleic Acids Res. 2021, 49, W431–W437. [Google Scholar] [CrossRef]
  59. Velodyne. UltraPuck Data Sheet. 2018. Available online: https://hypertech.co.il/wp-content/uploads/2016/05/ULTRA-Puck_VLP-32C_Datasheet.pdf (accessed on 18 January 2023).
  60. Sony. ILCE-7R Specifications. 2021. Available online: https://www.sony.com/electronics/support/e-mount-body-ilce-7-series/ilce-7r/specifications (accessed on 7 February 2023).
  61. Trimble. APX-15 UAV. 2019. Available online: https://www.applanix.com/downloads/products/specs/APX15_UAV.pdf (accessed on 7 February 2023).
  62. Trimble. POSPAC UAV. 2020. Available online: https://www.applanix.com/downloads/products/specs/POSPac-UAV.pdf (accessed on 7 February 2023).
  63. Ravi, R.; Lin, Y.-J.; Elbahnasawy, M.; Shamseldin, T. Simultaneous system calibration of a multi-lidar multicamera mobile mapping platform. IEEE J. Sel. Top. Appl. Earth Observ. Remote Sens. 2018, 11, 1694–1714. [Google Scholar] [CrossRef]
  64. Revelles, J.; Urena, C.; Lastra, M. An efficient parametric algorithm for octree traversal. J. WSCG 2000, 8, 1–3. [Google Scholar]
  65. Cai, S.; Zhang, W.; Liang, X.; Wan, P.; Qi, J.; Yu, S.; Yan, G.; Shao, J. Filtering airborne LiDAR data through complementary cloth simulation and progressive TIN densification filters. Remote Sens. 2019, 11, 1037. [Google Scholar] [CrossRef] [Green Version]
  66. Zhang, W.; Cai, S.; Liang, X.; Shao, J.; Hu, R.; Yu, S.; Yan, G. Cloth simulation-based construction of pit-free canopy height models from airborne LiDAR data. For. Ecosyst. 2020, 7, 1. [Google Scholar] [CrossRef] [Green Version]
  67. Yilmaz, C.S.; Yilmaz, V.; Gungor, O. Ground filtering of a uav-based point cloud with the cloth simulation filtering algorithm. In Proceedings of the International Conference on Advances and Innovations in Engineering (ICAIE), Elazig, Turkey, 10–12 May 2017. [Google Scholar]
  68. Schubert, E.; Sander, J.; Ester, M.; Kriegel, H.P.; Xu, X. DBSCAN revisited, revisited: Why and how you should (still) use DBSCAN. ACM Trans. Database Syst. 2017, 42, 1–21. [Google Scholar] [CrossRef]
  69. Schütz, M. Potree: Rendering Large Point Clouds in Web Browsers. Diploma Thesis, Vienna University of Technology, Vienna, Austria, 2016. [Google Scholar]
  70. Nesbit, P.R.; Durkin, P.R.; Hubbard, S.M. Visualization and sharing of 3D digital outcrop models to promote open science. GSA Today 2020, 30, 4–10. [Google Scholar] [CrossRef] [Green Version]
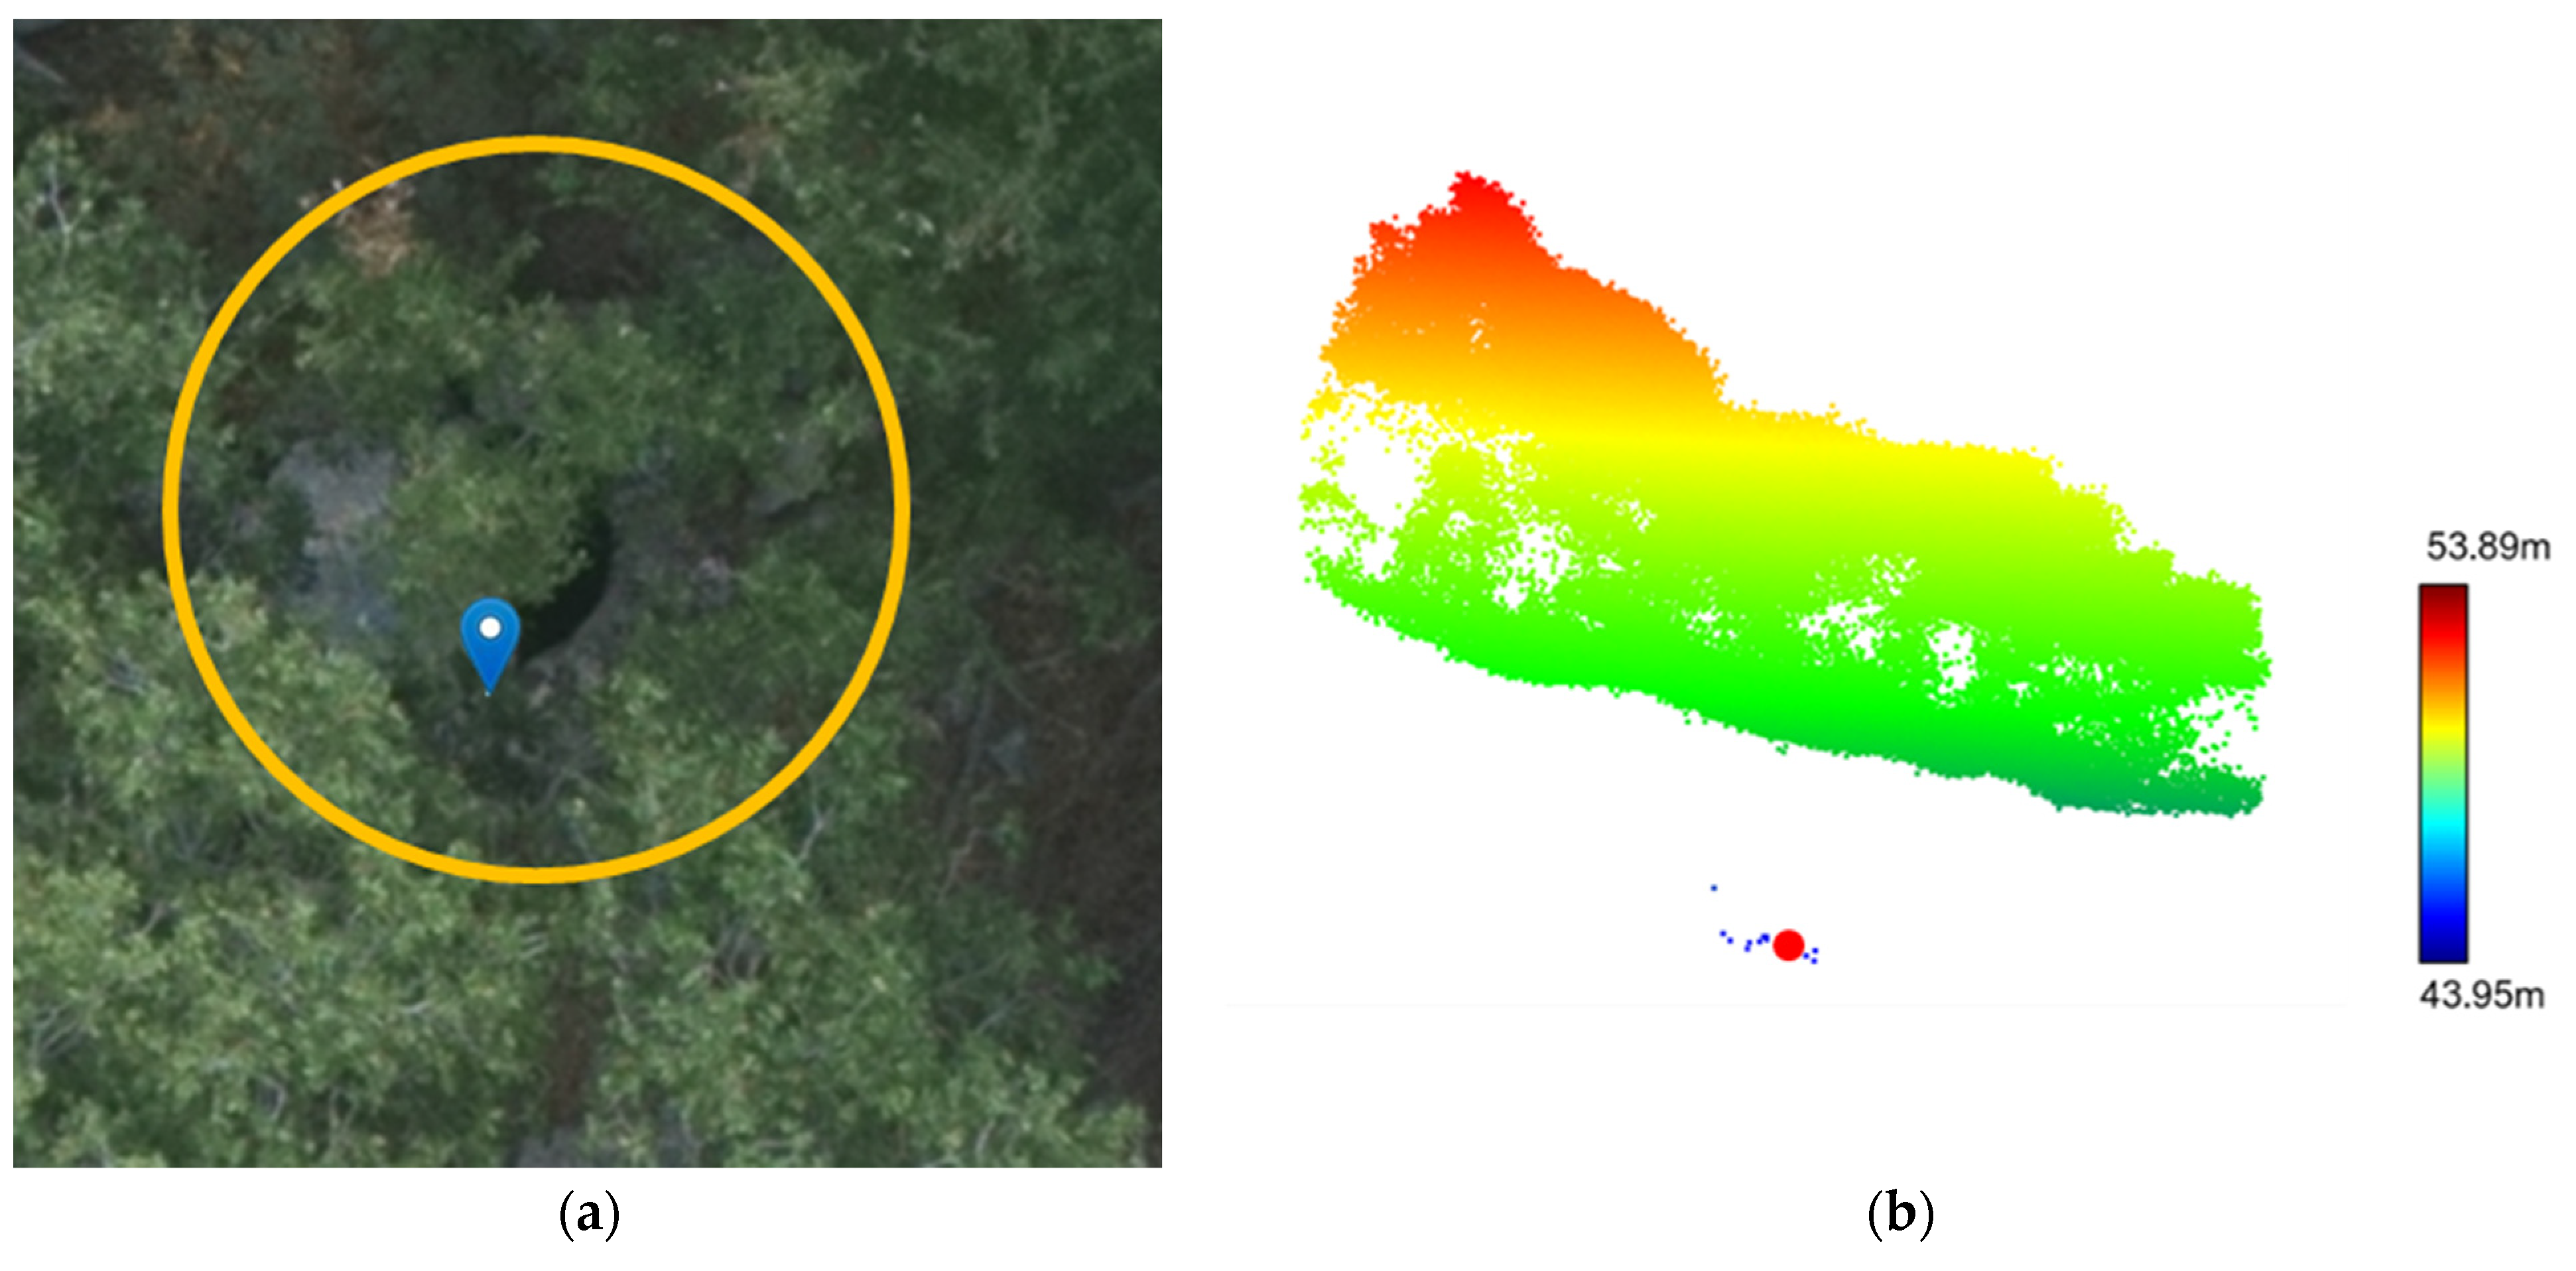
Figure 1. Illustration of a cistern in (a) an image and (b) LiDAR data (side view)—the cistern is hardly visible in the image, while it is clear in the point cloud (the blue placemark and red dot show the same location).
Remotesensing 15 01876 g001
Figure 2. Illustration of the UAV-based MMS used in this study.
Remotesensing 15 01876 g002
Figure 3. Illustrations of (a) mission information (yellow asterisk shows the study site) and the (b) used UAV and base station along the west coast of Dana Island.
Remotesensing 15 01876 g003
Figure 4. Illustration of a single mission coverage (mission #2 collected on 27 July 2019) along the west coast of Dana Island with the LiDAR colored by RGB data (whenever available)—otherwise, LiDAR data are colored by height.
Remotesensing 15 01876 g004
Figure 5. Schematic diagram of the point positioning equations for LiDAR and camera units onboard a GNSS/INS-assisted UAV system.
Remotesensing 15 01876 g005
Figure 6. Illustration of backward and forward projection processes for visualization.
Remotesensing 15 01876 g006
Figure 7. Schematic illustration of the forward projection algorithm: starting from I 1 , I 5 is the first point that fulfills the distance criteria; although I 8 and I 10 also meet the criteria, the corresponding surfaces are not visible.
Remotesensing 15 01876 g007
Figure 8. Examples of underground structures in Dana Island; images (left column) and corresponding LiDAR point clouds (right column).
Remotesensing 15 01876 g008
Figure 9. Flowchart of the proposed framework for the detection of underground structures using UAV LiDAR point clouds.
Remotesensing 15 01876 g009
Figure 10. Sample LiDAR point clouds (colored by height) showing the challenges in DTM generation: (a) presence of noise/outlier points; (b) sparse points on the ground caused by dense vegetation; (c) rugged terrain with sudden elevation change; and (d) presence of an underground structure.
Remotesensing 15 01876 g010
Figure 11. Schematic diagram of the cloth simulation strategy: (a) LiDAR points covering an area with a tree; (b) inverted LiDAR points and initial cloth; (c) final cloth; and (d) derived DTM as well as bare-earth and above-ground points.
Remotesensing 15 01876 g011
Figure 12. Derived DTM (in red), bare-earth points (in blue), and remaining points (in gray) using the cloth simulation algorithm for the challenging scenarios in Figure 10: (a) presence of noise/outlier points; (b) sparse points on the ground caused by dense vegetation; (c) rugged terrain with sudden elevation change; and (d) presence of an underground structure.
Remotesensing 15 01876 g012
Figure 13. Derived IHV using maximum height and 90th percentile height for three cases: Case A—ground with clean definition; Case B—ground with noise points; Case C—area with dense vegetation.
Remotesensing 15 01876 g013
Figure 14. Enhanced DTM (in red), bare-earth points (in blue), and remaining LiDAR points (in gray) using the proposed mitigation strategies for the challenging cases in Figure 10: (a) presence of a noise/outlier points; (b) sparse points on the ground caused by dense vegetation; (c) rugged terrain with sudden elevation change; and (d) presence of an underground structure.
Remotesensing 15 01876 g014
Figure 15. Illustrations of (a) original and (b) normalized point clouds for a sample profile (colored by height).
Remotesensing 15 01876 g015
Figure 16. Illustrations of (a) derived below-surface points (in purple) and (b) identified two clusters (in green and orange) representing underground structures, other points are colored in gray.
Remotesensing 15 01876 g016
Figure 17. Architecture of the Potree web-visualization portal established in this study.
Remotesensing 15 01876 g017
Figure 18. Illustrations of the base map and (a) UAV LiDAR point cloud over Dana Island overlaid with (b) UAV images in the Potree web-visualization portal.
Remotesensing 15 01876 g018
Figure 19. Illustration of the backward projection of a selected point (red dot) in a point cloud and the corresponding point in an image (blue placemark).
Remotesensing 15 01876 g019
Figure 20. Illustration of an object point within a cistern projected onto different images (elevation variations cause relief displacements, making the cistern invisible in some of the images—lower left and lower right).
Remotesensing 15 01876 g020
Figure 21. Illustration of the forward projection of a selected point (blue placemark) in an image and the corresponding point in LiDAR data (red dot).
Remotesensing 15 01876 g021
Figure 22. Illustrations of clearly visible cisterns in the UAV LiDAR point cloud and corresponding imagery which are (a) easy to see in the images, (b) hard to see in the images, and (c) no image available.
Remotesensing 15 01876 g022aRemotesensing 15 01876 g022b
Figure 23. Illustration of reference data generated through visual inspection of image and LiDAR data (in green) as well as field survey (in blue).
Remotesensing 15 01876 g023
Figure 24. Illustrations of the base map and (a) UAV LiDAR point cloud overlaid with (b) UAV images in the Potree web-visualization portal.
Remotesensing 15 01876 g024
Figure 25. Illustrations of (a) top view (default) and (b) perspective view of the base map and UAV point cloud overlaid with detected underground structures in the Potree web-visualization portal.
Remotesensing 15 01876 g025
Figure 26. Illustration of the base map and UAV LiDAR point cloud overlaid with annotated detected underground structure locations (red dots).
Remotesensing 15 01876 g026
Figure 27. Illustration of the backward projection of a selected cistern location (red dot) in the LiDAR point cloud and corresponding image where it is visible (blue placemark).
Remotesensing 15 01876 g027
Figure 28. Illustration of the forward projection of a cistern image point (blue placemark) and its corresponding point in the LiDAR data (red dot).
Remotesensing 15 01876 g028
Figure 29. Samples of detected cistern locations (red dots) in the LiDAR point cloud and images where they should be visible: (a) the cistern is clearly visible in the image and (b) the cistern is not visible in the image due to canopy cover.
Remotesensing 15 01876 g029
Figure 30. Illustration of detected underground structures and those existing in the reference dataset.
Remotesensing 15 01876 g030
Figure 31. Sample false-positive where we have a sudden elevation change covered by canopy.
Remotesensing 15 01876 g031
Figure 32. Sample false negatives caused by cisterns filled with debris.
Remotesensing 15 01876 g032
Table 1. Synergistic characteristics of imaging and LiDAR technologies for mapping/documentation of archaeological sites.
ApproachProsConsReference
Image-based
  • Less expensive.
  • Rich in semantic information.
  • Lots of existing image-processing strategies.
  • Only provides information about the canopy envelope.
  • Affected by illumination conditions.
  • Complex 3D reconstruction (e.g., establishing reliable matchings in overlapping imagery).
[4,18,21,30,31]
LiDAR-based
  • Straightforward 3D reconstruction.
  • Provides returns from below-canopy structures.
  • Not affected by illumination conditions.
  • More expensive.
  • Complex LiDAR data-processing strategies.
  • Less semantic information.
[28,30]
Table 2. Specifications of UAV data acquisitions along the west coast of Dana Island.
DatasetFlying Height
(m)
Average Speed (m/s)Flight Time (min)No. of ImagesNo. of Points
(million)
Spatial Coverage
(ha)
Day1 *-M145–656.013514766.5
Day1 *-M230–505.810518877.8
Day2 *-M1455.015597898.3
Day2 *-M260–805.015607589.7
Day2 *-M330–805.112578776.4
Day3 *-M145–505.515590966.6
Day3 *-M250–1005.7156868514.0
Day3 *-M360–905.01462514513.0
Day4 *-M150–905.0155871037.8
Day4 *-M222–403.0176631152.0
* Days 1–4 correspond to 26–29 July 2019, respectively; M1, M2, and M3 correspond to conducted missions on a given day.
Table 3. Classification of detection results according to the curated reference data.
Total Number of Detected
Underground Structures
True PositivesFalse PositivesFalse Negatives
169In total: 164524
easy_imghard_imgno_img
93701
Disclaimer/Publisher’s Note: The statements, opinions and data contained in all publications are solely those of the individual author(s) and contributor(s) and not of MDPI and/or the editor(s). MDPI and/or the editor(s) disclaim responsibility for any injury to people or property resulting from any ideas, methods, instructions or products referred to in the content.