Article

Comparing the Capability of Sentinel-2 and Landsat 9 Imagery for Mapping Water and Sandbars in the River Bed of the Lower Tagus River (Portugal)

by
Romeu Gerardo
1,2,3 and
Isabel P. de Lima
1,4,*
1
Department of Civil Engineering, Faculty of Sciences and Technology, University of Coimbra, Rua Luís Reis Santos, 3030-788 Coimbra, Portugal
2
CERIS, University of Coimbra, Rua Pedro Hispano s/n, 3030-289 Coimbra, Portugal
3
Itecons—Institute of Research and Technological Development in Construction, Energy, Environment and Sustainability, Rua Pedro Hispano, 3030-289 Coimbra, Portugal
4
MARE—Marine and Environmental Sciences Centre/ARNET–Aquatic Research Network, Pole MARE–UCoimbra, Polo II University of Coimbra, Rua Sílvio Lima, 3030-790 Coimbra, Portugal
*
Author to whom correspondence should be addressed.
Remote Sens. 2023, 15(7), 1927; https://doi.org/10.3390/rs15071927
Submission received: 4 March 2023 / Revised: 30 March 2023 / Accepted: 1 April 2023 / Published: 3 April 2023
(This article belongs to the Special Issue Initial Understanding of Landsat-9 Capabilities and Applications)

Abstract

:
Mapping river beds to identify water and sandbars is a crucial task for understanding the morphology and hydrodynamics of rivers and their ecological conditions. The main difficulties of this task so far have been the limitations of conventional approaches, which are generally costly (e.g., equipment, time- and human resource-demanding) and have poor flexibility to deal with all river conditions. Currently, alternative approaches rely on remote sensing techniques, which offer innovative tools for mapping water bodies in a quick and cost-effective manner based on relevant spectral indices. This study aimed to compare the capability of using imagery from the Sentinel-2 and newly launched Landsat 9 satellite to achieve this goal. For a segment of the Lower Tagus River (Portugal) with conditions of very low river discharge, comparison of the Normalized Difference Water Index, Modified Normalized Difference Water Index, Augmented Normalized Difference Water Index, and Automated Water Extraction Index calculated from the imagery of the two satellites shows that the two satellites’ datasets and mapping were consistent and therefore could be used complementarily. However, the results highlighted the need to classify satellite imagery based on index-specific classification decision values, which is an important factor in the quality of the information extracted.

1. Introduction

A key factor in understanding fluvial processes is mapping water surfaces and sandbars in river beds. This helps to characterize and monitor the morphologic and hydraulic behaviors and ecological conditions of rivers. The lack of data contributes to the slow progress in developing models in this field.
Sandbars are accumulations of sediment grains or sand and/or gravel deposits along a river’s main bed, which vary in time and space. These formations result from the river’s flow and sediment transport regimes [1], which lead to erosion and deposition processes that are determined by the combination of liquid and solid discharges in the river, sediment load grain size, and the river’s morphology, such as its slope and layout [2,3,4,5,6]. Larger flows have the potential to mobilize large amounts of bed and bank material, which often leads to the formation of new sandbars [7]. Additionally, the surface coverage of sandbars by vegetation also plays a role that depends on multiple factors, including the inundation frequency of the sandbars, which is conditioned by discharge, river hydraulics, and sandbar elevation [8]. The dynamics of sandbars affect the flow depths, control the supply and size of dredged aggregates, lead to localized erosion and hence damage to infrastructures, determine the navigability of rivers, and constrain the physical environment of the biota and ecosystem services [9,10,11,12,13,14,15].
Sandbars in rivers are more easily perceived under conditions of low flow, whether dictated by river regulation or hydrologic drought conditions. Conventional approaches to monitor river sandbars during such low flow conditions are based on historical photographs, ground-based surveys, and temporally sparse aerial datasets [16,17,18,19]. Overall, such approaches are generally costly (e.g., equipment, time- and human resource-demanding) and have poor flexibility to deal with all river conditions (e.g., river widths, discharges, flow velocities). Currently, alternative approaches rely on remote sensing (RS) techniques, which offer innovative tools for mapping water bodies based on relevant spectral indices. These methodologies are time- and cost-efficient and they allow us to monitor sandbar features over broader spatial extents.
Nowadays, RS data are available for short revisiting times and hence are expected to have the capability to be used as tools to investigate geomorphic processes that shape channel bars [20]. Information on the long-term morphodynamic evolution of channel bars, which have seldom been examined for many alluvial rivers, is required to reduce possible hazards in navigation and increase the understanding of erosion and deposition process responses to both natural and human influences in the river.
Valuable RS optical images data sources are, for example, those from the National Aeronautics and Space Administration (NASA), the U.S. Geological Survey (USGS), or the Copernicus satellite missions. Examples of studies that have used RS data to inspect the hydro-morphological evolution of rivers include those dedicated to the Mississippi River [20] and Yangtze River [21] using Landsat 5 and Landsat 8 imagery and the Po River [22] using Landsat 4-5-TM (Thematic Mapper sensor), Landsat 8-OLI (Operational Land Imager), and Sentinel-2 (S2) MSI (Multispectral Instrument) imagery. Recently, the new Landsat 9 (L9) carrying the Operational Land Imager 2 (OLI-2) was used to study bathymetry in the Colorado and Potomac Rivers [23]. The recent imagery from the S2 and L9 satellites is advantageous over that from previous satellites not only because of the higher spatial and temporal resolution but also because of the multispectral channels available. S2 includes 20 m resolution Short Wave Infrared (SWIR) bands and 10 m resolution Red, Green, Blue, and Near Infrared (NIR) bands, thereby making water mapping based on water indices at 10 and 20 m resolution possible [24]. L9, equipped with OLI-2, provides data with a 14-bit dynamic range, which is an improvement above the OLI on Landsat 8. As a result of OLI-2’s increased sensitivity to water-leaving radiation, its better radiometric resolution presents new prospects for monitoring inland and coastal waterways [25]. However, the application of S2 imagery in this type of study is scarce and the capability of L9 data has not yet been appraised for this end due to the very recent launching of the L9 satellite. It is expected that suitable multi-source data analysis could improve the time resolution limitations of RS data [26,27], in particular, S2 and L9 data.
Based on algebraic expressions and combinations of multispectral band reflectance data, several methods have been developed for surface water extraction from satellite imagery. The use of indices based on optical properties and subsequent application of image classification and segmentation methods to detect water and non-water pixels in satellite imagery has been found to be a valuable tool for understanding river morphodynamics [28,29] and can also have an important role in aquatic habitat assessment and ecological modeling.
The channel bar area, which can be assumed to correspond to the non-water pixels, has been commonly employed as a proxy to assess a sandbar’s dynamics [21]. Likely for simplicity, many studies have considered class separation values of spectral indices [30], without assessing their applicability. However, appropriate class separation values (i.e., thresholds) should be established to distinguish water surfaces/bodies from other land cover features, which should be defined on a case-by-case basis for the different multispectra-based data/outputs. The identification of these critical values has been discussed by different authors, arguing that the application of a fixed threshold value when using water indices to separate water from the background is disputable. For example, Ji et al. (2009) [31] stated that the threshold was a dynamic value that changed depending on the subpixel land cover characteristics.
The aim of this study was to explore different methodologies for mapping surface water and sandbars in rivers using data from the S2 and the newly launched L9 satellite in order to better understand the usefulness of data from both origins for this task. This study, which focused on a segment of the Lower Tagus River in Portugal, presents the first assessment of the potential of L9 for estimating water and sandbar surfaces in fluvial systems. Several spectral water indices were used to identify water and sandbars in the river bed. The results obtained for the water and sandbar areas were compared and the classification of surface attributes based on case-dependent decision values was assessed.

2. Materials

2.1. Site Description, Hydrology, and Hydraulics

This study focused on a selected segment of the main bed of the Tagus River, located in Portugal (Figure 1). This river segment had a length of about 11 km and an area of ≈4.12 km2; the central point coordinates were: 39°19′36″N; 8°31′44″W. At this location, the river is embedded in an area dominated by irrigated agriculture.
The Tagus River has its source in the center of the Iberian Peninsula (Western Europe) in Sierra de Albarracín (Spain), at an altitude of 1593 m a.s.l., and runs through approximately 1100 km until it outflows near Lisbon (Portugal) to the Atlantic Ocean (Figure 1). It is the longest river in the Iberian Peninsula. Its basin extends thus across Portugal and Spain, being the largest river basin in the Portuguese territory and the third largest in the Iberian Peninsula, with an area of about 81,310 km2 (e.g., refs. [32,33]) with ≈68% in Spain and ≈32% in Portugal. In this area, the climate is typically Mediterranean with two clearly different periods: a long dry summer season and a wet season during winter and early spring. In the Tagus basin, precipitation is characterized by strong variability, including interannual variability. The mean annual temperature ranges from 8 °C in the mountain peaks in the northern part of the basin to 17 °C in the western part; the mean annual precipitation ranges from 1800 mm to less than 400 mm [34].
Several studies have reported a decline in the availability of water resources in the Mediterranean region since the 1980s—e.g., ref. [35], including Spain and Portugal. This is partly caused by a generalized decrease in annual precipitation in this region mainly since the middle of the last century—e.g., refs. [36,37,38], which was accompanied by an increase in average temperatures—e.g., refs. [39,40,41]. These regional climatic trends, which are also predicted by climate change scenarios for the coming decades, and intensive water use have led to a reduction in streamflow in many river basins in this region over the past decades [42]. The main anthropic activities in Spain that have been identified [33] to influence streamflow, leading to its decline in both highly regulated and non-regulated rivers [43,44], are: (a) increasing use of water for irrigation; (b) overexploitation of groundwater resources; (c) inter-basin water transfers; and (d) processes of afforestation due to the abandonment of traditional rainfed crops. These activities also affect the Tagus River—e.g., ref. [33], with water management decisions in the Spanish territory greatly affecting water availability in the downstream country, Portugal. Overall, sustainability issues are being discussed by the governmental agencies responsible for water issues of both countries.
Currently, the Tagus River is heavily regulated by dams. Nevertheless, the river exhibits extreme seasonal and interannual discharge variability, with peak discharges up to 30 times larger than the average discharge [45,46]. On average (1930–2015), this river drains 14,946 hm3 of water annually, of which 6189 hm3 has its origin in Portugal [47].
Based on the analysis of a (time) series of cross-sectional profiles of the Lower Tagus River, a study conducted about two decades ago [48] concluded that the silting up of the Tagus River’s river bed had lost importance and was no longer observed. The evolution of the river bed between Alferrarede and Vila Franca de Xira, in the period from 1971/72 to 1998/99, was studied by the National Laboratory of Civil Engineering [49]. However, Fernandes et al. (2020) [50] identified the recently increased meandering of the flow channel and abundant deposition of coarse inorganic material within the Tagus River’s main channel, namely upstream of the city of Santarém (39°14′2″N; 8°41′10″W), and in the mouths of tributaries, which was reducing the river flow transport capacity and accentuating the risks of adjacent land flooding due to relatively low discharges.
In 2022, a severe drought affected several regions of Europe due to a persistent negative precipitation anomaly. This situation widely impacted river discharges across Europe, including Portugal and Spain. In the Iberian Peninsula, the 2022 water deficit was also aggravated by heat waves registered in late spring and summer. These types of events are critical for Portugal, where an intensification of the frequency and severity of droughts has been witnessed since the 1980s and particularly affect the territory south of the Tagus River, which is well known for its vulnerability to droughts and desertification [51]. The consequences are manifold, since low flow conditions affect hydroelectric energy production, water supply, provision of ecosystem services, and the ecological status of the river. For example, forced by the hydrologic scenario, several dams in the Tagus River suspended their hydroelectric production in 2022 [52]. Additionally, the extremely low discharge values reached in 2022 revealed features of the morphology of the Tagus’s river bed in the study area, namely sandbars that are seldom exposed and were directly observable; the sandbars are well perceived in Figure 1.
For this study, data from a nearby hydrometric gauging station (Almourol station, 17G/02H) of the Portuguese hydrometric network of Agência Portuguesa do Ambiente (APA), published on the website of Serviço Nacional de Informação de Recursos Hídricos (SNIRH, https://snirh.apambiente.pt, accessed on 12 September 2022), were inspected. For the Almourol station, the coordinates are 39°27′38″N 8°22′31″W at 19 m above sea level (a.s.l.); the drained area at the measuring section was 67,482 km2, with an average altitude of 137 m a.s.l. and an average slope of 7.8%. This station was located approximately 16 km upstream of the study site; there were no main tributaries between the Almourol station and the study site.
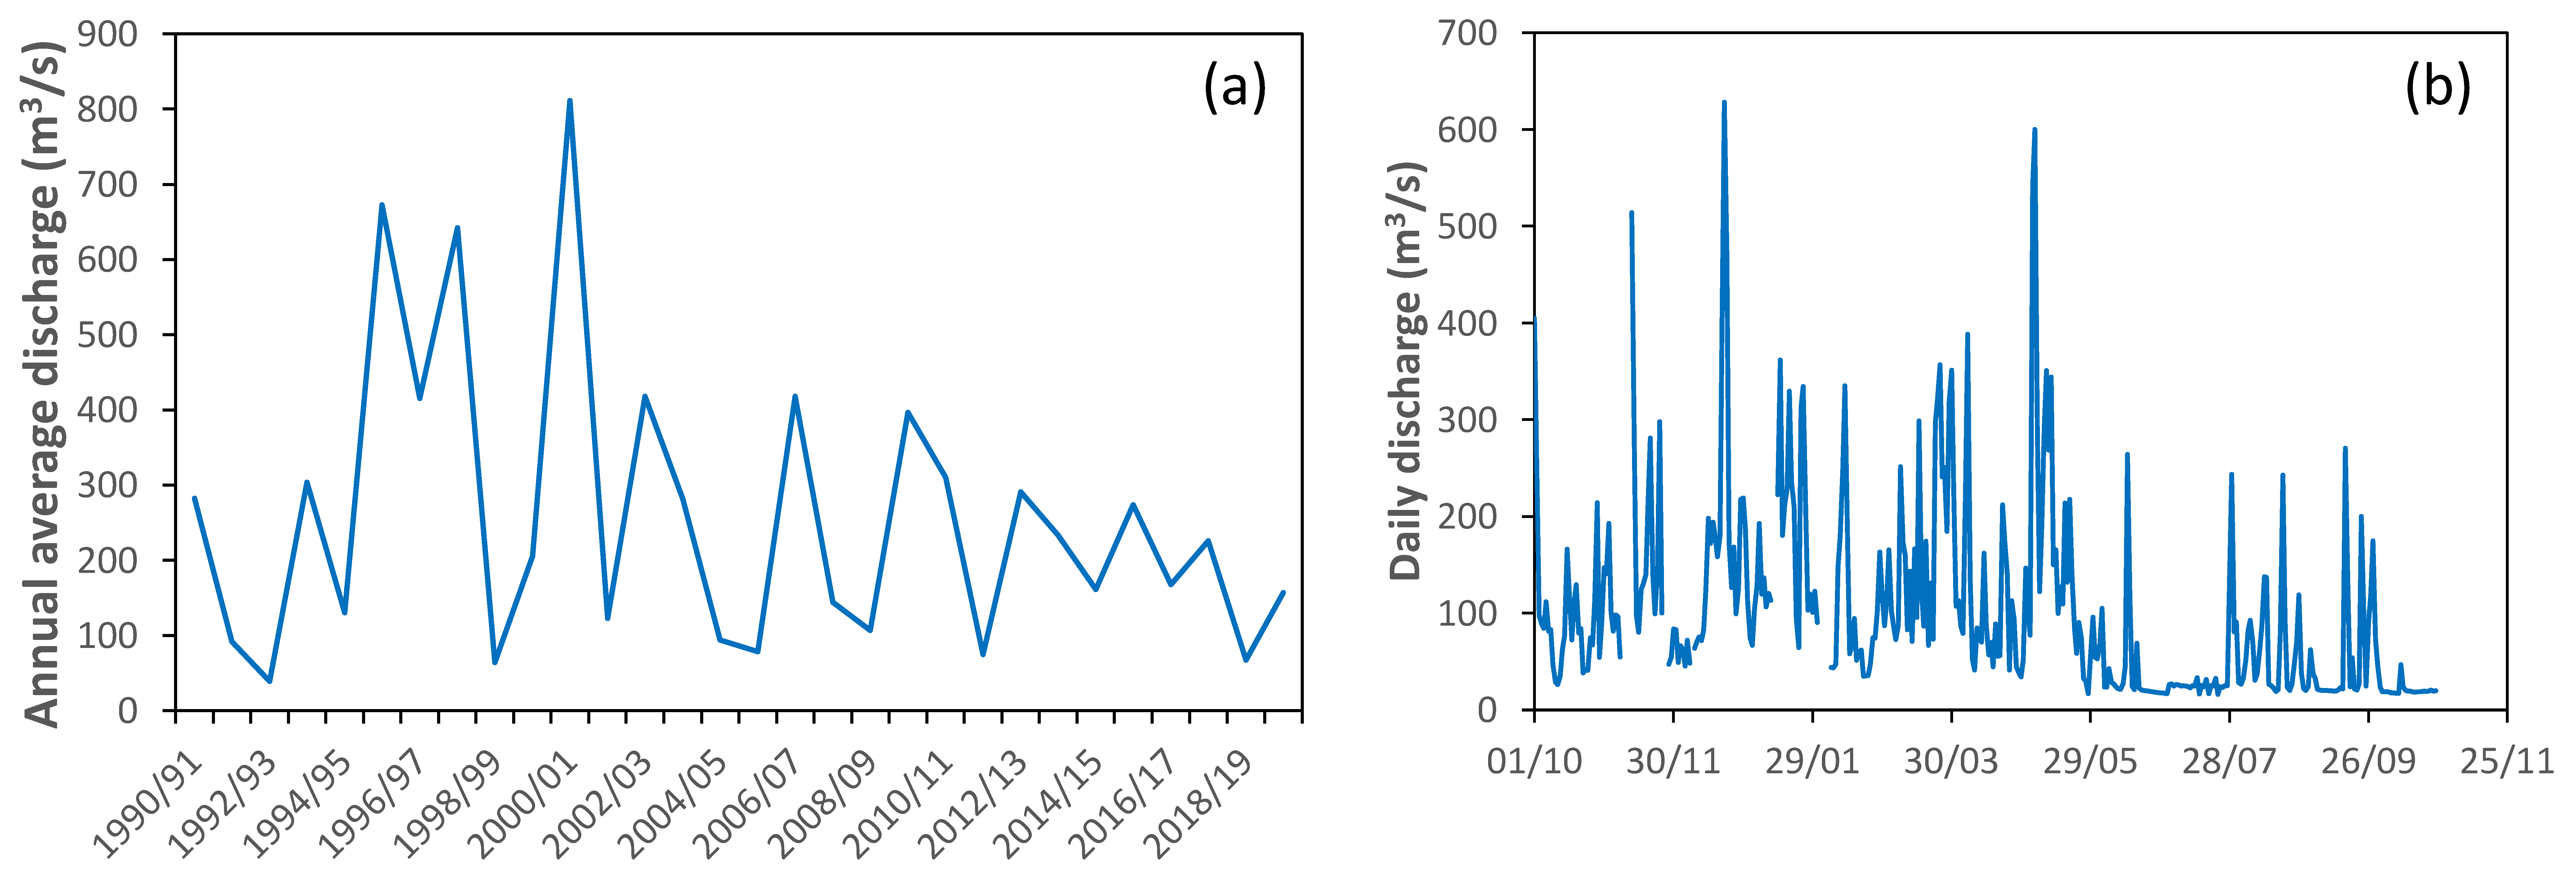
Records from the Almourol station (Figure 2a) revealed that low discharges were persistent during the last decade. For this station, Figure 2b shows the daily discharges observed from the beginning of the hydrologic year 2021/2022 (1 October 2021) until 25 October 2022. During 39 days (18 June–26 July 2022), the average daily discharges ranged between 16.07 and 33.34 m3/s (average discharge in this period was 22.81 m3/s), whereas the historical mean discharges in June and July (1990/1991–2019/2020) were about 143 and 128 m3/s, respectively. This low flow event in 2022 had undisputable negative impacts on the associated ecosystems and river ecosystem services.

2.2. Remote Sensing Data

2.2.1. Sentinel-2 Satellite Data

S2 data were acquired from the Copernicus Open Access Hub European Space Agencies (https://scihub.copernicus.eu/, accessed on 3 September 2022). S2 was launched on 23 June 2015 by the European Space Agency (ESA) and is a high-resolution, multispectral imaging mission. It includes two twin satellites (Sentinel-2A and Sentinel-2B) that fly in the same orbit (a sun-synchronous orbit at a mean altitude of 786 km) but offset 180 degrees to give a revisit frequency of 5 days at the equator. The S2 instruments sense a 290 km wide swath and 13 spectral bands, although at different spatial resolutions: four bands at 10 m spatial resolution, six bands at 20 m, and three bands at 60 m [53]. The spectral separation of each band into individual wavelengths is accomplished by stripe filters mounted on top of the satellite sensors.
Level 2A images (orthoimages in UTM/WGS84 projection) from S2, recorded on 8 July 2022 (average daily discharge was 24.8 m3/s; see Figure 2b), were selected for this study. The images were cloud free and already atmosphere-corrected. Some attributes of the S2 satellite imagery are shown in Table 1.

2.2.2. Landsat 9 Satellite Data

L9 satellite was successfully launched on 27 September 2021, and L9 data were available to the public on 10 February 2022. L9 is a partnership between NASA and USGS and carries OLI-2 and Thermal Infrared Sensor 2 (TIRS–2). The radiometric resolution of the sensor is improved to 14-bit quantization. The L9 orbit replaces the current orbit of Landsat 7 and is temporally offset in relation to the Landsat 8 and S2 orbits.
This study used L9 Collection 2 Surface Reflectance (L9C2_SR) data that have been geometric and radiometric corrected by USGS and downloaded from the USGS platform (https://earthexplorer.usgs.gov, accessed on 3 September 2022), namely cloud free images that were obtained on 7 July 2022 (average daily discharge was 24.9 m3/s; see Figure 2b). The selection of the L9 data took into consideration the proximal dates of the S2 and L9 records and the discharge of the river. The L9 multispectral wavelength bands’ data imagery were available at 30 m full spatial resolution and are described in Table 1, together with some of their attributes.

3. Methods

3.1. Methodology Overview

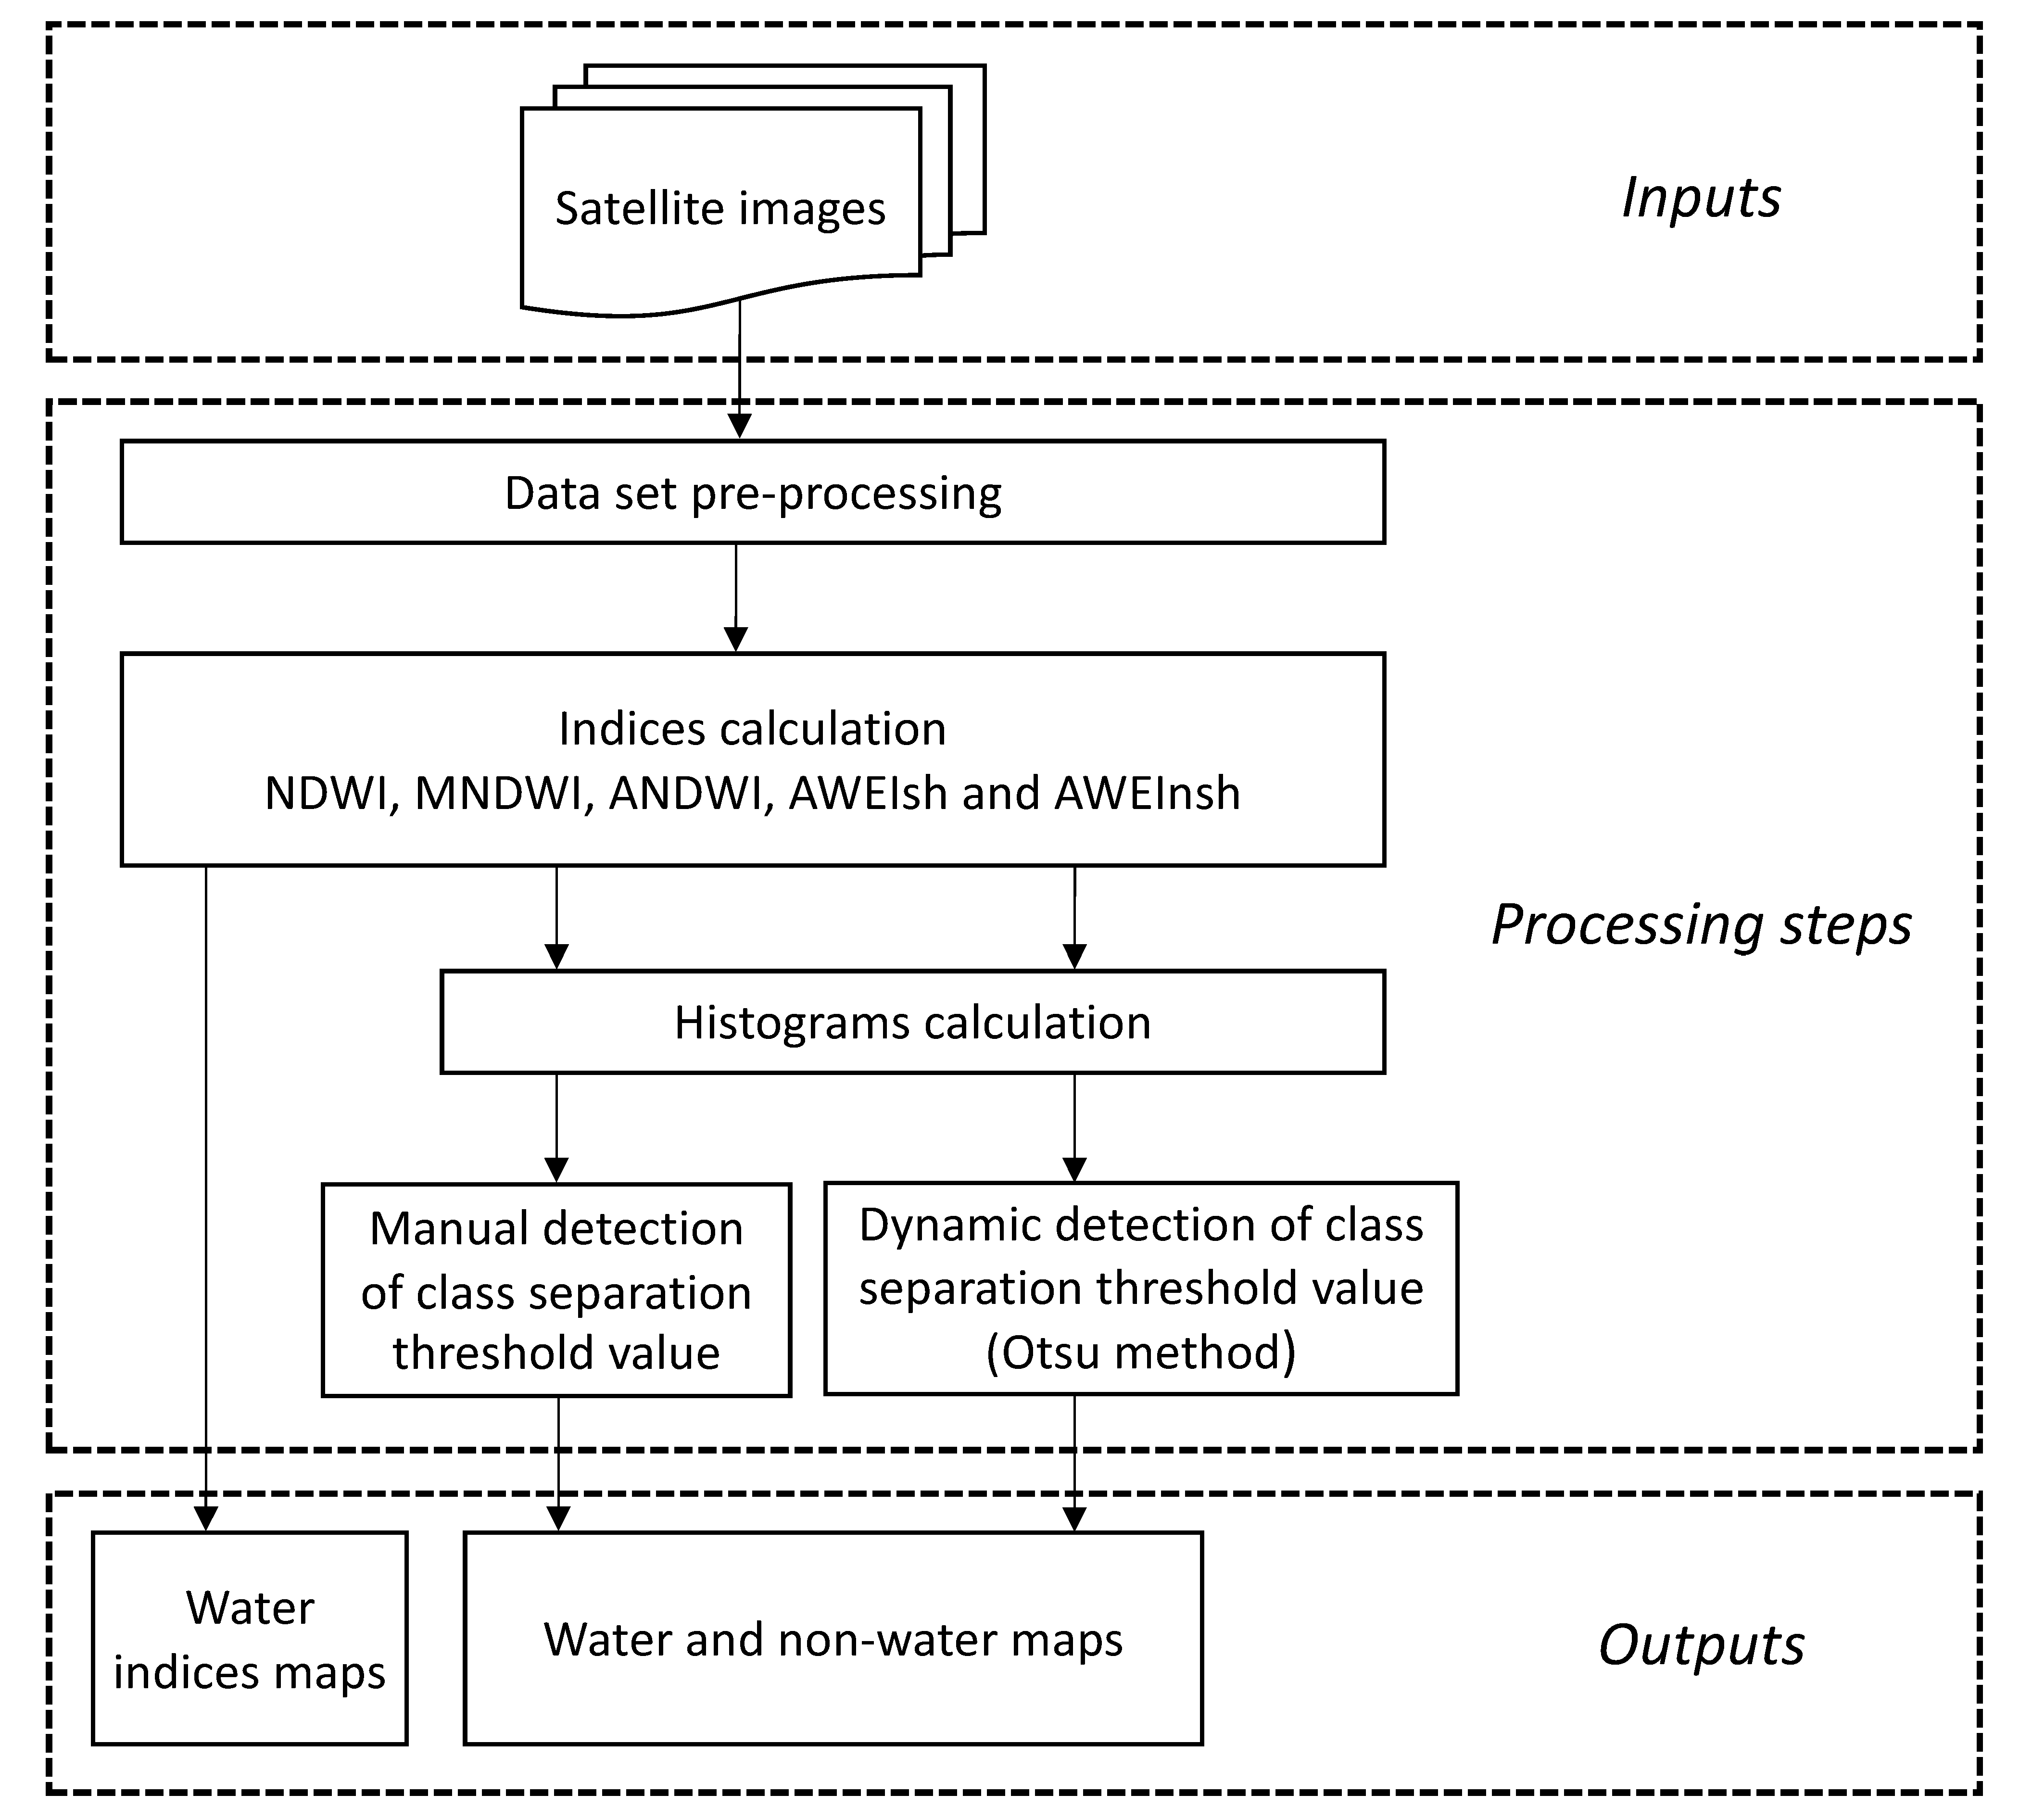
Figure 3 shows a schematic flowchart that illustrates the methodological steps that were used in this study for mapping water and non water (i.e., sandbars) in fluvial systems. After preprocessing the S2 and L9 images, 6 bands were selected to calculate the Normalized Difference Water Index (NDWI), Modified Normalized Difference Water Index (MNDWI), Augmented Normalized Difference Water Index (ANDWI), and Automated Water Extraction Index (AWEI), namely AWEIsh (i.e., with shadow) and AWEInsh (i.e., with no shadow). The approach was applied to both S2 and L9 satellite imagery.

3.2. Spectral Water Indices

The different reflectance data that were obtained from S2 and L9 satellites, especially those that relied on the Red, Green, Blue, NIR, and SWIR wavelength bands, could be used to calculate spectral (water) indices that were effective in assessing different attributes of the Earth’s surface, particularly for detecting surface water at the image’s pixel scale. Spectral water indices were single numbers calculated arithmetically (e.g., ratio, difference) using two or more spectral bands. Based on these indices, the separation of water bodies from other land cover features was determined by the application of appropriate index classification decision values [54], which were index specific. The classification was determined by the characteristics of the surface’s reflectance. For example, the NDWI, defined by McFeeters (1996) [55], is widely accepted for this purpose, as well as the MNDWI [56], but other indices such as the ANDWI [57] and the AWEI can also identify water features. AWEI was proposed by Feyisa et al. (2014) [58] and embraces two variants: AWEIsh, which was designed primarily to remove shadow pixels from imagery, and AWEInsh, which was designed for areas with an urban background.
This study applied these five indices (Table 2), which are briefly described below, for data analysis. The Raster Calculator Tool in open software QGIS v3.6 was applied to the orthoimages of each spectral wavelength band. Three of these indices show a form of normalized difference (NDWI, MNDWI and ANDWI); they are constrained within [−1, +1] and their thresholds to distinguish water and non-water surfaces are close to zero. High values are associated with water surfaces and low values are associated with land surface features. The two additional indices (AWEIsh and AWEInsh) show other arithmetic forms; they take values over wider ranges and their thresholds move away from zero.
NDWI: McFeeters (1996) [55] proposed the well-known NDWI to detect and assess the extent of surface water in wetland environments. The imagery classification is based on the strongest absorption of NIR wavelengths by water in relation to vegetation and the strongest reflectance of NIR wavelengths by vegetation in relation to water. For this purpose, NDWI uses the green and NIR spectral wavelength bands: it maximizes the reflectance of a water body in the green band while minimizing that in the NIR band. Although NDWI was designed with a zero threshold to distinguish water and land surfaces, this value varies depending on the sensor and image properties [59]. NDWI has been found able to identify water pixels quite accurately—e.g., refs. [60,61,62].
MNDWI: Xu (2006) developed this index [56], which uses the SWIR band instead of NIR. In general, compared to NDWI, water bodies yield greater positive MNDWI values because water bodies generally absorb more SWIR light than NIR light. Soil, vegetation, and built-up classes lead to smaller negative MNDWI values because these land surface classes reflect more SWIR light than green light [63]. MNDWI has been found to provide more accurate results than the conventional NDWI—e.g., refs. [64,65,66].
ANDWI: Rad et al. (2021) [57] proposed the ANDWI, which is based on an expanded set of spectral bands (Blue, Green, Red, NIR, SWIR1, and SWIR2) to maximize the contrast between water and non-water pixels. It successfully suppresses the omission and commission errors caused by land cover (e.g., rooftops) and/or natural events (e.g., dust storms) [57]. Imaging classification for differentiating water from non-water pixels was discussed by Rad et al. (2022) [67]. This index was applied to quantify and understand the presence of surface water by a meagre number of studies (e.g., ref. [68]) since it was only recently proposed.
AWEIsh and AWEInsh: Feyisa et al. (2014) [58] proposed the AWEI to identify water features. It includes two variants: AWEIsh was designed primarily to remove shadow pixels, whereas AWEInsh was dedicated to areas with an urban background. AWEI aims to maximize the separability of water and non-water pixels through band addition, differencing, and applying different coefficients [69]. It uses visible, NIR, and SWIR wavelength bands.
Since the S2 data are available at different spatial resolutions, depending on the wavelength band (Table 1), resampling of the data was needed to calculate indices that combined different wavelength bands’ data. Due to the procedures needed to perform changes on a pixel basis, the resampling required by the different spatial resolution of the MSI sensor was unquestionably a relevant source of errors [70,71]. Nevertheless, to ensure that the resolutions of the six bands from S2 imagery used in this study were consistent, the data of the visible and NIR bands were resampled using the nearest neighbor resampling technique before calculating the water indices—e.g., ref. [72].

3.3. Imagery Classification Decision Value

All of the water indices described in Section 3.2 allowed water and non-water pixels to be classified by applying a threshold value, i.e., a classification decision value. This value should be adjusted to different indices and imagery of different classification priorities. The identification of the threshold value is of great importance for the accurate delimitation of water bodies and it can be performed (i) manually—e.g., refs. [73,74], (ii) through a dynamic threshold selection method (e.g., Otsu method [75], or Jeffries–Matusita (J–M) distance method [76], or (iii) using automated methods—e.g., refs. [54,77]. Nevertheless, the selection of suitable class delimitation values is a sensitive issue that has direct implications for mapping surface attributes and class analysis. Sezgin and Sakur (2004) [78] investigated different methods to separate classes based on decision values.
For example, for NDWI- or MNDWI-based mapping of water bodies, the critical values are often assumed to be zero (larger index values are associated with the presence of water). However, some studies showed that a value of zero may not always generate the best segmentation results for all situations [29,56,64]; in practice, multispectral images acquired by different satellite platforms at different regions and times always have different characteristics, which demands a case-by-case decision. Xu et al. (2005) [73] manually searched for water class critical NDWI and MNDWI values and Feyisa et al. (2014) [58] manually investigated multiple values and selected the value that revealed the smallest sum of the commission and omission errors as the optimal value. Manual decisions in selecting critical class separation thresholds are usually based on histogram empirical analysis—e.g., ref. [79].
The Otsu method [75] is a commonly used method in image processing to search for the class (i.e., segment) separation critical value in bimodal histograms of pixel values for the target image. The method has two components: a measure of within-class homogeneity and a measure of between-class heterogeneity. It is based on the minimum within-class variance ( σ w 2 ) criterion, with the variance being chosen as the within-class homogeneity measure because relatively homogeneous classes generally have low variance. The method finds a threshold that maximizes the between-class variance ( σ B 2 ), considering two classes in the image, C 1 and C 2 , with C 1 denoting pixels with levels [1, …, k] and C 2 denoting pixels with levels [k + 1, …, L]. Then, the Otsu thresholding algorithm is described by the following equations:
σ w 2 = ω 1 σ 1 2 + ω 2 σ 2 2
σ B 2 = ω 1 μ 1 μ 2 + ω 2 μ 2 μ 2
μ = ω 1 μ 1 + ω 2 μ 2
ω 1 + ω 2 = 1
σ B 2 k = max 1 k L σ B 2 k
where ω 1 and ω 2 , μ 1 and μ 2 , and σ 1 2 and σ 2 2 are the probabilities of class occurrence, the class mean levels, and the class variances, respectively; μ is the total mean level of the original image; and k is the optimal threshold (at level k).
This method is not biased by case-specific image contrast or brightness conditions (e.g., ref. [80]); it has been found to generate a comparatively satisfactory result regardless of whether the image histogram is obviously bimodal. However, since land cover is only classified into two classes by the Otsu algorithm, it is likely that the water class would be classified with other types of land cover with higher or similar water index values [81].
Another approach in class separation that has been widely used in remote sensing is the Jeffries–Matusita (J–M) distance method, which applies a statistical class separability criterion [54,77,82,83,84]. This method assesses the J–M distance (i.e., a distance in statistical, not metric, terms) between a pair of class-specific probability functions (usually, assumed Gaussian), and thus their separability. It uses the J–M distance as a measure of the potential correctness of the classification results. This distance is asymptotic to 2 when signatures are completely different and tends to 0 when signatures are identical. Thus, a small J–M value indicates that the separation is poor and there will likely be many misclassified objects. For the two probability distributions created by a feature, corresponding respectively to two classes C 1 and C 2 (in this case, for water and non-water body samples) of size n 1 and n 2 , the J–M distance is defined as [54]:
J M C 1 , C 2 = 2 1 e B C 1 , C 2
where B C 1 , C 2 is the Bhattacharya distance, given by:
B C 1 , C 2 = 1 2 l n σ 1 2 + σ 2 2 2 σ 1 σ 2 + 1 4 μ 1 μ 2 2 σ 1 2 + σ 2 2
with μ 1 and μ 2 and σ 1 2 and σ 2 2 being the object characteristic mean values and variances of the distributions for classes C 1 and C 2 , respectively. For simplicity, J M will be used to refer to the J–M distance.
In this study, the spectral indices’ histograms were inspected, and water and non-water class separation values were determined based on (i) empirical manual decisions and (ii) application of the within-class minimum variance criterion. The different estimated critical values were compared based on the J–M distance method. This procedure was adopted as a tool (i.e., a feature-ranking measure) for handling the binary classification problem over the available datasets, therefore assessing the estimated class decision values for each satellite data-based index. Outcomes in terms of the water/non-water areal coverage of the studied river segment and its mapping were also compared.
Figure 3 shows a schematic flowchart that illustrates the methodological steps that were used in this study for mapping water and non water (i.e., sandbars) in fluvial systems. The approach was applied to both S2 and L9 satellite imagery.

4. Results

4.1. Comparison between the S2 and L9 Spectral Water Indices Maps

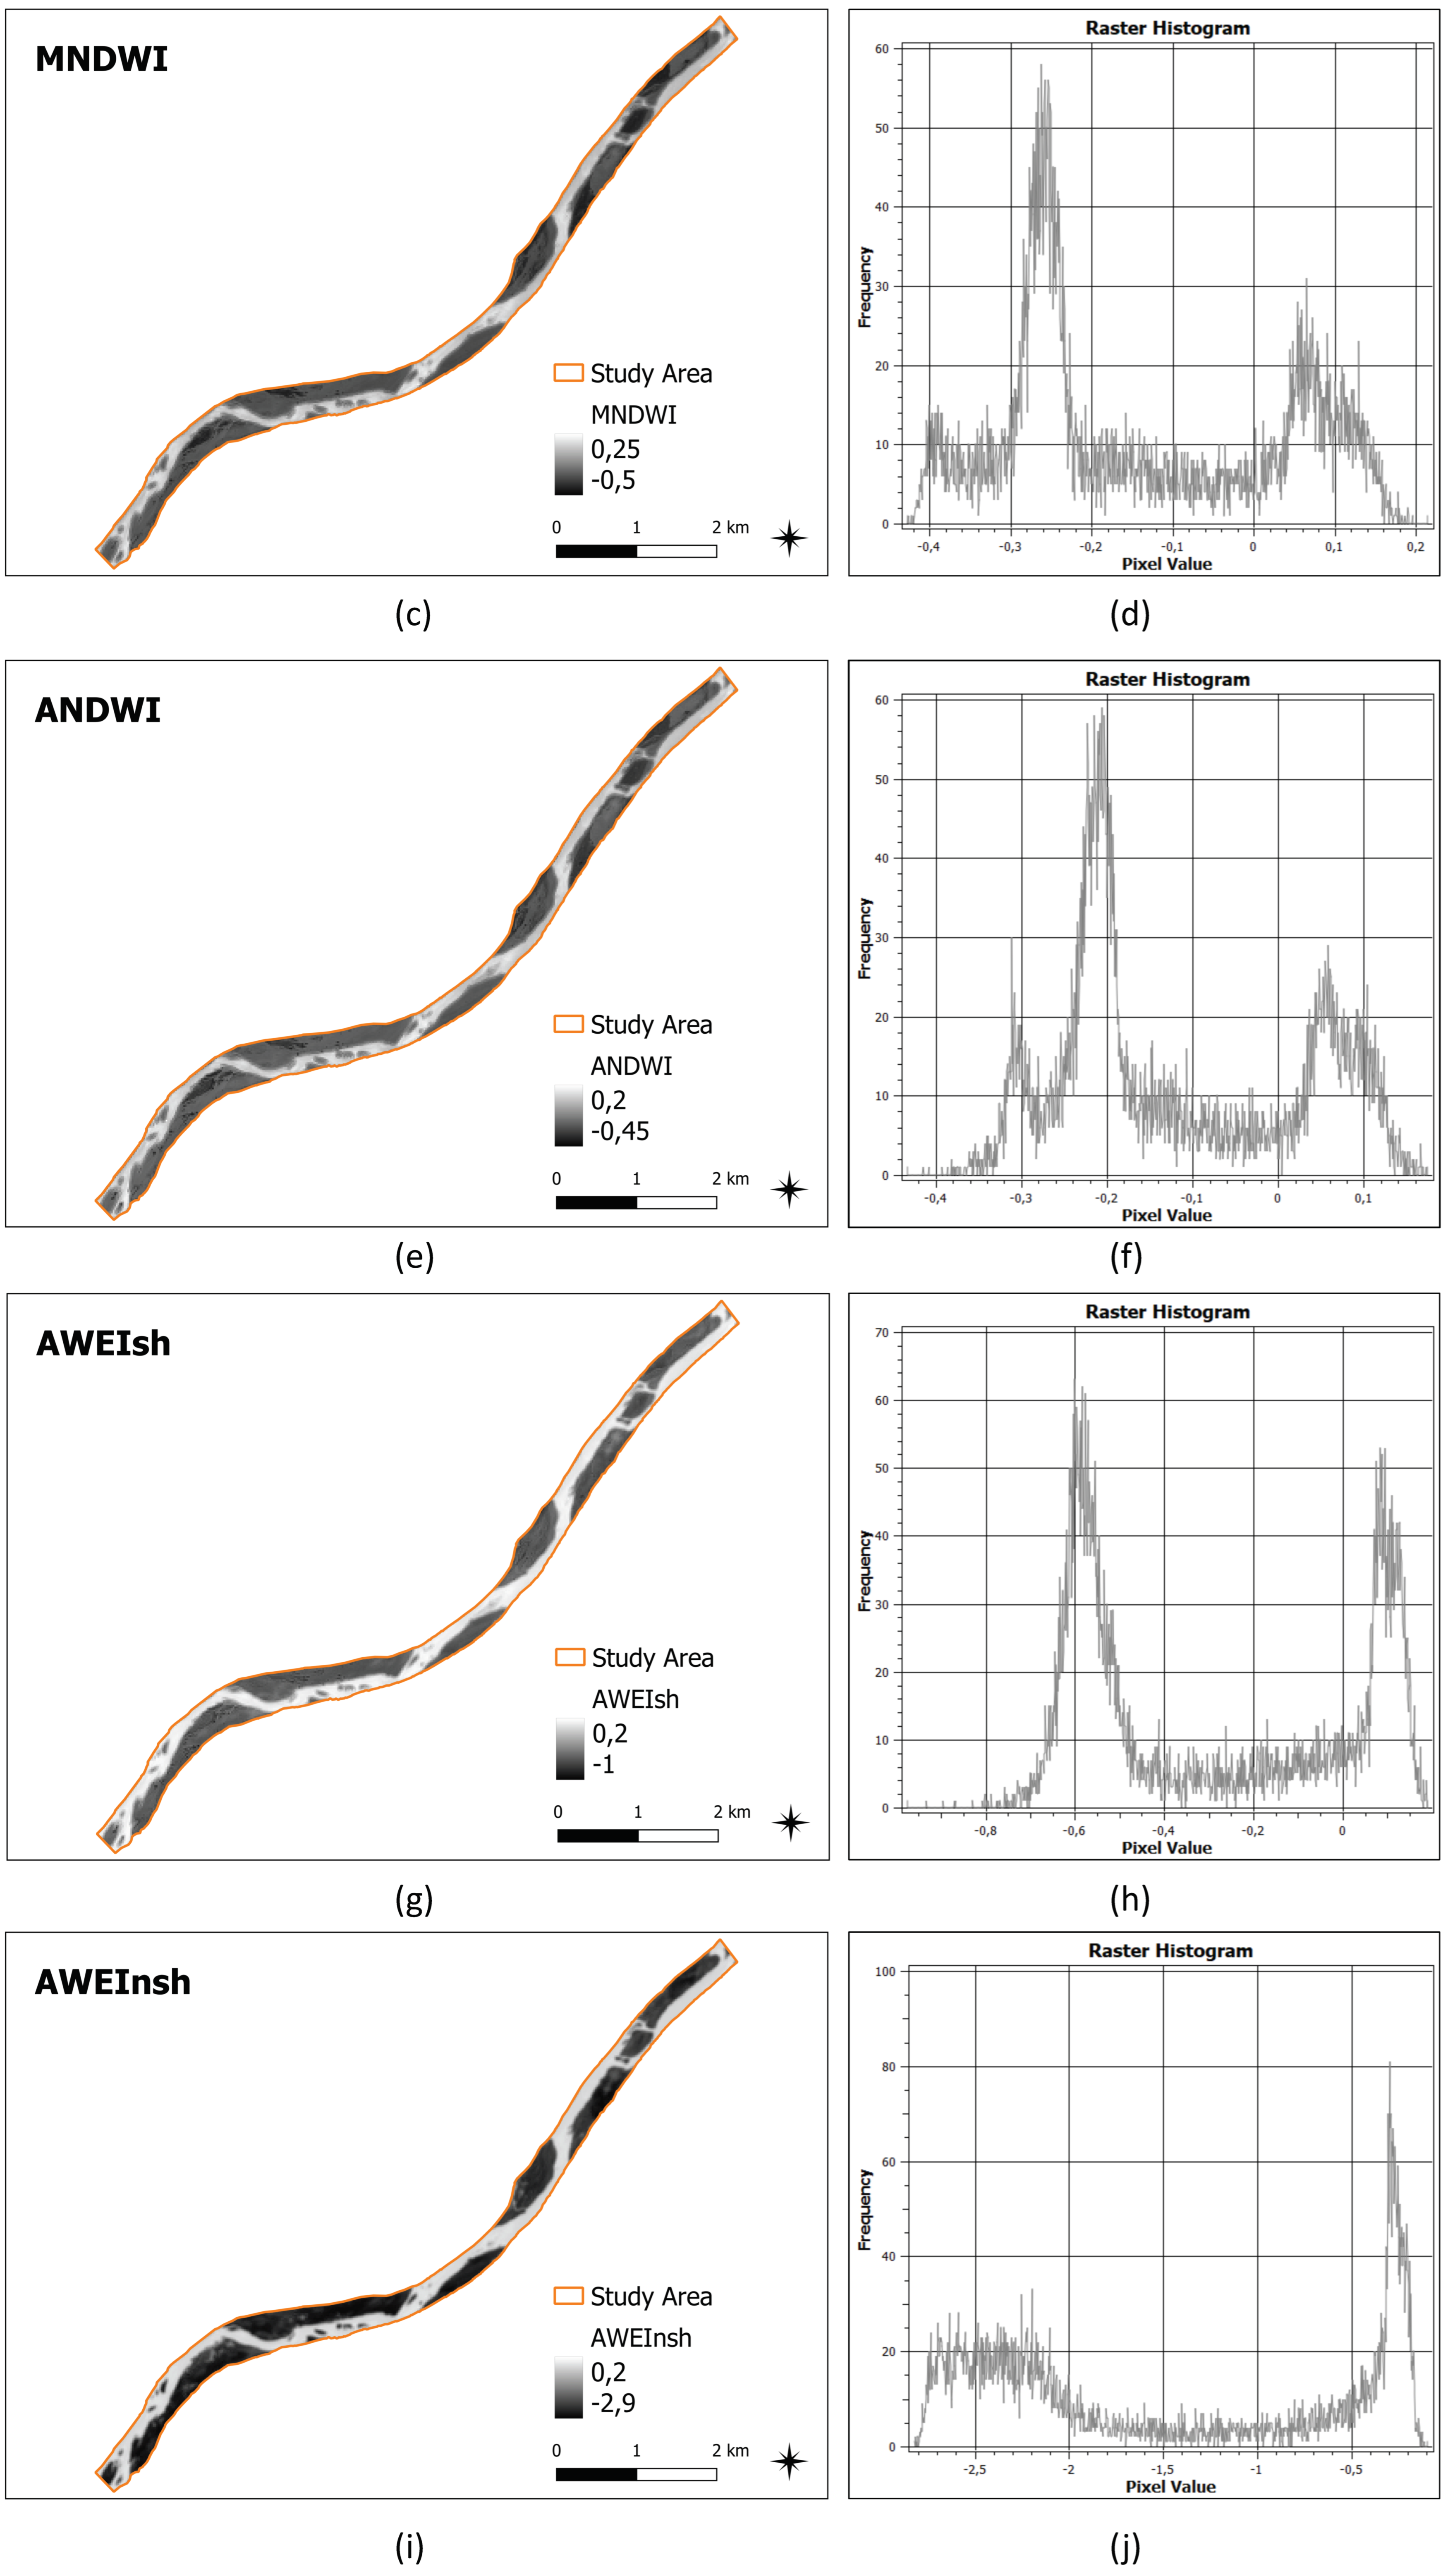
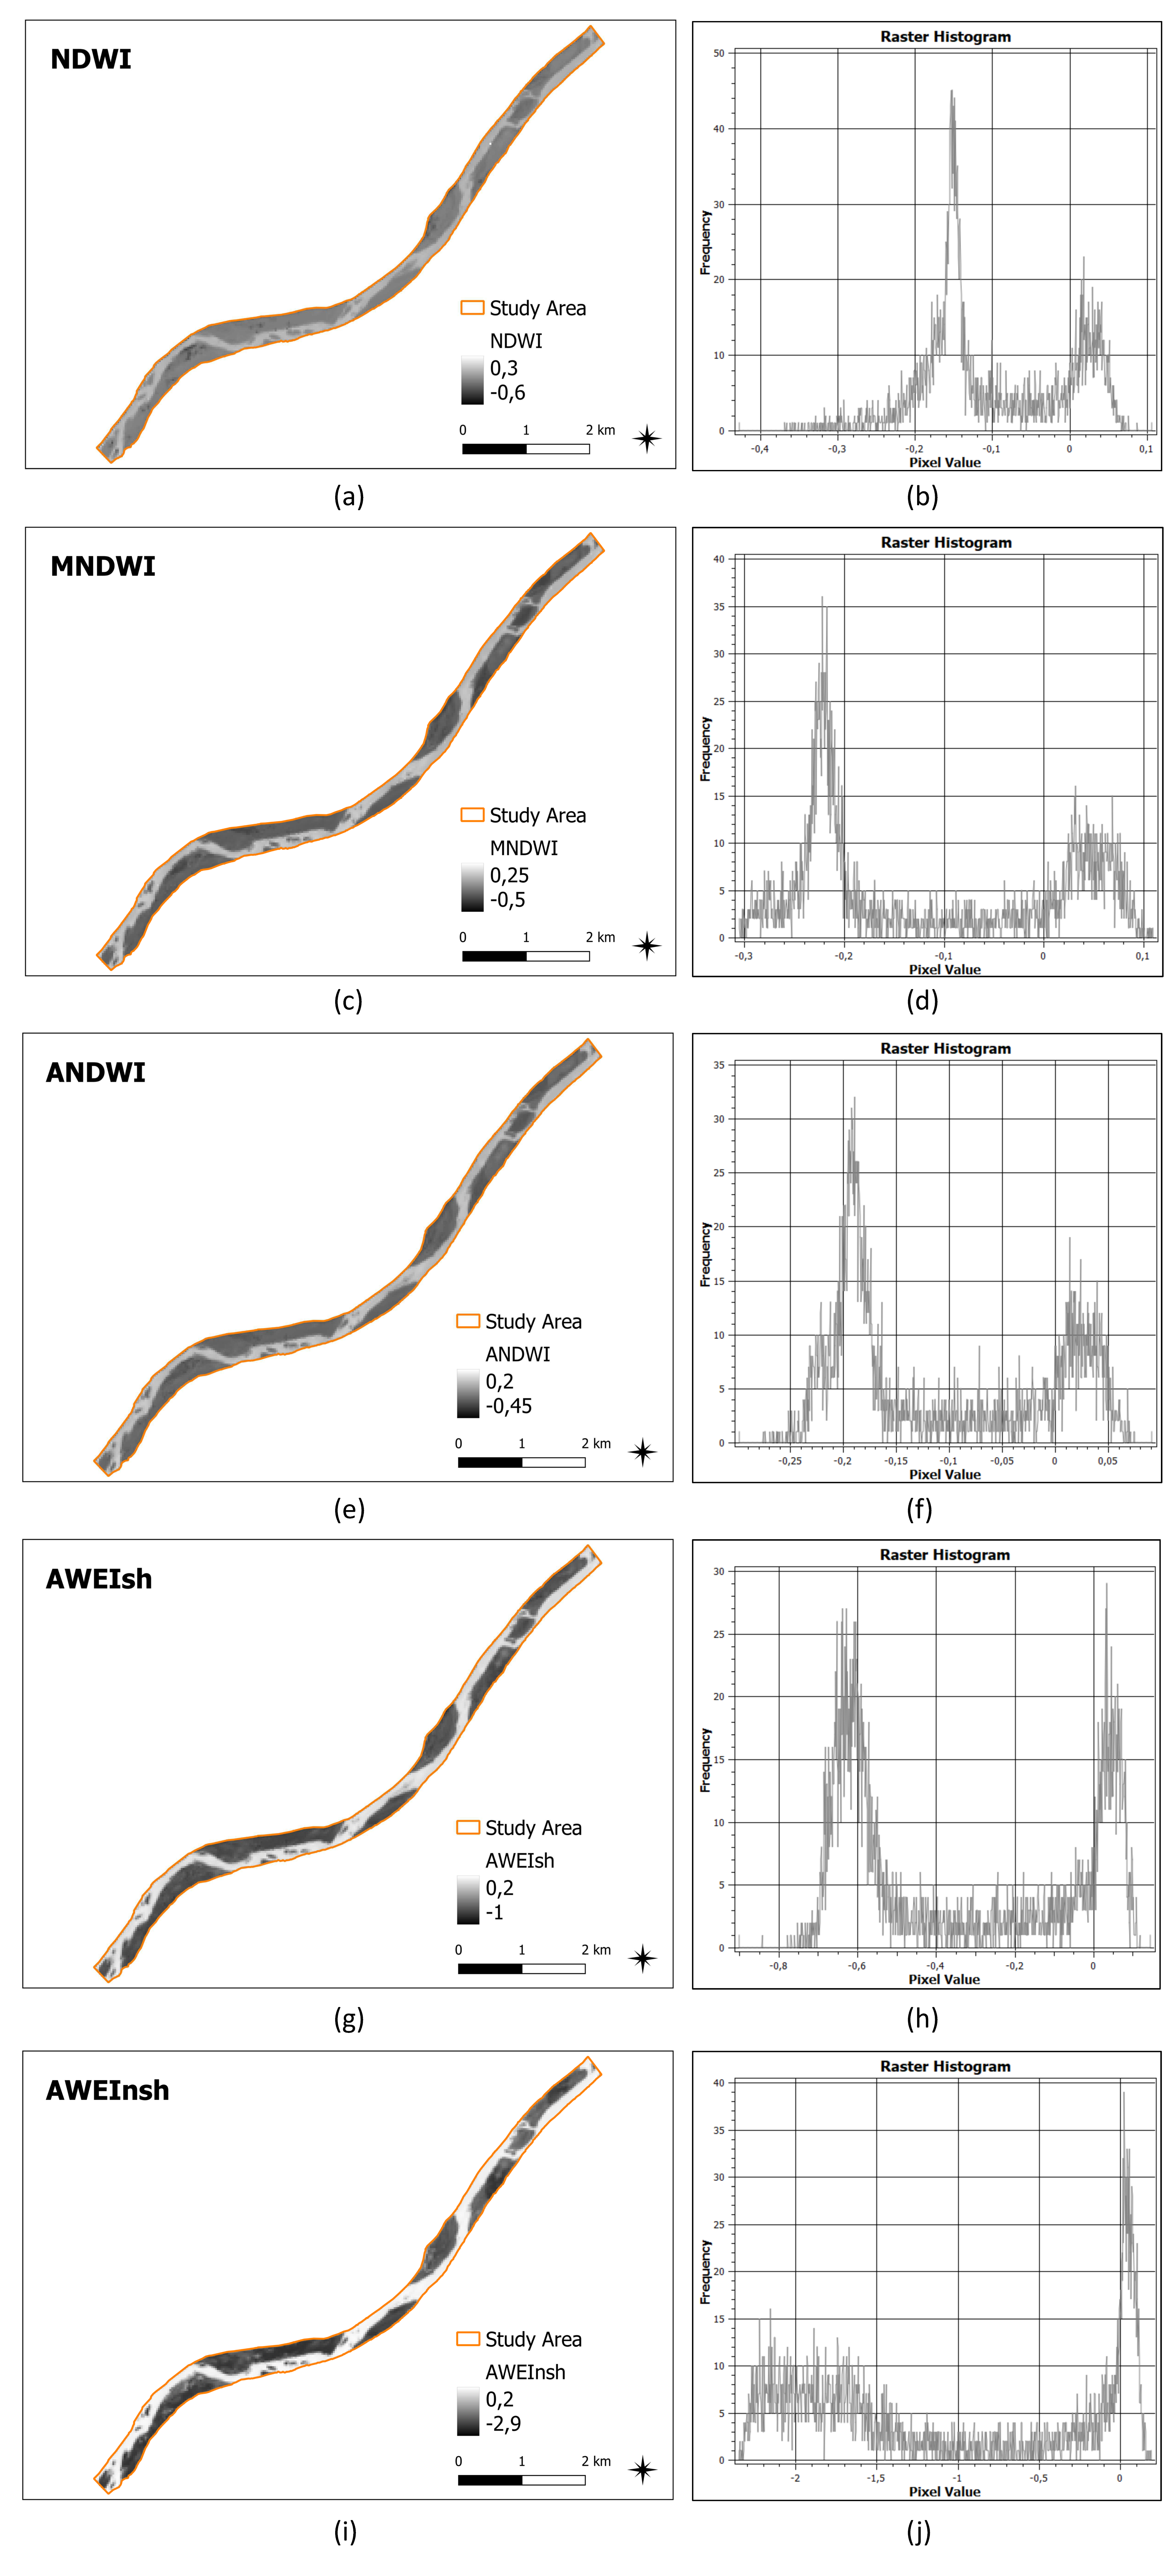
For a selected segment of the Tagus River (Section 2.1), maps of the water indices NDWI, MNDWI, ANDWI, AWEIsh, and AWEInsh calculated using the S2 and L9 satellite data are shown in Figure 4 and Figure 5, respectively. The grey scale used in the different maps was adjusted to each of the indices since the values of the calculated indices ranged between different limit values; however, the same scale was used for comparison purposes for the same index but different satellites’ data. For NDWI, MNDWI, and ANDWI, the range of pixel values observed was wider for S2 than for L9. For AWEIsh, the difference in range between the S2 and L9 values was relatively small. For AWEInsh, the spread in the values was similar for the S2 and L9 data, although overall, the index pixel values for L9 were higher than for S2.
The corresponding S2 and L9 data histograms (Figure 4 and Figure 5) were not unimodal, which revealed the presence of different types of surfaces/classes, i.e., subareas that were dominated by different attributes. In this case, those attributes corresponded broadly to the presence of water and non water (here, related to sandbars). Comparatively, the AWEI indices’ histograms revealed a stronger signal for water surfaces than the other indices’ histograms.
To better appraise the relationship between the S2 and L9 data, correlations between the satellite-based indices were explored. Figure 6 shows scatterplots of cross-comparison between water indices (NDWI, MNDWI, ANDWI, AWEIsh, AWEInsh) calculated at the pixel scale based on S2 and L9 satellite images for 2000 randomly selected data points. The linear relationship between paired pixel-scale index values and the correlation coefficients are shown in the respective panels (Figure 6); the linear regression line is also shown. Overall, for the tested area, a cross-comparison of the S2 and L9 indices showed that there was good agreement between the S2 and L9 datasets, as shown in Figure 6. The highest correlation coefficient was found for AWEInsh (0.95) and the lowest was found for NDWI (0.83). Among the normalized indices and for the classification criteria applied, MNDWI was the index for which the S2 and L9 data agreed best, whereas the biggest discrepancy was found for NDWI. The plots in Figure 6 revealed the dominance of two types of surfaces, which is shown by the uneven distribution of data points in the studied domain, in particular, the identification of two “sub-sets” for water and non-water surfaces. Outliers were not removed, which could have been generated by very low reflectance values (often occurring over water surfaces) that may have caused stability problems, particularly when computing band ratios [70]. For the five indices, the mean pixel values estimated using the S2 data were larger than those estimated using the L9 data for NDWI and AWEIsh, and they were smaller for the other indices.

4.2. Impact of Class Separation Decision Value on Water Body Mapping

For the NDWI, MNDWI, ANDWI, and AWEI data obtained using S2 and L9 satellite imagery, Table 3 shows the water/non-water class separation values for each index, estimated from the analysis of the histograms (Figure 4 and Figure 5) based on manual decision. As expected, the class separation thresholds found for NDWI, MNDWI, and ANDWI were close to zero, whereas they moved away from zero for AWEIsh and AWEInsh. Table 3 also shows the corresponding percentage area for the classes water and non-water in the selected river segment. The classification decisions of the S2 and L9 datasets were assessed by calculating J–M scores (Table 3).
For the same datasets, the approach based on the minimum within-class variance criterion led to the estimated class separation index values, and the corresponding percentage area for the water and non-water classes and J–M distances shown in Table 4.
Overall, the results in Table 3 and Table 4 indicated that the presence of different features/classes in the S2 and L9 data could not be ignored ( J M > 0.5) and that the segmentation applied to all of the indices was consistent ( J M > 1.75). However, for both criteria used to classify water and non-water surfaces, class separability was apparently less clear for NDWI than for other indices (Figure 7a).
In comparative terms, AWEI imagery (for both AWEIsh and AWEInsh) identified more water than the other indices (NDWI, MNDWI, and ANDWI). Except for AWEIsh, the class separation values (Table 3 and Table 4) estimated by applying the Otsu method were smaller than those estimated by manual decision. This trend was found for the S2 and L9 data. As a consequence, the estimated water surface area was generally slightly larger for the imagery classification based on the Otsu method (Table 3 and Table 4, Figure 7b). This type of result was also reported by, for example, Rad et al. (2022) [67].
For this case study, the incremental difference in water surface coverage estimated from NDWI and AWEInsh was, on average, about 10% (Figure 7 and Figure 8), which corresponded to a reduction in the estimated dominance of sandbars in the river bed. In this case, the results suggested that AWEI could underestimate the presence of sandbars. The results also showed that MNDWI identified a larger area for the water surface than NDWI (although smaller than the AWEI estimates), regardless of the approach used to estimate the class separation critical index value and the data’s origin (S2 and L9). On average, the water surface area obtained for ANDWI was similar to the result obtained for NDWI for both class segmentation criteria, although ANDWI led to larger J–M distances.
Although the remote sensing data observation dates corresponded to two consecutive days, discharge at the nearby Almourol hydrometric station (Section 2.1) was similar on 7 July (24.9 m3/s) and 8 July (24.8 m3/s), which corresponded to the observation dates of the L9 and S2 data, respectively. Since the water/non-water class areas may vary significantly with a small fluctuation in the river stage due to the low gradients of sandbars—e.g., ref. [21], satellite images of similar river stages are required to reduce errors in assessing sandbars.
In relation to the very low flow condition in the river, for the individual indices and the two satellites, the difference in classifying water and non-water surfaces was larger for NDWI, MDWI, and ANDWI than for the AWEI (Figure 8). However, this study did not allow us to discuss these results further or generalize trends in the outcomes.

4.3. Sentinel-2 and Landsat 9 Spectra-Based Water and Non-Water Mapping

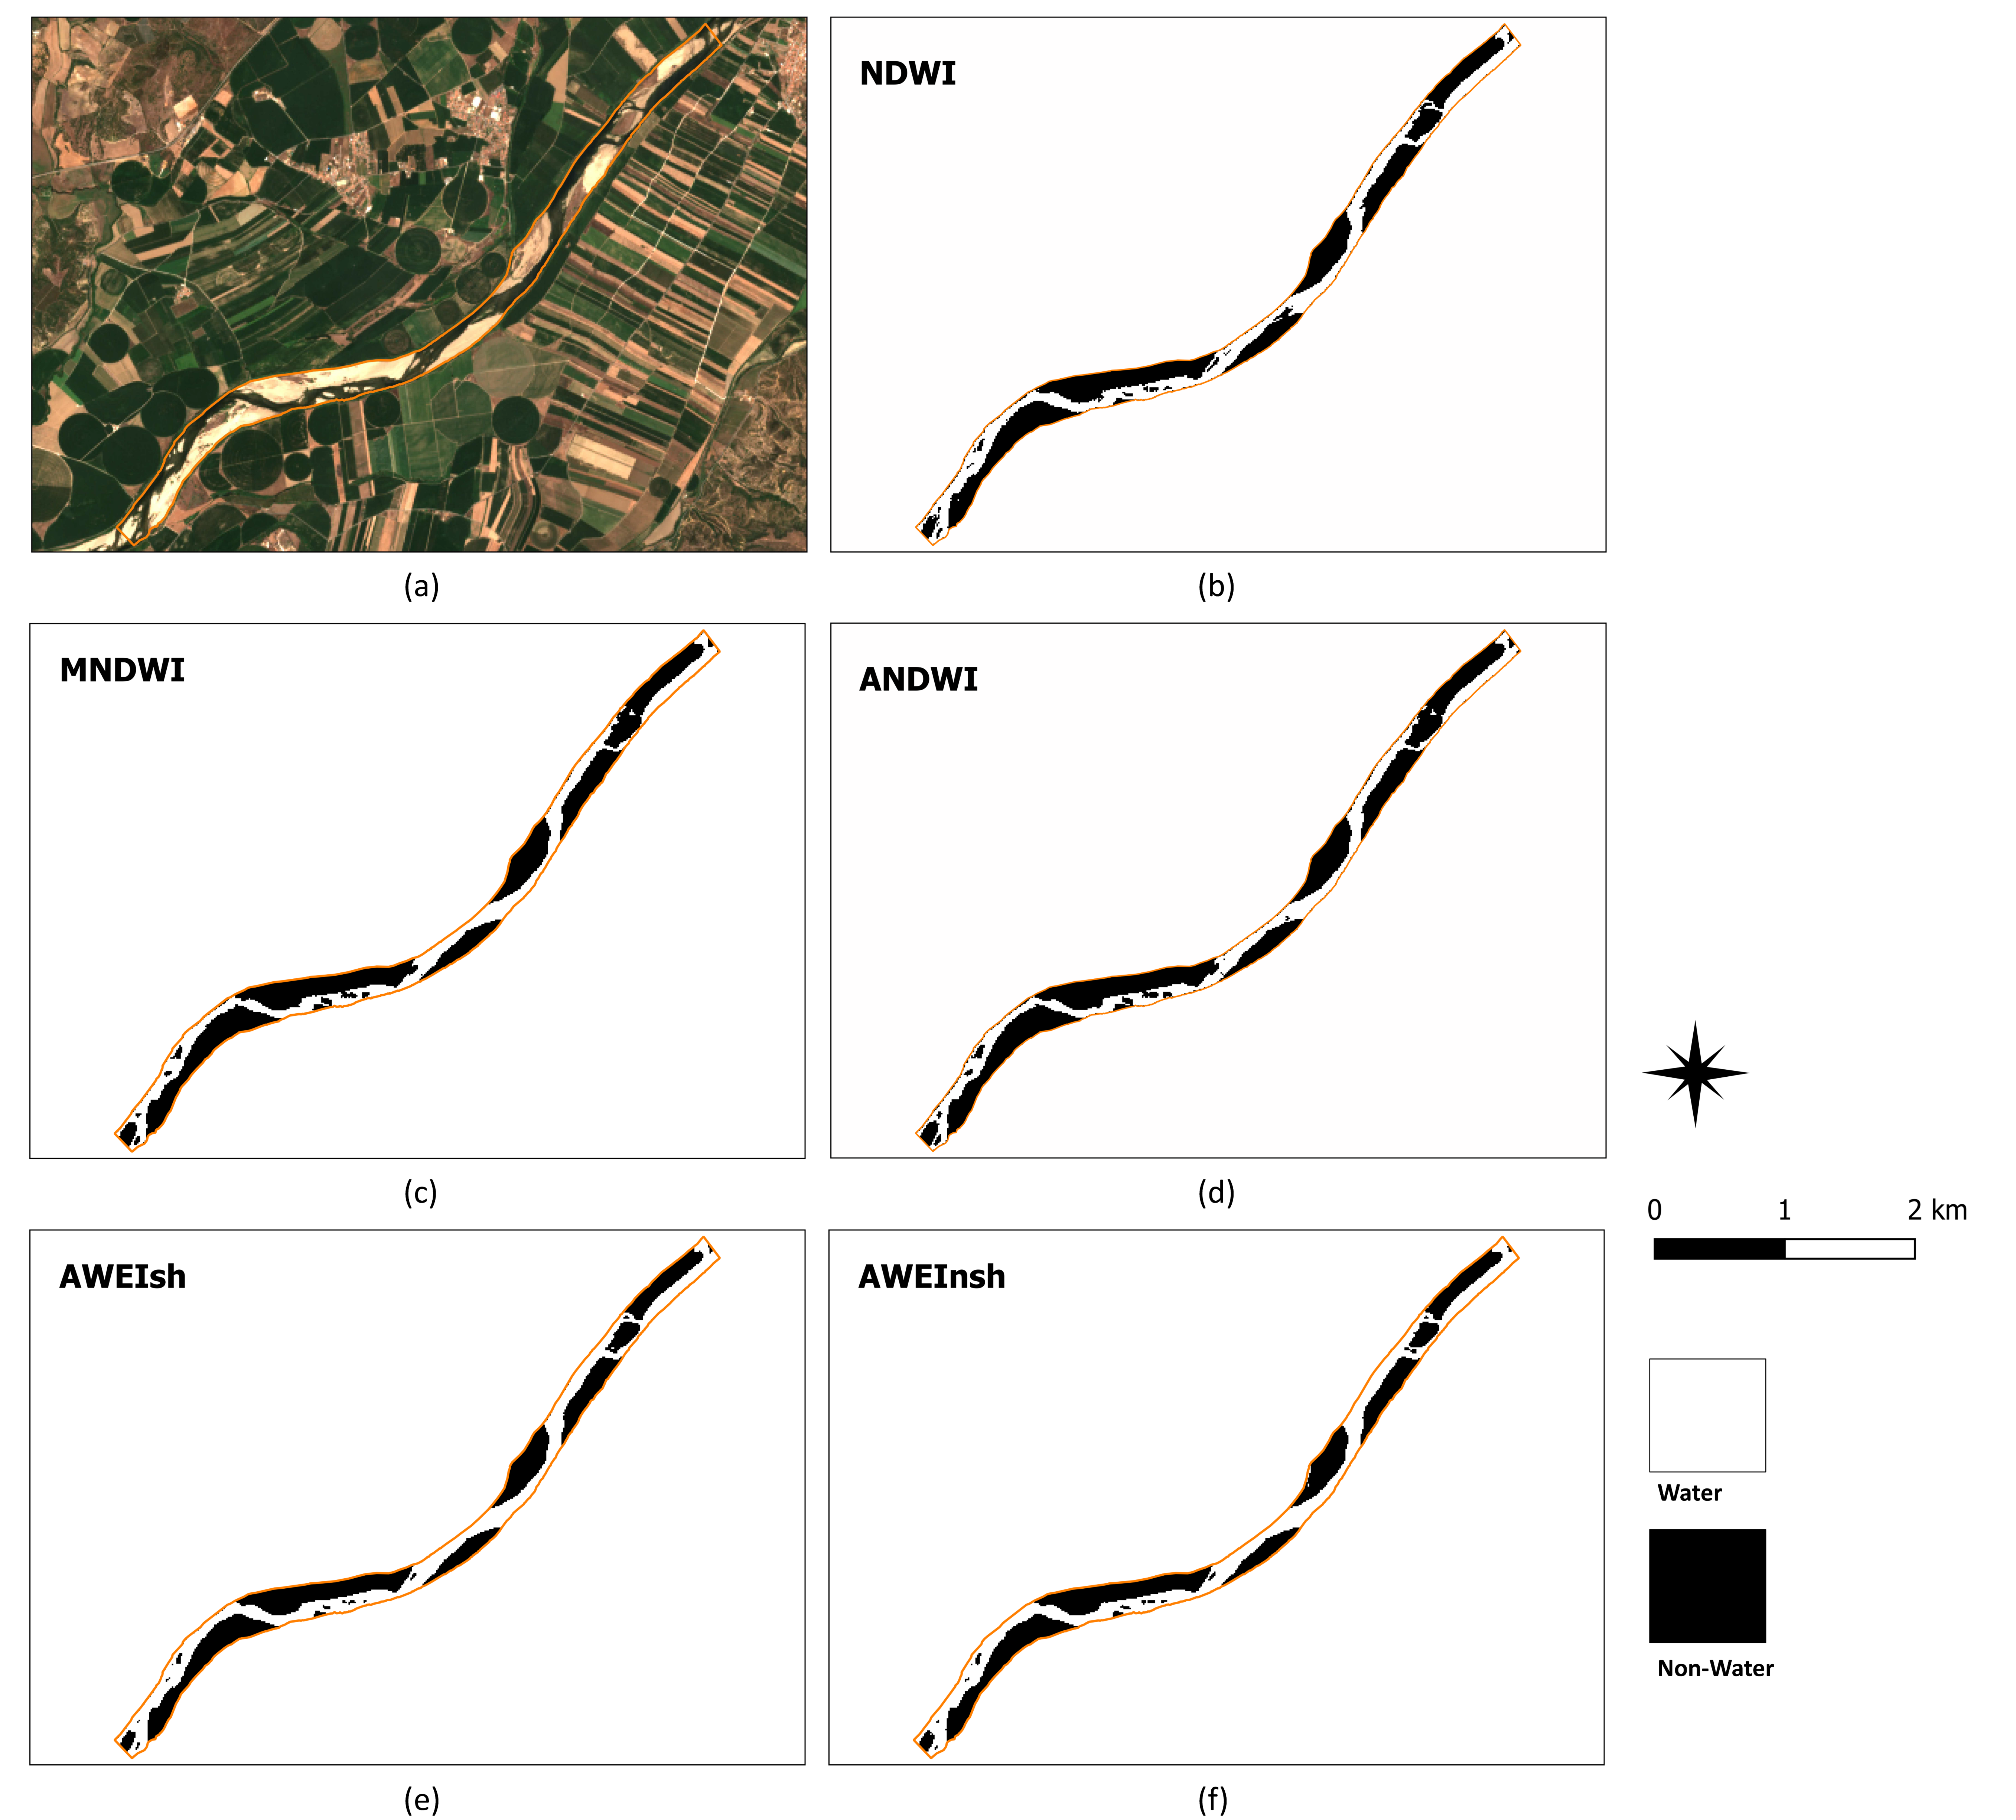
The water body was extracted by segmenting the NDWI, MNDWI, ANDWI, and AWEI images using the corresponding classification threshold values estimated by manual decision (Table 3). The resulting binary maps for water and non-water (sandbars) classes are shown in Figure 9 and Figure 10 for the S2 and L9 data, respectively.

4.4. Details of S2 and L9 Water and Non-Water Mapping

In order to better understand differences in mapping isolated sandbars based on water indexes calculated using the S2 and L9 data, two sub-sections of the area mapped in this study were investigated. These sub-sections illustrated some of the types of morphology found in the river bed: (i) a large single sandbar (Figure 11) and (ii) multiple isolated sandbars (Figure 12). The graphical scale used in Figure 11 and Figure 12 is larger than the scale used in Figure 9 and Figure 10, thus allowing a more detailed inspection of the pixel-based classification. It highlights the need to adjust classification criteria on a case-by-case basis.

5. Discussion

This study was supported by the calculation and analysis of five satellite-based water indices, which each relied on different combinations of diverse spectral bands. In general, the results obtained for a given index showed that water/sandbar mapping can be affected more by inadequate decisions in image classification (Figure 8) than by differences in the response signal in the different spectral water indices. This is thus a key issue that needs to be addressed carefully in all studies using spectral indices, namely the task of identifying image classification decision values. When available, ground truth should be taken into consideration. A recommendation for studies that face limitations in terms of ground truth data availability would be the broadening of the indicator suite used in assessments of land surface attributes and imagery classification.
The water and sandbar mapping of the river segment (Figure 9 and Figure 10) produced in this study and the results obtained for the areal coverage of the two classes (Table 3 and Table 4 and Figure 8) suggested that the S2 and L9 data were comparable despite the lower spatial resolution of the L9 data in relation to the S2 data.
The inspection of the small-sized river segments shown in Figure 11 and Figure 12 suggested that, for S2 and L9 data, some of the water index-based classifications over or underestimated the presence of the target sandbars. AWEIsh underestimated sandbars (as a result of the classification decision value used for AWEIsh and/or the signal captured by this index), which could explain the smaller number of pixels for the non-water class obtained for this index in comparison to the other indices. The overestimation of the target sandbars was associated especially with S2 data for water indices MNDWI and ANDWI, likely due to the use of the SWIR band in these indices.
Nevertheless, overall, the finding related to the comparability of results using the S2 and L9 imagery broadens the opportunity to acquire relevant data and map water and sandbar surface features at different times. In particular, it increases the frequency of available RS imagery time frames since the orbits of the S2 and L9 satellites are offset. As the L9 satellite was launched on 27 September 2021, there are as yet few studies dedicated to exploring the imagery obtained by this satellite and seldom studies comparing or combining S2 and L9 satellite imagery. With respect to applications of S2 satellite imagery for land surface classification, namely for extracting water and sandbars in fluvial systems, several studies have reported successful applications that were comparable to the outcomes of this study [22,81,85]. To the best of our knowledge, currently, reference applications of L9 imagery for the same purpose discussed in this work are not available. Although there are presently commercial satellites that produce data of higher spatial resolution, the S2 and L9 imagery constitutes an important asset in research and for practical applications in fluvial monitoring because the data are freely available.
The volume of emerged channel bars could be estimated by combining satellite imagery and river stage data [20] or through satellite imagery analysis using a machine learning framework [86]. This feature can be used as a control variable for identifying temporal changes in the channel bars in suitable time frames.

6. Conclusions

In general, conventional approaches to study the presence of sandbars in river beds are costly and require a large deal of logistics, human resources, and technologies. All of these factors contribute to hampering the availability of relevant information on river bed conditions. In particular, since sandbars are revealed by low water levels, conventional approaches often miss the opportunity to survey these forms under low flow conditions. By contrast, in such situations, RS satellite-based approaches have the capability to allow us to efficiently inspect river bed conditions, map the corresponding presence of water and sandbars, and quantify their areas, which build up at the level of the water in the river.
The results confirmed that the pixel value distributions (i.e., histograms) for different spectral water indices are crucial to informing satellite imagery classification, which needs to be supported by careful identification of suitable class separation decision values. This step needs to be addressed cautiously, in particular for allowing data from different sources to be used complementarily. In addition, the results showed that sandbar mapping can be affected more by inadequate decisions in image classification than by differences in the response signal of different spectral water indices.
This study found that the water body mapping obtained from the S2 and L9 datasets was comparable. This opens opportunities to combine the analysis of relevant data on water and non-water (sandbars) surface features from the S2 and L9 satellites. In particular, it suggests that L9 satellite-based mapping offers the possibility to complement the information obtained using S2 imagery, at least for the type of application discussed in this study. This increases the frequency of available RS imagery time frames since the orbits of the S2 and L9 satellites are offset. This study contributes to increasing the understanding of the capabilities and applications of the recently launched L9, namely for assessing the morphodynamic, hydraulic, and ecological conditions of rivers.

Author Contributions

All authors contributed equivalently to the study conception and design, material preparation, data collection, data analysis and writing of the manuscript. All authors have read and agreed to the published version of the manuscript.

Funding

The research presented here was partly funded through the Portuguese Fundação para a Ciência e a Tecnologia (FCT), involving project MEDWATERICE (PRIMA/0006/2018; with the support of PRIMA Programme), supported by national funds (PIDDAC); projects UIDB/04292/2020 and UIDP/04292/2020 granted to MARE–Marine and Environmental Research Center, and project LA/P/0069/2020 granted to the Associate Laboratory ARNET–Aquatic Research Network, supported by national funds.

Data Availability Statement

The S2 data are available via the Copernicus Open Access Hub (https://scihub.copernicus.eu/, accessed on 3 September 2022). The L9 data are available via the USGS Earth Resources Observation and Science (EROS) Center (https://earthexplorer.usgs.gov, accessed on 3 September 2022).

Conflicts of Interest

The authors declare no conflict of interest.

References

  1. Radecki-Pawlik, A. Flow and sediment size variability Naer gravel bars in the Beskidy mountains in the polish Carpathians. AUC Geographica 2014, 49, 121–126. [Google Scholar] [CrossRef] [Green Version]
  2. Church, M.A.; Jones, D. Channel Bars in Gravel-Bed Rivers, Gravel-Bed Rivers; R.D. Hey: London, UK, 1982. [Google Scholar]
  3. Whittow, J. Dictionary of Physical Geography; Penguin Books: London, UK, 1984; ISBN 0713912561. [Google Scholar]
  4. Alexander, J.S.; Schultze, D.M.; Zelt, R.B. Emergent Sandbar Dynamics in the Lower Platte River in Eastern Nebraska—Methods and Results of Pilot Study, 2011; U.S. Geological Survey Scientific Investigations Report 2013–5031; 2013; 42p. Available online: https://pubs.usgs.gov/sir/2013/5031/ (accessed on 15 September 2022).
  5. Jacobson, R.B. Riverine Habitat Dynamics. In Treatise on Geomorphology; Shroder, J.J., Butler, D., Hupp, C., Eds.; Academic Press: San Diego, CA, USA, 2013. [Google Scholar] [CrossRef]
  6. Sultana, M.S.; Dewan, A. A reflectance-based water quality index and its application to examine degradation of river water quality in a rapidly urbanising megacity. Environ. Adv. 2021, 5, 100097. [Google Scholar] [CrossRef]
  7. Rubin, D.M.; Schmidt, J.C.; Moore, J.N. Origin, structure, and evolution of a reattachment bar, Colorado River, Grand Canyon, Arizona. J. Sediment. Petrol. 1990, 60, 982–991. [Google Scholar] [CrossRef]
  8. Dixon, M.D.; Turner, M.G.; Jin, C. Riparian tree seedling distribution on Wisconsin river sandbars—Controls at different spatial scales. Ecol. Monogr. 2002, 72, 465–485. [Google Scholar] [CrossRef]
  9. Amsler, M.L.; García, M.H. Sand-dune geometry of large rivers during floods. J. Hydraul. Eng. 1997, 123, 582–584. [Google Scholar] [CrossRef]
  10. Amsler, M.L.; Prendes, H.H. Transporte de sedimentos y processos fluviales asociados. In El Río Paraná en su Tramo Medio; Paoli, C.M., Schreider, M., Eds.; Universidad Nacional del Litoral: Santa Fé, Argentina, 2000. [Google Scholar]
  11. Orfeo, O.; Stevaux, J. Hydraulic and morphologic characteristics of middle and upper reaches of the Paraná River (Argentina and Brazil). Geomorphology 2002, 44, 309–322. [Google Scholar] [CrossRef] [Green Version]
  12. Amsler, M.L.; Drago, E.C.; Paira, A.R. Fluvial sediments: Main channel and floodplain interrelationships. In The Middle Paraná River, Limnology of a Subtropical Wetland; Iriondo, H., Paggi, J.C., Parma, M.J., Eds.; Springer: New York, NY, USA, 2007. [Google Scholar] [CrossRef]
  13. Amsler, M.; Blettler, M.; de Drago, I.E. Influence of hydraulic conditions over dunes on the distribution of the benthic macroinvertebrates in a large sand bed river. Water Resour. Res. 2009, 45, W06426. [Google Scholar] [CrossRef] [Green Version]
  14. Paoli, C.; Iriondo, M.; García, N. Características de las cuencas de aporte. In El río Paraná en su tramo medio. Contribución al conocimiento y prácticas ingenieriles en un gran río de llanura; Paoli, C., Schreider, M., Eds.; Centro de Publicaciones de la UNL: Santa Fe, Argentina, 2000. [Google Scholar]
  15. Blettler, M.; Amsler, L.; de Drago, I.E. Hydraulic factors controlling the benthic invertebrate distribution within and among dunes of the Middle Paraná River (Argentina) and sampling techniques. J. S. Am. Earth Sci. 2012, 35, 27–37. [Google Scholar] [CrossRef]
  16. Rinaldi, M. Recent channel adjustments in alluvial rivers of Tuscany, Central Italy. Earth Surf. Process Land. 2003, 28, 587–608. [Google Scholar] [CrossRef]
  17. Dufour, S.; Rinaldi, M.; Piégay, H.; Michalon, A. How do river dynamics and human influences affect the landscape pattern of fluvial corridors? Lessons from the Magra River, Central–Northern Italy. Landsc. Urban Plan. 2015, 134, 107–118. [Google Scholar] [CrossRef]
  18. Aguiar, F.C.; Martins, M.J.; Silva, P.C.; Fernandes, M.R. Riverscapes downstream of hydropower dams: Effects of altered flows and historical land-use change. Landsc. Urban Plan. 2016, 153, 83–98. [Google Scholar] [CrossRef]
  19. Lallias-Tacon, S.; Liébault, F.; Piégay, H. Use of airborne LiDAR and historical aerial photos for characterising the history of braided river floodplain morphology and vegetation responses. Catena 2017, 149, 742–759. [Google Scholar] [CrossRef]
  20. Wang, B.; Xu, Y. Dynamics of 30 large channel bars in the lower Mississippi River in response to river engineering from 1985 to 2015. Geomorphology 2018, 300, 31–44. [Google Scholar] [CrossRef]
  21. Long, J.; Li, H.; Wang, Z.; Wang, B.; Xu, Y. Three decadal morphodynamic evolution of a large channel bar in the middle Yangtze River: Influence of natural and anthropogenic interferences. Catena 2021, 199, 105128. [Google Scholar] [CrossRef]
  22. Cavallo, C.; Nones, M.; Papa, M.N.; Gargiulo, M.; Ruello, G. Monitoring the morphological evolution of a reach of the Italian Po River using multispectral satellite imagery and stage data. Geocarto Int. 2021, 37, 8579–8601. [Google Scholar] [CrossRef]
  23. Niroumand-Jadidi, M.; Legleiter, C.J.; Bovolo, F. River Bathymetry Retrieval from Landsat-9 Images Based on Neural Networks and Comparison to SuperDove and Sentinel-2. IEEE J. Sel. Top. Appl. Earth Obs. Remote Sens. 2022, 15, 5250–5260. [Google Scholar] [CrossRef]
  24. Yang, X.; Zhao, S.; Qin, X.; Zhao, N.; Liang, L.J.R.S. Mapping of urban surface water bodies from Sentinel-2 MSI imagery at 10 m resolution via NDWI-based image sharpening. Remote Sens. 2017, 9, 596. [Google Scholar] [CrossRef] [Green Version]
  25. You, H.; Tang, X.; Deng, W.; Song, H.; Wang, Y.; Chen, J. A Study on the Difference of LULC Classification Results Based on Landsat 8 and Landsat 9 Data. Sustainability 2022, 14, 13730. [Google Scholar] [CrossRef]
  26. Koutsias, N.; Pleniou, M. A Rule-Based Semi-Automatic Method to Map Burned Areas in Mediterranean Using Landsat Images—Revisited and Improved. Int. J. Digit. Earth 2021, 14, 1602–1623. [Google Scholar] [CrossRef]
  27. Bannari, A.; Ali, T.S.; Abahussain, A. The Capabilities of Sentinel-MSI (2A/2B) and Landsat-OLI (8/9) in Seagrass and Algae Species Differentiation Using Spectral Reflectance. Ocean Sci. 2022, 18, 361–388. [Google Scholar] [CrossRef]
  28. Fisher, A.; Flood, N.; Danaher, T. Comparing Landsat water index methods for automated water classification in eastern Australia. Remote Sens. Environ. 2016, 175, 167–182. [Google Scholar] [CrossRef]
  29. Latella, M.; Luijendijk, A.; Moreno-Rodenas, A.M.; Camporeale, C. Satellite image processing for the coarse-scale investigation of sandy coastal areas. Remote Sens. 2021, 13, 4613. [Google Scholar] [CrossRef]
  30. Acharya, A.; Sharma, M.L.; Bishwakarma, K.; Dahal, P.; Chaudhari, S.K.; Adhikari, B.; Neupane, S.; Pokhrel, B.N.; Pant, R.R. Chemical Characteristics of the Karmanasha River Water and Its Appropriateness for Irrigational Usage. J. Nepal Chem. Soc. 2020, 41, 94–102. [Google Scholar] [CrossRef]
  31. Ji, L.; Zhang, L.; Wylie, B. Analysis of dynamic thresholds for the normalized difference water index. Photogramm. Eng. Remote Sens. 2009, 75, 1307–1317. [Google Scholar] [CrossRef]
  32. APA—Agência Portuguesa do Ambiente. Plano de Gestão da Região Hidrográfica do Tejo, Relatório Técnico—Síntese; Ministério da Agricultura, do Mar, do Ambiente e do Ordenamento do Território: Lisbon, Portugal, 2012; p. 294. [Google Scholar]
  33. Mezger, G.; De Stefano, L.; González del Tánago, M. Analysis of the Evolution of Climatic and Hydrological Variables in the Tagus River Basin, Spain. Water 2022, 14, 818. [Google Scholar] [CrossRef]
  34. Ministerio para la Transición Ecológica (MITECO). Available online: https://www.miteco.gob.es/es/cartografia-y-sig/ide/descargas/default.aspx (accessed on 25 September 2022).
  35. García-Ruiz, J.M.; López-Moreno, I.I.; Vicente-Serrano, S.M.; Lasanta-Martínez, T.; Beguería, S. Mediterranean water resources in a global change scenario. Earth-Sci. Rev. 2011, 105, 121–139. [Google Scholar] [CrossRef] [Green Version]
  36. European Environment Agency (EEA). Water Resources across Europe—Confronting Water Scarcity and Drought; Publications Office of the European Union: Luxemburg, 2009; pp. 1–90. [Google Scholar] [CrossRef]
  37. Philandras, C.M.; Nastos, P.T.; Kapsomenakis, J.; Douvis, K.C.; Tselioudis, G.; Zerefos, C.S. Long term precipitation trends and variability within the Mediterranean region. Nat. Hazards Earth Syst. Sci. 2011, 11, 3235–3250. [Google Scholar] [CrossRef] [Green Version]
  38. Espírito Santo, F.; Ramos, A.M.; de Lima, M.I.P.; Trigo, R.M. Seasonal changes in daily precipitation extremes in mainland Portugal from 1941 to 2007. Reg. Environ. Change 2014, 14, 1765–1788. [Google Scholar] [CrossRef]
  39. Alpert, P.; Krichak, S.O.; Sha, H.; Haim, D.; Osetinsky, I. Climatic trends to extremes employing regional modeling and statistical interpretation over the E. Mediterranean. Glob. Planet. Change 2008, 63, 163–170. [Google Scholar] [CrossRef]
  40. Camuffo, D.; Bertolin, M.; Barriendos, C.; Dominguez-Castro, F.; Cocheo, C.; Enzi, S.; Sghedoni, M.; della Valle, A.; Garnier, E.; Alcoforado, M.; et al. 500-year temperature reconstruction in the Mediterranean Basin by means of documentary data and instrumental observations. Clim. Change 2010, 101, 169–199. [Google Scholar] [CrossRef]
  41. Espírito Santo, F.; de Lima, M.I.P.; Ramos, A.M.; Trigo, R.M. Trends in seasonal surface air temperature in mainland Portugal, since 1941. Int. J. Climatol. 2014, 34, 1814–1837. [Google Scholar] [CrossRef]
  42. Vicente-Serrano, S.M.; Peña-Gallardo, M.; Hannaford, J.; Murphy, C.; Lorenzo-Lacruz, J.; Dominguez-Castro, F.; Lopez-Moreno, J.I.; Beguería, S.; Noguera, B.I.; Harrigan, S.; et al. Climate, Irrigation and Land Cover Change Explain Streamflow Trends in Countries Bordering the Northeast Atlantic. Geophys. Res. Lett. 2019, 46, 10821–10833. [Google Scholar] [CrossRef] [Green Version]
  43. Lorenzo-Lacruz, J.; Vicente-Serrano, S.M.; López-Moreno, J.I.; Morán-Tejeda, E.; Zabalza, J. Recent trends in Iberian streamflows (1945–2005). J. Hydrol. 2012, 414, 463–475. [Google Scholar] [CrossRef]
  44. Martínez-Fernández, J.; Sánchez, N.; Herrero-Jiménez, C. Recent trends in rivers with near-natural flow regime: The case of the river headwaters in Spain. Prog. Phys. Geogr. 2013, 37, 685–700. [Google Scholar] [CrossRef]
  45. Benito, G.; Sanchez-Moya, Y.; Sopena, A. Sedimentology of high-stage flood deposits of the Tagus River, central Spain. Sediment. Geol. 2003, 157, 107–132. [Google Scholar] [CrossRef]
  46. Bettencourt, A.; Ramos, L. Estuários Portugueses; Instituto da Água, Ministério das Cidades, Ordenamento do Território e Ambiente—Direcção de Serviços de Planeamento: Lisboa, Portugal, 2003; ISBN 972-9412-62-6. [Google Scholar]
  47. Agência Portuguesa do Ambiente. Tejo and Ribeiras do Oeste River Basin Management Plan (RBD5) 2016–2021. Part 2—Characterization and Diagnostics (Annexes); APA: Lisboa, Portugal, 2016; Available online: https://apambiente.pt/sites/default/files/_SNIAMB_Agua/DRH/PlaneamentoOrdenamento/PGRH/2016-2021/PTRH5A/PGRH_2_RH5A_Parte2_Anexos.pdf (accessed on 1 September 2022).
  48. PBH Tejo. Análise e Diagnóstico da Situação de Referência—1ª Fase. Anexo 4—Recursos Hídricos Subterrâneos—Tomo 4B—Caracterização do Balanço Hídrico Subterrâneo; MINISTÉRIO DO AMBIENTE: Lisboa, Portugal, 1999; Available online: https://sniambgeoviewer.apambiente.pt/GeoDocs/geoportaldocs/ARHTejo/PBHTejo/Fase1_Analise_Diagn_Sit_Referencia/AnexTematicos/TAnexo4_B.pdf (accessed on 1 September 2022).
  49. LNEC. Assessoria à Atribuição de Licenças de Extração de Inertes—2º Relatório—Análise do impacte da extração de areias na evolução do rio Tejo; Laboratório Nacional de Engenharia Civil: Lisboa, Portugal, 1999. [Google Scholar]
  50. Fernandes, M.R.; Aguiar., F.C.; Martins., M.J.; Rivaes., R.; Ferreira., M.T. Long-term human-generated alterations of Tagus River: Effects of hydrological regulation and land-use changes in distinct river zones. Catena 2020, 188. [Google Scholar] [CrossRef]
  51. Pessoa, F.; Lidon, F.; Reboredo, F. Drought effects on Portuguese Forest Cover. In Forest Context and Policies in Portugal; Reboredo, F., Ed.; Springer: Cham, Switzerland, 2014; pp. 67–96. ISBN 978-3-319-08455-8. [Google Scholar] [CrossRef]
  52. Cordovil, C.M.d.S.; Cruz, S.; Brito, A.G.; Cameira, M.R.; Poulsen, J.R.; Thodsen, H.; Kronvang, B. A simplified nitrogen assessment in Tagus river basin: A management focused review. Water 2018, 10, 406. [Google Scholar] [CrossRef] [Green Version]
  53. S2 User Handbook. ESA Standard Document. Issue 1, Rev 2. 24 July 2015. Available online: https://sentinels.copernicus.eu/documents/247904/685211/S2_User_Handbook.pdf/8869acdf-fd84-43ec-ae8c-3e80a436a16c?t=1438278087000 (accessed on 1 September 2022).
  54. Ji, R.J.; Yu, W.Y.; Feng, R.; Wu, J.W.; Zhang, Y.S. The threshold determination methods of water body information extraction using GF-1 satellite image. IOP Conf. Ser. Mater. Sci. Eng. 2019, 592, 012088. [Google Scholar] [CrossRef] [Green Version]
  55. McFeeters, S.K. The use of the normalized difference water index (NDWI) in the delineation of open water features. Int. J. Remote Sens. 1996, 17, 1425–1432. [Google Scholar] [CrossRef]
  56. Xu, H.Q. Modification of normalised difference water index (NDWI) to enhance open water features in remotely sensed imagery. Int. J. Remote Sens. 2006, 27, 3025–3033. [Google Scholar] [CrossRef]
  57. Rad, A.M.; Kreitler, J.; Sadegh, M. Augmented Normalized Difference Water Index for improved surface water monitoring. Environ. Model. Softw. 2021, 140, 105030. [Google Scholar] [CrossRef]
  58. Feyisa, G.L.; Meilby, H.; Fensholt, R.; Proud, S.R. Automated water extraction index: A new technique for surface water mapping using Landsat imagery. Remote Sens. Environ. 2014, 140, 23–35. [Google Scholar] [CrossRef]
  59. Janušaitė, R.; Jarmalavičius, D.; Jukna, L.; Žilinskas, G.; Pupienis, D. Analysis of interannual and seasonal nearshore bar behavior observed from decadal optical satellite data in the Curonian Spit, Baltic Sea. Remote Sens. 2022, 14, 3423. [Google Scholar] [CrossRef]
  60. Brinkhoff, J.; Hornbuckle, J.; Barton, J.L. Assessment of Aquatic Weed in Irrigation Channels Using UAV and Satellite Imagery. Water 2018, 10, 1497. [Google Scholar] [CrossRef] [Green Version]
  61. Chauhan, K.; Patel, J.; Shukla, S.H.; Kalubarme, M.H. Monitoring water spread and aquatic vegetation using Spectral Indices in Nalsarovar, Gujarat State-India. Int. J. Environ. Geoinform. 2021, 8, 49–56. [Google Scholar] [CrossRef]
  62. Gerardo, R.; de Lima, I.P. Monitoring Duckweeds (Lemna minor) in Small Rivers Using Sentinel 2 Satellite Imagery: Application of Vegetation and Water Indices to the Lis River (Portugal). Water 2022, 14, 2284. [Google Scholar] [CrossRef]
  63. Sun, Q.; Wu, Z.; Tan, J. The relationship between land surface temperature and land use/land cover in Guangzhou, China. Environ. Earth Sci. 2012, 65, 1687–1694. [Google Scholar] [CrossRef]
  64. Du, Y.; Zhang, Y.; Ling, F.; Wang, Q.; Li, W.; Li, X. Water bodies’ mapping from Sentinel 2 imagery with modified normalized difference water index at 10-m spatial resolution produced by sharpening the SWIR band. Remote Sens. 2016, 8, 354. [Google Scholar] [CrossRef] [Green Version]
  65. Kelly, J.T.; Gontz, A.M. Using GPS-surveyed intertidal zones to determine the validity of shorelines automatically mapped by Landsat water indices. Int. J. Appl. Earth Obs. Geoinf. 2018, 65, 92–104. [Google Scholar] [CrossRef]
  66. Bishop–Taylor, R.; Nanson, R.; Sagar, S.; Lymburner, L. Mapping Australia’s dynamic coastline at mean sea level using three decades of Landsat imagery. Remote Sens. Environ. 2021, 267, 112734. [Google Scholar] [CrossRef]
  67. Rad, A.M.; Kreitler, J.; Abatzoglou, J.T.; Fallon, K.; Roche, K.R.; Sadegh, M. Anthropogenic Stressors Compound Climate Impacts on Inland Lake Dynamics: The Case of Hamun Lakes. Sci. Total Environ. 2022, 829, 154419. [Google Scholar] [CrossRef]
  68. Feng, S.; Liu, S.; Zhou, G.; Gao, C.; Sheng, D.; Yan, W.; Wu, Y.; Gao, H.; Jia, J.; Wang, Z.; et al. Long-term dense Landsat observations reveal detailed waterbody dynamics and temporal changes of the size-abundance relationship. J. Hydrol. Reg. 2022, 41, 101111. [Google Scholar] [CrossRef]
  69. Guo, Q.D.; Pu, R.L.; Li, J.L.; Cheng, J. A weighted normalized difference water index for water extraction using Landsat imagery. Int. J. Remote Sens. 2017, 38, 5430–5445. [Google Scholar] [CrossRef]
  70. Mandanici, E.; Bitelli, G. Preliminary Comparison of Sentinel-2 and Landsat 8 Imagery for a Combined Use. Remote Sens. 2016, 8, 1014. [Google Scholar] [CrossRef] [Green Version]
  71. Parihar, S.K.; Borana, S.L.; Yadav, S.K. Comparative Evaluation of Spectral Indices and Sensors for Mapping of Urban Surface Water Bodies in Jodhpur Area: Smart & Sustainable Growth. In Proceedings of the 2019 International Conference on Computing Communication and Intelligent Systems (ICCCIS), Greater Noida, India, 18–19 October 2019; pp. 484–489. [Google Scholar] [CrossRef]
  72. Zhou, Y.; Dong, J.; Xiao, X.; Xiao, T.; Yang, Z.; Zhao, G.; Xiao, X.; Qin, Y. Open Surface Water Mapping Algorithms: A Comparison of Water-Related Spectral Indices and Sensors. Water 2017, 9, 256. [Google Scholar] [CrossRef]
  73. Xu, H.Q. A study on information extraction of water body with the modified normalized difference water index (MNDWI). J. Remote Sens. 2005, 9, 589–595. (In Chinese) [Google Scholar]
  74. Casal, G. Assessment of Sentinel-2 to monitor highly dynamic small water bodies: The case of Louro lagoon (Galicia, NW Spain). Oceanologia 2022, 64, 88–102. [Google Scholar] [CrossRef]
  75. Otsu, N. A Threshold Selection Method from Gray-Level Histograms. IEEE Trans. Syst. Man Cybern. 1979, 9, 62–66. [Google Scholar] [CrossRef] [Green Version]
  76. Richards, J.A.; Jia, X. Remote Sensing Digital Image Analysis: An Introduction; Springer: New York, NY, USA, 1999; ISBN 978-3-662-03978-6. [Google Scholar]
  77. Zhang, F.; Li, J.; Zhang, B.; Shen, Q.; Ye, H.; Wang, S.; Lu, Z. A simple automated dynamic threshold extraction method for the classification of large water bodies from Landsat-8 OLI water index images. Int. J. Remote Sens. 2018, 39, 3429–3451. [Google Scholar] [CrossRef]
  78. Sezgin, M.; Sankur, B. Survey over image thresholding techniques and quantitative performance evaluation. J. Electron. Imaging 2004, 13, 146–168. [Google Scholar] [CrossRef]
  79. Kryniecka, K.; Magnuszewski, A. Application of Satellite Sentinel-2 Images to Study Alternate Sandbars Movement at Lower Vistula River (Poland). Remote Sens. 2021, 13, 1505. [Google Scholar] [CrossRef]
  80. Kamel, M.; Zhao, A. Extraction of Binary Character/Graphics Images from Grayscale Document Images. Comput. Gr. Image Process. 1993, 55, 203–217. [Google Scholar] [CrossRef]
  81. Li, W.; Gong, P. Continuous monitoring of coastline dynamics in western Florida with a 30-year time series of Landsat imagery. Remote Sens. Environ. 2016, 179, 196–209. [Google Scholar] [CrossRef]
  82. Wardlow, B.D.; Egbert, S.L.; Kastens, J.H. Analysis of time-series MODIS 250 m vegetation index data for crop classification in the US Central Great Plains. Remote Sens. Environ. 2007, 108, 290–310. [Google Scholar] [CrossRef] [Green Version]
  83. Marpu, P.R.; Niemeyer, I.; Nussbaum, S.; Gloaguen, R. A procedure for automatic object-based classification. In Object-Based Image Analysis: Spatial Concepts for Knowledge-Driven Remote Sensing Applications; Blaschke, T., Lang, S., Hay, G.J., Eds.; Springer: Berlin/Heidelberg, Germany, 2008; pp. 168–184. ISBN 978-3-540-77057-2. [Google Scholar]
  84. Ai, J.; Chen, W.; Chen, L. Spectral discrimination of an invasive species (Spartina alterniflora) in Min River wetland using field spectrometry. In Proceedings of the International Symposium on Photoelectronic Detection and Imaging 2013: Laser Communication Technologies and Systems, Beijing, China, 25–27 June 2013; Volume 8910, p. 89100. [Google Scholar] [CrossRef]
  85. Walker, D.; Smigaj, M.; Jovanovic, N. Ephemeral sand river flow detection using satellite optical remote sensing. J. Arid Environ. 2019, 168, 17–25. [Google Scholar] [CrossRef]
  86. Marchetti, G.; Bizzi, S.; Belletti, B.; Lastoria, B.; Comiti, F.; Carbonneau, P.E. Mapping riverbed sediment size from Sentinel-2 satellite data. Earth Surf. Process Landf. 2022, 47, 2544–2559. [Google Scholar] [CrossRef]
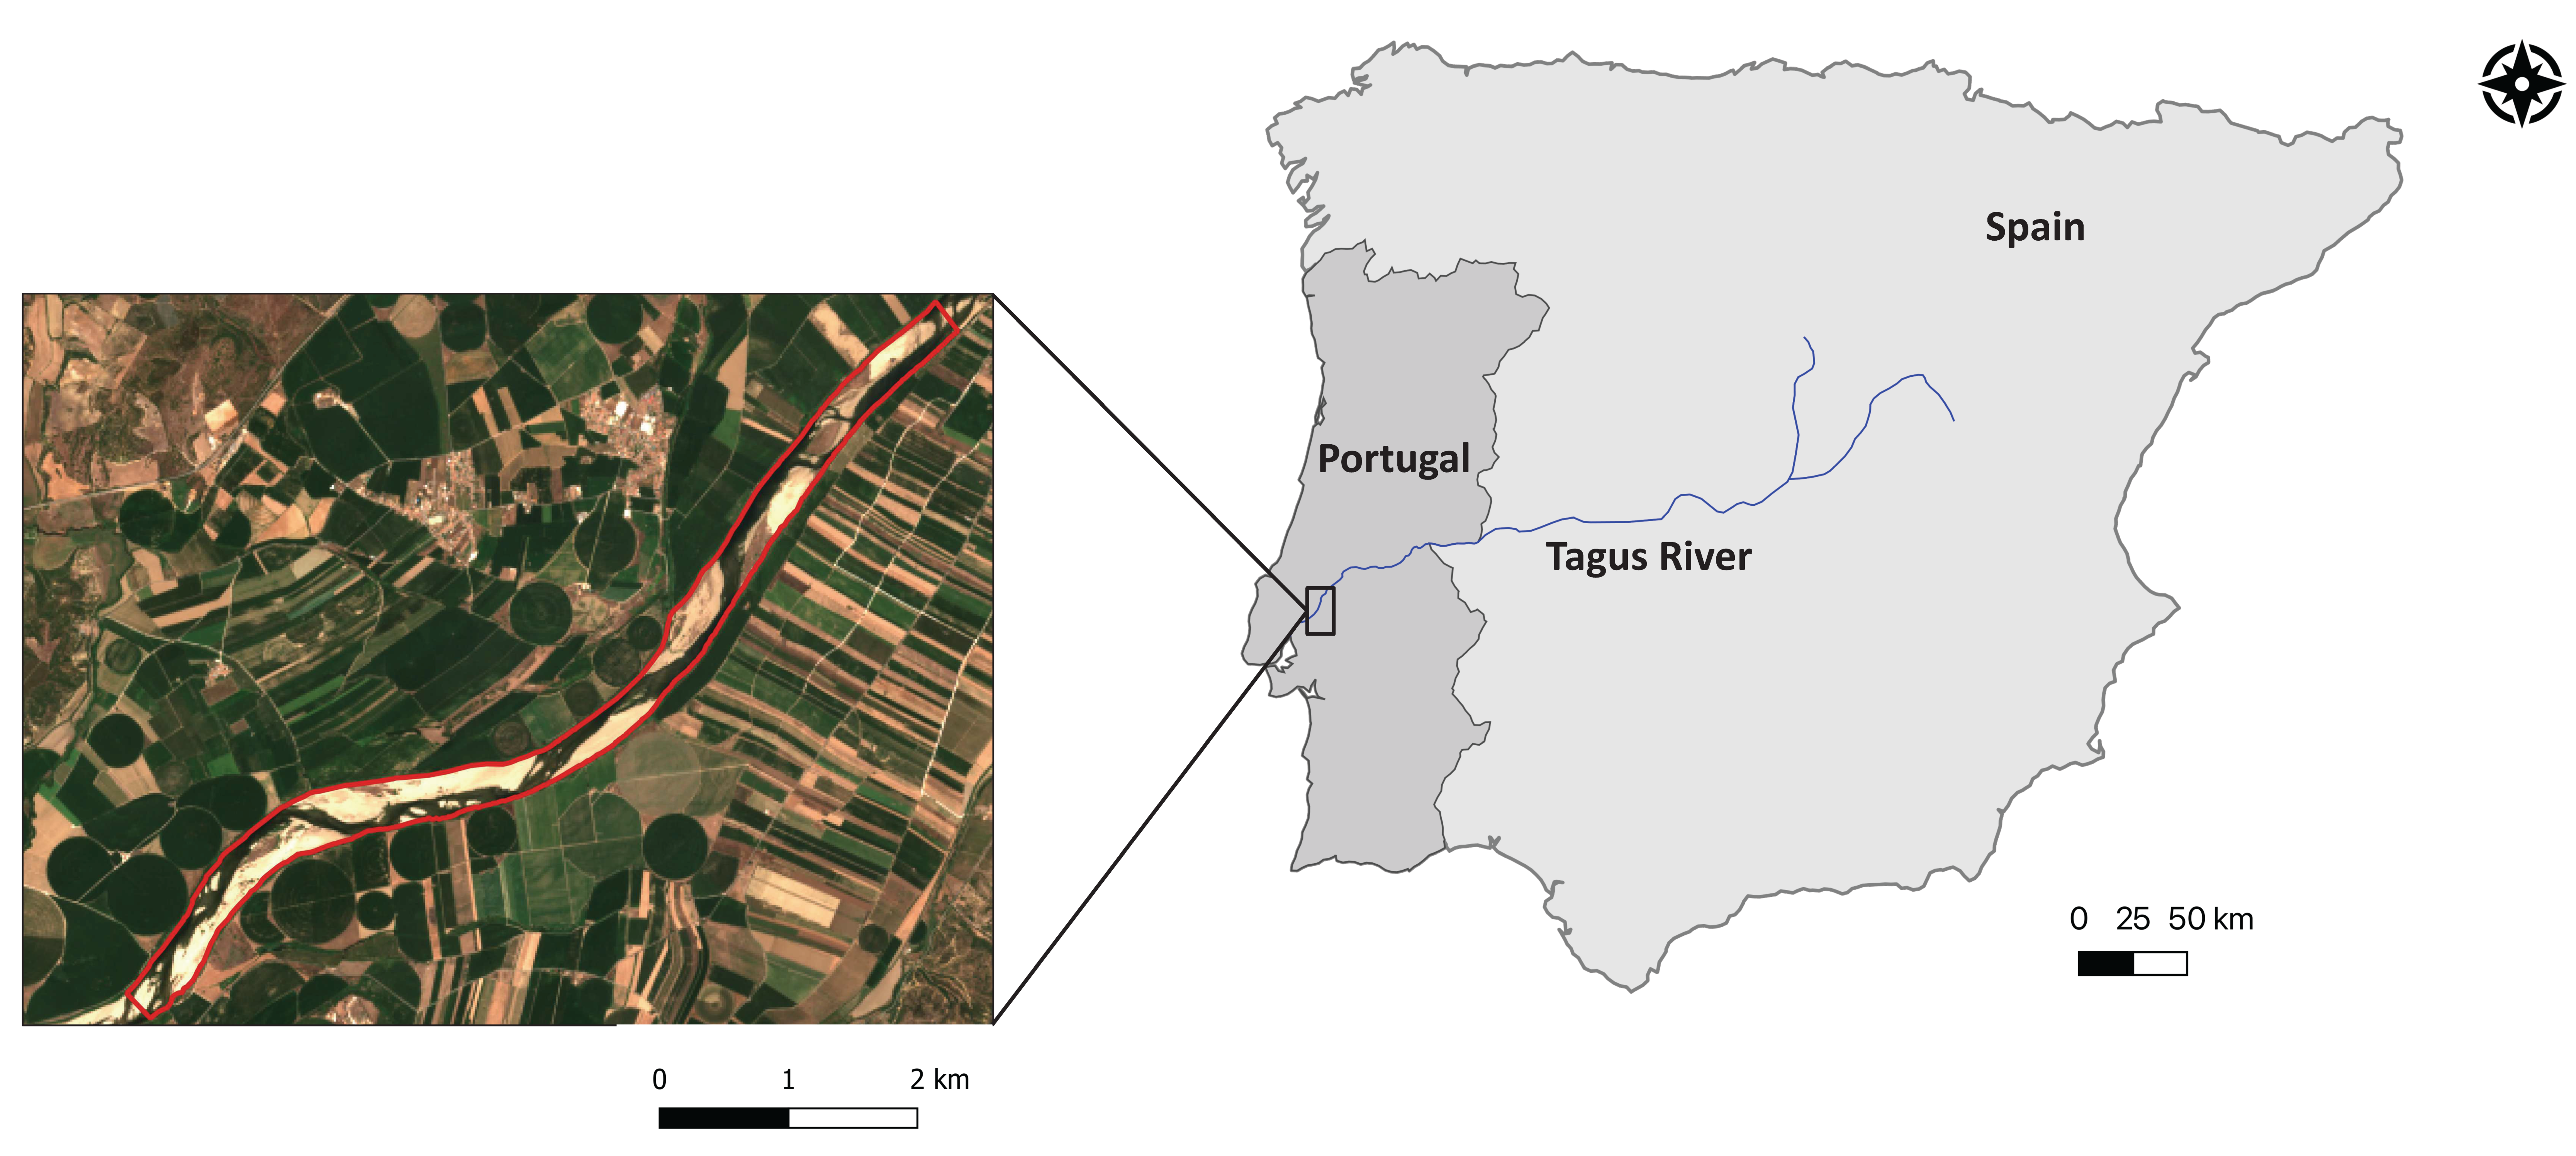
Figure 1. Identification of the river segment investigated in this study (left) and its location in the Tagus River (right). The view of the river segment, which captured a condition of very low river discharge that occurred in the summer of 2022, reveals the extensive presence of sandbars along the river bed.
Remotesensing 15 01927 g001
Figure 2. Data from Almourol hydrometric station (17G/02H), which was located just upstream of the studied river segment: (a) annual discharge time series for the period 1990/91–2019/2020; (b) daily discharge time series, for the period 1 October 2021–25 October 2022. A period of exceptional low river discharge occurred in the summer of 2022.
Remotesensing 15 01927 g002
Figure 3. Flowchart illustrating the methodological steps that were carried out in this study for mapping water and non-water (sandbars) surfaces using Sentinel-2 and Landsat 9 satellite imagery.
Remotesensing 15 01927 g003
Figure 4. Using Sentinel-2 imagery. (a,c,e,g,i) Spectral water indices maps of a segment of the Tagus River (Portugal) for NDWI, MNDWI, ANDWI, AWEIsh, and AWEInsh; the darker colors indicate non-water features. (b,d,f,h,j) Corresponding data histograms. The data spatial resolution is 20 m. The date of observation was 8 July 2022.
Remotesensing 15 01927 g004aRemotesensing 15 01927 g004b
Figure 5. Using Landsat 9 imagery. (a,c,e,g,i) Spectral water indices maps of a segment of the Tagus River (Portugal) for NDWI, MNDWI, ANDWI, AWEIsh, and AWEInsh; the darker colors indicate non-water features. (b,d,f,h,j) Corresponding data histograms. The data spatial resolution is 30 m. The date of observation was 7 July 2022.
Remotesensing 15 01927 g005
Figure 6. Correlation analysis of pixel=based water index values calculated from Sentinel-2 and Landsat 9 imagery: (a) NDWI; (b) MNDWI; (c) ANDWI; (d) AWEIsh; and (e) AWEInsh. The corresponding linear regression lines, equations, and correlation coefficients are shown.
Remotesensing 15 01927 g006
Figure 7. Comparison of classification results obtained for the NDWI, MNDWI, ANDWI, AWEIsh, and AWEInsh calculated from Sentinel-2 (S2) and Landsat 9 (L9) data, applying manual decision and the minimum within-class variance (Otsu method) criterion: (a) J–M distance found for the class segmentation decision values; (b) water surface percentage area in the studied segment of the Lower Tagus River (Portugal). The classes are for water and non-water (i.e., sandbars) surfaces. The 1:1 line is shown for reference. The remote sensing data spatial resolution is 20 m for S2 (8 July 2022) and 30 m for L9 (7 July 2022), for similar discharge conditions.
Remotesensing 15 01927 g007
Figure 8. Relationship between the percentage area estimated for the water surface in the selected segment of the Lower Tagus River (Portugal) and the water/non-water class segmentation decision values (estimated manually and by the Otsu method) used to classify the spectral water indices: (a) NDWI, MNDWI, and ANDWI; and (b) AWEIsh and AWEInsh. Data are from Sentinel-2 (S2) and Landsat 9 (L9). The remote sensing data spatial resolution is 20 m for S2 (8 July 2022) and 30 m for L9 (7 July 2022), for similar discharge conditions.
Remotesensing 15 01927 g008
Figure 9. (a) View of the selected segment of the Lower Tagus River (Portugal) and adjacent areas. (bf) Water and sandbar (non-water) mapping of the river segment based on the classification of water indices calculated using Sentinel 2 data (8 July 2022). The class separation threshold was estimated by manual decision. Data resolution is 20 m.
Remotesensing 15 01927 g009
Figure 10. (a) View of the selected segment of the Lower Tagus River (Portugal) and adjacent areas. (bf) Water and sandbar (non-water) mapping for the river segment based on the classification of water indices calculated using Landsat 9 data (7 July 2022). The class separation threshold was estimated by manual decision. Data resolution is 30 m.
Remotesensing 15 01927 g010
Figure 11. Detailed view of the river bed mapping in a section of the river dominated by the presence of a large single sandbar. The two panels more to left show 20 m Sentinel-2 RGB image (top row) and 30 m Landsat 9 RGB image (bottom row). The other panels show the corresponding mapping that resulted from the analysis of the five water indices (NDWI, MMNDWI, ANDWI, AWEInsh, AWEIsh) using the same criteria applied in Figure 9 and Figure 10.
Remotesensing 15 01927 g011
Figure 12. Detailed view of the river bed mapping in a section of the river that exhibits the presence of multiple sandbars. The two panels more to left show 20 m Sentinel-2 RGB image (top row) and 30 m Landsat 9 RGB image (bottom row). The other panels show the corresponding mapping that resulted from the analysis of the five water indices (NDWI, MMNDWI, ANDWI, AWEInsh, AWEIsh) using the same criteria applied in Figure 9 and Figure 10.
Remotesensing 15 01927 g012
Table 1. Attributes of the Sentinel-2 (S2) and Landsat 9 (L9) satellite imagery used in this study. NIR stands for near infrared and SWIR for shortwave infrared.
SatelliteAcquisition Date/TimeMSI Tile or Path-RothEntity IDBand IDBandBand Central Wavelength (nm)Band Width (nm)Spatial Resolution (m)
S28 July 2022
11:21:31 (UTC)
T29SNDS2ASIL2A20220708T112131N0400R037B2Blue4906510
B3Green5603510
B4Red6653010
B8ANIR8652020
B11SWIR116109020
B12SWIR2219018020
L97 July 2022
11:14:37 (UTC)
204-33LC09L2SP204033202207072022070902T1B2Blue4822030
B3Green5627530
B4Red6555030
B5NIR8654030
B6SWIR1161010030
B7SWIR2220020030
Table 2. Spectral water indices used for imaging water feature extraction.
IndexAbbreviationFormulaReferences
Normalized Difference
Water Index
NDWI Green     NIR Green   +   NIR [55]
Modified Normalized
Difference Water Index
MNDWI Green     SWIR 1 Green   +   SWIR 1 [56]
Augmented Normalized Difference Water IndexANDWI Blue   +   Green   +   Red     NIR     SWIR 1     SWIR 2 Blue   +   Green   +   Red   +   NIR   +   SWIR 1   +   SWIR 2 [57]
Automated Water
Extraction Index
AWEIsh Blue   + 2.5 × Green 1.5 × NIR + SWIR 1 0.25 × SWIR 2 [58]
AWEInsh 4 × Green SWIR 1 0.25 × NIR + 2.75 × SWIR 2
Table 3. Water and non-water class separation index values obtained from Sentinel-2 (S2) and Landsat 9 (L9) satellite imagery, estimated from manual decision analysis of the histograms. Pixel spatial resolution is 20 m for S2 and 30 m for L9.
SatelliteWater IndicesPixel Value MeanClass Separation Value from Manual DecisionWater Class Area (%)Non-Water Class Area (%)J–M Distance
S2NDWI−0.088−0.02232.467.61.85
MNDWI−0.142−0.07535.664.41.89
ANDWI−0.119−0.05333.866.21.99
AWEIsh−0.289−0.22543.956.11.95
AWEInsh−1.455−1.35045.454.61.98
L9NDWI−0.100−0.05533.466.61.84
MNDWI−0.115−0.06639.160.91.97
ANDWI−0.110−0.03933.666.41.94
AWEIsh−0.338−0.28543.057.01.97
AWEInsh−1.045−0.94343.057.01.97
Table 4. Water and non-water class separation index values obtained from Sentinel-2 (S2) and Landsat 9 (L9) satellite imagery estimated from minimum within-class variance criterion. Pixel spatial resolution is 20 m for S2 and 30 m for L9.
SatelliteWater IndicesPixel Value MeanClass Separation Value from min. Class Variance Water Class Area (%)Non-Water Class Area (%)J–M Distance
S2NDWI−0.088−0.07136.463.61.76
MNDWI−0.142−0.10338.062.01.87
ANDWI−0.119−0.08536.563.51.88
AWEIsh−0.289−0.22543.456.61.97
AWEInsh−1.455−1.42446.153.91.98
L9NDWI−0.100−0.09436.363.71.74
MNDWI−0.115−0.08241.059.01.97
ANDWI−0.110−0.07839.160.91.96
AWEIsh−0.338−0.27143.156.91.98
AWEInsh−1.045−1.07445.454.61.96
Disclaimer/Publisher’s Note: The statements, opinions and data contained in all publications are solely those of the individual author(s) and contributor(s) and not of MDPI and/or the editor(s). MDPI and/or the editor(s) disclaim responsibility for any injury to people or property resulting from any ideas, methods, instructions or products referred to in the content.